Embed Size (px)
Citation preview
WP/04/224
Macroeconomic Implications of Natural Disasters in the Caribbean
Tobias N. Rasmussen
© 2004 International Monetary Fund WP/04/224
IMF Working Paper
Western Hemisphere Department
Macroeconomic Implications of Natural Disasters in the Caribbean
Prepared by Tobias N. Rasmussen1
Authorized for distribution by David O. Robinson
December 2004
Abstract
This Working Paper should not be reported as representing the views of the IMF. The views expressed in this Working Paper are those of the author(s) and do not necessarily represent those of the IMF or IMF policy. Working Papers describe research in progress by the author(s) and are published to elicit comments and to further debate.
Each year natural disasters affect about 200 million people and cause about $50 billion in damage. This paper compares the incidence of natural disasters across countries along several dimensions and finds that the relative costs tend to be far higher in developing countries than in advanced economies. The analysis shows that small island states are especially vulnerable, with the countries of the Eastern Caribbean standing out as among the most disaster-prone in the world. Natural disasters are found to have had a discernible macroeconomic impact, including large effects on fiscal and external balances, pointing to animportant role for precautionary measures. JEL Classification Numbers: G22, H30, O10, Q54 Keywords: Natural Disasters, Eastern Caribbean, Developing Countries Author(s) E-Mail Address: [email protected]
1 Tobias N. Rasmussen is an economist in the IMF’s Western Hemisphere Department. The author thanks Paul Cashin, Prachi Mishra, David O. Robinson, Ratna Sahay, and seminar participants at the IMF and at the Ministries of Finance of Antigua and Barbuda, Grenada, Dominica, St. Lucia, St. Kitts and Nevis, and St. Vincent and the Grenadines for their many useful comments and suggestions.
- 2 -
Contents Page
I. Introduction ............................................................................................................................3
II. The Incidence of Natural Disasters .......................................................................................4
III. The Macroeconomic Implications of Natural Disasters ......................................................8 A. Short- and Medium-Term Impact .............................................................................8 B. Long-Term Effects ..................................................................................................11
IV. Mitigating Disasters...........................................................................................................12 A. Coping With Risk: The Role of Insurance and Capital Markets ............................12 B. Domestic Public Policy to Reduce Risk and Lessen the Impact.............................14 C. International Assistance and Cooperation...............................................................15
V. Summary of Findings..........................................................................................................16 References................................................................................................................................23 Tables
Table 1. Frequency and Impact of Natural Disasters, 1970–2002...................................17 Table 2. Determinants of Vulnerability to Natural Disaster, 1970–2002 ........................18 Table 3. Natural Disasters in ECCU Countries, 1970–2002 ...........................................19 Table 4. Worldwide Incidence of Natural Disasters, 1970–2002....................................20 Table 5. Correlations Between Measures of Proneness to Natural Disasters and Selected Macroeconomic Variables, 1970–2002...............................................21 Table 6. Volatility in Income and Consumption, 1970–2002..........................................22
Figures Figure 1. Global Frequency and Impact of Natural Disasters, 1970–2002 ......................4 Figure 2. Cross-Country Frequency and Impact of Natural Disasters, 1970–2002...........6 Figure 3. Median Impact of 12 Large Natural Disasters in the ECCU, 1970–2002........10 Boxes
Box 1. Review of Literature on Macroeconomic Implications of Natural Disasters.........9 Box 2. New Instruments for Dealing with Natural Hazard Risk .....................................13
- 3 -
I. INTRODUCTION
Wind storms, floods, droughts, and other potentially damaging natural events occur regularly across the world, but only on occasion do they lead to natural disasters. Whether an event will develop into a natural disaster will depend on its physical force, its location, the vulnerability of population and infrastructure, the level of preparedness, and a host of other factors. While such events cannot be eliminated, much can be done to prevent natural disasters. Emphasizing the implications for the Eastern Caribbean, this paper seeks to identify determinants of vulnerability to natural disaster, the economic impact, and possible remedies. The central source of data used in the analysis is the EM-DAT database compiled by the Centre for Research on the Epidemiology of Disasters (CRED, 2004), the most comprehensive database on natural disasters that is publicly available. Natural disasters are here defined as events due to natural causes that led to 10 or more fatalities, affected 100 or more people, or resulted in a call for international assistance or the declaration of a state of emergency. The database contains information on 14,535 natural disasters since 1900, including estimates of the number of people affected and the value of damage.2 According to these data, since 1970 natural disasters have affected more than 5 billion people and have caused more than $1 trillion in damage. The main contribution of this paper is to provide a comprehensive cross-country comparison of the incidence of natural disasters. To this end, countries are compared along four dimensions: the number of events divided by land area; the number of events divided by population; the number of affected persons divided by total population; and damage divided by GDP. Each of these measures has been used individually in previous studies, but bringing them together provides a broader understanding of countries’ vulnerabilities. The results show that developing countries tend to suffer most from natural disasters, especially in terms of the number of persons affected and the value of the damage. Small island states are found to have an especially high frequency of natural disasters, with the countries of the Eastern Caribbean Currency Union (ECCU) standing out owing to the large number of hurricanes.3 Based on the experience since 1970, a natural disaster inflicting damage equivalent to more than 2 percent of the affected country’s GDP can be expected to
2 EM-DAT defines as affected people requiring immediate assistance during a period of emergency. The figures for damage capture the value of direct damage to infrastructure, crops, housing, and other capital. The figures are based on a large number of different primary sources and are associated with substantial uncertainty, especially the estimates of damage where different agencies often report widely different numbers. Despite the wealth of information, the data still suffer from under-reporting, especially in the earlier periods, and the analysis therefore focuses on the period since 1970.
3 The ECCU countries are Anguilla, Antigua and Barbuda, Dominica, Grenada, Montserrat, St. Kitts and Nevis, St. Lucia, and St. Vincent and the Grenadines. Anguilla and Montserrat are British dependencies and are not analyzed independently.
- 4 -
hit the ECCU roughly once every two and a half years. The very high exposure to natural hazards in the Eastern Caribbean has recently been exemplified in Grenada, which suffered devastating damage from Hurricane Ivan in September 2004. Vulnerability to natural disasters is found to have important policy implications. Managing natural disaster risk would ideally involve use of market insurance mechanisms. However, the market for natural disaster insurance is not well developed and is largely absent in many developing countries. As an alternative, countries can self-insure by generating public savings in good times to cover potential increases in expenditure necessitated by future natural disasters. More appropriate building practices and other preventive measures may also substantially lessen a country’s exposure to natural hazards. The remainder of this chapter is organized as follows. Section II presents an overview of the incidence of natural disasters. Section III discusses the macroeconomic implications. Section IV offers an outline of different strategies to mitigate the impact of natural disasters. Section V summarizes the key findings.
II. THE INCIDENCE OF NATURAL DISASTERS
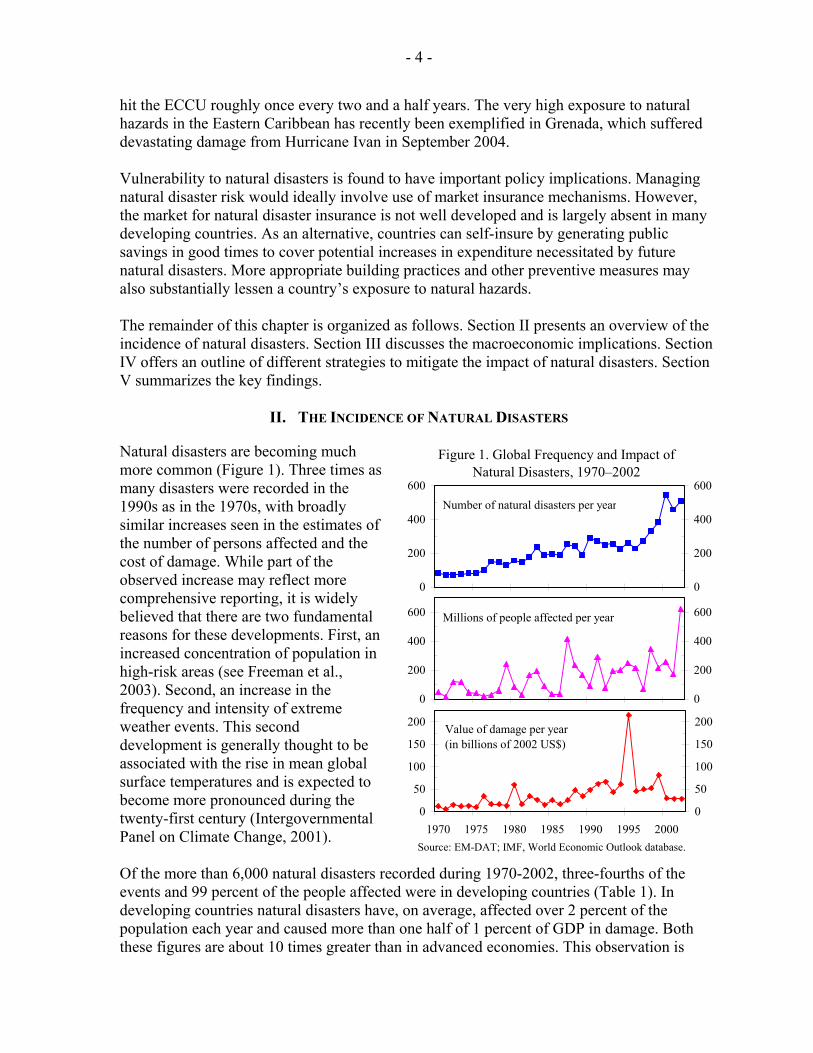
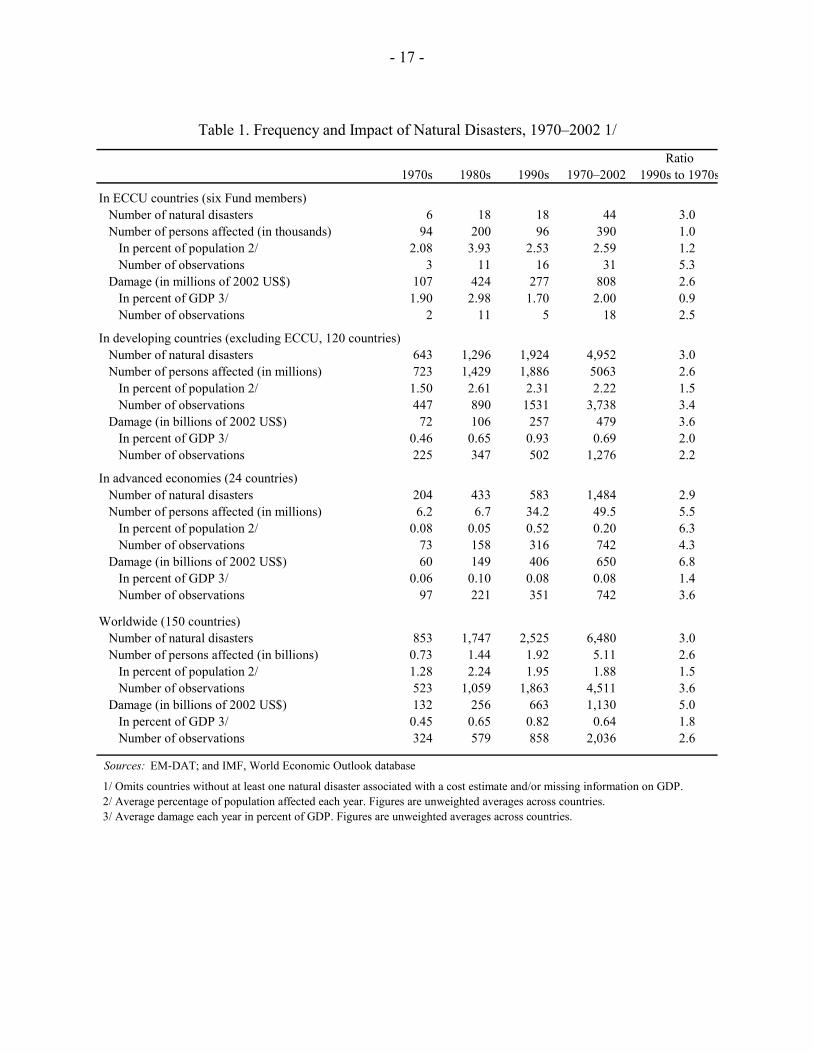
Natural disasters are becoming much more common (Figure 1). Three times as many disasters were recorded in the 1990s as in the 1970s, with broadly similar increases seen in the estimates of the number of persons affected and the cost of damage. While part of the observed increase may reflect more comprehensive reporting, it is widely believed that there are two fundamental reasons for these developments. First, an increased concentration of population in high-risk areas (see Freeman et al., 2003). Second, an increase in the frequency and intensity of extreme weather events. This second development is generally thought to be associated with the rise in mean global surface temperatures and is expected to become more pronounced during the twenty-first century (Intergovernmental Panel on Climate Change, 2001). Of the more than 6,000 natural disasters recorded during 1970-2002, three-fourths of the events and 99 percent of the people affected were in developing countries (Table 1). In developing countries natural disasters have, on average, affected over 2 percent of the population each year and caused more than one half of 1 percent of GDP in damage. Both these figures are about 10 times greater than in advanced economies. This observation is
0
200
400
600
0
200
400
600Number of natural disasters per year
Figure 1. Global Frequency and Impact of Natural Disasters, 1970–2002
0
50
100
150
200
1970 1975 1980 1985 1990 1995 20000
50
100
150
200Value of damage per year(in billions of 2002 US$)
Source: EM-DAT; IMF, World Economic Outlook database.
0
200
400
600
0
200
400
600Millions of people affected per year
- 5 -
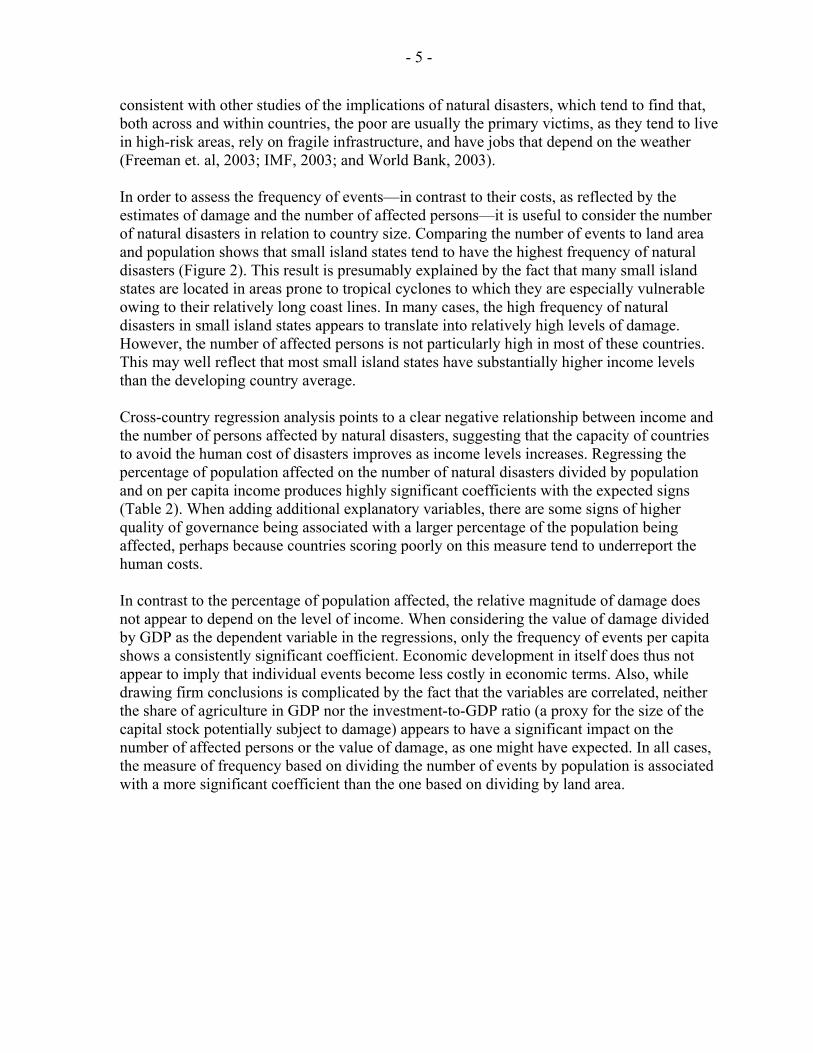
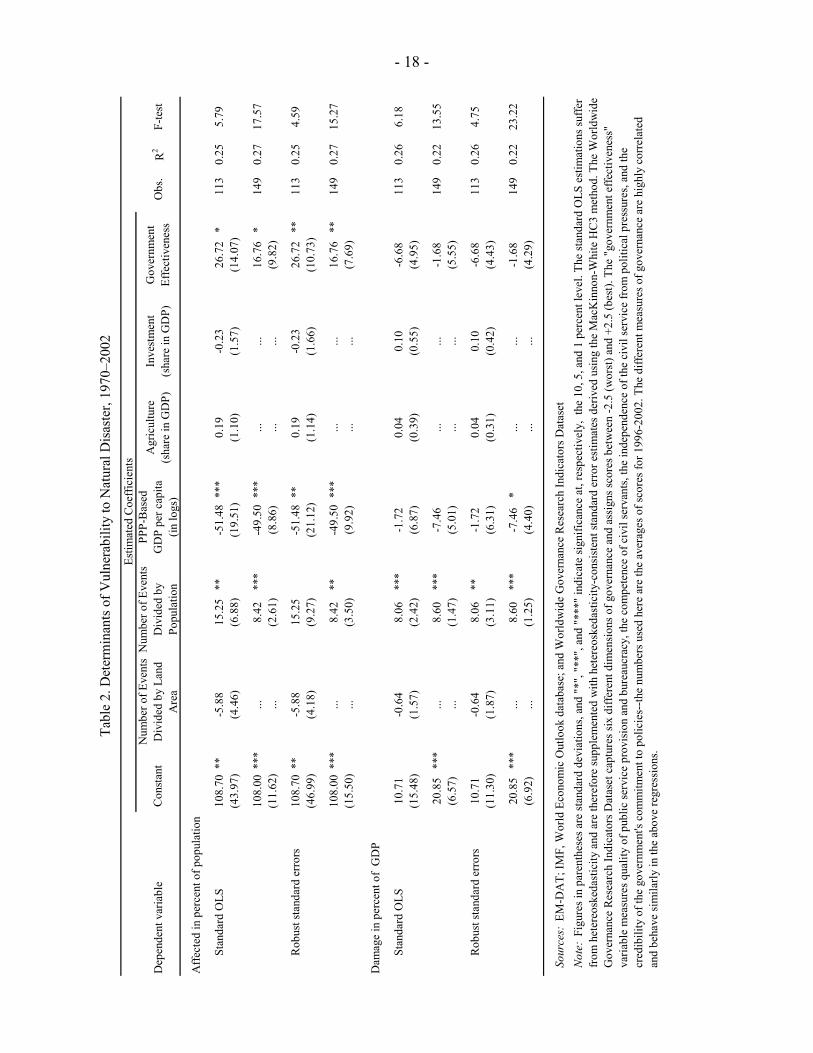
consistent with other studies of the implications of natural disasters, which tend to find that, both across and within countries, the poor are usually the primary victims, as they tend to live in high-risk areas, rely on fragile infrastructure, and have jobs that depend on the weather (Freeman et. al, 2003; IMF, 2003; and World Bank, 2003). In order to assess the frequency of events—in contrast to their costs, as reflected by the estimates of damage and the number of affected persons—it is useful to consider the number of natural disasters in relation to country size. Comparing the number of events to land area and population shows that small island states tend to have the highest frequency of natural disasters (Figure 2). This result is presumably explained by the fact that many small island states are located in areas prone to tropical cyclones to which they are especially vulnerable owing to their relatively long coast lines. In many cases, the high frequency of natural disasters in small island states appears to translate into relatively high levels of damage. However, the number of affected persons is not particularly high in most of these countries. This may well reflect that most small island states have substantially higher income levels than the developing country average. Cross-country regression analysis points to a clear negative relationship between income and the number of persons affected by natural disasters, suggesting that the capacity of countries to avoid the human cost of disasters improves as income levels increases. Regressing the percentage of population affected on the number of natural disasters divided by population and on per capita income produces highly significant coefficients with the expected signs (Table 2). When adding additional explanatory variables, there are some signs of higher quality of governance being associated with a larger percentage of the population being affected, perhaps because countries scoring poorly on this measure tend to underreport the human costs. In contrast to the percentage of population affected, the relative magnitude of damage does not appear to depend on the level of income. When considering the value of damage divided by GDP as the dependent variable in the regressions, only the frequency of events per capita shows a consistently significant coefficient. Economic development in itself does thus not appear to imply that individual events become less costly in economic terms. Also, while drawing firm conclusions is complicated by the fact that the variables are correlated, neither the share of agriculture in GDP nor the investment-to-GDP ratio (a proxy for the size of the capital stock potentially subject to damage) appears to have a significant impact on the number of affected persons or the value of damage, as one might have expected. In all cases, the measure of frequency based on dividing the number of events by population is associated with a more significant coefficient than the one based on dividing by land area.
- 6 -
Figu
re 2
. Cro
ss-C
ount
ry F
requ
ency
and
Impa
ct o
f Nat
ural
Dis
aste
rs, 1
970–
2002
Sour
ce:
EM-D
AT;
IMF,
Wor
ld E
cono
mic
Out
look
dat
abas
e; W
orld
Ban
k, W
orld
Dev
elop
men
t Ind
icat
ors.
Tong
a
St. V
ince
nt &
G
rena
dine
s St. L
ucia
St. K
itts a
nd
Nev
is
Mau
ritiu
sM
aldi
vesG
rena
daD
omin
ica
Bar
bado
s
Ant
igua
and
B
arbu
da
02468101214161820
05
1015
20
Ave
rage
ann
ual G
DP
per c
apita
(in
thou
sand
s of P
PP$)
Number of events divided by land area (index)
Ant
igua
and
B
arbu
da
Bel
ize
Dom
inic
a Gre
nada
Icel
and
St. K
itts a
nd
Nev
is
St. L
ucia
St. V
ince
ntTo
nga
Van
uatu
02468101214161820
05
1015
20
Ave
rage
ann
ual G
DP
per c
apita
(in
thou
sand
s of P
PP$)
Number of events divided by population (index)
Van
uatu
Swaz
iland
St. V
ince
ntSt
. Luc
iaSt
. Kitt
s
Nig
er
Moz
ambi
que
Mau
ritan
ia
Mal
awi
Indi
a
Gre
nada
Fiji
Ethi
opia D
omin
ica
Djib
outi
Bot
swan
aB
angl
ades
h
Aus
tralia
Ant
igua
and
B
arbu
da
02468101214
05
1015
20
Ave
rage
ann
ual G
DP
per c
apita
(in
thou
sand
s of P
PP$)
Average percent of population affected each year
Van
uatu
Tajik
ista
n
St. V
ince
ntSt
. Luc
ia
St. K
itts a
nd
Nev
is
Sam
oa
Nic
arag
uaM
ongo
lia Gre
nada
Dom
inic
a
Ant
igua
024681012
05
1015
20
Ave
rage
ann
ual G
DP
per c
apita
(in
thou
sand
s of P
PP$)
Average annual damage (in percent of GDP)
- 7 -
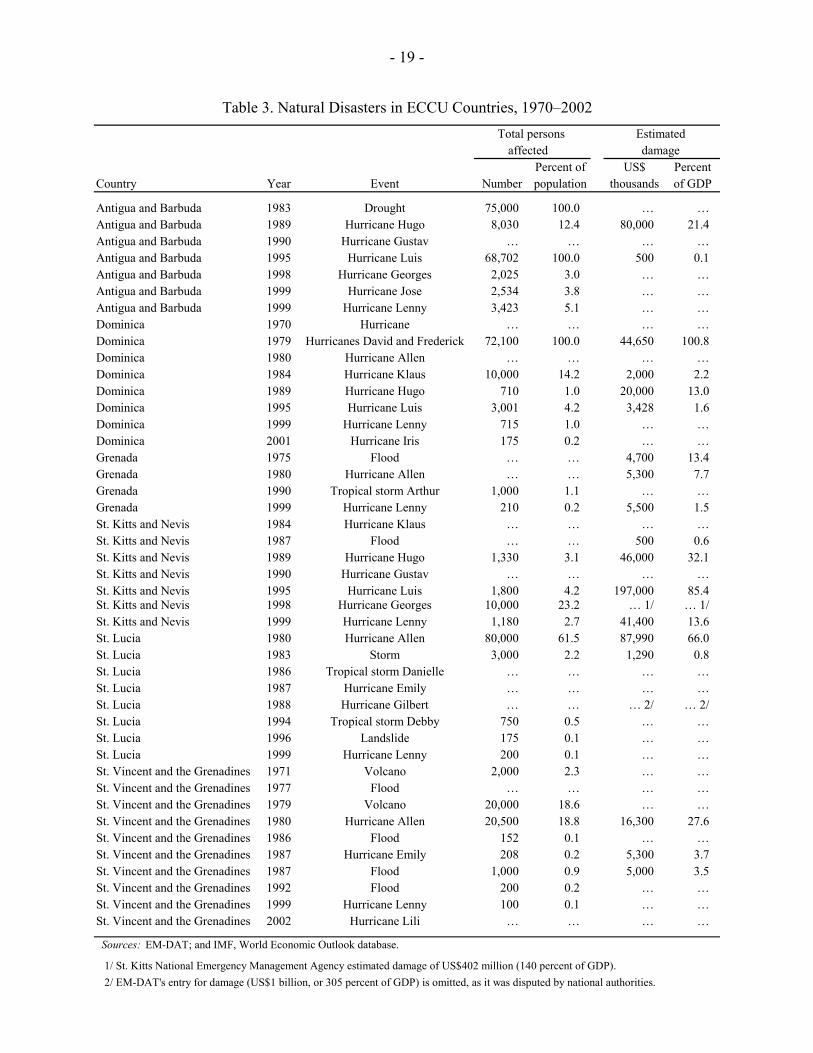
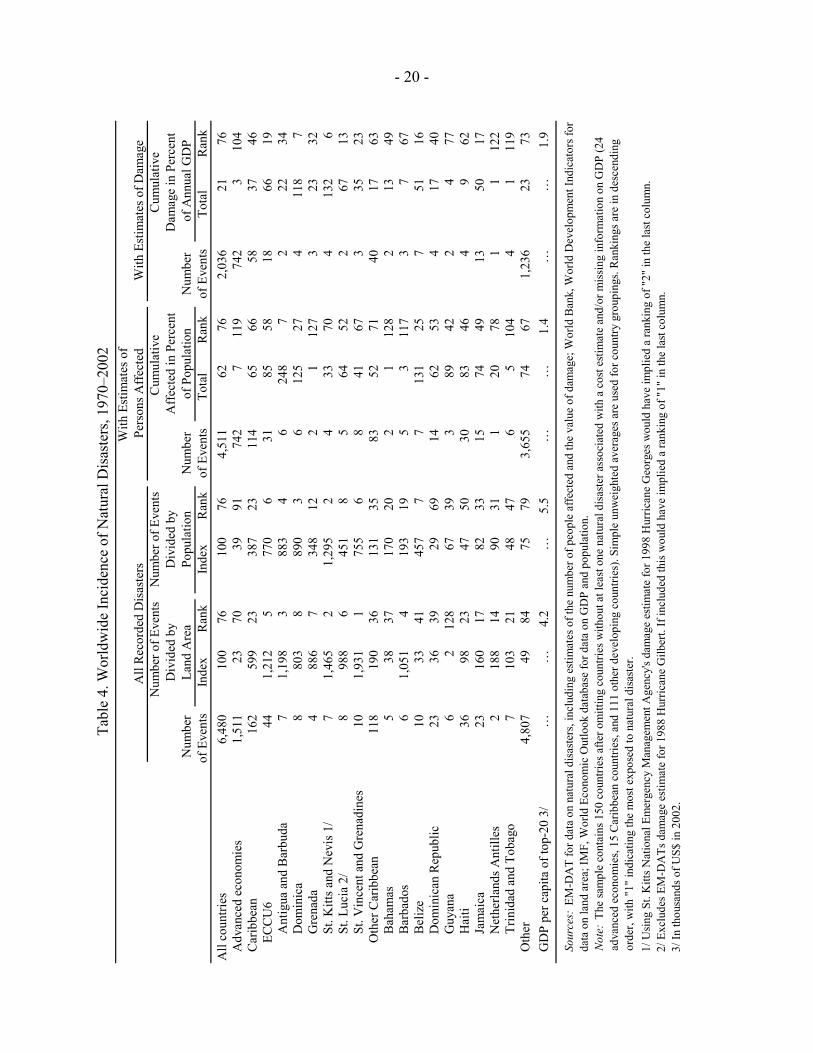
The Eastern Caribbean is in the Atlantic hurricane belt, and several of the countries are also subject to potential volcanic eruptions. Typically occurring during the June–November period, wind storms have caused 34 of the 44 natural disasters recorded since 1970 in the six ECCU countries that are Fund members (Table 3). On average, a natural disaster occurred once every four and a half years in each of the six countries. Considering only incidents that affected at least 2 percent of a country’s population or inflicted damage of at least 2 percent of GDP, EM-DAT figures point to such events occurring in the individual countries once every nine years or somewhere in the region once every two and a half years. Among these large disasters, the median number of affected persons amounted to 9 percent of the country’s population and the median value of damage was equivalent to 14 percent of the country’s annual GDP. Some events have been truly devastating, affecting the population of an entire country and causing damage exceeding 100 percent of annual GDP. For example, in 1979 Hurricane David hit Dominica with winds in excess of 130mph, killing 42 people, damaging 95 percent and completely destroying 12 percent of buildings, damaging or destroying the entire banana crop and 75 percent of the country’s forests, rendering virtually the entire population homeless, and leading to the temporary exodus of about a quarter of the population (Benson et al., 2001). Consequently, GDP plummeted by 17 percent, central government current expenditure increased by 31 percent with capital expenditure increasing even more rapidly, and the fiscal deficit increased from 3.1 percent of GDP in 1978 to 8.1 percent in 1981 despite a sizable increase in foreign grant receipts. By several measures, the ECCU countries are among the most disaster prone in the world (Table 4).4 When comparing the number of natural disasters during 1970–2002 to land area, all six ECCU countries rank among the 10 most disaster prone in the world. By this measure, they were more than 12 times as exposed as the average country. The incidence is only slightly lower when one compares the number of disasters to population. Interestingly, the results do not reveal clear differences between the ECCU countries. Given that the northern islands (Antigua and Barbuda, St. Kitts and Nevis, and Dominica) are closer to the center of the hurricane belt than the southern islands (St. Lucia, St. Vincent and the Grenadines, and Grenada), one would have expected the former countries to rank higher in terms of vulnerability to natural disaster, but that is not consistently the case. The costs of natural disasters in the ECCU appear somewhat lower than the very high frequency of events would suggest. The average cumulative damage was equivalent to 66 percent of annual GDP, compared to a worldwide average of 21 percent, and only two of the six countries are in
4 Crowards and Coulter (1998), ECLAC (2000), and Pollner (2001) reach a similar conclusion. At a broader level, the findings are also in line with the composite vulnerability indexes proposed by several international institutions (see Atkins et al., 2000; Crowards, 2000a; and United Nations, 2000). In addition to proneness to natural disaster, these indexes include factors such as susceptibility to terms of trade shocks and concentration of exports to rank countries according to their overall vulnerability. The different indices all find that small isolated low-income countries are the most vulnerable, with the ECCU countries in most cases ranking near the very top.
- 8 -
the top 10 according to this measure. In terms of the human cost, only Antigua and Barbuda was among the top 10 according to the percentage of the population affected. The relatively small number of persons affected by natural disaster in the ECCU is consistent with the tendency for countries to become more resilient as they become richer. Average per capita GDP in the six ECCU countries was US$5,500 in 2002, compared with US$1,400 for the 20 most vulnerable countries based on the percentage of the population affected. The relatively high level of income in ECCU countries thus appears to substantially mitigate the human cost of the frequent natural disasters.
III. THE MACROECONOMIC IMPLICATIONS OF NATURAL DISASTERS
In principle, one can distinguish between several sources of loss from natural disasters. There is a direct cost from loss of assets, as reflected by EM-DAT’s measure of damage. In addition, disruption of economic activity may lead to loss of income. Finally, these impacts may cause spillovers at the macroeconomic level, as fiscal and external pressures can lead to imbalances that spark economic crises, and an increase in the incidence of poverty can create social unrest. It is therefore useful to examine the broader impact.
A. Short- and Medium-Term Impact
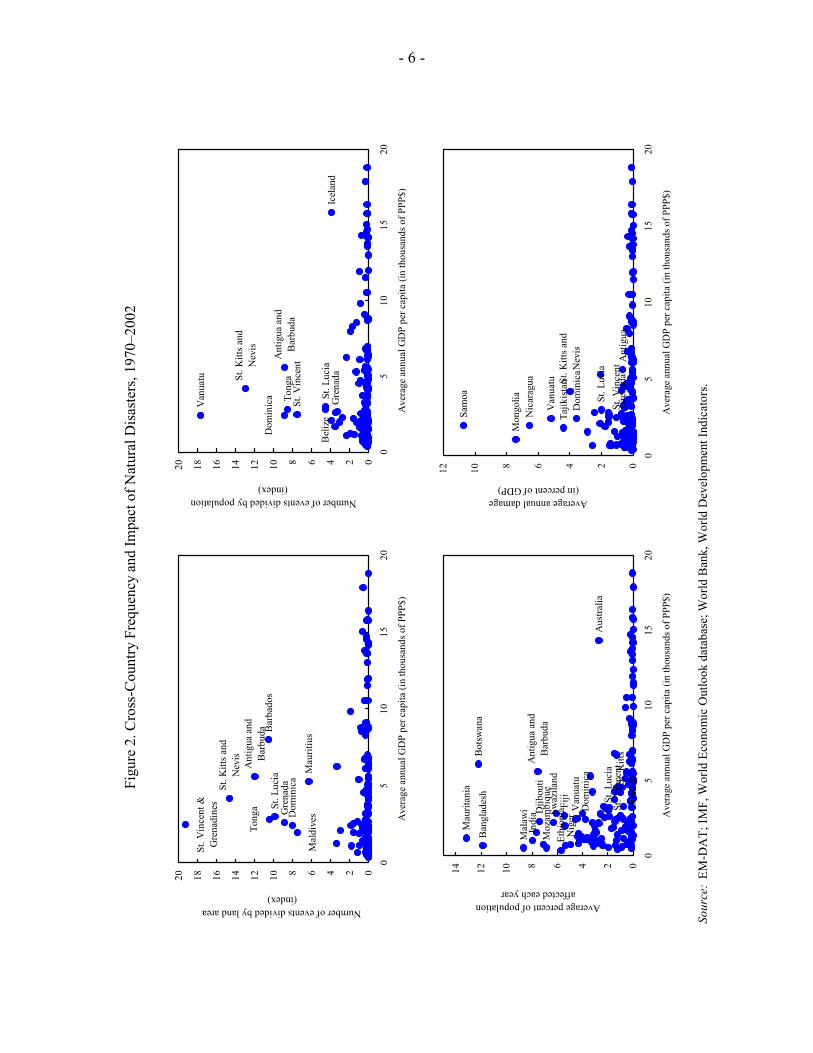
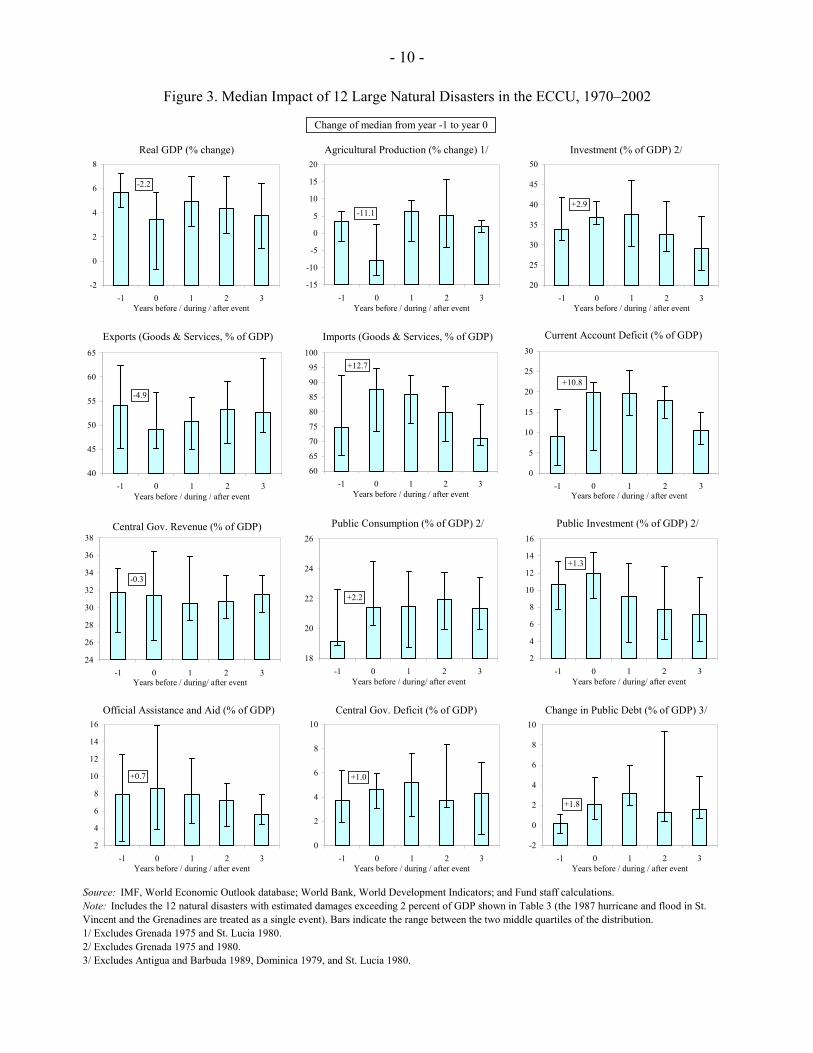
Studies of the impact of natural disasters (see Box 1) point to a discernible short-term impact. A common finding is an immediate contraction in output and a worsening of external and fiscal balances, with the impact somewhat softened by an increase in transfers from abroad. Figure 3 shows the dynamic impact of the 12 natural disasters in the ECCU since 1970 for which the damage estimate exceeded 2 percent of GDP. While the small number of observations prevents formal statistical analysis, the results suggest that the impact conformed to the general pattern, although in some cases it seems to have been more severe than seen elsewhere. The 12 large natural disasters in the ECCU were associated with a median reduction in same-year real GDP growth of 2.2 percentage points, as well as with a large decline in agricultural production and an offsetting increase in investment. Exports declined and imports increased, resulting in a staggering median increase in the current account deficit equal to 10.8 percent of GDP. These very large same-year effects are all the more striking when one considers that all the events occurred in the second half of the year. The impact on the central government was less clear, with a large variation in outcomes. Nevertheless, the tendency appears to have been a marked increase in expenditure and a small reduction in total revenue (including grants) despite an increase in inflows of official assistance and aid. As a result, the median public debt-to-GDP ratio increased sharply by a cumulative 6.5 percentage points over three years.
- 9 -
Box 1. Review of Literature on Macroeconomic Implications of Natural Disasters
A number of studies reveal that natural disasters are typically associated with:
• An immediate contraction in economic output. Natural disasters are found to have been usually accompanied by a reduction in same-year GDP growth, with the impact ranging from very small to 20 percentage points or more (e.g., Dominica in 1979). Among studies looking at Latin America and the Caribbean, Auffret (2003a) considers 16 natural disasters and finds that 1 percent of GDP in direct damage reduced same-year GDP growth by 0.5 percentage point; Charvériat (2000) analyzes 35 events with a median damage of 3 percent of GDP and finds that same-year GDP growth fell in 28 cases, with an overall median reduction of 1.7 percentage points; and Crowards (2000b) finds that same-year GDP growth fell by an average of 3.1 percentage points following 21 major disasters. Evidence of an impact on growth beyond the contemporaneous drop is mixed. For example, Caselli and Malhotra (2004) present a comprehensive statistical study and conclude that disasters have no significant impact on the growth path.
• A worsening of external balances. Several studies have found that natural disasters typically result in an increase in imports (e.g., for reconstruction materials and to compensate for lost production) and that exports tend to suffer. For example, ECLAC (2000) considers 42 large natural disasters in Latin America and the Caribbean and finds that these were, on average, associated with a deterioration in the balance of payments by an amount equal to about one-third of the estimated damage. Crowards (2000b) finds that 21 major natural disasters led to an average worsening of the trade balance owing to an increase in import growth and, to a lesser extent, a reduction in export growth. Benson et al. (2001) find that a country’s dependence on agricultural exports is an important indicator of the magnitude of the deterioration in the trade balance.
• A deterioration in fiscal balances. While significant relationships are difficult to establish, the literature suggests that natural disasters can put substantial pressure on public finances. Emergency assistance and reconstruction efforts call for higher government expenditure, and, at the same time, tax revenue may shrink because of the decline in economic activity. Consequently, the result is usually a worsening of public balances. For example, IMF (2003) finds that five large exogenous shocks in Africa were associated with same-year increases in fiscal deficits of up to 3 percent of GDP. However, in many cases natural disasters appear to have had very little impact on fiscal balances, perhaps because countries are constrained by existing expenditure envelopes (Benson and Clay, 2003a).
• An increase in poverty. Natural disasters have been found to have a disproportionate impact on the poorer segments of the population. Low-income households often settle in the most vulnerable areas and live in poorly constructed housing (World Bank, 2003). In addition, the poor have fewer assets and limited access to credit and are therefore less able to cushion the impact on consumption of disruptions to income (IMF, 2003). While natural disasters thus appear to have an adverse effect on poverty, it is unclear how quickly affected households can recover.
- 10 -
Figure 3. Median Impact of 12 Large Natural Disasters in the ECCU, 1970–2002
-2
0
2
4
6
8
-1 0 1 2 3Years before / during / after event
Real GDP (% change)
0
5
10
15
20
25
30
-1 0 1 2 3Years before / during / after event
Current Account Deficit (% of GDP)
+10.8
Source: IMF, World Economic Outlook database; World Bank, World Development Indicators; and Fund staff calculations.Note: Includes the 12 natural disasters with estimated damages exceeding 2 percent of GDP shown in Table 3 (the 1987 hurricane and flood in St. Vincent and the Grenadines are treated as a single event). Bars indicate the range between the two middle quartiles of the distribution.1/ Excludes Grenada 1975 and St. Lucia 1980.2/ Excludes Grenada 1975 and 1980.3/ Excludes Antigua and Barbuda 1989, Dominica 1979, and St. Lucia 1980.
60
65
70
75
80
85
90
95
100
-1 0 1 2 3Years before / during / after event
+12.7
Imports (Goods & Services, % of GDP)
40
45
50
55
60
65
-1 0 1 2 3Years before / during / after event
-4.9
Exports (Goods & Services, % of GDP)
18
20
22
24
26
-1 0 1 2 3Years before / during/ after event
+2.2
Public Consumption (% of GDP) 2/
2
4
6
8
10
12
14
16
-1 0 1 2 3Years before / during/ after event
+1.3
Public Investment (% of GDP) 2/
-15
-10
-5
0
5
10
15
20
-1 0 1 2 3Years before / during / after event
-11.1
Agricultural Production (% change) 1/
24
26
28
30
32
34
36
38
-1 0 1 2 3Years before / during/ after event
Central Gov. Revenue (% of GDP)
-0.3
0
2
4
6
8
10
-1 0 1 2 3Years before / during / after event
+1.0
Central Gov. Deficit (% of GDP)
-2
0
2
4
6
8
10
-1 0 1 2 3Years before / during / after event
+1.8
Change in Public Debt (% of GDP) 3/
2
4
6
8
10
12
14
16
-1 0 1 2 3Years before / during / after event
+0.7
Official Assistance and Aid (% of GDP)
20
25
30
35
40
45
50
-1 0 1 2 3Years before / during / after event
+2.9
Investment (% of GDP) 2/
-2.2
Change of median from year -1 to year 0
- 11 -
The observed deterioration in fiscal and external balances is not surprising, as governments and households would be expected to borrow in response to temporary shocks. As such, the very large impact on the current account deficit seen in the ECCU countries is a reflection of the region’s high degree of openness and access to international capital. Reliance on capital markets to mitigate the impact of natural disasters also represents a source vulnerability, however, as access to financing may suddenly dry up, making it difficult to service existing debts and necessitating deep cuts in consumption.
B. Long-Term Effects
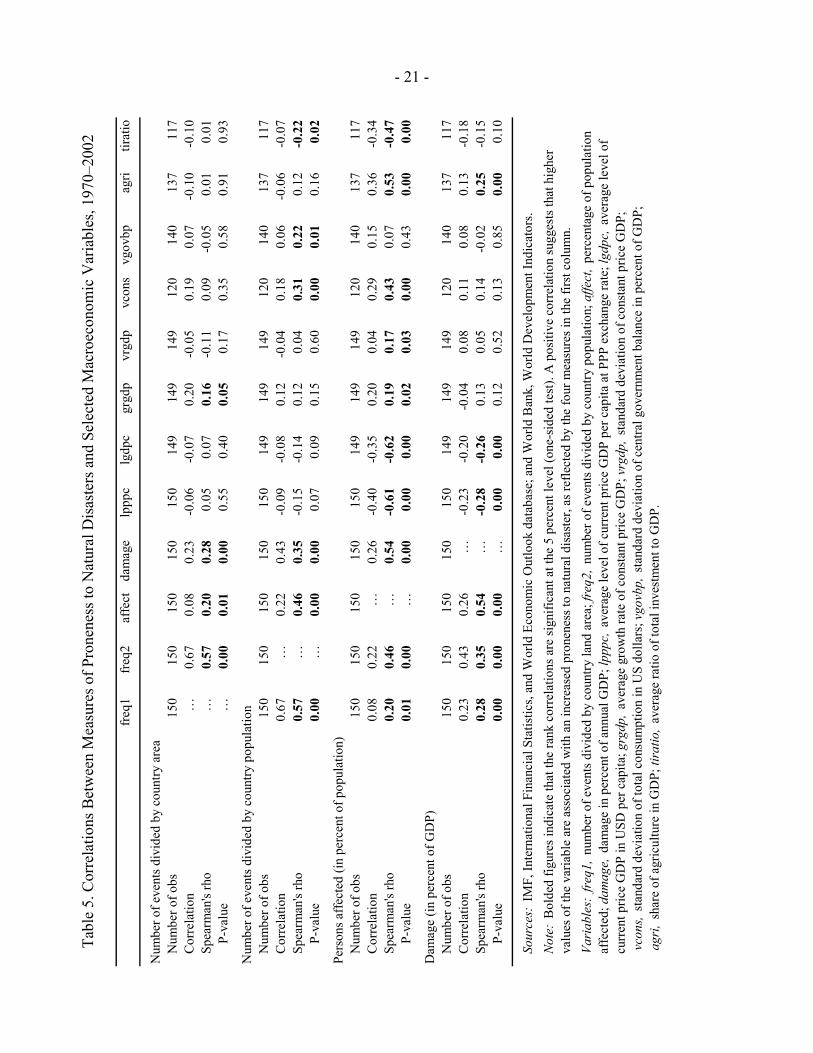
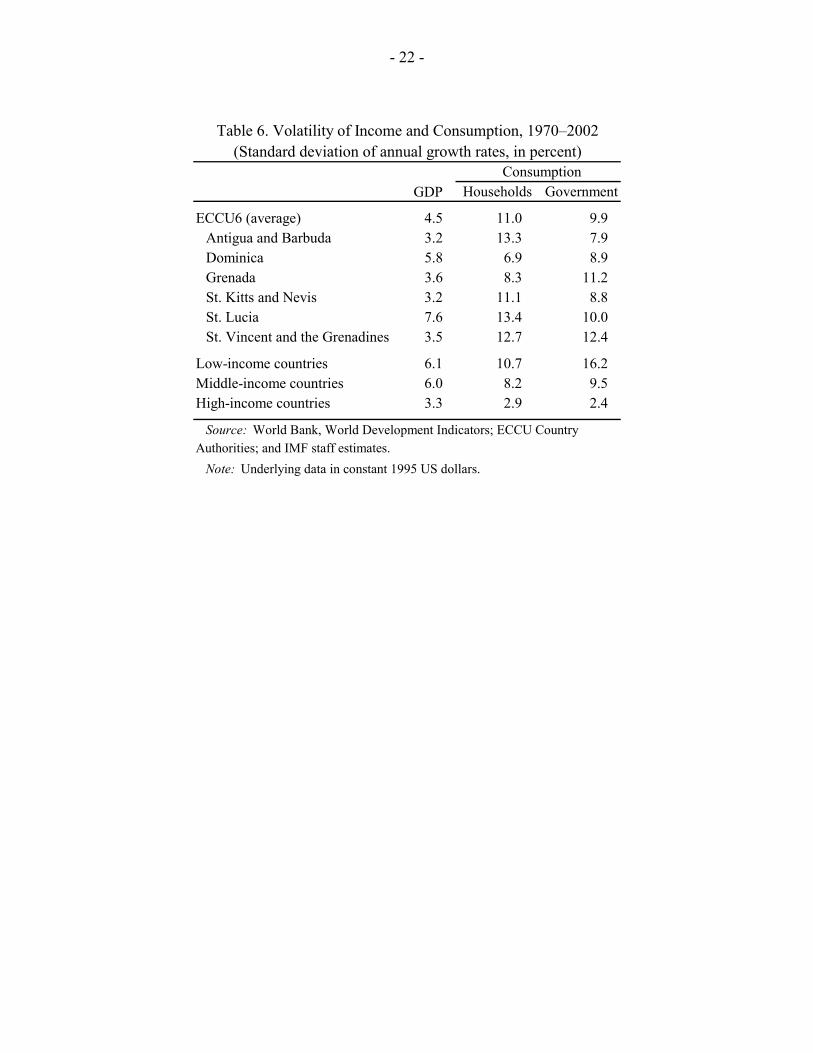
Natural disasters can affect long-term outcomes through a number of channels, including environmental damage to agriculture, fishing, and forestry (ECLAC, 2000). The destruction of schools could have a long-lasting negative impact on the stock of human capital; reconstruction efforts could crowd out productive capital expenditure; increased indebtedness could raise the rate of interest and reduce investment; and a worsening of fiscal and external balances could trigger inflation and/or financial crises.5 Evidence of the long-term economic effects of natural disasters is inconclusive. There has been little empirical analysis, and drawing firm conclusions is difficult. Among the few available studies, Benson and Clay (2003b) present findings suggesting that proneness to natural disasters has a negative impact on long-term economic growth, while the World Bank (2003) finds that natural disasters have no significant impact on growth. Table 5 presents rank correlations between the different measures of disaster proneness and key macroeconomic indicators. The results do not point to any persistently significant correlations and some have unexpected signs. In line with the findings of Section II, the percentage of the population affected is strongly associated with low levels of income. The rank correlations also suggest that proneness to natural disasters—especially in terms of the percentage of the population affected—is associated with high volatility of income, consumption, and fiscal balances; a large agricultural sector; and a low investment-to-GDP ratio. All this is as one would expect. Contrary to what one might expect, the number of recorded events divided by land area and the percentage of the population affected are both positively correlated with GDP growth, although the relationship is not strongly significant and could be driven by other factors. The Caribbean suffers from very high consumption volatility, which could plausibly be the result of the region’s proneness to natural disasters, as suggested by the findings in Table 5. However, using cross-country regression analysis, the World Bank (2003) finds that natural disasters do not appear to be a significant determinant of consumption volatility. Also, although there is substantial variation between countries, income volatility (as measured by the standard deviation of annual real GDP growth) is not especially high in the Caribbean compared with other middle- 5 IMF (2003), citing a number of different studies, finds that exogenous shocks and the associated policy responses have contributed to the accumulation of unsustainable external debt in many developing countries.
- 12 -
income countries (Table 6).6 This suggests that the impact of natural disasters on aggregate volatility, if any, is small. This is perhaps not surprising given that large events are relatively rare occurrences. High consumption volatility in the Caribbean therefore probably has less to do with proneness to natural disasters than with inadequate mechanisms for consumption smoothing, in particular a relatively limited use of insurance (Auffret, 2003a, 2003b); the absence of counter-cyclical fiscal policy (World Bank, 2003); and generally high volatility in small states (Easterly and Kraay, 2000). Nevertheless, even if the direct impact is small, it is still possible that natural disasters have an indirect impact on aggregate volatility. For example, low levels of insurance in the Caribbean may be, in part, a result of the proneness to natural hazards impeding the efficiency of the market.
IV. MITIGATING DISASTERS
This section reviews ways in which countries can reduce the cost of natural disasters and suggests that these can be substantially mitigated. Insurance and capital markets can provide compensation for loss of capital and income, alleviating the damage to household and government balance sheets, and reducing the immediate impact on consumption possibilities. Good building practices and other precautionary arrangements can lessen the impact of natural hazards in the first place. Unfortunately, these mechanisms function poorly in many of the countries most vulnerable to natural disasters, including the ECCU countries.
A. Coping With Risk: The Role of Insurance and Capital Markets
Insurance can reduce the negative impact of natural disasters by spreading the burden over space and time. The insurance market is mainly international, with local insurers reinsuring part of their exposure with larger, often global, companies. However, the market for natural hazard insurance does not operate very smoothly and is limited in scope. As described in Pollner (2001), natural disasters are “high severity, low frequency” events that are more difficult to manage for insurance companies than the “low severity, high frequency” risk that they prefer to cover. In addition, objective information on damage and risks is difficult to obtain. Consequently, the market for catastrophe risk insurance is well known to be inefficient, with high price of coverage, excessive volatility, and insufficient pooling of risk. A more efficient risk-sharing procedure would use capital markets to spread the exposure over a larger number of investors. The recent emergence of catastrophe bonds in advanced markets could help address the problem, but these are still not very widespread (Box 2).
6 Cashin (2004) shows that filtering out the effect of business cycles dramatically increases the volatility of real GDP growth in the ECCU relative to that of other countries.
- 13 -
Box 2. New Instruments for Dealing with Natural Hazard Risk
A number of capital market instruments have recently become available for weather- and disaster-related risks. Most prominent among these are catastrophe bonds, or cat bonds; other instruments include exchange-traded catastrophe options, catastrophe swaps, and weather derivatives. Cat bonds offer high yields but are subject to default if a covered catastrophe occurs during the life of the bond. Securitizing catastrophe risk in this way enables the risk to be spread more widely, thereby improving the efficiency of risk transfer.
While cat bonds and other similar instruments are still in their infancy and have so far been used only in developed countries, they could potentially help developing countries obtain large-scale protection against natural hazard risk. For example, a government could issue a cat bond to protect itself against the risk of a major hurricane. The proceeds from the bond would then be invested in risk-free securities with the spread between the two representing the recurring cost of insurance. If the specified hurricane occurs, the government would default on the cat bond and would then be free to use the funds placed in risk-free securities to cover its reconstruction costs. In order to minimize ambiguity, the bond should be tied to objective criteria such as wind speed or flood height at a specified location.
The shortcomings of the market for natural hazard insurance are especially pronounced in developing countries. In many developing countries the insurance sector is only at an early stage of development and there is very little spreading of natural hazard risk (Freeman et al., 2003). This is evident in the fact that the percentage of natural disaster damage covered by insurance is much lower than in advanced economies. According to Charvériat (2000), Latin America and the Caribbean has the lowest insurance cover of any region in the world, with only 3.9 percent of 1985–99 natural disaster damage covered by insurance—compared with 34.5 percent in North America, the region with the highest coverage. While the ECCU insurance market is relatively advanced in comparison to that in other developing countries, coverage is not very widespread and costs are much higher than in advanced economies. Relative to the economy total property insurance premiums in the ECCU are not that much lower than in the U.S. (about 2.4 percent of GDP compared with 3.3 percent). However, this is largely a reflection of high prices, with base property insurance rates in the ECCU countries about double the rate prevailing in less hurricane-exposed cities in the United States (Pollner, 2001). Overall, the Eastern Caribbean insurance market suffers from a high expense ratio, high fragmentation, and a low level of available risk capital. Pollner (2001) finds that the expense ratios of local insurance companies are 30-40 percent of premium income, compared with the U.S. average of 26-28 percent. With a limited domestic capital base and about 80 percent of gross property insurance premiums transferred to reinsurers, the East Caribbean insurance market is highly exposed to the volatile global reinsurance market. This has caused local insurance rates to be unduly affected by natural catastrophes in industrial countries. For example, swings in global reinsurance rates following Hurricane Andrew in Florida (1992) and the Northridge earthquake in California (1994), had a pronounced impact on property insurance rates
- 14 -
in the Eastern Caribbean, with the annual cost of insurance jumping from 0.4 percent of insured value in 1990 to 1.3 percent in 1994, and declining to 0.7 percent in 1998. Insurance coverage in the ECCU is highly uneven. The vast majority of property insurance relates to large commercial businesses, especially in the tourism sector. In contrast, even though lenders typically require mortgage holders to be insured, a large number of private dwellings are uninsured, particularly among low-income households. Public sector use of market insurance is generally limited, although some countries have recently moved toward insuring a majority of government assets. In addition, crop insurance is not always available to farmers, one exception being the WINCROP scheme.7
B. Domestic Public Policy to Reduce Risk and Lessen the Impact
While many countries have taken steps to improve their preparedness for natural disasters, there appears to be scope for increasing the efficacy of policy measures. Of particular importance in the ECCU is the need to improve the functioning of the insurance market, both to increase coverage in the face of the high natural hazard risk and to reduce economic volatility. Here, government property could be insured more widely, possibly by using cat bonds or other financial innovations. Policies to encourage more widespread insurance of dwellings and crops would also be beneficial, particularly in low-income communities. Strengthening financial regulation would improve the insurance product, making it attractive to a wider segment of the economy. In addition to promoting market-based insurance, very modest investments can often substantially reduce the structural vulnerability of infrastructure and buildings. By one estimate, investments of US$40 billion in disaster preparedness, prevention, and mitigation would have reduced global economic losses in the 1990s by US$280 billion (Freeman et al., 2003). For example, simple measures such as tying walls to foundation and roofs to walls may dramatically increase buildings’ resistance to hurricanes (Pollner, 2001). Well-designed and strictly enforced building codes and zoning regulation are central to ensuring that construction methods are appropriate for the local environment. Implementing hurricane-resistant home improvement programs to encourage safer building practices in the informal sector, as is done in several of the ECCU countries, can also have very positive results. In other areas, governments should refrain from subsidizing monoculture, as diversification within agriculture and from agriculture to other sectors would lessen the concentration of risk. Natural disasters cannot be entirely eliminated, especially in high risk regions such as the ECCU. Ensuring an effective response requires administrative initiatives, such as preparing emergency 7 Windward Islands Crop Insurance, or WINCROP, provides storm insurance for banana growers. The scheme, which covers the entire export crop in Dominica, Grenada, St. Lucia, and St. Vincent and the Grenadines, provides cover only against a small proportion (about 20 percent) of losses, but this has proven sufficient to enable growers to rehabilitate quickly.
- 15 -
procedures and social safety nets. It also requires financial preparedness. In principle, when market insurance is not available, risk-averse governments should each year save an amount equal to the expected cost of disasters (Freeman et al., 2003). Accumulation of contingency funds, such as those held at the Eastern Caribbean Central Bank (ECCB), would be the most obvious channel for such savings.8 For countries with very high debt levels, however, it may be more practical to use precautionary savings to pay down existing debt.
C. International Assistance and Cooperation
External assistance plays an important role in helping countries mitigate the effects of exogenous shocks. An increasing share of official development assistance is being devoted to emergency assistance, and multilateral financial institutions are also doing more in this area.9 Nevertheless, the very rapid increase in the frequency of natural disasters around the world suggests a need for increasing the effort. In addition, the majority of external assistance for natural disasters has been concentrated on a few very visible events, and it is possible that smaller disasters getting little media coverage are receiving too small a share of assistance. Given the small individual amounts of assistance, cooperation among agencies is important to ensure that resources are distributed appropriately. The IMF has several instruments for providing financial assistance in response to natural disasters. The most directly targeted policy is emergency assistance for natural disaster (EAND), which has been used 27 times since 1962. Other options include the compensatory financing facility, stand-by arrangements, and PRGF arrangements. Available resources in cases of natural disaster are relatively limited, however. The total amount of financing given in the six cases where ECCU countries have accessed EAND was only US$16 million, less than 2 percent of the estimated damage. The main benefit of EAND is that it can be provided relatively quickly (usually within two or three months after the event) with relatively little conditionality and that it can act as a catalyst for other donor flows. The compensatory financing facility may also be relevant, but is more directed at export shortfalls. Stand-By and PRGF arrangements, while permitting greater amounts of assistance, are slower to disburse, subject to conditionality, and not geared towards the problems associated with natural disasters. Of particular relevance for the ECCU countries are the programs sponsored by the Caribbean Development Bank (CDB), the World Bank, and the Caribbean Disaster Emergency Response Agency (CDERA). The CDB, which provides assistance for disaster relief, mitigation, and
8 The ECCB has a fiscal reserve account to assist member countries facing economic difficulties, including those caused by natural disasters. Contributions to the account are mandatory, with an amount automatically deducted from the profits owed to each member country, and the terms of drawings are determined on a case-by-case basis. The account, which has been in place for a decade, currently holds about EC$12 million and has never been used in relation to a natural disaster.
9 See IMF (2003) for an overview of international financing mechanisms for addressing exogenous shocks.
- 16 -
preparedness projects, disbursed US$50 million in loans for 27 operations during 1998–2001. The World Bank disbursed more than US$30 million in the region during the same period, in large part for projects relating to disaster management and emergency recovery. CDERA, a regional agency established in 1991 to provide an immediate and coordinated response to disastrous events in member countries, is engaged in a wide array of disaster-management services, ranging from local information campaigns to logistical support for dispatch of relief supplies.
V. SUMMARY OF FINDINGS
On average, natural disasters affect about 2 percent of a country’s population each year and cause damage amounting to well over one-half of 1 percent of GDP. The incidence is especially pronounced in developing countries, with the ECCU countries standing out as among the most vulnerable in the world in terms of the frequency of events. Given the high and increasing cost of disasters, there is a need for polices to better mitigate the impact of damaging natural events. Natural disasters are typically associated with an immediate contraction in economic output, a worsening of external and fiscal balances, and an increase in poverty. The impact is clearly seen in the ECCU, where natural disasters have had pronounced macroeconomic effects. Despite the vulnerability to natural disasters, insurance plays a limited role in developing countries. Although the insurance market is more advanced in the ECCU than in many other developing countries, property insurance is still not very widespread, especially among low-income households. Overall, the ECCU insurance market suffers from a high expense ratio, high fragmentation, high volatility, and a small capital base. Modest investments in preventive measures can often substantially mitigate the impact of natural hazards. Natural disasters cannot be eliminated, however, and it is important for governments to be prepared. Among other things, a tighter fiscal policy during good times would leave more room for expenditure increases in emergencies.
- 17 -
Table 1. Frequency and Impact of Natural Disasters, 1970–2002 1/
Ratio1970s 1980s 1990s 1970–2002 1990s to 1970s
In ECCU countries (six Fund members)Number of natural disasters 6 18 18 44 3.0Number of persons affected (in thousands) 94 200 96 390 1.0
In percent of population 2/ 2.08 3.93 2.53 2.59 1.2Number of observations 3 11 16 31 5.3
Damage (in millions of 2002 US$) 107 424 277 808 2.6In percent of GDP 3/ 1.90 2.98 1.70 2.00 0.9Number of observations 2 11 5 18 2.5
In developing countries (excluding ECCU, 120 countries)Number of natural disasters 643 1,296 1,924 4,952 3.0Number of persons affected (in millions) 723 1,429 1,886 5063 2.6
In percent of population 2/ 1.50 2.61 2.31 2.22 1.5Number of observations 447 890 1531 3,738 3.4
Damage (in billions of 2002 US$) 72 106 257 479 3.6In percent of GDP 3/ 0.46 0.65 0.93 0.69 2.0Number of observations 225 347 502 1,276 2.2
In advanced economies (24 countries)Number of natural disasters 204 433 583 1,484 2.9Number of persons affected (in millions) 6.2 6.7 34.2 49.5 5.5
In percent of population 2/ 0.08 0.05 0.52 0.20 6.3Number of observations 73 158 316 742 4.3
Damage (in billions of 2002 US$) 60 149 406 650 6.8In percent of GDP 3/ 0.06 0.10 0.08 0.08 1.4Number of observations 97 221 351 742 3.6
Worldwide (150 countries)Number of natural disasters 853 1,747 2,525 6,480 3.0Number of persons affected (in billions) 0.73 1.44 1.92 5.11 2.6
In percent of population 2/ 1.28 2.24 1.95 1.88 1.5Number of observations 523 1,059 1,863 4,511 3.6
Damage (in billions of 2002 US$) 132 256 663 1,130 5.0In percent of GDP 3/ 0.45 0.65 0.82 0.64 1.8Number of observations 324 579 858 2,036 2.6
Sources: EM-DAT; and IMF, World Economic Outlook database
1/ Omits countries without at least one natural disaster associated with a cost estimate and/or missing information on GDP. 2/ Average percentage of population affected each year. Figures are unweighted averages across countries. 3/ Average damage each year in percent of GDP. Figures are unweighted averages across countries.
- 18 -
Tabl
e 2.
Det
erm
inan
ts o
f Vul
nera
bilit
y to
Nat
ural
Dis
aste
r, 19
70–2
002
Estim
ated
Coe
ffici
ents
Dep
ende
nt v
aria
ble
Obs
. R
2F-
test
Affe
cted
in p
erce
nt o
f pop
ulat
ion
Stan
dard
OLS
108.
70**
-5.8
815
.25
**-5
1.48
***
0.19
-0.2
326
.72
*11
30.
255.
79(4
3.97
)(4
.46)
(6.8
8)(1
9.51
)(1
.10)
(1.5
7)(1
4.07
)
108.
00**
*...
8.42
***
-49.
50**
*...
...16
.76
*14
90.
2717
.57
(11.
62)
...(2
.61)
(8.8
6)...
...(9
.82)
Rob
ust s
tand
ard
erro
rs10
8.70
**-5
.88
15.2
5-5
1.48
**0.
19-0
.23
26.7
2**
113
0.25
4.59
(46.
99)
(4.1
8)(9
.27)
(21.
12)
(1.1
4)(1
.66)
(10.
73)
108.
00**
*...
8.42
**-4
9.50
***
......
16.7
6**
149
0.27
15.2
7(1
5.50
)...
(3.5
0)(9
.92)
......
(7.6
9)
Dam
age
in p
erce
nt o
f G
DP
Stan
dard
OLS
10.7
1-0
.64
8.06
***
-1.7
20.
040.
10-6
.68
113
0.26
6.18
(15.
48)
(1.5
7)(2
.42)
(6.8
7)(0
.39)
(0.5
5)(4
.95)
20.8
5**
*...
8.60
***
-7.4
6...
...-1
.68
149
0.22
13.5
5(6
.57)
...(1
.47)
(5.0
1)...
...(5
.55)
Rob
ust s
tand
ard
erro
rs10
.71
-0.6
48.
06**
-1.7
20.
040.
10-6
.68
113
0.26
4.75
(11.
30)
(1.8
7)(3
.11)
(6.3
1)(0
.31)
(0.4
2)(4
.43)
20.8
5**
*...
8.60
***
-7.4
6*
......
-1.6
814
90.
2223
.22
(6.9
2)...
(1.2
5)(4
.40)
......
(4.2
9)
Inve
stm
ent
(sha
re in
GD
P)G
over
nmen
t Ef
fect
iven
ess
Con
stan
t N
umbe
r of E
vent
s D
ivid
ed b
y Po
pula
tion
PPP-
Bas
ed
GD
P pe
r cap
ita
(in
logs
)
Agr
icul
ture
(sha
re in
GD
P)
Num
ber o
f Eve
nts
Div
ided
by
Land
A
rea
Sour
ces:
EM
-DA
T; IM
F, W
orld
Eco
nom
ic O
utlo
ok d
atab
ase;
and
Wor
ldw
ide
Gov
erna
nce
Res
earc
h In
dica
tors
Dat
aset
N
ote:
Fig
ures
in p
aren
thes
es a
re st
anda
rd d
evia
tions
, and
"*"
, "**
", a
nd "
***"
indi
cate
sign
ifica
nce
at, r
espe
ctiv
ely,
the
10,
5, a
nd 1
per
cent
leve
l. Th
e st
anda
rd O
LS e
stim
atio
ns su
ffer
from
het
ereo
sked
astic
ity a
nd a
re th
eref
ore
supp
lem
ente
d w
ith h
eter
eosk
edas
ticity
-con
sist
ent s
tand
ard
erro
r est
imat
es d
eriv
ed u
sing
the
Mac
Kin
non-
Whi
te H
C3
met
hod.
The
Wor
ldw
ide
Gov
erna
nce
Res
earc
h In
dica
tors
Dat
aset
cap
ture
s six
diff
eren
t dim
ensi
ons o
f gov
erna
nce
and
assi
gns s
core
s bet
wee
n -2
.5 (w
orst
) and
+2.
5 (b
est).
The
"go
vern
men
t effe
ctiv
enes
s"
varia
ble
mea
sure
s qua
lity
of p
ublic
serv
ice
prov
isio
n an
d bu
reau
crac
y, th
e co
mpe
tenc
e of
civ
il se
rvan
ts, t
he in
depe
nden
ce o
f the
civ
il se
rvic
e fr
om p
oliti
cal p
ress
ures
, and
the
cred
ibili
ty o
f the
gov
ernm
ent's
com
mitm
ent t
o po
licie
s--th
e nu
mbe
rs u
sed
here
are
the
aver
ages
of s
core
s for
199
6-20
02. T
he d
iffer
ent m
easu
res o
f gov
erna
nce
are
high
ly c
orre
late
d an
d be
have
sim
ilarly
in th
e ab
ove
regr
essi
ons.
- 19 -
Table 3. Natural Disasters in ECCU Countries, 1970–2002 Total persons Estimated
affected damage Percent of US$ Percent
Country Year Event Number population thousands of GDP
Antigua and Barbuda 1983 Drought 75,000 100.0 … …Antigua and Barbuda 1989 Hurricane Hugo 8,030 12.4 80,000 21.4Antigua and Barbuda 1990 Hurricane Gustav … … … …Antigua and Barbuda 1995 Hurricane Luis 68,702 100.0 500 0.1Antigua and Barbuda 1998 Hurricane Georges 2,025 3.0 … …Antigua and Barbuda 1999 Hurricane Jose 2,534 3.8 … …Antigua and Barbuda 1999 Hurricane Lenny 3,423 5.1 … …Dominica 1970 Hurricane … … … …Dominica 1979 Hurricanes David and Frederick 72,100 100.0 44,650 100.8Dominica 1980 Hurricane Allen … … … …Dominica 1984 Hurricane Klaus 10,000 14.2 2,000 2.2Dominica 1989 Hurricane Hugo 710 1.0 20,000 13.0Dominica 1995 Hurricane Luis 3,001 4.2 3,428 1.6Dominica 1999 Hurricane Lenny 715 1.0 … …Dominica 2001 Hurricane Iris 175 0.2 … …Grenada 1975 Flood … … 4,700 13.4Grenada 1980 Hurricane Allen … … 5,300 7.7Grenada 1990 Tropical storm Arthur 1,000 1.1 … …Grenada 1999 Hurricane Lenny 210 0.2 5,500 1.5St. Kitts and Nevis 1984 Hurricane Klaus … … … …St. Kitts and Nevis 1987 Flood … … 500 0.6St. Kitts and Nevis 1989 Hurricane Hugo 1,330 3.1 46,000 32.1St. Kitts and Nevis 1990 Hurricane Gustav … … … …St. Kitts and Nevis 1995 Hurricane Luis 1,800 4.2 197,000 85.4St. Kitts and Nevis 1998 Hurricane Georges 10,000 23.2 … 1/ … 1/St. Kitts and Nevis 1999 Hurricane Lenny 1,180 2.7 41,400 13.6St. Lucia 1980 Hurricane Allen 80,000 61.5 87,990 66.0St. Lucia 1983 Storm 3,000 2.2 1,290 0.8St. Lucia 1986 Tropical storm Danielle … … … …St. Lucia 1987 Hurricane Emily … … … …St. Lucia 1988 Hurricane Gilbert … … … 2/ … 2/St. Lucia 1994 Tropical storm Debby 750 0.5 … …St. Lucia 1996 Landslide 175 0.1 … …St. Lucia 1999 Hurricane Lenny 200 0.1 … …St. Vincent and the Grenadines 1971 Volcano 2,000 2.3 … …St. Vincent and the Grenadines 1977 Flood … … … …St. Vincent and the Grenadines 1979 Volcano 20,000 18.6 … …St. Vincent and the Grenadines 1980 Hurricane Allen 20,500 18.8 16,300 27.6St. Vincent and the Grenadines 1986 Flood 152 0.1 … …St. Vincent and the Grenadines 1987 Hurricane Emily 208 0.2 5,300 3.7St. Vincent and the Grenadines 1987 Flood 1,000 0.9 5,000 3.5St. Vincent and the Grenadines 1992 Flood 200 0.2 … …St. Vincent and the Grenadines 1999 Hurricane Lenny 100 0.1 … …St. Vincent and the Grenadines 2002 Hurricane Lili … … … …
Sources: EM-DAT; and IMF, World Economic Outlook database.
1/ St. Kitts National Emergency Management Agency estimated damage of US$402 million (140 percent of GDP).2/ EM-DAT's entry for damage (US$1 billion, or 305 percent of GDP) is omitted, as it was disputed by national authorities.
- 20 -
Tabl
e 4.
Wor
ldw
ide
Inci
denc
e of
Nat
ural
Dis
aste
rs, 1
970–
2002
With
Est
imat
es o
f A
ll R
ecor
ded
Dis
aste
rsPe
rson
s Aff
ecte
dW
ith E
stim
ates
of D
amag
eN
umbe
r of E
vent
sN
umbe
r of E
vent
sC
umul
ativ
e C
umul
ativ
e D
ivid
ed b
yD
ivid
ed b
yA
ffec
ted
in P
erce
ntD
amag
e in
Per
cent
N
umbe
rLa
nd A
rea
Popu
latio
nN
umbe
rof
Pop
ulat
ion
Num
ber
of A
nnua
l GD
Pof
Eve
nts
Inde
xR
ank
Inde
xR
ank
of E
vent
sTo
tal
Ran
kof
Eve
nts
Tota
lR
ank
All
coun
tries
6,48
010
076
100
764,
511
6276
2,03
621
76A
dvan
ced
econ
omie
s1,
511
2370
3991
742
711
974
23
104
Car
ibbe
an16
259
923
387
2311
465
6658
3746
ECC
U6
441,
212
577
06
3185
5818
6619
Ant
igua
and
Bar
buda
71,
198
388
34
624
87
222
34D
omin
ica
880
38
890
36
125
274
118
7G
rena
da4
886
734
812
21
127
323
32St
. Kitt
s and
Nev
is 1
/7
1,46
52
1,29
52
433
704
132
6St
. Luc
ia 2
/8
988
645
18
564
522
6713
St. V
ince
nt a
nd G
rena
dine
s10
1,93
11
755
68
4167
335
23O
ther
Car
ibbe
an11
819
036
131
3583
5271
4017
63B
aham
as5
3837
170
202
112
82
1349
Bar
bado
s6
1,05
14
193
195
311
73
767
Bel
ize
1033
4145
77
713
125
751
16D
omin
ican
Rep
ublic
2336
3929
6914
6253
417
40G
uyan
a6
212
867
393
8942
24
77H
aiti
3698
2347
5030
8346
49
62Ja
mai
ca23
160
1782
3315
7449
1350
17N
ethe
rland
s Ant
illes
218
814
9031
120
781
112
2Tr
inid
ad a
nd T
obag
o7
103
2148
476
510
44
111
9O
ther
4,80
749
8475
793,
655
7467
1,23
623
73G
DP
per c
apita
of t
op-2
0 3/
……
4.2
…5.
5…
…1.
4…
…1.
9
1/ U
sing
St.
Kitt
s Nat
iona
l Em
erge
ncy
Man
agem
ent A
genc
y's d
amag
e es
timat
e fo
r 199
8 H
urric
ane
Geo
rges
wou
ld h
ave
impl
ied
a ra
nkin
g of
"2"
in th
e la
st c
olum
n.2/
Exc
lude
s EM
-DA
Ts d
amag
e es
timat
e fo
r 198
8 H
urric
ane
Gilb
ert.
If in
clud
ed th
is w
ould
hav
e im
plie
d a
rank
ing
of "
1" in
the
last
colu
mn.
3/ In
thou
sand
s of U
S$ in
200
2.
Sour
ces:
EM
-DA
T fo
r dat
a on
nat
ural
dis
aste
rs, i
nclu
ding
est
imat
es o
f the
num
ber o
f peo
ple
affe
cted
and
the
valu
e of
dam
age;
Wor
ld B
ank,
Wor
ld D
evel
opm
ent I
ndic
ator
s for
data
on
land
are
a; IM
F, W
orld
Eco
nom
ic O
utlo
ok d
atab
ase
for d
ata
on G
DP
and
popu
latio
n.
Not
e: T
he sa
mpl
e co
ntai
ns 1
50 c
ount
ries a
fter o
mitt
ing
coun
tries
with
out a
t lea
st o
ne n
atur
al d
isas
ter a
ssoc
iate
d w
ith a
cos
t est
imat
e an
d/or
mis
sing
info
rmat
ion
on G
DP
(24
adva
nced
eco
nom
ies,
15 C
arib
bean
cou
ntrie
s, an
d 11
1 ot
her d
evel
opin
g co
untri
es).
Sim
ple
unw
eigh
ted
aver
ages
are
use
d fo
r cou
ntry
gro
upin
gs. R
anki
ngs a
re in
des
cend
ing
orde
r, w
ith "
1" in
dica
ting
the
mos
t exp
osed
to n
atur
al d
isas
ter.
- 21 -
Tabl
e 5.
Cor
rela
tions
Bet
wee
n M
easu
res o
f Pro
nene
ss to
Nat
ural
Dis
aste
rs a
nd S
elec
ted
Mac
roec
onom
ic V
aria
bles
, 197
0–20
02
freq
1fr
eq2
affe
ctda
mag
elp
ppc
lgdp
cgr
gdp
vrgd
pvc
ons
vgov
bpag
ritir
atio
Num
ber o
f eve
nts d
ivid
ed b
y co
untry
are
aN
umbe
r of o
bs15
015
015
015
015
014
914
914
912
014
013
711
7C
orre
latio
n…
0.67
0.08
0.23
-0.0
6-0
.07
0.20
-0.0
50.
190.
07-0
.10
-0.1
0Sp
earm
an's
rho
…0.
570.
200.
280.
050.
070.
16-0
.11
0.09
-0.0
50.
010.
01P-
valu
e…
0.00
0.01
0.00
0.55
0.40
0.05
0.17
0.35
0.58
0.91
0.93
Num
ber o
f eve
nts d
ivid
ed b
y co
untry
pop
ulat
ion
Num
ber o
f obs
150
150
150
150
150
149
149
149
120
140
137
117
Cor
rela
tion
0.67
…0.
220.
43-0
.09
-0.0
80.
12-0
.04
0.18
0.06
-0.0
6-0
.07
Spea
rman
's rh
o0.
57…
0.46
0.35
-0.1
5-0
.14
0.12
0.04
0.31
0.22
0.12
-0.2
2P-
valu
e0.
00…
0.00
0.00
0.07
0.09
0.15
0.60
0.00
0.01
0.16
0.02
Pers
ons a
ffect
ed (i
n pe
rcen
t of p
opul
atio
n)N
umbe
r of o
bs15
015
015
015
015
014
914
914
912
014
013
711
7C
orre
latio
n0.
080.
22…
0.26
-0.4
0-0
.35
0.20
0.04
0.29
0.15
0.36
-0.3
4Sp
earm
an's
rho
0.20
0.46
…0.
54-0
.61
-0.6
20.
190.
170.
430.
070.
53-0
.47
P-va
lue
0.01
0.00
…0.
000.
000.
000.
020.
030.
000.
430.
000.
00
Dam
age
(in p
erce
nt o
f GD
P)N
umbe
r of o
bs15
015
015
015
015
014
914
914
912
014
013
711
7C
orre
latio
n0.
230.
430.
26…
-0.2
3-0
.20
-0.0
40.
080.
110.
080.
13-0
.18
Spea
rman
's rh
o0.
280.
350.
54…
-0.2
8-0
.26
0.13
0.05
0.14
-0.0
20.
25-0
.15
P-va
lue
0.00
0.00
0.00
…0.
000.
000.
120.
520.
130.
850.
000.
10
Sour
ces:
IM
F, In
tern
atio
nal F
inan
cial
Sta
tistic
s, an
d W
orld
Eco
nom
ic O
utlo
ok d
atab
ase;
and
Wor
ld B
ank,
Wor
ld D
evel
opm
ent I
ndic
ator
s.N
ote:
Bol
ded
figur
es in
dica
te th
at th
e ra
nk c
orre
latio
ns a
re si
gnifi
cant
at t
he 5
per
cent
leve
l (on
e-si
ded
test
). A
pos
itive
cor
rela
tion
sugg
ests
that
hig
her
valu
es o
f the
var
iabl
e ar
e as
soci
ated
with
an
incr
ease
d pr
onen
ess t
o na
tura
l dis
aste
r, as
refle
cted
by
the
four
mea
sure
s in
the
first
col
umn.
Vari
able
s: fr
eq1,
num
ber o
f eve
nts d
ivid
ed b
y co
untry
land
are
a; fr
eq2,
num
ber o
f eve
nts d
ivid
ed b
y co
untry
pop
ulat
ion;
affe
ct,
perc
enta
ge o
f pop
ulat
ion
affe
cted
; dam
age,
dam
age
in p
erce
nt o
f ann
ual G
DP;
lppp
c, a
vera
ge le
vel o
f cur
rent
pric
e G
DP
per c
apita
at P
PP e
xcha
nge
rate
; lgd
pc,
aver
age
leve
l of
curr
ent p
rice
GD
P in
USD
per
cap
ita; g
rgdp
, av
erag
e gr
owth
rate
of c
onst
ant p
rice
GD
P; v
rgdp
, st
anda
rd d
evia
tion
of c
onst
ant p
rice
GD
P; v
cons
, st
anda
rd d
evia
tion
of to
tal c
onsu
mpt
ion
in U
S do
llars
; vgo
vbp,
stan
dard
dev
iatio
n of
cen
tral g
over
nmen
t bal
ance
in p
erce
nt o
f GD
P; a
gri,
shar
e of
agr
icul
ture
in G
DP;
tira
tio,
aver
age
ratio
of t
otal
inve
stm
ent t
o G
DP.
- 22 -
Table 6. Volatility of Income and Consumption, 1970–2002(Standard deviation of annual growth rates, in percent)
ConsumptionGDP Households Government
ECCU6 (average) 4.5 11.0 9.9Antigua and Barbuda 3.2 13.3 7.9Dominica 5.8 6.9 8.9Grenada 3.6 8.3 11.2St. Kitts and Nevis 3.2 11.1 8.8St. Lucia 7.6 13.4 10.0St. Vincent and the Grenadines 3.5 12.7 12.4
Low-income countries 6.1 10.7 16.2Middle-income countries 6.0 8.2 9.5High-income countries 3.3 2.9 2.4
Source: World Bank, World Development Indicators; ECCU Country Authorities; and IMF staff estimates.
Note: Underlying data in constant 1995 US dollars.
- 23 -
REFERENCES
Atkins, J.P., S. Mazzi, and C.D. Easter, 2000, “A Commonwealth Vulnerability Index for Developing Countries: The Position of Small States,” Economic Paper No. 40 (London: Commonwealth Secretariat).
Auffret, P., 2003a, “High Consumption Volatility: the Impact of Natural Disasters,” World Bank Working Paper No. 2962 (Washington: World Bank).
———, 2003b, “Catastrophe Insurance Market in the Caribbean Region: Market Failures and Recommendations for Public Sector Interventions,” Policy Research Working Paper No. 2963 (Washington: World Bank).
Benson, C. and E. Clay, 2003a, Economic and Financial Impacts of Natural Disasters: an Assessment of Their Effects and Options for Mitigation (London: Overseas Development Institute).
———, 2003b, “Disasters, Vulnerability and the Global Economy,” in A. Kreimer, M. Arnold, and A. Carlin (Eds.), Building Safer Cities: The Future of Disaster Risk (Washington: World Bank).
———, F.V. Michael, and A.W. Robertson, 2001, “Dominica: Natural Disasters and Economic Development in a Small Island State,” Disaster Risk Management Working Paper Series No. 2 (Washington: World Bank).
Caselli, F. and P. Malhotra, 2004, “Natural Disasters and Growth: from Thought Experiment to Natural Experiment,” Unpublished Draft, International Monetary Fund.
Cashin, P., 2004, “Key Features of Caribbean Business Cycles,” IMF Working Paper WP/04/136 (Washington: International Monetary Fund).
Charvériat, C., 2000, “Natural Disasters in Latin America and the Caribbean: An Overview of Risk,” Working Paper No. 434 (Washington: Inter-American Development Bank).
Collier, P., and J. Dehn, 2001, “Aid, Shocks, and Growth,” World Bank Working Paper No. 2688 (Washington: World Bank).
Crowards, T., 2000a, “An Index of Inherent Economic Vulnerability of Developing Countries,” Staff Working Paper No. 6/00 (St. Michael, Barbados: Caribbean Development Bank).
———, 2000b, “Comparative Vulnerability to Natural Disasters in the Caribbean,” Staff Working Paper No. 1/00 (St. Michael, Barbados: Caribbean Development Bank).
Crowards, T., and W. Coulter, 1998, “Measuring The Comparative Vulnerability of the Eastern Caribbean,” Working Paper (St. Michael, Barbados: Caribbean Development Bank).
Centre for Research on the Epidemiology of Disasters (CRED), 2004, “EM-DAT: The OFA/CRED International Disaster Database,” http://www.em-dat.net/.
Easterly, W., and A. Kraay, 2000, “Small States, Small Problems? Income, Growth, and Volatility in Small States,” World Development, Vol. 28, pp. 2013–2027.
- 24 -
Economic Commission for Latin America and the Inter-American Development Bank (ECLAC), 2000, “A Matter of Development: How to Reduce Vulnerability in the Face of Natural Disasters” (Port-of-Spain, Trinidad and Tobago).
Freeman, P.K., M. Keen, and M. Mani, 2003, “Dealing with Increased Risk of Natural Disasters: Challenges and Options,” IMF Working Paper WP/03/197 (Washington: International Monetary Fund).
Intergovernmental Panel on Climate Change, 2001, “Third Assessment Report - Climate Change 2001” (Geneva, Switzerland).
International Monetary Fund, 2003, “Fund Assistance for Countries Facing Exogenous Shocks,” http://www.imf.org/external/np/pdr/sustain/2003/080803.pdf.
Pollner, J., 2001, “Managing Catastrophic Disaster Risk Using Alternative Risk Financing and Pooled Insurance Systems,” World Bank Technical Paper No. 495 (Washington: World Bank).
United Nations, 2000, “Committee for Development Policy’s Economic Vulnerability Index: Explanatory Note,” http://www.un.org/esa/policy/devplan/cdp00p21.pdf
World Bank, 2003, “Caribbean Economic Overview 2002: Macroeconomic Volatility, Household Vulnerability, and Institutional and Policy Responses,” Report No. 24165-LAC (Washington: World Bank).