Embed Size (px)
Citation preview
Maine Geological Survey Maine’s History of Sea-Level Changes
Joseph T. Kelley Stephen M. Dickson
Maine Geological Survey Department of Conservation
Daniel Belknap
Department of Geological Sciences University of Maine
1996
Maine’s History of Sea-Level Changes
Maine Geological Survey, Department of Agriculture, Conservation & Forestry 1
Maine Geological Survey Maine’s History of Sea-Level Changes
Introduction
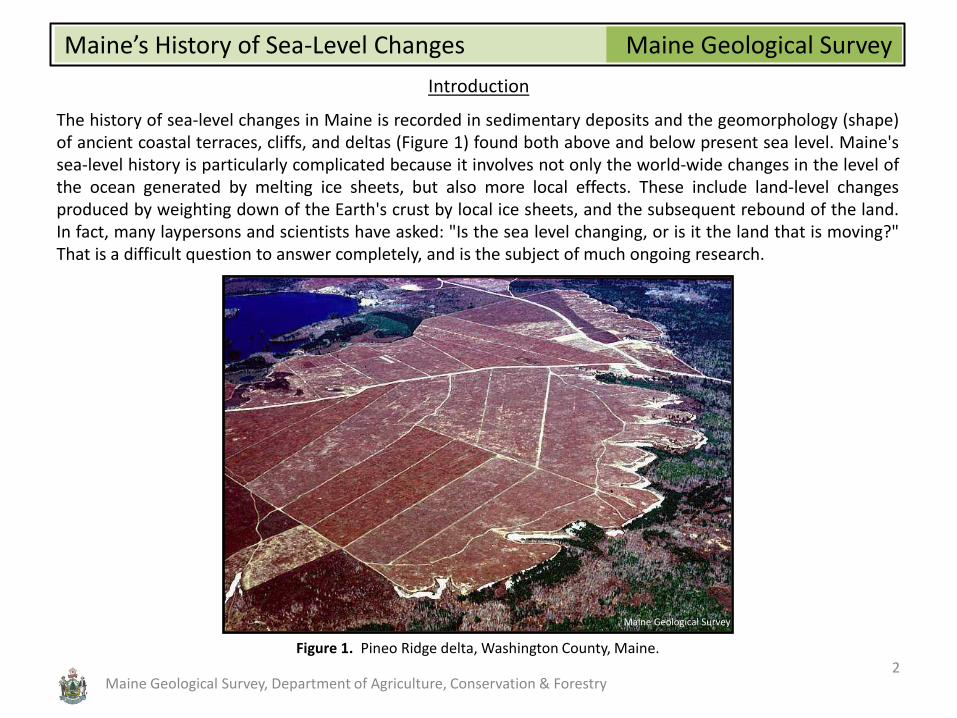
The history of sea-level changes in Maine is recorded in sedimentary deposits and the geomorphology (shape) of ancient coastal terraces, cliffs, and deltas (Figure 1) found both above and below present sea level. Maine's sea-level history is particularly complicated because it involves not only the world-wide changes in the level of the ocean generated by melting ice sheets, but also more local effects. These include land-level changes produced by weighting down of the Earth's crust by local ice sheets, and the subsequent rebound of the land. In fact, many laypersons and scientists have asked: "Is the sea level changing, or is it the land that is moving?" That is a difficult question to answer completely, and is the subject of much ongoing research.
Figure 1. Pineo Ridge delta, Washington County, Maine.
Maine Geological Survey
Maine Geological Survey, Department of Agriculture, Conservation & Forestry 2
Maine Geological Survey Maine’s History of Sea-Level Changes
Introduction (continued)
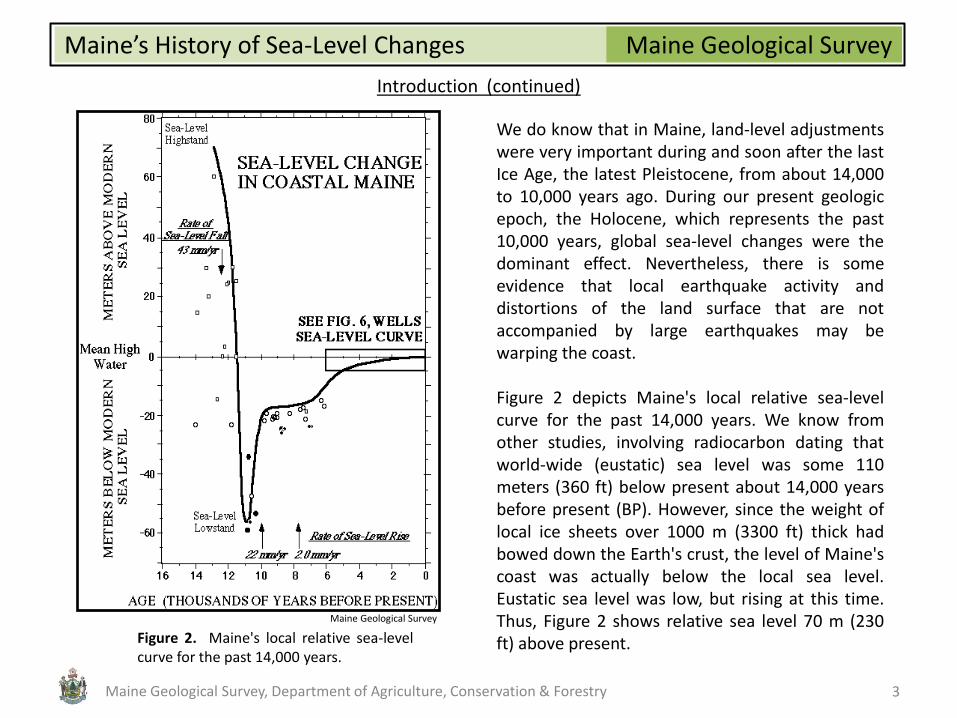
We do know that in Maine, land-level adjustments were very important during and soon after the last Ice Age, the latest Pleistocene, from about 14,000 to 10,000 years ago. During our present geologic epoch, the Holocene, which represents the past 10,000 years, global sea-level changes were the dominant effect. Nevertheless, there is some evidence that local earthquake activity and distortions of the land surface that are not accompanied by large earthquakes may be warping the coast. Figure 2 depicts Maine's local relative sea-level curve for the past 14,000 years. We know from other studies, involving radiocarbon dating that world-wide (eustatic) sea level was some 110 meters (360 ft) below present about 14,000 years before present (BP). However, since the weight of local ice sheets over 1000 m (3300 ft) thick had bowed down the Earth's crust, the level of Maine's coast was actually below the local sea level. Eustatic sea level was low, but rising at this time. Thus, Figure 2 shows relative sea level 70 m (230 ft) above present.
Maine Geological Survey
Figure 2. Maine's local relative sea-level curve for the past 14,000 years.
3 Maine Geological Survey, Department of Agriculture, Conservation & Forestry
Maine Geological Survey Maine’s History of Sea-Level Changes
Presumpscot Formation
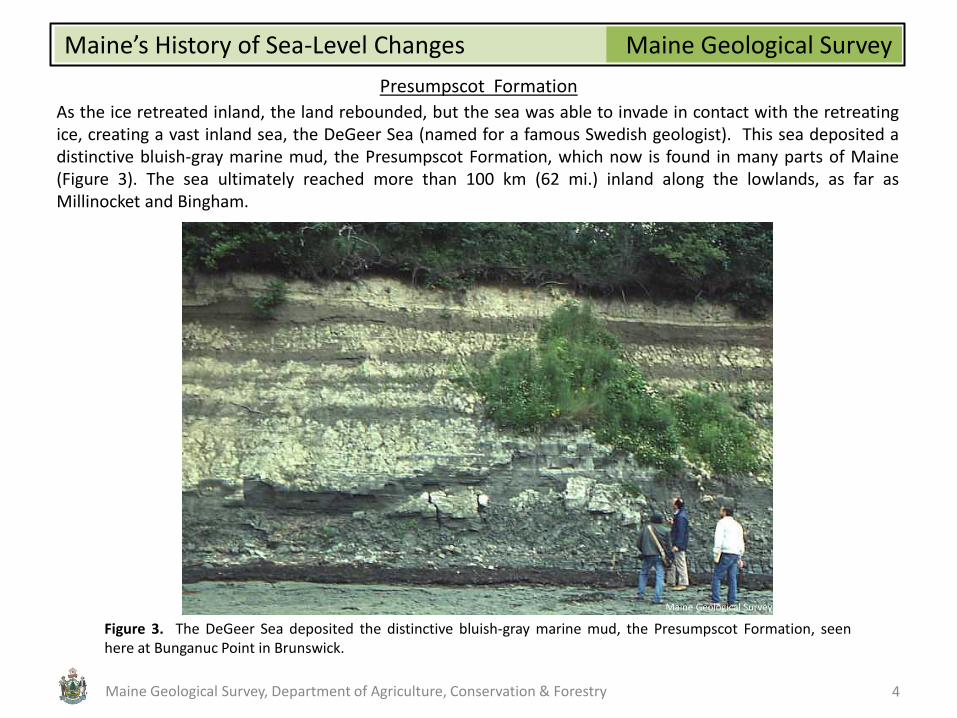
As the ice retreated inland, the land rebounded, but the sea was able to invade in contact with the retreating ice, creating a vast inland sea, the DeGeer Sea (named for a famous Swedish geologist). This sea deposited a distinctive bluish-gray marine mud, the Presumpscot Formation, which now is found in many parts of Maine (Figure 3). The sea ultimately reached more than 100 km (62 mi.) inland along the lowlands, as far as Millinocket and Bingham.
Figure 3. The DeGeer Sea deposited the distinctive bluish-gray marine mud, the Presumpscot Formation, seen here at Bunganuc Point in Brunswick.
Maine Geological Survey
Maine Geological Survey, Department of Agriculture, Conservation & Forestry 4
Maine Geological Survey Maine’s History of Sea-Level Changes
Isostatic Rebound
We know the elevations shown in Figure 2 from exposed deltas and shorelines of the DeGeer Sea preserved above present sea level in interior Maine (Figure 1). We know the timing from radiocarbon dates on fossil shells and wood preserved in Presumpscot Formation sediments deposited during that time (the individual symbols of Figure 2). Ultimately, the release of the weight of the ice allowed rebound of the land (isostatic rebound) to outpace the rate of global sea-level rise. Ultimately, the release of the weight of the ice allowed rebound of the land (isostatic rebound) to outpace the rate of global sea-level rise. Local relative sea level fell, at rates up to 43 mm/yr (1.7 in/yr), until it reached a local lowstand 55 m (180 ft) below present sea level. This caused the coastline to move well offshore of the present coast, as recorded by terraces, lowstand deltas, and patterns of erosion and deposition on the Maine inner continental shelf (Figure 4). After this lowstand, global sea-level rise rates again became dominant as the rate of isostatic rebound waned. Local relative sea-level rose at rates up to 22 mm/yr (0.9 in/yr), until the rate of rise slowed again, dramatically, about 9000 BP. We are still investigating this slower rate, but theorize that is relates to large-scale warping of the crust at a distance from the ice sheet. Finally, sea-level rise resumed, and approached its present level over the past 5000 years.
Maine Geological Survey, Department of Agriculture, Conservation & Forestry 5
Maine Geological Survey Maine’s History of Sea-Level Changes
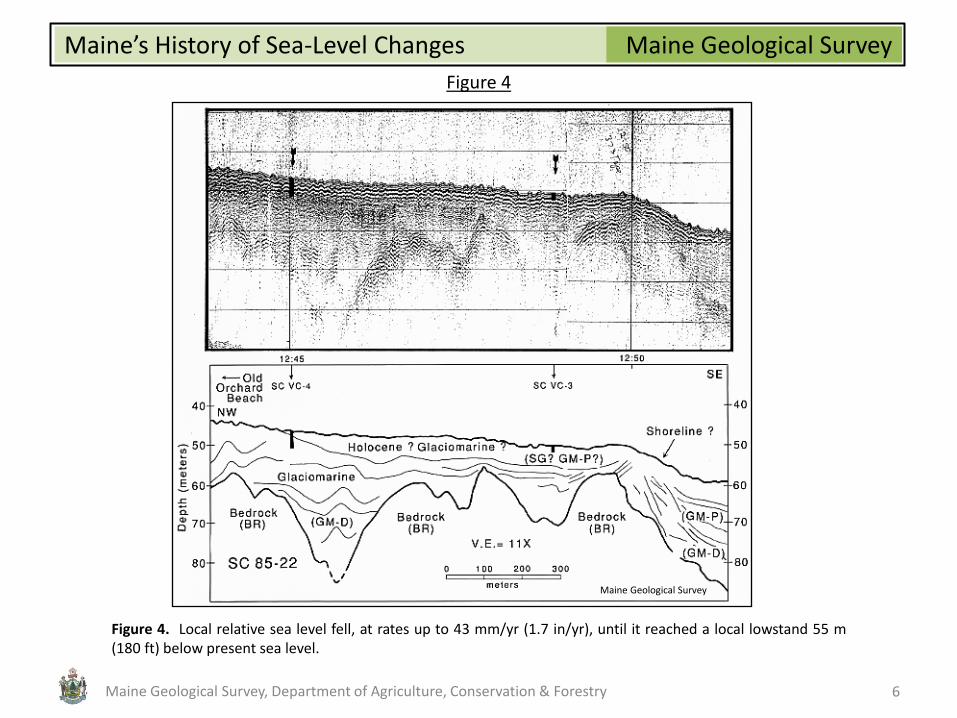
Figure 4
Figure 4. Local relative sea level fell, at rates up to 43 mm/yr (1.7 in/yr), until it reached a local lowstand 55 m (180 ft) below present sea level.
Maine Geological Survey
Maine Geological Survey, Department of Agriculture, Conservation & Forestry 6
Maine Geological Survey Maine’s History of Sea-Level Changes
Salt Marsh Peats
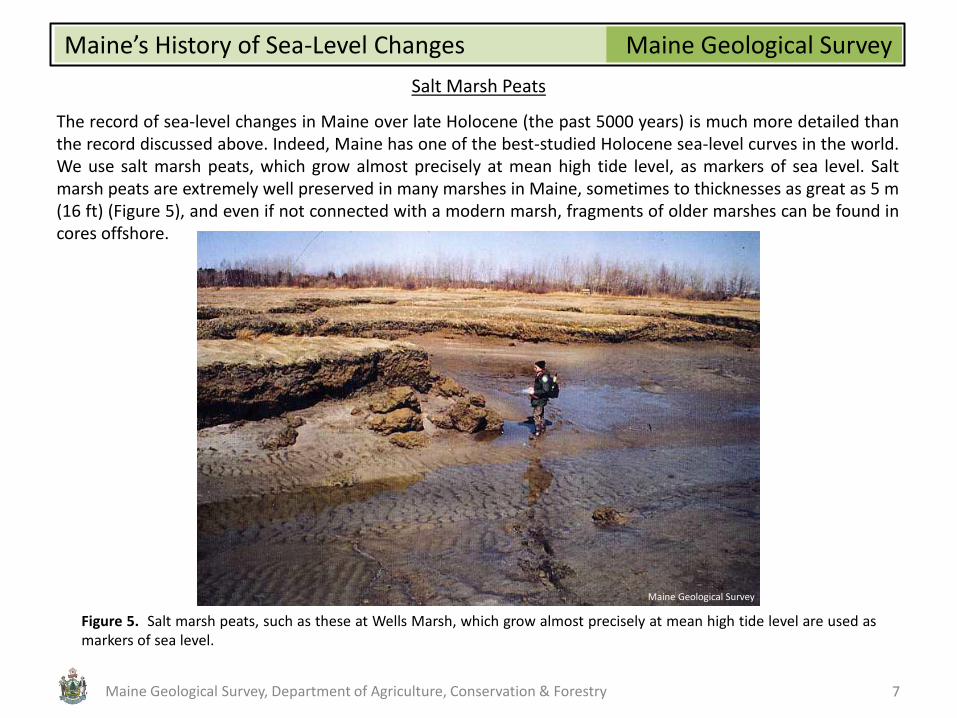
The record of sea-level changes in Maine over late Holocene (the past 5000 years) is much more detailed than the record discussed above. Indeed, Maine has one of the best-studied Holocene sea-level curves in the world. We use salt marsh peats, which grow almost precisely at mean high tide level, as markers of sea level. Salt marsh peats are extremely well preserved in many marshes in Maine, sometimes to thicknesses as great as 5 m (16 ft) (Figure 5), and even if not connected with a modern marsh, fragments of older marshes can be found in cores offshore.
Figure 5. Salt marsh peats, such as these at Wells Marsh, which grow almost precisely at mean high tide level are used as markers of sea level.
Maine Geological Survey
Maine Geological Survey, Department of Agriculture, Conservation & Forestry 7
Maine Geological Survey Maine’s History of Sea-Level Changes
Radiocarbon Dating
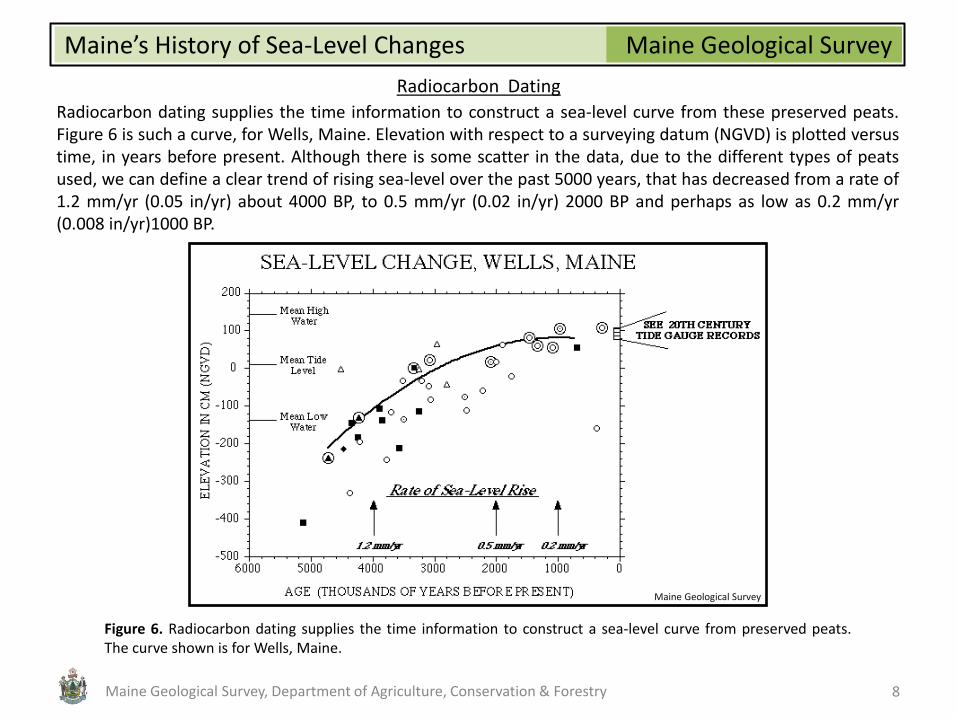
Radiocarbon dating supplies the time information to construct a sea-level curve from these preserved peats. Figure 6 is such a curve, for Wells, Maine. Elevation with respect to a surveying datum (NGVD) is plotted versus time, in years before present. Although there is some scatter in the data, due to the different types of peats used, we can define a clear trend of rising sea-level over the past 5000 years, that has decreased from a rate of 1.2 mm/yr (0.05 in/yr) about 4000 BP, to 0.5 mm/yr (0.02 in/yr) 2000 BP and perhaps as low as 0.2 mm/yr (0.008 in/yr)1000 BP.
Figure 6. Radiocarbon dating supplies the time information to construct a sea-level curve from preserved peats. The curve shown is for Wells, Maine.
Maine Geological Survey
Maine Geological Survey, Department of Agriculture, Conservation & Forestry 8
Maine Geological Survey Maine’s History of Sea-Level Changes
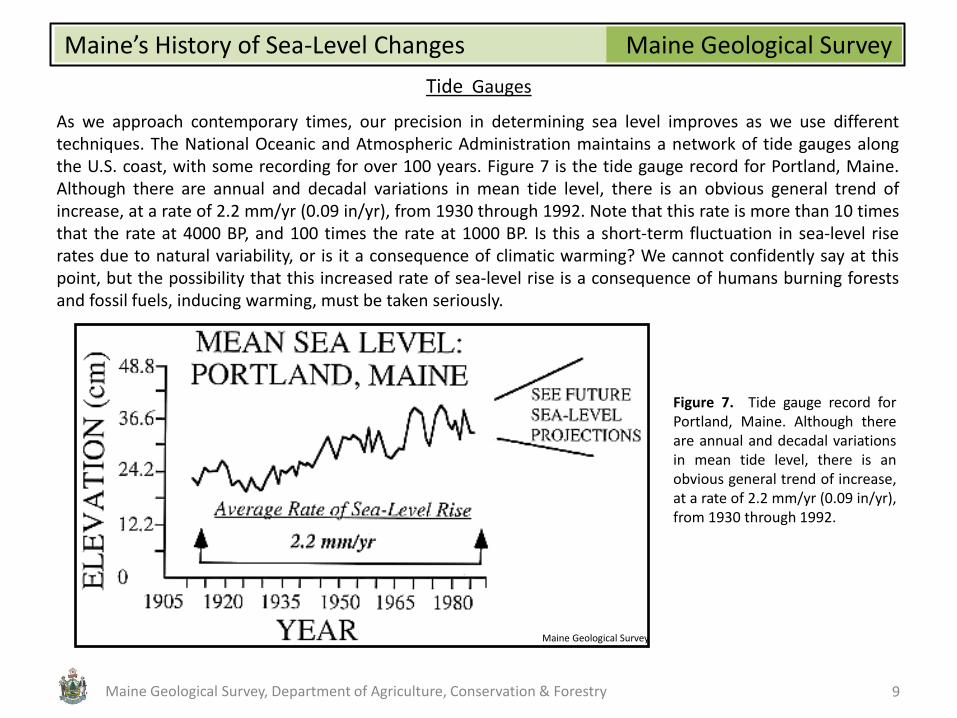
As we approach contemporary times, our precision in determining sea level improves as we use different techniques. The National Oceanic and Atmospheric Administration maintains a network of tide gauges along the U.S. coast, with some recording for over 100 years. Figure 7 is the tide gauge record for Portland, Maine. Although there are annual and decadal variations in mean tide level, there is an obvious general trend of increase, at a rate of 2.2 mm/yr (0.09 in/yr), from 1930 through 1992. Note that this rate is more than 10 times that the rate at 4000 BP, and 100 times the rate at 1000 BP. Is this a short-term fluctuation in sea-level rise rates due to natural variability, or is it a consequence of climatic warming? We cannot confidently say at this point, but the possibility that this increased rate of sea-level rise is a consequence of humans burning forests and fossil fuels, inducing warming, must be taken seriously.
Figure 7. Tide gauge record for Portland, Maine. Although there are annual and decadal variations in mean tide level, there is an obvious general trend of increase, at a rate of 2.2 mm/yr (0.09 in/yr), from 1930 through 1992.
Maine Geological Survey
Maine Geological Survey, Department of Agriculture, Conservation & Forestry 9
Tide Gauges
Maine Geological Survey Maine’s History of Sea-Level Changes
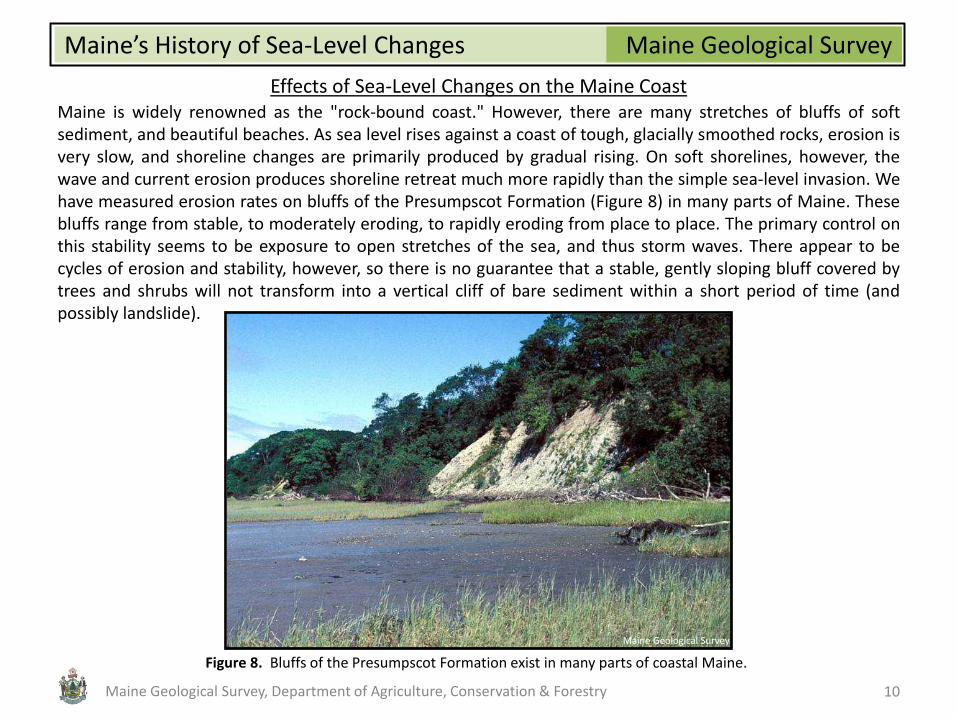
Effects of Sea-Level Changes on the Maine Coast Maine is widely renowned as the "rock-bound coast." However, there are many stretches of bluffs of soft sediment, and beautiful beaches. As sea level rises against a coast of tough, glacially smoothed rocks, erosion is very slow, and shoreline changes are primarily produced by gradual rising. On soft shorelines, however, the wave and current erosion produces shoreline retreat much more rapidly than the simple sea-level invasion. We have measured erosion rates on bluffs of the Presumpscot Formation (Figure 8) in many parts of Maine. These bluffs range from stable, to moderately eroding, to rapidly eroding from place to place. The primary control on this stability seems to be exposure to open stretches of the sea, and thus storm waves. There appear to be cycles of erosion and stability, however, so there is no guarantee that a stable, gently sloping bluff covered by trees and shrubs will not transform into a vertical cliff of bare sediment within a short period of time (and possibly landslide).
Figure 8. Bluffs of the Presumpscot Formation exist in many parts of coastal Maine.
Maine Geological Survey
Maine Geological Survey, Department of Agriculture, Conservation & Forestry 10
Maine Geological Survey Maine’s History of Sea-Level Changes
Erosion of Bluffs
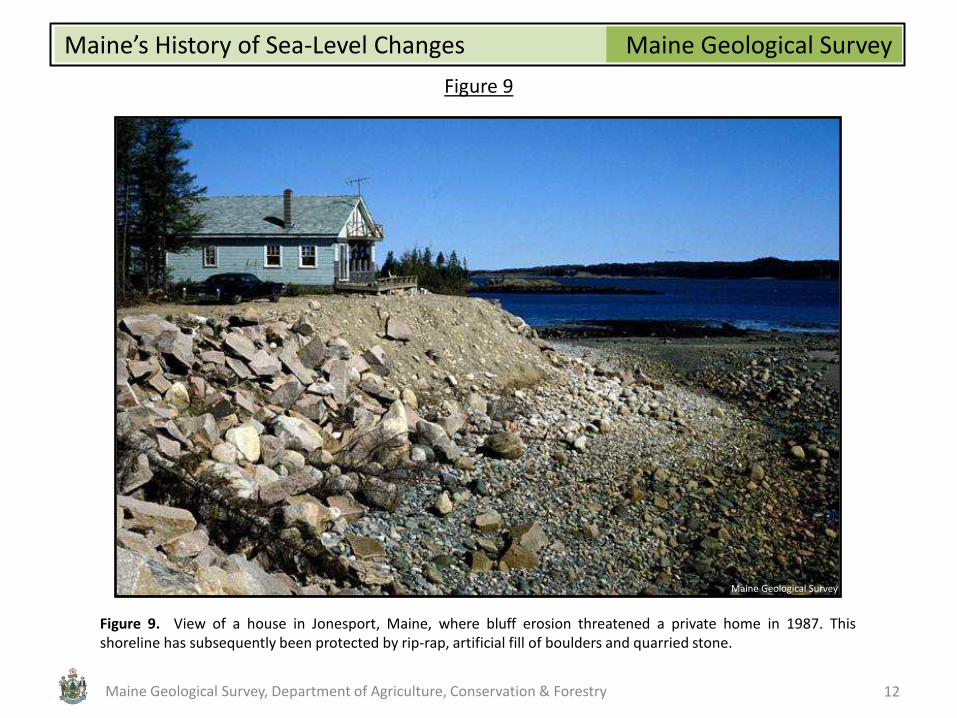
When homeowners, developers, or larger-scale engineering changes are introduced, vegetation is often stripped and the natural cycles are interrupted. Figure 9 shows a view of a house in Jonesport, Maine, where bluff erosion threatened a private home in 1987. This shoreline has subsequently been protected by rip-rap, artificial fill of boulders and quarried stone. This has slowed erosion rate at this site, but there are deleterious effects to the tidal flat fronting the site, and to neighboring stretches of shoreline. In our measurements of erosion rate we find that bluffs of the soft Presumpscot Formation mud erode at 0.5 to 1.0 m/yr (1.6 to 3.3 ft/yr). Bluffs of till, a stiff, stoney sediment, erode at about half that rate. Again, consider the geologically rapid rates here as relatively slow in terms of a summer vacation or even a generation, but consider the implications for a person's entire lifetime: up to an entire football field's length of bluff erosion. We have seen tragic cases of new development where homeowners have told us of their plans to leave the property to their grandchildren. In some places that will not be possible, as the houses will fall down the bluff in 10-30 years without massive, costly intervention.
Maine Geological Survey, Department of Agriculture, Conservation & Forestry 11
Maine Geological Survey Maine’s History of Sea-Level Changes
Figure 9
Figure 9. View of a house in Jonesport, Maine, where bluff erosion threatened a private home in 1987. This shoreline has subsequently been protected by rip-rap, artificial fill of boulders and quarried stone.
Maine Geological Survey
Maine Geological Survey, Department of Agriculture, Conservation & Forestry 12
Maine Geological Survey Maine’s History of Sea-Level Changes
Coastal Erosion
One of the most publicized landscapes for conflict between human development and natural processes is the sandy coast. Beaches and sand dunes are dynamic areas, constantly shifting in response to waves, winds, tides, and coastal currents. A more subtle, but immensely powerful influence is sea-level change. Again, as above, the change may be too slow to be obvious in the short term, but is relatively rapid in geologic terms. Maine's Sand Dune Regulations use current floodplain elevations and take future sea-level rise into account in regulating new construction and replacement of damaged structures in these coastal settings. This approach is valuable in the face of predicted rapid climate change and uncertainties about future shoreline change. Coastal erosion is often considered unpredictable, and an implacable foe of homeowners. Coastal erosion is in fact decidedly predictable, all we are lacking is information on precisely when the events will occur. Similarly, erosion is only a problem when we try to fix property lines or build structures in an inherently unstable environment, when the long-term change in many locations is dominated by landward movement of the shoreline.
Maine Geological Survey
Maine Geological Survey, Department of Agriculture, Conservation & Forestry 13
Maine Geological Survey Maine’s History of Sea-Level Changes
Drowned Forests
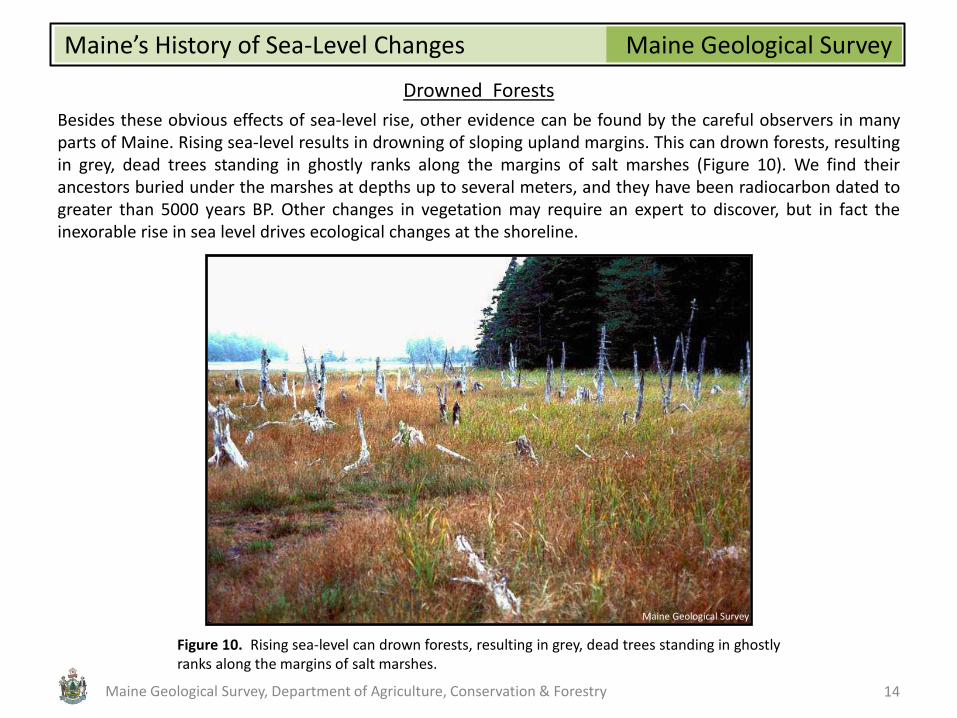
Besides these obvious effects of sea-level rise, other evidence can be found by the careful observers in many parts of Maine. Rising sea-level results in drowning of sloping upland margins. This can drown forests, resulting in grey, dead trees standing in ghostly ranks along the margins of salt marshes (Figure 10). We find their ancestors buried under the marshes at depths up to several meters, and they have been radiocarbon dated to greater than 5000 years BP. Other changes in vegetation may require an expert to discover, but in fact the inexorable rise in sea level drives ecological changes at the shoreline.
Figure 10. Rising sea-level can drown forests, resulting in grey, dead trees standing in ghostly ranks along the margins of salt marshes.
Maine Geological Survey
Maine Geological Survey, Department of Agriculture, Conservation & Forestry 14
Maine Geological Survey Maine’s History of Sea-Level Changes
Saltwater Intrusion
Below ground, rising sea level can also influence our environment. Saltwater intrusion can eventually ruin wells and affect soils and ground water. Saltwater intrusion occurs as sea-level rise and causes drowning, but in actuality, human development and use of water resources is a much more rapid cause of change. This is a serious problem in many parts of the United States, and likely will become more publicized in Maine as development pressures continue.
What is the Potential for Future Sea-Level Changes?
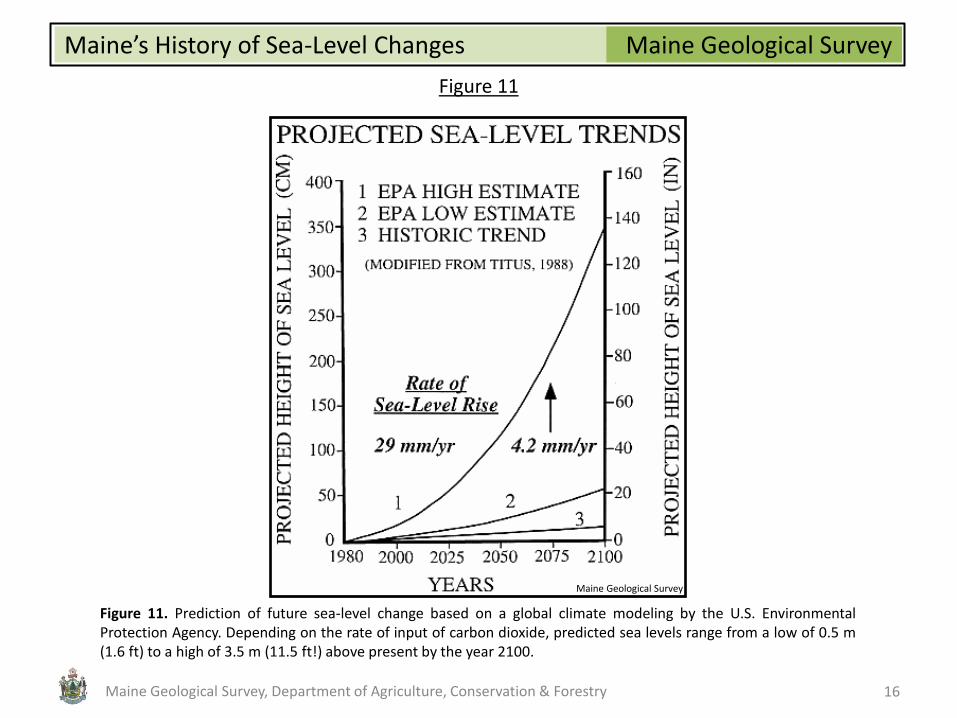
In any discussion of rapid changes of climate and sea-level, the ultimate question is: what can we predict for the future? Reliable predictions for future change must be built on a scientifically defendable basis. There are several approaches. One approach is to conduct computer model studies, based on the best available information on climate, glacial, and ocean processes. We discuss such a model above, for antarctic glaciers. Other models include global climate studies. These models use national supercomputer facilities and immense sets of data from around the world. Several of our colleagues at the University of Maine are involved in this modeling. Global climate models provide predictions of warming and precipitation changes under future scenarios of increased carbon dioxide in the atmosphere. Figure 11 depicts a prediction of future sea-level change based on a global climate modeling by the U.S. Environmental Protection Agency. Depending on the rate of input of carbon dioxide, predicted sea levels range from a low of 0.5 m (1.6 ft) to a high of 3.5 m (11.5 ft!) above present by the year 2100. Most scientists now accept the lower to middle-lower range predictions, but notice that this is still more than double the historic trend shown by tide gauges. Remember that the tide gauges, in turn, show far more rapid rates of rise than those of the past 1000-2000 years. How are we to evaluate such predictions? The only rational means is by comparing to past history and observable ongoing trends, as we have outlined above.
15 Maine Geological Survey, Department of Agriculture, Conservation & Forestry
Maine Geological Survey Maine’s History of Sea-Level Changes
Figure 11
Figure 11. Prediction of future sea-level change based on a global climate modeling by the U.S. Environmental Protection Agency. Depending on the rate of input of carbon dioxide, predicted sea levels range from a low of 0.5 m (1.6 ft) to a high of 3.5 m (11.5 ft!) above present by the year 2100.
Maine Geological Survey
Maine Geological Survey, Department of Agriculture, Conservation & Forestry 16