Embed Size (px)
Citation preview

Major Points
• An example• Sampling distribution• Hypothesis testing
The null hypothesis Test statistics and their distributions The normal distribution and testing
• Important concepts
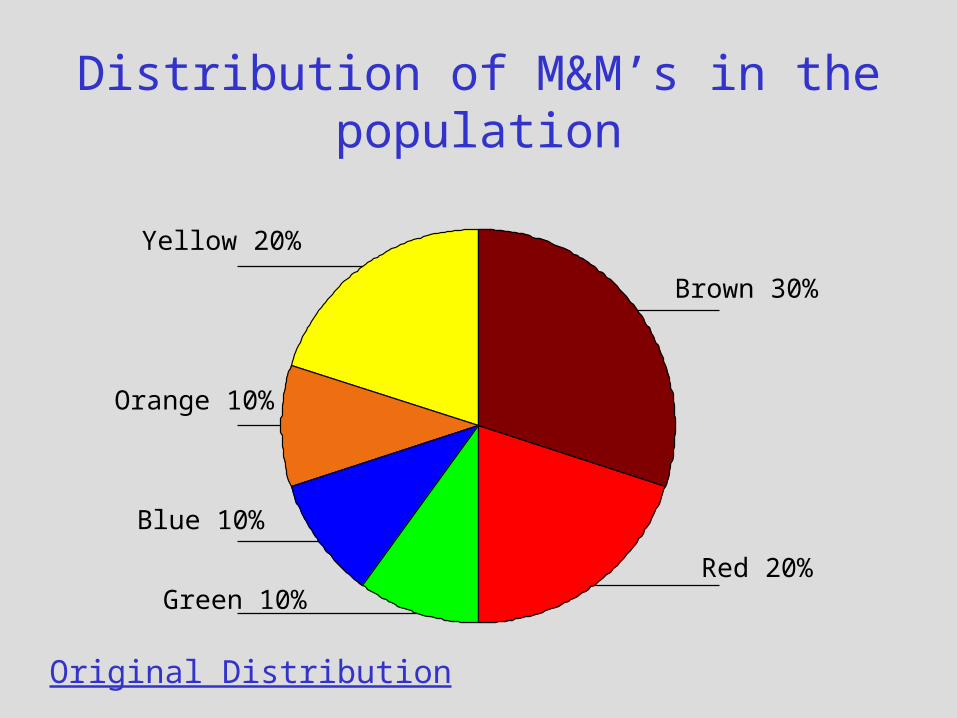
Distribution of M&M’s in the population
Yellow 20%
Orange 10%
Blue 10%
Green 10%Red 20%
Brown 30%
Original Distribution

Testing one sample against population
– There are normally 5.65 red M&M’s in bag (a population parameter)
– Mean number of red M&M’s in a halloween candy bag = 4.56 (a sample statistic)
– Are there sufficiently more red M&M’s to conclude significant differences / the two numbers come from different populations.
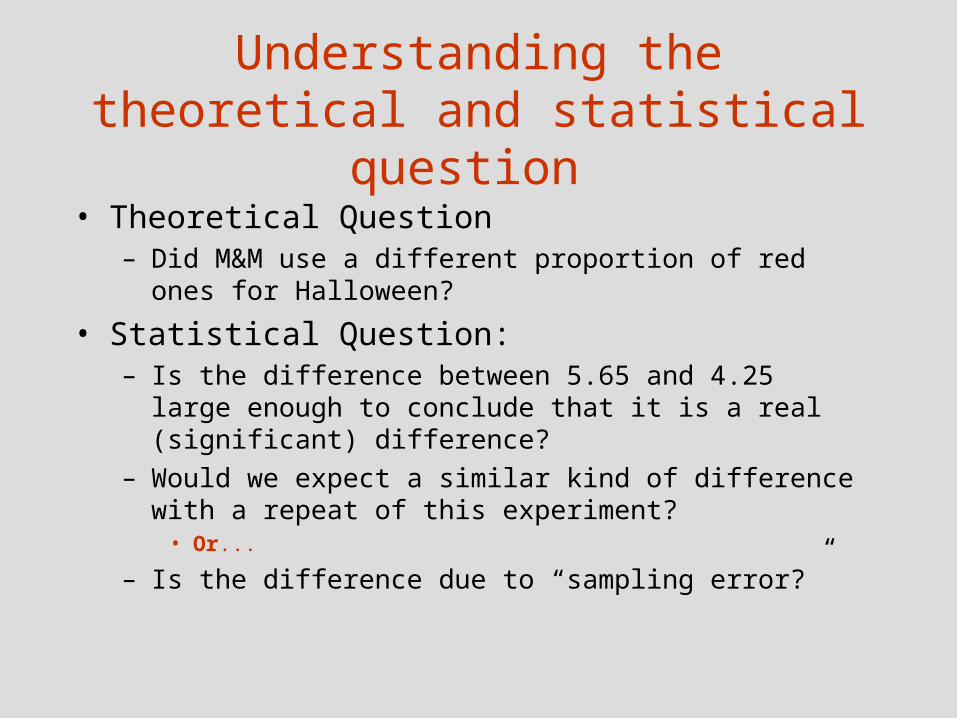
Understanding the theoretical and statistical question
• Theoretical Question– Did M&M use a different proportion of red ones for
Halloween?
• Statistical Question:– Is the difference between 5.65 and 4.25 large
enough to conclude that it is a real (significant) difference?
– Would we expect a similar kind of difference with a repeat of this experiment?
• Or...
– Is the difference due to “sampling error?”
Sampling Error
• Often differences are due to sampling error
• Sampling Error does not imply doing a mistake
• Sampling Error simply refers to the normal variability that we would expect to find from one sample to another, or one study to another
How could we assess Sampling Error?
• Take many bags of regular M&M candy.
• Record the number of red M&M’s.• Plot the distribution and record its
mean and standard deviation.• This distribution is a “Sampling
Distribution” of the Mean

Means of various samples of Brown M&M’s
7.257.00
6.756.50
6.256.00
5.755.50
5.255.00
4.754.50
4.254.00
3.75
Sampling Distribution
Number of Red M&M’s in the populationF
req
ue
ncy
1400
1200
1000
800
600
400
200
0
Std. Dev = .45 Mean = 5.65
What is Sampling Distribution
• The distribution of a statistic over repeated sampling from a specified population.
• Can be computed for many different statistics
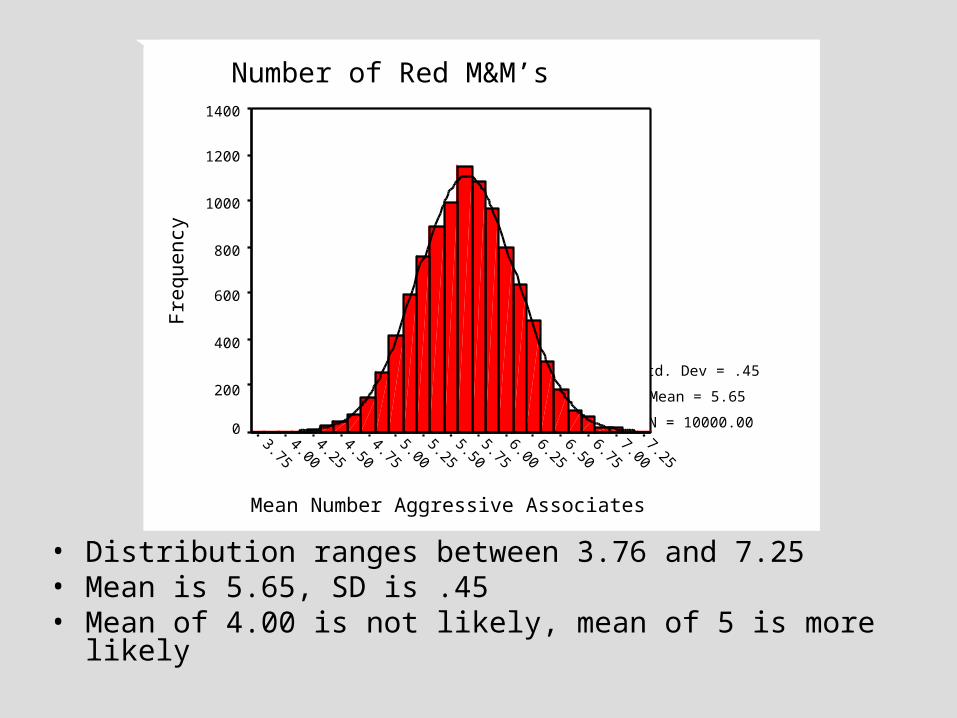
• Distribution ranges between 3.76 and 7.25• Mean is 5.65, SD is .45• Mean of 4.00 is not likely, mean of 5 is more likely
Mean Number Aggressive Associates
7.257.00
6.756.50
6.256.00
5.755.50
5.255.00
4.754.50
4.254.00
3.75
Number of Red M&M’s
Fre
qu
en
cy
1400
1200
1000
800
600
400
200
0
Std. Dev = .45
Mean = 5.65
N = 10000.00
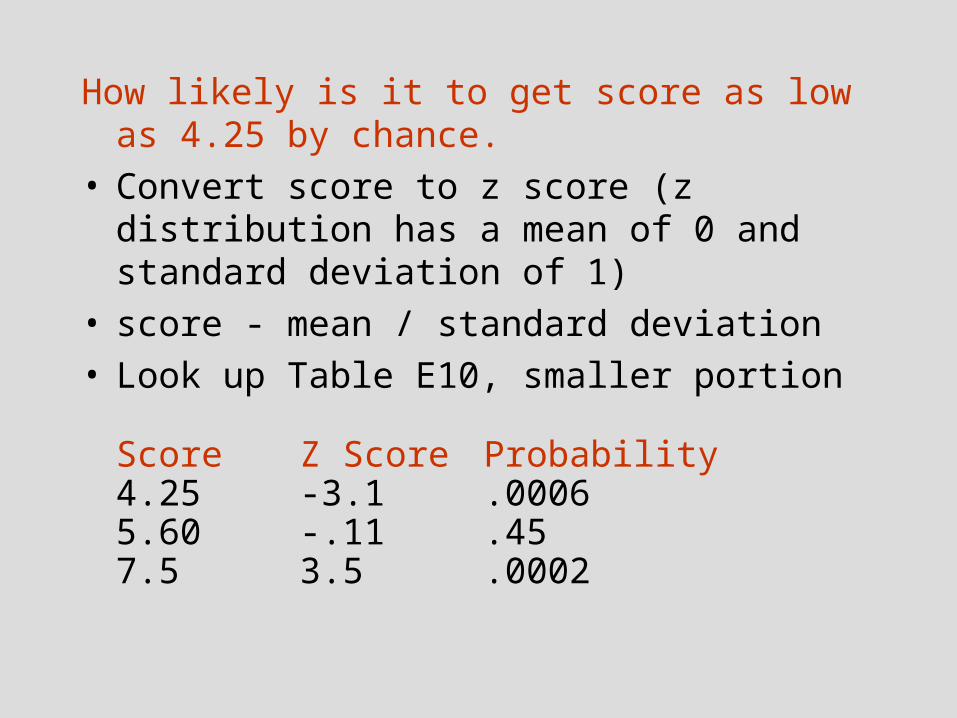
How likely is it to get score as low as 4.25 by chance.
• Convert score to z score (z distribution has a mean of 0 and standard deviation of 1)
• score - mean / standard deviation• Look up Table E10, smaller portion
Score Z Score Probability4.25 -3.1 .00065.60 -.11 .457.5 3.5 .0002

Hypothesis Testing• A formal way of testing if we should
accept results as being significantly different or not
• Start with hypothesis that halloween M&M’s are from normal distribution– The null hypothesis
• Find parameters of normal distribution• Compare halloween candy to normal
distribution
The Null Hypothesis (H0)• Is the hypothesis postulating that there is no
difference, that two things are from the same distribution.
• The hypothesis that Halloween candy came from a population of normal M&M’s
• The hypothesis we usually want to reject.• Alternative Hypothesis: Halloween and Regular
M&M’s are from different distributions

It is easier to prove Alternative Hypothesis than Null Hypothesis
• Hypothesis: All crows are black• Sample: 3000 crows• Results: all are black• Conclusion: Are all crows black?
• Observation: One white crow• Conclusion: Statement :Every crow is
black” is false• It is easier to prove alternative
hypothesis (all crows are not black) than null hypothesis (all crows are black)
• Hypothesis: Shopping on Amazon.com is different than on BN.com
• Study: 100 usability tests comparing the two shopping process on both
• Results: Both sites performed similarly• Conclusion: ?
Another example of Null & Alternative Hypothesis

• Observation: On Test No:101 Amazon did better
• Conclusion: Amazon.com and BN are different.

Steps in Hypothesis Testing
• Define the null hypothesis.• Decide what you would expect to
find if the null hypothesis were true.
• Look at what you actually found.• Reject the null if what you found is
not what you expected.
Important Concepts
• Concepts critical to hypothesis testing– Decision– Type I error– Type II error– Critical values– One- and two-tailed tests

Decisions• When we test a hypothesis we
draw a conclusion; either correct or incorrect.– Type I error
• Reject the null hypothesis when it is actually correct.
– Type II error• Retain the null hypothesis when it is
actually false.

Possible Scenarios
Null Hypothesis is actuallyResults show TRUE FALSE
TRUE Correct Acceptance Type IIFALSE TypeI Correct Rejection

M&M candy example
H0: Halloween & Regular M&M are actually the same
Results of study showTRUE (are same) FALSE (not same)
ACCEPT Correct Acceptance Type II
REJECT TypeI Correct Rejection

Type I Errors
• Assume Halloween and Regular candies are same (null hypothesis is true)
• Assume our results show that they are not same (we reject null hypothesis)
• This is a Type I error– Probability set at alpha ()
usually at .05
– Therefore, probability of Type I error = .05

Type II Errors
• Assume Halloween and Regular Candies are different (alternative hypothesis is true)
• Assume that we conclude they are the same (we accept null hypothesis)
• This is also an error– Probability denoted beta ()
• We can’t set beta easily.• We’ll talk about this issue later.
• Power = (1 - ) = probability of correctly rejecting false null hypothesis.
Critical Values
• These represent the point at which we decide to reject null hypothesis.
• e.g. We might decide to reject null when (p|null) < .05.– Our test statistic has some value with p
= .05– We reject when we exceed that value.– That value is the critical value.
One- and Two-Tailed Tests
• Two-tailed test rejects null when obtained value too extreme in either direction– Decide on this before collecting data.
• One-tailed test rejects null if obtained value is too low (or too high)– We only set aside one direction for
rejection.

One- & Two-Tailed Example
• One-tailed test– Reject null if number of red in Halloween
candies is higher
• Two-tailed test– Reject null if number of red in Halloween
candies is different (whether higher or lower)
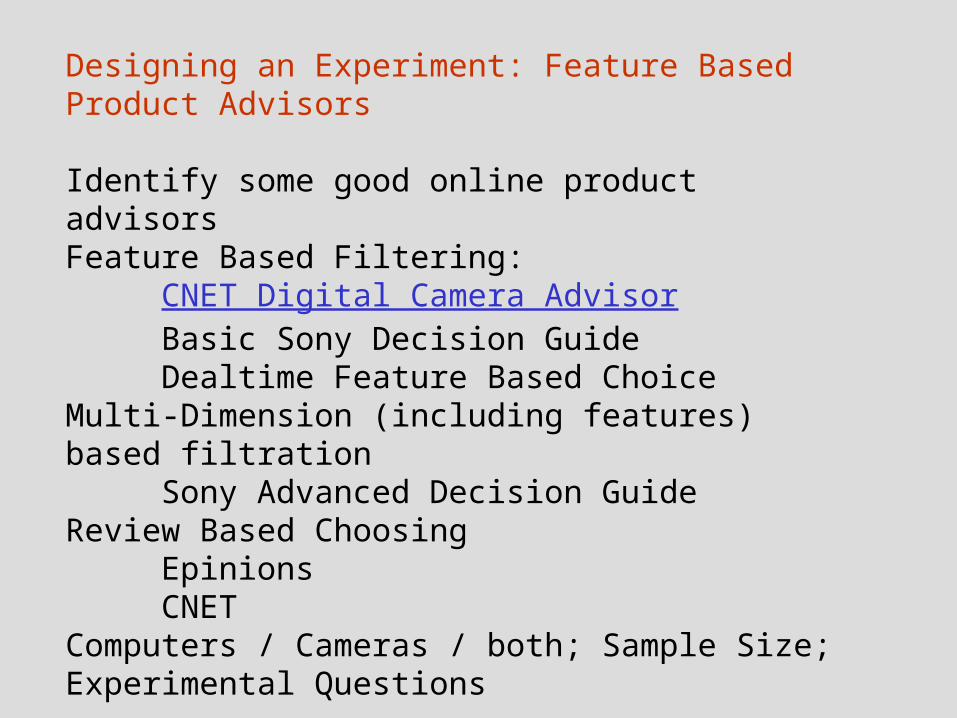
Designing an Experiment: Feature Based Product Advisors
Identify some good online product advisorsFeature Based Filtering:
CNET Digital Camera AdvisorBasic Sony Decision GuideDealtime Feature Based Choice
Multi-Dimension (including features) based filtration
Sony Advanced Decision GuideReview Based Choosing
EpinionsCNET
Computers / Cameras / both; Sample Size; Experimental Questions