Embed Size (px)
Citation preview
Int. J. Human—Computer Studies (1998) 49, 651—674Article No. hc980207
Making the most of ecological interface design:the role of self-explanation
DIANNE E. HOWIE
Centre for Applied Cognitive Science, Ontario Institute for Studies in Education of theUniversity of Toronto, 5 King+s College Road, Toronto, Ont., Canada M5S 3G8.email: [email protected]
KIM J. VICENTE*
Cognitive Engineering Laboratory, Department of Mechanical and Industrial Engineering,University of Toronto, 5 King+s College Road, Toronto, Ont., Canada M5S 3G8.email: [email protected]
(Received 12 June 1997 and accepted in revised form 22 June 1998)
Ecological interface design (EID) is a candidate framework for designing interfaces forcomplex sociotechnical systems. Interfaces based on EID have been shown to lead tobetter performance than traditional interfaces, but not all participants benefit equally.Thus, it is important to identify ways of raising the performance of all participants usingan EID interface. The purpose of this article is to determine whether encouragingparticipants to engage in self-explanations (i.e. reasoning aloud) can help them ‘‘make themost’’ of EID. An experiment was conducted using DURESS II, an interactive, thermal-hydraulic process control microworld with an interface designed according to theprinciples of EID. During this one-month study, participants controlled DURESS IIunder normal and fault conditions on a quasi-daily basis. Two experimental groupsoccasionally watched a replay of their own performance immediately after completinga trial, while the control group did not. In addition, the self-explanation (SE) group wasinstructed to explain aloud the reasons for their control actions while watching thereplay. The replay group simple watched their trials again with no verbal explanation.The SE participants were divided into ‘‘good’’ and ‘‘poor’’ groups according to severalperformance criteria. An analysis of the protocols produced during self-explanationrevealed that ‘‘good’’ SE participants showed more signs of self-explanation in theirprotocols than did the ‘‘poor’’ SE participants. There were no substantial differencesbetween the SE, replay and control groups for normal trials. However, the SE partici-pants did have the best overall performance on fault trials, suggesting that self-explana-tion can help operators make the most of EID.
( 1998 Academic Press
1. Introduction
Ecological interface design (EID) is a theoretical framework for designing interfaces forcomplex sociotechnical systems (Vicente & Rasmussen, 1990, 1992; Vicente, Christoffer-sen & Hunter, 1996). Previous empirical research has shown the benefits of an ecological
*Author to whom correspondence should be sent.
1071-5819/98/110651#24 $30.00/0 ( 1998 Academic Press
652 D. E. HOWIE AND K. J. VICENTE
interface (e.g. Hunter, Janzen & Vicente, 1995; Pawlak & Vicente, 1996; Christoffersen,Hunter & Vicente, 1996, 1997, 1998). Participants using an ecological interface per-form more consistently under normal conditions than participants using a traditionalinterface. In addition, participants using an ecological interface can detect faults morequickly, diagnose them more accurately and return the process to steady state morepromptly. Finally, participants using an ecological interface can also exhibit a deeperknowledge of the process than those using a traditional interface.
Despite these encouraging overall results, participants do not drive equal benefits froman ecological interface (Christoffersen et al., 1998). While some demonstrate an excep-tional level of performance of both normal and fault trails and a deep knowledge base,others demonstrate poor performance and a shallow knowledge base. In fact, theperformance of the latter participants is not substantially better than those usinga traditional interface. Are these individual differences inevitable, or is there some way toenable all participants to ‘‘make the most’’ of an ecological interface?
This issue is of considerable practical importance because it has clear implicationsfor selection or training. In the previously observed individual differences in perfor-mance and depth of knowledge are rooted in stable psychological traits (e.g. cognitivestyle), then operators would need to be selected according to some psychologicalcriterion to get the most out of an interface based on EID (Howie, 1996). This solutionis a last resort because, ideally, we would like to minimize selection criteria andinstead create the conditions so that all individuals could attain proficient performancewith an EID interface. One way to progress towards this goal is to investigate theimpact of different types of training on participants using an EID interface. Ifsuccessful, the results of such research would indicate the type of intervention that systemdesigners need to adopt to allow all individuals to make the most of an interface basedon EID.
Hunter et al. (1995) investigated the effect of one training approach on performance-model-based training. Participants used their a traditional interface or an interfacedesigned according to the principles of EID. The training groups were taughtto think about a thermal-hydraulic process control microworld using an abstrac-tion hierarchy representation (Rasmussen, 1985; Vicente & Rasmussen, 1990;Bisantz & Vicente, 1994). Hunter et al. (1995) found a clear interface effect infavour of the ecological interface group. Also, the training groups demonstratedgreater improvement on normal and fault trials than the no-training groups, althoughthis effect was not as pronounced as the interface effect. Nevertheless, there werestill substantial individual differences across participants. Therefore, model-basedtraining based on the abstraction hierarchy can improve performance but, alone, it doesnot provide a satisfactory solution to the practical problem of how to make the mostof EID.
The findings of another study suggest an alternative solution. Christoffersen et al.(1998) found that the best participants tended to reflect to the feedback provided by anecological interface, whereas the worst participant observed only the surface features ofthe interface. Will instructing all participants to reflect improve their performance withan ecological interface? This study attempted to answer this question by makingparticipants explain their control actions aloud (self-explanation) to induce a reflectiveorientation.
MAKING THE MOST OF EID 653
1.1. SELF-EXPLANATION
Chi, Bassok, Lewis, Reimann and Glaser (1989) studied the self-generated explanations,or self-explanations, given by students in think-aloud protocols while studying examplephysics problems. Chi et al. (1989) found that they were able to differentiate good andpoor students on the basis of the amounts and types of these explanations. Goodstudents spontaneously elaborated on reasons when and why a particular strategyshould be used. This type of self-explanation can help students to integrate new informa-tion with existing knowledge. Further, the good students monitored the limits to theirunderstanding. In contrast, poor students did not generate effective self-explanations,and they were not aware of gaps in their understanding.
The findings of Chi et al. (1989) have been replicated in several different domains:physics (Ferguson-Hessler & de Jong, 1990), mathematics (Lawson & Chinnappan,1994), and computer programming (Pirolli & Recker, 1994). Using verbal reportdata, Ferguson-Hessler and de Jong (1990) found that both good and poor students usedan equal number of study processes when examining physics texts. However, goodstudents were distinguished by their deeper study processes, including integrating,making relationships explicit and imposing structure. Lawson and Chinnappan (1994)also observed that high achieving students generated more content-related explanationswhen solving geometry problems. Statements classified as generative included categor-izing a problem, organizing information, identifying strategies and decomposing a prob-lem. Similarly, the most successful participants in Pirolli and Recker’s (1994) studyproduced the largest number of relevant elaborations while learning to program in Lisp.Pirolli and Recker also discovered that self-explanation had a diminishing rate of return;more explanation helped to improve performance, but each additional explanation hada smaller marginal value. In summary, good students seem to be naturally inclined toself-explain academic material across a variety of domains, and improve their perfor-mance by doing so.
Significantly, for the present study, Chi, De Leeuw, Chiu and LaVancher (1994)demonstrated that self-explanation could also aid students even when their explanationswere prompted rather than spontaneously generated. Chi et al. (1994) required students toexplain the meaning of each line of expository text about the human circulatory system.On a post-test, students in the self-explanation group achieved greater gains thanstudents in the control group, particularly on the most difficult questions. Furthermore,both good and poor students improved equally when asked to self-explain.
Nathan, Mertz and Ryan (1994) also found that students were able to achieve highertest scores when they were taught to self-explain algebra problems. These gains weresubstantial in tasks involving conceptual learning (story-problem translations), but onlymarginal in more procedural tasks (equation manipulation).
Research on cooperative, small group problem solving also provides some indirectsupport for the role of self-explanation in learning (see Webb, 1989 for a review). A rangeof studies of learning mathematics and computer science reveal that giving elaborateexplanations to other group members benefits students. In contrast, receiving elaborateexplanation has mixed, or even determental, results. Giving an explanation to anotherstudent has similar advantages to self-explanation. In both cases, the student must clarifyand organize their knowledge in order to express it. Through this process, the student
654 D. E. HOWIE AND K. J. VICENTE
may resolve any gaps in their knowledge, reaching a better understanding of thematerial.
This study attempted to determine whether self-explanation could lead to improve-ments in performance with an ecological interface in the domain of process control.-Accordingly, two hypotheses were evaluated. First, if the research based on academicdomains applies to participants using an ecological interface, then the content ofself-explanation protocols for good participants should differ from those of poor partici-pants. Second, participants who are asked to self-explain should outperform those whoare not. Previous research suggests that this self-explanation effect should be the mostpronounced on more difficult trials such as fault trials.
One methodological problem raised by conducting this study in the real-time domainof process control is how to implement the self-explanation manipulation. Unfortunate-ly, most existing measures of control performance are time-dependent so that askingparticipants to self-explain while operating the process may interface with their perfor-mance. Consequently, the participants in the self-explanation group (SE) explained theircontrol actions while watching a recording of their trial immediately after completion. Inorder to compensate for any advantages purely from watching a replay of the trial, thereplay group reviewed a recording of their trial without self-explanation. The controlgroup did not watch any trial replays.
The following sections introduce the basics of EID, as well as the microworld and theinterface that were used in this study.
1.2. ECOLOGICAL INTERFACE DESIGN
Rasmussen’s (1983, 1985) skills-rules-knowledge (SRK) taxonomy and abstraction hier-archy provide the conceptual foundations of EID (Vicente & Rasmussen, 1990, 1992;Vicente et al., 1996). EID should be considered as a complement to, rather thana replacement of, other approaches such as user-centred design.
1.2.1. SRK taxonomyAccording to the SRK taxonomy, their are three levels of cognitive control: skill-based behaviour, rule-based behaviour and knowledge-based behaviour (Rasmussen,1983). Skill- and rule-based behaviour are predominantly perceptual-motor, whileknowledge-based behaviour is analytical. Ecological interfaces should support allthree levels of processing. Perceptual-motor processing is faster and less resourcedemanding, but analytical processing allows users to cope with novelty. To promoteautomated behaviour (skill-based behaviour), the user should act directly on the inter-face. To active goal-directed mental sub-routines (rule-based behaviour), there should bea consistent one-to-one mapping between cues on the interface and constraints in thework environment. To support conscious reasoning and testing of plans (knowledge-based behaviour), the work domain should be represented as an abstraction hierarchy(Rasmussen, 1985).
-Note that the results obtained in this study may or may not generalize to other interface types. Because thepractical motivation for this research is how to make the most of EID in particular, the issue of generalizabilityto other interface types, while certainly interesting, was not addressed. Accordingly, no other types of interfaceswere included in the experimental design.
MAKING THE MOST OF EID 655
1.2.2. Abstraction hierarchyInterfaces designed according to an abstraction hierarchy representation provide modelsof the work domain at different levels of detail and abstraction [see Bisantz & Vicente(1994) for a detailed example]. The abstraction hierarchy supports problem solving byexplicitly representing the goal-relevant constraints that describe the structure of thework domain. Any abnormalities appear as broken constraints, providing useful in-formation for coping with unfamiliar, unanticipated situations. Operators can movebetween higher, abstract (functional) representations and lower, concrete (physical)representations of the system while monitoring the work domain state or diagnosingproblems. Moving upwards through the abstraction hierarchy will provide the reasonsfor a situation—the ‘‘why’’—and moving downwards will provide the physicalcauses—the ‘‘how’’ (Rasmussen, 1985). Traditional interfaces do not provide this type ofunderlying cognitive support because they focus on presenting physical information, andpay little attention to displaying functional information.
1.3. DURESS II MICROWORLD
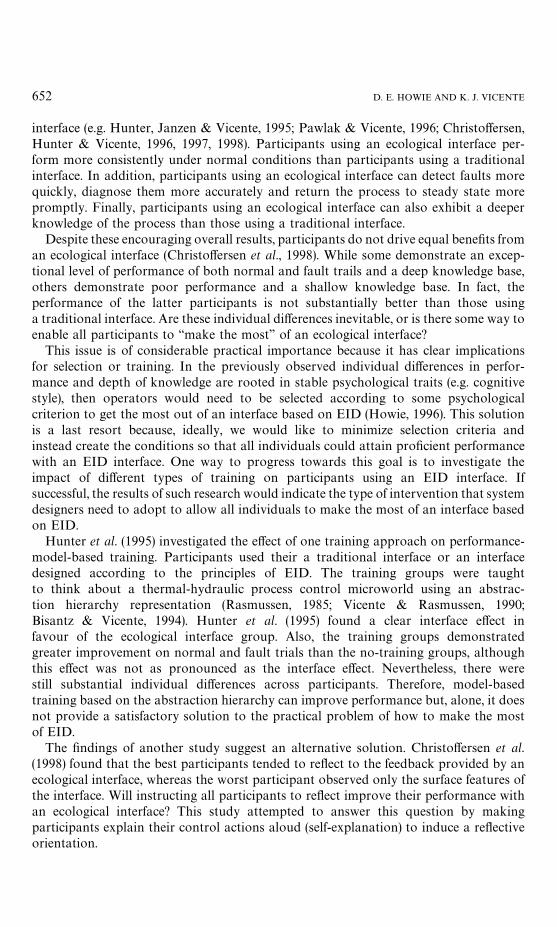
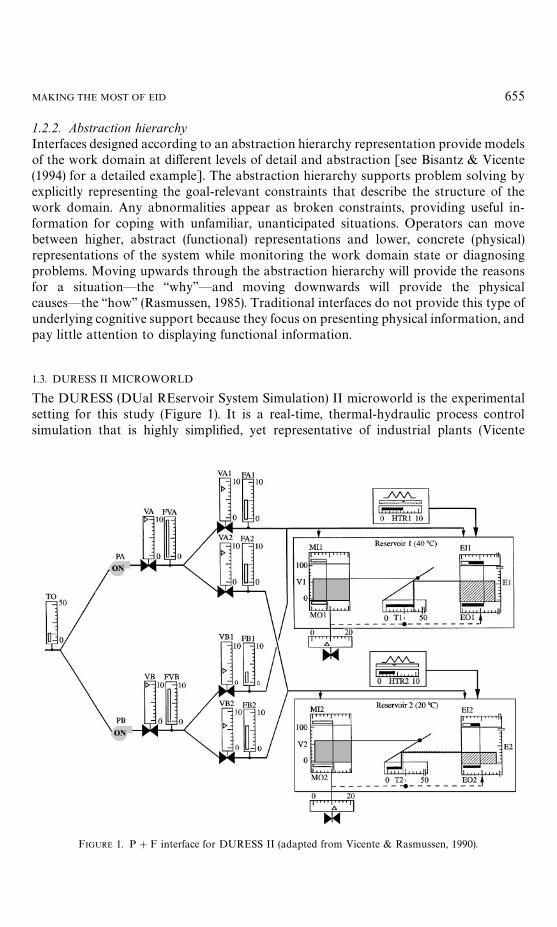
The DURESS (DUal REservoir System Simulation) II microworld is the experimentalsetting for this study (Figure 1). It is a real-time, thermal-hydraulic process controlsimulation that is highly simplified, yet representative of industrial plants (Vicente
FIGURE 1. P#F interface for DURESS II (adapted from Vicente & Rasmussen, 1990).
656 D. E. HOWIE AND K. J. VICENTE
& Rasmussen, 1990). For example, some purposes and sub-systems are coupled. Thecomponents have time lags so that the consequences of manipulating a control are notimmediately obvious to the novice. There are also interacting, or non-independent, goals.In addition, there is some degree of risk involved since ineffective control may cause theprocess to fail (or ‘‘blow-up’’), thereby stopping the simulation.
In DURESS II, participants may control the work domain by adjusting the settings ofthe heaters (HTR1, HTR2), pumps (PA, PB) and values (VA, VA1, VA2, VO1, VB, VB1,VB2, VO2). The purpose is to satisfy the required output demand water-flow rates (MO1,MO2) and temperature set points (T1, T2) for each reservoir, and to keep the processwithin tolerance of these values for five consecutive minutes, a period called steady state.The temperature goals for each reservoir remain the same for each trial, while thedemand pairs vary between trials.
The only interface used in this experiment, shown in Figure 1, was developed accord-ing to the principles of EID [see Vicente & Rasmussen (1990) for a detailed description ofthe design basis]. Because it is based on an abstraction hierarchy representation ofDURESS II, this interface provides both physical and functional (P#F) information.Physically, it indicates the positions and settings of each component, and the outputgoals. Functionally, the P#F interface also indicates higher-order relationships withinthe work domain. This information includes the flow rates (e.g. FA, FA1 and FA2), themass balance (e.g. MI1, V1, MO1), and the energy balance (e.g. EI1, E1 and EO1), whichare intended to provide cognitive support for problem solving (or knowledge-basedbehaviour). For a very detailed, graphical description of the P#F interface, see Pawlakand Vicente (1996).
Based on the rationale provided earlier, we predicted that (1) the content of theself-explanation protocols for good participants using the P#F interface should differfrom those of poor participants, and (2) participants using the P#F interface who areasked to self-explain should demonstrate superior performance.
2. Method
2.1. EXPERIMENTAL DESIGN
This study used a represented measures, between-subjects design with replay and self-explanation as the primary manipulations. Participants were assigned to one of threegroups: control, replay and self-explanation (SE), and participated for a period of onemonth.
2.2. PARTICIPANTS
The participants were 18 university students in science or engineering. Participants withrelated technical backgrounds, mainly science and engineering, were chosen since theycan often learn more quickly how to operate DURESS II. This allowed the experiment tobe potentially shorter in duration than if participants with non-technical backgroundswere selected.
The participants were matched as closely as possible in triples according to theireducational background, individual differences test results and gender, since there is
MAKING THE MOST OF EID 657
a possible relationship between these factors and performance. (For a discussion aboutthe implications of individual differences on performance, see Howie, 1996.) One memberof each triple was assigned to each of the control, replay and SE groups. Note that whenthe members of a triple were not equivalent on all measures, an effort was made to assignparticipants to groups in order to balance the overall composition of the groups.
2.3. PROCEDURE
The experiment was approximately one month in duration. All participants devoted onehour per weekday to the experiment during this period. The procedure was mostlyidentical for the three groups, as described below. Before being assigned to groups, theparticipants read a description of the experimental procedure, completed a consent form,a demographic questionnaire and individual differences tests. The questionnaire deter-mined the participants’ age, the number of courses they had taken in physics andthermodynamics and their overall level of education. There were two individualdifferences tests: the Spy Ring History Test (Pask & Scott, 1972) that measured theparticipants’ cognitive styles on the holist-serialist dimension and the Study ProcessesQuestionnaire (SPQ; Biggs, 1987) that measured their approaches to learning on thedeep-achieving-surface dimension.
On the first day of the experiment, the participants read a technical description ofDURESS II, and answered questions about what they had learned. On the second day,the participants were introduced to the P#F interface, and answered related questionsto test their comprehension. All participants had to correctly answer each comprehen-sion question before advancing to the next part of the experiment.
During the remainder of the study, all participants completed 67 trials in which theirtask was to start-up the process from a shut-down state to steady state. All participantsgave verbal protocols from roughly half of the trials. The verbal protocols were collectedfor both normal trials and fault trials so that participants would not link the collection ofverbal protocol data with the occurrence of a fault.
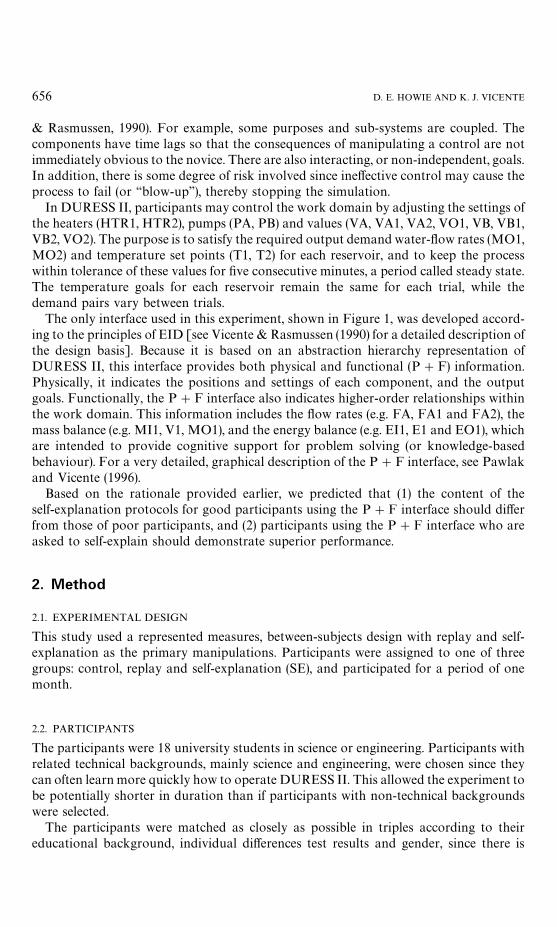
Faults were distributed randomly and infrequently throughout the trials. This proced-ure simulated the unanticipated nature of faults in a natural setting. There were sevenroutine faults and three non-routine faults. The routine faults were designed to berepresentative of the recurring failures that occur in process control plants. Theseconsisted of valve blockages, heater failures and reservoir leaks. The non-routine faultswere unfamiliar, unanticipated events that process control operators would rarelyencounter. These consisted of a reservoir leak coupled with an extra heat source, onereservoir leaking into the other and a heater failure coupled with an increased inputwater temperature. The non-routine faults were generally more difficult than andqualitatively different from normal faults. The participants were not told when, which orhow often faults would occur, so as to create conditions that are representative of thosefound in industry. The distribution of the fault trials over the experiment is shown inFigure 2.
Each trial had different steady-state demand pairs to prevent the participants fromadopting excessively simplified control methods. The participants were not informed ofthe results of their trials, although they could refer to the elapsed time indicated on theinterface to gain feedback on how long it was taking them to achieve steady state.
FIGURE 2. Distribution of fault trials. The numbers indicate the trial number (out of a total of 67) on whichfaults occurred.
658 D. E. HOWIE AND K. J. VICENTE
A second source of feedback was the failure message displayed on the screen at the end ofaborted trials. Such messages simply stated which component had failed (for example,‘‘Reservoir 1 heated empty’’). After an equipment failure message appeared, the trial wasterminated.
The only procedural difference between the groups occurred on one trial each day,referred to as the ‘‘Dplayer trial’’. Dplayer is a computer program that allowed theparticipants to play back their trials, showing the state of the work domain on the P#Finterface, accompanied by a salient arrow indicating what control actions had beentaken during the trial being reviewed. The participants could control the pace of replay.The Dplayer trial was chosen to be the same for each participant. Immediately after eachof these designated trials, the replay and SE groups reviewed the trial using the Dplayertrial replay module.
The participants sequentially operated Dplayer in two modes. In the discrete mode, theparticipants could step through the log file in a discrete manner to view static ‘‘snap-shot’’ states of the process at the times when they had made a control action. Thedynamic state of the work domain between actions could not be viewed. In thecontinuous mode, participants could step through the log file in a continuous manner toview the dynamic state of the process throughout the entire trial. In this case, bothcontrol actions and the process’ dynamic response between action could be observed. Ineither mode, Dplayer allowed participants to reverse the direction of the replay so thatthey could review an earlier portion of the trial again. Thus, the pace of the replay wasself-controlled. The participants were able to operate Dplayer as long as they wanted ineach mode, up to a total of 30 min.
In the replay group, the participants simply watched the replay using Dplayer. In theSE group, the participants were instructed to explain aloud to the experimenter thereasons for their control actions as they reviewed the trial. The experimenter promptedthese participants to verbalize their thoughts at the beginning of each Dplayer trial andreminded them if they fell silent for several successive control actions. Both the trial itselfand the Dplayer replay of the trial were videotaped for each of the groups so that theverbal protocols could be analysed. The experimenter also recorded the amount of timespent in each mode of Dplayer.
3. Results
This section describes analyses of the experimental data. First, the verbal protocols fromthe Dplayer trials for the best and worst participants in the SE group will be contrastedto test for differences in spontaneous self-explanation. Second, the performance of the
MAKING THE MOST OF EID 659
three groups will be contrasted to examine the role of induced self-explanation acrossboth normal and fault trials, using a variety of measures.
The method of data analysis adopted in this experiment is similar to the examples setby Pawlak & Vicente (1996) and Christoffersen et al. (1997, 1998). The emphasis in thedesign of the experiment was on representativeness (Brunswik, 1956) to improve thegeneralizability of the results to operational settings. This choice greatly increasedthe complexity and duration of the study. Furthermore, many of the analyses werenecessarily based on verbal protocol data (on the order of 50 h in total) which arenotoriously time consuming to analyse. For both of these reasons, only a relatively smallnumber of participants could be included in each group. Chi (1997) has recommendedthat, under these conditions, validity should be demonstrated using means other thaninferential statistics, preferably through multiple, coverging measures. We followed thisadvice by analysing each individual participant’s data in detail using various measures,and by explicitly summarizing at the end of each section the cumulative findings bearingon the experimental hypotheses.
3.1. SPONTANEOUS SELF-EXPLANATION
In this section, the amount of time that the participants spent examining their trials inDplayer will be compared. The length and content of the protocols from the SE groupwill also be examined in the context of the participants’ overall performance operatingthe DURESS II simulation. Each of these measures can indicate how deeply theparticipants reflected on their control actions, and whether this reflection is related totheir performance. The Dplayer protocols from six fault trials, out of a total of 10, wereanalysed. Three early and three late fault trials were chosen to illustrate the changes inthe participants’ self-explanations over time.
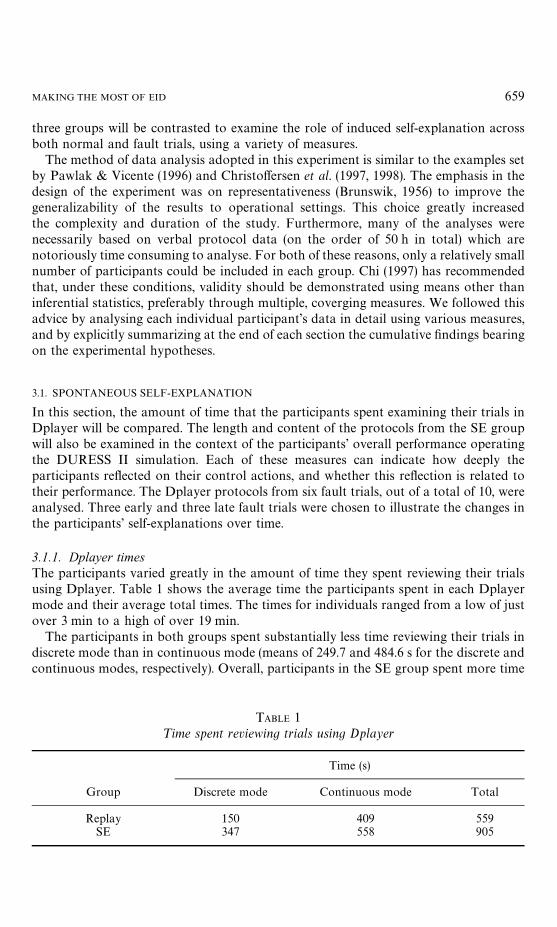
3.1.1. Dplayer timesThe participants varied greatly in the amount of time they spent reviewing their trialsusing Dplayer. Table 1 shows the average time the participants spent in each Dplayermode and their average total times. The times for individuals ranged from a low of justover 3 min to a high of over 19 min.
The participants in both groups spent substantially less time reviewing their trials indiscrete mode than in continuous mode (means of 249.7 and 484.6 s for the discrete andcontinuous modes, respectively). Overall, participants in the SE group spent more time
TABLE 1¹ime spent reviewing trials using Dplayer
Time (s)
Group Discrete mode Continuous mode Total
Replay 150 409 559SE 347 558 905
660 D. E. HOWIE AND K. J. VICENTE
reviewing their trials than participants in the replay group (means of 905 and 559 s forthe SE and replay groups, respectively), as one would expect given the instruction toverbalize.
3.1.2. RankingPrevious studies have divided self-explanation groups into ‘‘good’’ and ‘‘poor’’ partici-pants, based on a post hoc median split (Chi et al., 1994; Pirolli & Recker, 1994).Performance with DURESS II is a function of multiple criteria on normal and faulttrials, so the rankings of participants in the SE group were determined by combining thefollowing measures; number of incomplete normal trials, steady-state times for the firstand last block of normal trials, number of incomplete fault trials, number of faultsdetected, detection times, diagnosis scores and compensation times for the first and lastblock of fault trials. These measures are discussed in more detail later. The ranks fora participant on each measure were summed to obtain an overall ranking.
Overall, the participants, ordered from best to worst according to these criteria, wereDQ, VG, DL, NC, GS and AR. Thus, the ‘‘good’’ participants group contained DQ, VGand DL, while the ‘‘poor’’ participants group contained NC, GS and AR. Thesegroupings were used in all of the self-explanation measures described below. Tables 2—5list the participants in order of their rank.
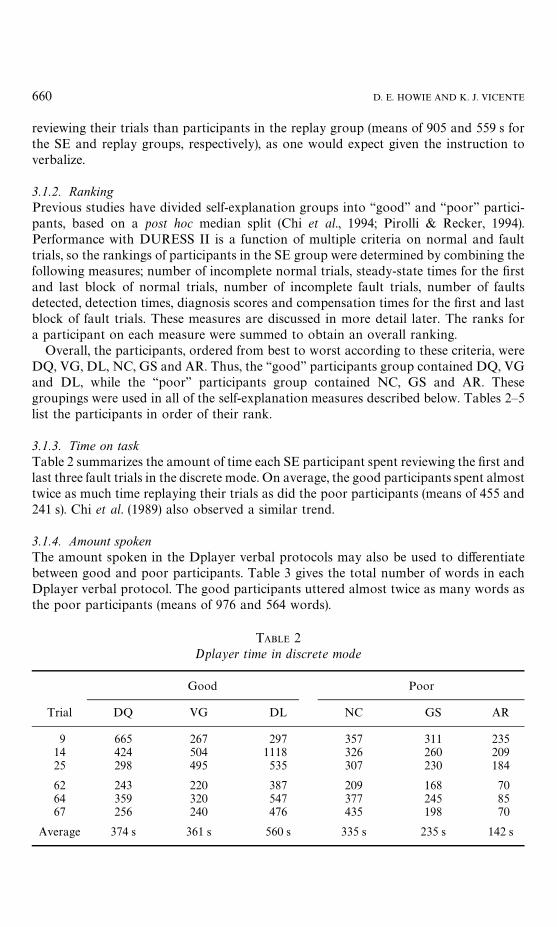
3.1.3. Time on taskTable 2 summarizes the amount of time each SE participant spent reviewing the first andlast three fault trials in the discrete mode. On average, the good participants spent almosttwice as much time replaying their trials as did the poor participants (means of 455 and241 s). Chi et al. (1989) also observed a similar trend.
3.1.4. Amount spokenThe amount spoken in the Dplayer verbal protocols may also be used to differentiatebetween good and poor participants. Table 3 gives the total number of words in eachDplayer verbal protocol. The good participants uttered almost twice as many words asthe poor participants (means of 976 and 564 words).
TABLE 2Dplayer time in discrete mode
Good Poor
Trial DQ VG DL NC GS AR
9 665 267 297 357 311 23514 424 504 1118 326 260 20925 298 495 535 307 230 184
62 243 220 387 209 168 7064 359 320 547 377 245 8567 256 240 476 435 198 70
Average 374 s 361 s 560 s 335 s 235 s 142 s

TABLE 3Number of words in Dplayer verbal protocol
Good Poor
Trial DQ VG DL NC GS AR
9 1421 519 672 593 443 31314 — 1036 2145 664 377 36425 637 915 959 561 414 322
62 549 521 878 414 261 8964 771 721 1248 801 413 13067 581 831 1153 913 337 132
Average 792 757 1176 658 374 225
MAKING THE MOST OF EID 661
3.1.5. ExplanationsPrevious studies of self-explanation have found that the verbal protocols of the goodstudents differed from those of the poor students both quantitatively, as discussed above,and qualitatively. Specifically, the verbal protocols of the best students contained more‘‘elaborations’’ or ‘‘explanations’’. Nathan et al. (1994) defined a self-explanation as ‘‘anyutterance that adds some new information, regardless of its truth value’’ (p. 3). Similarly,Pirolli and Recker (1994) defined an elaboration as ‘‘a pause bounded-utterance that wasnot a first reading of the text’’ (p. 256), in the case where the protocols consisted ofstudents’ comments while studying a text book.
A definition of an explanation for DURESS II must differ slightly from those in theliterature since there is no text with which to compare the protocols. Broadly, a self-explanation in the context of DURESS II could be considered as an utterance that goesbeyond a direct statement of a control action to explain the reason for that action (e.g. ‘‘Iincreased the heat for heater 1 because I realized that I hadn’t met the objective and thatit was climbing at such a slow rate’’ [emphasis added]). To provide an objective count ofself-explanations, a list of key words indicating an explanation were compiled andcounted for each Dplayer verbal protocol. The self-explanation key words were: becauseor cause (slang version of because), so, since and reason.
Table 4 summarizes the frequency of these self-explanation key words in the protocolsof participants in the SE group. The good participants included over twice as manyself-explanation key words as the poor participants.
3.1.6. MonitoringAnother characteristic of good students is that they tend to monitor their understandingof a topic as they study (Pirolli & Recker, 1994). Poor students detect gaps in theirunderstanding less frequently than good students (Chi et al., 1994). This should bereflected in the Dplayer verbal protocols for DURESS II. Three kinds of monitoringstatements were considered.
1. Participants notice a mistake that they had made during the trial (for example,‘‘I made a mistake as well in VO2 and I readjusted it smaller’’).
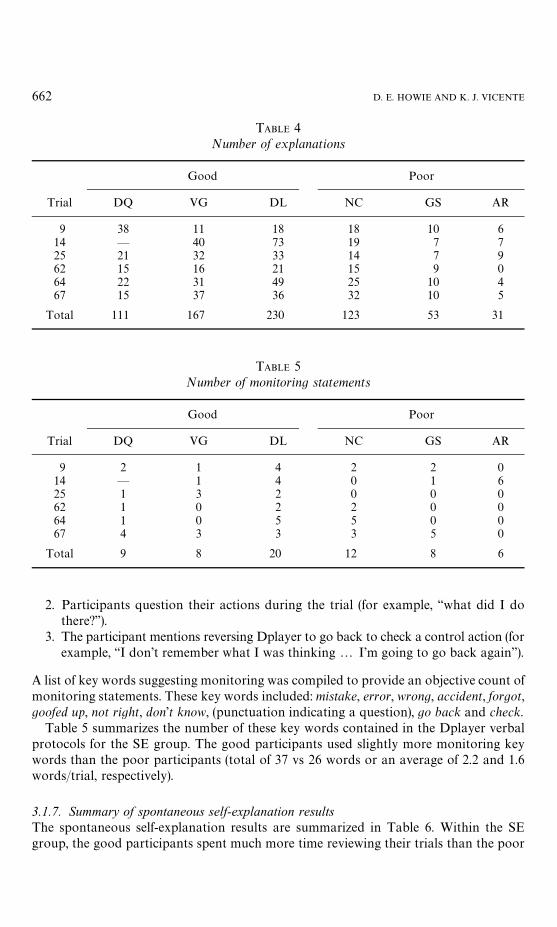
TABLE 4Number of explanations
Good Poor
Trial DQ VG DL NC GS AR
9 38 11 18 18 10 614 — 40 73 19 7 725 21 32 33 14 7 962 15 16 21 15 9 064 22 31 49 25 10 467 15 37 36 32 10 5
Total 111 167 230 123 53 31
TABLE 5Number of monitoring statements
Good Poor
Trial DQ VG DL NC GS AR
9 2 1 4 2 2 014 — 1 4 0 1 625 1 3 2 0 0 062 1 0 2 2 0 064 1 0 5 5 0 067 4 3 3 3 5 0
Total 9 8 20 12 8 6
662 D. E. HOWIE AND K. J. VICENTE
2. Participants question their actions during the trial (for example, ‘‘what did I dothere?’’).
3. The participant mentions reversing Dplayer to go back to check a control action (forexample, ‘‘I don’t remember what I was thinking2 I’m going to go back again’’).
A list of key words suggesting monitoring was compiled to provide an objective count ofmonitoring statements. These key words included: mistake, error, wrong, accident, forgot,goofed up, not right, don’t know, (punctuation indicating a question), go back and check.
Table 5 summarizes the number of these key words contained in the Dplayer verbalprotocols for the SE group. The good participants used slightly more monitoring keywords than the poor participants (total of 37 vs 26 words or an average of 2.2 and 1.6words/trial, respectively).
3.1.7. Summary of spontaneous self-explanation resultsThe spontaneous self-explanation results are summarized in Table 6. Within the SEgroup, the good participants spent much more time reviewing their trials than the poor
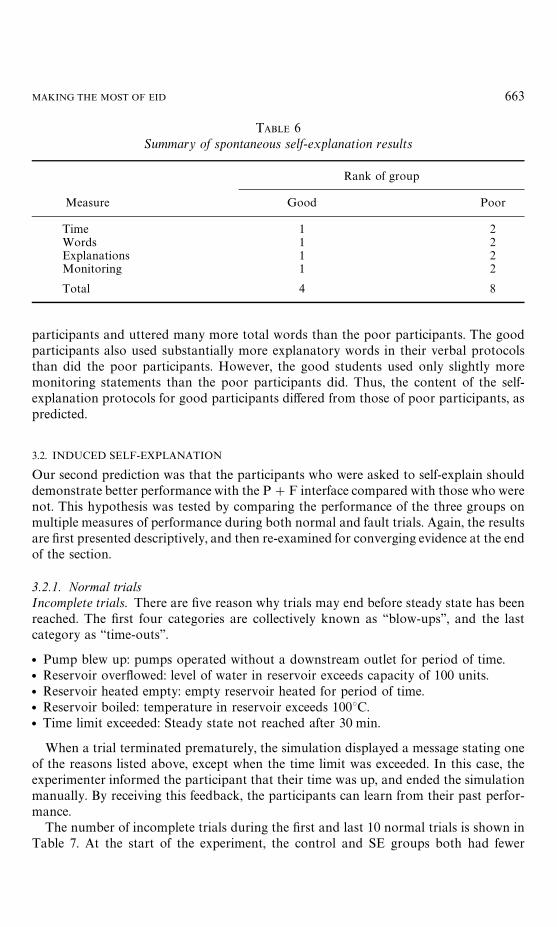
TABLE 6Summary of spontaneous self-explanation results
Rank of group
Measure Good Poor
Time 1 2Words 1 2Explanations 1 2Monitoring 1 2
Total 4 8
MAKING THE MOST OF EID 663
participants and uttered many more total words than the poor participants. The goodparticipants also used substantially more explanatory words in their verbal protocolsthan did the poor participants. However, the good students used only slightly moremonitoring statements than the poor participants did. Thus, the content of the self-explanation protocols for good participants differed from those of poor participants, aspredicted.
3.2. INDUCED SELF-EXPLANATION
Our second prediction was that the participants who were asked to self-explain shoulddemonstrate better performance with the P#F interface compared with those who werenot. This hypothesis was tested by comparing the performance of the three groups onmultiple measures of performance during both normal and fault trials. Again, the resultsare first presented descriptively, and then re-examined for converging evidence at the endof the section.
3.2.1. Normal trialsIncomplete trials. There are five reason why trials may end before steady state has beenreached. The first four categories are collectively known as ‘‘blow-ups’’, and the lastcategory as ‘‘time-outs’’.
f Pump blew up: pumps operated without a downstream outlet for period of time.f Reservoir overflowed: level of water in reservoir exceeds capacity of 100 units.f Reservoir heated empty: empty reservoir heated for period of time.f Reservoir boiled: temperature in reservoir exceeds 100°C.f Time limit exceeded: Steady state not reached after 30 min.
When a trial terminated prematurely, the simulation displayed a message stating oneof the reasons listed above, except when the time limit was exceeded. In this case, theexperimenter informed the participant that their time was up, and ended the simulationmanually. By receiving this feedback, the participants can learn from their past perfor-mance.
The number of incomplete trials during the first and last 10 normal trials is shown inTable 7. At the start of the experiment, the control and SE groups both had fewer
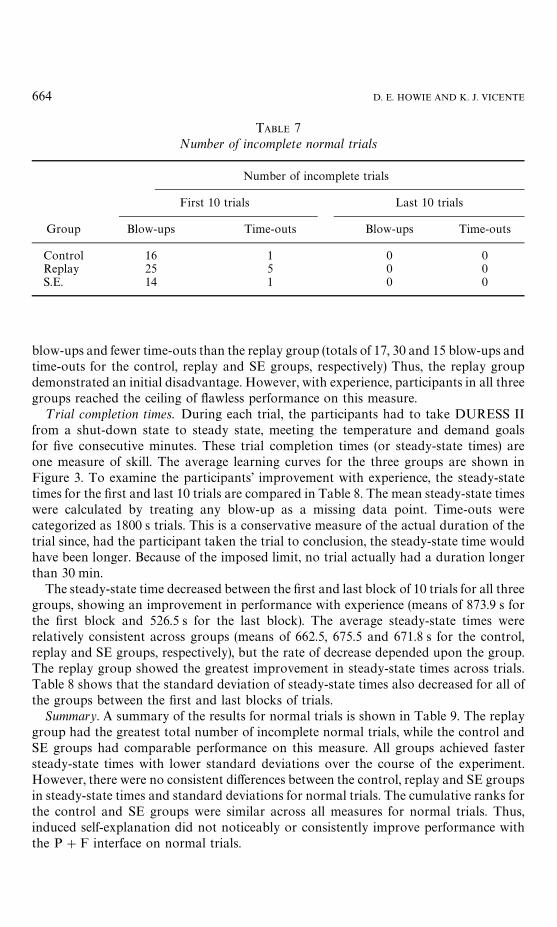
TABLE 7Number of incomplete normal trials
Number of incomplete trials
First 10 trials Last 10 trials
Group Blow-ups Time-outs Blow-ups Time-outs
Control 16 1 0 0Replay 25 5 0 0S.E. 14 1 0 0
664 D. E. HOWIE AND K. J. VICENTE
blow-ups and fewer time-outs than the replay group (totals of 17, 30 and 15 blow-ups andtime-outs for the control, replay and SE groups, respectively) Thus, the replay groupdemonstrated an initial disadvantage. However, with experience, participants in all threegroups reached the ceiling of flawless performance on this measure.
¹rial completion times. During each trial, the participants had to take DURESS IIfrom a shut-down state to steady state, meeting the temperature and demand goalsfor five consecutive minutes. These trial completion times (or steady-state times) areone measure of skill. The average learning curves for the three groups are shown inFigure 3. To examine the participants’ improvement with experience, the steady-statetimes for the first and last 10 trials are compared in Table 8. The mean steady-state timeswere calculated by treating any blow-up as a missing data point. Time-outs werecategorized as 1800 s trials. This is a conservative measure of the actual duration of thetrial since, had the participant taken the trial to conclusion, the steady-state time wouldhave been longer. Because of the imposed limit, no trial actually had a duration longerthan 30 min.
The steady-state time decreased between the first and last block of 10 trials for all threegroups, showing an improvement in performance with experience (means of 873.9 s forthe first block and 526.5 s for the last block). The average steady-state times wererelatively consistent across groups (means of 662.5, 675.5 and 671.8 s for the control,replay and SE groups, respectively), but the rate of decrease depended upon the group.The replay group showed the greatest improvement in steady-state times across trials.Table 8 shows that the standard deviation of steady-state times also decreased for all ofthe groups between the first and last blocks of trials.
Summary. A summary of the results for normal trials is shown in Table 9. The replaygroup had the greatest total number of incomplete normal trials, while the control andSE groups had comparable performance on this measure. All groups achieved fastersteady-state times with lower standard deviations over the course of the experiment.However, there were no consistent differences between the control, replay and SE groupsin steady-state times and standard deviations for normal trials. The cumulative ranks forthe control and SE groups were similar across all measures for normal trials. Thus,induced self-explanation did not noticeably or consistently improve performance withthe P#F interface on normal trials.
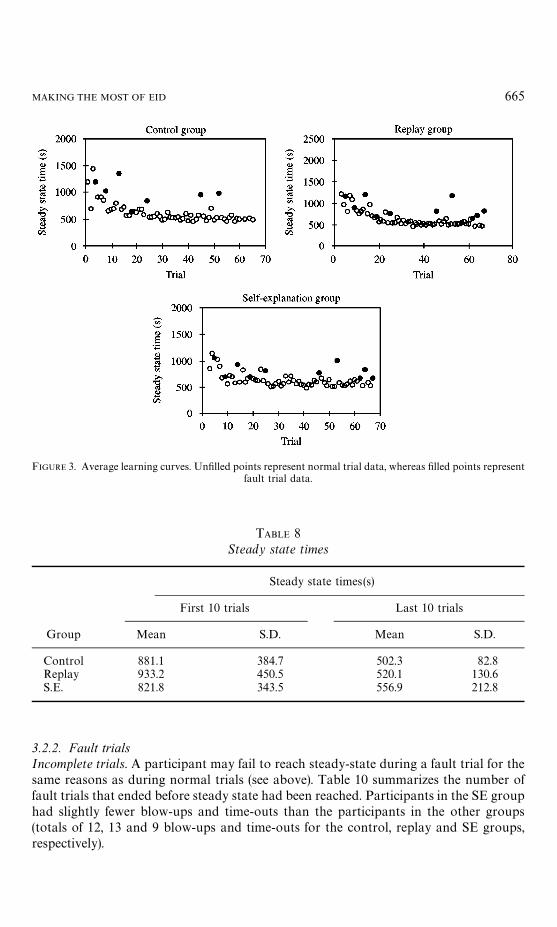
FIGURE 3. Average learning curves. Unfilled points represent normal trial data, whereas filled points representfault trial data.
TABLE 8Steady state times
Steady state times(s)
First 10 trials Last 10 trials
Group Mean S.D. Mean S.D.
Control 881.1 384.7 502.3 82.8Replay 933.2 450.5 520.1 130.6S.E. 821.8 343.5 556.9 212.8
MAKING THE MOST OF EID 665
3.2.2. Fault trialsIncomplete trials. A participant may fail to reach steady-state during a fault trial for thesame reasons as during normal trials (see above). Table 10 summarizes the number offault trials that ended before steady state had been reached. Participants in the SE grouphad slightly fewer blow-ups and time-outs than the participants in the other groups(totals of 12, 13 and 9 blow-ups and time-outs for the control, replay and SE groups,respectively).

TABLE 9Summary of normal trial results
Rank of group
Measure Control Replay SE
Incomplete 2 3 1Time (first) 2 3 1Time (last) 1 2 3S.D. (first) 2 3 1S.D. (last) 1 2 3
Total 8 13 9
TABLE 10Number of incomplete fault trials
Number of incomplete trials
Group Blow-ups Time-outs
Control 10 2Replay 11 2S.E. 8 1
666 D. E. HOWIE AND K. J. VICENTE
Detection. Following Pawlak and Vicente (1996), detection time was measured as theinterval from the onset of a fault until a participant stated that they thought thatsomething was wrong with the work domain (e.g. ‘‘it’s not responding’’). The participantsdid not have to accurately state the cause of a fault for detection to be scored; they simplyhad to notice that the process was acting abnormally. Table 11 summarizes the detectiontimes averaged across routine and non-routine faults for each group. The mean detectiontimes for the control and SE groups were similar, but faster than those for the replaygroups (mean detection times of 64.8, 78.4 and 65.8 s for the control, replay and SEgroups, respectively). However, taken alone, these means are misleading because thegroups were not able to detect faults with equal frequency.
Table 11 lists the number of faults that each group detected out of a total of 78, wherea non-routine fault is scored as two faults. The SE group detected substantially morefaults than either the control or replay groups (total of 47, 37 and 58 for the control,replay and SE groups, respectively). Figure 4 illustrates the distribution of detectiontimes. The SE group had the largest proportion of faults detected in the first 50 s, and thesmallest proportion of faults that were not detected. In contrast, the replay group did notdetect about half of the faults. The control group detected an intermediate number offaults, with about half of their detections occurring in the first 50 s.
Figure 5 illustrates the relationship between group and type of fault (routine ornon-routine). There is an increasingly larger spread between detection times for routine
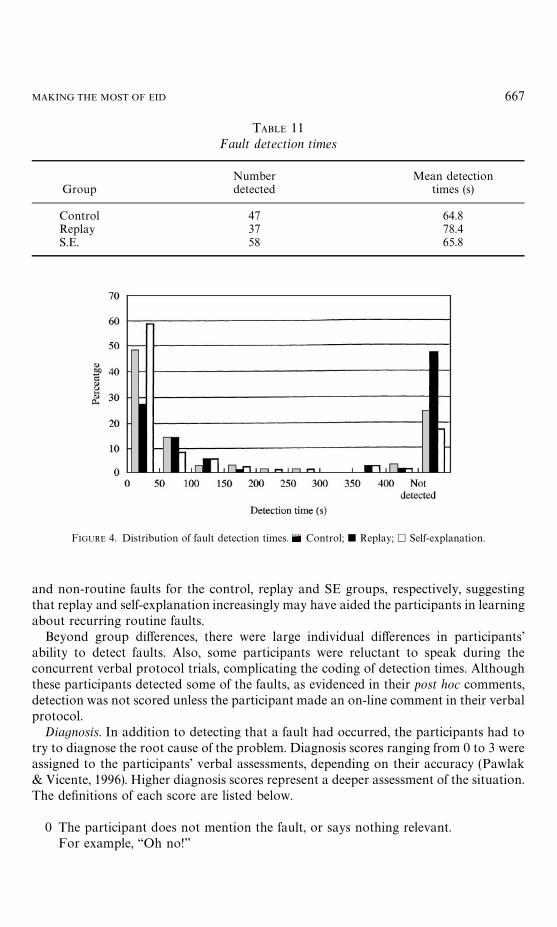
TABLE 11Fault detection times
Number Mean detectionGroup detected times (s)
Control 47 64.8Replay 37 78.4S.E. 58 65.8
FIGURE 4. Distribution of fault detection times. Control; j Replay; h Self-explanation.
MAKING THE MOST OF EID 667
and non-routine faults for the control, replay and SE groups, respectively, suggestingthat replay and self-explanation increasingly may have aided the participants in learningabout recurring routine faults.
Beyond group differences, there were large individual differences in participants’ability to detect faults. Also, some participants were reluctant to speak during theconcurrent verbal protocol trials, complicating the coding of detection times. Althoughthese participants detected some of the faults, as evidenced in their post hoc comments,detection was not scored unless the participant made an on-line comment in their verbalprotocol.
Diagnosis. In addition to detecting that a fault had occurred, the participants had totry to diagnose the root cause of the problem. Diagnosis scores ranging from 0 to 3 wereassigned to the participants’ verbal assessments, depending on their accuracy (Pawlak& Vicente, 1996). Higher diagnosis scores represent a deeper assessment of the situation.The definitions of each score are listed below.
0 The participant does not mention the fault, or says nothing relevant.For example, ‘‘Oh no!’’
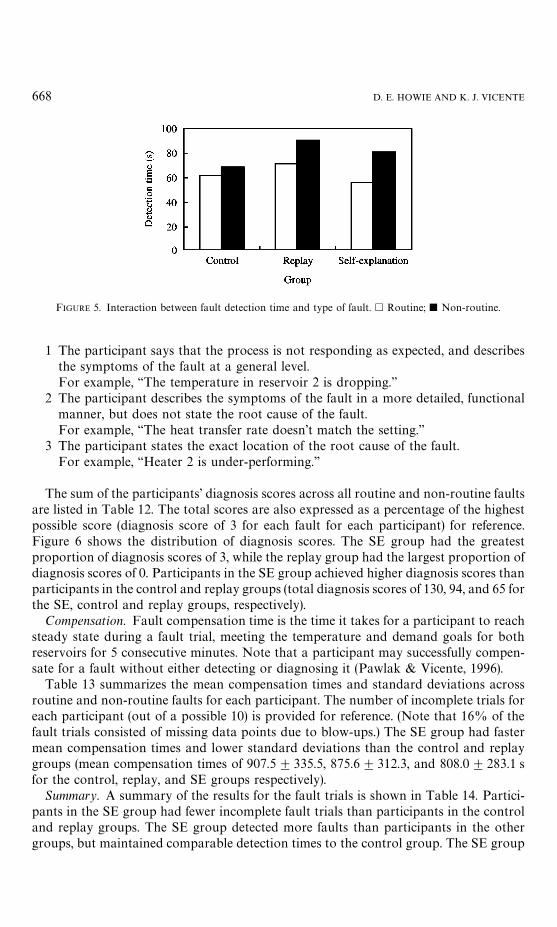
FIGURE 5. Interaction between fault detection time and type of fault. h Routine; j Non-routine.
668 D. E. HOWIE AND K. J. VICENTE
1 The participant says that the process is not responding as expected, and describesthe symptoms of the fault at a general level.For example, ‘‘The temperature in reservoir 2 is dropping.’’
2 The participant describes the symptoms of the fault in a more detailed, functionalmanner, but does not state the root cause of the fault.For example, ‘‘The heat transfer rate doesn’t match the setting.’’
3 The participant states the exact location of the root cause of the fault.For example, ‘‘Heater 2 is under-performing.’’
The sum of the participants’ diagnosis scores across all routine and non-routine faultsare listed in Table 12. The total scores are also expressed as a percentage of the highestpossible score (diagnosis score of 3 for each fault for each participant) for reference.Figure 6 shows the distribution of diagnosis scores. The SE group had the greatestproportion of diagnosis scores of 3, while the replay group had the largest proportion ofdiagnosis scores of 0. Participants in the SE group achieved higher diagnosis scores thanparticipants in the control and replay groups (total diagnosis scores of 130, 94, and 65 forthe SE, control and replay groups, respectively).
Compensation. Fault compensation time is the time it takes for a participant to reachsteady state during a fault trial, meeting the temperature and demand goals for bothreservoirs for 5 consecutive minutes. Note that a participant may successfully compen-sate for a fault without either detecting or diagnosing it (Pawlak & Vicente, 1996).
Table 13 summarizes the mean compensation times and standard deviations acrossroutine and non-routine faults for each participant. The number of incomplete trials foreach participant (out of a possible 10) is provided for reference. (Note that 16% of thefault trials consisted of missing data points due to blow-ups.) The SE group had fastermean compensation times and lower standard deviations than the control and replaygroups (mean compensation times of 907.5$335.5, 875.6$312.3, and 808.0$283.1 sfor the control, replay, and SE groups respectively).
Summary. A summary of the results for the fault trials is shown in Table 14. Partici-pants in the SE group had fewer incomplete fault trials than participants in the controland replay groups. The SE group detected more faults than participants in the othergroups, but maintained comparable detection times to the control group. The SE group

TABLE 12¹otal fault diagnosis scores
Diagnosis score
Group Total Percent of maximum
Control 94 51Replay 65 31S.E. 130 62
FIGURE 6. Distribution of fault diagnosis scores. Control; j Replay; h Self-explanation.
TABLE 13Fault compensation times
Compensation times (s)Number
Group incomplete Mean S.D.
Control 12 907.5 335.5Replay 13 875.6 312.3S.E. 9 808.0 283.1
MAKING THE MOST OF EID 669
also had the greatest difference in detection times for routine and non-routine faults,suggesting that self-explanation may have helped to improve their performance onrecurring faults. Furthermore, the SE group had the highest total and percentagediagnosis scores, the fastest compensation times, and the least variable compensationtimes. The cumulative ranks for the control and replay groups were double that of the SE
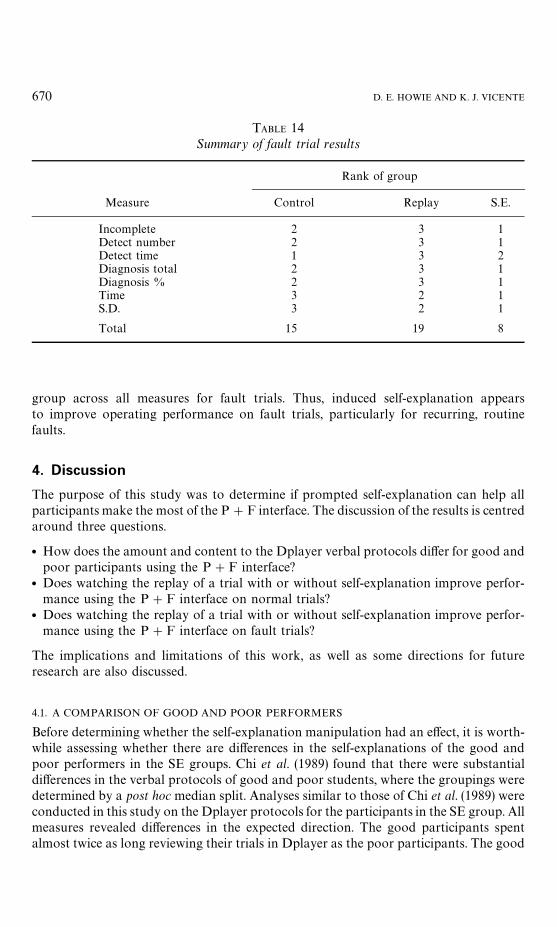
TABLE 14Summary of fault trial results
Rank of group
Measure Control Replay S.E.
Incomplete 2 3 1Detect number 2 3 1Detect time 1 3 2Diagnosis total 2 3 1Diagnosis % 2 3 1Time 3 2 1S.D. 3 2 1
Total 15 19 8
670 D. E. HOWIE AND K. J. VICENTE
group across all measures for fault trials. Thus, induced self-explanation appearsto improve operating performance on fault trials, particularly for recurring, routinefaults.
4. Discussion
The purpose of this study was to determine if prompted self-explanation can help allparticipants make the most of the P#F interface. The discussion of the results is centredaround three questions.
f How does the amount and content to the Dplayer verbal protocols differ for good andpoor participants using the P#F interface?
f Does watching the replay of a trial with or without self-explanation improve perfor-mance using the P#F interface on normal trials?
f Does watching the replay of a trial with or without self-explanation improve perfor-mance using the P#F interface on fault trials?
The implications and limitations of this work, as well as some directions for futureresearch are also discussed.
4.1. A COMPARISON OF GOOD AND POOR PERFORMERS
Before determining whether the self-explanation manipulation had an effect, it is worth-while assessing whether there are differences in the self-explanations of the good andpoor performers in the SE groups. Chi et al. (1989) found that there were substantialdifferences in the verbal protocols of good and poor students, where the groupings weredetermined by a post hoc median split. Analyses similar to those of Chi et al. (1989) wereconducted in this study on the Dplayer protocols for the participants in the SE group. Allmeasures revealed differences in the expected direction. The good participants spentalmost twice as long reviewing their trials in Dplayer as the poor participants. The good
MAKING THE MOST OF EID 671
participants also included more explanations in their Dplayer protocols. Finally, thegood participants also included more monitoring statements in their Dplayer protocolsthan the poor participants, but only barely. This difference between the groups may havebeen minimized because the poor participants made more mistakes that merited com-ment. Also, mistakes may be more visible in the dynamic, interactive DURESS IIenvironment, particularly with the P#F interface, as compared to a non-interactive,text-based learning environment. Every control action that a participant makes has animpact on the state of the work domain, so the effects of an action cannot be as easilyignored as when studying text. This may explain why the difference between good andpoor SE participants on this measure was not as noticeable as on other measures.
This set of findings is important because it shows that there is a consistent relationshipbetween the content of self-explanations and performance with the P#F interface.Having established this result, the next question is whether instructing participants toself-explain can improve their performance.
4.2. SELF-EXPLANATION AND PERFORMANCE ON NORMAL TRIALS
The performance of the control, replay and SE groups using the P#F interface wassimilar under normal operating conditions. The replay group initially had the greatestnumber of incomplete trials, but they became comparable to the other groups withexperience. The steady-state times of the three groups were not substantially different. Allparticipants achieved faster steady-state times across the course of the experiment, butthe rate of decrease depended upon the group. The replay group showed the greatestimprovement in steady-state times probably because their initial performance wasrelatively poor. The steady-state times also became less variable with experience, but thestandard deviations did not differ markedly among the groups. Thus, induced self-explanation did not appear to improve markedly participants’ performance with theP#F interface on normal trials.
4.3. SELF-EXPLANATION AND PERFORMANCE ON FAULT TRIALS
There were reasons to believe that the results for fault trials might show greater evidenceof the influence of self-explanation. Chi et al. (1994) found that their self-explanationgroup demonstrated the greatest improvement relative to the control group on themost difficult questions—those that required deeper domain knowledge. These moredifficult questions would seem to be analogous to the fault trials of DURESS II. Indeed,the evidence indicates superior performance on fault trials for the SE group acrossa variety of measures. Participants in the SE group had the fewest incomplete fault trialsand the greatest number of faults that were detected. The difference between thedetection times for routine and non-routine faults increased for the control, replay andSE groups, respectively. This result suggests that self-explanation may have helped theparticipants in the SE groups to learn to detect recurring routine faults more quickly.Participants in the SE group accumulated the highest total and percentage diagnosisscores. The SE group also achieved the fastest compensation times, over thelargest number of completed trials, with the lowest standard deviations of all threegroups.
672 D. E. HOWIE AND K. J. VICENTE
This set of results in important because it shows that instructing participants using theP#F interface to self-explain their actions can raise their performance on fault trials. Inshort, induced self-explanation can help participants make the most of EID.
Denning’s (1995) study provides a possible approach to improving the effect of self-explanation on participants’ performance while using an EID interface even further. Shehad groups of students use a computer program (¹he Biology Sleuth) to help diagnosediseases. These exercises were intended to foster critical thinking, where small groupdiscussions played a similar role to self-explanation in our study. Denning found thatgood students were able to benefit from simply working with the computer program,whereas poor students only showed marginal improvements. When a group of poorstudents received training on how to effectively use Biology Sleuth, they derived similarbenefits to the good students from working with the program. The training consisted ofa graduated series of exercises using a paper-based chart that showed the relationshipsbetween various diseases and test results supporting those diagnoses. The exercises wereordered using a scaffolding procedure, moving from easy, known concepts to moredifficult, unfamiliar ones. Thus, explicitly scaffolding the poor students’ learning wasessential in helping them to learn from their experience.
Thus, introducing some form of explicit training could help to maximize the influenceof self-explanation, particularly for the poor SE participants. The type of scaffoldedinstruction suggested by Denning (1995) might provide a viable solution.
4.4. IMPLICATIONS
Two practical implications arise from this study.
1. Good operators using an EID interface seem to naturally reflect on their operatingperformance, but poor operators rarely seem to think deeply about the reasons fortheir actions. However, good and poor operators tend to monitor their perfor-mance with equal frequency.
2. Simply instructing operators using an EID interface to reflect on their operationalstrategies is unlikely to produce much performance improvement under normalconditions, but may help their performance under fault conditions.
4.5. LIMITATIONS
Despite our efforts to balance the groups through the use of individual differences tests,there were still initial performance differences across the three groups. In particular, thereplay group was initially plagued with poorer performance. The Spy Ring History Testprovides an improvement over previous methods of balancing group compositions, butit will be important to more accurately balance the participants across groups in anyfuture studies.
The individual differences among participants are particularly salient because ofthe small group sizes. The duration and complexity of experiments using DURESS IImake larger sample sizes prohibitive. And while the current methodological approachallows a detailed profile of the strategies and performance of individual operators, thisbenefit comes at the price of not conducting inferential tests of the reliability of theresults.
MAKING THE MOST OF EID 673
4.6. FUTURE DIRECTIONS
Future studies in this area could examine a number of related questions.
1. Does scaffolding (for example, training on strategies or heuristics) allow the poorparticipants using an EID interface to benefit more from self-explanation?
2. What individual differences tests are most predictive of performance using an EIDinterface? Can these be used to better balance experimental and control groups forresearch?
3. Does induced self-explanation help participants make the most of other types ofinterfaces not based on EID?
5. Conclusions
Previous studies have shown that an interface designed according to the principles ofEID can lead to a level of performance and degree of deep knowledge that is notobserved with a more traditional interface (e.g. Christoffersen et al., 1996, 1997, 1998).However, an ecological interface coupled with a surface approach to learning can stilllead to shallow knowledge and poor performance (Christoffersen et al. 1998). Thissituation may be remedied either by selection or by training. This study examined oneway to improve the level of performance with an EID interface—self-explanation. Thismanipulation improved performance on fault trials, showing that self-explanation canhelp operators make the most of EID. Nevertheless, there were still substantial indi-vidual differences between participants in the SE group. Supplementing self-explanationwith training may help this approach become even more effective. Alternatively, oper-ators could be selected based on stable trials that lead to effective performance with anEID interface. Through this research, we have moved one step closer to a full under-standing of what system designers need to do to make the most of EID.
This research was sponsored by a contract from the Japan Atomic Energy Research Institute (DrFumiya Tanabe, Contract Monitor) and by research and equipment grants from the NaturalSciences and Engineering Research Council of Canada. We would like to thank Dr Tanabe,Michael Janzen, Lisa Orchanian and Tom Smahel for their contributions to this research.
References
BIGGS, J. B. (1987). Student Approaches to ¸earning and Studying. Hawthorne, Victoria: AustralianCouncil for Educational Research.
BISANTZ, A. M. & VICENTE, K. J. (1994). Making the abstraction hierarchy concrete. InternationalJournal of Human—Computer Studies, 40, 83—117.
CHI, M. T. H., BASSOK, M., LEWIS, M. W., REIMANN, P. & GLASER, R. (1989) Self-explanations:how students study and use examples in learning to solve problems. Cognitive Science, 13,145—182.
CHI, M. T. H., DE LEEUW, N., CHIU, M.-H. & LAVANCHER, C. (1994). Eliciting self-explanationsimproves understanding. Cognitive Science, 18, 439—477.
CHRISTOFFERSEN, K., HUNTER, C. N. & VICENTE, K. J. (1996) A longitudinal study of the effect ofecological interface design on skill acquisition. Human Factors, 38, 523—541.
CHRISTOFFERSEN, K., HUNTER, C. N. & VICENTE, K. J. (1997) A longitudinal study of the effects ofecological interface design on fault management performance. International Journal of Cogni-tive Ergonomics, 1, 1—24.
674 D. E. HOWIE AND K. J. VICENTE
CHRISTOFFERSEN, K., HUNTER, C. N. & VICENTE, K. J. (1998). A longitudinal study of the effects ofecological interface design on deep knowledge. International Journal of Human—ComputerStudies.
DENNING, R. (1995). A case study in the design and evaluation of an interactive learningenvironment to teach problem-solving skills. Unpublished manuscript, Center for CognitiveScience, The Ohio State University.
FERGUSON-HESSLER, M. G. M. & DE JONG, T. (1990). Studying physics texts: differences in studyprocesses between good and poor performers. Cognition and Instruction, 7, 41—54.
HOWIE, D. E. (1996). Shaping experties through ecological interface design: Strategies, metacogni-tion, and individual differences CEL 96-01, Cognitive Engineering Laboratory, University ofToronto, Toronto, Ontario, Canada.
HUNTER, C. N., JANZEN, M. E. & VICENTE, K. J. (1995). Research on factors influencing humancognitive behavior (II). CEL 95-08. Cognitive Engineering Laboratory, University of Toronto,Toronto, Ontario, Canada.
LAWSON, M. J. & CHINNAPPAN, M. (1994). Generative activity during problem solving: compari-son of the performance of high-achieving and low-achieving high school students. Cognitionand Instruction, 12, 61—93.
NATHAN, M. J., MERTZ, K. & RYAN, R. (1994). Learning through self-explanation of mathematicsexamples: Effects of cognitive load. Paper presented at the 1994 Annual Meeting of theAmerican Educational Research Association.
PASK, G. & SCOTT, B. C. (1972). Learning strategies and individual competence. InternationalJournal of Man-Machine Studies, 4, 217—253.
PAWLAK, W. S. & VICENTE, K. J. (1996). Inducing effective operator control through ecologicalinterface design. International Journal of Human—Computer Studies, 44, 653—688.
PIROLLI, P. & RECKER, M. (1994). Learning strategies and transfer in the domain of programming.Cognition and Instruction, 12, 235—275.
RASMUSSEN, J. (1983). Skills, rules, and knowledge; Signals, signs, and symbols, and otherdistinctions in human performance models. IEEE ¹ransactions on Systems, Man, and Cyber-netics, SMC-13, 257—266.
RASMUSSEN, J. (1985). The role of hierarchical knowledge representation in decision making andsystem management. IEEE ¹ransactions on Systems, Man and Cybernetics, SMC-15, 234—243.
VICENTE, K. J., CHRISTOFFERSEN, K. & HUNTER, C. N. (1996). Response to Maddox critique.Human Factors, 38, 546—549.
VICENTE, K. J. & PAWLAK, W. S. (1994). Cognitive work analysis of the DºRESS II system, CEL94-03 Cognitive Engineering Laboratory, University of Toronto, Toronto, Ontario, Canada.
VICENTE, K. J. & RASMUSSEN, J. (1990). The ecology of human-machine systems II: mediating‘‘direct perception’’ in complex work domains. Ecological Psychology, 2, 207—249.
VICENTE, K. J. & RASMUSSEN, J. (1992). Ecological interface design: Theoretical foundations.IEEE ¹ransactions on Systems, Man, and Cybernetics, SMC-22, 589—606.
WEBB, N. M. (1989). Peer interaction and learning in small groups. International Journal ofEducation Research, 13, 21—39.
Paper accepted for publication by Associate editor, Dr. B. van der Veer


![RESEARCH ARTICLE Open Access Qualitative skeletal ... · states in deep time [7,8] as a potential explanation for the current ecological and phylogenetic diversity of birds [9]. Efforts](https://img.pdfslide.net/doc/110x75/5f0939217e708231d425cef8/research-article-open-access-qualitative-skeletal-states-in-deep-time-78.jpg)


![Cisco UCS Faults · Fault Code:F0708 Message Connection to Adapter [id] eth interface [id] in server [id] missing Explanation The link for a network-facing host interface is missing](https://img.pdfslide.net/doc/110x75/60f9cd32caccdb790c41238b/cisco-ucs-faults-fault-codef0708-message-connection-to-adapter-id-eth-interface.jpg)