Embed Size (px)
Citation preview
Malnutrition Screening and Assessment in
PaediatricsDr Melinda White PhD, APDPaediatric Dietitian
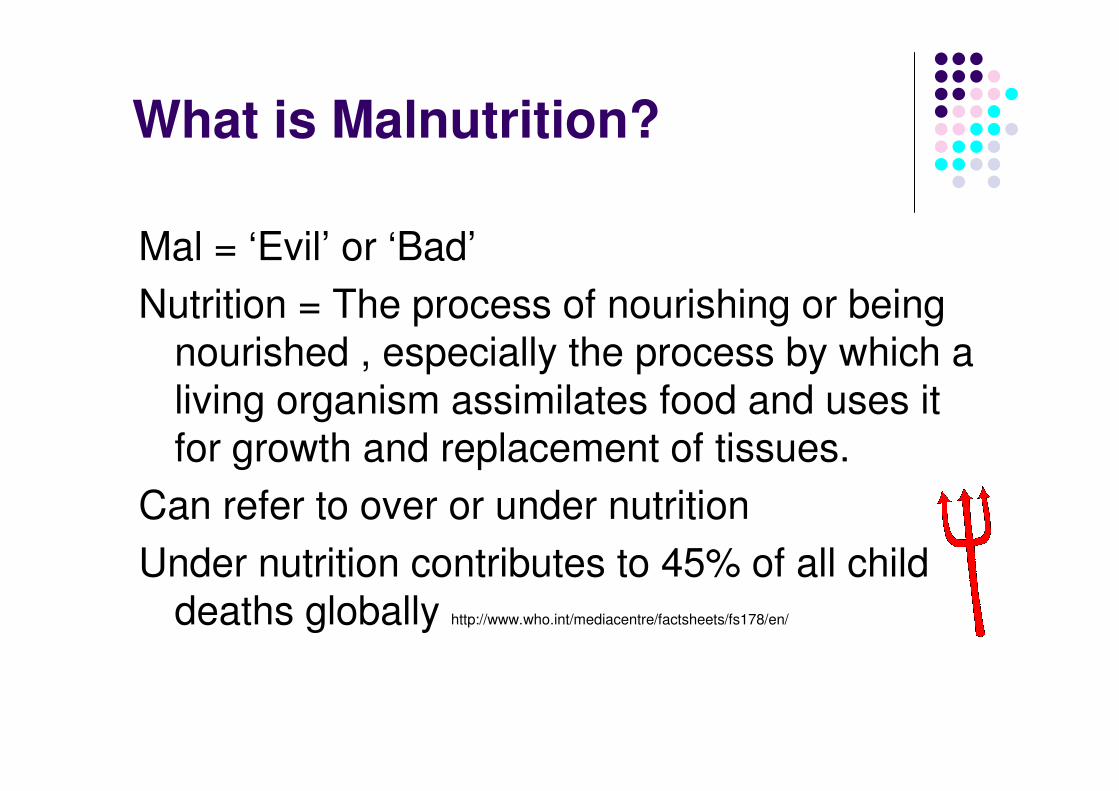
What is Malnutrition?
Mal = ‘Evil’ or ‘Bad’
Nutrition = The process of nourishing or being
nourished , especially the process by which a
living organism assimilates food and uses it
for growth and replacement of tissues.
Can refer to over or under nutrition
Under nutrition contributes to 45% of all child
deaths globally http://www.who.int/mediacentre/factsheets/fs178/en/
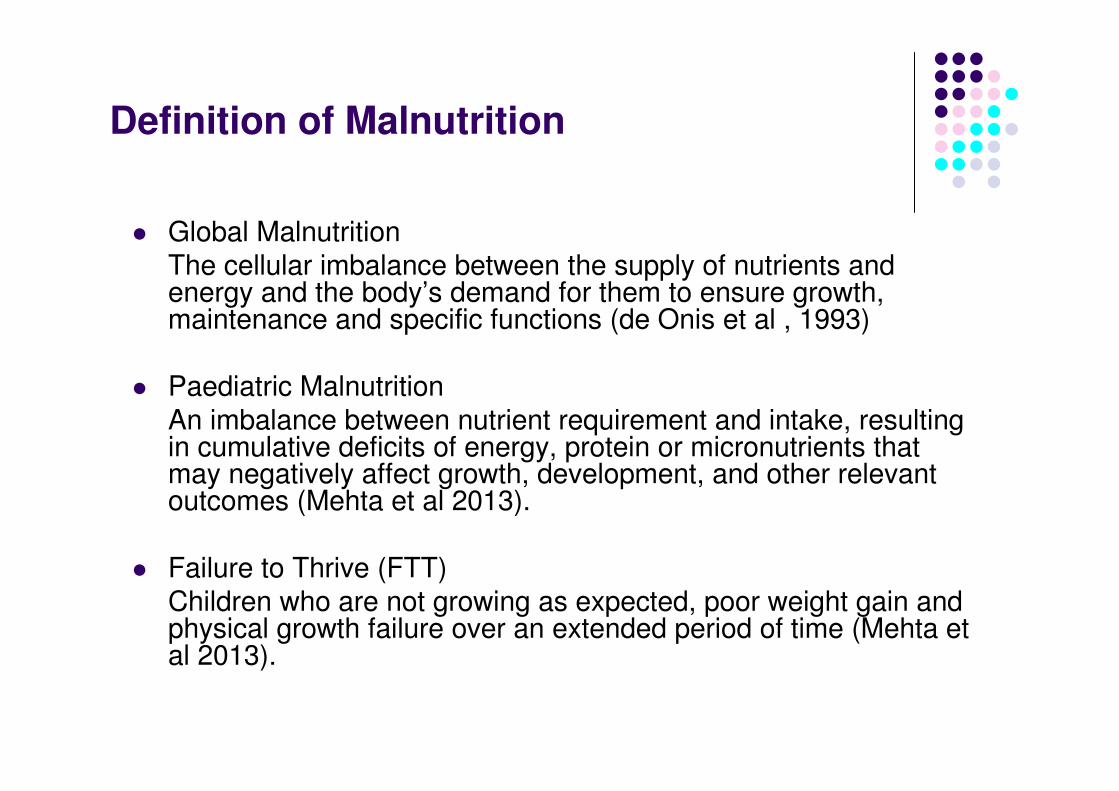
Definition of Malnutrition
� Global Malnutrition
The cellular imbalance between the supply of nutrients and energy and the body’s demand for them to ensure growth, maintenance and specific functions (de Onis et al , 1993)
� Paediatric Malnutrition
An imbalance between nutrient requirement and intake, resulting in cumulative deficits of energy, protein or micronutrients thatmay negatively affect growth, development, and other relevant outcomes (Mehta et al 2013).
� Failure to Thrive (FTT)
Children who are not growing as expected, poor weight gain and physical growth failure over an extended period of time (Mehta et al 2013).
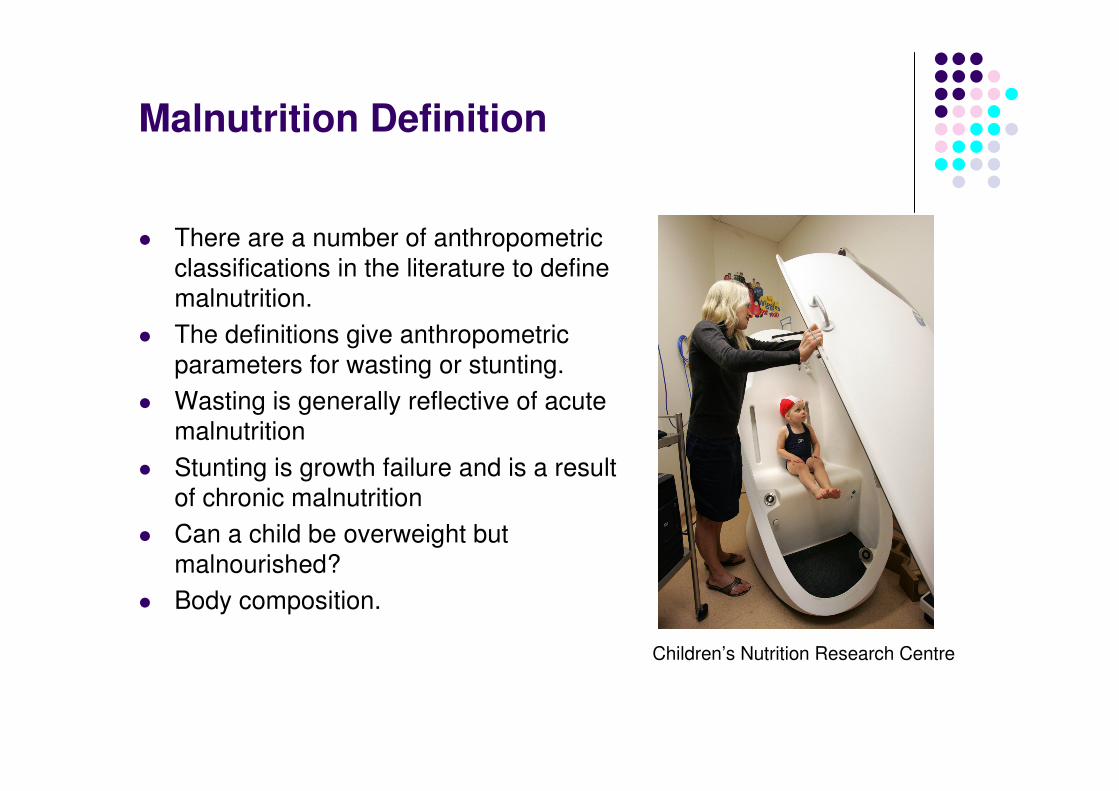
Malnutrition Definition
� There are a number of anthropometric
classifications in the literature to define malnutrition.
� The definitions give anthropometric
parameters for wasting or stunting.
� Wasting is generally reflective of acute malnutrition
� Stunting is growth failure and is a result of chronic malnutrition
� Can a child be overweight but
malnourished?
� Body composition.
Children’s Nutrition Research Centre
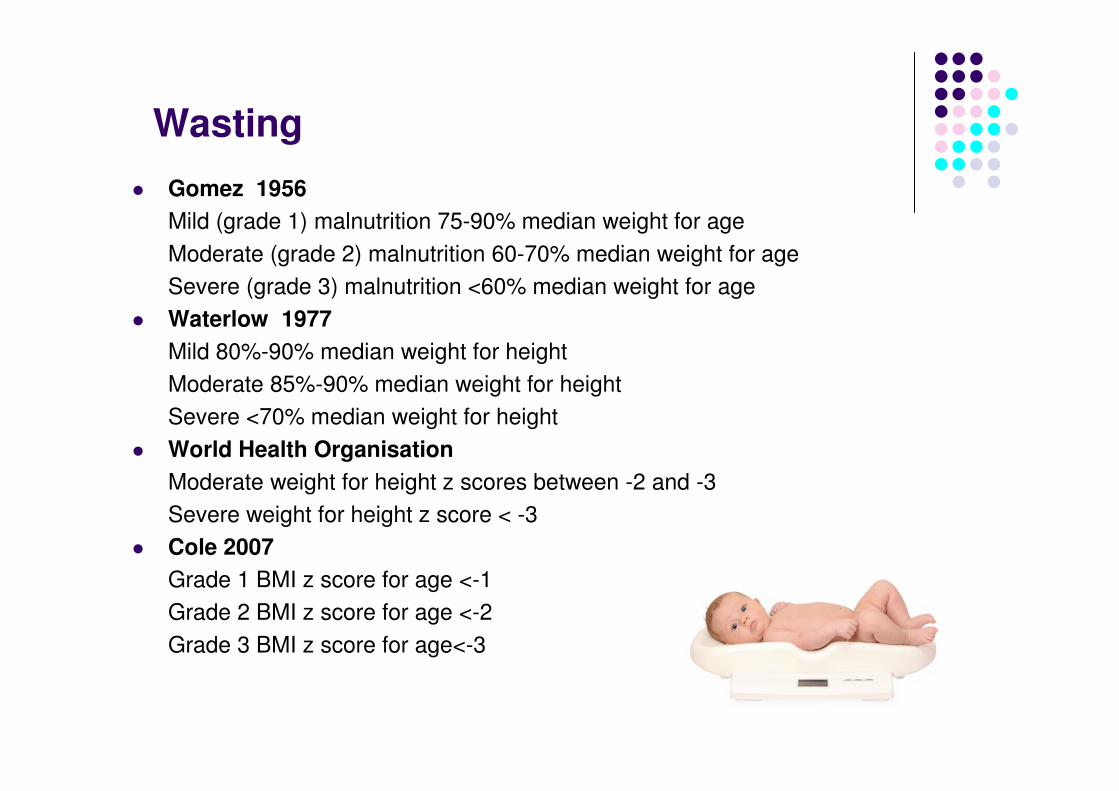
Wasting
� Gomez 1956
Mild (grade 1) malnutrition 75-90% median weight for age
Moderate (grade 2) malnutrition 60-70% median weight for age
Severe (grade 3) malnutrition <60% median weight for age
� Waterlow 1977
Mild 80%-90% median weight for height
Moderate 85%-90% median weight for height
Severe <70% median weight for height
� World Health Organisation
Moderate weight for height z scores between -2 and -3
Severe weight for height z score < -3
� Cole 2007
Grade 1 BMI z score for age <-1
Grade 2 BMI z score for age <-2
Grade 3 BMI z score for age<-3
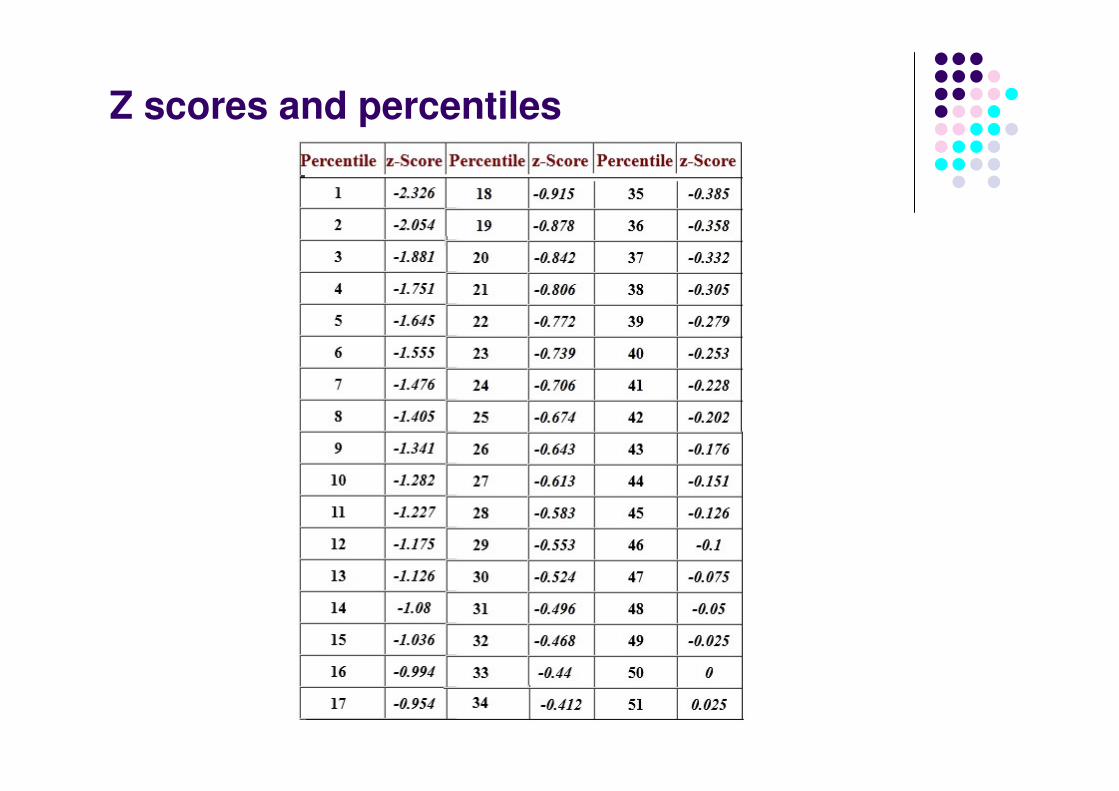
Z scores and percentiles
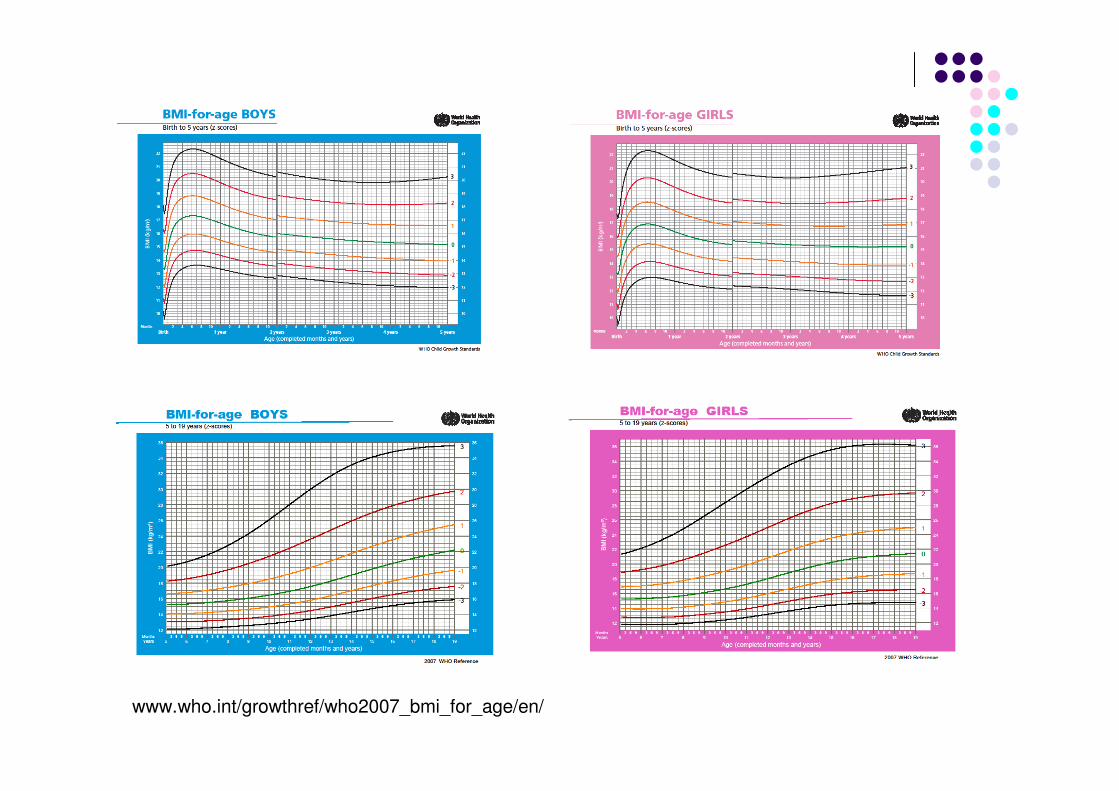
www.who.int/growthref/who2007_bmi_for_age/en/
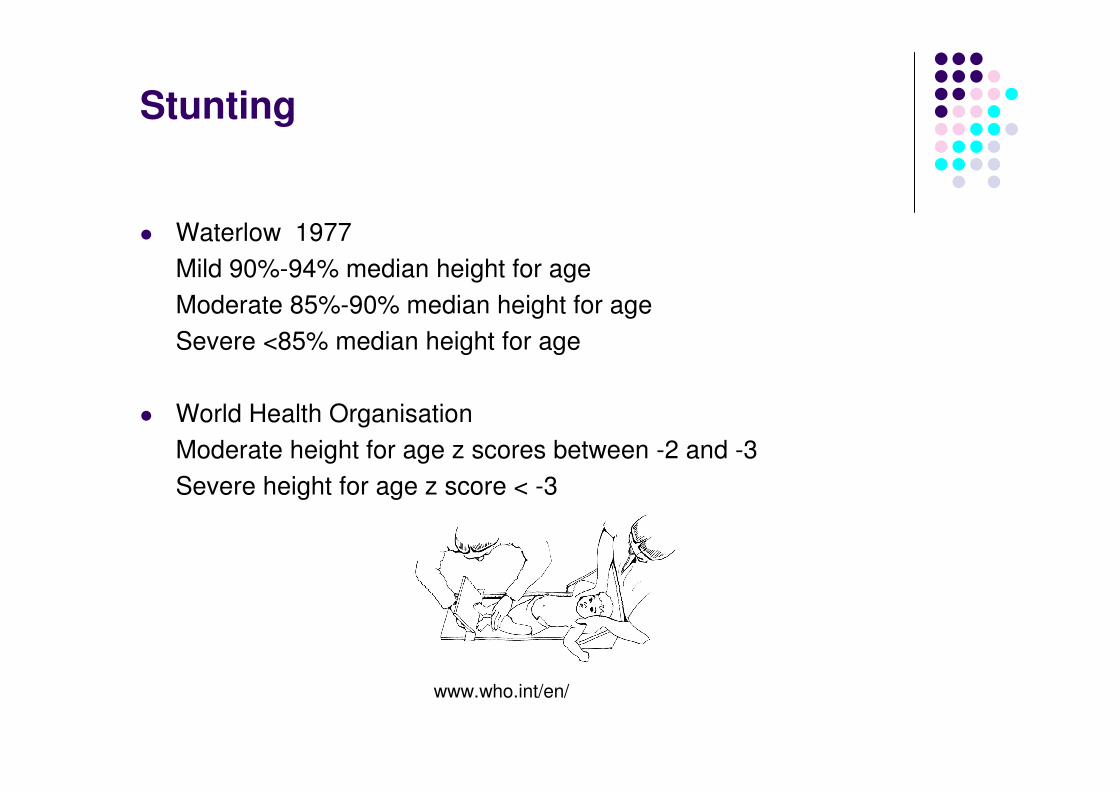
Stunting
� Waterlow 1977
Mild 90%-94% median height for age
Moderate 85%-90% median height for age
Severe <85% median height for age
� World Health Organisation
Moderate height for age z scores between -2 and -3
Severe height for age z score < -3
www.who.int/en/
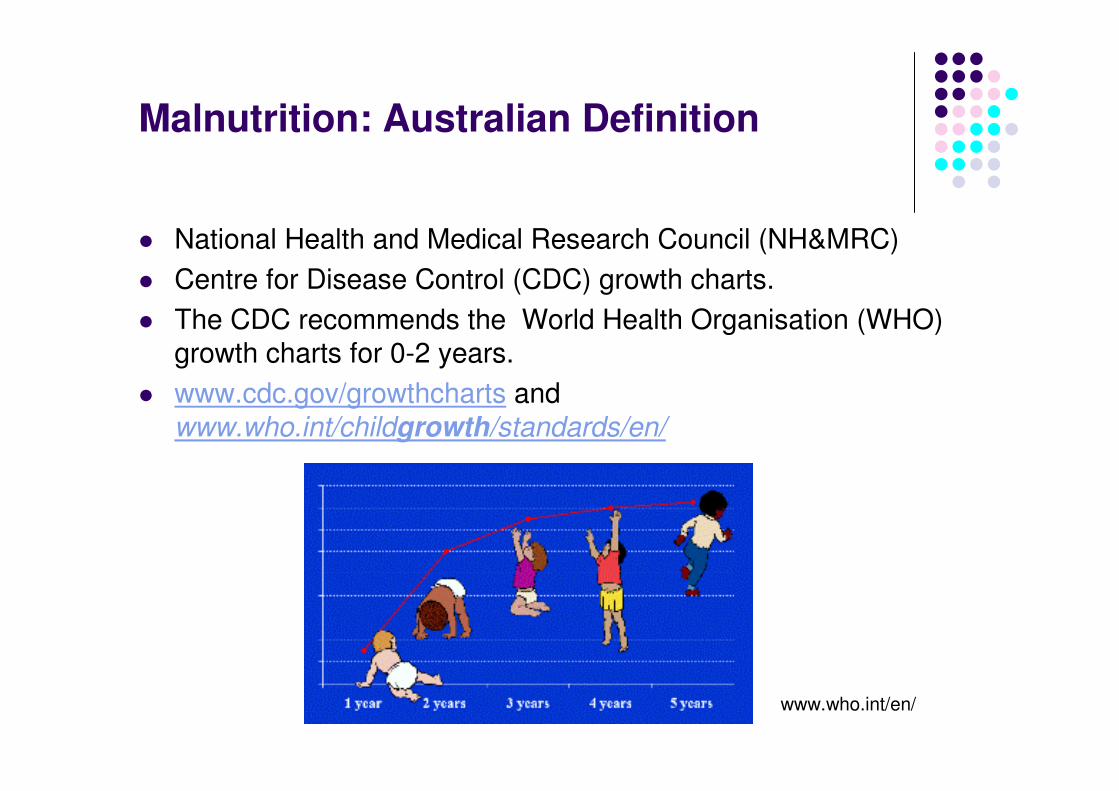
� National Health and Medical Research Council (NH&MRC)
� Centre for Disease Control (CDC) growth charts.
� The CDC recommends the World Health Organisation (WHO)
growth charts for 0-2 years.
� www.cdc.gov/growthcharts and
www.who.int/childgrowth/standards/en/
Malnutrition: Australian Definition
www.who.int/en/
� Body Mass Index or weight for height below the 5th percentile.
� Weight percentile greater than 2 percentiles below height percentile (birth to 20 years).
� Any decrease in the curve by 2 or more growth percentile channels (height-for-age, weight-for-age, BMI) during 6 months.
� Growth that is persistently below the 3rd percentile (not explained by parental stature or genetic
potential).
Malnutrition: Australian Definition
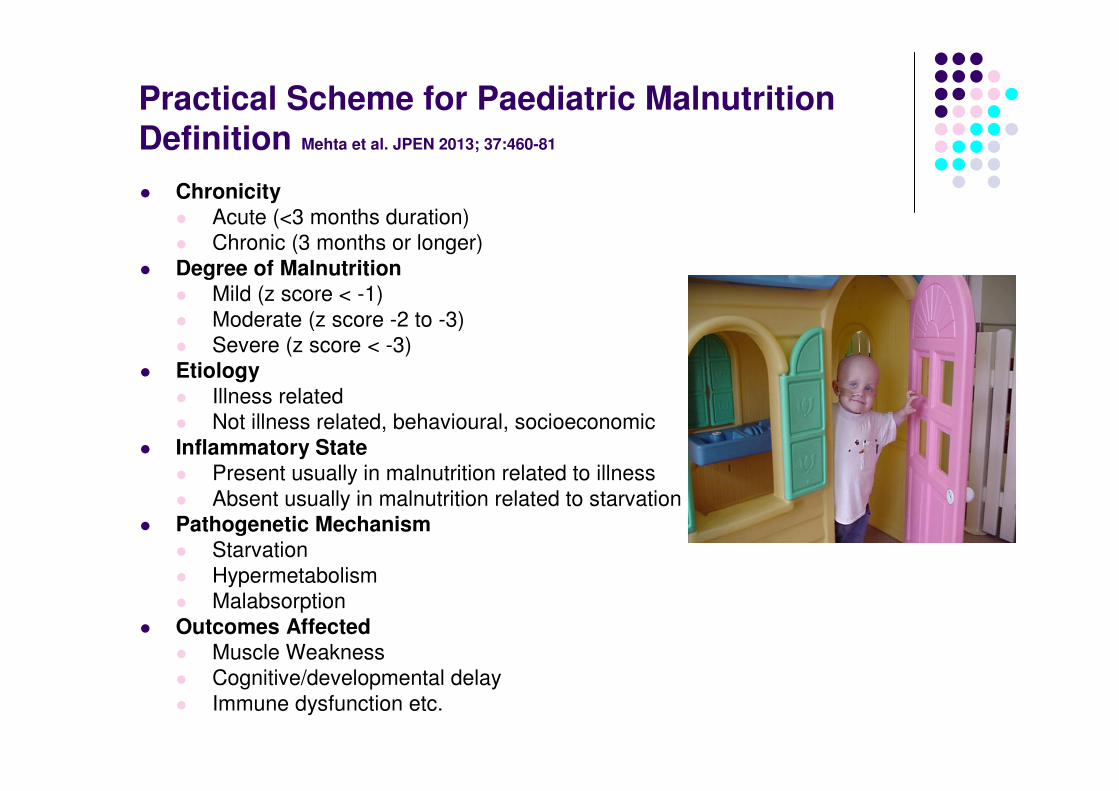
Practical Scheme for Paediatric Malnutrition Definition Mehta et al. JPEN 2013; 37:460-81
� Chronicity� Acute (<3 months duration)
� Chronic (3 months or longer)
� Degree of Malnutrition� Mild (z score < -1)
� Moderate (z score -2 to -3)
� Severe (z score < -3)
� Etiology
� Illness related
� Not illness related, behavioural, socioeconomic
� Inflammatory State� Present usually in malnutrition related to illness
� Absent usually in malnutrition related to starvation
� Pathogenetic Mechanism� Starvation
� Hypermetabolism
� Malabsorption
� Outcomes Affected � Muscle Weakness
� Cognitive/developmental delay
� Immune dysfunction etc.
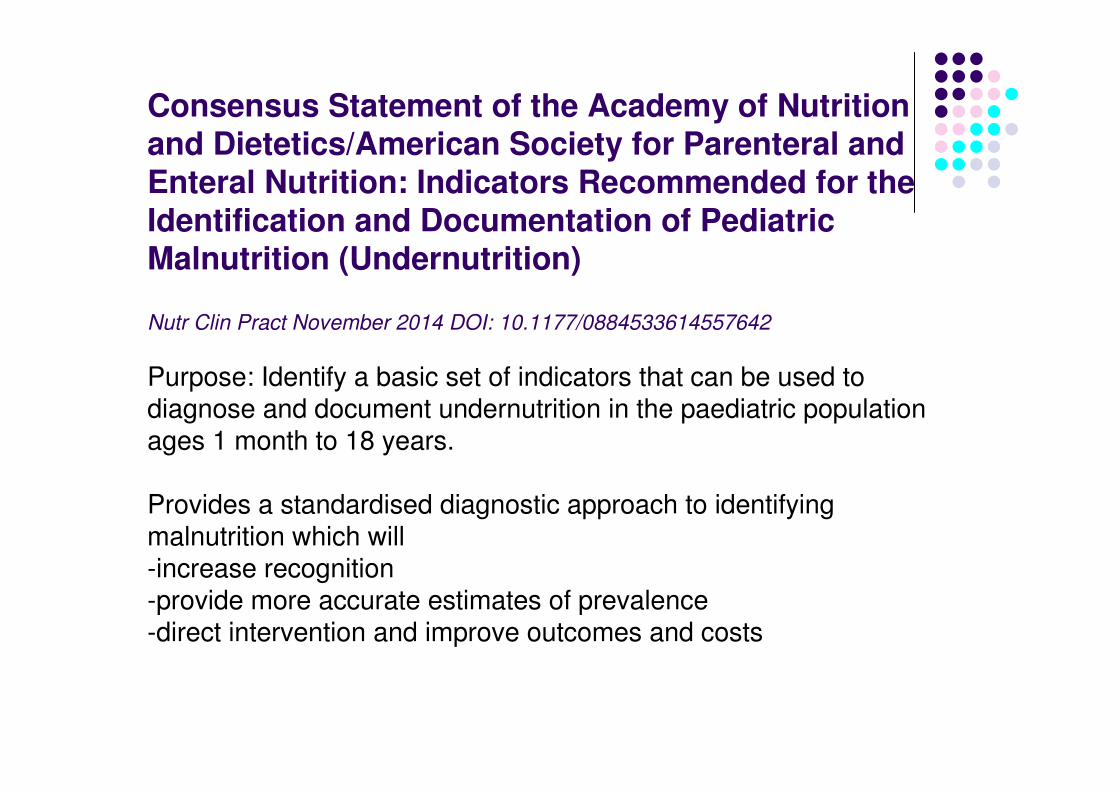
Consensus Statement of the Academy of Nutrition and Dietetics/American Society for Parenteral and Enteral Nutrition: Indicators Recommended for the Identification and Documentation of Pediatric Malnutrition (Undernutrition)
Nutr Clin Pract November 2014 DOI: 10.1177/0884533614557642
Purpose: Identify a basic set of indicators that can be used to diagnose and document undernutrition in the paediatric population ages 1 month to 18 years.
Provides a standardised diagnostic approach to identifying malnutrition which will-increase recognition-provide more accurate estimates of prevalence-direct intervention and improve outcomes and costs
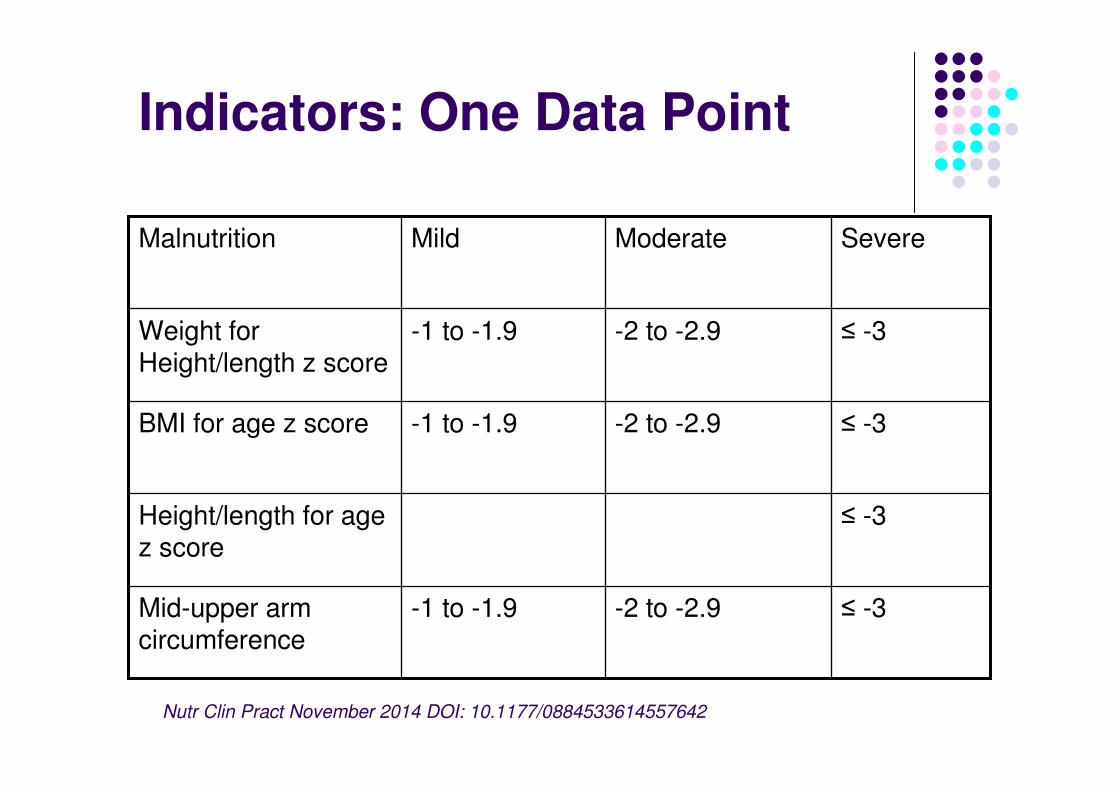
Indicators: One Data Point
≤ -3-2 to -2.9-1 to -1.9Mid-upper arm circumference
≤ -3Height/length for age z score
≤ -3-2 to -2.9-1 to -1.9BMI for age z score
≤ -3-2 to -2.9-1 to -1.9Weight for Height/length z score
SevereModerateMildMalnutrition
Nutr Clin Pract November 2014 DOI: 10.1177/0884533614557642
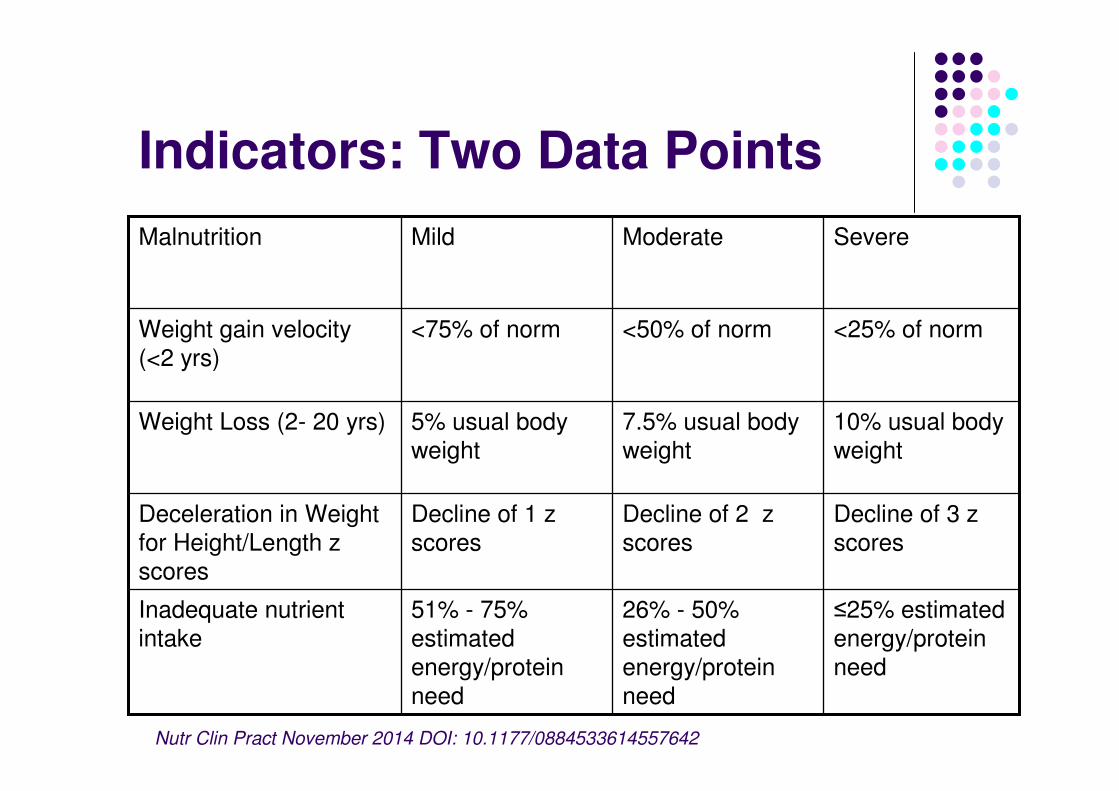
Indicators: Two Data Points
≤25% estimated
energy/protein
need
26% - 50%
estimated
energy/protein
need
51% - 75%
estimated
energy/protein
need
Inadequate nutrient
intake
Decline of 3 z
scores
Decline of 2 z
scores
Decline of 1 z
scores
Deceleration in Weight
for Height/Length z
scores
10% usual body
weight
7.5% usual body
weight
5% usual body
weight
Weight Loss (2- 20 yrs)
<25% of norm<50% of norm<75% of normWeight gain velocity
(<2 yrs)
SevereModerate Mild Malnutrition
Nutr Clin Pract November 2014 DOI: 10.1177/0884533614557642
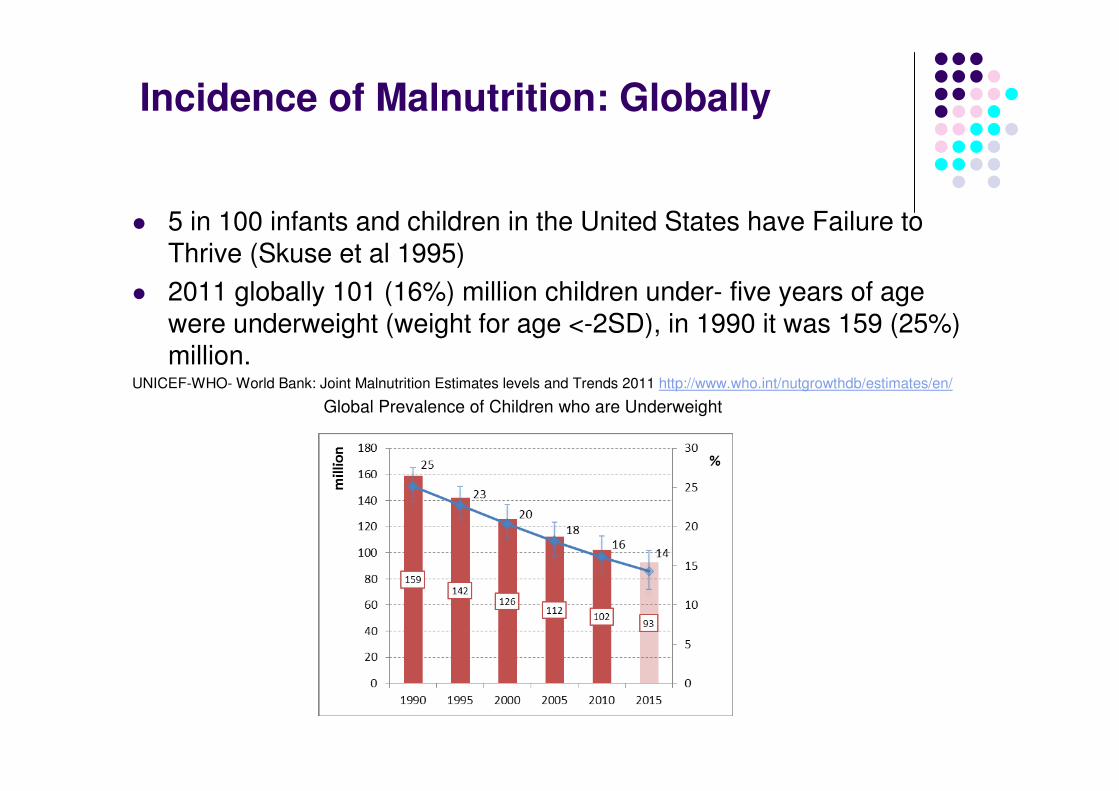
Incidence of Malnutrition: Globally
� 5 in 100 infants and children in the United States have Failure to Thrive (Skuse et al 1995)
� 2011 globally 101 (16%) million children under- five years of age were underweight (weight for age <-2SD), in 1990 it was 159 (25%) million.
UNICEF-WHO- World Bank: Joint Malnutrition Estimates levels and Trends 2011 http://www.who.int/nutgrowthdb/estimates/en/
Global Prevalence of Children who are Underweight
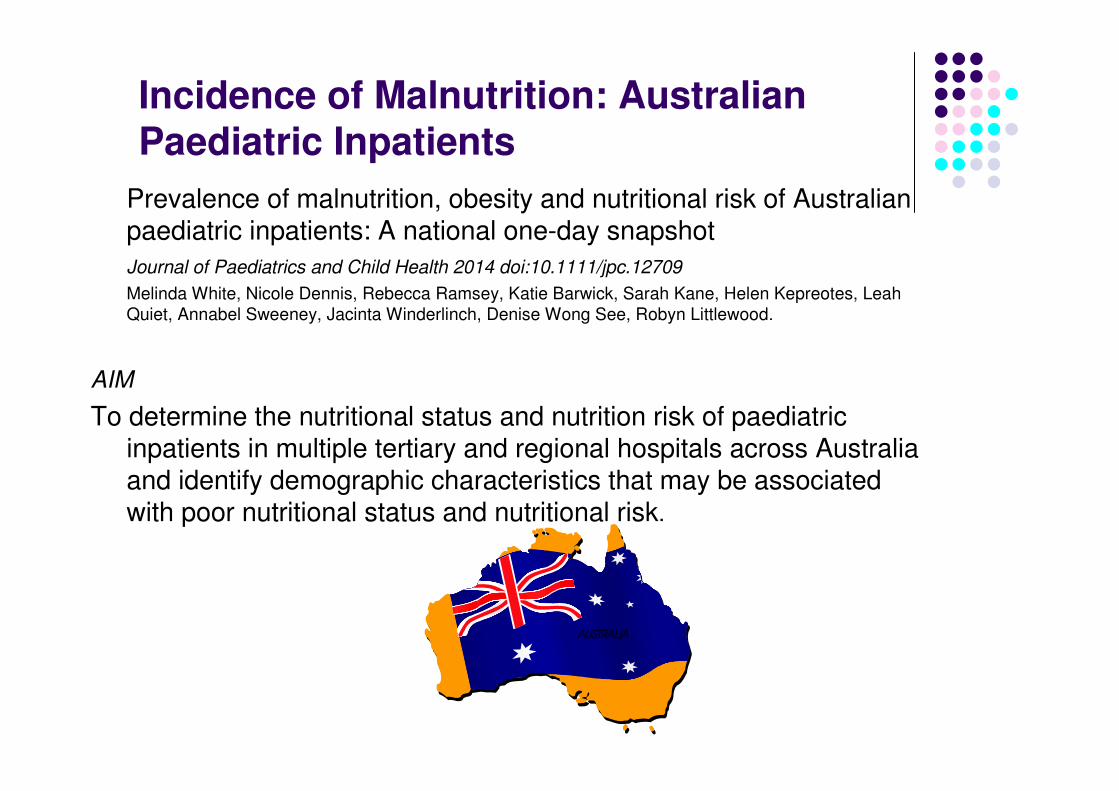
Incidence of Malnutrition: Australian Paediatric Inpatients
Prevalence of malnutrition, obesity and nutritional risk of Australian paediatric inpatients: A national one-day snapshot
Journal of Paediatrics and Child Health 2014 doi:10.1111/jpc.12709
Melinda White, Nicole Dennis, Rebecca Ramsey, Katie Barwick, Sarah Kane, Helen Kepreotes, Leah
Quiet, Annabel Sweeney, Jacinta Winderlinch, Denise Wong See, Robyn Littlewood.
AIM
To determine the nutritional status and nutrition risk of paediatric inpatients in multiple tertiary and regional hospitals across Australia and identify demographic characteristics that may be associated with poor nutritional status and nutritional risk.

Study Design: One Day Snapshot10:00am, Thursday the 7th March, 2013
16 hospitals collected data on every paediatric inpatient in the hospital at 1000, local time.
8 tertiary and 8 regional
� Royal Children’s Hospital, Brisbane� Children’s Hospital at Westmead, Sydney� Princess Margaret Hospital, Perth� Alice Springs Hospital, Alice Springs� Nambour General Hospital, Nambour� Canberra Hospital, Canberra� Women and Children’s Health Network, Adelaide� Mater Children’s Hospital, Brisbane� Royal Darwin Hospital, Darwin� Sydney Children’s Hospital, Sydney� Cairns Base Hospital, Cairns� Townsville Hospital, Townsville� Joondalup Health Campus, Joondalup� John Hunter Children’s, Newcastle� Monash Children’s Hospital, Melbourne� Royal Hobart Hospital, Tasmania
Methods
� Data collected for all inpatients included:� Date of birth� Gestational age� Gender� ATSI status� Primary diagnosis� Reason for admission� Exclusion criteria
� Weight� Length/Height/Knee Height� BMI� Z scores � Paediatric Yorkhill Malnutrition Score (PYMS)
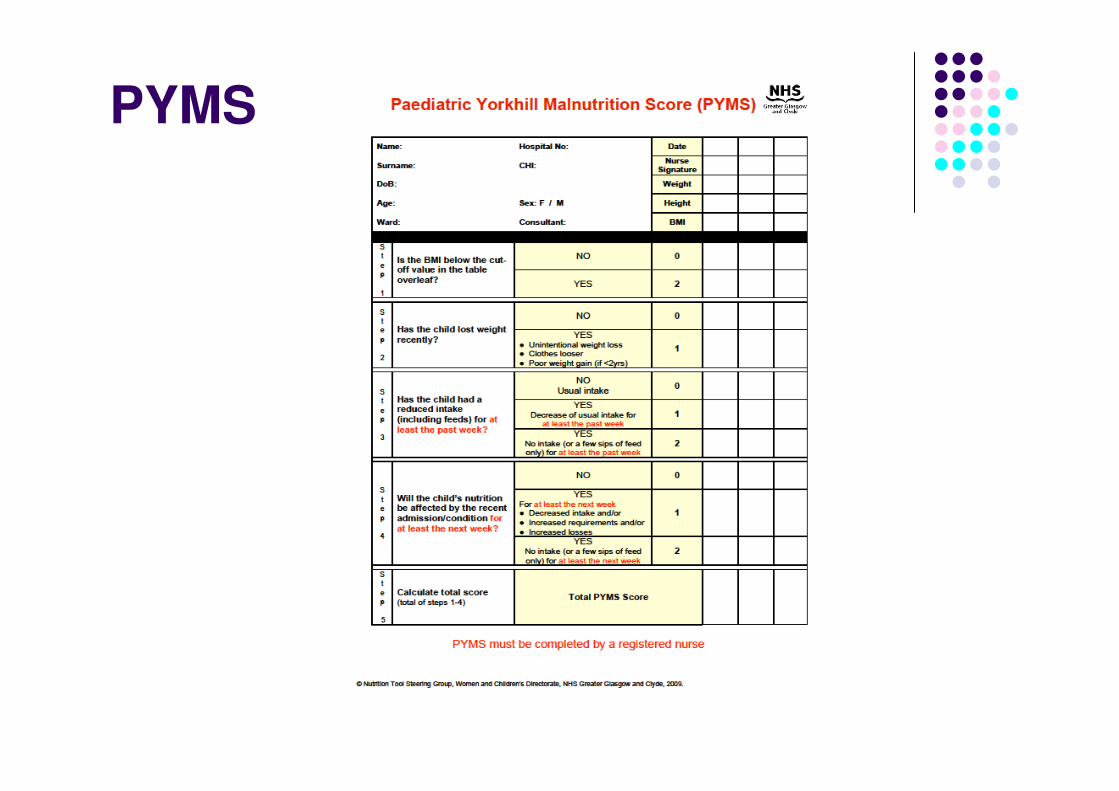
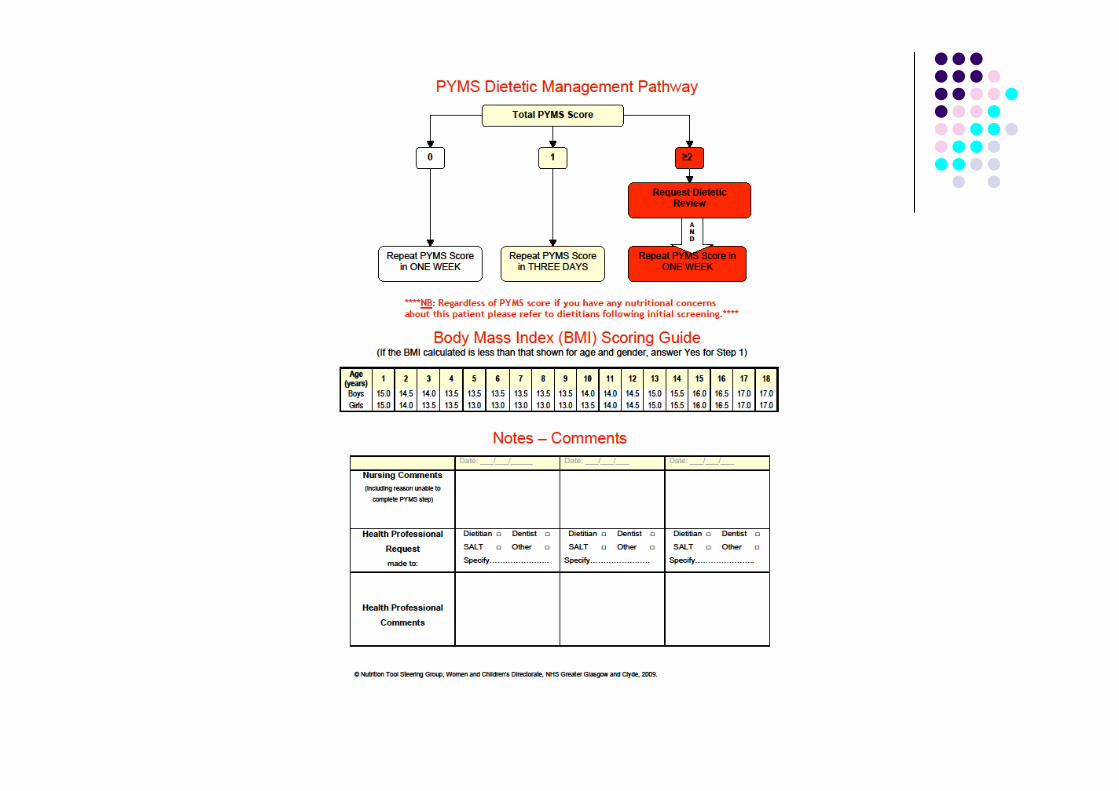
PYMS
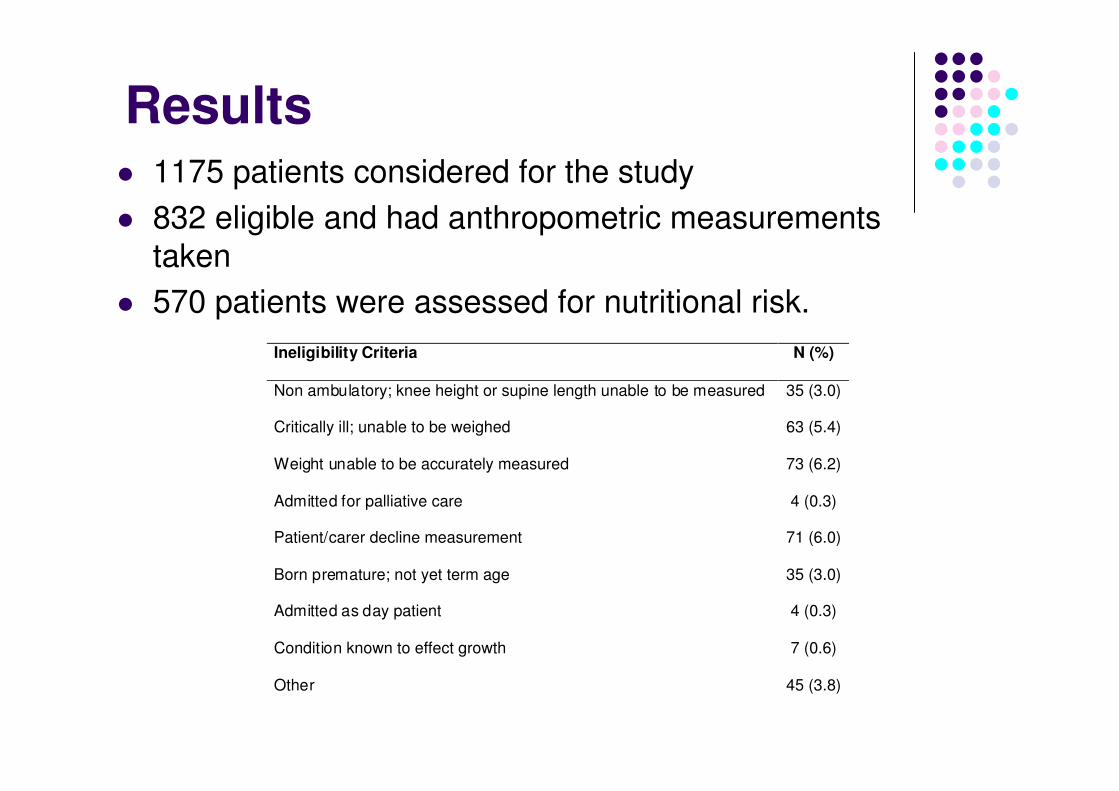
Results� 1175 patients considered for the study
� 832 eligible and had anthropometric measurements
taken
� 570 patients were assessed for nutritional risk.
Ineligibility Criteria N (%)
Non ambulatory; knee height or supine length unable to be measured 35 (3.0)
Critically ill; unable to be weighed 63 (5.4)
Weight unable to be accurately measured 73 (6.2)
Admitted for palliative care 4 (0.3)
Patient/carer decline measurement 71 (6.0)
Born premature; not yet term age 35 (3.0)
Admitted as day patient 4 (0.3)
Condition known to effect growth 7 (0.6)
Other 45 (3.8)
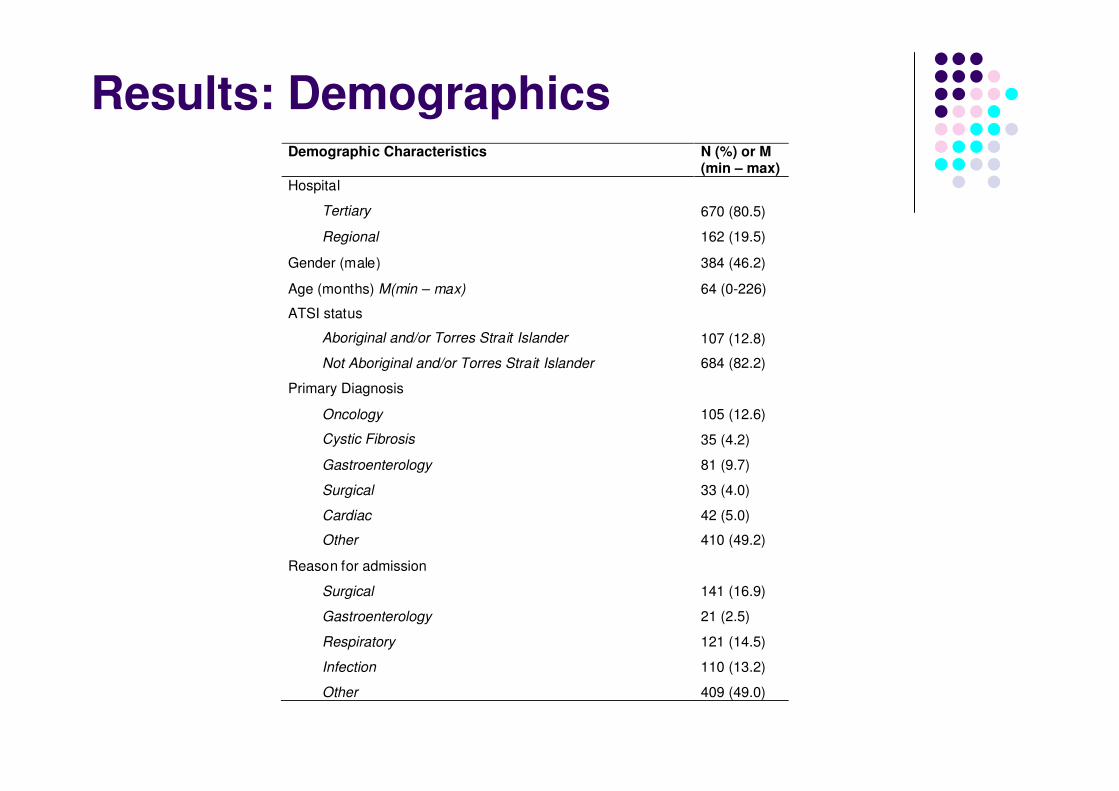
Results: DemographicsDemographic Characteristics N (%) or M
(min – max)
Hospital
Tertiary 670 (80.5)
Regional 162 (19.5)
Gender (male) 384 (46.2)
Age (months) M(min – max) 64 (0-226)
ATSI status
Aboriginal and/or Torres Strait Islander 107 (12.8)
Not Aboriginal and/or Torres Strait Islander 684 (82.2)
Primary Diagnosis
Oncology 105 (12.6)
Cystic Fibrosis 35 (4.2)
Gastroenterology 81 (9.7)
Surgical 33 (4.0)
Cardiac 42 (5.0)
Other 410 (49.2)
Reason for admission
Surgical 141 (16.9)
Gastroenterology 21 (2.5)
Respiratory 121 (14.5)
Infection 110 (13.2)
Other 409 (49.0)
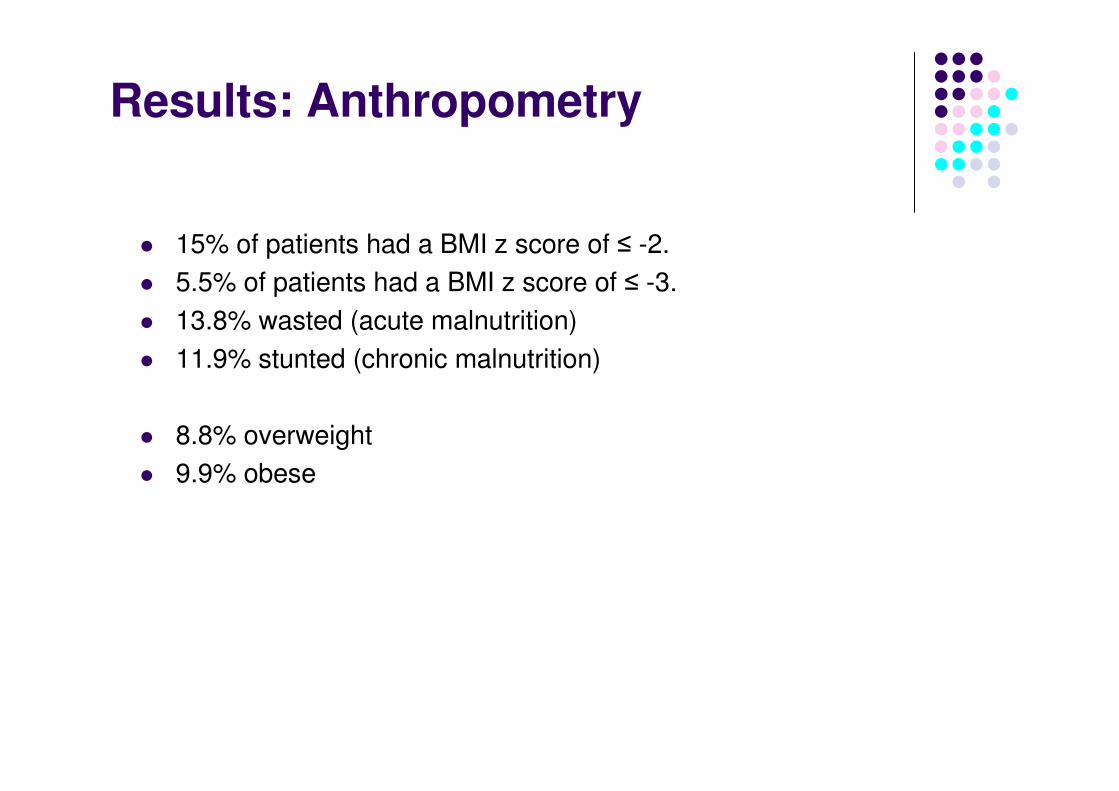
Results: Anthropometry
� 15% of patients had a BMI z score of ≤ -2.
� 5.5% of patients had a BMI z score of ≤ -3.
� 13.8% wasted (acute malnutrition)
� 11.9% stunted (chronic malnutrition)
� 8.8% overweight
� 9.9% obese
Results
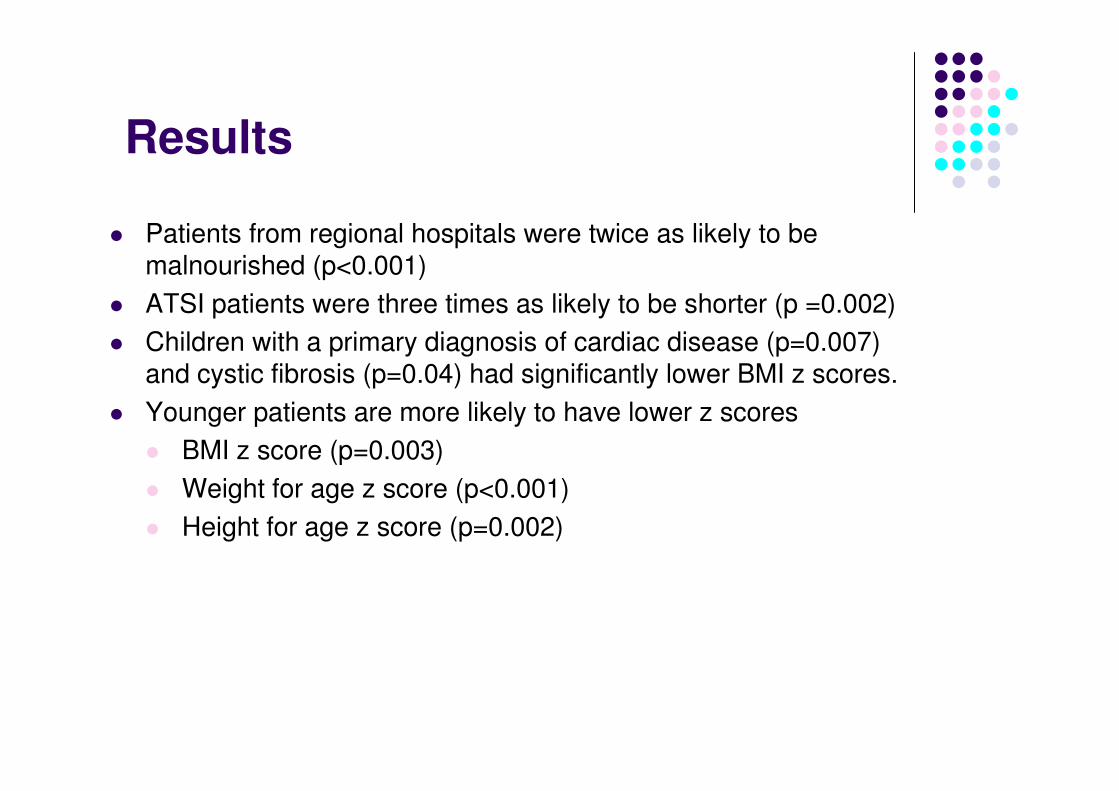
� Patients from regional hospitals were twice as likely to be malnourished (p<0.001)
� ATSI patients were three times as likely to be shorter (p =0.002)
� Children with a primary diagnosis of cardiac disease (p=0.007) and cystic fibrosis (p=0.04) had significantly lower BMI z scores.
� Younger patients are more likely to have lower z scores
� BMI z score (p=0.003)
� Weight for age z score (p<0.001)
� Height for age z score (p=0.002)
Results: Nutrition Risk
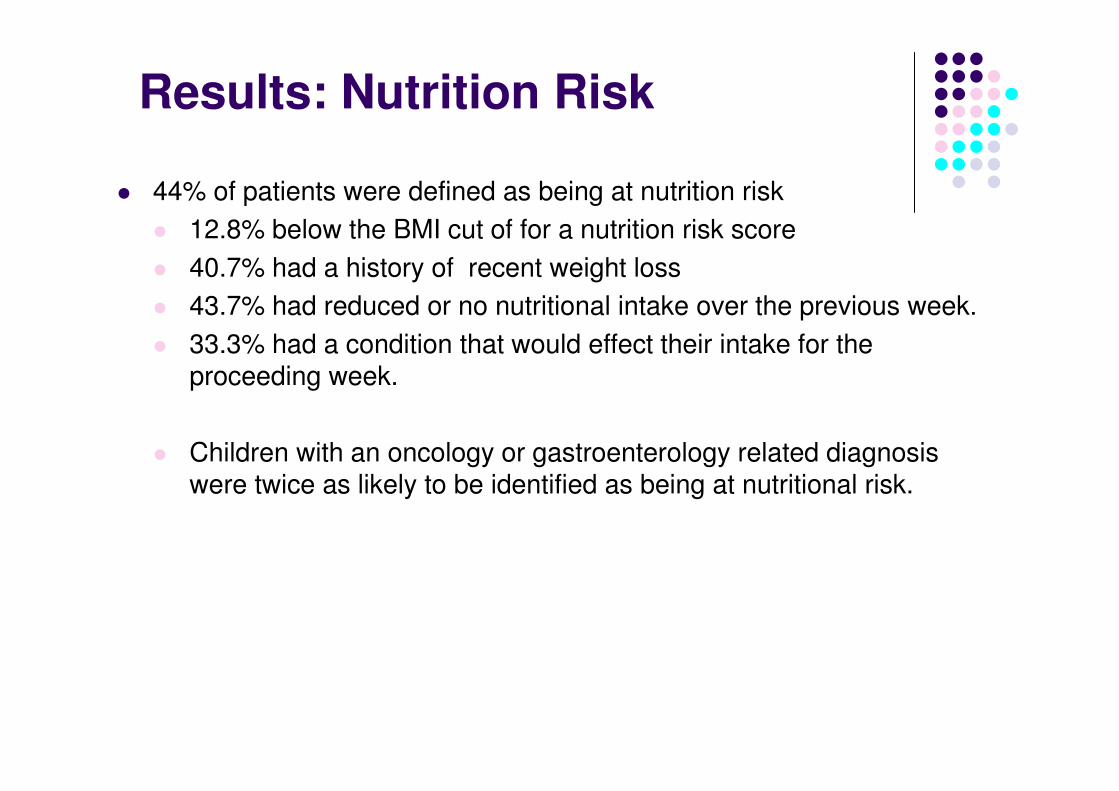
� 44% of patients were defined as being at nutrition risk
� 12.8% below the BMI cut of for a nutrition risk score
� 40.7% had a history of recent weight loss
� 43.7% had reduced or no nutritional intake over the previous week.
� 33.3% had a condition that would effect their intake for the proceeding week.
� Children with an oncology or gastroenterology related diagnosis were twice as likely to be identified as being at nutritional risk.
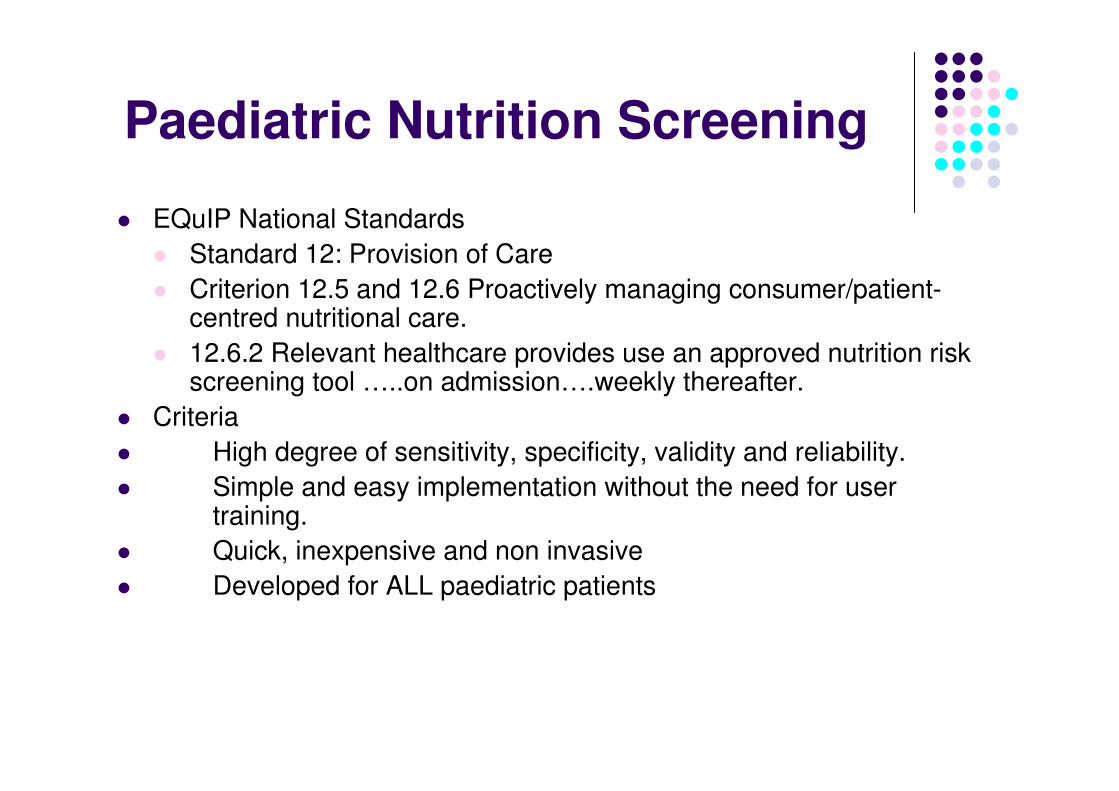
Paediatric Nutrition Screening
� EQuIP National Standards
� Standard 12: Provision of Care
� Criterion 12.5 and 12.6 Proactively managing consumer/patient-centred nutritional care.
� 12.6.2 Relevant healthcare provides use an approved nutrition risk screening tool …..on admission….weekly thereafter.
� Criteria
� High degree of sensitivity, specificity, validity and reliability.
� Simple and easy implementation without the need for user training.
� Quick, inexpensive and non invasive
� Developed for ALL paediatric patients
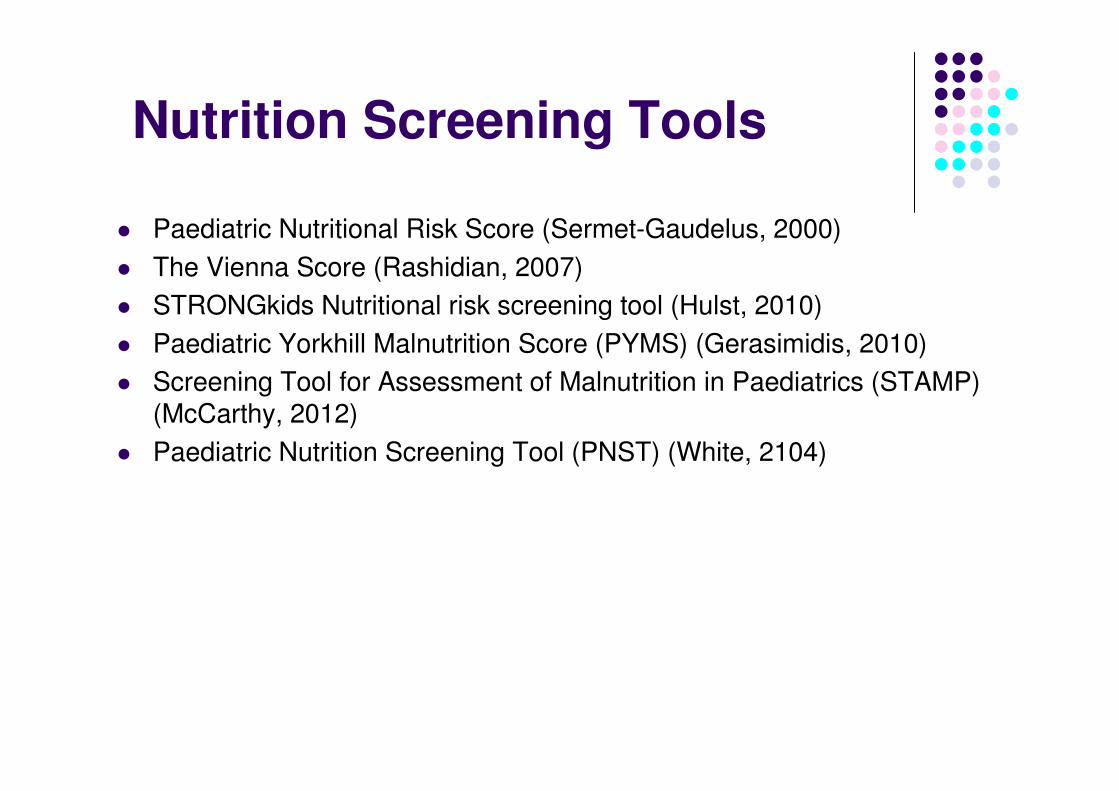
Nutrition Screening Tools
� Paediatric Nutritional Risk Score (Sermet-Gaudelus, 2000)
� The Vienna Score (Rashidian, 2007)
� STRONGkids Nutritional risk screening tool (Hulst, 2010)
� Paediatric Yorkhill Malnutrition Score (PYMS) (Gerasimidis, 2010)
� Screening Tool for Assessment of Malnutrition in Paediatrics (STAMP) (McCarthy, 2012)
� Paediatric Nutrition Screening Tool (PNST) (White, 2104)
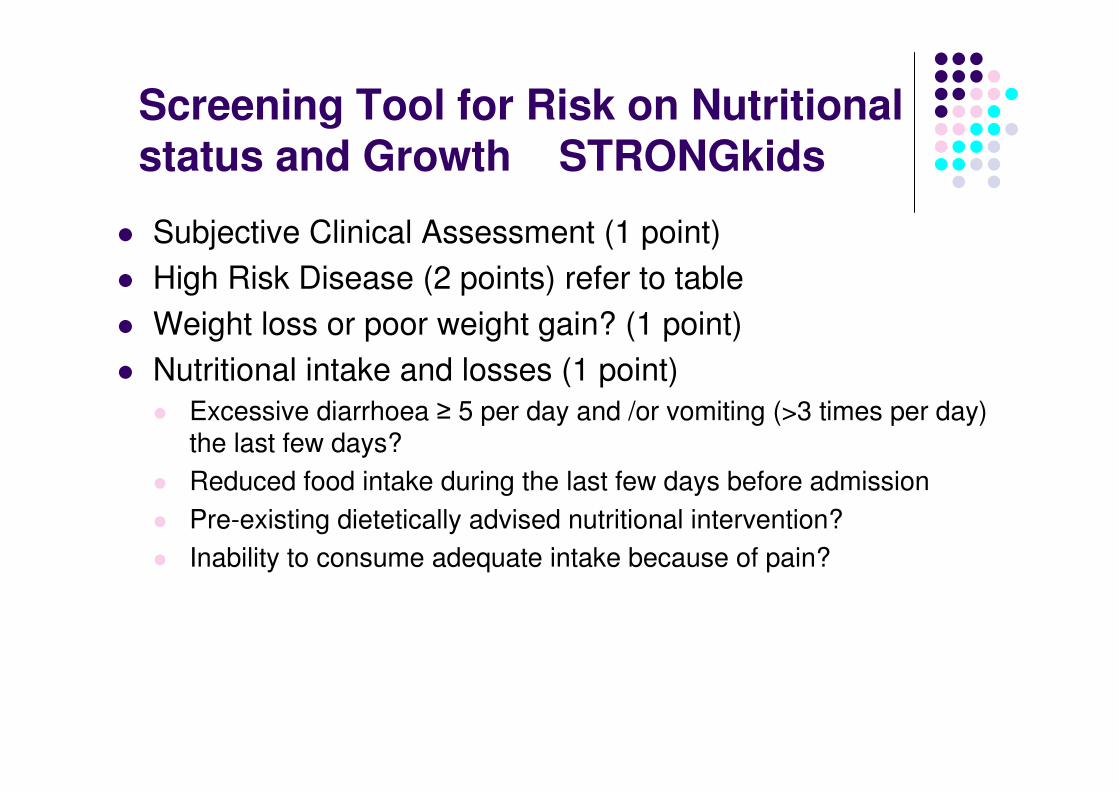
Screening Tool for Risk on Nutritional status and Growth STRONGkids
� Subjective Clinical Assessment (1 point)
� High Risk Disease (2 points) refer to table
� Weight loss or poor weight gain? (1 point)
� Nutritional intake and losses (1 point)
� Excessive diarrhoea ≥ 5 per day and /or vomiting (>3 times per day) the last few days?
� Reduced food intake during the last few days before admission
� Pre-existing dietetically advised nutritional intervention?
� Inability to consume adequate intake because of pain?
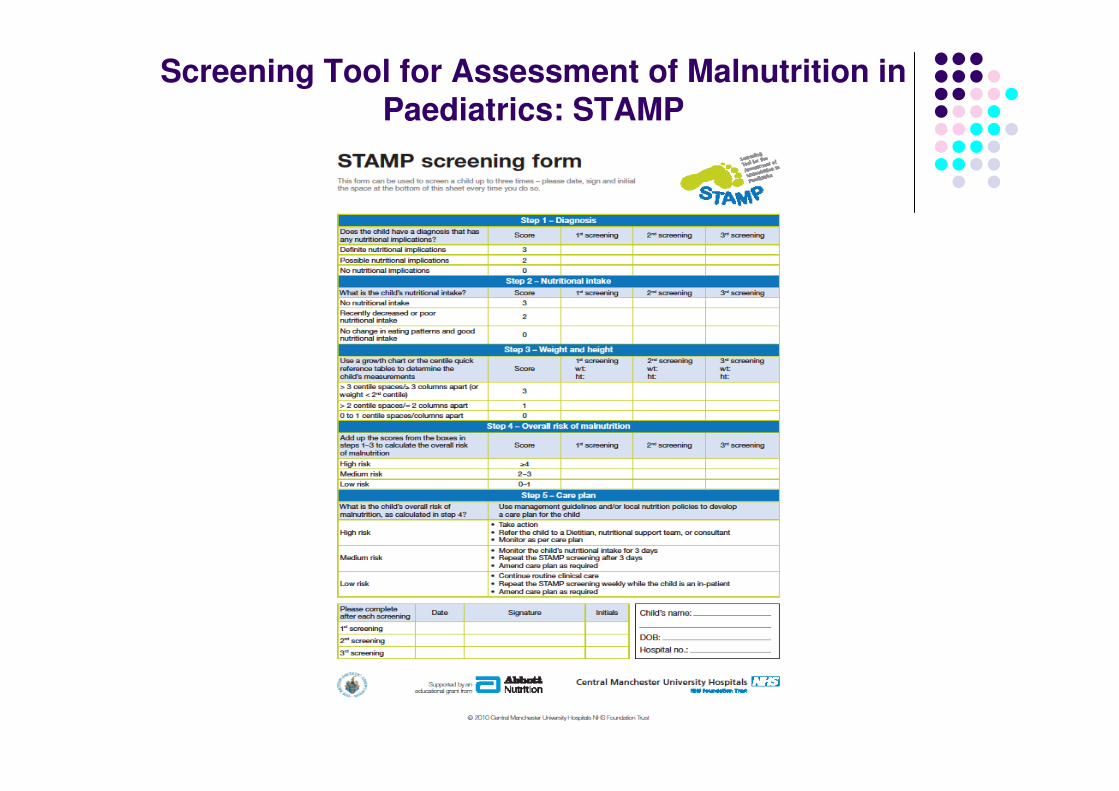
Screening Tool for Assessment of Malnutrition inPaediatrics: STAMP
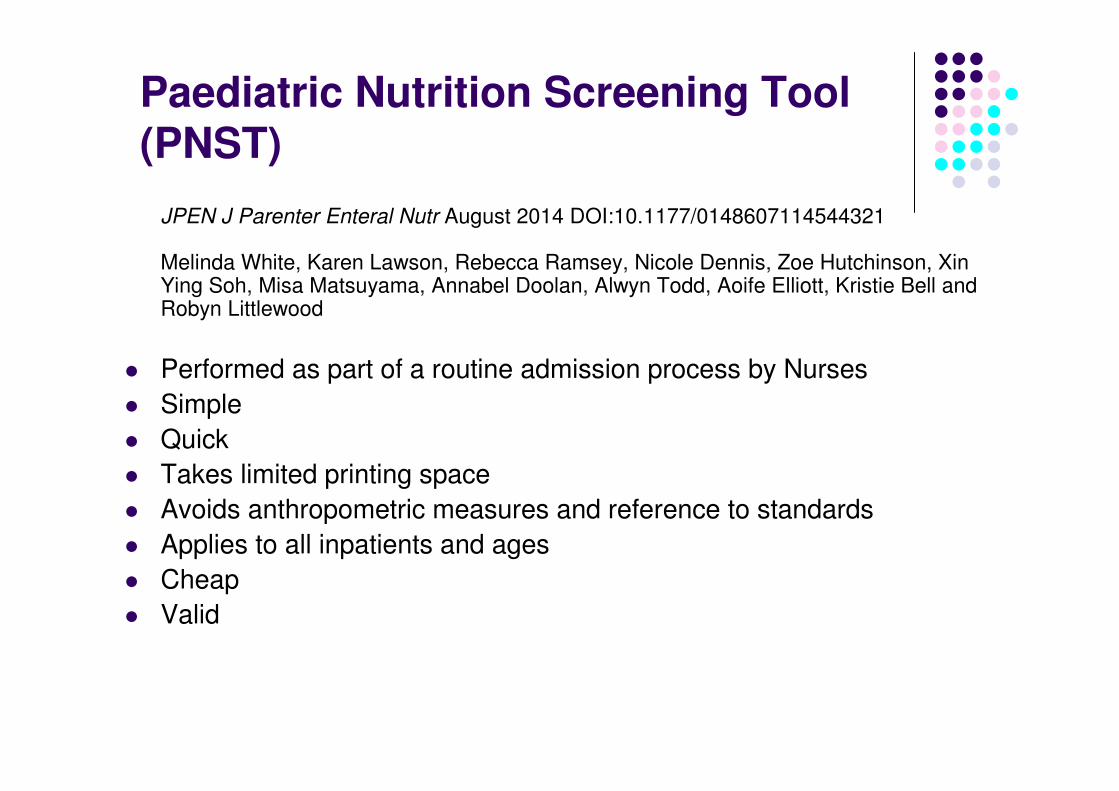
Paediatric Nutrition Screening Tool (PNST)
JPEN J Parenter Enteral Nutr August 2014 DOI:10.1177/0148607114544321
Melinda White, Karen Lawson, Rebecca Ramsey, Nicole Dennis, Zoe Hutchinson, Xin Ying Soh, Misa Matsuyama, Annabel Doolan, Alwyn Todd, Aoife Elliott, Kristie Bell and Robyn Littlewood
� Performed as part of a routine admission process by Nurses
� Simple
� Quick
� Takes limited printing space
� Avoids anthropometric measures and reference to standards
� Applies to all inpatients and ages
� Cheap
� Valid
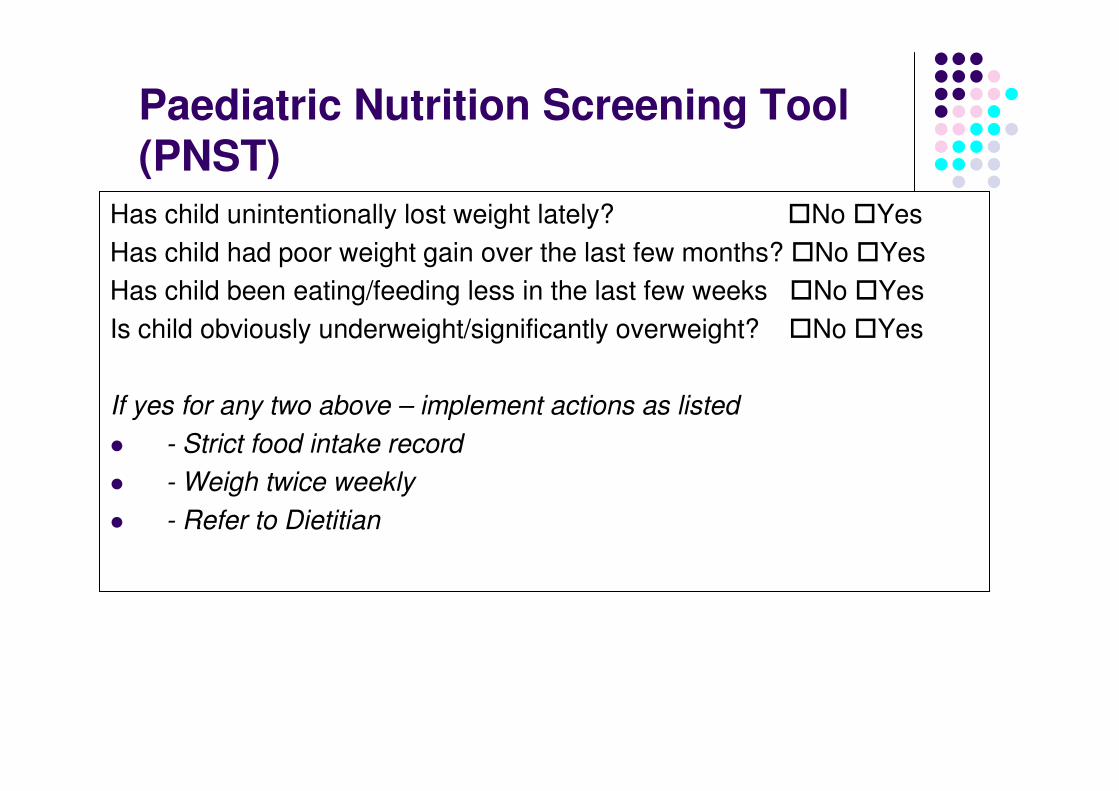
Paediatric Nutrition Screening Tool (PNST)
Has child unintentionally lost weight lately? �No �Yes
Has child had poor weight gain over the last few months? �No �Yes
Has child been eating/feeding less in the last few weeks �No �Yes
Is child obviously underweight/significantly overweight? �No �Yes
If yes for any two above – implement actions as listed
� - Strict food intake record
� - Weigh twice weekly
� - Refer to Dietitian
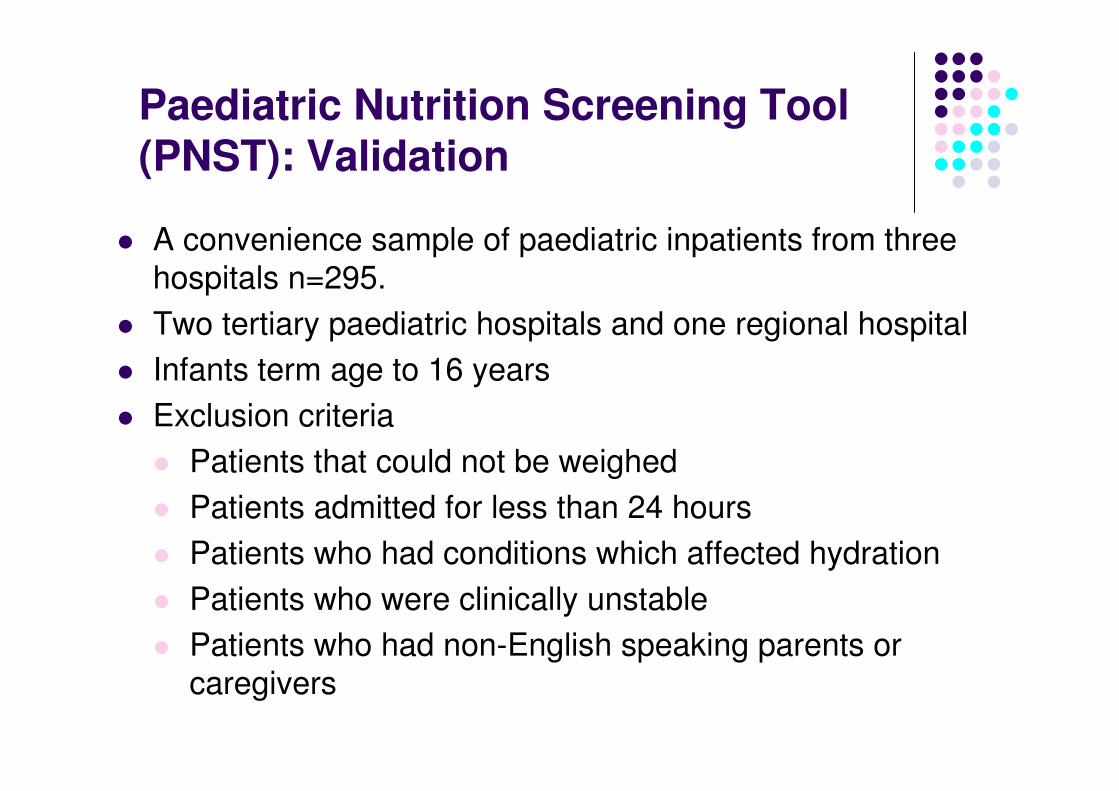
Paediatric Nutrition Screening Tool (PNST): Validation
� A convenience sample of paediatric inpatients from three
hospitals n=295.
� Two tertiary paediatric hospitals and one regional hospital
� Infants term age to 16 years
� Exclusion criteria
� Patients that could not be weighed
� Patients admitted for less than 24 hours
� Patients who had conditions which affected hydration
� Patients who were clinically unstable
� Patients who had non-English speaking parents or
caregivers
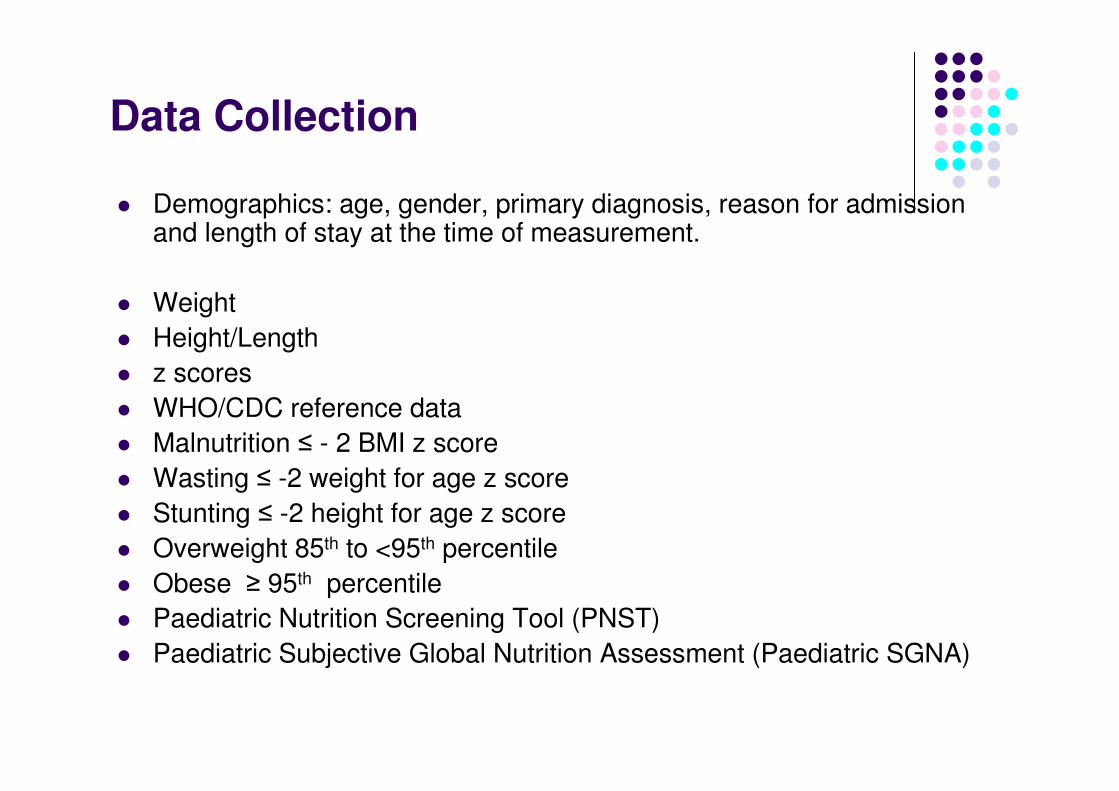
Data Collection
� Demographics: age, gender, primary diagnosis, reason for admission and length of stay at the time of measurement.
� Weight
� Height/Length
� z scores
� WHO/CDC reference data
� Malnutrition ≤ - 2 BMI z score
� Wasting ≤ -2 weight for age z score
� Stunting ≤ -2 height for age z score
� Overweight 85th to <95th percentile
� Obese ≥ 95th percentile
� Paediatric Nutrition Screening Tool (PNST)
� Paediatric Subjective Global Nutrition Assessment (Paediatric SGNA)
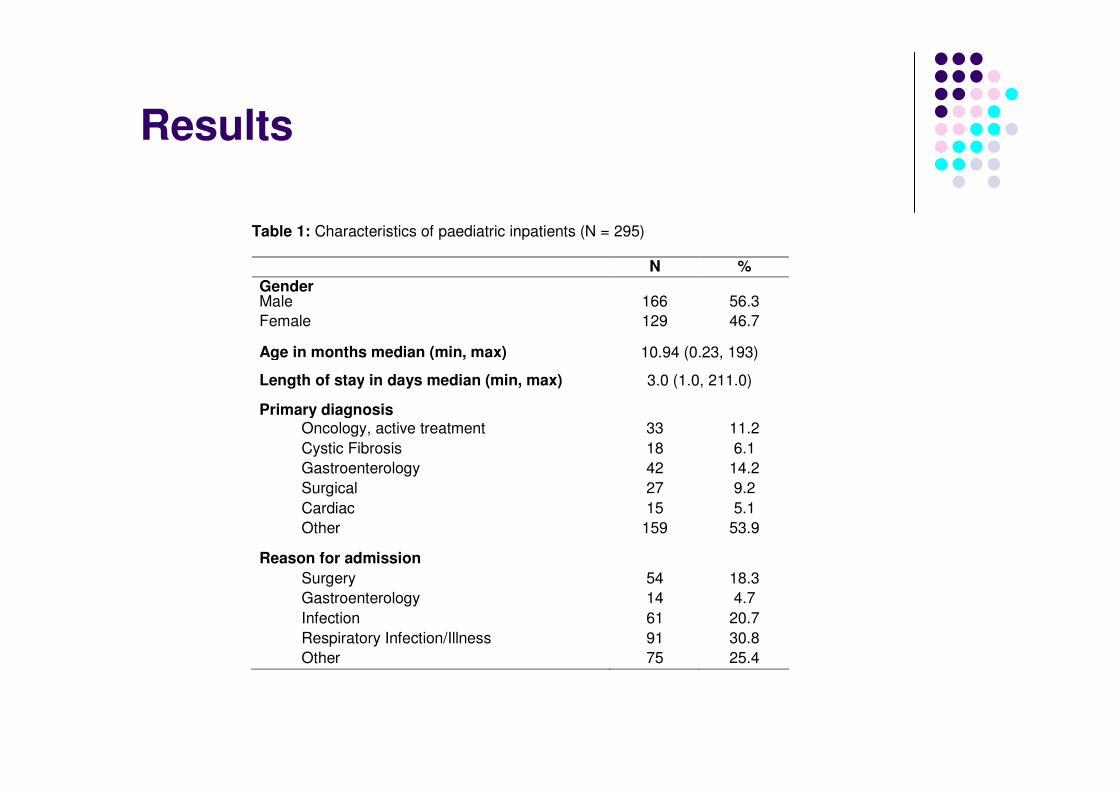
Results
Table 1: Characteristics of paediatric inpatients (N = 295)
N %
Gender Male 166 56.3
Female 129 46.7
Age in months median (min, max) 10.94 (0.23, 193)
Length of stay in days median (min, max) 3.0 (1.0, 211.0)
Primary diagnosis Oncology, active treatment 33 11.2
Cystic Fibrosis 18 6.1
Gastroenterology 42 14.2
Surgical 27 9.2
Cardiac 15 5.1
Other 159 53.9
Reason for admission
Surgery 54 18.3
Gastroenterology 14 4.7
Infection 61 20.7
Respiratory Infection/Illness 91 30.8
Other 75 25.4
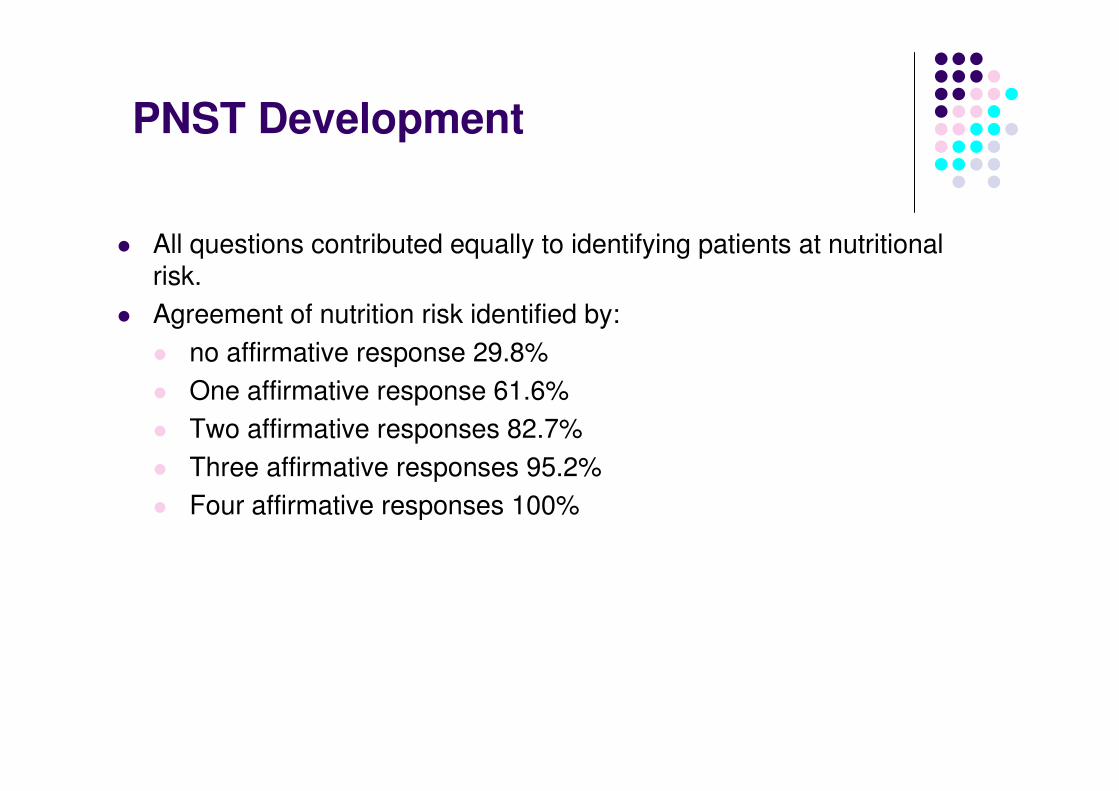
PNST Development
� All questions contributed equally to identifying patients at nutritional risk.
� Agreement of nutrition risk identified by:
� no affirmative response 29.8%
� One affirmative response 61.6%
� Two affirmative responses 82.7%
� Three affirmative responses 95.2%
� Four affirmative responses 100%
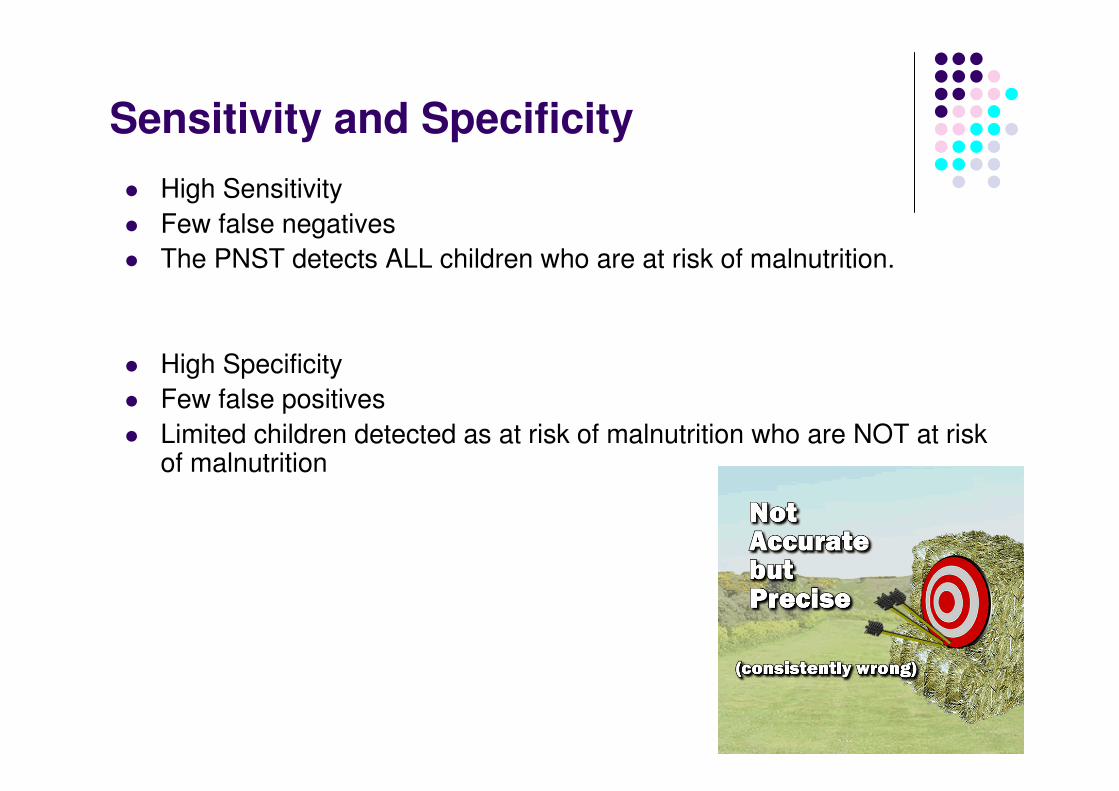
Sensitivity and Specificity
� High Sensitivity
� Few false negatives
� The PNST detects ALL children who are at risk of malnutrition.
� High Specificity
� Few false positives
� Limited children detected as at risk of malnutrition who are NOT at risk of malnutrition
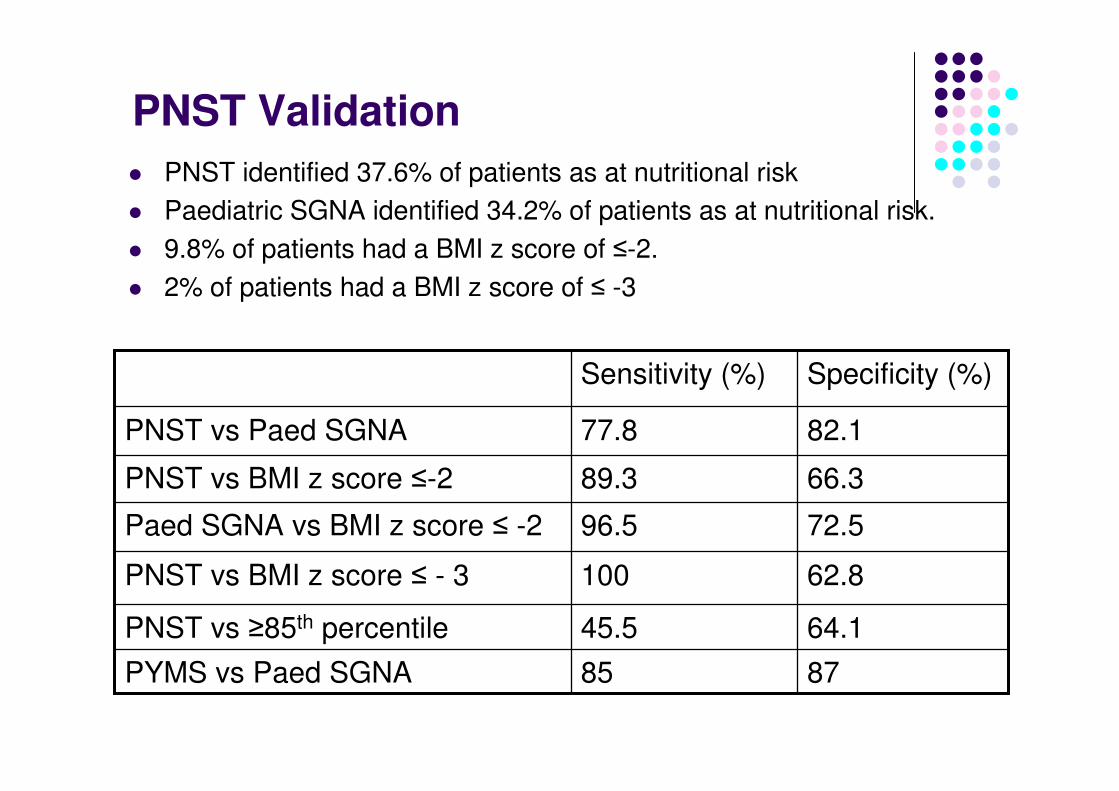
PNST Validation
� PNST identified 37.6% of patients as at nutritional risk
� Paediatric SGNA identified 34.2% of patients as at nutritional risk.
� 9.8% of patients had a BMI z score of ≤-2.
� 2% of patients had a BMI z score of ≤ -3
64.145.5PNST vs ≥85th percentile
8785PYMS vs Paed SGNA
62.8100PNST vs BMI z score ≤ - 3
72.596.5Paed SGNA vs BMI z score ≤ -2
66.389.3PNST vs BMI z score ≤-2
82.177.8PNST vs Paed SGNA
Specificity (%)Sensitivity (%)
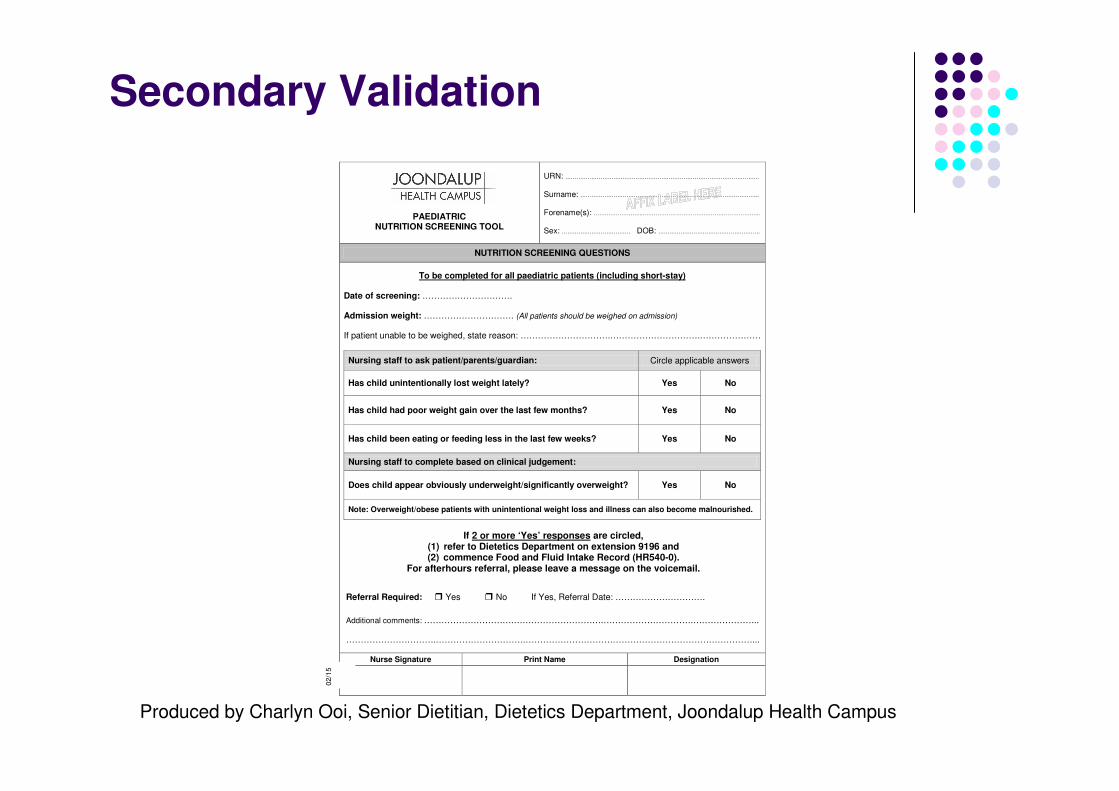
Secondary Validation
PAEDIATRIC NUTRITION SCREENING TOOL
URN: ………………………….……………………………………………………………….. Surname: ………………….………………………………………………………………... Forename(s): ……………………...…………………………….………………………... Sex: ………………………………. DOB: ……………………………………………….
NUTRITION SCREENING QUESTIONS
To be completed for all paediatric patients (including short-stay) Date of screening: …………………………. Admission weight: …………………………. (All patients should be weighed on admission)
If patient unable to be weighed, state reason: ………………………….………………………….…………………
Nursing staff to ask patient/parents/guardian: Circle applicable answers
Has child unintentionally lost weight lately? Yes No
Has child had poor weight gain over the last few months? Yes No
Has child been eating or feeding less in the last few weeks? Yes No
Nursing staff to complete based on clinical judgement:
Does child appear obviously underweight/significantly overweight? Yes No
Note: Overweight/obese patients with unintentional weight loss and illness can also become malnourished.
If 2 or more ‘Yes’ responses are circled, (1) refer to Dietetics Department on extension 9196 and (2) commence Food and Fluid Intake Record (HR540-0).
For afterhours referral, please leave a message on the voicemail.
Referral Required: � Yes � No If Yes, Referral Date: ………………………….
Additional comments: ………………………….………………………….………………………….…………………..
………………………….………………………….……………………………………………………………………...
Nurse Signature Print Name Designation
02
/15
Produced by Charlyn Ooi, Senior Dietitian, Dietetics Department, Joondalup Health Campus
Assessment for Malnutrition
Paediatric subjective global nutritional assessment (PSGNA).
Secker DJ and Jeejeebhoy KN. How to perform Subjective Global Nutritional Assessment in Children. J Acad Nutr Diet. 2012;112(3)424-431.
� Historical, symptomatic and physical parameters� Validated in identifying malnutrition and the risk of malnutrition in
paediatric surgical patients (Secker and Jeejeebhoy, 2007)
� Independently validated to identify malnourished children and those at risk of longer hospital stay (Mahdavi and Safaiyan, 2009; Gerasimidis et al 2010)
� Subjective� Experience helps (being familiar with healthy children)� Physical assessment� Do not need to fill in all of the sections� Gives an over ranking normal, moderate and severe
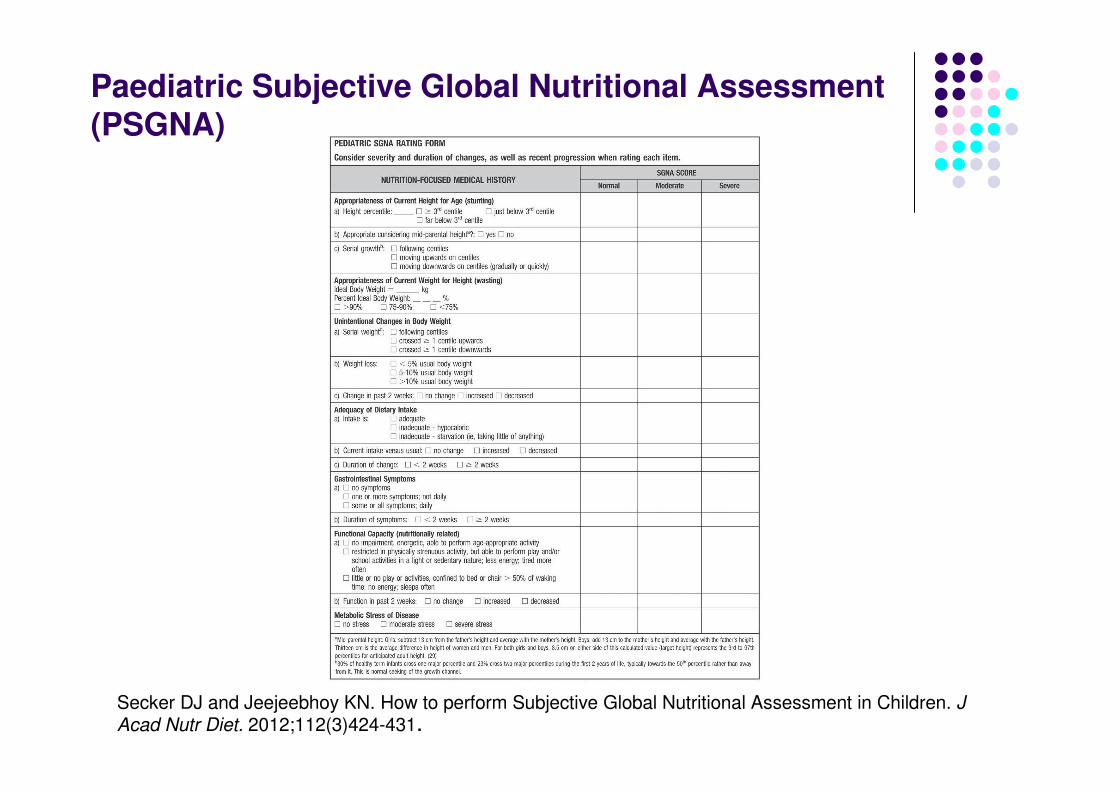
Paediatric Subjective Global Nutritional Assessment (PSGNA)
Secker DJ and Jeejeebhoy KN. How to perform Subjective Global Nutritional Assessment in Children. J Acad Nutr Diet. 2012;112(3)424-431.
Secker DJ and Jeejeebhoy KN. How to perform Subjective Global Nutritional Assessment in Children. J Acad Nutr Diet. 2012;112(3)424-431.
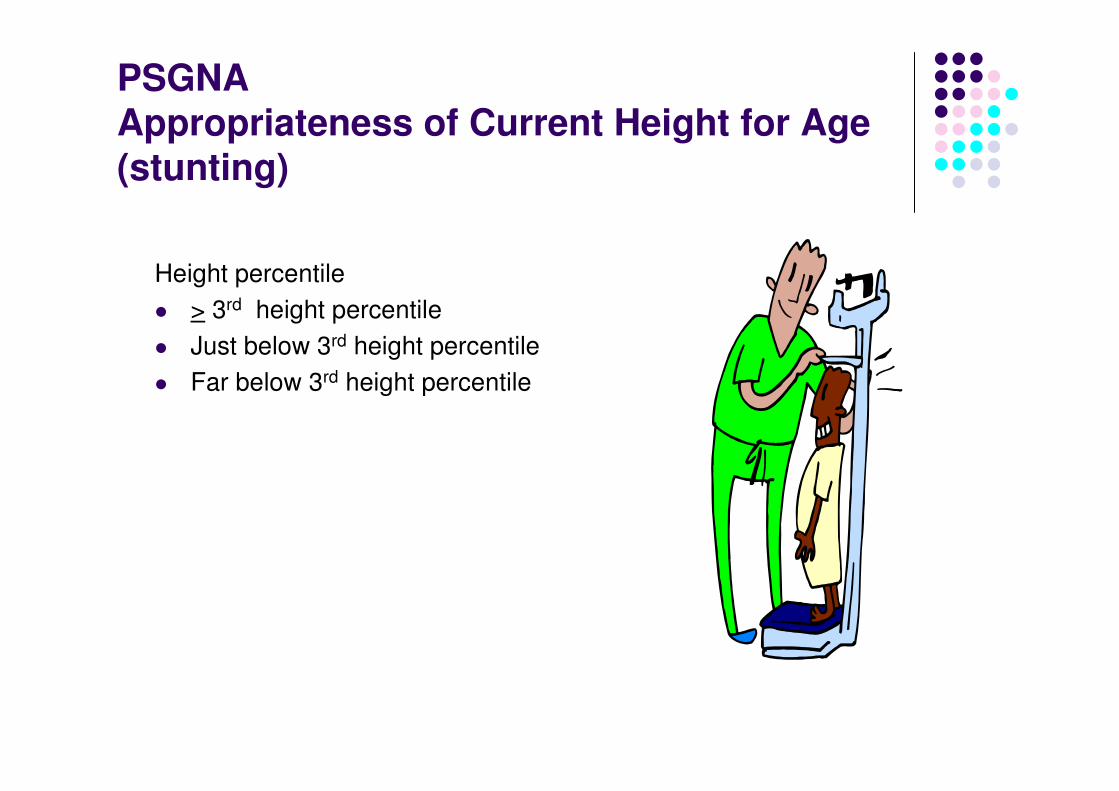
PSGNAAppropriateness of Current Height for Age (stunting)
Height percentile
� > 3rd height percentile
� Just below 3rd height percentile
� Far below 3rd height percentile
PSGNAHeight appropriate considering mid parental height
To determine mid parental height
• Assumes an average of 13cm difference between adult male and adult female height.
For girls
� Subtract 13cm from the father’s height
� Average with the mother’s height
For boys
� Add 13cm to the mother’s height
� Average with the father’s height
Calculate the percentiles for anticipated adult height• 8.5cm either side of mid parental height (at 18 years on the CDC or WHO
growth charts)• Plot both values on growth chart to determine the anticipated upper and
lower limits for the child’s genetic growth potential
• Is the child’s height within these percentiles?
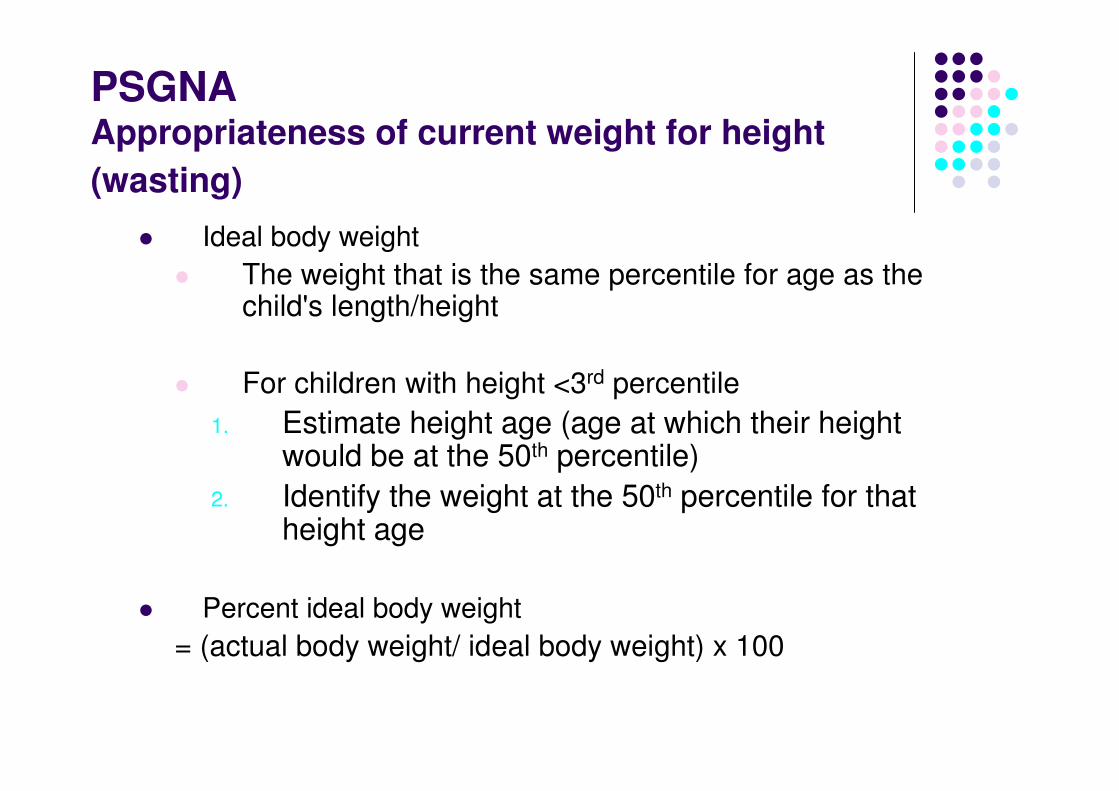
PSGNAAppropriateness of current weight for height
(wasting)
� Ideal body weight
� The weight that is the same percentile for age as the child's length/height
� For children with height <3rd percentile
1. Estimate height age (age at which their height would be at the 50th percentile)
2. Identify the weight at the 50th percentile for that height age
� Percent ideal body weight
= (actual body weight/ ideal body weight) x 100
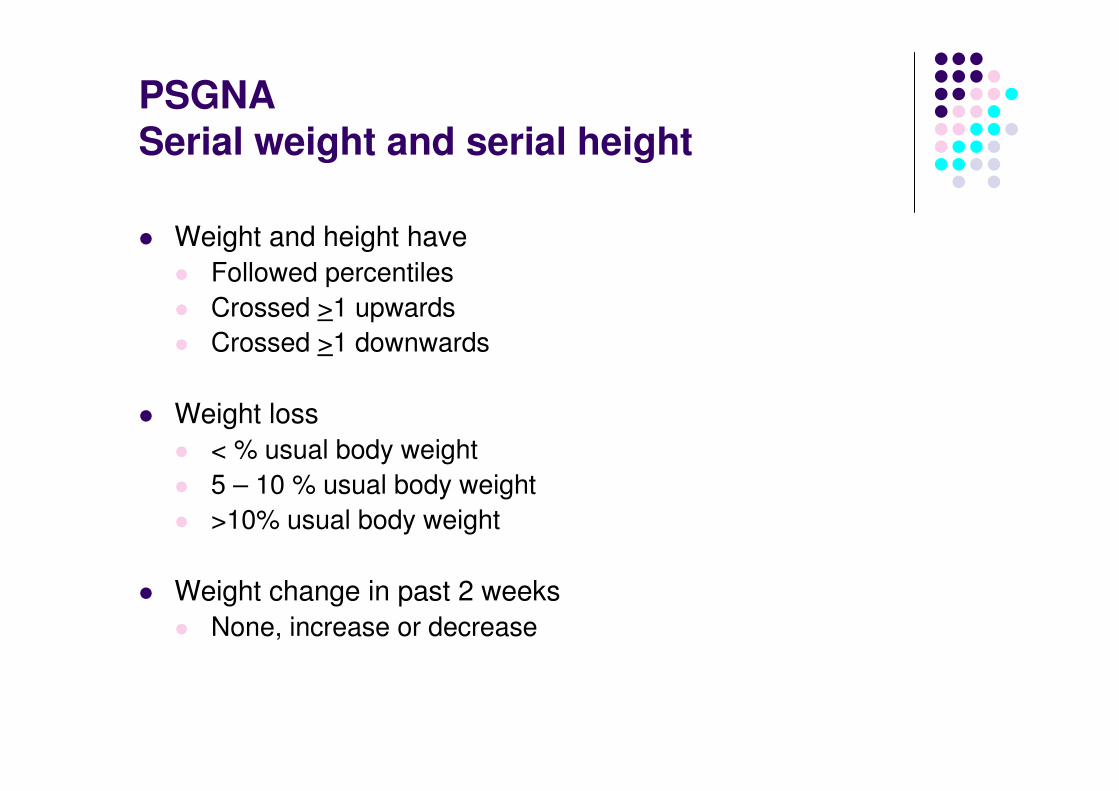
PSGNASerial weight and serial height
� Weight and height have
� Followed percentiles
� Crossed >1 upwards
� Crossed >1 downwards
� Weight loss
� < % usual body weight
� 5 – 10 % usual body weight
� >10% usual body weight
� Weight change in past 2 weeks
� None, increase or decrease
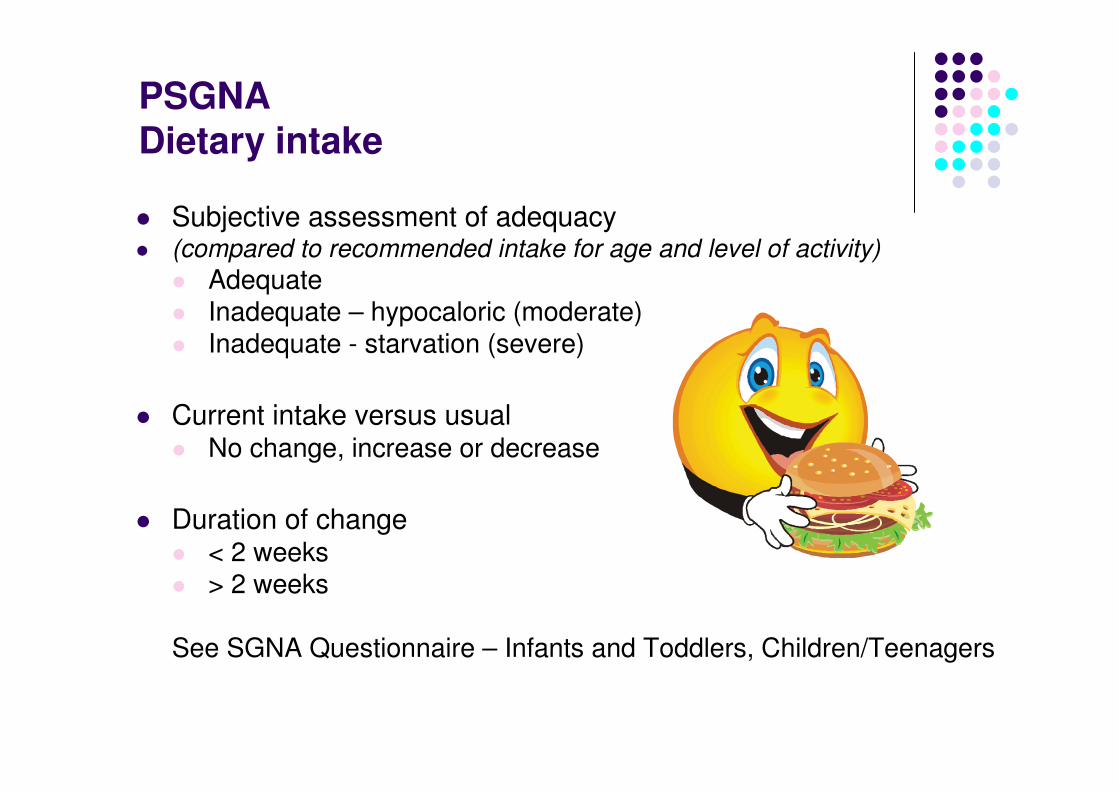
PSGNADietary intake
� Subjective assessment of adequacy � (compared to recommended intake for age and level of activity)
� Adequate� Inadequate – hypocaloric (moderate)� Inadequate - starvation (severe)
� Current intake versus usual� No change, increase or decrease
� Duration of change� < 2 weeks � > 2 weeks
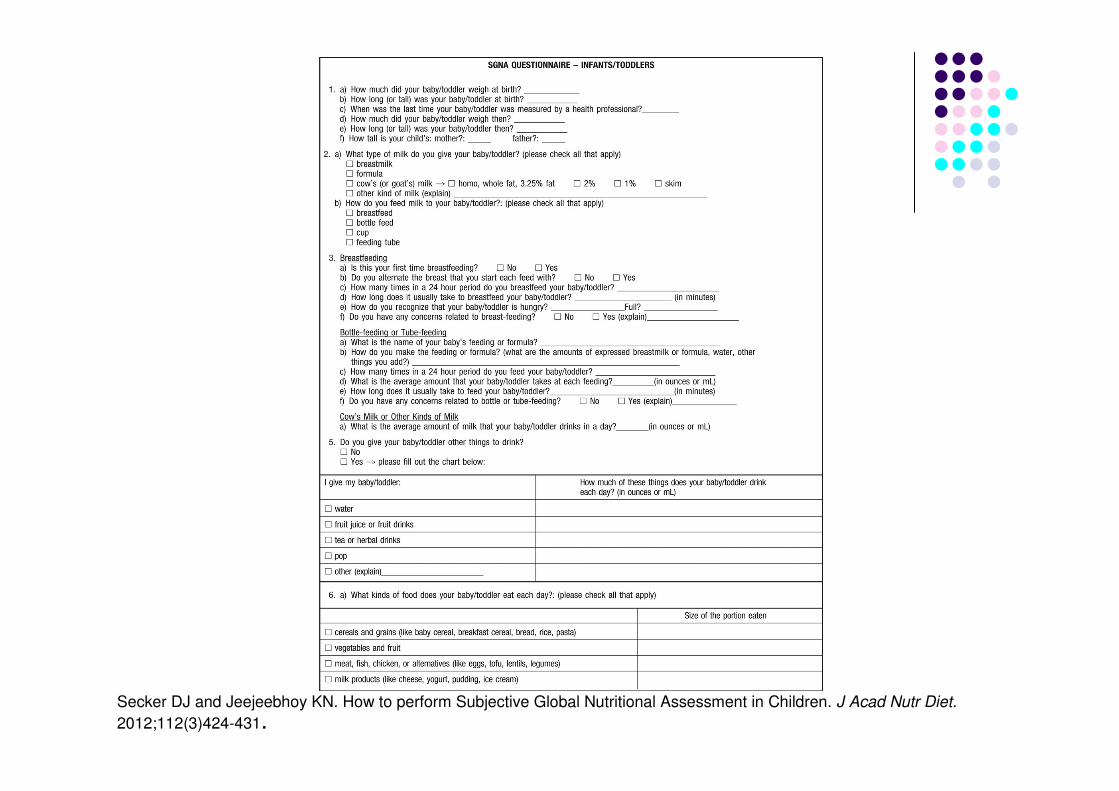
See SGNA Questionnaire – Infants and Toddlers, Children/Teenagers
Secker DJ and Jeejeebhoy KN. How to perform Subjective Global Nutritional Assessment in Children. J Acad Nutr Diet.
2012;112(3)424-431.
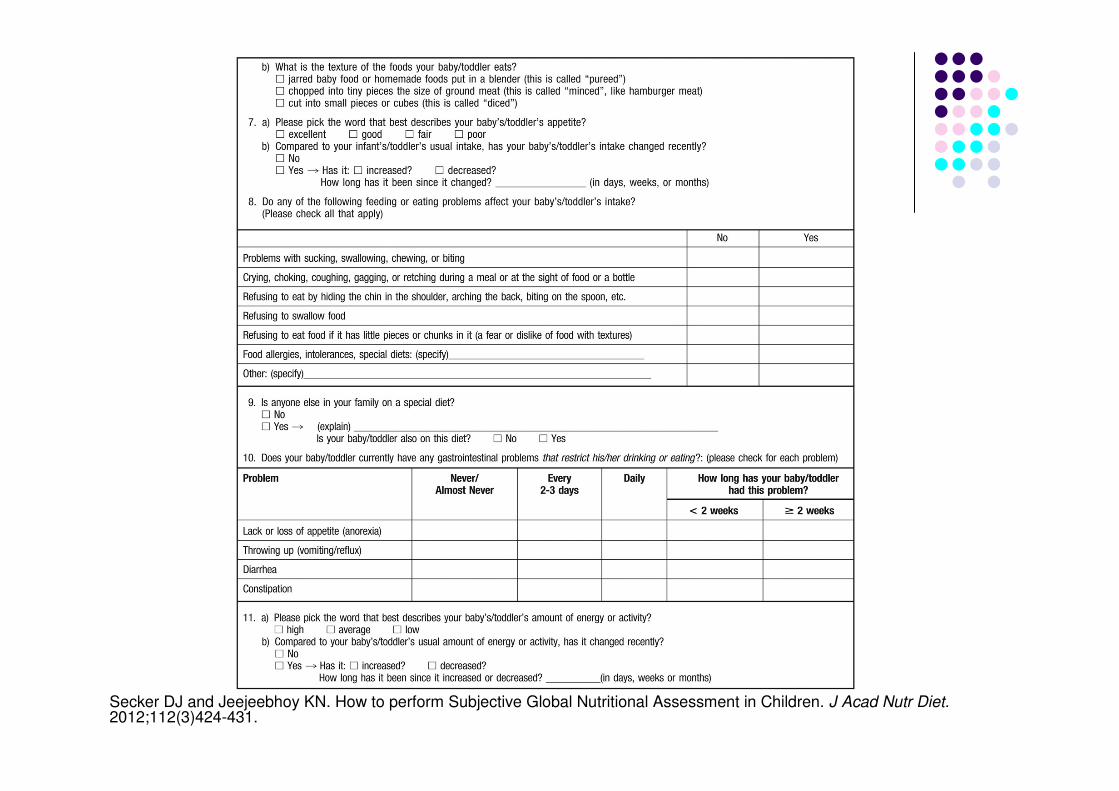
Secker DJ and Jeejeebhoy KN. How to perform Subjective Global Nutritional Assessment in Children. J Acad Nutr Diet.2012;112(3)424-431.
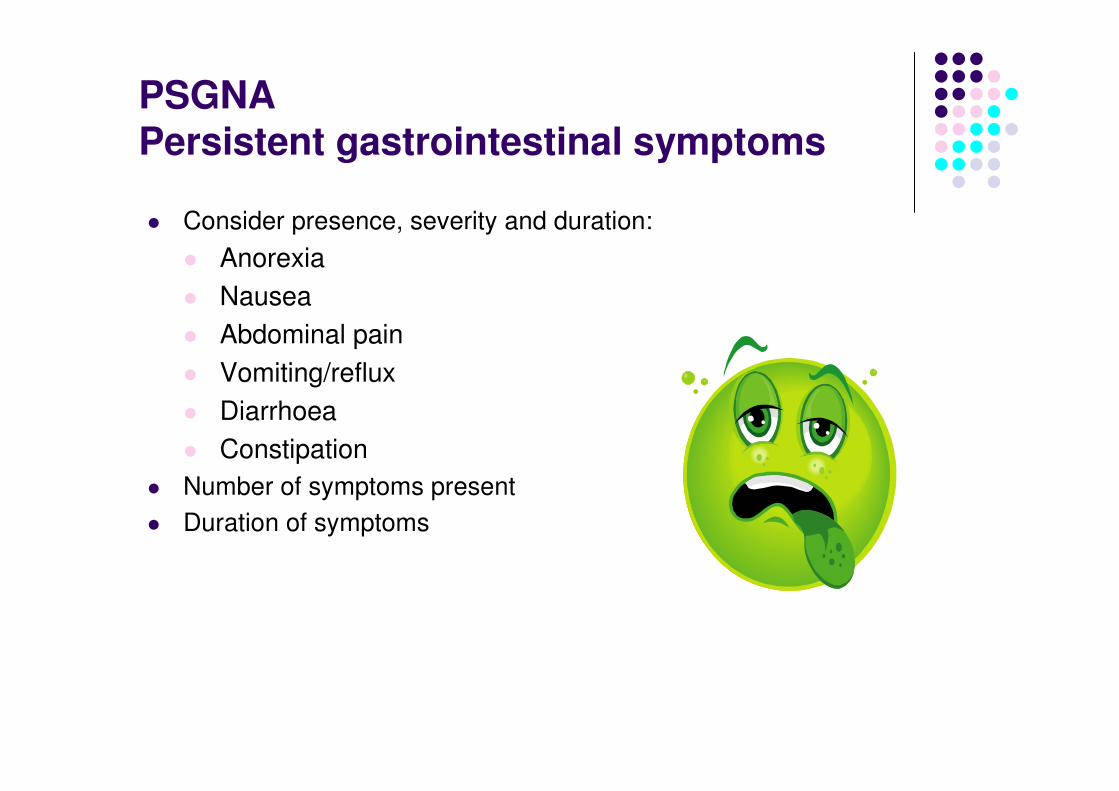
PSGNAPersistent gastrointestinal symptoms
� Consider presence, severity and duration:
� Anorexia
� Nausea
� Abdominal pain
� Vomiting/reflux
� Diarrhoea
� Constipation
� Number of symptoms present
� Duration of symptoms
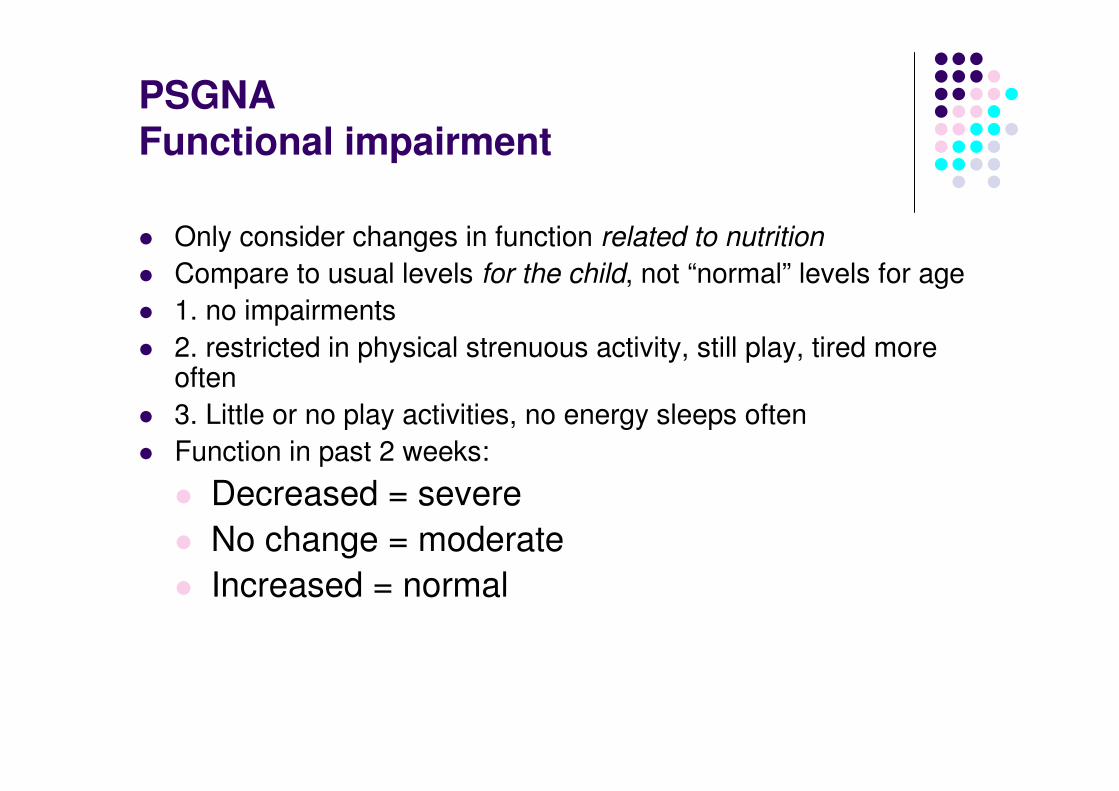
PSGNAFunctional impairment
� Only consider changes in function related to nutrition
� Compare to usual levels for the child, not “normal” levels for age
� 1. no impairments
� 2. restricted in physical strenuous activity, still play, tired more often
� 3. Little or no play activities, no energy sleeps often
� Function in past 2 weeks:
� Decreased = severe
� No change = moderate
� Increased = normal
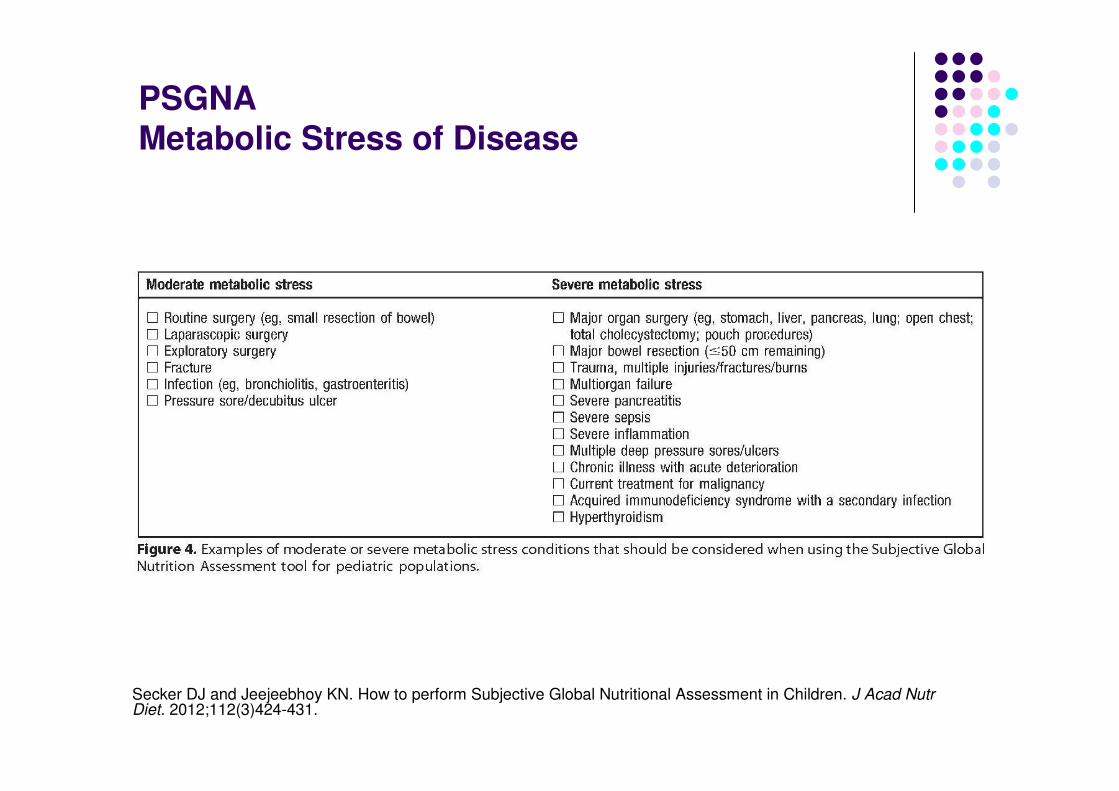
PSGNAMetabolic Stress of Disease
Secker DJ and Jeejeebhoy KN. How to perform Subjective Global Nutritional Assessment in Children. J Acad Nutr Diet. 2012;112(3)424-431.
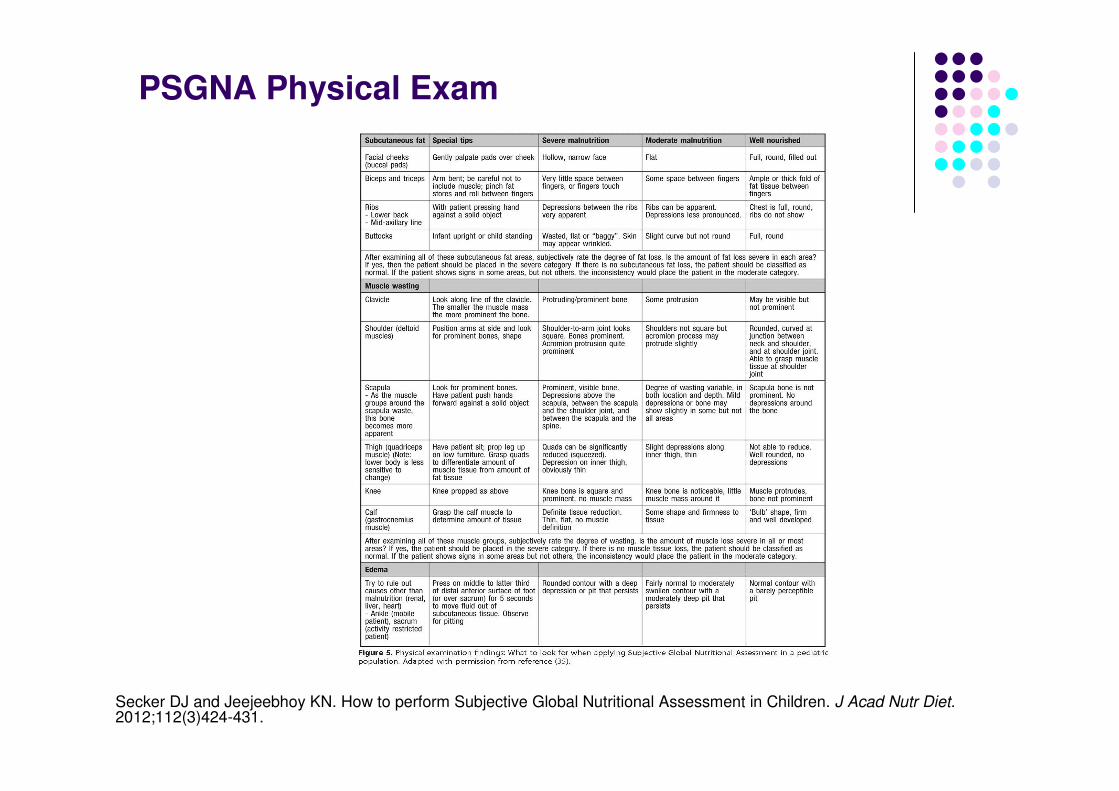
PSGNA Physical Exam
Secker DJ and Jeejeebhoy KN. How to perform Subjective Global Nutritional Assessment in Children. J Acad Nutr Diet.2012;112(3)424-431.
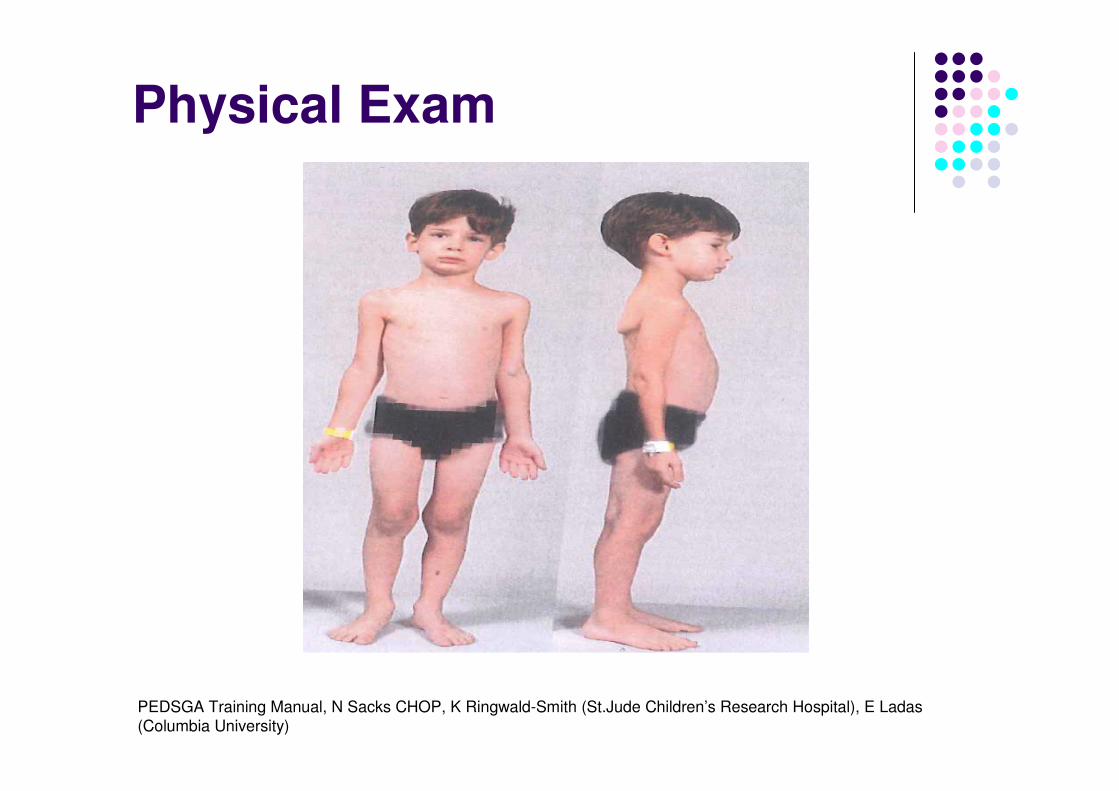
Physical Exam
PEDSGA Training Manual, N Sacks CHOP, K Ringwald-Smith (St.Jude Children’s Research Hospital), E Ladas
(Columbia University)
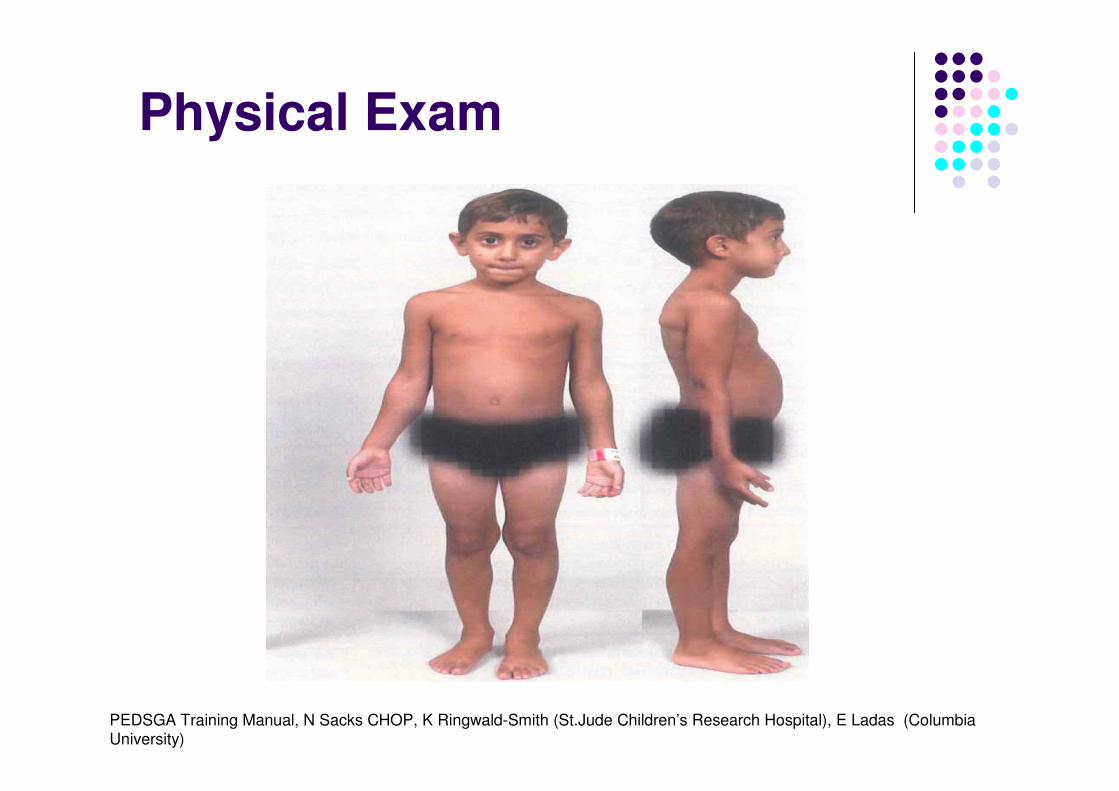
Physical Exam
PEDSGA Training Manual, N Sacks CHOP, K Ringwald-Smith (St.Jude Children’s Research Hospital), E Ladas (Columbia University)
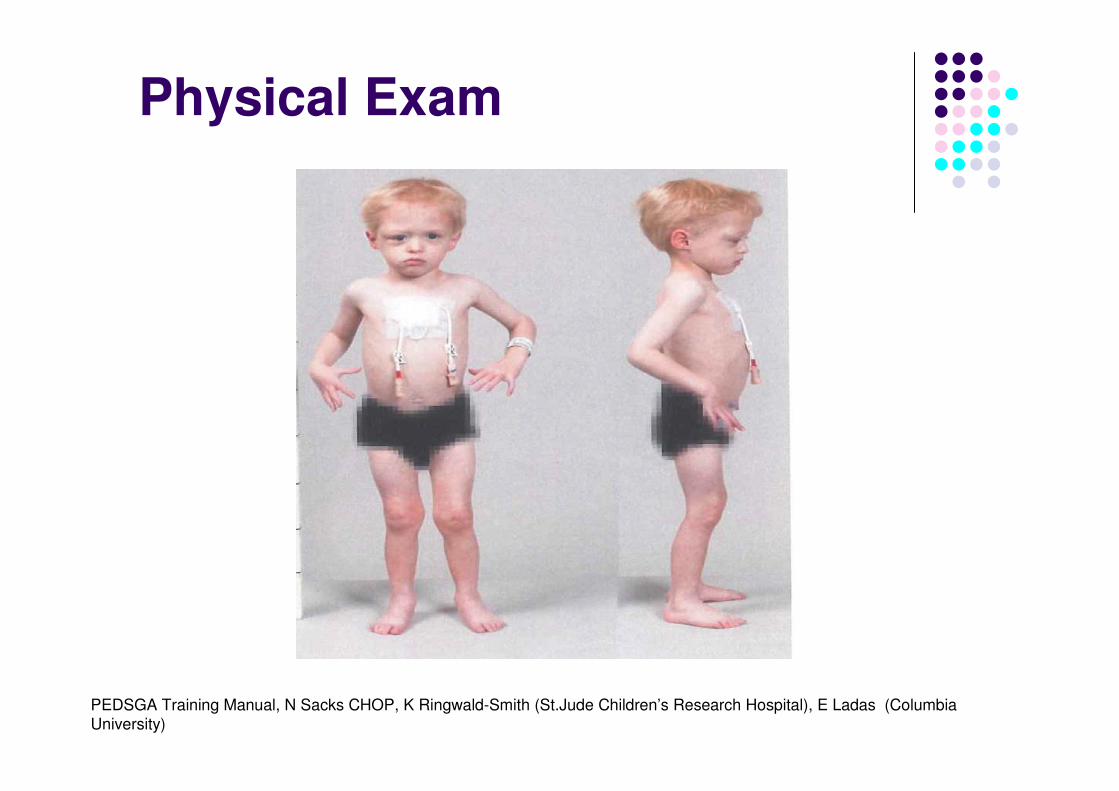
Physical Exam
PEDSGA Training Manual, N Sacks CHOP, K Ringwald-Smith (St.Jude Children’s Research Hospital), E Ladas (Columbia
University)

Thank you