Embed Size (px)
Citation preview
Mammal indicator species for protected areasand managed forests in a landscape conservationarea of northern India
Pradeep K. Mathur . Harish Kumar . John F. Lehmkuhl .
Anshuman Tripathl . Vishwas B. Sawarkar . Rupak De .
Abstract There is a realization that managed forests and other natural areas in thelandscape matrix can and must make significant contributions to biodiversity conservation.Often, however, there are no consistent baseline vegetation or wildlife data for assessingthe status of biodiversity elements across protected and managed areas for conservationplanning, nor is there a rapid and efficient means to acquire those data. We used a unifiedvegetation classification and simple animal sampling design to describe the patterns ofabundance of selected mammals as indicator, or characteristic, species in different vege-tation types and protected areas vs. managed forest units in the Terai Conservation Area(TCA) in northern Uttar Pradesh state, India. We quantified the relative abundance of 15
mammals of conservation concern from dung counts in vegetation sampling plots within122 sample patches in 13 vegetation types and 4 management units. Assemblages ofspecies differed both among vegetation types and among management units. Speciesassemblages in the two protected areas differed strongly from those in two managedforests. Grasslands in protected areas were the most species diverse among vegetationtypes and had several indicator species. Protected forests were dominated by chital (Axisaxis) and nilgai (Boselaphus tragocamelus) in a second species group. A third speciesgroup in open grasslands and savannas in managed forests was characterized by cattle (Bostaurus) and Indian hare (Lepus nigricollis). Protected areas clearly are the core conser-vation area of the TCA for their relatively high habitat value and species diversity, andtheir protected status minimizes human disturbance. Impacts of human use are high inmanaged forests, indicating their compromised value for biodiversity conservation. Oursimple assessment methodology gives managers a simple way to assess the status ofimportant mammals across landscape conservation units.
Keywords Grasslands · India . Indicator species . Managed forests .Monitoring . Protected areas . Sal forest
Introduction
Large reserves and corridors in reserve networks long have been considered the keystonebiodiversity conservation strategy (e.g., Noss and Harris 1986; Noss and Cooperrider1994). Yet, there is the realization that managed forests and other semi-natural areas in thelandscape matrix can and must make significant contributions to biodiversity conservation(Everett and Lehmkuhl 1996; Reid 1996; Salwasser et al. 1996; Sawarkar 2005; Franklinand Lindenmayer 2009). Several issues hinder the integration of protected areas andmanaged forests into a cohesive conservation unit (Everett and Lehmkuhl 1996; Sawarkar2005). First, goals, objectives, and consequent practices may differ. Second, there often isno consistent baseline vegetation or wildlife data for assessing the status and contributionof biodiversity elements across allocations and the impacts of different managementobjectives: hence, no basis for effective conservation planning. Although coarse-filterapproaches that conserve general vegetation communities or animal habitats are vital, fine-filter baseline data on species of concern are vital for effective conservation planning andmanagement (Hunter et al. 1988; Haufler et al. 1996; Lambeck 1997; Lindenmayer et al.2002). We address the second issue in this paper.
India has a well-established network of protected areas and managed forests that aremanaged by state forest departments under different administrative divisions in collabo-ration with the national Indian Forest Service. Forest reserves for sustainable extraction ofwood and forage were established across India during the late 1800s and early 1900s, andthe Indian Forest Service was established to develop a core of professional foresters(Saxena 2002). During the last half of the twentieth century an impressive network ofprotected areas as national parks and wildlife sanctuaries was carved from managed forestreserves, and that protected area network continues to grow (Rodgers et al. 2000). Cur-rently, 21 % of India is classified as forested (FSI 2003), but only 24% of the forested landis in protected areas (MoEF 2008). Under the mandate of the Biological Diversity Act of2002 foresters have begun to develop landscape-scale strategies for integrating biodiversityand social issues in management plans that encompass protected areas, managed forests,
and matrix (De 2001; Sawarkar 2005). Yet, the lack of consistent baseline assessments ofhabitats and species across administrative units hinders that integration (Sawarkar 2005).
Pilot projects in four diverse Indian ecosystems assessed the issues and developedlandscape-scale strategies for integrating protected and managed forests into formal con-servation areas (Mathur et al. 2002; Lehmkuhl et al. 2006). One of those pilot projectsfocused on the remaining Terai forests and grasslands in the premier protected areas andmanaged forests of northern Uttar Pradesh (U.P.) state (Kumar et al. 2002). The Terai is abiodiversity-rich area of forests and tall grasslands in the alluvial floodplains of the GangaRiver that extends east-west at the base of the Himalaya through southern Nepal and thenorthern Indian states of Uttarakhand, UP., Bihar, and West Bengal (Mathur 2000). It ispart of the Terai-Bhabhar biogeographic sub-division of the Upper Gangetic biotic prov-ince in the Gangetic Plains biogeographic zone (Rodgers et al. 2000).
In the past, the Terai ecosystem was a continuous belt of tropical moist deciduousforests interspersed with tall wet grasslands and numerous swamps (Mathur 2000). It iskramanayake et al. 2004). This area now is highly fragmented by densely populated andrich agricultural land, and is one of the most affected ecosystems of India (Rodgers et al.
Nevertheless, remnant portions of the Terai region in Uttarakhand, UP., Bihar, andWest Bengal plus similar habitats in the Brahmaputra River valley of Assam state, remainas complex and dynamic natural ecosystems and are a biodiversity-rich region in India.These protected areas and adjacent managed forests are international conservationstrongholds for several threatened or endangered species, most notably tiger (Pantheratigris tigris), greater one-homed rhinoceros (Rhinoceros unicomis), Asian elephant(Elephas maximus), Asian wild buffalo (Bubalus bubalis), swamp deer (Rucervusduvaucelii duvaucelii), pygmy hog (Porcula salvania), hispid hare (Caprolagus hispidus),and Bengal florican (Hubaropsis bengalensis). Historically, the diversity and biomass oflarge herbivores in an intact Terai ecosystem equaled or exceeded many of the famouswildlife areas of East Africa (Lehmkuhl 1994).
The Terai Conservation Area (TCA) designated by Kumar et al. (2002) in northern U.P.has two core protected areas, Dudwa National Park and Kishanpur Wildlife Sanctuary, twomanaged forest units (North and South Kheri Forest Divisions), and the intervening agri-cultural matrix. In addition to encompassing varied environments, the constituent units areunder different management objectives, administration, and levels of human disturbance.Human disturbance varies from little to none, except tourist use, in national parks, to someallowable grazing and produce collection in wildlife sanctuaries, to timber harvest, silvi-cultural operations, and grazing in managed forests. Wildlife habitat relationships might varynot only with vegetation types, or habitat, but with management allocation and the corre-sponding amount of human use (De 2001). No common vegetation classification schemeexisted for both protected areas and managed forests, and there was no common process ormethodology for rapid wildlife assessments and monitoring. If landscape conservation areaslike the TCA are to be successful in the critical integration of the matrix and protected areas(Prugh et al. 2008; Franklin and Lindenmayer 2009). then rapid and efficient collection andanalysis of baseline data on vegetation condition and animal distribution and habitat useacross units is critical for further planning efforts, including coarse- and fine-filter approaches(e.g., focal species) (Lambeck 1997; Lindenmayer et al.
Our goal was to develop a rapid field assessment and data analysis methodology thatcould be integrated with standard timber, or vegetation, inventory procedures to quantifybaseline wildlife habitat relationships among management allocations and determine howallocations uniquely contribute to or hinder conservation of wildlife species. Our primaryobjective was to describe the patterns of abundance of selected mammals of management
concern as indicator, i.e. characteristic, species in different vegetation types andmanagement allocations (i.e., protected areas vs. managed forest units) of the TCA withdifferent management and disturbance histories. We hypothesized that mammal occurrencewould be most strongly affected by vegetation type, and that management allocation(protected vs. managed) and associated levels of human disturbance would have amodifying affect on occurrence.
Materials and methods
Study area
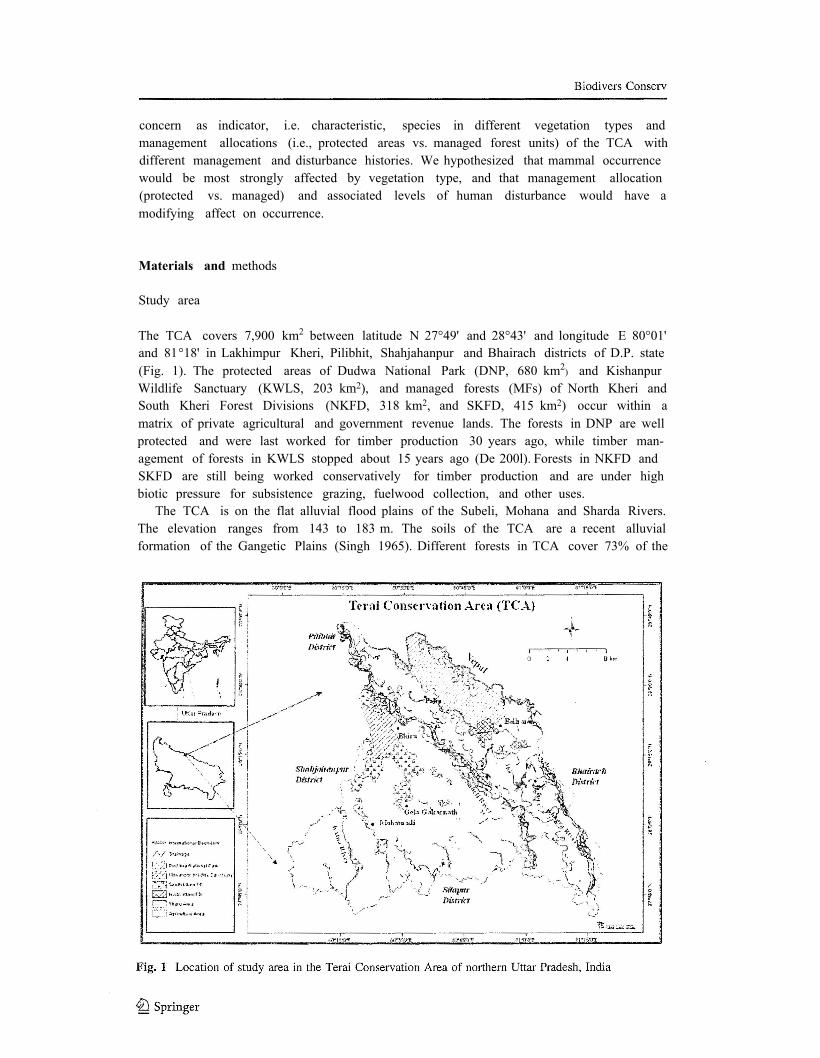
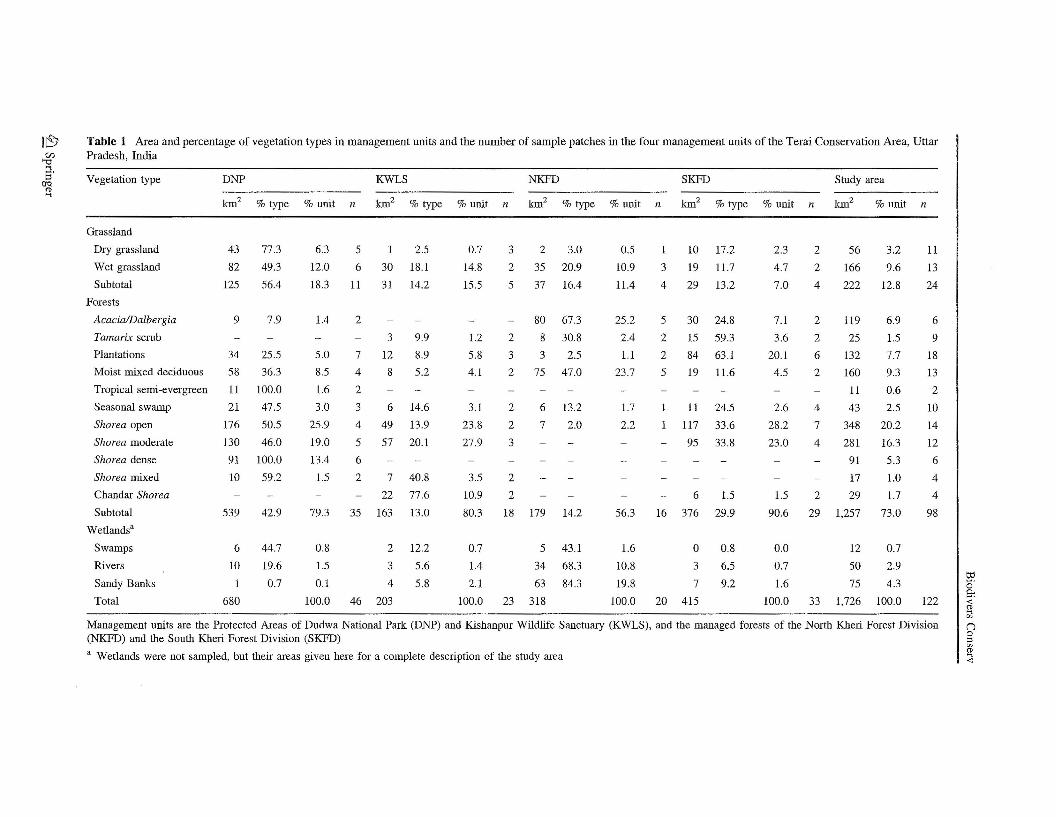
The TCA covers 7,900 km2 between latitude N 27°49' and 28°43' and longitude E 80°01'and 81°18' in Lakhimpur Kheri, Pilibhit, Shahjahanpur and Bhairach districts of D.P. state(Fig. 1). The protected areas of Dudwa National Park (DNP, 680 km2) and KishanpurWildlife Sanctuary (KWLS, 203 km2), and managed forests (MFs) of North Kheri andSouth Kheri Forest Divisions (NKFD, 318 km2, and SKFD, 415 km2) occur within amatrix of private agricultural and government revenue lands. The forests in DNP are wellprotected and were last worked for timber production 30 years ago, while timber man-agement of forests in KWLS stopped about 15 years ago (De 200l). Forests in NKFD andSKFD are still being worked conservatively for timber production and are under highbiotic pressure for subsistence grazing, fuelwood collection, and other uses.
The TCA is on the flat alluvial flood plains of the Subeli, Mohana and Sharda Rivers.The elevation ranges from 143 to 183 m. The soils of the TCA are a recent alluvialformation of the Gangetic Plains (Singh 1965). Different forests in TCA cover 73% of the
non-agricultural areas (Table 1). Sal (Shorea robusta) forests account for 45% of theforested area, with most in the protected DNP and managed SKFD units. Moist mixeddeciduous forest, tropical semi-evergreen, and seasonal swamp forests occupy 12.4% of thearea. Early-seral Acacia/Dalbergia and Tamarix communities occupy 8.4% of the youngfloodplain terraces. Dry upland and wet lowland grasslands occur on 13% of the naturalareas, primarily in DNP. Plantations of primarily eucalyptus occur on 7.7% of the area,mostly in SKFD. A detailed description of vegetation in the TCA can be found in Kumaret al. (2002).
The climate of the study area is a tropical monsoon type and experiences three distinctseasons: cool-dry winter (mid-October to mid-March), hot-dry summer (mid-March tomid-June), and warm-wet monsoon (mid-June to mid-October). The month of January isthe coldest with mean maximum temperature of 20°C and mean minimum temperature of9°C. The months of May and June are hottest with the mean maximum temperature risingup to 43°C. Annual rainfall is about 150 cm (De 2001).
Sampling design
We stratified sampling of non-wetland vegetation patches by natural vegetation types,management unit, and patch size. Thirteen vegetation types (9 forest types, Tamarix scrub,dry upland and wet lowland grasslands, and plantations of varying ages) were identifiedfrom a vegetation map based on the classification of IR 1B LISS II satellite images(Table 1) (Kumar et al. 2002). Patches of varying sizes in each vegetation type andmanagement unit were delineated. We allocated samples within vegetation types to ensurerepresentative samples of different patch sizes in each of the four management units(Table 1). In the case of varying types of S. robusta forest, large, medium, and small patcheswere >2000 ha, 1000-2000 ha and <1000 ha area, respectively. In other categories offorests and grasslands, large, medium, and small patches were >500 ha, 100-500 ha, and<100 ha area, respectively. Altogether, we sampled 122 patches in 13 vegetation types(Table 1).
We sub-sampled each sample patch with 20 m x 20 m quadrats laid out along tran-sects. The size of the quadrat was based on species-area curves (Mueller-Dombois andEllenberg 1974) to meet vegetation sampling objectives (Kumar et al. 2002). In general, aminimum of 10 quadrats was used to sample the smallest forest patches (~-50 ha).Quadrats were distributed at 200-m intervals within patches along transects of varyinglength (2-3.5 km) to systematically cover the patch. Vegetation was measured at each plotand is reported elsewhere (Kumar et al. 2002). The presence of wildlife dung for eachspecies was recorded in the subsample quadrats. Sampling occurred during November1997 to February 2001. A total of 1,967 vegetation quadrats were subsampled in the 122sample patches.
We calculated an index of animal abundance as the percentage frequency of occurrenceof a species in each sample patch as the number of subsample quadrats with old or freshdung divided by the total number of quadrats. We recorded data for 15 mammals ofconservation or management concern: tiger (Panthera tigris tigris), sloth bear (Melursusursinus), honey badger (Mellivora capensis), elephant (Elephas maximus), nilgai(Boselaphus tragoeamelus), sambar (Rusa unicolor), swamp deer (Rucervus duvauceliiduvaueelii), chital (Axis axis), barking deer (Muntiacus muntjak), blackbuck (Antelopecervicapra), hog deer (Axis porcinus), wild boar (Sus scrofa), Indian hare (Lepusnigricollis), hispid hare (Caprolagus hispidus), and cattle (Bos taurus). Tiger, elephant, andhispid hare are Endangered, sloth bear and swamp deer are Vulnerable, blackbuck is Near
Threatened, and honey badger is at Lower Risk on the IUCN Red List (IUCN 2009), andall are accorded Schedule I (highest) protection under the Wildlife (Protection) Act of India(WPA) (MoEF 1972). Nilgai, sambar, chital, barking deer, hog deer, and wild boar are allIUCN Lower Risk species with Schedule III (lowest) protection under the WPA; but, thesespecies have critical management importance as either a WPA Schedule I species (honeybadger), or as primary prey species of the tiger (De 2001). Cattle are of interest becausetheir occurrence impacts native wild ungulate species through potential competition andhuman disturbance (De 200l). Indian hares are important prey for avian and smallmammalian carnivores and a likely indicator species in scrubby disturbed habitats. Speciestaxonomy followed Wilson and Reeder (2005).
Data analysis
We used non-parametric methods for analysis of ecological communities to examine therelationships between relative animal abundance, vegetation type, management unit, andpatch size. Typical methods for modeling resource use by individual species, such asgeneral linear models (Manly et al. 2002) or occupancy modeling (MacKenzie et al. 2006),were problematic because the sampling design included many empty cells (e.g., not allvegetation types were found in every management unit), the data included many zerovalues (i.e., animals not found in a vegetation type or management unit), and data forspecies had messy frequency distributions. Those types of data are well suited for com-munity analysis methods (McCune and Grace 2002). All analysis was done with PCORDsoftware (McCune and Mefford 1999).
We used Multi-Response Permutation Procedures (MRPP) to test the hypothesis of nodifference in species composition among groups, i.e., among vegetation types and amongmanagement units (Zimmerman et al. 1985; Biondini et al. 1988). An A statistic measuredthe grouping "effect size", or distinctiveness of groups, on a scale of 0-1. Values ofA > 0.3 are considered fairly high. Monte Carlo permutations calculated probabilities fordifferences between groups.
A primary method for summarizing relative abundance data was Indicator SpeciesAnalysis (ISA), which identified indicator, or characteristic, species found mostly in asingle type and present in the majority of the sites belonging to a group (Dufrene andLegendre 1997). ISA combined information on both species relative abundance and rel-ative frequency across sample patches to estimate indicator values for each species in eachgroup (i.e., vegetation type, management unit, patch size). The maximum indicator valueof an item within cover types was tested for statistical significance against the randomexpectation calculated by Monte Carlo permutation.
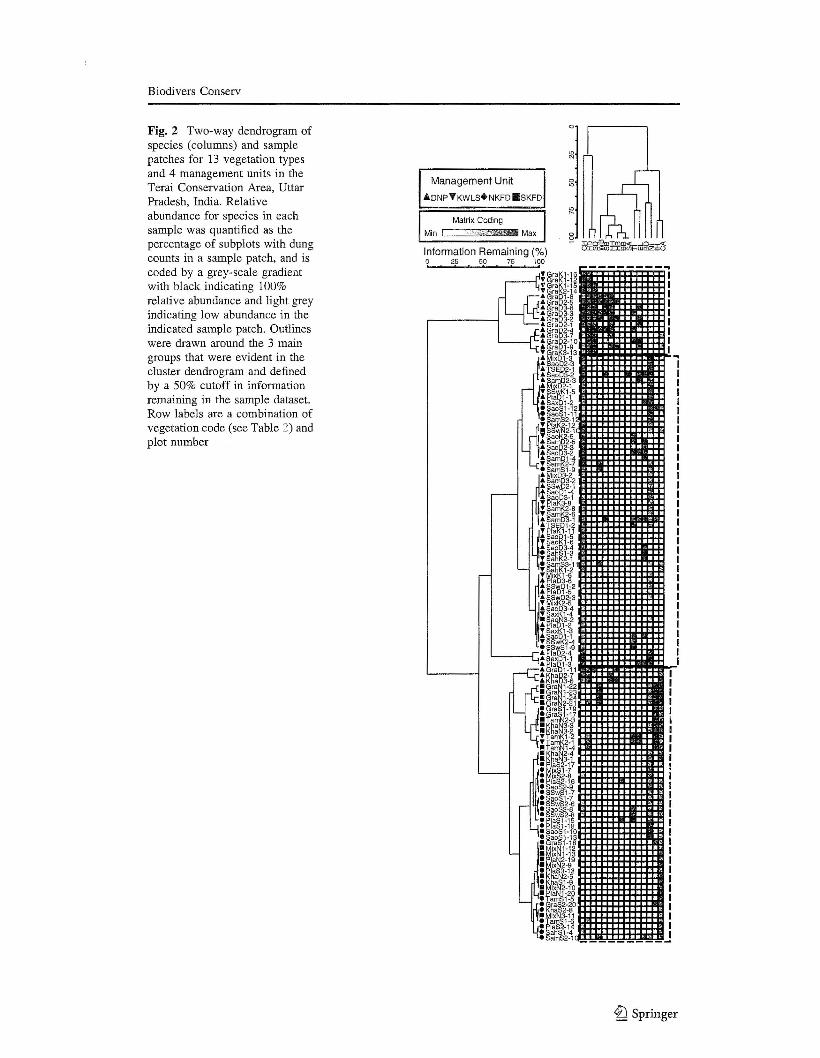
We also used two-way cluster analysis of species and sample patches to graphicallyexamine relationships among species and sample units representing different vegetationtypes and management units (McCune and Mefford 1999). Data were represented in a two-way dendrogram with species as columns and samples as rows. Relative abundance forspecies in each sample was coded by a grey-scale gradient, with black indicating 100%relative abundance in the sample patch. Management unit status was examined bymanipulating the topology of the dendrogram to group sample patches (McCune andMefford 1999). Outlines were drawn around the 3 main groups that were evident in thecluster dendrogram as defined by a 50% cutoff in information remaining in the sampledataset.
We accepted a significance level of P < 0.10 for all statistical analyses. Although lessconservative than P < 0.05, we considered X = 0.10 to be an acceptable chance of Type I
error for ecological field studies that also allowed for reduced Type II error and was wellwithin the bounds of statistical convention (Zar 1999). A significant difference is impliedwhere a difference among means is reported in the text for a priori comparisons.
Results
Dung of the selected mammal species was present in about 50% of the 1,967 subsamplequadrats in 122 sample patches. Assemblages of species differed both among vegetationtypes (A = 0.231, P < 0.001) and among management units (A = 0.125, P < 0.001).Based on the relative size of A statistics, vegetation type had a nearly 2x stronger effect onspecies occurrence compared to management unit. Species assemblages in the protectedareas of DNP and KWLS differed somewhat in composition (A = 0.010, P = 0.103)(Table 2, Fig. 2). Chital and hog deer were important indicator species in both protectedareas, but DNP had a much stronger diversity of grassland species compared to KWLS.Nilgai were commonly found with chital in forests of both protected areas (Fig. 2).
The collective assemblage of species in both protected areas differed strongly from thatof the managed forests of NKFD and SKFD (A < 0.09, P < 0.001), primarily in theabsence of cattle and Indian hare (Fig. 2). Species composition in the two managed forestunits themselves differed (A = 0.069, P < 0.001), mostly in the presence of wild boar andIndian hare (Fig. 2). Species composition was not affected by the size of patch that wassampled (A = 0.002, P = 0.556); but swamp deer, sloth bear, and hispid hare wereindicator species of large sample patches (P< 0.051).
Three obvious and sensible patterns of species clustering among vegetation types andmanagement units were evident at the 50% value of information remaining (Table 2,Fig. 2). The dry upland grasslands and wet lowland grasslands were the most speciesdiverse among vegetation types and had several indicator (characteristic) species (Table 2,top section of Fig. 2). Hog deer, swamp deer, hispid hare, and honey badger were grasslandindicator species. Wild boar and sloth bear also had their highest indicator values in thecombined grassland types. These grassland species were most indicative of protected areas,mostly DNP where 56% of the grassland occurred. Chital also were relatively abundant ingrasslands, but also were abundant in protected forests.
A second group dominated by chital and nilgai described an assemblage of species inforests of protected areas (middle group of Fig. 2). No species was a specific indicator of aparticular forest type. However, chital a generalist using both grasslands and forests,tended to be most abundant in closed-canopy sal forest (Table 2). Nilgai was a forest-dependent species that favored open-canopy sal and other forests. Barking deer reachedtheir highest abundance in closed-canopy sal forests of DNP.
A third species group characterized the mammal assemblage wherever cattle werepresent in most managed forests and some grasslands (Table 2, bottom group of Fig. 2).Grasslands, Tamarix scrub on fresh riverbed alluvium, open Acaci/Dalbergia savanna onsecondary river terraces, plantations, and open or moderate-canopy sal forest were typicalvegetation types in managed forest areas that were used by this group. Indian hare and wildboar were other indicator species that seemed compatible with cattle grazing. Nilgai alsowas associated with this species group, mostly where cattle were found in open sal andother forests.
Tiger used a broad array of vegetation types and management units, but was not sig-nificantly characteristic of any vegetation type or management unit (Table 2, Fig. 2).Elephant sign likewise was not associated with any particular vegetation type, but was
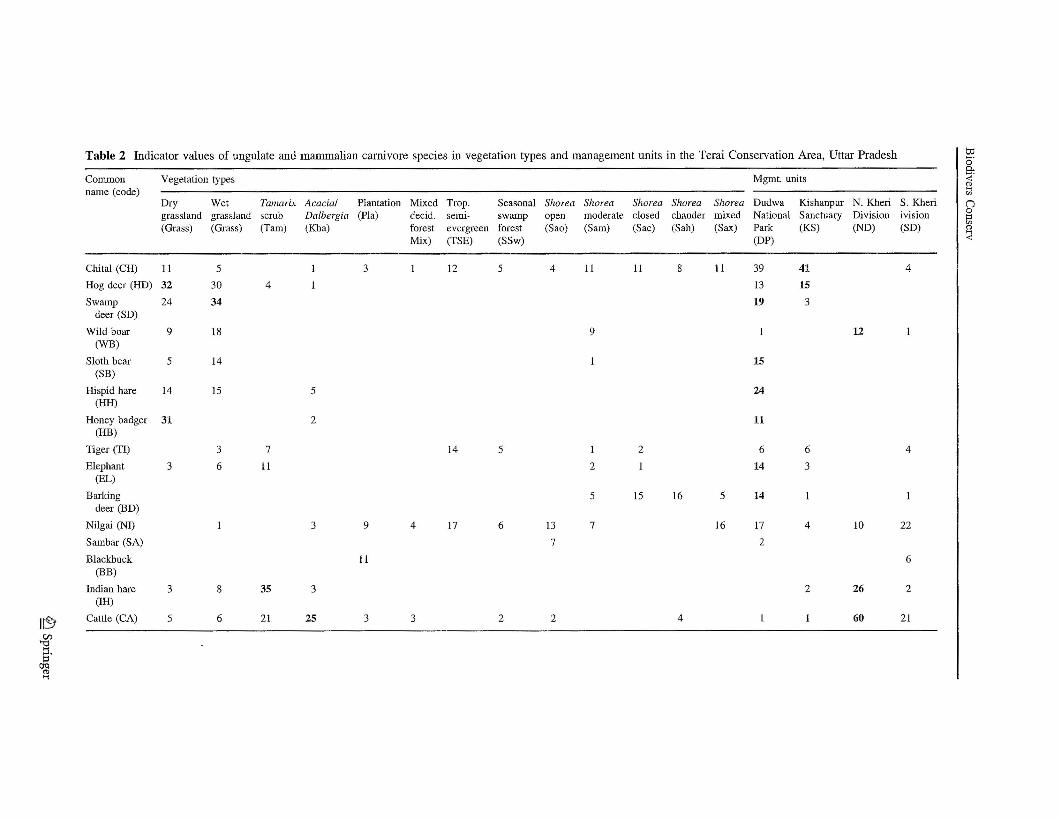
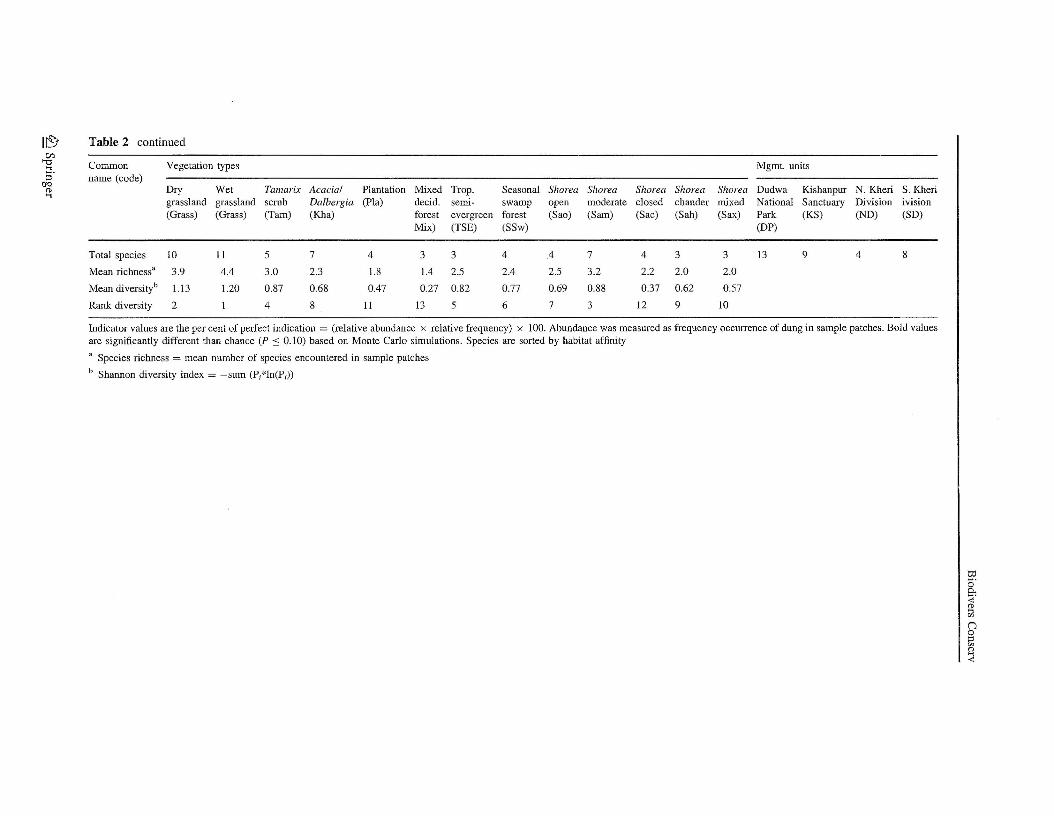
mostly found in open grassland and Tamarix scrub vegetation (Table 2). Unlike tiger,however, elephant sign was highly characteristic of the protected area DNP.
DNP had by far the most indicator species (Table 2). Swamp deer, sloth bear, hispidhare, honey badger, elephant, and barking deer were strong indicator species of the DNPprotected area. Chital and hog deer were indicator species for KWLS. Collectively theseeight species characterized the protected areas. Indicator species of the managed forestareas were cattle, Indian hare, and wild boar. Nilgai also had high indicator values inmanaged forests, but similar to values in DNP.
Discussion
We found support for our hypothesis that vegetation has a primary influence overimportant mammal species distributions, and that management allocation and its variedlevel of human disturbance also was important. DNP was clearly the core conservation areaof the TCA for its relatively high species diversity and high indicator values for manyspecies, and its protected status that minimizes human disturbance. Much of that intrinsicvalue can be ascribed to the grassland communities, which have been long recognized aslocal biodiversity hot spots (Bell and Oliver 1992; Lehmkuhl 1994; Mathur et al. 203) andare the primary reason many of these areas have been protected in south Asia (Rodgerset al. 2000). Hog deer (Dhungel and O'Gara 1991; Timmins et al. 2008), swamp deer(Duckworth et al. 2008), and hispid hare (Oliver 1980; Maheswaran and Smith 2008) arewell recognized obligate grassland species and are of important conservation concern inthis area (Rodgers et al. 2000).
Grasslands also were important habitat for wild boar, sloth bear, and honey badger, butonly the later two were characteristic of DNP. Sloth bear is a creature of mixed deciduousforests, scrub and grassland (Joshi et al.(1995); Menon 2003), and the apparent protectionfrom humans, for whom sloth bear are both aggressive and dangerous, made DNP astronghold area. Joshi et al. (1995) also found grasslands to be the primary habitat for slothbears in the similar Chitwan National Park, Nepal. The honey badger is an uncommon, butwidespread and little studied species in India, that uses a variety of open scrubby andforested habitats (Prater 1971; Menon 2.003), and is most abundant in the semi-arid regionsof northwestern India (Hussain 1999), which includes the study area. Based on our data,honey badgers in the TCA find dry grasslands to be their primary habitat, perhaps becauseof the open structure and relatively sandy soils for easy digging while foraging or makingdens (Prater 1971). Wild boar are a common species in grassland and open habitats, and arepersistent crop raiders (Prater (1971); they were most characteristic of wet grasslands inNKFD, possibly because the pattern of small constituent forest patches in the NKFD set inthe agricultural matrix afforded ample opportunity for shelter and food. Elephant abun-dance was relatively high in the grasslands of DNP, where it was characteristically foundas an indicator species.
Grasslands, mostly wet grasslands, comprised ~ 16% of the KWLS and were also likelya strong factor in the diversity of species in KWLS, despite KWLS being the smallest unitin the TCA. Protected area status and contiguity of area likely were other important factorsin the diversity of detected species in the KWLS. Both KWLS and DNP are single con-tiguous blocks of habitats with strict protective enforcement denying human access;whereas, the managed NKFD and SKFD units are comprised of many small (NKFD) tomedium-large subunits imbedded as fragments in the agricultural matrix, so have high
human activity as a result of easy human access, permitted access for grazing and otheruses, and active timber management programs (Kumar et al. 2002).
The impact of human disturbance was perhaps best seen in the distribution of chitalacross the TCA vegetation types and management units. Chital were found very broadlyacross the grassland, and semi-evergreen and sal forest vegetation types, as others haveobserved in the Terai (Dinerstein 1979; Mishra 1982; Moe and Wegge 1994), but almostexclusively in the protected areas of the TCA. The size of the unit had little to do withchital presence as shown by a strong indicator value in KWLS, which was the smallestunit. The relatively large blocks of sal forest with low edge in SKFD compared to NKFDmay have contributed to relatively higher use of SKFD compared to NKFD among themanaged forest units.
Menon (2003) describes poaching and cattle grazing as the chief conservation threats tochital. That chital are sensitive to human use and the presence of cattle is supported by thenear absence of chital in managed forest units, where cattle was among the strongestindicators species. In addition to harassment, competition for forage with cattle could alsobe having an impact. If managers were able to control human use or cattle grazing inmanaged forest units, then chital populations might be expected to increase and provideabundant prey for tiger. That would benefit tiger conservation, and may reduce depredationon cattle and incidents of attacks on humans.
Nilgai was the second most common and widespread ungulate after chi tal. In contrast tochital, nilgai were a predominantly open forest animal that was found in both protectedarea and managed forest units. In nearby (~75 km) and similar Bardia National Park,Nepal, chital was the most abundant ungulate and together with nilgai constituted themajor wild herbivore biomass (Dinerstein 1980). The presence of cattle seemed to havevery little influence on occurrence of nilgai, and the species is known to be well suited toopen patchy forests in disturbed landscapes (Khan 1994,1995; Bagchi et al. 2003; Menon2003). The high abundance of cattle in Acacia/Dolbergia forest, Tamarix scrub, and uplandand lowland grasslands can be attributed to the availability of forage, water, and proximityto village areas.
Tiger sign was found broadly in the protected areas and in the NKFD managed forests,but the indicator value was not significantly high in anyone unit. Correlations of tigerindicator values and the 2 major prey species, chital and nilgai, showed some interestingpatterns that managers should note. Tiger, chital, and nilgai sign were highest in therelatively uncommon tropical semi-evergreen forest, which is found along stream and pondriparian areas only in DNP, where it makes up only 1.6% of the area. The presence of freewater, and productive rich and moist soils (Kumar et al. 2002) make this an attractivevegetation type for the two major ungulate prey species of tiger, hence also for the tiger.Because of the relatively small area of this type, only two plots were observed, so resultsshould be considered tentative. However, the more heavily sampled seasonal swamp forest(n = 10), which is similar to semi-evergreen forest (Kumar et al. 2002), had patterns ofabundance of chital, nilgai, and tiger similar to semi-evergreen forest. Tiger sign was alsorelatively abundant in Tamarix scrub, where the likely prey species was cattle based onindicator values and the absence of other prey species.
This research was an initial step in documenting patterns of wildlife occurrence acrossthe disparate units of the TCA in conjunction with vegetation sampling. The wildlifeoccurrence data were collected as secondary data to the primary vegetation sampling(Kumar et al. 2002); as such, the wildlife data had limitations on the type of analysis thatcould be performed. As opposed to conventional dung counts in plots or strips to estimatedung or animal density (reviewed by Marques et al. 2001), we recorded simple presence or
absence of dung in subplots, then indexed abundance in sample patches as the percentageof subplots with dung. Analysis was similar to what could be done with the vegetationpercentage cover data using community ecology techniques (McCune and Grace 2002).Our methodology was simple but effective in quantifying patterns of relative occurrenceamong vegetation types and management units. It could easily be incorporated in thecomprehensive field inventories that are standard practice in managed forests (Sawarkar2005). We were unable, however, to estimate the density of animals, or the specific timeperiod or season to which our data applied.
Recent efforts to prepare a Tiger Conservation Plan for the National Tiger ConservationAuthority (India) have resulted in a consistent and rigorous methodology to map vegetationand quantify and monitor patterns of tiger and prey distributions across protected area andmanaged forest conservation units (Gopal et al. 2007). The comprehensive methodologyincludes mark-recapture and occupancy methods to document the distribution and numbersof tigers and other carnivores, and line-transect and pellet-count methods to quantifyabundance of large tiger prey (Jhala and Qureshi 2005; Gopal et al. 2007). To date,regional scale patterns of occurrence in forested areas have been reported (Jhala et al.2008). Our results provide TCA managers with smaller patch-scale data for local vege-tation types and management status that provides a fine-scale view of wildlife distributionpatterns.
We believe the ecological scope of the research results is not limited just area of theTCA, but applies certainly to the 15 protected areas and their surrounding managed forests,and managed forests in general, with similar habitats and species in the Indian andNepalese Terai at the base of the Himalayas. This region is an internationally recognizedbiodiversity hot spot with many recognized endangered habitats and species, chief amongthem the tiger (Wikramanayake et al. 2004). The implications of human use and cattle inmanaged forests (and protected areas too) and the associated exclusion of chital hasimplications throughout peninsular India where chital are probably the most abundantprimary prey of endangered tigers (Jhala et al. 2008).
Complete faunal inventories are difficult, time-consuming and costly (Lawton et al.1998), therefore monitoring of the status of all species operationally is impossible for mostnatural resource managers (Baldi 2003). Many managers and researchers want to identifypractical indicator or focal species (Lambeck 1997) that can be monitored efficiently andextrapolated reliably to understand the impacts of management. Our results provide astarting point for selecting which species to monitor. In a push for monitoring efficiency,however, it should not be forgotten that little is known about the distribution, populationstatus, ecology, and effects of management of the large number of less conspicuous plantand animal species that make up the bulk of biodiversity in the TCA (Hore and Uniyal2008b). These species form the base of the intricate food webs and ecosystems that supportthe well-known species on which management typically is focused and should be con-sidered for monitoring patterns of biodiversity (Hore and Uniyal 2008a
Acknowledgements This study was part of a major collaborative project between the Wildlife Institute ofIndia and the USDA Forest Service. Financial support [Grant No. FG-In-780 (In-FS-120)] received from theUS Dept. of Agriculture, Far Eastern Regional Research Office (FERRO) of the U.S. Embassy, New Delhi,is acknowledged. We gratefully acknowledge encouragement and support received from Dr. JamesR. Stevenson, Mr. G.K. Gupta and Mrs. Usha Kapur of FERRO. We are also grateful to Mr. P.R. Sinha,Director, WII; Chief Wildlife Warden, Uttar Pradesh; and Field Director, Dudwa Tiger Reserve foradministrative support and field logistics. We thank all other team members and collaborators of the projectfor their valuable inputs at various stages.
References
Bagchi S, Goyal SP, Sankar K (2003) Niche relationships of an ungulate assemblage in a dry tropical forest.J Mammal 84:981-988
Baldi A (2003) Using higher taxa as surrogates of species richness: a study based on 3700 Coleoptera,Diptera, and Acari species in Central-Hungarian reserves. Basic Appl Ecol 4:589-593
Bell D, Oliver W (1992) Northern Indian tall grasslands: management and species conservation with specialreference to fire. In: Singh K, Singh J (eds) Tropical ecosystems: ecology and management. WileyEastern Limited, New Delhi
Biondini ME, Mielke PW Jr, Berry KJ (1988) Data-dependent permutation techniques for the analysis ofecological data. Vegetatio 75:161-168
De R (2001) Management plan of the Dudwa Tiger Reserve (2000-2001 to 2009-2010). Wildlife Preser-vation Organization. Uttar Pradesh Forest Department, Lucknow, India
Dhungel SK, O'Gara BW (1991) Ecology of the hog deer in Royal Chitwan National Park, Nepal. WildlMonogr 119:1-40
Dinerstein E (1979) Ecological survey of the Royal Karnali Bardia Wildlife Reserve, Nepal. Part 2: habitat-animal interactions, Biol Conserv 16:265-300
Dinerstein E (1980) An ecological survey of the Royal Karnali-Bardia Wildlife Reserve, Nepal. Part 3:ungulate populations. Biol Conserv 18:5-37
Duckworth J, Kumar S, Pokheral C, Baral S, Timmins R (2008) Rucervus duvaucelii. mCN red list ofthreatened species. http://www.iucnredlist.org. Cited 13 April 2009
Dufrene M, Legendre P (1997) Species assemblages and indicator species: the need for a fiexible asym-metrical approach. Ecol Monogr 67:345-366
Everett RL, Lehmkuhl JF (1996) An emphasis-use approach to conserving biodiversity. Wildl Soc Bull24:192-199
Franklin JF, Lindenmayer DB (2009) Importance of matrix habitats in maintaining biological diversity. ProcNatl Acad Sci USA 106:349-350
FSI (2003) State of forest report 2003. Forest Survey of India (Ministry of Envrionment and Forests),Dehradun
Gopal R, Sinha PR, Mathur VB, Jhala YV, Qureshi Q (2007) Guidelines for preparation of tiger conser-vation Plan. National Tiger Conservation Authority, Ministry of Environment and Forests. NTCA/0l/07, New Delhi
Haufier JB, Mehl CA, Roloff GJ (1996) Using a coarse-filter approach with species assessment for eco-system management. Wildl Soc Bull 24:200-208
Hore U, Uniyal VP (2008a) Use of spiders (Araneae) as indicator for monitoring of habitat conditions inTerai Conservation Area, India. Indian Forester 134:1371-1380
Hore U, Uniyal VP (2008b) Diversity and composition of spider assemblages in five vegetation types of theTerai Conservation Area, India. J Arachnol 36:251-258
Hunter ML Jr, Jacobson GJ Jr, Webb TI (1988) Paleoecology and the coarse-filter approach to maintainingbiological diversity. Conserv Biol 2:375-385
Hussain SA (1999) Mustelids, viverrids, and herpestids of India: species profiles and conservation status. In:Hussain SA (ed) mustellids, viverrids, and herpestids of India. ENVIS Bulletin: Wildlife and protectedareas 2. Wildlife Institute of India, Dehra Dun
IUCN (2009) IUCN red list of threatened species. Version 2009.2. http://www.iucnredlist.org. Cited 03November 2009
Jhala YV, Qureshi Q (2005) Monitoring tigers, co-predators, prey and their habitats. Project Tiger Direc-torate and Wildlife Institute of India. Dehra Dun
Jhala YV, Gopal R, Qureshi Q (eds) (2008) Status of tigers, co-predators, and prey in India. National TigerConservation Authority and Wildlife Institute of India. TR08/001, Dehra Dun
Joshi AR, Garshelis DL, Smith JLD (1995) Home ranges of sloth bears in Nepal: implications for con-servation. J Wildl Manage 59:204-214
Khan JA (1994) Food habits of ungulates in dry tropical forests of Gir Lion Sanctuary, Gujarat, India. ActaTheriol 39:185-193
Khan JA (1995) Conservation and management of Gir Lion Sanctuary and National Park, Gujarat, India.Biol Conserv 73:183-188
Kumar H, Mathur PK, Lehmkuhl JF, Khati DVS, De R, Longwah W (2002) Management of forests in Indiafor biological diversity and forests productivity, a new perspective-Volume VI: Terai ConservationArea (TCA), WII-USDA Forest Service Collaborative Project Report Wildlife Institute of India. DehraDun
Lambeck RJ (1997) Focal species: a multi-species umbrella for nature conservation. Conserv Biol 11:849-856
Lawton JH, Naeem S, Thompson LJ, Hector A, Crawley MJ (1998) Biodiversity and ecosystem function:getting the Ecotron experiment in its correct context. Funct Ecol 12:848-852
Lehmkuhl JF (1994) A classification of subtropical riverine grassland and forest in Chitwan National Park,Nepal. Vegetatio 111:29-43
Lehmkuhl JF, Mathur PK, Sawarkar VB, Holthausen R, Marcot BG, Raphael MG (2006) Managing Indianforests for biological diversity and productivity. In: McNeely JA, McCarthy TM, Smith A, Olsvig-Whittaker L, Wikramanayake ED (eds) Conservation biology in Asia. Society for ConservationBiology Asia Section and Resources Himalaya Foundation, Kathmandu, Nepal
Lindenmayer DB, Manning AD, Smith PL et al (2002) The focal-species approach and landscape resto-ration: a critique. Conserv Biol 16:338-345
MacKenzie D, Nichols J, Royle J, Pollock KH, Bailey LL, Hines JE (2006) Occupancy estimation andmodeling: inferring patterns and dynamics of species occurrence. Elsevier, Amsterdam
Maheswaran G, Smith A (2008) Caprolagus hispidus. IUCN red list of threatened species.iucnredlist.org. Cited 13 April 2009
Manly B, McDonald T, Thomas D, Erickson W (2002) Resource selection by animals: statistical design andanalysis for field studies. Springer, New York
Marques FFC, Buckland ST, Goffin D, Dixon CE, Borchers DL, Mayle BA, Peace AJ (2001) Estimatingdeer abundance from line transect surveys of dung: sika deer in southern Scotland. J Appl Ecol 38:349-363
Mathur PK (2000) Status of research and monitoring in protected areas of Indian Terai--an overview. In:Richard C, Basnet K, Sah JP, Raut Y (eds) Grassland ecology and management in protected areas ofNepal. Volume 2: technical and status papers on grasslands of Terai protected areas InternationalCentre for Integrated Mountain Development. Kathmandu, Nepal
Mathur PK, Lehmkuhl IF, Sawarkar VB (tech coords) (2002) Management of forests in India for biologicaldiversity and forests productivity, a new perspective. Volume I: concepts, approaches and projectoverview. WIT-USDA Forest Service Collaborative Project Report, Wildlife Institute of India,Debra Dun
Mathur PK, Kumar H, Lehmkuhl IF (2003) Terai grasslands-diversity, management and conservationperspective. ENVIS Bull 1:1-28
McCune B, Grace J (2002) Analysis of ecological communities. MjM Software Design. Gleneden Beach,Oregon, USA
McCune B, Mefford M (1999) Multivariate analysis of ecological data, version 4.17. MjM Software.Gleneden Beach, Oregon, USA
Menon V (2003) A field guide to Indian mammals. Dorling Kindersley (India), New DelhiMishra HR (1982) Balancing human needs and conservation in Nepal's Royal Chitwan National Park.
Ambio 11:246-251Moe SR, Wegge P (1994) Spacing behaviour and habitat use of axis deer (Axis axis) in lowland Nepal. Can J
Zool72:1735-1744MoEF (1972) The Wildlife (Protection Act), 1972 (http://moef.nic.in/modules/rules.and.regulations/
wildlife/)MoEF (2008) National biodiversity action plan. Ministry of Environment and Forests. Government of India,
New DelhiMueller-Dornbois D, Ellenberg H (1974) Aims and methods of vegetation ecology. John Wiley and Sons,
New YorkNoss R, Cooperrider A (1994) Saving nature's legacy: protecting and restoring biodiversity. Island Press,
Washington, DCNoss RF, Harris LD (1986) Nodes, networks, and MUMs: preserving diversity at all scales. Environ Manage
10:299-309Oliver W (1980) The pygmy hog: the biology and conservation of the pygmy hog and the hispid hare.
Special Scientific Report No. 1. The Jersey Wildlife Preservation Trust, Jersey, UKPrater SH (1971) The book of Indian animals, 3rd edn. Bombay Natural History Society, Mumbai, IndiaPrugh LR, Hodges KE, Sinclair ARE, Brashares JS (2008) Effect of habitat area and isolation on fragmented
animal populations. Proc Nat! Acad Sci USA 105:20770-20775Reid W (1996) Beyond protected areas: changing perceptions of ecological management objectives. In:
Szaro R, Johnston D (eds) Biodiversity in managed landscapes. Oxford University Press, New YorkRodgers WA, Panwar HS, Mathur VB (2000) Wildlife protected area network in India: a review. Wildlife
Institute of India, Debra Dun
Salwasser H, Caplan JA, Cartwright CW, Doyle AT, Kessler WB, Marcot BG, Stritch L (1996) Conservingbiodiversity through ecosystem management. In: Szaro R, Johnston D (eds) Biodiversity in managedlandscapes. Oxford University Press, New York
Sawarkar VB (2005) Planning wildlife management in protected areas and managed landscapes. WildlifeInstitute of India and Natraj Publishers, Dehra Dun
Saxena NC (2002) The Indian Forest Service. Centre for Sustainable Development. Lal Bahadur ShastriNational Academy of Administration, Mussoorie
Singh L (1965) The Terai region of the U.P.: a study in human geology. Ram Narayan Lal Beni PrasadPublishers, Allahabad
Timmins RJ, Duckworth JW, Kumar NS, Islam MA, Baral HS, Long B, Maxwell A (2008) Axis porcinus.IUCN red list of threatened species. http//www.iucnredlist.org. Cited 13 April 2009
Wikramanayake E, McKnight M, Dinerstein E, Joshi A, Gurung B, Smith D (2004) Designing a conser-vation landscape for tigers in human-dominated environments. Conserv Biol 18:839-844
Wilson DE, Reeder DM (eds) (2005) Mammal species of the world. A taxonomic and geographcal refer-ence, 3rd edn. Johns Hopkins University Press, Baltimore, Maryland
Zar J (1999) Biostatistical analysis. Prentice-Hall, Upper Saddle River, New JerseyZimmerman G, Goetz H, Mielke P (1985) Use of an improved statistical method for group comparisons to
study effects of prairie fire. Ecology 66:606-611