Embed Size (px)
Citation preview
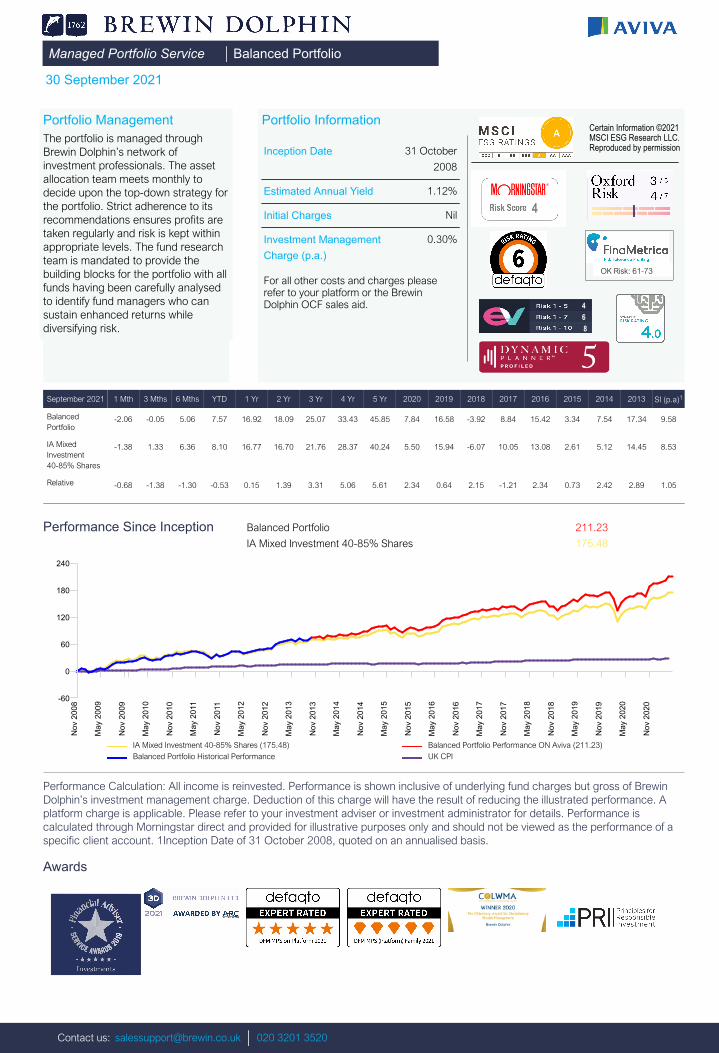
Managed Portfolio Service Balanced Portfolio 30 September 2021
Portfolio ManagementThe portfolio is managed throughBrewin Dolphin’s network ofinvestment professionals. The assetallocation team meets monthly todecide upon the top-down strategy forthe portfolio. Strict adherence to itsrecommendations ensures profits aretaken regularly and risk is kept withinappropriate levels. The fund researchteam is mandated to provide thebuilding blocks for the portfolio with allfunds having been carefully analysedto identify fund managers who cansustain enhanced returns whilediversifying risk.
Portfolio Information
Inception Date 31 October
2008
Estimated Annual Yield 1.12%
Initial Charges Nil
Investment ManagementCharge (p.a.)
0.30%
For all other costs and charges pleaserefer to your platform or the BrewinDolphin OCF sales aid.
Certain Information ©2021MSCI ESG Research LLC.Reproduced by permission
4
OK Risk: 61-73
4 6 8
September 2021 1 Mth 3 Mths 6 Mths YTD 1 Yr 2 Yr 3 Yr 4 Yr 5 Yr 2020 2019 2018 2017 2016 2015 2014 2013 SI (p.a)1
BalancedPortfolio
-2.06 -0.05 5.06 7.57 16.92 18.09 25.07 33.43 45.85 7.84 16.58 -3.92 8.84 15.42 3.34 7.54 17.34 9.58
IA MixedInvestment40-85% Shares
-1.38 1.33 6.36 8.10 16.77 16.70 21.76 28.37 40.24 5.50 15.94 -6.07 10.05 13.08 2.61 5.12 14.45 8.53
Relative -0.68 -1.38 -1.30 -0.53 0.15 1.39 3.31 5.06 5.61 2.34 0.64 2.15 -1.21 2.34 0.73 2.42 2.89 1.05
Performance Since Inception
Balanced Portfolio 211.23
IA Mixed Investment 40-85% Shares 175.48
-60
0
60
120
180
240
Nov
200
8
May
200
9
Nov
200
9
May
201
0
Nov
201
0
May
201
1
Nov
201
1
May
201
2
Nov
201
2
May
201
3
Nov
201
3
May
201
4
Nov
201
4
May
201
5
Nov
201
5
May
201
6
Nov
201
6
May
201
7
Nov
201
7
May
201
8
Nov
201
8
May
201
9
Nov
201
9
May
202
0
Nov
202
0
IA Mixed Investment 40-85% Shares (175.48)
Balanced Portfolio Performance ON Aviva (211.23)
Balanced Portfolio Historical Performance
UK CPI
Performance Calculation: All income is reinvested. Performance is shown inclusive of underlying fund charges but gross of BrewinDolphin’s investment management charge. Deduction of this charge will have the result of reducing the illustrated performance. Aplatform charge is applicable. Please refer to your investment adviser or investment administrator for details. Performance iscalculated through Morningstar direct and provided for illustrative purposes only and should not be viewed as the performance of aspecific client account. 1Inception Date of 31 October 2008, quoted on an annualised basis.
Awards
Contact us: [email protected] 020 3201 3520
30 September 2021
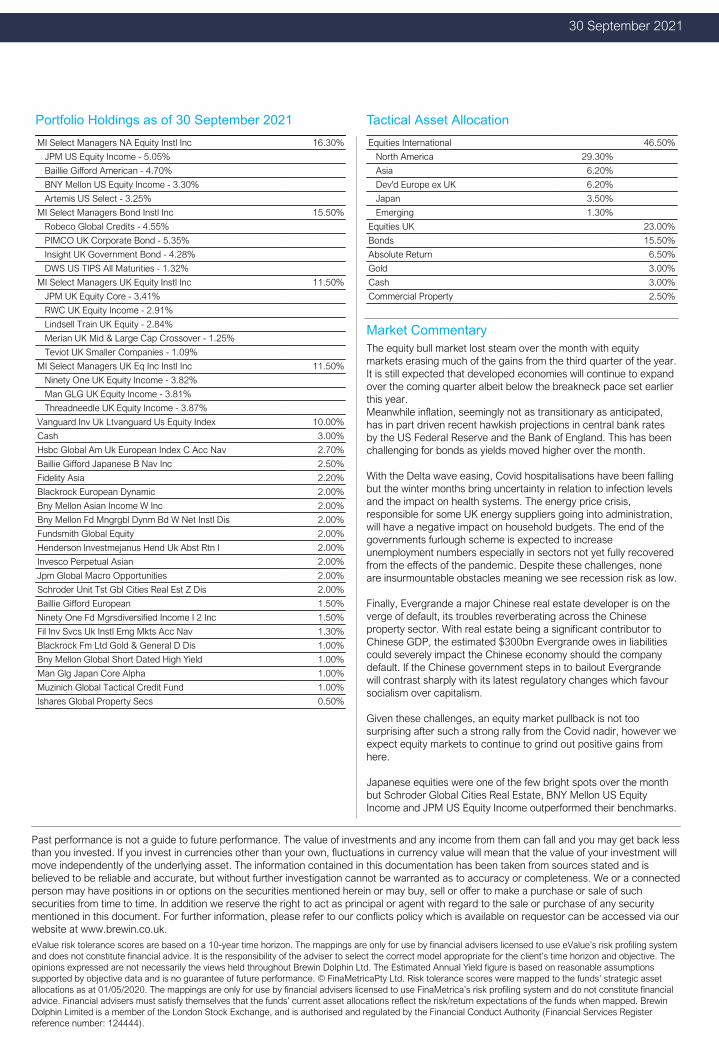
Portfolio Holdings as of 30 September 2021
Tactical Asset Allocation
MI Select Managers NA Equity Instl Inc 16.30%
JPM US Equity Income - 5.05%
Baillie Gifford American - 4.70%
BNY Mellon US Equity Income - 3.30%
Artemis US Select - 3.25%
MI Select Managers Bond Instl Inc 15.50%
Robeco Global Credits - 4.55%
PIMCO UK Corporate Bond - 5.35%
Insight UK Government Bond - 4.28%
DWS US TIPS All Maturities - 1.32%
MI Select Managers UK Equity Instl Inc 11.50%
JPM UK Equity Core - 3.41%
RWC UK Equity Income - 2.91%
Lindsell Train UK Equity - 2.84%
Merian UK Mid & Large Cap Crossover - 1.25%
Teviot UK Smaller Companies - 1.09%
MI Select Managers UK Eq Inc Instl Inc 11.50%
Ninety One UK Equity Income - 3.82%
Man GLG UK Equity Income - 3.81%
Threadneedle UK Equity Income - 3.87%
Vanguard Inv Uk Ltvanguard Us Equity Index 10.00%
Cash 3.00%
Hsbc Global Am Uk European Index C Acc Nav 2.70%
Baillie Gifford Japanese B Nav Inc 2.50%
Fidelity Asia 2.20%
Blackrock European Dynamic 2.00%
Bny Mellon Asian Income W Inc 2.00%
Bny Mellon Fd Mngrgbl Dynm Bd W Net Instl Dis 2.00%
Fundsmith Global Equity 2.00%
Henderson Investmejanus Hend Uk Abst Rtn I 2.00%
Invesco Perpetual Asian 2.00%
Jpm Global Macro Opportunities 2.00%
Schroder Unit Tst Gbl Cities Real Est Z Dis 2.00%
Baillie Gifford European 1.50%
Ninety One Fd Mgrsdiversified Income I 2 Inc 1.50%
Fil Inv Svcs Uk Instl Emg Mkts Acc Nav 1.30%
Blackrock Fm Ltd Gold & General D Dis 1.00%
Bny Mellon Global Short Dated High Yield 1.00%
Man Glg Japan Core Alpha 1.00%
Muzinich Global Tactical Credit Fund 1.00%
Ishares Global Property Secs 0.50%
Equities International 46.50%
North America 29.30%
Asia 6.20%
Dev'd Europe ex UK 6.20%
Japan 3.50%
Emerging 1.30%
Equities UK 23.00%
Bonds 15.50%
Absolute Return 6.50%
Gold 3.00%
Cash 3.00%
Commercial Property 2.50%
Market CommentaryThe equity bull market lost steam over the month with equitymarkets erasing much of the gains from the third quarter of the year.It is still expected that developed economies will continue to expandover the coming quarter albeit below the breakneck pace set earlierthis year.Meanwhile inflation, seemingly not as transitionary as anticipated,has in part driven recent hawkish projections in central bank ratesby the US Federal Reserve and the Bank of England. This has beenchallenging for bonds as yields moved higher over the month.
With the Delta wave easing, Covid hospitalisations have been fallingbut the winter months bring uncertainty in relation to infection levelsand the impact on health systems. The energy price crisis,responsible for some UK energy suppliers going into administration,will have a negative impact on household budgets. The end of thegovernments furlough scheme is expected to increaseunemployment numbers especially in sectors not yet fully recoveredfrom the effects of the pandemic. Despite these challenges, noneare insurmountable obstacles meaning we see recession risk as low.
Finally, Evergrande a major Chinese real estate developer is on theverge of default, its troubles reverberating across the Chineseproperty sector. With real estate being a significant contributor toChinese GDP, the estimated $300bn Evergrande owes in liabilitiescould severely impact the Chinese economy should the companydefault. If the Chinese government steps in to bailout Evergrandewill contrast sharply with its latest regulatory changes which favoursocialism over capitalism.
Given these challenges, an equity market pullback is not toosurprising after such a strong rally from the Covid nadir, however weexpect equity markets to continue to grind out positive gains fromhere.
Japanese equities were one of the few bright spots over the monthbut Schroder Global Cities Real Estate, BNY Mellon US EquityIncome and JPM US Equity Income outperformed their benchmarks.
Past performance is not a guide to future performance. The value of investments and any income from them can fall and you may get back lessthan you invested. If you invest in currencies other than your own, fluctuations in currency value will mean that the value of your investment willmove independently of the underlying asset. The information contained in this documentation has been taken from sources stated and isbelieved to be reliable and accurate, but without further investigation cannot be warranted as to accuracy or completeness. We or a connectedperson may have positions in or options on the securities mentioned herein or may buy, sell or offer to make a purchase or sale of suchsecurities from time to time. In addition we reserve the right to act as principal or agent with regard to the sale or purchase of any securitymentioned in this document. For further information, please refer to our conflicts policy which is available on requestor can be accessed via ourwebsite at www.brewin.co.uk. eValue risk tolerance scores are based on a 10-year time horizon. The mappings are only for use by financial advisers licensed to use eValue’s risk profiling systemand does not constitute financial advice. It is the responsibility of the adviser to select the correct model appropriate for the client’s time horizon and objective. Theopinions expressed are not necessarily the views held throughout Brewin Dolphin Ltd. The Estimated Annual Yield figure is based on reasonable assumptionssupported by objective data and is no guarantee of future performance. © FinaMetricaPty Ltd. Risk tolerance scores were mapped to the funds’ strategic assetallocations as at 01/05/2020. The mappings are only for use by financial advisers licensed to use FinaMetrica’s risk profiling system and do not constitute financialadvice. Financial advisers must satisfy themselves that the funds’ current asset allocations reflect the risk/return expectations of the funds when mapped. BrewinDolphin Limited is a member of the London Stock Exchange, and is authorised and regulated by the Financial Conduct Authority (Financial Services Registerreference number: 124444).