Embed Size (px)
Citation preview
The Chartered Institute of Management Accountants 2007
Management Accounting Pillar
Managerial Level Paper
P1 – Management Accounting – Performance Evaluation
22 May 2007 – Tuesday Morning Session Instructions to candidates
You are allowed three hours to answer this question paper.
You are allowed 20 minutes reading time before the examination begins during which you should read the question paper and, if you wish, highlight and/or make notes on the question paper. However, you will not be allowed, under any circumstances, to open the answer book and start writing or use your calculator during the reading time.
You are strongly advised to carefully read ALL the question requirements before attempting the question concerned (that is, all parts and/or sub- questions). The requirements for the questions in Section C are contained in a dotted box.
ALL answers must be written in the answer book. Answers or notes written on the question paper will not be submitted for marking.
Answer the ONE compulsory question in Section A. This has 15 sub-questions and is on pages 2 to 8.
Answer ALL SIX compulsory sub-questions in Section B on pages 10 and 11.
Answer ONE of the two questions in Section C on pages 12 to 15.
Maths Tables and Formulae are provided on pages 17 to 21. These pages are detachable for ease of reference.
The list of verbs as published in the syllabus is given for reference on the inside back cover of this question paper.
Write your candidate number, the paper number and examination subject title in the spaces provided on the front of the answer book. Also write your contact ID and name in the space provided in the right hand margin and seal to close.
Tick the appropriate boxes on the front of the answer book to indicate which questions you have answered.
P1 –
Per
form
ance
Eva
luat
ion
TURN OVER
P1 2 May 2007
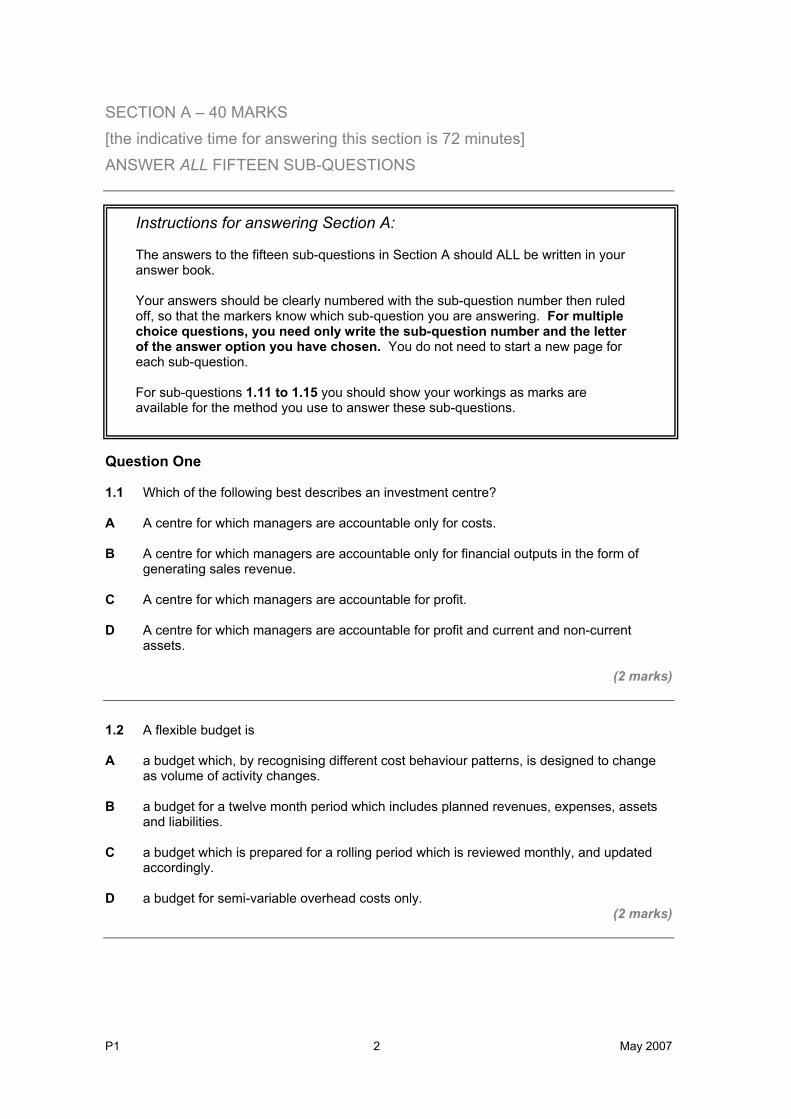
SECTION A – 40 MARKS [the indicative time for answering this section is 72 minutes] ANSWER ALL FIFTEEN SUB-QUESTIONS
Question One 1.1 Which of the following best describes an investment centre? A A centre for which managers are accountable only for costs. B A centre for which managers are accountable only for financial outputs in the form of
generating sales revenue. C A centre for which managers are accountable for profit. D A centre for which managers are accountable for profit and current and non-current
assets.
(2 marks)
1.2 A flexible budget is A a budget which, by recognising different cost behaviour patterns, is designed to change
as volume of activity changes. B a budget for a twelve month period which includes planned revenues, expenses, assets
and liabilities. C a budget which is prepared for a rolling period which is reviewed monthly, and updated
accordingly. D a budget for semi-variable overhead costs only.
(2 marks)
Instructions for answering Section A: The answers to the fifteen sub-questions in Section A should ALL be written in your answer book. Your answers should be clearly numbered with the sub-question number then ruled off, so that the markers know which sub-question you are answering. For multiple choice questions, you need only write the sub-question number and the letter of the answer option you have chosen. You do not need to start a new page for each sub-question. For sub-questions 1.11 to 1.15 you should show your workings as marks are available for the method you use to answer these sub-questions.
May 2007 3 P1
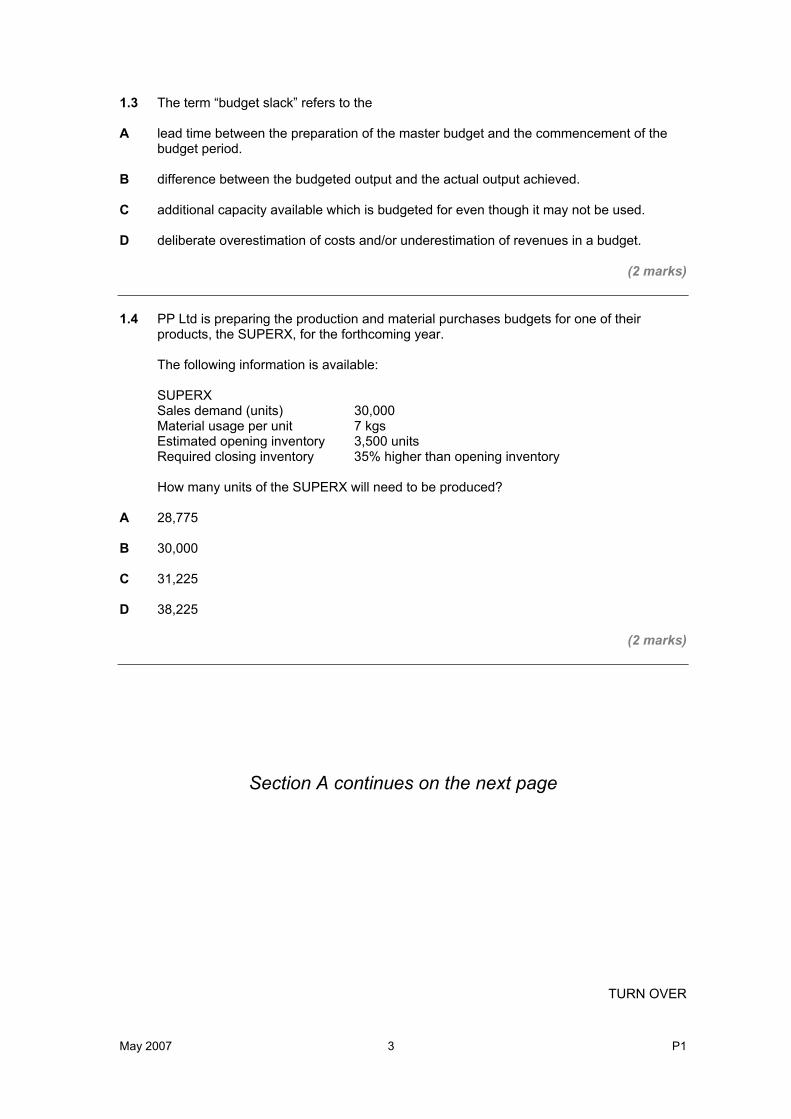
1.3 The term “budget slack” refers to the A lead time between the preparation of the master budget and the commencement of the
budget period. B difference between the budgeted output and the actual output achieved. C additional capacity available which is budgeted for even though it may not be used. D deliberate overestimation of costs and/or underestimation of revenues in a budget.
(2 marks)
1.4 PP Ltd is preparing the production and material purchases budgets for one of their
products, the SUPERX, for the forthcoming year.
The following information is available: SUPERX Sales demand (units) 30,000 Material usage per unit 7 kgs Estimated opening inventory 3,500 units Required closing inventory 35% higher than opening inventory
How many units of the SUPERX will need to be produced? A 28,775 B 30,000 C 31,225 D 38,225
(2 marks)
Section A continues on the next page
TURN OVER
P1 4 May 2007
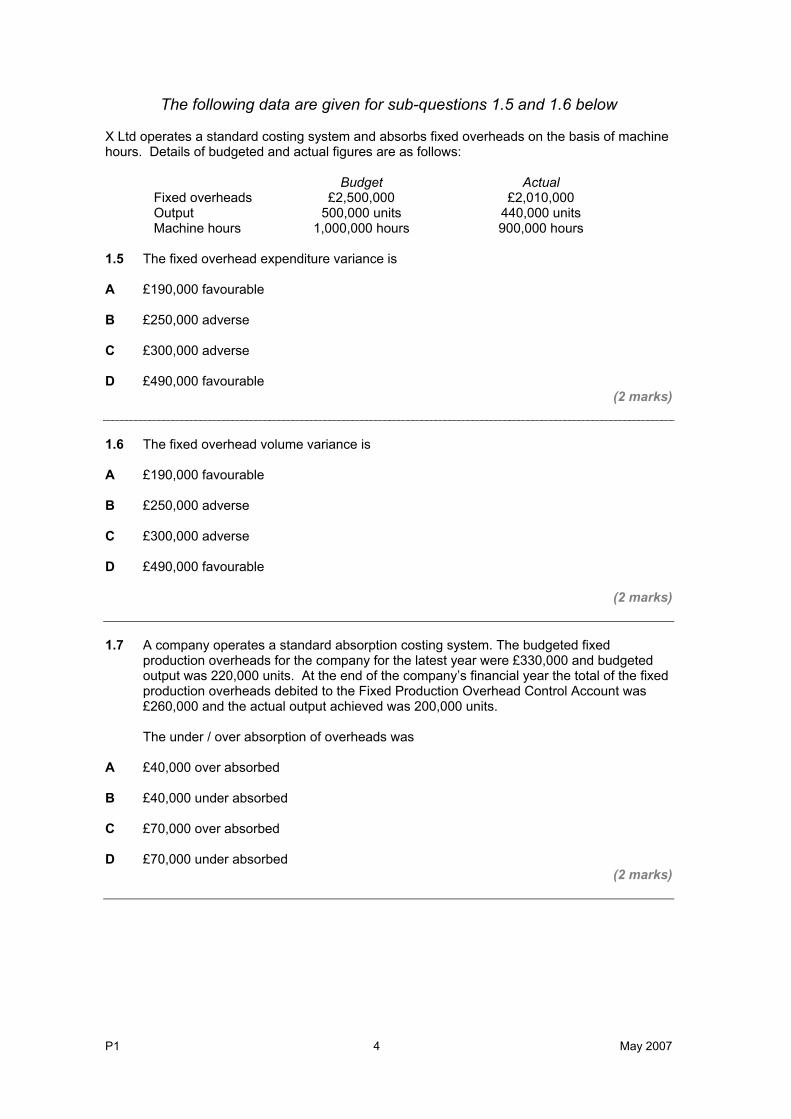
The following data are given for sub-questions 1.5 and 1.6 below X Ltd operates a standard costing system and absorbs fixed overheads on the basis of machine hours. Details of budgeted and actual figures are as follows:
Budget Actual Fixed overheads £2,500,000 £2,010,000 Output 500,000 units 440,000 units Machine hours 1,000,000 hours 900,000 hours
1.5 The fixed overhead expenditure variance is A £190,000 favourable B £250,000 adverse C £300,000 adverse D £490,000 favourable
(2 marks) 1.6 The fixed overhead volume variance is A £190,000 favourable B £250,000 adverse C £300,000 adverse D £490,000 favourable
(2 marks) 1.7 A company operates a standard absorption costing system. The budgeted fixed
production overheads for the company for the latest year were £330,000 and budgeted output was 220,000 units. At the end of the company’s financial year the total of the fixed production overheads debited to the Fixed Production Overhead Control Account was £260,000 and the actual output achieved was 200,000 units.
The under / over absorption of overheads was
A £40,000 over absorbed
B £40,000 under absorbed
C £70,000 over absorbed
D £70,000 under absorbed (2 marks)
May 2007 5 P1
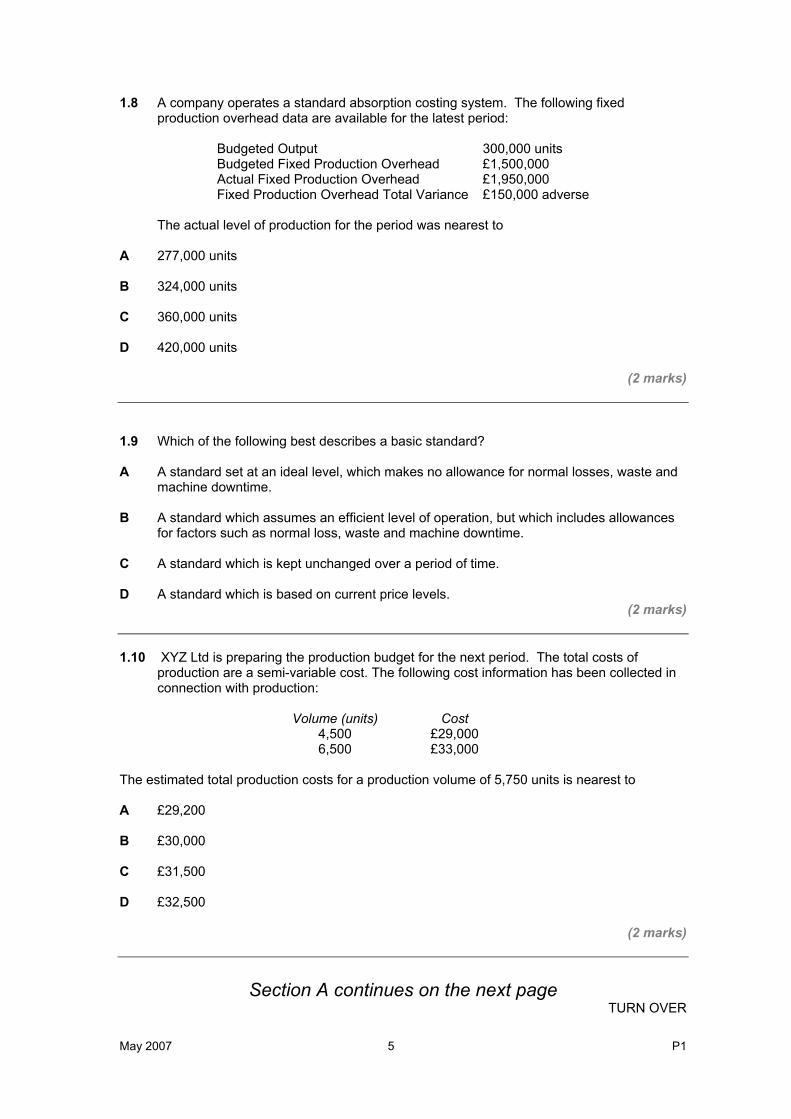
1.8 A company operates a standard absorption costing system. The following fixed production overhead data are available for the latest period:
Budgeted Output 300,000 units Budgeted Fixed Production Overhead £1,500,000 Actual Fixed Production Overhead £1,950,000 Fixed Production Overhead Total Variance £150,000 adverse
The actual level of production for the period was nearest to
A 277,000 units
B 324,000 units
C 360,000 units
D 420,000 units
(2 marks)
1.9 Which of the following best describes a basic standard? A A standard set at an ideal level, which makes no allowance for normal losses, waste and
machine downtime. B A standard which assumes an efficient level of operation, but which includes allowances
for factors such as normal loss, waste and machine downtime. C A standard which is kept unchanged over a period of time. D A standard which is based on current price levels.
(2 marks)
1.10 XYZ Ltd is preparing the production budget for the next period. The total costs of
production are a semi-variable cost. The following cost information has been collected in connection with production:
Volume (units) Cost
4,500 £29,000 6,500 £33,000
The estimated total production costs for a production volume of 5,750 units is nearest to A £29,200
B £30,000
C £31,500
D £32,500
(2 marks)
Section A continues on the next page TURN OVER
P1 6 May 2007
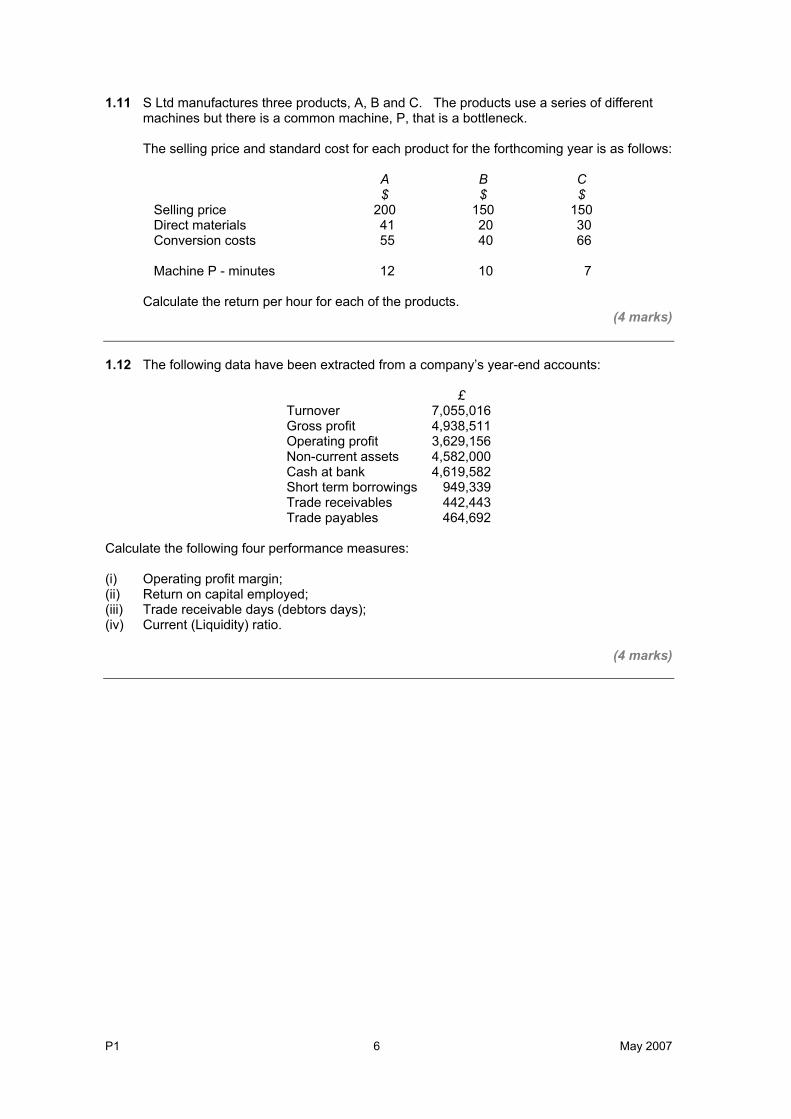
1.11 S Ltd manufactures three products, A, B and C. The products use a series of different machines but there is a common machine, P, that is a bottleneck.
The selling price and standard cost for each product for the forthcoming year is as follows:
A B C $ $ $ Selling price 200 150 150 Direct materials 41 20 30 Conversion costs 55 40 66 Machine P - minutes 12 10 7
Calculate the return per hour for each of the products.
(4 marks) 1.12 The following data have been extracted from a company’s year-end accounts:
£ Turnover 7,055,016Gross profit 4,938,511Operating profit 3,629,156Non-current assets 4,582,000Cash at bank 4,619,582Short term borrowings 949,339Trade receivables 442,443Trade payables 464,692
Calculate the following four performance measures: (i) Operating profit margin; (ii) Return on capital employed; (iii) Trade receivable days (debtors days); (iv) Current (Liquidity) ratio.
(4 marks)
May 2007 7 P1
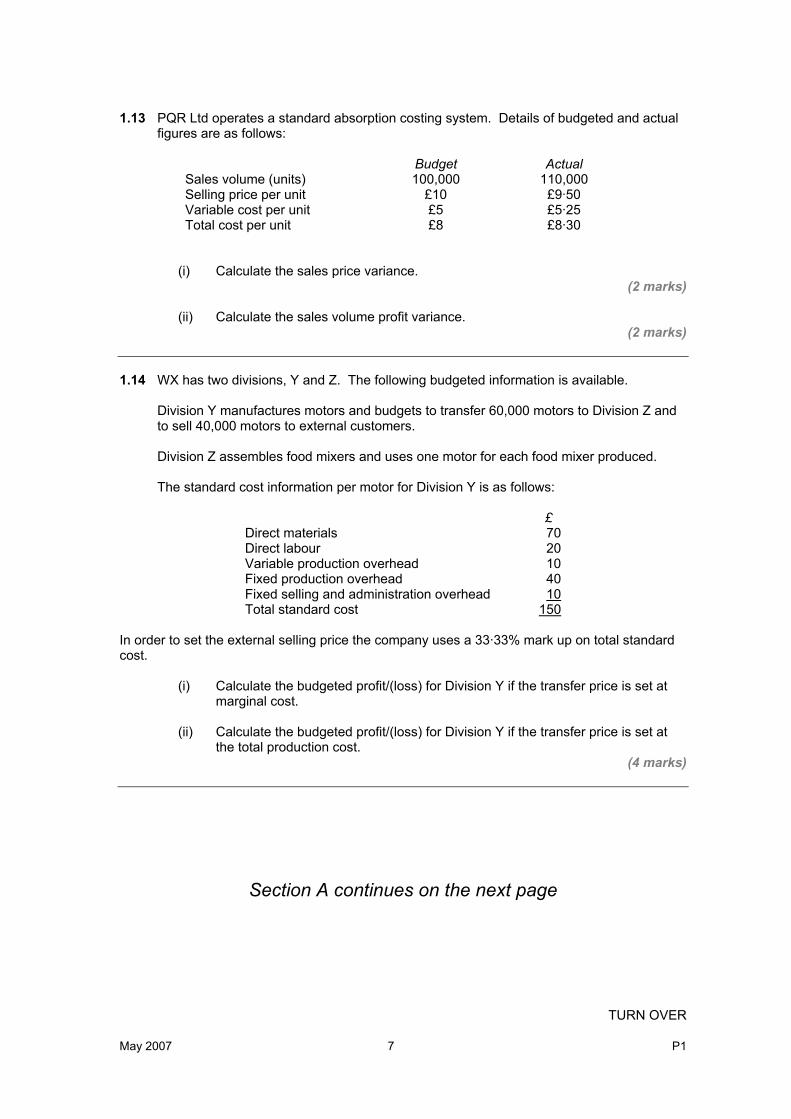
1.13 PQR Ltd operates a standard absorption costing system. Details of budgeted and actual
figures are as follows:
Budget Actual Sales volume (units) 100,000 110,000 Selling price per unit £10 £9·50 Variable cost per unit £5 £5·25 Total cost per unit £8 £8·30
(i) Calculate the sales price variance. (2 marks)
(ii) Calculate the sales volume profit variance.
(2 marks)
1.14 WX has two divisions, Y and Z. The following budgeted information is available.
Division Y manufactures motors and budgets to transfer 60,000 motors to Division Z and to sell 40,000 motors to external customers.
Division Z assembles food mixers and uses one motor for each food mixer produced.
The standard cost information per motor for Division Y is as follows:
£ Direct materials 70 Direct labour 20 Variable production overhead 10 Fixed production overhead 40 Fixed selling and administration overhead 10 Total standard cost 150
In order to set the external selling price the company uses a 33·33% mark up on total standard cost.
(i) Calculate the budgeted profit/(loss) for Division Y if the transfer price is set at marginal cost.
(ii) Calculate the budgeted profit/(loss) for Division Y if the transfer price is set at
the total production cost. (4 marks)
Section A continues on the next page
TURN OVER
P1 8 May 2007
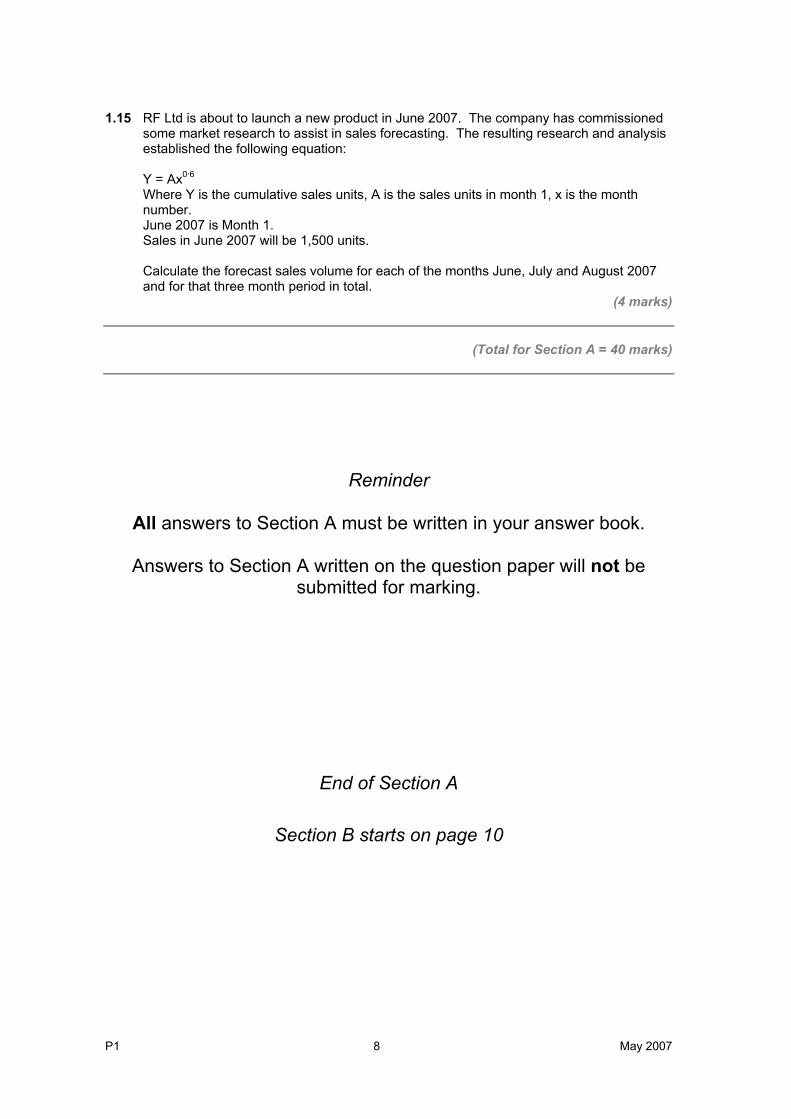
1.15 RF Ltd is about to launch a new product in June 2007. The company has commissioned
some market research to assist in sales forecasting. The resulting research and analysis established the following equation:
Y = Ax0·6 Where Y is the cumulative sales units, A is the sales units in month 1, x is the month number. June 2007 is Month 1. Sales in June 2007 will be 1,500 units.
Calculate the forecast sales volume for each of the months June, July and August 2007 and for that three month period in total.
(4 marks)
(Total for Section A = 40 marks)
Reminder
All answers to Section A must be written in your answer book.
Answers to Section A written on the question paper will not be submitted for marking.
End of Section A
Section B starts on page 10

May 2007 9 P1
[this page is blank]
P1 10 May 2007
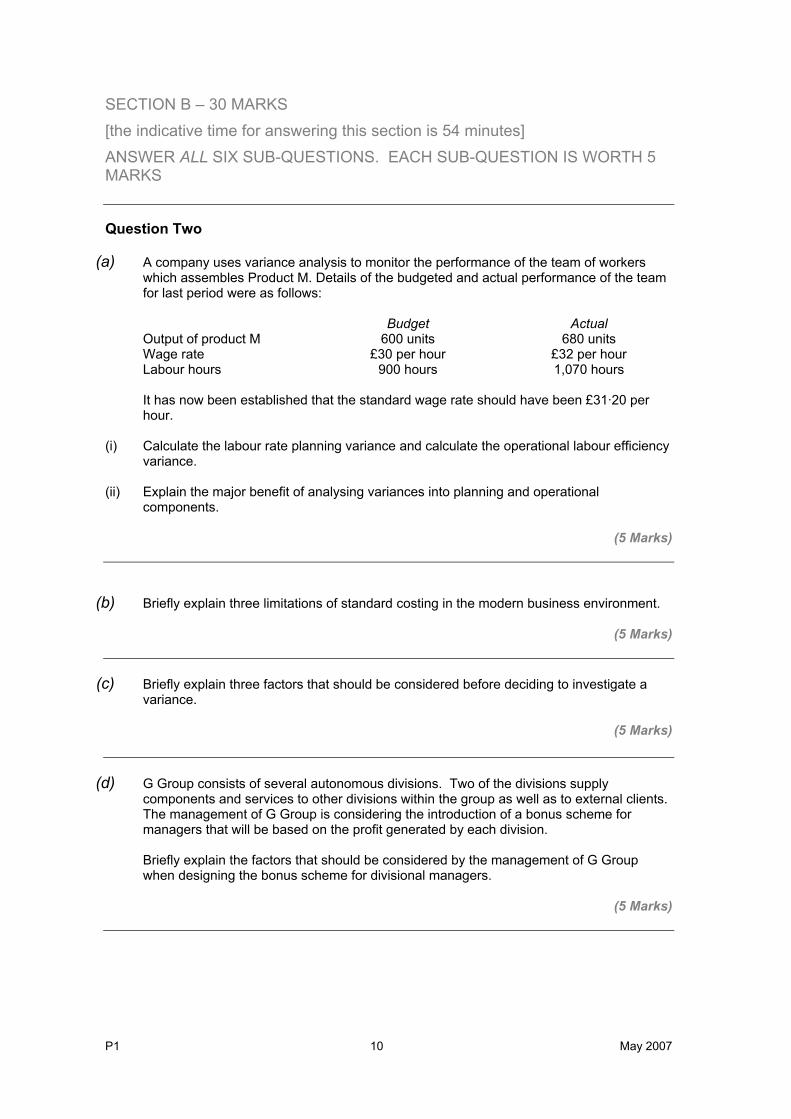
SECTION B – 30 MARKS [the indicative time for answering this section is 54 minutes] ANSWER ALL SIX SUB-QUESTIONS. EACH SUB-QUESTION IS WORTH 5 MARKS Question Two
(a) A company uses variance analysis to monitor the performance of the team of workers which assembles Product M. Details of the budgeted and actual performance of the team for last period were as follows:
Budget Actual Output of product M 600 units 680 units Wage rate £30 per hour £32 per hour Labour hours 900 hours 1,070 hours
It has now been established that the standard wage rate should have been £31·20 per hour.
(i) Calculate the labour rate planning variance and calculate the operational labour efficiency
variance. (ii) Explain the major benefit of analysing variances into planning and operational
components.
(5 Marks)
(b) Briefly explain three limitations of standard costing in the modern business environment.
(5 Marks)
(c) Briefly explain three factors that should be considered before deciding to investigate a
variance.
(5 Marks)
(d) G Group consists of several autonomous divisions. Two of the divisions supply components and services to other divisions within the group as well as to external clients. The management of G Group is considering the introduction of a bonus scheme for managers that will be based on the profit generated by each division.
Briefly explain the factors that should be considered by the management of G Group when designing the bonus scheme for divisional managers.
(5 Marks)
May 2007 11 P1
(e) Briefly explain the role of a Manufacturing Resource Planning System in supporting a
standard costing system.
(5 Marks)
(f) Briefly explain the main differences between the traditional manufacturing environment and a just-in-time manufacturing environment.
(5 marks) (Total for Question Two = 30 marks)
(Total for Section B = 30 marks)
End of Section B
Section C starts on page 12
TURN OVER
P1 12 May 2007
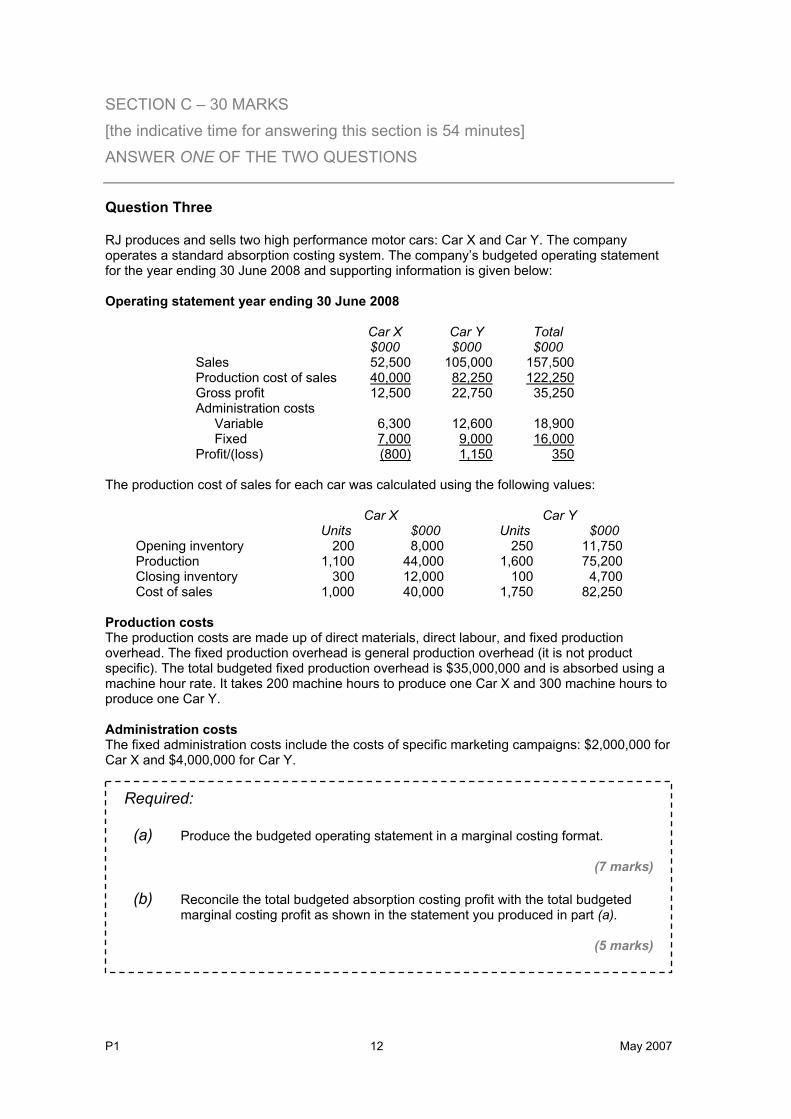
SECTION C – 30 MARKS [the indicative time for answering this section is 54 minutes] ANSWER ONE OF THE TWO QUESTIONS
Question Three RJ produces and sells two high performance motor cars: Car X and Car Y. The company operates a standard absorption costing system. The company’s budgeted operating statement for the year ending 30 June 2008 and supporting information is given below: Operating statement year ending 30 June 2008
Car X Car Y Total $000 $000 $000 Sales 52,500 105,000 157,500 Production cost of sales 40,000 82,250 122,250 Gross profit 12,500 22,750 35,250 Administration costs
Variable 6,300 12,600 18,900 Fixed 7,000 9,000 16,000
Profit/(loss) (800) 1,150 350 The production cost of sales for each car was calculated using the following values:
Car X Car Y Units $000 Units $000 Opening inventory 200 8,000 250 11,750 Production 1,100 44,000 1,600 75,200 Closing inventory 300 12,000 100 4,700 Cost of sales 1,000 40,000 1,750 82,250
Production costs The production costs are made up of direct materials, direct labour, and fixed production overhead. The fixed production overhead is general production overhead (it is not product specific). The total budgeted fixed production overhead is $35,000,000 and is absorbed using a machine hour rate. It takes 200 machine hours to produce one Car X and 300 machine hours to produce one Car Y. Administration costs The fixed administration costs include the costs of specific marketing campaigns: $2,000,000 for Car X and $4,000,000 for Car Y.
Required:
(a) Produce the budgeted operating statement in a marginal costing format.
(7 marks)
(b) Reconcile the total budgeted absorption costing profit with the total budgeted
marginal costing profit as shown in the statement you produced in part (a).
(5 marks)
May 2007 13 P1
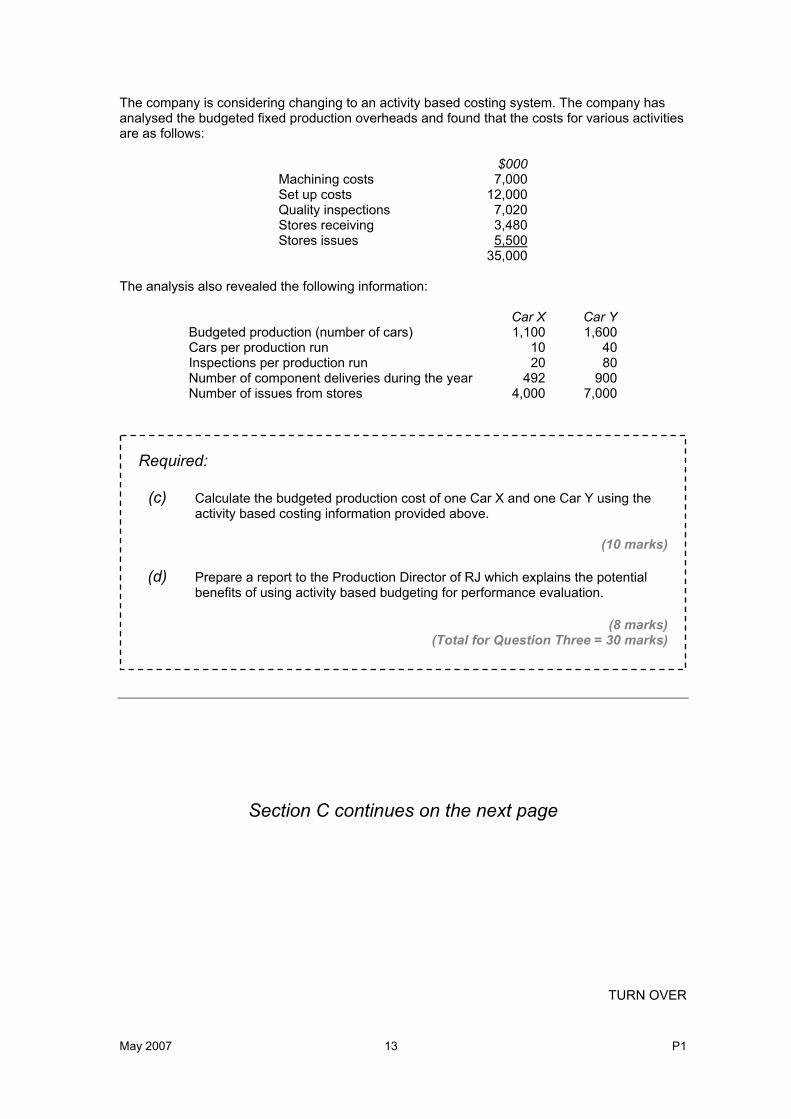
The company is considering changing to an activity based costing system. The company has analysed the budgeted fixed production overheads and found that the costs for various activities are as follows:
$000 Machining costs 7,000Set up costs 12,000Quality inspections 7,020Stores receiving 3,480Stores issues 5,500 35,000
The analysis also revealed the following information:
Car X Car Y Budgeted production (number of cars) 1,100 1,600 Cars per production run 10 40 Inspections per production run 20 80 Number of component deliveries during the year 492 900 Number of issues from stores 4,000 7,000
Required:
(c) Calculate the budgeted production cost of one Car X and one Car Y using the activity based costing information provided above.
(10 marks)
(d) Prepare a report to the Production Director of RJ which explains the potential
benefits of using activity based budgeting for performance evaluation.
(8 marks) (Total for Question Three = 30 marks)
Section C continues on the next page
TURN OVER
P1 14 May 2007
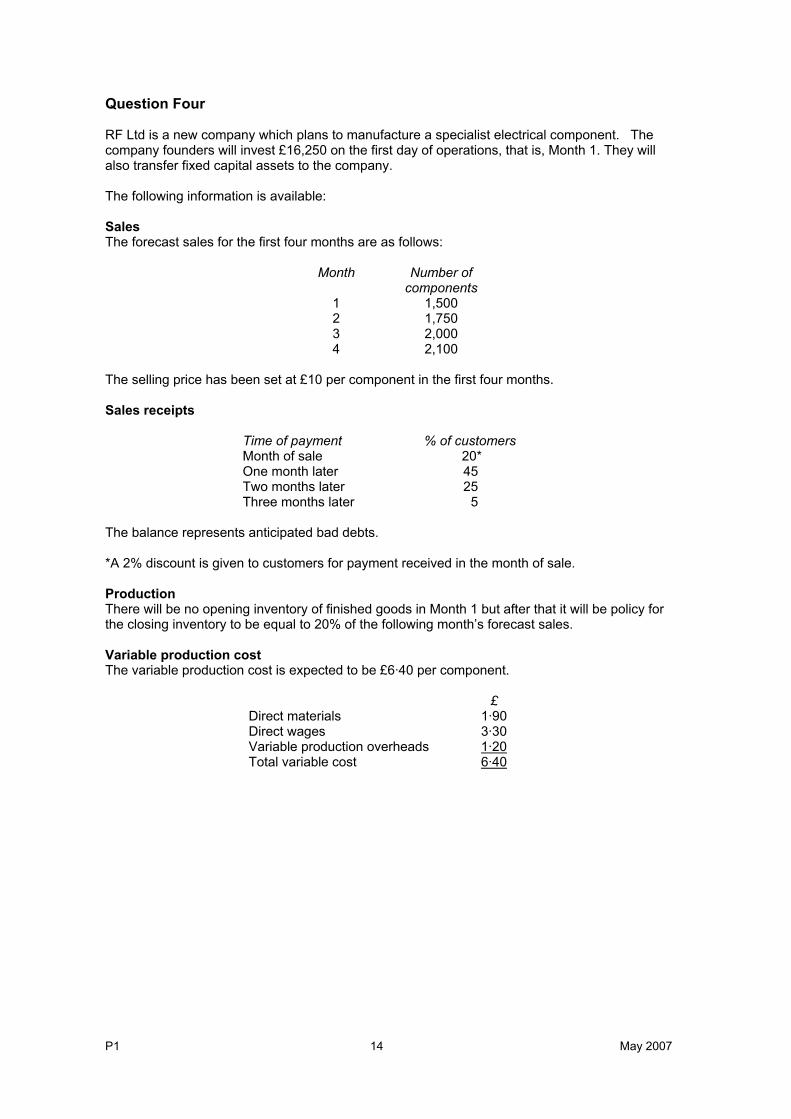
Question Four
RF Ltd is a new company which plans to manufacture a specialist electrical component. The company founders will invest £16,250 on the first day of operations, that is, Month 1. They will also transfer fixed capital assets to the company. The following information is available: Sales The forecast sales for the first four months are as follows:
Month Number of components
1 1,500 2 1,750 3 2,000 4 2,100
The selling price has been set at £10 per component in the first four months. Sales receipts
Time of payment % of customers Month of sale 20* One month later 45 Two months later 25 Three months later 5
The balance represents anticipated bad debts. *A 2% discount is given to customers for payment received in the month of sale. Production There will be no opening inventory of finished goods in Month 1 but after that it will be policy for the closing inventory to be equal to 20% of the following month’s forecast sales. Variable production cost The variable production cost is expected to be £6·40 per component.
£ Direct materials 1·90 Direct wages 3·30 Variable production overheads 1·20 Total variable cost 6·40
May 2007 15 P1
Notes: Direct materials: 100% of the materials required for production will be purchased in the month of production. No inventory of materials will be held. Direct materials will be paid for in the month following purchase. Direct wages will be paid in the month in which production occurs. Variable production overheads: 60% will be paid in the month in which production occurs and the remainder will be paid one month later. Fixed overhead costs Fixed overhead costs are estimated at £75,000 per annum and are expected to be incurred in equal amounts each month. 60% of the fixed overhead costs will be paid in the month in which they are incurred and 30% in the following month. The balance represents depreciation of fixed assets. Calculations are to be made to the nearest £1. Ignore VAT and Tax.
Required:
(a) Prepare a cash budget for each of the first three months and in total. (15 marks)
(b) There is some uncertainty about the direct material cost. It is thought that the
direct material cost per component could range between £1·50 and £2·20. Calculate the budgeted total net cash flow for the three month period if the cost of the direct material is:
(i) £1.50 per component; or (ii) £2.20 per component.
(6 marks)
(c) Using your answers to part (a) and (b) above, prepare a report to the management of RF Ltd that discusses the benefits or otherwise of performing ‘what if’ analysis when preparing cash budgets.
(9 marks)
(Total for Question Four = 30 marks)
(Total for Section C = 30 marks)
End of question paper Maths Tables and Formulae are on pages 17 to 21
TURN OVER

P1 16 May 2007
[this page is blank]
May 2007 17 P1
P1 18 May 2007
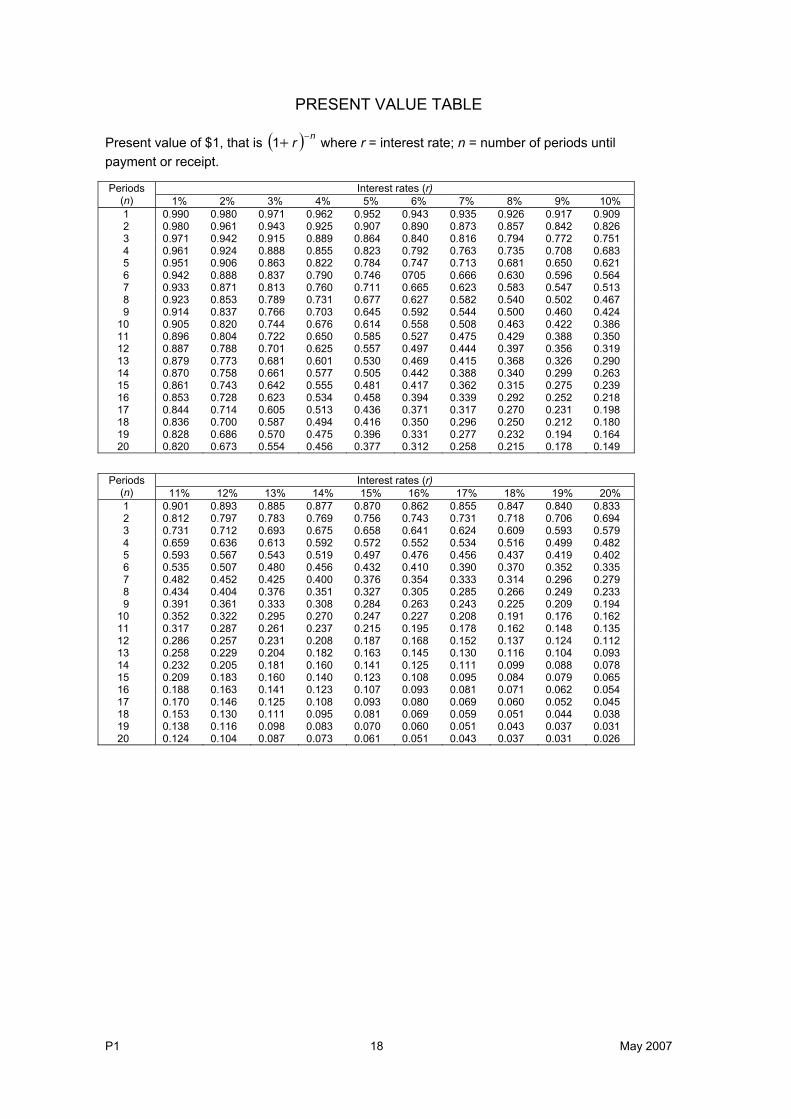
PRESENT VALUE TABLE
Present value of $1, that is ( ) nr −+1 where r = interest rate; n = number of periods until payment or receipt.
Interest rates (r) Periods (n) 1% 2% 3% 4% 5% 6% 7% 8% 9% 10%
1 0.990 0.980 0.971 0.962 0.952 0.943 0.935 0.926 0.917 0.909 2 0.980 0.961 0.943 0.925 0.907 0.890 0.873 0.857 0.842 0.826 3 0.971 0.942 0.915 0.889 0.864 0.840 0.816 0.794 0.772 0.751 4 0.961 0.924 0.888 0.855 0.823 0.792 0.763 0.735 0.708 0.683 5 0.951 0.906 0.863 0.822 0.784 0.747 0.713 0.681 0.650 0.621 6 0.942 0.888 0.837 0.790 0.746 0705 0.666 0.630 0.596 0.564 7 0.933 0.871 0.813 0.760 0.711 0.665 0.623 0.583 0.547 0.513 8 0.923 0.853 0.789 0.731 0.677 0.627 0.582 0.540 0.502 0.467 9 0.914 0.837 0.766 0.703 0.645 0.592 0.544 0.500 0.460 0.424 10 0.905 0.820 0.744 0.676 0.614 0.558 0.508 0.463 0.422 0.386 11 0.896 0.804 0.722 0.650 0.585 0.527 0.475 0.429 0.388 0.350 12 0.887 0.788 0.701 0.625 0.557 0.497 0.444 0.397 0.356 0.319 13 0.879 0.773 0.681 0.601 0.530 0.469 0.415 0.368 0.326 0.290 14 0.870 0.758 0.661 0.577 0.505 0.442 0.388 0.340 0.299 0.263 15 0.861 0.743 0.642 0.555 0.481 0.417 0.362 0.315 0.275 0.239 16 0.853 0.728 0.623 0.534 0.458 0.394 0.339 0.292 0.252 0.218 17 0.844 0.714 0.605 0.513 0.436 0.371 0.317 0.270 0.231 0.198 18 0.836 0.700 0.587 0.494 0.416 0.350 0.296 0.250 0.212 0.180 19 0.828 0.686 0.570 0.475 0.396 0.331 0.277 0.232 0.194 0.164 20 0.820 0.673 0.554 0.456 0.377 0.312 0.258 0.215 0.178 0.149
Interest rates (r) Periods
(n) 11% 12% 13% 14% 15% 16% 17% 18% 19% 20% 1 0.901 0.893 0.885 0.877 0.870 0.862 0.855 0.847 0.840 0.833 2 0.812 0.797 0.783 0.769 0.756 0.743 0.731 0.718 0.706 0.694 3 0.731 0.712 0.693 0.675 0.658 0.641 0.624 0.609 0.593 0.579 4 0.659 0.636 0.613 0.592 0.572 0.552 0.534 0.516 0.499 0.482 5 0.593 0.567 0.543 0.519 0.497 0.476 0.456 0.437 0.419 0.402 6 0.535 0.507 0.480 0.456 0.432 0.410 0.390 0.370 0.352 0.335 7 0.482 0.452 0.425 0.400 0.376 0.354 0.333 0.314 0.296 0.279 8 0.434 0.404 0.376 0.351 0.327 0.305 0.285 0.266 0.249 0.233 9 0.391 0.361 0.333 0.308 0.284 0.263 0.243 0.225 0.209 0.194 10 0.352 0.322 0.295 0.270 0.247 0.227 0.208 0.191 0.176 0.162 11 0.317 0.287 0.261 0.237 0.215 0.195 0.178 0.162 0.148 0.135 12 0.286 0.257 0.231 0.208 0.187 0.168 0.152 0.137 0.124 0.112 13 0.258 0.229 0.204 0.182 0.163 0.145 0.130 0.116 0.104 0.093 14 0.232 0.205 0.181 0.160 0.141 0.125 0.111 0.099 0.088 0.078 15 0.209 0.183 0.160 0.140 0.123 0.108 0.095 0.084 0.079 0.065 16 0.188 0.163 0.141 0.123 0.107 0.093 0.081 0.071 0.062 0.054 17 0.170 0.146 0.125 0.108 0.093 0.080 0.069 0.060 0.052 0.045 18 0.153 0.130 0.111 0.095 0.081 0.069 0.059 0.051 0.044 0.038 19 0.138 0.116 0.098 0.083 0.070 0.060 0.051 0.043 0.037 0.031 20 0.124 0.104 0.087 0.073 0.061 0.051 0.043 0.037 0.031 0.026
May 2007 19 P1
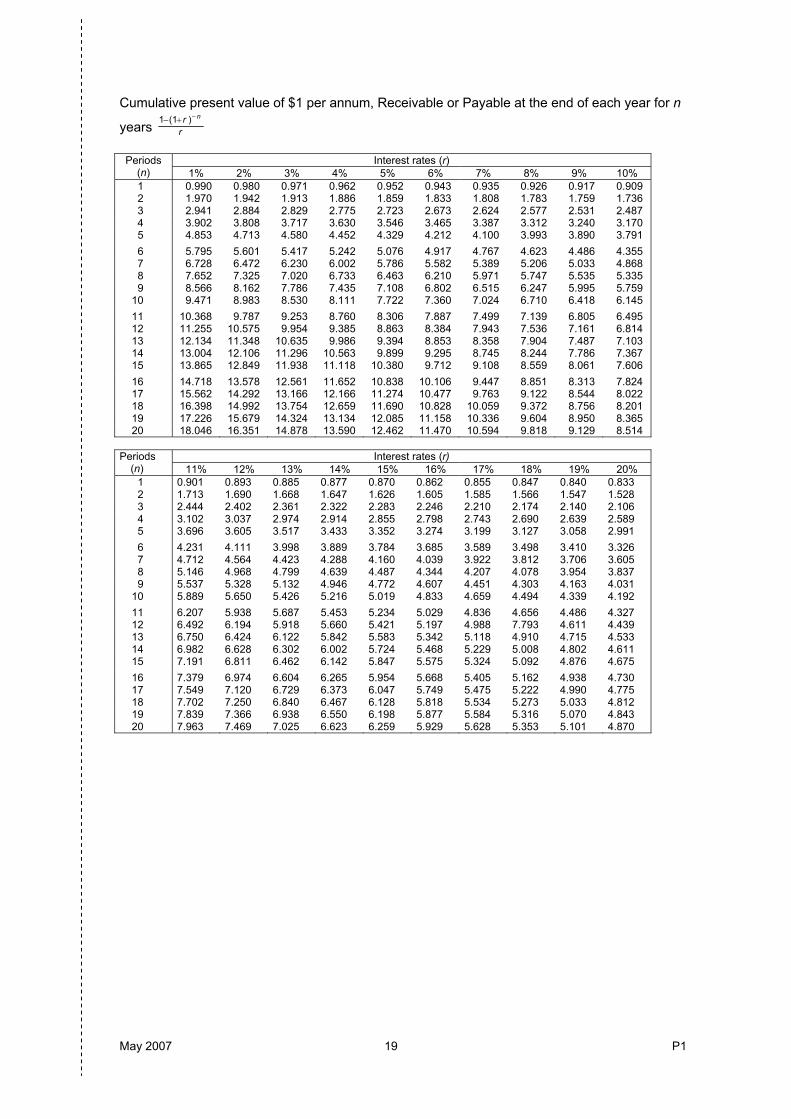
Cumulative present value of $1 per annum, Receivable or Payable at the end of each year for n
years rr n−+− )(11
Interest rates (r) Periods
(n) 1% 2% 3% 4% 5% 6% 7% 8% 9% 10% 1 0.990 0.980 0.971 0.962 0.952 0.943 0.935 0.926 0.917 0.909 2 1.970 1.942 1.913 1.886 1.859 1.833 1.808 1.783 1.759 1.736 3 2.941 2.884 2.829 2.775 2.723 2.673 2.624 2.577 2.531 2.487 4 3.902 3.808 3.717 3.630 3.546 3.465 3.387 3.312 3.240 3.170 5 4.853 4.713 4.580 4.452 4.329 4.212 4.100 3.993 3.890 3.791 6 5.795 5.601 5.417 5.242 5.076 4.917 4.767 4.623 4.486 4.355 7 6.728 6.472 6.230 6.002 5.786 5.582 5.389 5.206 5.033 4.868 8 7.652 7.325 7.020 6.733 6.463 6.210 5.971 5.747 5.535 5.335 9 8.566 8.162 7.786 7.435 7.108 6.802 6.515 6.247 5.995 5.759 10 9.471 8.983 8.530 8.111 7.722 7.360 7.024 6.710 6.418 6.145 11 10.368 9.787 9.253 8.760 8.306 7.887 7.499 7.139 6.805 6.495 12 11.255 10.575 9.954 9.385 8.863 8.384 7.943 7.536 7.161 6.814 13 12.134 11.348 10.635 9.986 9.394 8.853 8.358 7.904 7.487 7.103 14 13.004 12.106 11.296 10.563 9.899 9.295 8.745 8.244 7.786 7.367 15 13.865 12.849 11.938 11.118 10.380 9.712 9.108 8.559 8.061 7.606 16 14.718 13.578 12.561 11.652 10.838 10.106 9.447 8.851 8.313 7.824 17 15.562 14.292 13.166 12.166 11.274 10.477 9.763 9.122 8.544 8.022 18 16.398 14.992 13.754 12.659 11.690 10.828 10.059 9.372 8.756 8.201 19 17.226 15.679 14.324 13.134 12.085 11.158 10.336 9.604 8.950 8.365 20 18.046 16.351 14.878 13.590 12.462 11.470 10.594 9.818 9.129 8.514
Interest rates (r) Periods
(n) 11% 12% 13% 14% 15% 16% 17% 18% 19% 20% 1 0.901 0.893 0.885 0.877 0.870 0.862 0.855 0.847 0.840 0.833 2 1.713 1.690 1.668 1.647 1.626 1.605 1.585 1.566 1.547 1.528 3 2.444 2.402 2.361 2.322 2.283 2.246 2.210 2.174 2.140 2.106 4 3.102 3.037 2.974 2.914 2.855 2.798 2.743 2.690 2.639 2.589 5 3.696 3.605 3.517 3.433 3.352 3.274 3.199 3.127 3.058 2.991 6 4.231 4.111 3.998 3.889 3.784 3.685 3.589 3.498 3.410 3.326 7 4.712 4.564 4.423 4.288 4.160 4.039 3.922 3.812 3.706 3.605 8 5.146 4.968 4.799 4.639 4.487 4.344 4.207 4.078 3.954 3.837 9 5.537 5.328 5.132 4.946 4.772 4.607 4.451 4.303 4.163 4.031 10 5.889 5.650 5.426 5.216 5.019 4.833 4.659 4.494 4.339 4.192 11 6.207 5.938 5.687 5.453 5.234 5.029 4.836 4.656 4.486 4.327 12 6.492 6.194 5.918 5.660 5.421 5.197 4.988 7.793 4.611 4.439 13 6.750 6.424 6.122 5.842 5.583 5.342 5.118 4.910 4.715 4.533 14 6.982 6.628 6.302 6.002 5.724 5.468 5.229 5.008 4.802 4.611 15 7.191 6.811 6.462 6.142 5.847 5.575 5.324 5.092 4.876 4.675 16 7.379 6.974 6.604 6.265 5.954 5.668 5.405 5.162 4.938 4.730 17 7.549 7.120 6.729 6.373 6.047 5.749 5.475 5.222 4.990 4.775 18 7.702 7.250 6.840 6.467 6.128 5.818 5.534 5.273 5.033 4.812 19 7.839 7.366 6.938 6.550 6.198 5.877 5.584 5.316 5.070 4.843 20 7.963 7.469 7.025 6.623 6.259 5.929 5.628 5.353 5.101 4.870
P1 20 May 2007
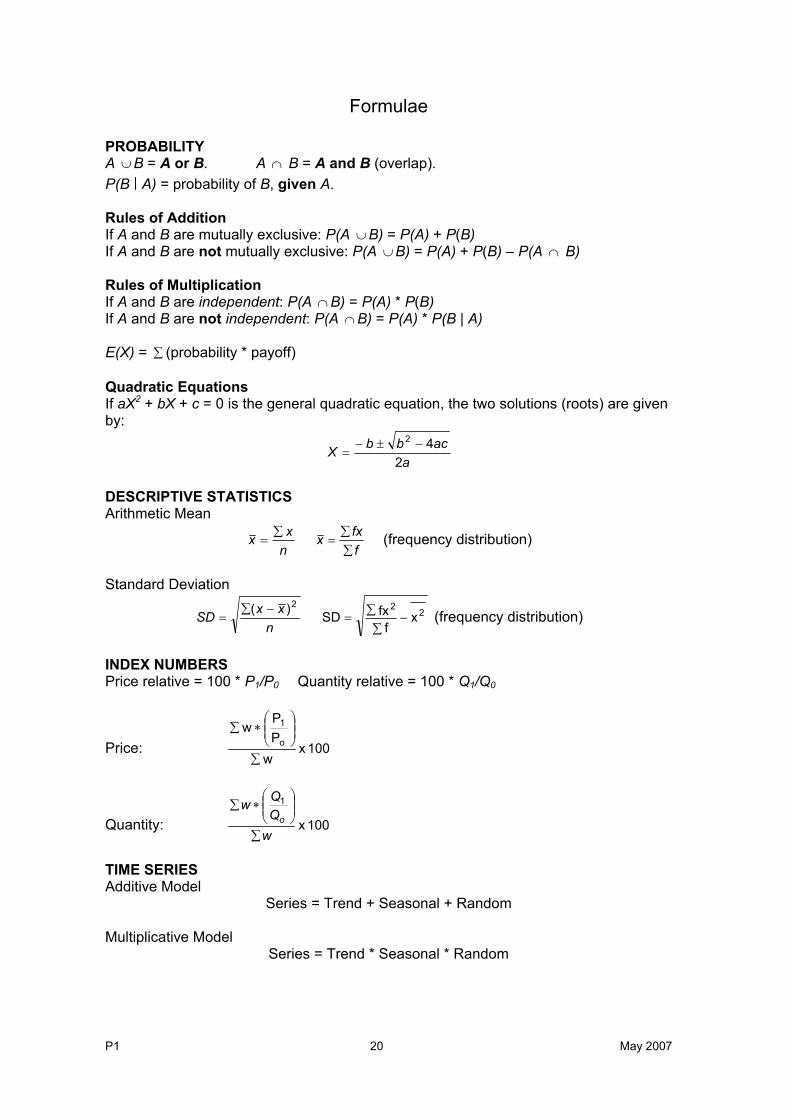
Formulae
PROBABILITY A ∪B = A or B. A ∩ B = A and B (overlap). P(B A) = probability of B, given A. Rules of Addition If A and B are mutually exclusive: P(A ∪B) = P(A) + P(B) If A and B are not mutually exclusive: P(A ∪B) = P(A) + P(B) – P(A ∩ B) Rules of Multiplication If A and B are independent: P(A ∩B) = P(A) * P(B) If A and B are not independent: P(A ∩B) = P(A) * P(B | A) E(X) = ∑ (probability * payoff) Quadratic Equations If aX2 + bX + c = 0 is the general quadratic equation, the two solutions (roots) are given by:
aacbbX
242 −±−
=
DESCRIPTIVE STATISTICS Arithmetic Mean
nxx ∑
= ffxx
∑∑
= (frequency distribution)
Standard Deviation
nxxSD
2)( −∑= 2
2x
ffxSD −∑∑= (frequency distribution)
INDEX NUMBERS Price relative = 100 * P1/P0 Quantity relative = 100 * Q1/Q0
Price: 100 x w
PP
wo
1
∑
∗∑
Quantity: 100 x
1
wQQw
o
∑
∗∑
TIME SERIES Additive Model
Series = Trend + Seasonal + Random Multiplicative Model
Series = Trend * Seasonal * Random
May 2007 21 P1
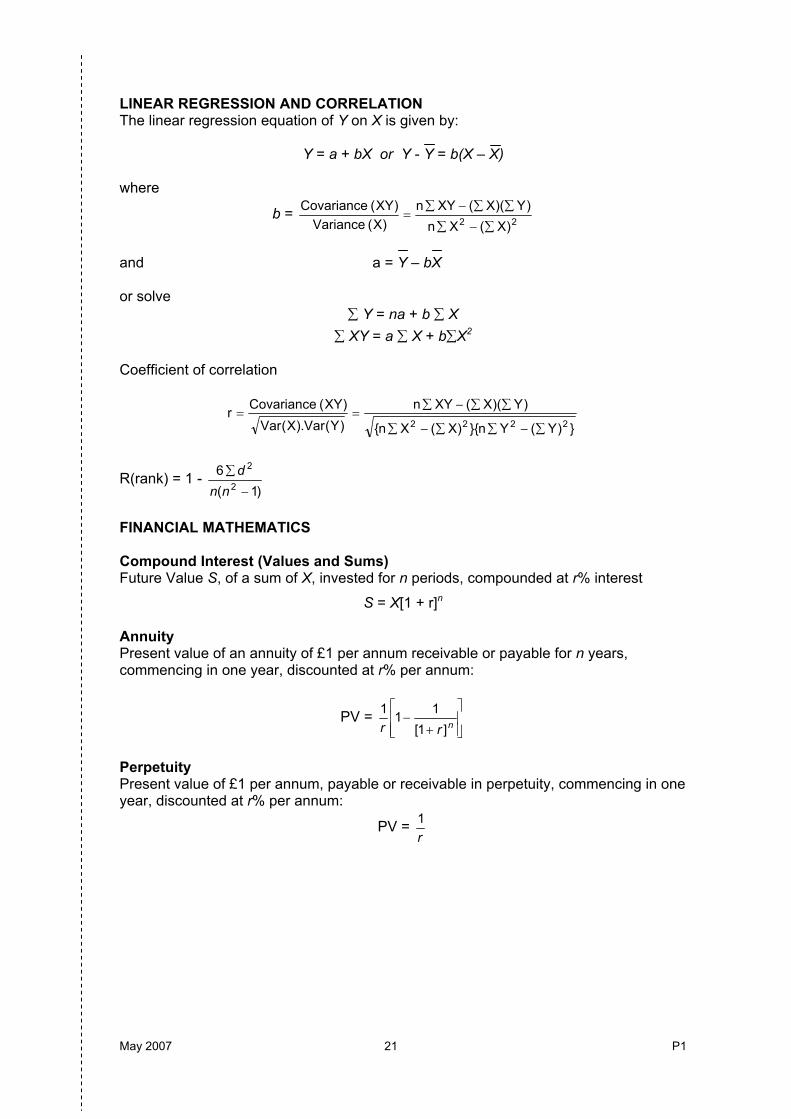
LINEAR REGRESSION AND CORRELATION The linear regression equation of Y on X is given by:
Y = a + bX or Y - Y = b(X – X) where
b = 22 )X(Xn
)Y)(X(XYn)X( Variance
)XY( Covariance∑−∑
∑∑−∑=
and a = Y – bX or solve
∑ Y = na + b ∑ X ∑ XY = a ∑ X + b∑X2
Coefficient of correlation
})Y(Yn}{)X(Xn{
)Y)(X(XYn)Y(Var).X(Var)XY( Covariancer
2222 ∑−∑∑−∑
∑∑−∑==
R(rank) = 1 - )1(
62
2
−
∑
nnd
FINANCIAL MATHEMATICS Compound Interest (Values and Sums) Future Value S, of a sum of X, invested for n periods, compounded at r% interest
S = X[1 + r]n Annuity Present value of an annuity of £1 per annum receivable or payable for n years, commencing in one year, discounted at r% per annum:
PV =
+−
nrr ]1[111
Perpetuity Present value of £1 per annum, payable or receivable in perpetuity, commencing in one year, discounted at r% per annum:
PV = r1

P1 22 May 2007
[this page is blank]
May 2007 23 P1
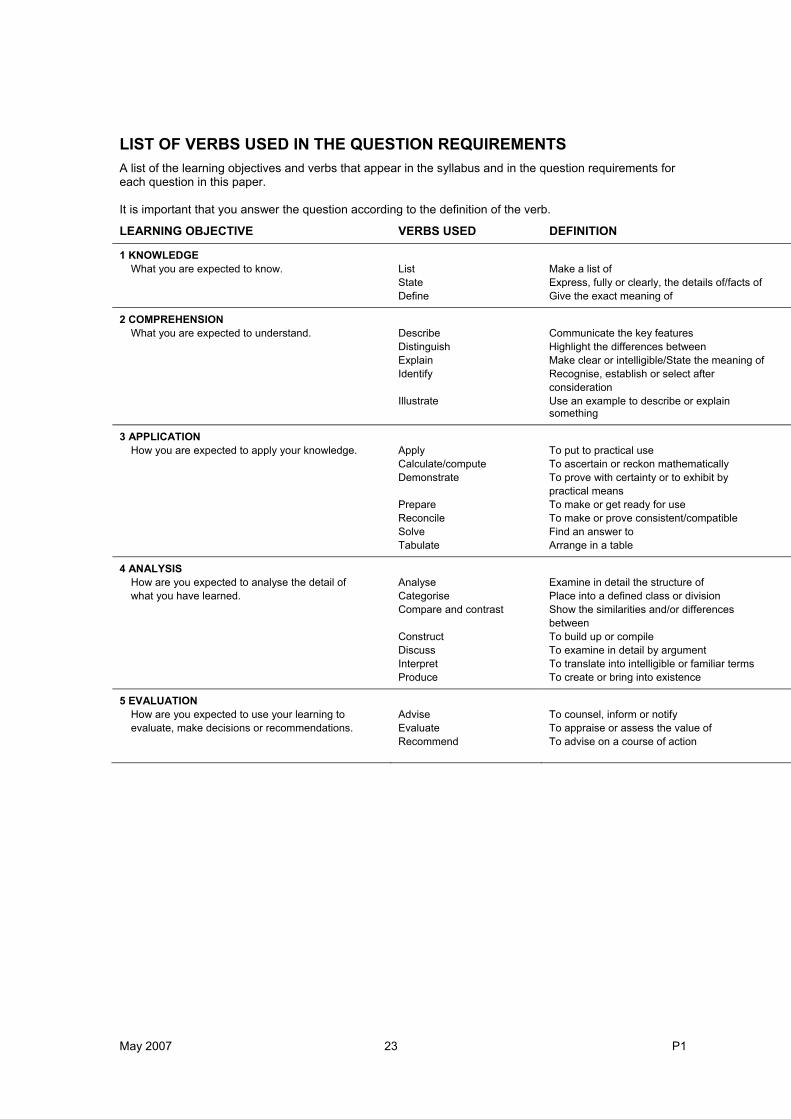
LIST OF VERBS USED IN THE QUESTION REQUIREMENTS A list of the learning objectives and verbs that appear in the syllabus and in the question requirements for each question in this paper. It is important that you answer the question according to the definition of the verb.
LEARNING OBJECTIVE VERBS USED DEFINITION
1 KNOWLEDGE
What you are expected to know. List Make a list of State Express, fully or clearly, the details of/facts of Define Give the exact meaning of
2 COMPREHENSION What you are expected to understand. Describe Communicate the key features
Distinguish Highlight the differences between Explain Make clear or intelligible/State the meaning of Identify Recognise, establish or select after
consideration Illustrate Use an example to describe or explain
something
3 APPLICATION How you are expected to apply your knowledge. Apply
Calculate/compute To put to practical use To ascertain or reckon mathematically
Demonstrate To prove with certainty or to exhibit by practical means
Prepare To make or get ready for use Reconcile To make or prove consistent/compatible Solve Find an answer to Tabulate Arrange in a table
4 ANALYSIS How are you expected to analyse the detail of what you have learned.
Analyse Categorise
Examine in detail the structure of Place into a defined class or division
Compare and contrast Show the similarities and/or differences between
Construct To build up or compile Discuss To examine in detail by argument Interpret To translate into intelligible or familiar terms Produce To create or bring into existence
5 EVALUATION How are you expected to use your learning to evaluate, make decisions or recommendations.
Advise Evaluate Recommend
To counsel, inform or notify To appraise or assess the value of To advise on a course of action
P1 24 May 2007
Management Accounting Pillar
Managerial Level
P1 – Management Accounting – Performance Evaluation
May 2007
Tuesday Morning Session