Embed Size (px)
Citation preview
Management’s Discussion and Analysis
First half of 2011
0
hire
Management’s Discussion and Analysis of financial position and results of operations
First half of 2011
Management’s Discussion and Analysis
First half of 2011
1
Contents
Business overview ........................................................................................................ 2
Key 2011 events ............................................................................................................ 3
Business structure ........................................................................................................ 4
Financial and operating highlights ............................................................................ 5
Sales volumes ............................................................................................................... 6
Revenue......................................................................................................................... 7
Cost of sales .................................................................................................................. 8
Gross profit ................................................................................................................ 11
Operating expenses .................................................................................................... 12
Foreign exchange gain, net ....................................................................................... 13
Gain on changes in fair value of derivative financial instrument......................... 14
Finance costs, net ....................................................................................................... 14
Income tax .................................................................................................................. 15
Net income for the period ......................................................................................... 15
Adjusted EBITDA ..................................................................................................... 15
Liquidity and capital resources ................................................................................ 16
Cash flows ................................................................................................................... 16
Indebtedness ............................................................................................................... 16
Capital expenditure ................................................................................................... 17
Development trends ................................................................................................... 18
Selected financial data ............................................................................................... 19
Principal Risks and Uncertainties............................................................................ 21
Responsibility Statement .......................................................................................... 26
Management’s Discussion and Analysis
First half of 2011
2
The following review of our financial position and results of operations is
based on, and should be read in conjunction with, our consolidated
financial statements and related notes for the six months ended June 30,
2011.
Certain information contained in this section, including information with
respect to our plans and strategy, includes forward-looking statements and
inherently involves risks and uncertainties. In assessing this discussion and
analysis, various risk factors must be considered, which means that our
actual results may differ significantly from those presented in these
statements.
Rounding
Certain monetary amounts, percentages and other figures included in this
management’s discussion and analysis have been subject to rounding
adjustments. Amounts shown in tables may not be the arithmetic
accumulation of the figures that precede them, and figures expressed as
percentages in the text and in tables may not total 100%.
Business overview
We are one of the leading global manufacturers and suppliers of tubular
products for the oil and gas industry, as well as other industrial applications.
We are the leading manufacturer and supplier of steel pipes for the oil and
gas industry in Russia. The largest share of our sales belongs to high-margin
oil country tubular goods (OCTG).
We operate 24 production sites, which are geographically diversified with
locations in Russia, the United States, Romania and Kazakhstan, and supply
to more than 65 countries worldwide. In the first half of 2011, 63% of our
sales volumes were derived from the clients located in Russia, and 23% –
from the clients located in North America.
In the first half of 2011, the Russian pipe market continued to recover from
the economic downturn and grew 31% as compared to the first half of 2010.
Sales volumes of our tubular products in the Russian market grew
significantly as well; however our market share slightly decreased from
27% to 25% as a result of growing production facilities of other pipe
producers and higher imports, in particular from the Ukraine. Nevertheless,
we persisted the strong market position for our key products, maintaining
60% market share in seamless OCTG and 72% in seamless line pipe sales.
We are the largest exporter of pipes in Russia. Export sales of pipes
produced in Russia constituted 12% of our total sales volumes in the first
half of 2011 compared to 14% in the corresponding period of 2010.
In January to June 2011, we sold 2,179 thousand tonnes of tubular products,
an increase of 16% compared to the same period of 2010, including 1,235
thousand tonnes of seamless pipes. Our sales of seamless and welded
OCTG achieved 797 thousand tonnes, a 7% increase compared to the first
half of 2010.
In January to June 2011, we reported total consolidated revenue of
U.S.$3,547 million, up 38% as compared to the same period of 2010.
Adjusted EBITDA1 increased 51% to U.S.$625 million in the first half
of 2011 from U.S.$415 million in the first half of 2010. Adjusted EBITDA
margin reached 18% in the first half of 2011 as compared to 16% in the
same period of 2010.
1 See Group IFRS Financial Statements for calculation methodology.
Management’s Discussion and Analysis
First half of 2011
3
Key 2011 events
In January 2011, we supplied seamless pipes to Gazprom for construction of
the Portovaya compressor station. Unique in its technical and operating
characteristics, this compressor station will be a starting point for gas
supplies via the Nord Stream gas pipeline.
In January 2011, we completed the offering of U.S.$500 million of 7.75%
loan participation notes which fall due in January 2018. The notes have
been admitted for trading on the London Stock Exchange. The proceeds
were used to refinance existing indebtedness.
In March 2011, we won an open auction for the acquisition of a 25.5% stake
in OAO Volgograd River Port for RUB113 million (approximately U.S.$4
million). The auction was held by the Russian Federal Property
Management Agency. The acquisition was finalised on August 4, 2011.
This acquisition will allow us to optimise logistics for our Volzhsky plant,
located close to the Volgograd River Port, and will create additional
opportunities to ship OCTG and line pipe to the oil and gas fields in the
Caspian region.
In March 2011, the second thread line for ULTRA connections with a
capacity of 240 thousand joints was commissioned at TMK IPSCO’s
facility in Brookfield, USA. The new line will also enhance our product
range. The increase in demand for ULTRA connections due to the active
development of shale oil and gas as well as the expected growth in
development of oil sands in the United States and Canada were the reasons
for this furtherer expansion of TMK IPSCO's premium threading capacities.
In April 2011, we completed shipments of casing pipe with ULTRA SF
Premium Connections to Gazprom Neft for the Urmanskoye field in the
Tomsk region in Western Siberia. The pipes were produced by TMK
IPSCO. This was the first of our deliveries to Russia of premium tubular
products made in the United States.
In May 2011, we began construction of a research center in Houston, Texas
(U.S.A.). The state-of-the-art facility will be used for product design and
development, experimental and validation testing and advanced
metallurgical research. The center will collaborate with numerous
organizations, including the Massachusetts Institute of Technology, our
subsidiary RosNITI and several other research laboratories and universities.
In May 2011, we finalised the sale of TMK Hydroenergy Power S.R.L., our
non-core asset previously owned by TMK-RESITA, which is comprised of
four hydropower generating units located in Romania.
In June and July 2011, as a part of the Programme on Development and
Testing of TMK Premium Connections, we successfully completed
qualification tests of TMK PF and ULTRA-QX connections in accordance
with ISO 13679 CAL IV standard. Certification of the connections will
allow us to provide more tailored solutions to the clients and further
strengthen our positions in the segment of premium pipe products.
In June 2011, we started production of pipes with a new TMK CWB
premium connection for drilling with casing. The implementation of new
technology will allow us for an increase in the connection’s gas-tightness
and operational efficiency. One of the TMK CWB connection’s outstanding
features is its ability to be coupled with other types of threads and to be used
as an adapter.
Management’s Discussion and Analysis
First half of 2011
4
Business structure
The results of operations are presented in three reporting segments:
Russian division: manufacturing facilities located in the Russian
Federation and Kazakhstan, oilfield service companies and trading
companies in Russia, Kazakhstan, Switzerland, the United Arab
Emirates and South Africa. The Russian division is engaged in the
production and supply of seamless and welded pipes, premium
products and rendering of related services to oil and gas companies;
American division: manufacturing facilities and trading companies
located in North America. The American division is engaged in the
production and supply of seamless and welded pipes and premium
products, including ULTRA connections;
European division: manufacturing facilities located in Romania, and
trading companies located in Italy and Germany. The European
division is engaged in the production and supply of seamless pipes
and steel billets.
Management’s Discussion and Analysis
First half of 2011
5
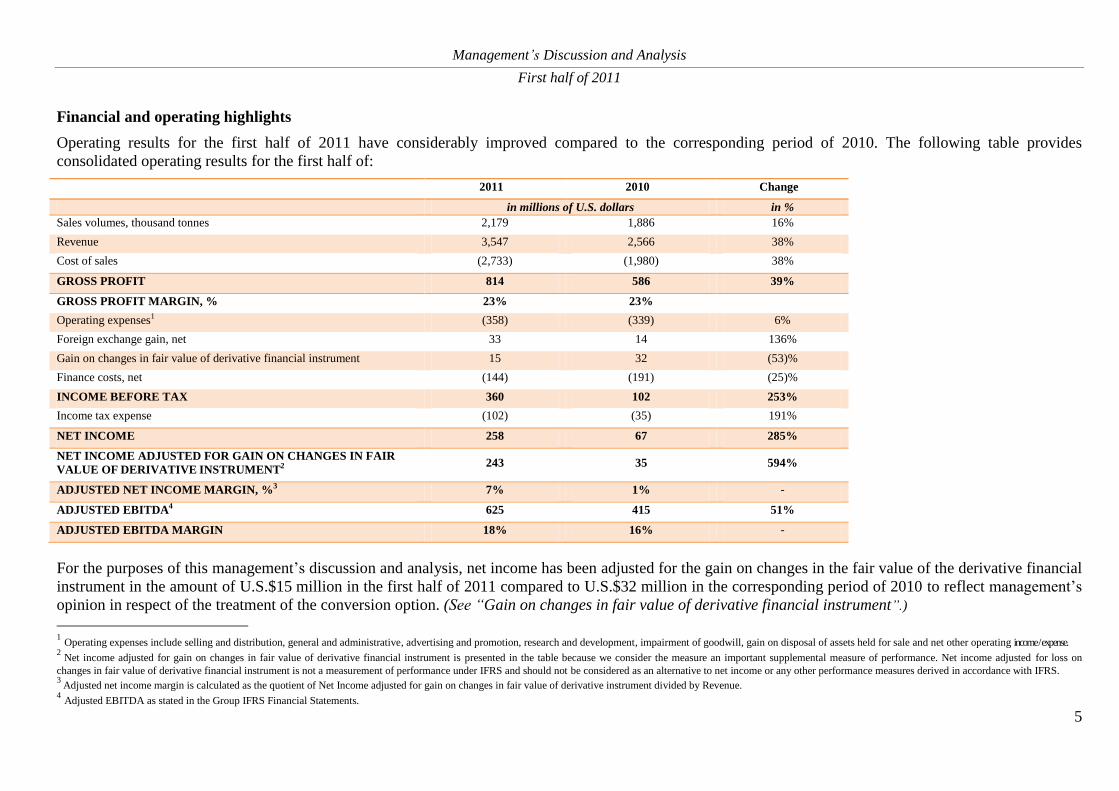
Financial and operating highlights
Operating results for the first half of 2011 have considerably improved compared to the corresponding period of 2010. The following table provides
consolidated operating results for the first half of:
2011 2010 Change
in millions of U.S. dollars in %
Sales volumes, thousand tonnes 2,179 1,886 16%
Revenue 3,547 2,566 38%
Cost of sales (2,733) (1,980) 38%
GROSS PROFIT 814 586 39%
GROSS PROFIT MARGIN, % 23% 23%
Operating expenses1 (358) (339) 6%
Foreign exchange gain, net 33 14 136%
Gain on changes in fair value of derivative financial instrument 15 32 (53)%
Finance costs, net (144) (191) (25)%
INCOME BEFORE TAX 360 102 253%
Income tax expense (102) (35) 191%
NET INCOME 258 67 285%
NET INCOME ADJUSTED FOR GAIN ON CHANGES IN FAIR
VALUE OF DERIVATIVE INSTRUMENT2 243 35 594%
ADJUSTED NET INCOME MARGIN, %3 7% 1% -
ADJUSTED EBITDA4 625 415 51%
ADJUSTED EBITDA MARGIN 18% 16% -
For the purposes of this management’s discussion and analysis, net income has been adjusted for the gain on changes in the fair value of the derivative financial
instrument in the amount of U.S.$15 million in the first half of 2011 compared to U.S.$32 million in the corresponding period of 2010 to reflect management’s
opinion in respect of the treatment of the conversion option. (See “Gain on changes in fair value of derivative financial instrument”.)
1 Operating expenses include selling and distribution, general and administrative, advertising and promotion, research and development, impairment of goodwill, gain on disposal of assets held for sale and net other operating income / expense.
2 Net income adjusted for gain on changes in fair value of derivative financial instrument is presented in the table because we consider the measure an important supplemental measure of performance. Net income adjusted for loss on
changes in fair value of derivative financial instrument is not a measurement of performance under IFRS and should not be considered as an alternative to net income or any other performance measures derived in accordance with IFRS. 3
Adjusted net income margin is calculated as the quotient of Net Income adjusted for gain on changes in fair value of derivative instrument divided by Revenue. 4 Adjusted EBITDA as stated in the Group IFRS Financial Statements.
Management’s Discussion and Analysis
First half of 2011
6
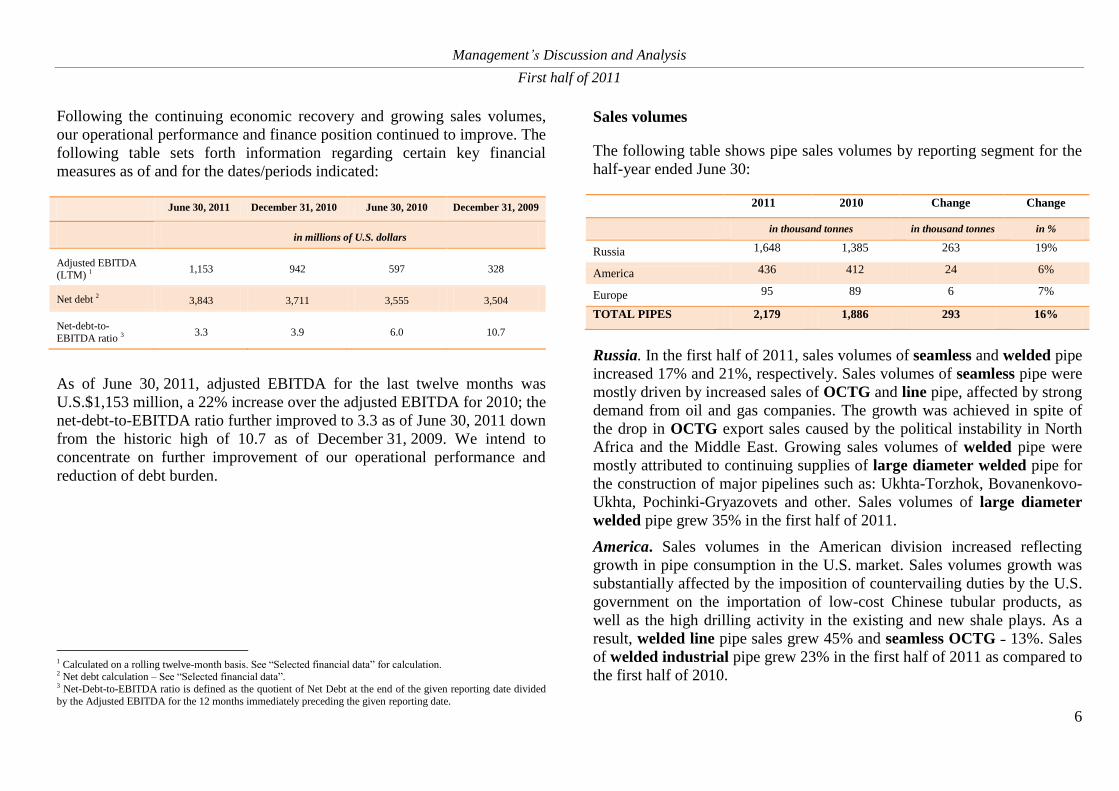
Following the continuing economic recovery and growing sales volumes,
our operational performance and finance position continued to improve. The
following table sets forth information regarding certain key financial
measures as of and for the dates/periods indicated:
June 30, 2011 December 31, 2010 June 30, 2010 December 31, 2009
in millions of U.S. dollars
Adjusted EBITDA (LTM) 1 1,153 942 597 328
Net debt 2 3,843 3,711 3,555 3,504
Net-debt-to-
EBITDA ratio 3 3.3 3.9 6.0 10.7
As of June 30, 2011, adjusted EBITDA for the last twelve months was
U.S.$1,153 million, a 22% increase over the adjusted EBITDA for 2010; the
net-debt-to-EBITDA ratio further improved to 3.3 as of June 30, 2011 down
from the historic high of 10.7 as of December 31, 2009. We intend to
concentrate on further improvement of our operational performance and
reduction of debt burden.
1 Calculated on a rolling twelve-month basis. See “Selected financial data” for calculation. 2 Net debt calculation – See “Selected financial data”. 3 Net-Debt-to-EBITDA ratio is defined as the quotient of Net Debt at the end of the given reporting date divided
by the Adjusted EBITDA for the 12 months immediately preceding the given reporting date.
Sales volumes
The following table shows pipe sales volumes by reporting segment for the
half-year ended June 30:
2011 2010 Change Change
in thousand tonnes in thousand tonnes in %
Russia 1,648 1,385 263 19%
America 436 412 24 6%
Europe 95 89 6 7%
TOTAL PIPES 2,179 1,886 293 16%
Russia. In the first half of 2011, sales volumes of seamless and welded pipe
increased 17% and 21%, respectively. Sales volumes of seamless pipe were
mostly driven by increased sales of OCTG and line pipe, affected by strong
demand from oil and gas companies. The growth was achieved in spite of
the drop in OCTG export sales caused by the political instability in North
Africa and the Middle East. Growing sales volumes of welded pipe were
mostly attributed to continuing supplies of large diameter welded pipe for
the construction of major pipelines such as: Ukhta-Torzhok, Bovanenkovo-
Ukhta, Pochinki-Gryazovets and other. Sales volumes of large diameter
welded pipe grew 35% in the first half of 2011.
America. Sales volumes in the American division increased reflecting
growth in pipe consumption in the U.S. market. Sales volumes growth was
substantially affected by the imposition of countervailing duties by the U.S.
government on the importation of low-cost Chinese tubular products, as
well as the high drilling activity in the existing and new shale plays. As a
result, welded line pipe sales grew 45% and seamless OCTG ˗ 13%. Sales
of welded industrial pipe grew 23% in the first half of 2011 as compared to
the first half of 2010.
Management’s Discussion and Analysis
First half of 2011
7
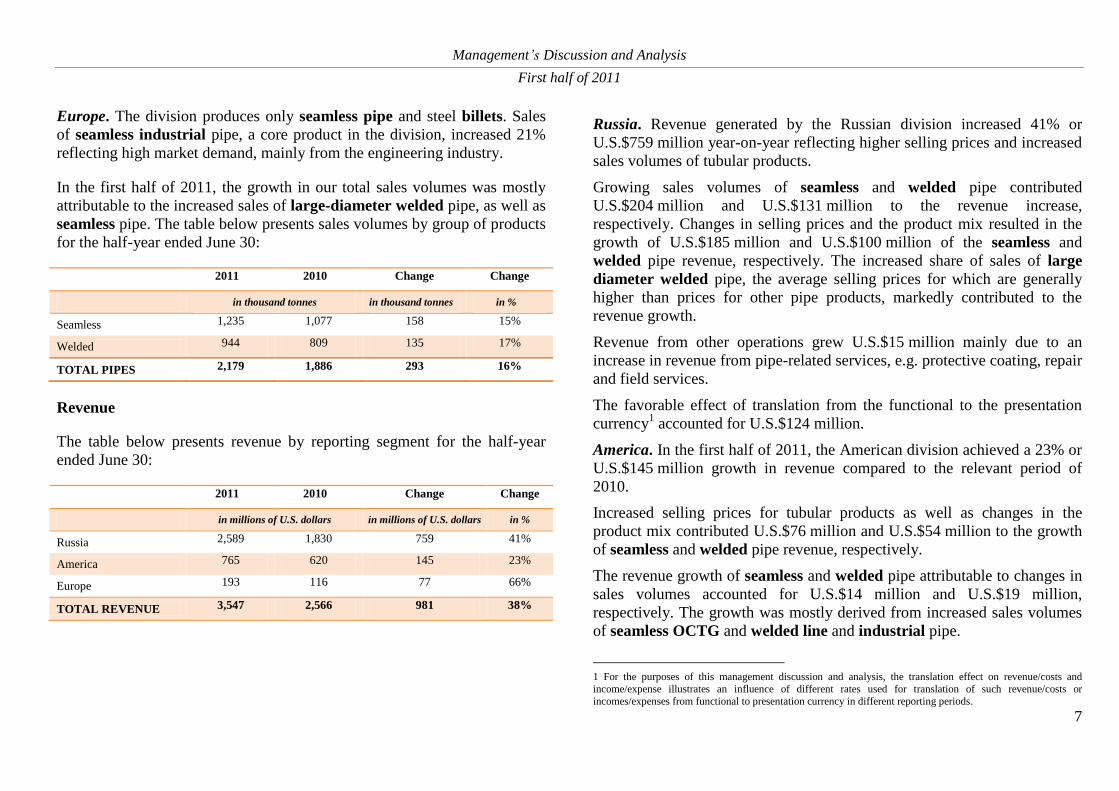
Europe. The division produces only seamless pipe and steel billets. Sales
of seamless industrial pipe, a core product in the division, increased 21%
reflecting high market demand, mainly from the engineering industry.
In the first half of 2011, the growth in our total sales volumes was mostly
attributable to the increased sales of large-diameter welded pipe, as well as
seamless pipe. The table below presents sales volumes by group of products
for the half-year ended June 30:
2011 2010 Change Change
in thousand tonnes in thousand tonnes in %
Seamless 1,235 1,077 158 15%
Welded 944 809 135 17%
TOTAL PIPES 2,179 1,886 293 16%
Revenue
The table below presents revenue by reporting segment for the half-year
ended June 30:
2011 2010 Change Change
in millions of U.S. dollars in millions of U.S. dollars in %
Russia 2,589 1,830 759 41%
America 765 620 145 23%
Europe 193 116 77 66%
TOTAL REVENUE 3,547 2,566 981 38%
Russia. Revenue generated by the Russian division increased 41% or
U.S.$759 million year-on-year reflecting higher selling prices and increased
sales volumes of tubular products.
Growing sales volumes of seamless and welded pipe contributed
U.S.$204 million and U.S.$131 million to the revenue increase,
respectively. Changes in selling prices and the product mix resulted in the
growth of U.S.$185 million and U.S.$100 million of the seamless and
welded pipe revenue, respectively. The increased share of sales of large
diameter welded pipe, the average selling prices for which are generally
higher than prices for other pipe products, markedly contributed to the
revenue growth.
Revenue from other operations grew U.S.$15 million mainly due to an
increase in revenue from pipe-related services, e.g. protective coating, repair
and field services.
The favorable effect of translation from the functional to the presentation
currency1 accounted for U.S.$124 million.
America. In the first half of 2011, the American division achieved a 23% or
U.S.$145 million growth in revenue compared to the relevant period of
2010.
Increased selling prices for tubular products as well as changes in the
product mix contributed U.S.$76 million and U.S.$54 million to the growth
of seamless and welded pipe revenue, respectively.
The revenue growth of seamless and welded pipe attributable to changes in
sales volumes accounted for U.S.$14 million and U.S.$19 million,
respectively. The growth was mostly derived from increased sales volumes
of seamless OCTG and welded line and industrial pipe.
1 For the purposes of this management discussion and analysis, the translation effect on revenue/costs and
income/expense illustrates an influence of different rates used for translation of such revenue/costs or
incomes/expenses from functional to presentation currency in different reporting periods.
Management’s Discussion and Analysis
First half of 2011
8
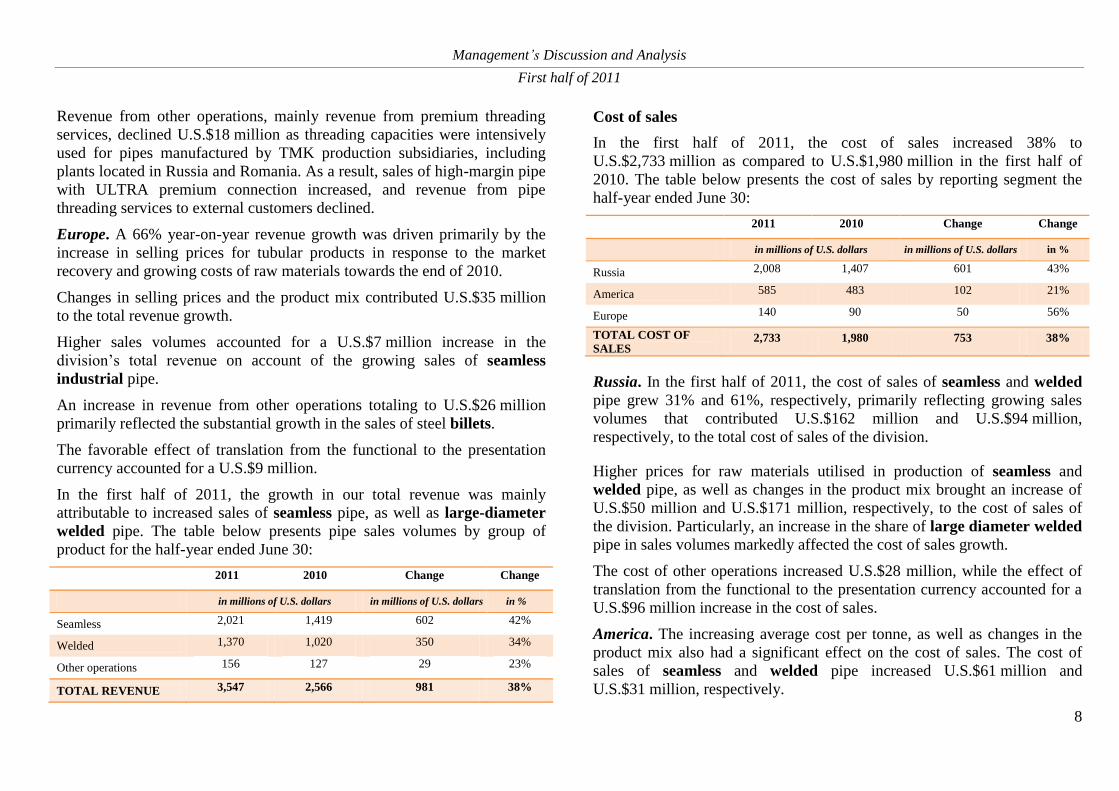
Revenue from other operations, mainly revenue from premium threading
services, declined U.S.$18 million as threading capacities were intensively
used for pipes manufactured by TMK production subsidiaries, including
plants located in Russia and Romania. As a result, sales of high-margin pipe
with ULTRA premium connection increased, and revenue from pipe
threading services to external customers declined.
Europe. A 66% year-on-year revenue growth was driven primarily by the
increase in selling prices for tubular products in response to the market
recovery and growing costs of raw materials towards the end of 2010.
Changes in selling prices and the product mix contributed U.S.$35 million
to the total revenue growth.
Higher sales volumes accounted for a U.S.$7 million increase in the
division’s total revenue on account of the growing sales of seamless
industrial pipe.
An increase in revenue from other operations totaling to U.S.$26 million
primarily reflected the substantial growth in the sales of steel billets.
The favorable effect of translation from the functional to the presentation
currency accounted for a U.S.$9 million.
In the first half of 2011, the growth in our total revenue was mainly
attributable to increased sales of seamless pipe, as well as large-diameter
welded pipe. The table below presents pipe sales volumes by group of
product for the half-year ended June 30:
2011 2010 Change Change
in millions of U.S. dollars in millions of U.S. dollars in %
Seamless 2,021 1,419 602 42%
Welded 1,370 1,020 350 34%
Other operations 156 127 29 23%
TOTAL REVENUE 3,547 2,566 981 38%
Cost of sales
In the first half of 2011, the cost of sales increased 38% to
U.S.$2,733 million as compared to U.S.$1,980 million in the first half of
2010. The table below presents the cost of sales by reporting segment the
half-year ended June 30:
2011 2010 Change Change
in millions of U.S. dollars in millions of U.S. dollars in %
Russia 2,008 1,407 601 43%
America 585 483 102 21%
Europe 140 90 50 56%
TOTAL COST OF
SALES 2,733 1,980 753 38%
Russia. In the first half of 2011, the cost of sales of seamless and welded
pipe grew 31% and 61%, respectively, primarily reflecting growing sales
volumes that contributed U.S.$162 million and U.S.$94 million,
respectively, to the total cost of sales of the division.
Higher prices for raw materials utilised in production of seamless and
welded pipe, as well as changes in the product mix brought an increase of
U.S.$50 million and U.S.$171 million, respectively, to the cost of sales of
the division. Particularly, an increase in the share of large diameter welded
pipe in sales volumes markedly affected the cost of sales growth.
The cost of other operations increased U.S.$28 million, while the effect of
translation from the functional to the presentation currency accounted for a
U.S.$96 million increase in the cost of sales.
America. The increasing average cost per tonne, as well as changes in the
product mix also had a significant effect on the cost of sales. The cost of
sales of seamless and welded pipe increased U.S.$61 million and
U.S.$31 million, respectively.
Management’s Discussion and Analysis
First half of 2011
9
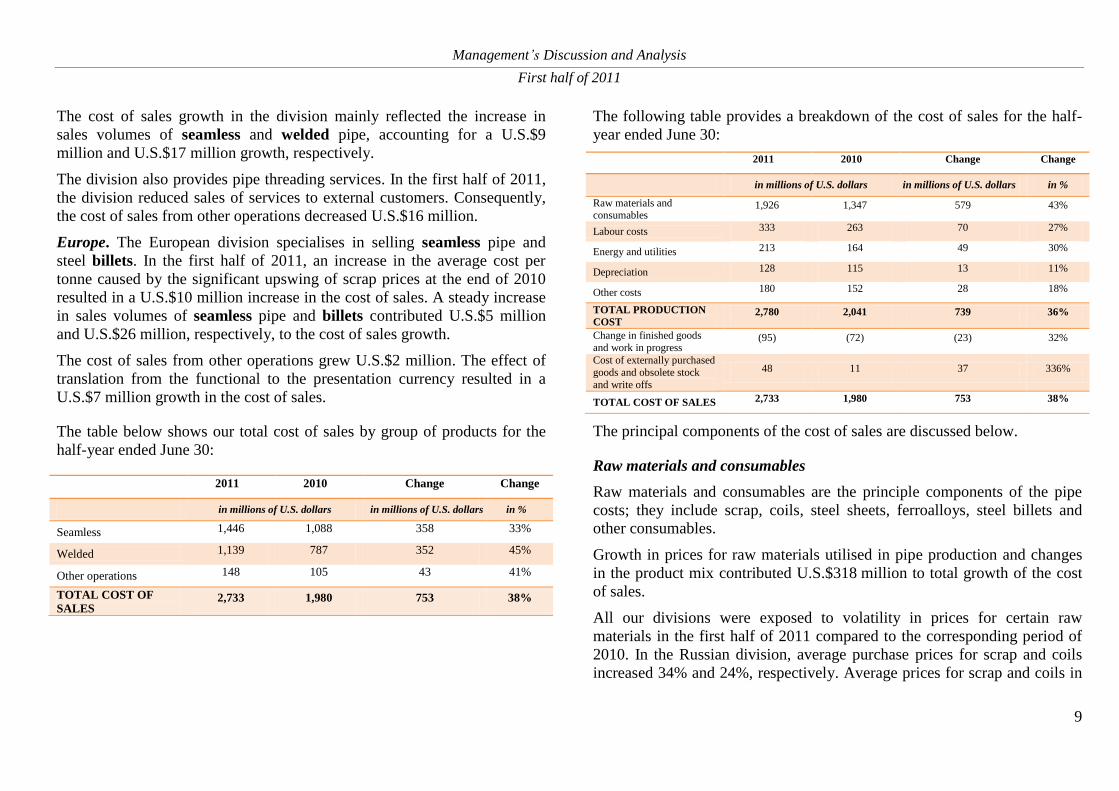
The cost of sales growth in the division mainly reflected the increase in
sales volumes of seamless and welded pipe, accounting for a U.S.$9
million and U.S.$17 million growth, respectively.
The division also provides pipe threading services. In the first half of 2011,
the division reduced sales of services to external customers. Consequently,
the cost of sales from other operations decreased U.S.$16 million.
Europe. The European division specialises in selling seamless pipe and
steel billets. In the first half of 2011, an increase in the average cost per
tonne caused by the significant upswing of scrap prices at the end of 2010
resulted in a U.S.$10 million increase in the cost of sales. A steady increase
in sales volumes of seamless pipe and billets contributed U.S.$5 million
and U.S.$26 million, respectively, to the cost of sales growth.
The cost of sales from other operations grew U.S.$2 million. The effect of
translation from the functional to the presentation currency resulted in a
U.S.$7 million growth in the cost of sales.
The table below shows our total cost of sales by group of products for the
half-year ended June 30:
2011 2010 Change Change
in millions of U.S. dollars in millions of U.S. dollars in %
Seamless 1,446 1,088 358 33%
Welded 1,139 787 352 45%
Other operations 148 105 43 41%
TOTAL COST OF
SALES 2,733 1,980 753 38%
The following table provides a breakdown of the cost of sales for the half-
year ended June 30:
2011 2010 Change Change
in millions of U.S. dollars in millions of U.S. dollars in %
Raw materials and consumables
1,926 1,347 579 43%
Labour costs 333 263 70 27%
Energy and utilities 213 164 49 30%
Depreciation 128 115 13 11%
Other costs 180 152 28 18%
TOTAL PRODUCTION
COST 2,780 2,041 739 36%
Change in finished goods
and work in progress (95) (72) (23) 32%
Cost of externally purchased
goods and obsolete stock
and write offs
48 11 37 336%
TOTAL COST OF SALES 2,733 1,980 753 38%
The principal components of the cost of sales are discussed below.
Raw materials and consumables
Raw materials and consumables are the principle components of the pipe
costs; they include scrap, coils, steel sheets, ferroalloys, steel billets and
other consumables.
Growth in prices for raw materials utilised in pipe production and changes
in the product mix contributed U.S.$318 million to total growth of the cost
of sales.
All our divisions were exposed to volatility in prices for certain raw
materials in the first half of 2011 compared to the corresponding period of
2010. In the Russian division, average purchase prices for scrap and coils
increased 34% and 24%, respectively. Average prices for scrap and coils in
Management’s Discussion and Analysis
First half of 2011
10
the American division increased 21% and 26%, respectively. The average
purchase price for scrap in the European division was up 31%.
The increased share of large diameter welded pipe in the product mix
resulted in a higher amount of raw materials consumed as the average
purchase prices for steel plates and coil used in the production of this
product type were higher than of other tubular products.
Our sales growth resulted in higher production volumes which contributed
U.S.$189 million to the increase in the cost of raw materials and
consumables.
The effect of translation from the functional to the presentation currency
accounted for a U.S.$72 million increase in the cost of sales.
Labour costs
Growth in labour costs primarily reflected increased payroll rates and
changes in the Russian tax legislation in respect of the social security
contributions effective from January 1, 2011, that resulted in a
U.S.$45 million increase. The increase in insurance contribution rates from
26% to 34% and changes in calculation methodology also affected the
labour costs in the first half of 2011.
The effect of rehiring production workers in the American division where
labour costs increased U.S.$15 million was partially offset by a
U.S.$2 million decline due to a minor decrease in the headcount of the
Russian division.
The effect of translation from the functional to the presentation currency
accounted for a U.S.$12 million increase in labour costs.
Energy and utilities
As a result of increased prices for energy and utilities consumed in the pipe
and steel production process, energy costs grew U.S.$14 million in the first
half of 2011 compared to the respective period of 2010.
In the first half of 2011 compared to the corresponding period of 2010, on
average, the electricity and natural gas tariffs in the Russian division
increased 18% and 15%, respectively. In the American division, the average
electricity tariff increased only 2% and the average natural gas tariff
decreased 6% due to the regressive tariffs system. The average electricity
and natural gas tariffs in the European division were up 37% and 9%,
respectively.
Energy costs increased U.S.$26 million primarily reflecting growth in
production volumes in the first half of 2011 compared to the same period of
2010. The effect of translation from the functional to the presentation
currency accounted for a U.S.$9 million increase in energy costs.
Depreciation
Depreciation expenses increased U.S.$13 million in the first half of 2011
compared to the corresponding period of 2010. The effect of translation
from the functional to the presentation currency accounted for a
U.S.$5 million increase. The principal share of the remaining growth relates
to the reduction of the estimated useful lives of some open-hearth furnaces,
pilger mill and 2520 welded pipe mill in the Russian division due to the
planned replacement of this equipment with the new one before the end of
the initially assessed useful lives.
Other costs
Other costs include repair and maintenance, contracted manufacture,
transportation among production sites, taxes and other expenses. Growth of
other expenses was consistent with the operating activity dynamics.
Management’s Discussion and Analysis
First half of 2011
11
The effect of translation from the functional to the presentation currency
accounted for a U.S.$5 million increase.
Change in finished goods and work in progress
The gradual growth of finished goods and work in progress balances for the
first half of 2011 and 2010 reflects growing prices for raw materials and
tubular products as well as the increased stock driven by the growth of sales
volumes.
Gross profit
The following table shows gross profit and gross margin by reporting
segment for the half-year ended June 30:
2011 2010 Change
in millions of
U.S. dollars
in % in millions of
U.S. dollars
in % in millions of
U.S. dollars
Russia 581 22.4% 424 23.1% 157
America 180 23.5% 137 22.1% 43
Europe 53 27.6% 25 21.9% 28
TOTAL GROSS
PROFIT 814 23.0% 586 22.8% 228
In the first half of 2011, gross profit increased 39% or U.S.$228 million as
compared to the first half of 2010, and amounted to U.S.$814 million. The
gross margin remained nearly unchanged in the first half of 2011.
Russia. The gross margin in the Russian division declined from 23.1% in
the first half of 2010 to 22.4% in the first half of 2011, reflecting lower
gross margin of large-diameter welded pipe, particularly, as a result of
completion of some higher-margin projects. The projects included long-
distance delivery terms which resulted in higher selling prices and
additional selling and distribution expenses. However the decrease in large-
diameter welded pipe gross margin was partially offset by the growth in
gross margin of seamless OCTG and line pipe.
The increase in gross profit was mainly attributable to the growth in selling
prices for seamless pipe that outpaced the growth in the average cost per
tonne, that together with the changes in the product mix contributed
U.S.$134 million. However gross profit per tonne of welded pipe was lower
in the first half of 2011, that together with the effect of the changes in the
product mix resulted in a U.S.$72 million decrease in gross profit.
As a result, the division recorded a U.S.$43 million and U.S.$37 million
increase in gross profit from the change in sales volumes of seamless and
welded pipe, respectively.
Gross profit from other operations declined U.S.$13 million. The effect of
translation from the functional to the presentation currency resulted in a
U.S.$28 million growth in gross profit.
America. Gross margin in the American division increased from 22.1% in
the first half of 2010 to 23.5% in the first half of 2011 mainly because of
increased sales volumes and prices as well as the increased share of high-
margin seamless OCTG pipe in the division’s sales.
Increased selling prices for tubular products and changes in the product mix
contributed U.S.$15 million and U.S.$23 million to the growth of seamless
and welded pipe gross profit, respectively.
In the first half of 2011, the division increased sales volumes of seamless
OCTG, resulting in a U.S.$5 million rise of the seamless pipe gross profit.
The growth in sales volumes of welded line and industrial pipe contributed
U.S.$2 million to the increase in gross profit of welded pipe. However the
division’s gross profit from other operations declined U.S.$2 million, as the
division was mostly focused on selling high-margin pipes with ULTRA
premium connection rather than providing premium threading services to
the external customers.
Management’s Discussion and Analysis
First half of 2011
12
Europe. In the first half of 2011, gross margin in the European division was
27.6% compared to 21.9% in the first half of 2010 as a result of the overall
favorable market situation, and, in particular, because of certain high-
margin orders related to industrial heat-treated alloy pipe. The increase in
gross profit during the period was mainly attributable to growing gross
profit per tonne of seamless pipe sold, resulting in a U.S.$24 million
increase in gross profit. Gross profit of steel billets was up U.S.$2 million.
The effect of translation from the functional to the presentation currency
resulted in a U.S.$2 million growth in gross profit.
The following table represents our gross profit by group of products for the
half-year ended June 30:
2011 2010 Change
in millions of
U.S. dollars
in % in millions of
U.S. dollars
in % in millions of
U.S. dollars
Seamless 575 28,5% 331 23,3% 244
Welded 231 16,9% 233 22,8% (2)
Other operations 8 5,1% 22 17,3% (14)
TOTAL GROSS
PROFIT 814 23,0% 586 22,8% 228
Operating expenses
Selling and distribution expenses
Selling and distribution expenses decreased as a percentage of revenue to
6% in the first half of 2011 compared to 8% in the corresponding period of
2010. The following table sets out selling and distribution expenses for the
half-year ended June 30:
2011 2010 Change Change
in millions of U.S. dollars in millions of U.S. dollars in %
Russia 152 140 12 9%
America 39 46 (7) (15)%
Europe 15 13 2 15%
TOTAL SELLING AND
DISTRIBUTION EXPENSES 206 199 7 4%
Russia. The increase was mainly attributable to the growth in sales staff
costs in the first half of 2011 compared to the corresponding period of 2010.
Growing salaries and related social security contributions resulted in a
U.S.$3 million growth in the selling expenses. The increase in freight tariffs
was fully offset by a decrease of freight expenses under certain sales
contracts that resulted in a U.S.$3 million decline in the selling expenses.
The effect of translation from the functional to the presentation currency
and changes in other expenses accounted for U.S.$7 million and
U.S.$5 million, respectively.
America. Selling expenses in the division declined reflecting primarily an
U.S.$8 million decrease in depreciation expenses mainly due to the
amortisation of an intangible asset “Customer relationships”: the asset is
amortised using the diminishing balance method which reflects the pattern
of consumption of the related economic benefits. Other selling expenses
increased U.S.$1 million.
Europe. An increase in selling expenses in the European division reflects
higher sales activities in the European division which caused a
U.S.$2 million growth in freight expenses in the first half of 2011 compared
to the corresponding period of 2010.
Management’s Discussion and Analysis
First half of 2011
13
The table below provides a breakdown of our total selling and distribution
expenses for the half-year ended June 30:
2011 2010 Change Change
in millions of U.S. dollars in millions of U.S. dollars in %
Freight 107 103 4 4%
Depreciation 33 41 (8) (20)%
Staff costs 31 26 5 19%
Other expenses 35 29 6 21%
TOTAL SELLING AND
DISTRIBUTION EXPENSES 206 199 7 4%
General and administrative expenses
The following table sets out general and administrative expenses for the
half-year ended June 30:
2011 2010 Change Change
in millions of U.S. dollars in millions of U.S. dollars in %
Russia 106 81 25 31%
America 29 25 4 16%
Europe 5 4 1 25%
TOTAL GENERAL AND
ADMINISTRATIVE EXPENSES 140 110 30 27%
Russia. The growth in general and administrative expenses was primarily
the result of increased salaries and related social security contributions that
resulted in a U.S.$15 million growth of the division’s expenses. According
to the amended Russian tax legislation in respect of the social security
contributions, the insurance contribution rates increased from 26% to 34%
and the regressive calculation methodology was changed, that affected the
staff costs growth in the first half of 2011. The effect of translation from the
functional to the presentation currency and changes in other expenses
accounted for U.S.$5 million each.
America. An increase in general and administrative expenses in the
American division was mostly due to an increase in salaries and accrued
bonuses in the first half of 2011.
Europe. In the European division, general and administrative expenses
slightly increased as a result of the growth in staff costs and other expenses,
and the effect of translation from the functional to the presentation currency.
The table below provides a breakdown of our total general and
administrative expenses for the half-year ended June 30:
2011 2010 Change Change
in millions of U.S. dollars in millions of U.S. dollars in %
Staff costs 81 60 21 35%
Professional services 27 22 5 23%
Depreciation 7 6 1 17%
Travel 5 4 1 25%
Other expenses 20 18 2 11%
TOTAL GENERAL AND
ADMINISTRATIVE EXPENSES 140 110 30 27%
Foreign exchange gain, net
In the first half of 2011, a foreign exchange gain was recognised in the
amount of U.S.$33 million as compared to U.S.$14 million in the
corresponding period of 2010. In addition, a foreign exchange gain of
U.S.$96 million was recognised during the first half of 2011 as compared to
a U.S.$36 million loss from exchange rate fluctuations in the corresponding
period of 2010 in the statement of other comprehensive income,
representing the effective portion of foreign exchange gains or losses on our
hedging instruments. At the date of acquisition of controlling interests in
Management’s Discussion and Analysis
First half of 2011
14
NS Group, Inc. and IPSCO Tubulars, Inc. we hedged our net investment in
these operations against foreign currency risk using US dollar denominated
borrowings made by Russian entities of TMK. Hedging is used to eliminate
the foreign currency exchange rate risk associated with a repayment of these
liabilities resulting from changes in the US dollar/Russian rouble spot rates.
Gain on changes in fair value of derivative financial instrument
In February 2010, we issued U.S.$413 million 5.25% convertible bonds due
2015, convertible into TMK's GDRs. The bonds are convertible into GDRs
at a conversion price of U.S.$23.075 per GDR. The convertible bonds
represent a combined financial instrument containing two components: (i) a
bond liability and (ii) an embedded derivative representing a conversion
option in foreign currency combined with an issuer call. In accordance with
IFRS, a bond liability of U.S.$368 million (net of transaction costs of
U.S.$9 million) was recognised and the liability under the embedded
conversion option of U.S.$35 million at the initial recognition date.
As of June 30, 2011, the bond liability and the liability under the embedded
conversion option were U.S.$382 million and U.S.$33 million, respectively.
As of 31 December, 2010, the liability under the embedded conversion
option was U.S.$48 million. Consequently, we recognised a gain of
U.S.$15 million on changes in the fair value of the derivative financial
instrument in the first half of 2011.
Management nevertheless believes that the IFRS accounting treatment of
the conversion option of the bond does not reflect the expected outflow of
resources under the conversion rights. The conversion option, whether
exercised or expired, will not result in cash outflows. In the event of the
bond not being converted, the liability under the conversion option will be
recognised as a gain in our income statement. In the event of the exercise of
the option, the liability will be transferred to equity (together with the
carrying value of the converted bonds); no gain or loss will be recognised
on the transaction. Additionally, the accounting treatment of the conversion
option requires that changes in the fair value of the embedded instrument be
recognised in the income statement. The price and volatility of TMK’s
GDRs have significant impact on the fair value of the embedded derivative.
In the event the GDRs perform well, the liability under the conversion
option will increase and result in losses in the income statement. The
changes in the fair value may be material in comparison to our net income
and may cause distortions in the income statement.
As such, for management discussion and analysis purposes, in addition to
net income as reflected in the consolidated income statement for the first
half of 2011 and 2010, it has been decided to present, in this management
discussion and analysis, an adjusted net income so that it does not reflect
gains in changes in the fair value with respect to the embedded derivative
component of the convertible bond. The adjusted net income is an
alternative performance measure that is not reflected in our consolidated
financial statements and has not been audited or reviewed in accordance
with ISA.
Finance costs, net
Finance costs decreased 20% or U.S.$40 million in the first half of 2011
compared to the corresponding period of 2010. In 2010, we negotiated
lower interest rates for the existing loans with major creditors and acquired
cheaper loans to refinance the existing debt. Consequently, the weighted
average nominal interest rate declined gradually to 7.33% as of June 30,
2011 compared to 8.95% as of June 30, 2010. A decline in the amount of
unamortised debt issue costs absorbed in the income statement in the first
half of 2011 also decreased our finance costs.
Finance income increased 80% to U.S.$15 million in the first half of 2011,
primarily due to the growing dividend income.
As a result, net finance costs decreased U.S.$47 million or 25% in the first
half of 2011 compared to the corresponding period of 2010.
Management’s Discussion and Analysis
First half of 2011
15
Income tax
TMK, as a global company with production facilities and trading companies
geographically diversified and located in Russia and the CIS, the United
States, and Europe, is exposed to taxes charged to businesses in those
countries. In both the first half of 2011 and 2010, the following corporate
income tax rates were in force in the countries where most of our production
plants are located: 20% in Russia, 35% (federal tax rate) in the United
States, 16% in Romania.
In the first half of 2011, a pre-tax income of U.S.$360 million was reported
as compared to U.S.$102 million in the corresponding period of 2010. As a
result, in the first half of 2011 an income tax expense of U.S.$102 million
was recognised compared to U.S.$35 million in the first half of 2010. Our
effective income tax rate declined to 28% in the first half of 2011 from 34%
in the first half of 2010, first, due to the growth in the pre-tax income that
outpaced the growth in non-deductible expenses, and, second, due to the
decreased share of the pre-tax income in the U.S. with a higher income tax
rate compared to the pre-tax income in other jurisdictions.
Net income for the period
As a result of the above-mentioned factors, net income in the amount of
U.S.$258 million was recognised in the first half of 2011 as compared to
U.S.$67 million in the first half of 2010. Net income adjusted to the gain on
changes in the fair value of the derivative financial instrument equals
U.S.$243 million. (See “Gain on changes in fair value of derivative
financial instrument” for reasons of using such non-IFRS measure.)
Adjusted net income margin1 increased to 7% in the first half of 2011 from
1% in the relevant period in 2010.
1 Adjusted net profit margin is calculated as a quotient of Net Income adjusted for gain on changes in fair value of
derivative instrument divided by Revenue.
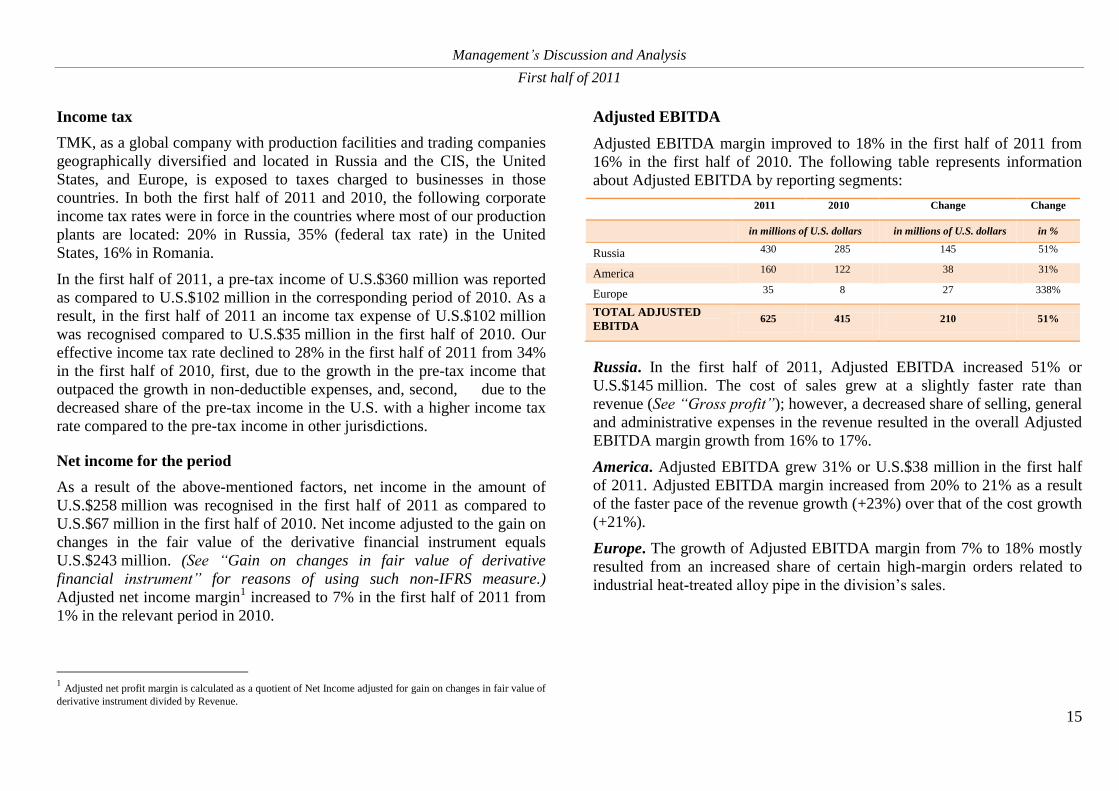
Adjusted EBITDA
Adjusted EBITDA margin improved to 18% in the first half of 2011 from
16% in the first half of 2010. The following table represents information
about Adjusted EBITDA by reporting segments:
2011 2010 Change Change
in millions of U.S. dollars in millions of U.S. dollars in %
Russia 430 285 145 51%
America 160 122 38 31%
Europe 35 8 27 338%
TOTAL ADJUSTED
EBITDA 625 415 210 51%
Russia. In the first half of 2011, Adjusted EBITDA increased 51% or
U.S.$145 million. The cost of sales grew at a slightly faster rate than
revenue (See “Gross profit”); however, a decreased share of selling, general
and administrative expenses in the revenue resulted in the overall Adjusted
EBITDA margin growth from 16% to 17%.
America. Adjusted EBITDA grew 31% or U.S.$38 million in the first half
of 2011. Adjusted EBITDA margin increased from 20% to 21% as a result
of the faster pace of the revenue growth (+23%) over that of the cost growth
(+21%).
Europe. The growth of Adjusted EBITDA margin from 7% to 18% mostly
resulted from an increased share of certain high-margin orders related to
industrial heat-treated alloy pipe in the division’s sales.
Management’s Discussion and Analysis
First half of 2011
16
Liquidity and capital resources
Cash flows
The following table illustrates total cash flows for the first half ended
June 30:
2011 2010 Change Change
in millions of U.S. dollars in millions of U.S. dollars in %
Net cash flows from operating activities 378 197 181 92%
Net cash flows used in investing activities (185) (162) (23) 14%
Net cash flows used in financing activities (180) (191) 11 (6)%
Increase/(decrease) in cash and cash
equivalents 13 (156) 169 108%
Effect of exchange rate changes on cash and
cash equivalents (1) (3) - -
Cash and cash equivalents as of 1 January 158 244 (86) (35)%
CASH AND CASH EQUIVALENTS
AS OF JUNE 30 170 85 85 100%
Operating activities
Net cash flows from operating activities in the first half of 2011 grew 92%
to U.S.$378 million from U.S.$197 million in the first half of 2010.
Net cash flows from operating activities before changes in working capital
increased from U.S.$415 million in the first half of 2010 to
U.S.$625 million in the corresponding period of 2011. The increase was
mainly attributable to a pre-tax income of U.S.$360 million in the first half
of 2011 as compared to U.S.$102 million in the first half of 2010. In the
first half of 2011, cash flows in the amount of U.S.$211 million were used
to finance working capital as compared to U.S.$227 million in the
corresponding period of 2010. Working capital increased in both periods in
response to growing production and sales activities.
Investing activities
In the first half of 2011, net cash used in investing activities equalled to
U.S.$185 million, or 14% higher than in the corresponding period of 2010.
In the first half of 2011, significant payments related to certain capital
expenditure projects were made, particularly, the construction of the electric
arc furnace at Tagmet and the modernisation of our seamless pipe
production line with the new FQM mill at STZ.
Financing activities
In the first half of 2011, net cash used in financing activities amounted to
U.S.$180 million as compared to U.S.$191 million in the first half of 2010.
A reduction in net cash used in financing activities was principally
attributable to a decrease in interest paid from U.S.$182 million in the first
half of 2010 to U.S.$142 million in the first half of 2011 as a result of lower
interest rates negotiated with our creditors. Net cash repayment of
borrowing increased from U.S.$8 million in the first half of 2010 to
U.S.$36 million in the first half of 2011. Significant amounts of cash related
to proceeds and repayments of borrowings reflect refinancing of existing
loans with lower interest rates.
Indebtedness
The following table illustrates the maturity profile of our total financial
debt:
1 year or
less
1 to 3
years
Over 3
years
Unamortised
debt issue costs
Total
debt
in millions of U.S. dollars
At June 30, 2011 542 1,544 1,956 (25) 4,017
At December 31, 2010 706 1,222 1,968 (24) 3,872
Management’s Discussion and Analysis
First half of 2011
17
The current debt portfolio comprises diversified debt instruments, including
bank loans, bonds, convertible bonds and other credit facilities. Total
financial debt increased 4% from U.S.$3,872 million as of December 31,
2010 to U.S.$4,017 million as of June 30, 2011. The net amount of debt
repayment in the first half of 2011 equaled to U.S.$36 million. However,
the appreciation of the Russian rouble against the U.S. dollar resulted in an
increase of the U.S. dollar equivalent of the Russian rouble-denominated
loans in the financial statements as of June 30, 2011. As of June 30, 2011,
U.S. dollar-, Russian rouble- and euro-denominated debt accounted for
47%, 47% and 6%, respectively, of the total financial debt.
As a result of actions undertaken to improve the debt maturity profile, the
share of short-term debt decreased to 13% as of June 30, 2011 as compared
to 18% as of December 31, 2010.
The debt portfolio includes fixed as well as floating interest rate debt
facilities. As of June 30, 2011, borrowings with a floating interest rate
represented U.S.$309 million or 8% as compared to U.S.$3,671 million or
92% of borrowings with a fixed interest rate.
The weighted average nominal interest rate decreased 53 basis points as
compared to December 31, 2010 and stood at 7.33% as of June 30, 2011.
Measures to improve the structure of our loan portfolio will be continued.
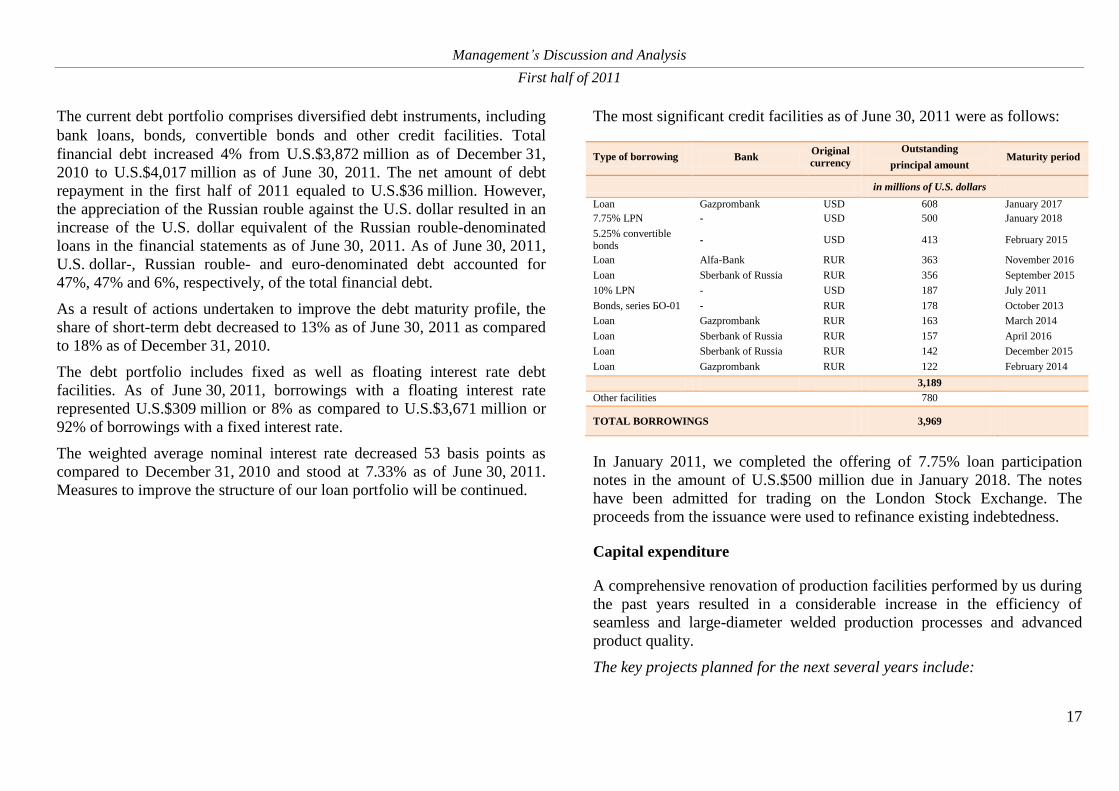
The most significant credit facilities as of June 30, 2011 were as follows:
Type of borrowing Bank Original
currency
Outstanding
principal amount Maturity period
in millions of U.S. dollars
Loan Gazprombank USD 608 January 2017
7.75% LPN - USD 500 January 2018
5.25% convertible bonds
- USD 413 February 2015
Loan Alfa-Bank RUR 363 November 2016
Loan Sberbank of Russia RUR 356 September 2015
10% LPN - USD 187 July 2011
Bonds, series БО-01 - RUR 178 October 2013
Loan Gazprombank RUR 163 March 2014
Loan Sberbank of Russia RUR 157 April 2016
Loan Sberbank of Russia RUR 142 December 2015
Loan Gazprombank RUR 122 February 2014
3,189
Other facilities 780
TOTAL BORROWINGS 3,969
In January 2011, we completed the offering of 7.75% loan participation
notes in the amount of U.S.$500 million due in January 2018. The notes
have been admitted for trading on the London Stock Exchange. The
proceeds from the issuance were used to refinance existing indebtedness.
Capital expenditure
A comprehensive renovation of production facilities performed by us during
the past years resulted in a considerable increase in the efficiency of
seamless and large-diameter welded production processes and advanced
product quality.
The key projects planned for the next several years include:
Management’s Discussion and Analysis
First half of 2011
18
- replacement of the open hearth furnaces with EAF steelmaking
facilities at Tagmet with an annual steel-making capacity of 400
thousand tonnes; the project is planned to be completed in 2013;
- construction of a new Fine Quality Mill (“FQM”) at Seversky with an
annual seamless pipe production capacity of 600 thousand tonnes and
completion in 2013;
- installation of additional nondestructive testing instrumentation,
construction of the new hydro-press, new pipe-threading and coupling-
threading facilities at Sinarsky to further improve quality of OCTG
produced at the works; the project is planned to be completed in 2012.
Other investment projects started in the first half of 2011:
- construction also began on a line to produce premium threaded casing
at the Orsk Machine-Building Plant, with a total capacity at 30
thousand tonnes per year. Project completion is scheduled for 2011
and will strengthen the premium segment of the business.
The following projects will enable TMK IPSCO to strengthen its position in
the segment of premium connections for horizontal and directional drilling
in North America:
- at TMK IPSCO, construction continued of the ULTRA Premium
Connections threading line which was started at the Wilder plant
(Kentucky, USA) at the end of 2010;
- consolidation of threading operations at TMK IPSCO’s production
facility located in Odessa, Texas is also underway.
Development trends
Results of the first half of 2011 came out stronger than expected as we
managed to increase our sales volumes and profitability in the environment
of increasing costs and competition pressures. We expect to see a robust
demand for oil and gas pipes through the rest of the year as oil and gas
companies keep up their drilling programmes without much sensitivity to
short-term volatility in energy prices.
Going into the third quarter, lower sales volumes, particularly in the large-
diameter segment, compared to the second quarter and scheduled
maintenance of equipment at Seversky, Volzhsky and Sinarsky plants in
Russia might adversely affect our financial results and profitability.
However, stronger operating performance expected in the fourth quarter of
2011 should largely offset a negative impact of the preceding quarter.
We continue improving our product mix and introducing innovative
products and services to Russian oil and gas companies. Recently, we
introduced a few high-graded products, like ULTRA premium threads,
Chrome 13 pipe and insulated lift pipe, to the Russian market. Also we plan
to support overseas projects of Russian oil and gas companies by supplying
full range of products and services globally.
We continue to prioritise deleveraging and intend to reduce the total amount
of debt in 2011. Staying committed to reduce the amount of debt, we look to
further improve our debt profile and reduce the cost of borrowings.
Availability of debt financing remains strong and we expect to continue
refinancing as designated.
Management’s Discussion and Analysis
First half of 2011
19
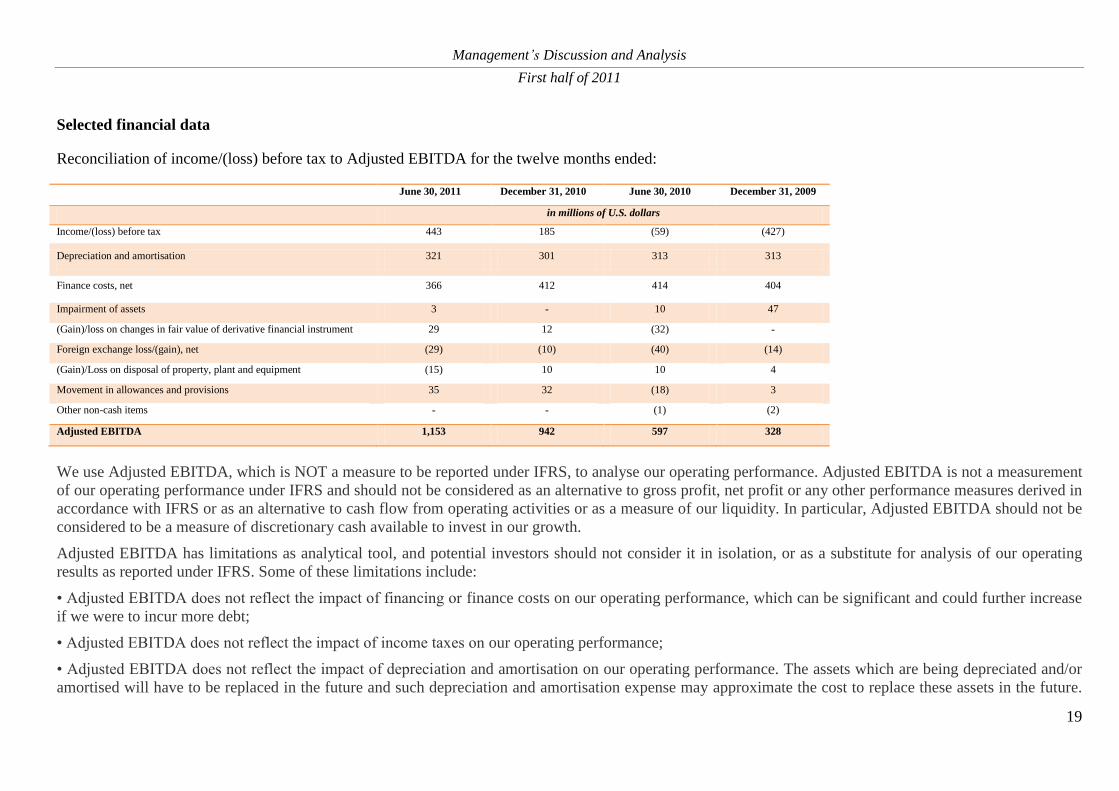
Selected financial data
Reconciliation of income/(loss) before tax to Adjusted EBITDA for the twelve months ended:
June 30, 2011 December 31, 2010 June 30, 2010 December 31, 2009
in millions of U.S. dollars
Income/(loss) before tax 443 185 (59) (427)
Depreciation and amortisation 321 301 313 313
Finance costs, net 366 412 414 404
Impairment of assets 3 - 10 47
(Gain)/loss on changes in fair value of derivative financial instrument 29 12 (32) -
Foreign exchange loss/(gain), net (29) (10) (40) (14)
(Gain)/Loss on disposal of property, plant and equipment (15) 10 10 4
Movement in allowances and provisions 35 32 (18) 3
Other non-cash items - - (1) (2)
Adjusted EBITDA 1,153 942 597 328
We use Adjusted EBITDA, which is NOT a measure to be reported under IFRS, to analyse our operating performance. Adjusted EBITDA is not a measurement
of our operating performance under IFRS and should not be considered as an alternative to gross profit, net profit or any other performance measures derived in
accordance with IFRS or as an alternative to cash flow from operating activities or as a measure of our liquidity. In particular, Adjusted EBITDA should not be
considered to be a measure of discretionary cash available to invest in our growth.
Adjusted EBITDA has limitations as analytical tool, and potential investors should not consider it in isolation, or as a substitute for analysis of our operating
results as reported under IFRS. Some of these limitations include:
• Adjusted EBITDA does not reflect the impact of financing or finance costs on our operating performance, which can be significant and could further increase
if we were to incur more debt;
• Adjusted EBITDA does not reflect the impact of income taxes on our operating performance;
• Adjusted EBITDA does not reflect the impact of depreciation and amortisation on our operating performance. The assets which are being depreciated and/or
amortised will have to be replaced in the future and such depreciation and amortisation expense may approximate the cost to replace these assets in the future.
Management’s Discussion and Analysis
First half of 2011
20
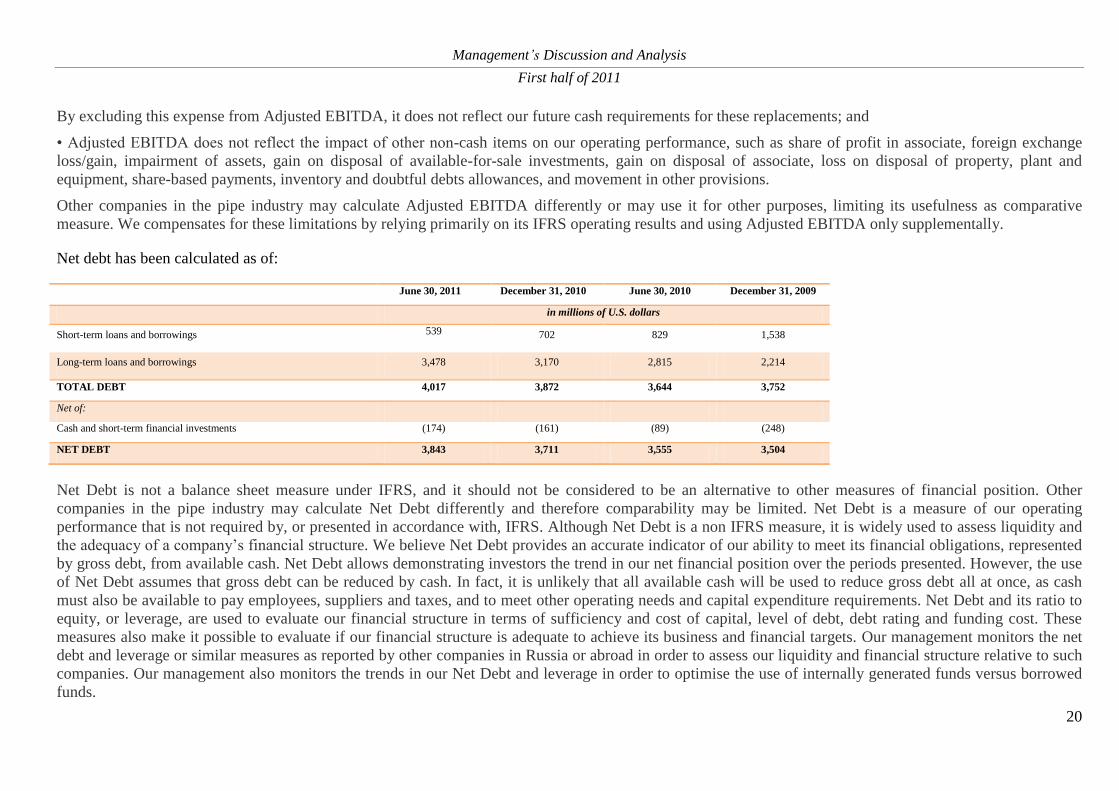
By excluding this expense from Adjusted EBITDA, it does not reflect our future cash requirements for these replacements; and
• Adjusted EBITDA does not reflect the impact of other non-cash items on our operating performance, such as share of profit in associate, foreign exchange
loss/gain, impairment of assets, gain on disposal of available-for-sale investments, gain on disposal of associate, loss on disposal of property, plant and
equipment, share-based payments, inventory and doubtful debts allowances, and movement in other provisions.
Other companies in the pipe industry may calculate Adjusted EBITDA differently or may use it for other purposes, limiting its usefulness as comparative
measure. We compensates for these limitations by relying primarily on its IFRS operating results and using Adjusted EBITDA only supplementally.
Net debt has been calculated as of:
June 30, 2011 December 31, 2010 June 30, 2010 December 31, 2009
in millions of U.S. dollars
Short-term loans and borrowings 539 702 829 1,538
Long-term loans and borrowings 3,478 3,170 2,815 2,214
TOTAL DEBT 4,017 3,872 3,644 3,752
Net of:
Cash and short-term financial investments (174) (161) (89) (248)
NET DEBT 3,843 3,711 3,555 3,504
Net Debt is not a balance sheet measure under IFRS, and it should not be considered to be an alternative to other measures of financial position. Other
companies in the pipe industry may calculate Net Debt differently and therefore comparability may be limited. Net Debt is a measure of our operating
performance that is not required by, or presented in accordance with, IFRS. Although Net Debt is a non IFRS measure, it is widely used to assess liquidity and
the adequacy of a company’s financial structure. We believe Net Debt provides an accurate indicator of our ability to meet its financial obligations, represented
by gross debt, from available cash. Net Debt allows demonstrating investors the trend in our net financial position over the periods presented. However, the use
of Net Debt assumes that gross debt can be reduced by cash. In fact, it is unlikely that all available cash will be used to reduce gross debt all at once, as cash
must also be available to pay employees, suppliers and taxes, and to meet other operating needs and capital expenditure requirements. Net Debt and its ratio to
equity, or leverage, are used to evaluate our financial structure in terms of sufficiency and cost of capital, level of debt, debt rating and funding cost. These
measures also make it possible to evaluate if our financial structure is adequate to achieve its business and financial targets. Our management monitors the net
debt and leverage or similar measures as reported by other companies in Russia or abroad in order to assess our liquidity and financial structure relative to such
companies. Our management also monitors the trends in our Net Debt and leverage in order to optimise the use of internally generated funds versus borrowed
funds.
Management’s Discussion and Analysis
First half of 2011
21
Principal Risks and Uncertainties
Industry risks
Increases in the cost of raw materials
Raw materials and consumables remain the principle component of our
production costs. The principal raw materials we use in production
processes include scrap, ferroalloys and refractories for use in steelmaking
operations, steel billets used for the production of seamless pipes and steel
coils and plates for the production of welded pipes. The demand for the
principal raw materials we utilise generally correlates with macroeconomic
fluctuations, which are in turn affected by global economic conditions. The
prices for raw materials and supplies, one of the main factors affecting our
results of operations, are influenced by many factors, including worldwide
economic growth, oil and gas prices, capacity utilisation rates, inflation,
exchange rates, trade barriers and improvements in steelmaking processes.
In the first half of 2011 raw materials and consumables accounted for 69%
of total cost of production as compared to 66% in the first half of 2010. All
our divisions were exposed to volatility in raw material prices in the first
half of 2011. The average purchase price for scrap in the Russian, American
and European divisions increased by 34%, 21% and 31% in the first half of
2011, respectively, as compared to the first half of 2010. The average
purchase price for coils in the Russian and American divisions also
increased by 24% and 26%, respectively. As a result of increased prices for
raw materials and increased sales volumes, our costs of raw materials and
consumables rose from U.S.$1,347 million in the first half of 2010 to
U.S.$1,926 million in the first half of 2011. Prices for raw materials
continue to have a key influence on our production costs. If not passed on to
customers in a timely fashion, the increase in prices for scrap, coils and
other principle raw materials can adversely affect our profit margins and
results of operations.
We also consume significant quantities of energy, particularly electricity
and gas. In the first half of 2011 energy costs amounted to 8% of the total
cost of production and remained relatively flat as compared to the first half
of 2010. Further price increases for energy resources will increase our costs
of production and could have an adverse effect on results of operations and
financial results.
Dependence on the oil and gas industry
The oil and gas industry is the principal consumer of steel pipe products
worldwide and accounts for most of our sales, in particular sales of OCTG,
line pipe and large diameter welded pipe. In the first half of 2011, sales of
pipes used in oil and gas industry (OCTG, line pipe and large diameter pipe)
accounted for 75% of our total sales volumes.
Any downturns in the oil and gas markets can adversely affect the demand
for our products which largely depends on the number of oil and gas wells
being drilled and completed, the depth and drilling conditions of wells and
on the construction of oil and gas transportation pipelines. The level of such
capital spending by major oil and gas companies is largely driven by
prevailing prices for oil and natural gas and their stability. In case of
significant and/or sustained decline in oil and natural gas prices energy
companies could reduce their levels of expenditures and investment activity.
As a result, the demand for pipes used in oil and gas industry can
substantially decrease, which can also lead to tightening of competition and
possible decreases of market prices for tubular products. Thus, the decline
in oil and gas exploration, drilling and production activities and in prices for
energy commodities could have a negative impact on our results of
operations and financial position.
Management’s Discussion and Analysis
First half of 2011
22
Dependence on a small group of customers
We remain focused on supplying a wide range of products to the oil and gas
industry, which contributed to 75% of our total sales volumes in the first
half of 2011. Therefore our largest customers are oil and gas companies. In
the first half of 2011, our five largest customers were Gazprom, Rosneft,
Surgutneftegas, TNK BP and Lukoil, which together accounted for 39% of
total pipe sales. We have strong business relationships with its key
customers and expect a proportion of sales to a limited number of
companies to remain high in the foreseeable future. Nevertheless, the
increased dependence of pipe sales on a single large customer bears the risk
of an adverse effect on our results of operations in the event that our
relationship with any of these major customers deteriorated.
Our large diameter welded pipe business is largely dependent on one of our
largest customers, Gazprom, which is one of our largest customers for 1,420
mm diameter welded pipes used for construction of gas transportation
pipelines. Further increases of the level of competition in the supply of
large-diameter pipe or a change in relationships with Gazprom could
negatively affect our competitive position in large-diameter pipe market,
resulting in decreased revenues from sales of these products and adversely
affecting our results of operations and financial position. Additionally, large
diameter welded pipe business depends significantly upon the level of
construction of new oil and gas pipelines in Russia and the CIS. The delay,
cancellation or other changes in the scale or scope of significant pipeline
projects, or the selection by the sponsors of such projects of other suppliers
could have an adverse effect on our sales of large diameter welded pipes,
and thus on our results of operations and financial position.
Our American and European divisions, together with direct sales to end
customers, cooperate with a wide range of distributors, each of whose share
in our total sales volumes is not significant
Competition
The global steel pipe market, particularly in the oil and gas sector, is highly
competitive and primarily based on compliance with technical requirements,
price, quality and related services. In the Russian and CIS markets, we face
competition primarily from Russian and, to a certain extent, Ukrainian
seamless and welded pipe producers. In the United States, our American
division faces competition primarily from first-tier domestic steel pipe
producers, as well as from imported OCTG and line pipe products,
principally from Asia, Canada and Mexico. Several of our key competitors
are currently building and/or ramping-up new pipe capacities, which is
expected to increase competition in certain pipe segments in Russia, CIS the
United States and other international pipe markets.
Financial risks
Liquidity risk
Following the growth of sales volumes and improvements in operating
performance our leverage level continued to improve in the first half of
2011. Our net-debt-to-EBITDA ratio stood at 3.3x as of June 30, 2011,
down from 3.9x as of December 31, 2010 and 6.0x as of June 30, 2010. Our
adjusted EBITDA for the twelve months ended June 30, 2011 reached
U.S.$1,153 million on the back of further improvements in operating
performance in the first half of 2011. On the other hand, our total debt
amounted to U.S.$4,017 million as of June 30, 2011, as compared to
U.S.$3,872 million as of December 31, 2010. Appreciation of the Russian
rouble against the U.S. dollar resulted in an increase of the U.S. dollar
equivalent of the Russian rouble-denominated loans and, consequently, in a
growth of total debt as compared to the beginning of the year.
In the first half of 2011 we continued to improve our liquidity profile and
optimise financial performance. The ratio of short-term debt relative to total
debt, which stood at 18% as of 31 December 2010, was further improved to
13% as of June 30, 2011. The weighted average nominal interest rate further
Management’s Discussion and Analysis
First half of 2011
23
decreased in the first half of 2011 and stood at 7.33% as of June 30, 2011,
down 53 basis points from 2010 end.
We continue to carry out measures to maintain sufficient liquidity and
improve loan portfolio structure. Nevertheless, there can be no assurance
that our efforts to improve liquidity profile and reduce leverage will prove
successful. Negative market developments or deteriorating global financial
situation may have an adverse impact on our ability to refinance existing
obligations or new borrowings in banks or on capital markets, and may put
pressure on our liquidity, increase borrowing costs, temporary reduce the
availability of credit lines and lead to unavailability of financing on
acceptable terms.
Interest rate risk
We currently benefit from relatively low interest rates. Our interest
payments continue to decrease: in the first half of 2011 our total interest
paid amounted to U.S.$142 million as compared to U.S.$182 million in the
first half of 2010. While our cost of funding continues to decrease, there can
be no assurance that rates will stay on their low levels in the future. Should
the rates increase in the future, our interest expense can increase and
adversely affect our financial position.
Certain part of our loan portfolio is represented by loans taken out at
floating interest rates. As of June 30, 2011, loans with floating interest rates
represented 8% of our total loan portfolio and amounted to U.S.$309
million. The underlying floating interest rates in current loans remained
close to their historical lows in the first half of 2011, which kept our interest
expense on the relevant loans low. The share of floating rate loans in our
loan portfolio remains insignificant and we consider relevant interest rate
risk negligible. At present we do not use derivative instruments to hedge
such interest rate risks. Nevertheless, should floating interest rates increase
in the future, our interest expenses on relevant loans will increase.
Currency risk
Our products are typically priced in roubles for Russian sales and in U.S.
dollars and euros for CIS, U.S. and other international sales. Our direct
costs and interest expense are largely incurred in roubles and U.S. dollars,
while capital expenditures are incurred principally in roubles, euros and
U.S. dollars.
In the first half of 2011 we incurred gains from spot rate changes in the
amount of U.S.$129 million, including gains in the amount of U.S.$33
million recognised in the income statement and gains in the amount of
U.S.$96 million recognised in the statement of comprehensive income.
Gains from foreign exchange difference in the income statement were
primarily attributable to the fact that during first half of 2011 the U.S. dollar
exchange rate decreased and the income arose from non-hedged part of U.S.
dollar denominated loans. Gains from foreign exchange difference in the
statement of comprehensive income relating to hedged financial instruments
arose from the revaluation of dollar denominated loans attracted by Russian
companies of the Group.
As of June 30, 2011, U.S. dollar-denominated debt, Russian rouble-
denominated debt and euro-denominated debt accounted for 47%, 47% and
6%, respectively, of our total financial debt. The significant part of our debt
is currently denominated in U.S. dollars, and the possible devaluation of the
rouble against the U.S. dollar in the future could result in foreign exchange
losses. To mitigate this risk, we continue to decrease the share of
U.S. dollar-denominated debt in debt portfolio. Nevertheless, if U.S. dollar
appreciates against rouble in the future, this could adversely affect our net
profit.
Management’s Discussion and Analysis
First half of 2011
24
Inflation risk
As our production activities are largely located in Russia, the majority of
our direct costs are incurred in Russian roubles. We tend to experience
inflation-driven increases in raw material costs, transportation costs, energy
costs and salaries that are linked to the general price level in Russia. In the
first half of 2011, inflation rate in Russia reached 5% and may increase in
the future. We may not be able to increase the prices that we receive from
the sale of pipe products sufficiently in order to preserve existing operating
margins.
Inflation rate in the United States, with respect to our American division, is
historically much lower than in Russia. The U.S. inflation rate over the last
12 months reached 3.6% in June 2011. Accordingly, high rates of inflation,
especially in Russia, could increase our production costs, decrease operating
margins and materially adversely affect our operating performance and
financial position.
Legal risks
Changes in tax legislation and tax system
Our subsidiaries make significant tax payments, in particular, profit tax,
VAT, social and pension contributions and property tax. Changes in tax
legislation could lead to an increase in tax payments and, as a result, to a
lowering of our financial results. As significant part of our operations is
located in Russia, the main risks relate to changes in the legislation of the
Russian tax system. The Russian Government continually reviews the
Russian tax system and passes a number of laws to carry out tax reforms.
The new laws generally reduce the number of taxes and the overall tax
burden on business while simplifying tax legislation. Despite measures to
improve the tax system, tax legislation continues to give latitude to local tax
authorities and leaves a multitude of unresolved problems which may have a
negative effect on our operating results.
According to Russia’s Finance Ministry forecasts the budget will remain
deficit in 2011 in spite of improvements in the effectiveness of budget
spending. Should the Russian government increase tax burden on corporate
sector to finance the budget deficit, we can be subject to higher tax
payments in the future, which may adversely affect our financial results.
Additionally, the Russian oil industry is subject to substantial taxes,
including significant resources production taxes and significant export
customs duties. Negative changes to the tax regime and customs duties rates
may adversely affect the level of oil and gas exploration and development in
Russia, which can adversely affect demand for our products sold in Russia.
Changes in environmental law
We meet the requirements of national environmental regulations at its
Russian plants, the directives and regulations of EU and national Romanian
legislation at its Romanian plants and, with the acquisition of TMK IPSCO
the U.S. environmental laws.
The main ecological-and-economical risks for us are related to expected
changes and tightening of Russian environmental protection laws.
Environmental legislation in Russia is currently undergoing significant
change. The imposition of a new environmental law and regulation system
may require further expenditures to modernize production operations, install
pollution control equipment, perform site clean-ups and reclamation.
Stricter regulations may also lead to increases in the rate of payments for
negative impact on the environment and the use of increasing payment
coefficients. Compliance with the regulations will be accompanied by
stricter control by state monitoring authorities. Such changes in existing
legislation may lead to additional costs or unforeseen environmental
liabilities, which could have a material adverse effect on our financial
position and results of operations.
With the acquisition of TMK IPSCO, we are now responsible for
compliance with U.S. laws on the environment which differ significantly
from Russian environmental legislation. The environmental protection
Management’s Discussion and Analysis
First half of 2011
25
regime in the United States is more onerous than what we face with respect
to operations in Russia and other countries and compliance with these U.S.
laws may expose us to additional costs. We estimate that the environmental
legislation of the European Union and the United States will not undergo
any material changes in the near future. Romania’s admission into the
European Union, which occurred in 2007, resulted in increased
environmental liabilities for our Romanian operations. TMK Romanian
subsidiaries may be required to adopt and implement more stringent
environmental and labor laws in the future. There can be no assurance that
the European Union will not impose new environmental regulations or that
Romanian state authorities will not change national environmental laws in
the future.
Although we do not anticipate any significant environmental matters in the
United States and Romania, if such matters arise, the cost of compliance
could have a material adverse effect on our business.
Other risks
Equipment failures or production curtailments or shutdowns
Our production capacities are subject to the risk of equipment failures due
to unanticipated events, such as fires, explosions and adverse weather
conditions. Manufacturing processes depend on critical pieces of steel-
making and pipe-making equipment. Such equipment may, on occasion, be
out of service as a result of unanticipated failures could require us to close
part of the relevant production facility or cause to reduce production on one
or more of production lines. Any interruption in production capability may
require us to make significant and unanticipated capital expenditures to
affect relevant repairs, which could have a negative effect on our
profitability and cash flows. We currently maintain insurance against losses
that may arise in case of property damage, accidents and transportation of
goods. We also maintain corporate product liability and directors and
officers’ liability insurance policies. Nevertheless, any recoveries under
insurance coverage that may be obtained in the future may not offset the lost
revenues or increased costs resulting from a disruption of operations.
Insurance against all potential risks and losses
We do not carry insurance against all potential risks and losses that may
arise in connection with the quality of our products, property damage, work-
related accidents and occupational illnesses, natural disasters and
environmental contamination. We currently maintain no business
interruption insurance. Losses or liabilities arising from these or other
events could increase our costs and could adversely affect our business,
financial position and operating results.
Ability to effect staff alterations and shortages of skilled labor
Our Russian subsidiaries are in many regions the largest employers in the
cities in which they operate, such as Volzhsky, Taganrog, Kamensk-Uralsky
and Polevskoy. While we do not have any specific legal social obligations
or responsibilities with respect to these regions, the ability to effect
alterations in the number of our employees may nevertheless be subject to
political and social considerations. Any inability to make planned
reductions in the number of employees or other changes to operations in
such regions could have an adverse effect on our results of operations and
prospects.
Competition for skilled labor in the steel pipe industry remains relatively
intense, and labor costs continue to increase moderately, particularly in the
CIS, Eastern Europe and the United States. We expect the demand and,
hence, costs for skilled engineers and operators will continue to increase,
reflecting the significant demand from other industries and public
infrastructure projects. Continual high demand for skilled labor and
continued increases in labor costs could have a material adverse effect on
our business, financial position and results of operations. Furthermore, any
work stoppages, strikes or other labor-related developments could have an
adverse effect on our business, financial position and results of operations.
Management’s Discussion and Analysis
First half of 2011
26
Responsibility Statement
We confirm to the best of our knowledge:
1. The consolidated financial statements of OAO TMK presented together with this management’s discussion and analysis of financial condition and
results of operation of OAO TMK and established in conformity with International Financial Reporting Standards give a true and fair view of the assets,
liabilities, financial position and profit of OAO TMK and the undertakings included in the consolidation taken as a whole; and
2. The management report includes a fair review of the development and performance of the business and the position of OAO TMK and the undertakings
included in the consolidation taken as a whole, together with a description of the principal risks and uncertainties that they face.
Chief Executive Officer ОАО ТМК
Alexander G. Shiryaev
Chief Financial Officer ОАО ТМК
Tigran I. Petrosyan
2 September 2011