Embed Size (px)
Citation preview
8/6/2019 Management of Obstructive Sleep Apnea
http://slidepdf.com/reader/full/management-of-obstructive-sleep-apnea 1/10 Journal of Clinical Sleep Medicine, Vol. 2, No. 2, 2006
There exists a dire need to raise and standardize the quality of
healthcare delivery in many disease conditions, including ob-
structive sleep apnea (OSA).1 Unique to OSA are the uncertainties
of disease definition,2 large variability in scoring of polysomno-
grams and therefore diagnosing OSA,3,4 and also multidisciplinary
backgrounds and respective biases of physicians who treat OSA.5
In light of such variability, the training for physicians offered by
formal sleep-medicine fellowships, and the benchmarks advocat-
ed by the American Academy of Sleep Medicine (AASM) for the
workings of a sleep center, afford greater conformity and set stan-
dards of practice for individual physicians and sleep centers.6 So
far, a systematic assessment of the effect of AASM center accredi-
tation and sleep-medicine certification of physicians on clinical
outcomes in patients with OSA has not been reported. In order
to measure the effect of AASM accreditation and sleep-medicine
certification on clinical outcomes in patients with OSA, several
important endpoints can be considered.
One such endpoint that poses a challenge in the management
of patients with OSA is patient adherence to positive airway pres-
sure (PAP) therapy.7 While the minimum required adherence—in
hours of PAP therapy used per night—is unclear,8 discontinuation
of PAP device is an unambiguous endpoint for treatment failure
In this study, we used such a clear definition of treatment fail-
ure—proportion of patients who discontinued PAP therapy—to
measure the performance of physicians and sleep centers. Ad-
ditionally, because patients’ risk perceptions of OSA and their
knowledge of their disease condition are important to ensure ad-
herence to therapy,8,9 we assessed patients’ perceptions of whether
such information was dispensed by their physicians or sleep cen-
ters. Lastly, other important benchmarks in the management of
patients with OSA, such as timely delivery of care10 (time lapse
between initial sleep study and institution of PAP therapy) and pa-
tients’ overall satisfaction with care rendered by their physicians
and centers, were also assessed.
A National Survey of the Effect of Sleep Medicine Specialists and American Academyof Sleep Medicine Accreditation on Management of Obstructive Sleep Apnea
Sairam Parthasarathy, M.D.1,2; Patricia L. Haynes, Ph.D.2; Rohit Budhiraja, M.D.1,2; Michael P. Habib, M.D.1,2; Stuart F. Quan, M.D.2
1Southern Arizona Veterans Administration Health Care System, Tucson, AZ; 2University of Arizona, Tuscon, AZ
Disclosure Statement
This was not an industry supported study. Drs. Parthasarathy, Haynes, Bud-
hiraja, Habib, and Quan have indicated no financial conflicts of interest.
Submitted for publication November 18, 2005
Accepted for publication December 14, 2005
Address correspondence to: Sairam Parthasarathy, M.D., Southern Arizona
VA Health Care System, 3601, South Sixth Avenue, Mail Stop 1-111A, Tuc-
son, AZ 85723; Tel: (520) 792-1450 ext. 15076; Fax: (520) 629-4641; E-mail:
SCIENTIFIC INVESTIGATIONS
133
Study Objectives: To study the effect of American Academy of Sleep
Medicine accreditation of sleep centers and sleep-medicine certification
of physicians on the management of patients with obstructive sleep ap-
nea (OSA).
Design: Cross-sectional study.
Setting: National web-based survey.Patients: Six hundred thirty-two patients with OSA.
Interventions: None.Measurements and Results: Self-reported data on details of whether
patients with OSA were using positive airway pressure (PAP) devices,
timeliness of the initiation of PAP therapy, and overall satisfaction of care
received from physicians and centers. After adjusting for covariates, lack
of accreditation or certification status of providers was independently as-
sociated with discontinuation of PAP therapy (odds ratio [OR] 1.9, 95%
confidence interval [CI], 1.1-3.2; p = .03). Patient education leading to
perception of risk associated with OSA (OR 0.5, 95% CI, 0.2-0.9) and
medications for nasal congestion (OR 0.3, 95% CI, 0.1-0.8) “protected”
against discontinuation of PAP therapy, whereas nasal congestion (OR
1.6, 95% CI, 1.0-2.4) increased the likelihood for discontinuation of PAP
therapy. Certified physicians and accredited centers were more likely to
educate their patients and received greater satisfaction ratings than non-
certified physicians and nonaccredited centers (p < .05). Time delays in
instituting PAP therapy were not influenced by accreditation or certifica-
tion status, but such delays diminished patient satisfaction.
Conclusions: In this web-based survey, accreditation or certification
status of sleep centers and physicians was associated with better index-
es of clinical management in patients with OSA. Better patient education
that fostered risk perception may have been partly responsible for such
an association. Prospective studies designed to collect objective data
regarding the effect of accreditation or certification status on outcomes
in patients with OSA are still needed.
Keywords: Sleep, professional competence, obstructive sleep apnea,
patient satisfaction, continuous positive airway pressure, accreditation,
patient compliance, treatment refusal, nasal obstruction, nasal decon-
gestants, sleep apnea syndromesCitation: Parthasarathy S; Haynes PL; Budhiraja R et al. A national sur-
vey of the effect of sleep medicine specialists and American Academy
of Sleep Medicine accreditation on management of obstructive sleep
apnea. J Clin Sleep Med 2006;2(2):133-142.
Commentary Follows on Pages 143-144
8/6/2019 Management of Obstructive Sleep Apnea
http://slidepdf.com/reader/full/management-of-obstructive-sleep-apnea 2/10
Journal of Clinical Sleep Medicine, Vol. 2, No. 2, 2006
We designed a survey that asked patients about the care they
received from their physicians and sleep centers for their OSA
condition. The overall purpose of the study was to study the ef-
fect of AASM accreditation of sleep centers and sleep-medicine
certification of physicians on the clinical management of patients
with OSA through a web-based survey. We hypothesized that pa-
tients with OSA who are cared for by sleep-certified physicians
or AASM-accredited centers are less likely to discontinue PAP
therapy than are patients cared for by noncertified physicians and
nonaccredited centers. We also hypothesized that patient educa-tion regarding OSA and associated risks are provided by a greater
proportion of sleep-certified physicians and AASM-accredited
centers than by noncertified physicians and nonaccredited cen-
ters. Lastly, we hypothesized that sleep-certified physicians and
AASM-accredited centers provide more timely care and achieve
greater patient-satisfaction ratings than do noncertified physicians
and nonaccredited centers.
METHODS
Patients
We conducted a cross-sectional study of 632 patients with OSA
across the country using a web-based survey. Of the 842 “hits”to the web site containing the questionnaire, 632 patients took
the time to respond to the questionnaire. Patients were naïve to
the exact purposes of the study. Patients older than 20 years of
age with a diagnosis of OSA were solicited to take the anony-
mous web-based survey (see Appendix). Such solicitations to
participate were placed on web sites frequented by patients
with OSA: sleep apnea support groups (American Sleep Apnea
Association, Washington, DC), other educational web sites
(such as apneanet.org, Glen Ellyn, IL), vendors of PAP therapy
devices (such as cpapstore.com, Kennewick, Wash, and cpaptalk.
com, Missouri City, TX), and Internet chat groups (such as the
one sponsored by the AASM, sleepeducation.com, Westchester,
IL). The Institutional Review Board of the University of Arizonaapproved the study and waived the need for documentation of
written informed consent.
Questionnaire Tool
Patients were asked to respond yes, no, or don’t know to the
following questions: (1) whether the physician managing their
sleep-apnea condition is a sleep expert (an Internet link to the
AASM web site with a state-wise list of certified sleep physicians
was provided); (2) whether the sleep center that they received ser-
vice from was accredited (an Internet link to the AASM web site
with state-wise list of AASM-accredited centers was provided);
(3) whether they received adequate education from the health-care provider in any form—verbal, audiovisual, or pamphlets;
(4) whether such education improved their understanding of their
disease condition; (5) whether such education helped them realize
the risks associated with OSA; and (6) whether they were satis-
fied with their physician’s management of their sleep-apnea con-
dition on a 5-point Likert scale that ranged from very dissatisfied
(score of 1) to very satisfied (score of 5).11 Also, they were asked
to evaluate the sleep center on a 5-point satisfaction scale.11 Pa-
tients were asked whether they were continuing to use the PAP
device or whether they had stopped using such therapy. Patients
were also asked to report when they received their PAP device in
relation to their first sleep study and the duration of time that they
have had the PAP device.
Potential confounders that may affect acceptance of PAP de-
vice were also measured: PAP pressure level, device type (auto-
matic PAP, bilevel PAP, or continuous PAP), presence and sever-
ity of nasal congestion, age, sex, height, weight (for calculations
of body mass index), and highest education (did not finish high
school, finished high school, college, masters, or doctorate). Po-
tential confounders for timeliness in healthcare delivery such as
type of health insurance (HMO, PPO, POS, Medicare, or lackof any insurance) were also requested. Also, subjective improve-
ment in sleepiness after the initiation of PAP therapy was mea-
sured using a 5-point Likert scale,12 and self-reported hours of
PAP-device use was sought. Patient responses were saved in the
file server and analyzed in aggregate.
Questionnaire Validation
We measured nasal congestion using a 5-point Likert scale that
was previously administered to patients with sleep-disordered
breathing.13 Nasal-congestion severity was scored in the following
manner: 0 for never congested, 1 for rarely, 2 for sometimes, 3 for
most of the time, and 4 for always. Additionally, we revalidated
this 5-point Likert scale against a well-validated nasal symptom
scale.14,15 We performed such validation in a separate cohort of
54 patients with OSA by correlating nasal-congestion scores
obtained by our single question versus the previously well-
validated, multiple-question nasal symptom scale. There was
good consistency between the 2 measures (Cronbach α coefficient
of 0.79).
Initial construction of questions relating to patient satisfaction
was based on patient interviews. Subsequently, an initial data set
of 50 patient responses and input from sleep-medicine experts
was used to identify questions that made the largest contribution
to variation in satisfaction scores and to shorten and edit the
questionnaire. Internal consistency for the patient education-related questions was excellent (Cronbach α coefficient of
0.93; questions 3, 4, and 5 in Appendix) and good for patient-
satisfaction questions (Cronbach α coefficient of 0.75; questions
7 and 8 in Appendix).
Data Analysis
ENDPOINTS
The primary endpoint for analysis was discontinuation of PAP
therapy. Secondary endpoints were (1) patients’ perceptions of
education they received regarding OSA and risks associated with
OSA, (2) time delay in instituting PAP therapy, and (3) overall
patient satisfaction of the care delivered by the physician andcenter, measured separately.
PREDICTORS AND COVARIATES
In order to assess the combined “dose-effect” of sleep certifi-
cation of physicians and AASM accreditation of the centers on
patient outcomes, we assigned patients to 1 of 3 groups: (1) the
physician was certified and the center was accredited, (2) either
the physician was certified or the center was accredited, and (3)
neither was the physician certified nor was the center accredited
From the list of predictors and potential confounders, simple lo-
gistic-regression analysis was performed to identify significant
134
S Parthasarathy, PL Haynes, R Budhiraja et al
8/6/2019 Management of Obstructive Sleep Apnea
http://slidepdf.com/reader/full/management-of-obstructive-sleep-apnea 3/10
Journal of Clinical Sleep Medicine, Vol. 2, No. 2, 2006
covariates that influenced discontinuation of PAP therapy. Sub-
sequently, we built multivariate logistic-regression models with
continued use of PAP device as the dependent variable using sig-
nificant covariates identified by simple logistic-regression analy-
sis (p < .05).
Also, general linear models were constructed to identify
determinants of timely delivery of care and self-reported adherence
to PAP therapy (expressed as hours per week). Multicollinearity
among independent variables was verified, and, in the event of
collinearity, the strongest predictor variable alone was included. Nonparametrically distributed variables—such as time delay—
were log transformed to meet assumptions of normality required for
multiple regression. All analyses used a list-wise deletion strategy
for missing values. Results are presented as mean and standard
deviation unless otherwise specified. All tests for significance and
resulting p values were 2-sided, with a significance level of .05. All
analyses were performed using SPSS v12.0 (SPSS Inc., Chicago,
IL). Unadjusted proportions were compared using Pearson χ 2 test
with Bonferroni correction applied when appropriate.
POWER ANALYSIS
Acceptance of PAP-device therapy has been reported to
range from 75% to 80% of patients who were prescribed such
therapy.16,17 We assumed a PAP-acceptance proportion of 70% in
patients cared for by nonaccredited centers or physicians and 80%
in the AASM-accredited centers or physicians—a difference of
10%. Based upon such assumptions, we estimated that we would
need 412 patients per group—a total of 824 responses (assuming
also that α is .05, 2-sided, power of 90% using χ 2). We report
significant results from the planned midpoint interim analysis—
444 responses with accreditation or certification status.
RESULTS
Description of Respondents
Of the 842 “hits” to the web site containing the questionnaire,
632 responded to the survey (overall response rate of 75%). The
mean age of patients was 51 ± 10 years (range from 20-89 years)
with 35% comprising women. Average body mass index was 35.7
± 8.9 kg/m2, and average continuous PAP pressure was 11.5 ± 3.6
cm h2o, with 78% of patients having been prescribed continuous
PAP devices. A minority of patients were prescribed automatic
PAP (10%) and bilevel PAP devices (12%). Of the 632 responses,
444 patients had responded as knowing both their physician’s cer-
tification status and their sleep center’s accreditation status, while
188 patients were unaware of the accreditation status of their phy-
sician, the certification status of their sleep center, or both.
Discontinuation of PAP Therapy and Adherence
Of the 444 patients who identified physician-accreditation sta-
tus and center-certification status, 16 (5%) of 307 patients who
were cared for by certified physicians and accredited centers had
stopped using their PAP devices. In contrast, 7 (7%) of 99 pa-
tients cared for by either certified physicians or accredited centers
had stopped using their PAP devices, and 8 (21%) of 38 patients
who were cared for by noncertified physicians and nonaccredited
centers had stopped using their PAP device (χ 2; p = .001)(Table
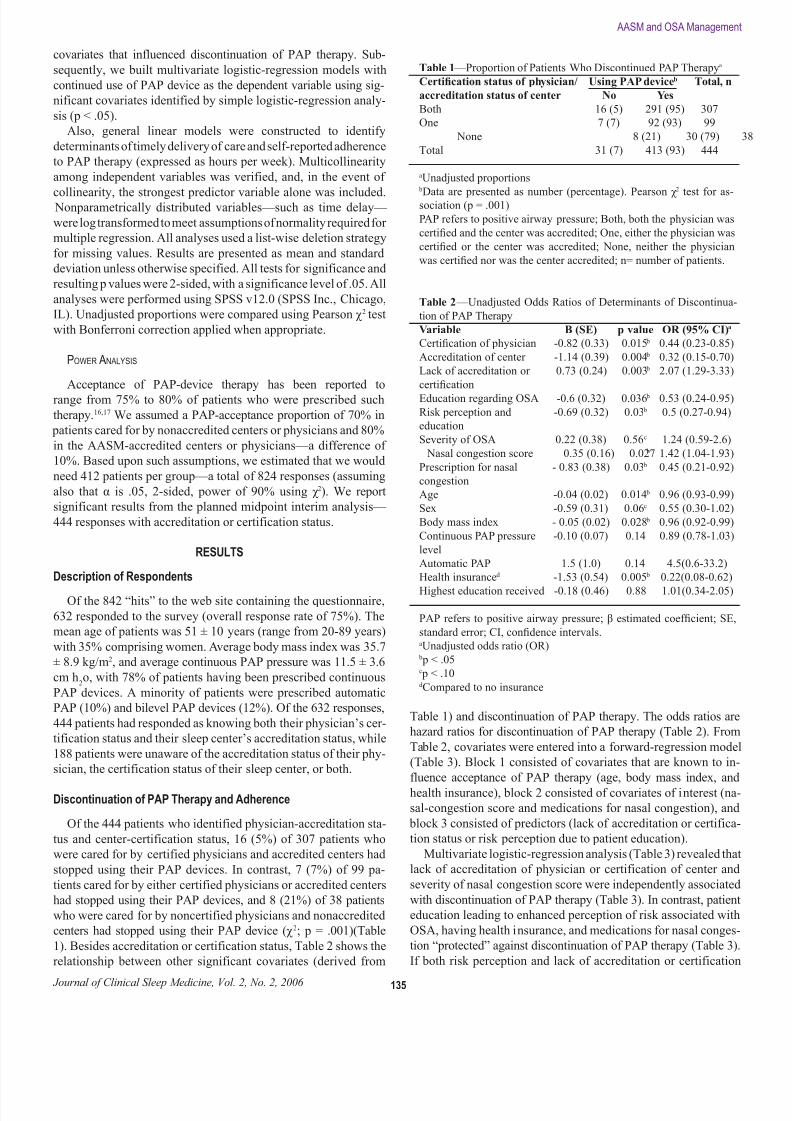
1). Besides accreditation or certification status, Table 2 shows the
relationship between other significant covariates (derived from
Table 1) and discontinuation of PAP therapy. The odds ratios are
hazard ratios for discontinuation of PAP therapy (Table 2). From
Table 2, covariates were entered into a forward-regression model
(Table 3). Block 1 consisted of covariates that are known to in-
fluence acceptance of PAP therapy (age, body mass index, and
health insurance), block 2 consisted of covariates of interest (na-
sal-congestion score and medications for nasal congestion), and
block 3 consisted of predictors (lack of accreditation or certifica-
tion status or risk perception due to patient education).
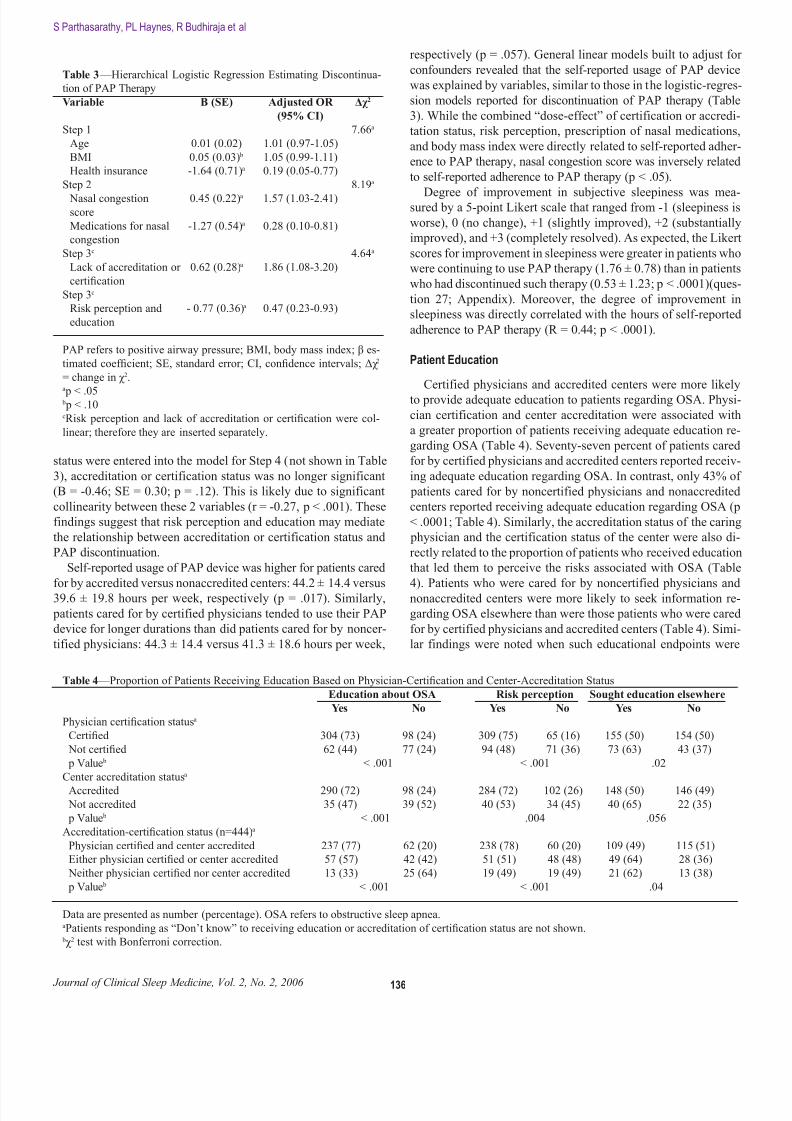
Multivariate logistic-regression analysis (Table 3) revealed that
lack of accreditation of physician or certification of center and
severity of nasal congestion score were independently associated
with discontinuation of PAP therapy (Table 3). In contrast, patient
education leading to enhanced perception of risk associated with
OSA, having health insurance, and medications for nasal conges-
tion “protected” against discontinuation of PAP therapy (Table 3).
If both risk perception and lack of accreditation or certification
135
AASM and OSA Managemen
Table 1 —Proportion of Patients Who Discontinued PAP Therapya
Certification status of physician/ Using PAP deviceb Total, n
accreditation status of center No Yes
Both 16 (5) 291 (95) 307
One 7 (7) 92 (93) 99
None 8 (21) 30 (79)
Total 31 (7) 413 (93) 444
aUnadjusted proportions b
Data are presented as number (percentage). Pearson χ 2
test for as-sociation (p = .001)
PAP refers to positive airway pressure; Both, both the physician was
certified and the center was accredited; One, either the physician was
certified or the center was accredited; None, neither the physician
was certified nor was the center accredited; n= number of patients.
Table 2 —Unadjusted Odds Ratios of Determinants of Discontinua-
tion of PAP Therapy
Variable B (SE) p value OR (95% CI)a
Certification of physician -0.82 (0.33) 0.015 b 0.44 (0.23-0.85)
Accreditation of center -1.14 (0.39) 0.004 b 0.32 (0.15-0.70)
Lack of accreditation or 0.73 (0.24) 0.003 b 2.07 (1.29-3.33)
certification
Education regarding OSA -0.6 (0.32) 0.036 b 0.53 (0.24-0.95)
Risk perception and -0.69 (0.32) 0.03 b 0.5 (0.27-0.94)
education
Severity of OSA 0.22 (0.38) 0.56c 1.24 (0.59-2.6)
Nasal congestion score 0.35 (0.16) 0.027 b 1.42 (1.04-1.93)
Prescription for nasal - 0.83 (0.38) 0.03 b 0.45 (0.21-0.92)
congestion
Age -0.04 (0.02) 0.014 b 0.96 (0.93-0.99)
Sex -0.59 (0.31) 0.06c 0.55 (0.30-1.02)
Body mass index - 0.05 (0.02) 0.028 b 0.96 (0.92-0.99)
Continuous PAP pressure -0.10 (0.07) 0.14 0.89 (0.78-1.03)
level
Automatic PAP 1.5 (1.0) 0.14 4.5(0.6-33.2)
Health insuranced -1.53 (0.54) 0.005 b 0.22(0.08-0.62)
Highest education received -0.18 (0.46) 0.88 1.01(0.34-2.05)
PAP refers to positive airway pressure; β estimated coefficient; SE,
standard error; CI, confidence intervals.aUnadjusted odds ratio (OR)
b p < .05c p < .10dCompared to no insurance
8/6/2019 Management of Obstructive Sleep Apnea
http://slidepdf.com/reader/full/management-of-obstructive-sleep-apnea 4/10
Journal of Clinical Sleep Medicine, Vol. 2, No. 2, 2006
status were entered into the model for Step 4 (not shown in Table
3), accreditation or certification status was no longer significant
(B = -0.46; SE = 0.30; p = .12). This is likely due to significant
collinearity between these 2 variables (r = -0.27, p < .001). These
findings suggest that risk perception and education may mediate
the relationship between accreditation or certification status and
PAP discontinuation.
Self-reported usage of PAP device was higher for patients cared
for by accredited versus nonaccredited centers: 44.2 ± 14.4 versus39.6 ± 19.8 hours per week, respectively (p = .017). Similarly,
patients cared for by certified physicians tended to use their PAP
device for longer durations than did patients cared for by noncer-
tified physicians: 44.3 ± 14.4 versus 41.3 ± 18.6 hours per week,
respectively (p = .057). General linear models built to adjust for
confounders revealed that the self-reported usage of PAP device
was explained by variables, similar to those in the logistic-regres-
sion models reported for discontinuation of PAP therapy (Table
3). While the combined “dose-effect” of certification or accredi-
tation status, risk perception, prescription of nasal medications,
and body mass index were directly related to self-reported adher-
ence to PAP therapy, nasal congestion score was inversely related
to self-reported adherence to PAP therapy (p < .05).
Degree of improvement in subjective sleepiness was mea-sured by a 5-point Likert scale that ranged from -1 (sleepiness is
worse), 0 (no change), +1 (slightly improved), +2 (substantially
improved), and +3 (completely resolved). As expected, the Likert
scores for improvement in sleepiness were greater in patients who
were continuing to use PAP therapy (1.76 ± 0.78) than in patients
who had discontinued such therapy (0.53 ± 1.23; p < .0001)(ques-
tion 27; Appendix). Moreover, the degree of improvement in
sleepiness was directly correlated with the hours of self-reported
adherence to PAP therapy (R = 0.44; p < .0001).
Patient Education
Certified physicians and accredited centers were more likely
to provide adequate education to patients regarding OSA. Physi-
cian certification and center accreditation were associated with
a greater proportion of patients receiving adequate education re-
garding OSA (Table 4). Seventy-seven percent of patients cared
for by certified physicians and accredited centers reported receiv-
ing adequate education regarding OSA. In contrast, only 43% of
patients cared for by noncertified physicians and nonaccredited
centers reported receiving adequate education regarding OSA (p
< .0001; Table 4). Similarly, the accreditation status of the caring
physician and the certification status of the center were also di-
rectly related to the proportion of patients who received education
that led them to perceive the risks associated with OSA (Table
4). Patients who were cared for by noncertified physicians andnonaccredited centers were more likely to seek information re-
garding OSA elsewhere than were those patients who were cared
for by certified physicians and accredited centers (Table 4). Simi-
lar findings were noted when such educational endpoints were
136
S Parthasarathy, PL Haynes, R Budhiraja et al
Table 3 —Hierarchical Logistic Regression Estimating Discontinua-
tion of PAP Therapy
Variable B (SE) Adjusted OR Δχ 2
(95% CI)
Step 1 7.66a
Age 0.01 (0.02) 1.01 (0.97-1.05)
BMI 0.05 (0.03) b 1.05 (0.99-1.11)
Health insurance -1.64 (0.71)a 0.19 (0.05-0.77)
Step 2 8.19a
Nasal congestion 0.45 (0.22)a 1.57 (1.03-2.41)score
Medications for nasal -1.27 (0.54)a 0.28 (0.10-0.81)
congestion
Step 3c 4.64a
Lack of accreditation or 0.62 (0.28)a 1.86 (1.08-3.20)
certification
Step 3c
Risk perception and - 0.77 (0.36)a 0.47 (0.23-0.93)
education
PAP refers to positive airway pressure; BMI, body mass index; β es-
timated coefficient; SE, standard error; CI, confidence intervals; Δχ 2
= change in χ 2.a
p < .05 b p < .10cRisk perception and lack of accreditation or certification were col-
linear; therefore they are inserted separately.
Table 4 —Proportion of Patients Receiving Education Based on Physician-Certification and Center-Accreditation Status
Education about OSA Risk perception Sought education elsewhere
Yes No Yes No Yes No
Physician certification statusa
Certified 304 (73) 98 (24) 309 (75) 65 (16) 155 (50) 154 (50)
Not certified 62 (44) 77 (24) 94 (48) 71 (36) 73 (63) 43 (37)
p Value b < .001 < .001 .02
Center accreditation statusa
Accredited 290 (72) 98 (24) 284 (72) 102 (26) 148 (50) 146 (49)
Not accredited 35 (47) 39 (52) 40 (53) 34 (45) 40 (65) 22 (35)
p Value b < .001 .004 .056
Accreditation-certification status (n=444)a
Physician certified and center accredited 237 (77) 62 (20) 238 (78) 60 (20) 109 (49) 115 (51)
Either physician certified or center accredited 57 (57) 42 (42) 51 (51) 48 (48) 49 (64) 28 (36)
Neither physician certified nor center accredited 13 (33) 25 (64) 19 (49) 19 (49) 21 (62) 13 (38)
p Value b < .001 < .001 .04
Data are presented as number (percentage). OSA refers to obstructive sleep apnea.aPatients responding as “Don’t know” to receiving education or accreditation of certification status are not shown.
bχ 2 test with Bonferroni correction.
8/6/2019 Management of Obstructive Sleep Apnea
http://slidepdf.com/reader/full/management-of-obstructive-sleep-apnea 5/10
Journal of Clinical Sleep Medicine, Vol. 2, No. 2, 2006
analyzed after patients were grouped by physician-certification or
center-accreditation status alone (Table 4).
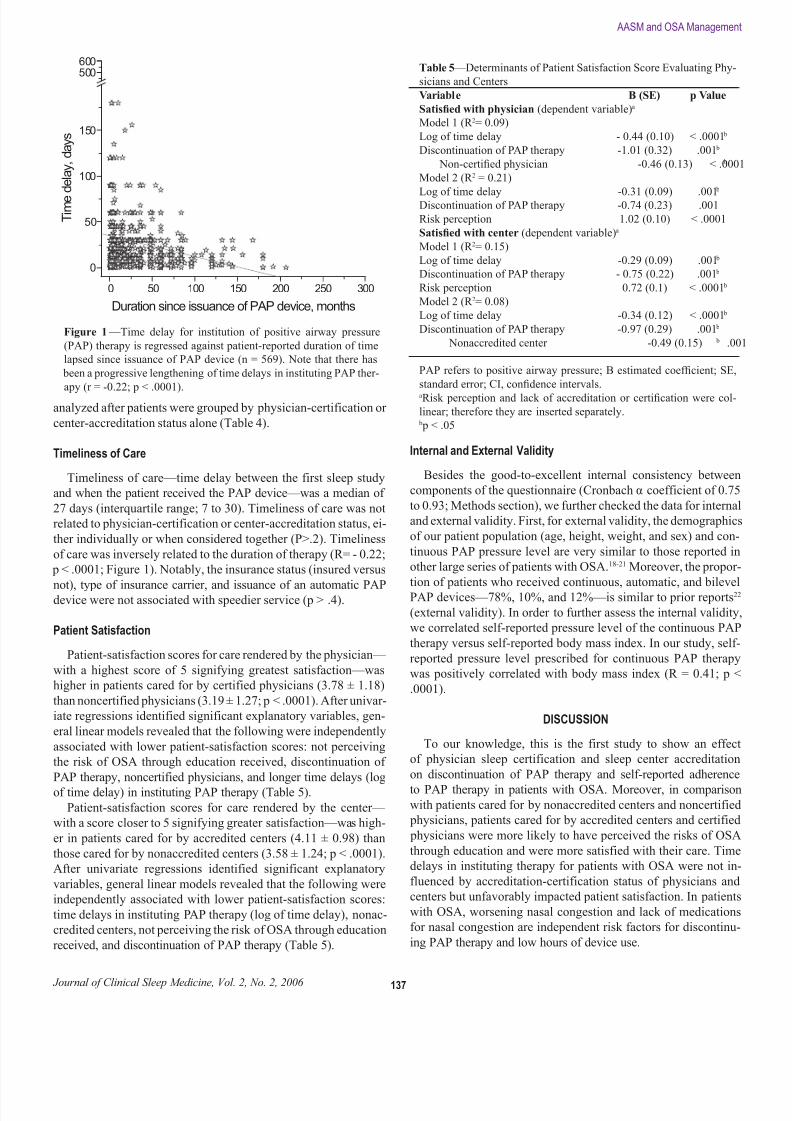
Timeliness of Care
Timeliness of care—time delay between the first sleep study
and when the patient received the PAP device—was a median of
27 days (interquartile range; 7 to 30). Timeliness of care was not
related to physician-certification or center-accreditation status, ei-
ther individually or when considered together (P>.2). Timeliness
of care was inversely related to the duration of therapy (R= - 0.22;
p < .0001; Figure 1). Notably, the insurance status (insured versus
not), type of insurance carrier, and issuance of an automatic PAPdevice were not associated with speedier service (p > .4).
Patient Satisfaction
Patient-satisfaction scores for care rendered by the physician—
with a highest score of 5 signifying greatest satisfaction—was
higher in patients cared for by certified physicians (3.78 ± 1.18)
than noncertified physicians (3.19 ± 1.27; p < .0001). After univar-
iate regressions identified significant explanatory variables, gen-
eral linear models revealed that the following were independently
associated with lower patient-satisfaction scores: not perceiving
the risk of OSA through education received, discontinuation of
PAP therapy, noncertified physicians, and longer time delays (log
of time delay) in instituting PAP therapy (Table 5).
Patient-satisfaction scores for care rendered by the center—
with a score closer to 5 signifying greater satisfaction—was high-
er in patients cared for by accredited centers (4.11 ± 0.98) than
those cared for by nonaccredited centers (3.58 ± 1.24; p < .0001).
After univariate regressions identified significant explanatory
variables, general linear models revealed that the following were
independently associated with lower patient-satisfaction scores:
time delays in instituting PAP therapy (log of time delay), nonac-
credited centers, not perceiving the risk of OSA through education
received, and discontinuation of PAP therapy (Table 5).
Internal and External Validity
Besides the good-to-excellent internal consistency between
components of the questionnaire (Cronbach α coefficient of 0.75
to 0.93; Methods section), we further checked the data for internal
and external validity. First, for external validity, the demographics
of our patient population (age, height, weight, and sex) and con-
tinuous PAP pressure level are very similar to those reported in
other large series of patients with OSA.18-21 Moreover, the propor-
tion of patients who received continuous, automatic, and bilevel
PAP devices—78%, 10%, and 12%—is similar to prior reports22
(external validity). In order to further assess the internal validity,
we correlated self-reported pressure level of the continuous PAP
therapy versus self-reported body mass index. In our study, self-
reported pressure level prescribed for continuous PAP therapy
was positively correlated with body mass index (R = 0.41; p <
.0001).
DISCUSSION
To our knowledge, this is the first study to show an effect
of physician sleep certification and sleep center accreditation
on discontinuation of PAP therapy and self-reported adherence
to PAP therapy in patients with OSA. Moreover, in comparisonwith patients cared for by nonaccredited centers and noncertified
physicians, patients cared for by accredited centers and certified
physicians were more likely to have perceived the risks of OSA
through education and were more satisfied with their care. Time
delays in instituting therapy for patients with OSA were not in-
fluenced by accreditation-certification status of physicians and
centers but unfavorably impacted patient satisfaction. In patients
with OSA, worsening nasal congestion and lack of medications
for nasal congestion are independent risk factors for discontinu-
ing PAP therapy and low hours of device use.
0 50 100 150 200 250 300
0
50
100
150
500600
T i m e
d e l a y ,
d a y s
Duration since issuance of PAP device, months
Figure 1 —Time delay for institution of positive airway pressure
(PAP) therapy is regressed against patient-reported duration of time
lapsed since issuance of PAP device (n = 569). Note that there has
been a progressive lengthening of time delays in instituting PAP ther-
apy (r = -0.22; p < .0001).
137
AASM and OSA Managemen
Table 5 —Determinants of Patient Satisfaction Score Evaluating Phy-
sicians and Centers
Variable B (SE) p Value
Satisfied with physician (dependent variable)a
Model 1 (R 2= 0.09)
Log of time delay - 0.44 (0.10) < .0001 b
Discontinuation of PAP therapy -1.01 (0.32) .001 b
Non-certified physician -0.46 (0.13) < .000 b
Model 2 (R 2 = 0.21)
Log of time delay -0.31 (0.09) .001 b
Discontinuation of PAP therapy -0.74 (0.23) .001
Risk perception 1.02 (0.10) < .0001
Satisfied with center (dependent variable)a
Model 1 (R 2= 0.15)
Log of time delay -0.29 (0.09) .001 b
Discontinuation of PAP therapy - 0.75 (0.22) .001 b
Risk perception 0.72 (0.1) < .0001 b
Model 2 (R 2= 0.08)
Log of time delay -0.34 (0.12) < .0001 b
Discontinuation of PAP therapy -0.97 (0.29) .001 b
Nonaccredited center -0.49 (0.15) .00 b
PAP refers to positive airway pressure; B estimated coefficient; SE,
standard error; CI, confidence intervals.aRisk perception and lack of accreditation or certification were col-
linear; therefore they are inserted separately. b p < .05
8/6/2019 Management of Obstructive Sleep Apnea
http://slidepdf.com/reader/full/management-of-obstructive-sleep-apnea 6/10
Journal of Clinical Sleep Medicine, Vol. 2, No. 2, 2006
Risk Perception and Education
Reports cite that between 25% and 50% of patients with OSA
may abandon treatment during the first 2 to 4 weeks of treat-
ment.23-26 Although physical factors such as poor mask fit, nasal
congestion, and high pressure contribute to such nonadherence,
psychological factors may play a major role as well.7,9 Using the
social cognitive model,27 Weaver and colleagues developed a
questionnaire-based instrument involving 3 major cognitions that
play a role in adherence to PAP therapy—patient’s perception of
health risk associated with OSA, patient’s expectations of out-
comes, and patient’s perceived ability to use the PAP device.7 In
this instrument, perception of risk was an additional, and impor-
tant component, believed to determine and predict patient behav-
ior in response to therapy and considered an improvement over a
prior model.9 Such perception of risk is usually imparted by edu-
cating the patient regarding disease-specific outcomes and health
risks.27,28 In our study, education leading to a patient’s perception
of risk due to OSA was associated with decreased odds for discon-
tinuing PAP therapy (adjusted odds ratio [OR] 0.5, p = .03; step 3,
Table 3). This is in agreement with other investigations showing
the beneficial effect of intensive education on adherence to PAP
therapy.29
Certification-Accreditation Status
In our study, successful education of the patient regarding the
health risks of OSA was performed more often by certified physi-
cians and accredited centers than by noncertified physicians and
nonaccredited centers (Table 4). Such education leading to risk
perception may underlie the lower likelihood for discontinua-
tion of PAP therapy in patients cared for by certified physicians
and accredited centers than in patients cared for by noncertified
physicians and nonaccredited centers. This is further supported
by the collinearity between “risk perception” and accreditation
or certification status in our regression model (Table 3). Besides
promoting adherence to PAP therapy through education, physi-
cians may favorably influence adherence to PAP therapy by other
means: prescription of medications to relieve nasal congestion,
heated humidifier,30 or choice of mask interfaces.31 We have previ-
ously reported differences in prescription practices among physi-
cians of various specialties.32 Physicians who specialized in the
“parent” fields for sleep medicine—pulmonary medicine, neurol-
ogy, and psychiatry—were less likely to prescribe sedatives to
patients with as yet undiagnosed OSA.32 Conversely, a survey by
Chervin and colleagues appears to indicate that there is wide vari-
ability in practice patterns of physicians managing patients with
sleep problems—regardless of their certification status.33 In the
present study, while prescription of medications for nasal conges-
tion protected against discontinuing PAP therapy (OR 0.3, 95%
CI 0.1–0.8; p = .02; Table 3), certified physicians were no more
likely than noncertified physicians to prescribe medications for
nasal congestion (p = .5; not shown). Therefore, such a mecha-
nism is unlikely to be responsible for the effect of accreditation or
certification status on discontinuation of PAP therapy.
We chose discontinuation of PAP therapy as the primary end-
point because, currently, it is unclear as to what threshold of hour-
ly PAP-therapy use is acceptable and what, if any, are the benefits
associated with an extra hour of nightly usage.8 In keeping with
this line of reasoning, we had originally powered the study based
on continuation or discontinuation of PAP therapy and not hourly
usage. Nevertheless, we did collect information regarding self-
reported hourly PAP use, and the effects of accreditation or cer-
tification status on hour-based adherence to PAP therapy was no
different than the effect of such status on discontinuation of PAP
therapy. Moreover, while self-reporting of PAP-therapy usage is
not as accurate as monitoring device compliance using microchip
technology,26 we do not believe that a systematic bias would have
occurred across the patient groups compared in our study.
Nasal Congestion and TherapyPrevious studies have identified nasal congestion and symp-
toms as important reasons for abandoning PAP therapy or poor
adherence.7,34 However, a systematic measurement of nasal symp-
toms using validated questionnaires in patients using PAP therapy
has not been performed. Often, such nasal symptoms are attrib-
uted to PAP therapy.35,36 In our study, however, patients who had
already discontinued PAP therapy reported higher nasal-conges-
tion scores than did patients who were continuing to use their PAP
devices. This would suggest that nasal congestion might play an
important role in acceptance of PAP therapy, and, conceivably,
such a role may be independent of the effect of PAP therapy on
nasal symptoms. Additionally, the importance of nasal conges-
tion on discontinuation of PAP therapy is further emphasized by
our finding that prescription of medications for nasal congestion
protected against discontinuation of PAP therapy (OR 0.3, 95%
CI 0.1-0.8; p = .02; Table 3).
Satisfaction Rates
Certified physicians and accredited centers achieved greater
satisfaction ratings from patients than did noncertified physicians
and nonaccredited centers. Other factors determining patient sat-
isfaction were receiving education leading to perception of health
risks associated with OSA and outcome of treatment—whether
they continued to use the PAP device or not and timeliness of
care. This is consistent with other reports that have identified ac-cess to care and physician communication as important determi-
nants of patient satisfaction.37,38 In light of this information, the
sleep community and healthcare systems need to address the ris-
ing wait times (Figure).
Wait Times
We chose the time lapse between first sleep study and delivery
of PAP device because these are points in time that the patient
is more likely to remember. Our data are consistent with recent
reports of time delays for sleep evaluation in the United States,10
but the magnitude of our wait times is lower than that reported
by Flemons and colleagues.10
Such a difference is probably dueto the fact that the 2 studies measured different timeframes along
the timeline of care delivered to patients with OSA. Our data,
however, allow relating the wait times to patient satisfaction and
also provide trends that allow extrapolation.
Limitations
There are several limitations to this study. First, this is an ob-
servational study, making it difficult to attribute cause-and-effect
relationships. Second, self-selection of patients agreeing to par-
ticipate in this study may not be representative of the average
patient. Third, although response rate was good, it is unknown
138
S Parthasarathy, PL Haynes, R Budhiraja et al
8/6/2019 Management of Obstructive Sleep Apnea
http://slidepdf.com/reader/full/management-of-obstructive-sleep-apnea 7/10
Journal of Clinical Sleep Medicine, Vol. 2, No. 2, 2006
as to how the nonrespondents may have influenced the results.
Fourth, this Internet-based survey does not include patients with-
out Internet access and may have discounted patients belonging
to lower socioeconomic strata or patients with disabilities. Fifth,
race demographic was not sought, but we do not believe that this
would have significantly affected the sampling because our pa-
tients’ age, sex, height, and weight information are very similar
to those in previous reports. Lastly, patients were asked to rely on
their memory—especially with regard to time delays—and such
information may be prone to recall bias.
ACKNOWLEDGEMENTS
The authors are indebted to all the organizations that helped
advertise the survey. The authors thank Mr. Joe Guilford (of cpap-
store.com) and Mr. David Hargett (Chairman, American Sleep
Apnea Association) for helpful suggestions and advertisement.
Funded by SAVAHCS Research Award and American Sleep Med-
icine Foundation of the American Academy of Sleep Medicine.
REFERENCES
1. Grant opportunities. American Academy of Sleep Medicine Bulle-
tin. 2004.11;16.2. Nieto FJ, Young TB, Lind BK, et al. Association of sleep-disordered breathing, sleep apnea, and hypertension in a large community- based study. Sleep Heart Health Study. JAMA 2000;283:1829-36.
3. Drinnan MJ, Murray A, Griffiths CJ, Gibson GJ. Interobserver vari-ability in recognizing arousal in respiratory sleep disorders. Am JRespir Crit Care Med 1998;158:358-62.
4. Tsai WH, Flemons WW, Whitelaw WA, Remmers JE. A comparisonof apnea-hypopnea indices derived from different definitions of hy- popnea. Am J Respir Crit Care Med 1999;159:43-8.
5. Tachibana N, Ayas NT, White DP. A quantitative assessment of sleeplaboratory activity in the United States. J Clin Sleep Med 2005;1:23-26.
6. American Academy of Sleep Medicine. Professional Standards.Clinical Practice Parameters. Available at:http://www.aasmnet.org/PracticeParam.aspx. Accessed June 26, 2005
7. Weaver TE, Maislin G, Dinges DF, et al. Self-efficacy in sleep apnea:instrument development and patient perceptions of obstructive sleepapnea risk, treatment benefit, and volition to use continuous positiveairway pressure. Sleep 2003;26:727-32.
8. Weaver T, Maislin G, Dinges D, Pack A, Multisite Study Group.CPAP dose duration for effective response. Am J Respir Crit CareMed 2003;167:A155.
9. Stepnowsky CJ Jr, Marler MR, Ancoli-Israel S. Determinants of na-sal CPAP compliance. Sleep Med 2002;3:239-47.
10. Flemons WW, Douglas NJ, Kuna ST, Rodenstein DO, Wheatley J.Access to diagnosis and treatment of patients with suspected sleepapnea. Am J Respir Crit Care Med 2004;169:668-72.
11. Otani K, Harris LE, Tierney WM. A paradigm shift in patient satis-faction assessment. Med Care Res Rev 2003;60:347-65.
12. Weaver TE. Outcome measurement in sleep medicine practice and
research. Part 1: assessment of symptoms, subjective and objectivedaytime sleepiness, health-related quality of life and functional sta-tus. Sleep Med Rev 2001;5:103-28.
13. Young T, Finn L, Kim H. Nasal obstruction as a risk factor for sleep-disordered breathing. The University of Wisconsin Sleep and Respi-ratory Research Group. J Allergy Clin Immunol 1997;99:S757-62.
14. Craig TJ, Teets S, Lehman EB, Chinchilli VM, Zwillich C. Nasalcongestion secondary to allergic rhinitis as a cause of sleep distur- bance and daytime fatigue and the response to topical nasal cortico-steroids. J Allergy Clin Immunol 1998;101:633-7.
15. Golden S, Teets SJ, Lehman EB, et al. Effect of topical nasal az-elastine on the symptoms of rhinitis, sleep, and daytime somno-lence in perennial allergic rhinitis. Ann Allergy Asthma Immunol2000;85:53-7.
16. Collard P, Pieters T, Aubert G, Delguste P, Rodenstein DO. Com- pliance with nasal CPAP in obstructive sleep apnea patients. SleepMed Rev 1997;1:33-44.
17. Speer TK, Fayle RW. The effect of systematic desensitization andsensory awareness training on adherence to CPAP treatment. SleepRes 1997;26:216.
18. Punjabi NM, Bandeen-Roche K, Marx JJ, Neubauer DN, SmithPL, Schwartz AR. The association between daytime sleepinessand sleep-disordered breathing in NREM and REM sleep. Sleep2002;25:307-14.
19. Mendelson WB. The relationship of sleepiness and blood pres-
sure to respiratory variables in obstructive sleep apnea. Chest1995;108:966-72.
20. Chervin RD, Aldrich MS. The relation between multiple sleep la-tency test findings and the frequency of apneic events in REM andnon-REM sleep. Chest. 1998;113:980-4.
21. Sin DD, Mayers I, Man GCW, Pawluk L. Long-term compliancerates to continuous positive airway pressure in obstructive sleep ap-nea. A population-based study. Chest 2002;121:430-5.
22. Parthasarathy S, Habib M, Quan SF. How are automatic positiveairway pressure and related devices prescribed by sleep physicians?A web-based survey. J Clin Sleep Med 2005;1:27-34.
23. Zozula R, Rosen R Compliance with continuous positive airway pressure therapy: assessing and improving treatment outcomesCurr Opin Pulm Med 2001;7:391-8.
24. Berthon-Jones M, Lawrence S, Sullivan CE, Grunstein R. Nasa
continuous positive airway pressure treatment: current realities andfuture. Sleep 1996;19:S131-5.25. Reeves-Hoche MK, Meck R, Zwillich CW. Nasal CPAP: an objec-
tive evaluation of patient compliance. Am J Respir Crit Care Med1994;149:149-54.
26. Kribbs NB, Pack AI, Kline LR, et al. Objective measurement of patterns of nasal CPAP use by patients with obstructive sleep apnea.Am Rev Respir Dis 1993;147:887-95.
27. Bandura A. Self-efficacy: toward a unifying theory of behavioralchange. Psychol Rev 1977;84:191-215.
28. Haynes RB. Introduction. In: Taylor DW, Sackett DL, eds. Com- pliance in heath care. Baltimore: Johns Hopkins University Press;1979:1-7.
29. Hoy CJ, Vennelle M, Kingshott RN, Engleman HM, Douglas NJCan intensive support improve continuous positive airway pres-sure use in patients with the sleep apnea/hypopnea syndrome? Am JRespir Crit Care Med 1999;159:1096-100.
30. Massie CA, Hart RW, Peralez K, Richards GN. Effects of humidi-fication on nasal symptoms and compliance in sleep apnea patientsusing continuous positive airway pressure. Chest 1999;116:403-8.
31. Massie CA, Hart RW. Clinical outcomes related to interface type in patients with obstructive sleep apnea/hypopnea syndrome who areusing continuous positive airway pressure. Chest 2003;123:1112-8
32. Lu B, Budhiraja R, Parthasarathy S. Sedating medications and un-diagnosed obstructive sleep apnea: physician determinants and pa-tient consequences. J Clin Sleep Med 2005;1:367-71.
33. Chervin RD, Moyer CA, Palmisano J, et al. Sleep disordered breathing in Michgan: a practice pattern survey. Sleep Breath2003;7:95-104.
34. Janson C, Noges E, Svedberg-Randt S, Lindberg E. What character-izes patients who are unable to tolerate continuous positive airway
pressure (CPAP) treatment? Respir Med 2000;94:145-9.35. Grunstein RR. Sleep-related breathing disorders. Nasal continuous
positive airway pressure treatment for obstructive sleep apnoeaThorax 1995;50:1106-13.
36. Richards GN, Cistulli PA, Ungar RG, Berthon-Jones M, SullivanCE. Mouth leak with nasal continuous positive airway pressureincreases nasal airway resistance. Am J Respir Crit Care Med1996;154:182-6.
37. Hays RD, Brown JA, Spritzer KL, Dixon WJ, Brook RH. Memberratings of health care provided by 48 physicians. Arch Intern Med1998;158:785-90.
38. Morales LS, Cunningham WE, Brown JA, Liu H, Hays RD. AreLatinos less satisfied with communication by health care providers?
J Gen Intern Med 1999;14:409-17.
139
AASM and OSA Managemen
8/6/2019 Management of Obstructive Sleep Apnea
http://slidepdf.com/reader/full/management-of-obstructive-sleep-apnea 8/10
Journal of Clinical Sleep Medicine, Vol. 2, No. 2, 2006
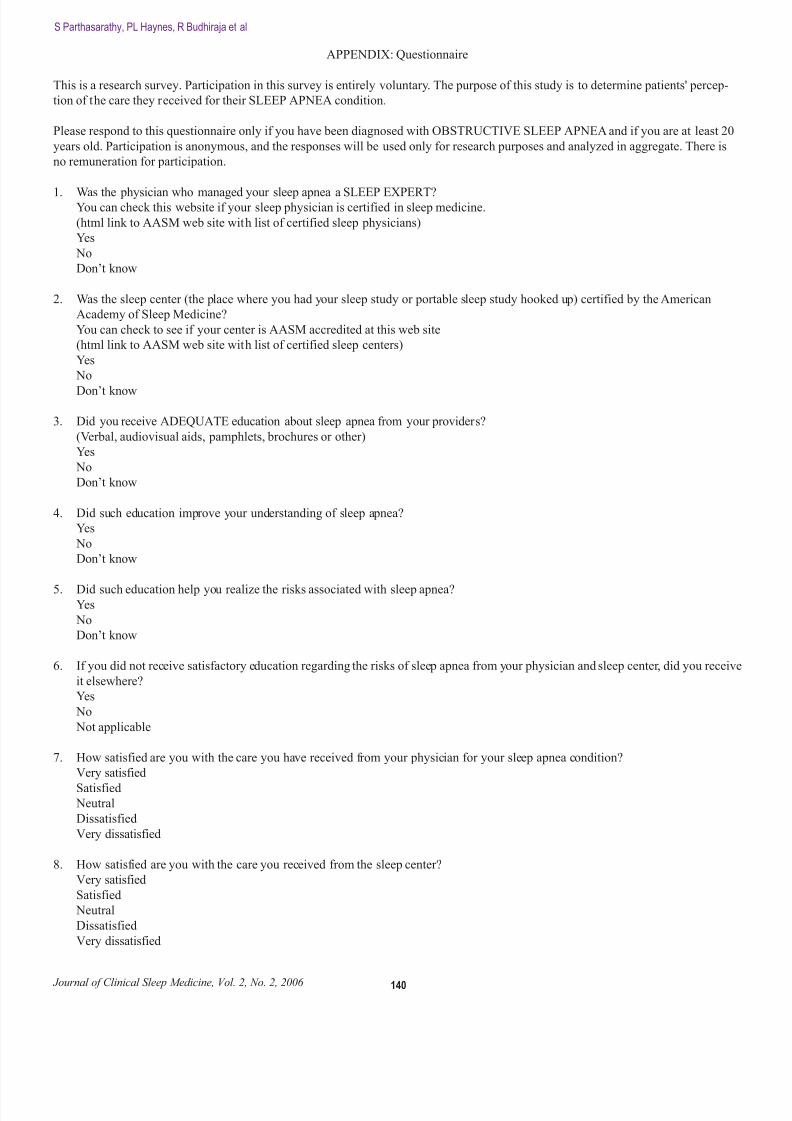
APPENDIX: Questionnaire
This is a research survey. Participation in this survey is entirely voluntary. The purpose of this study is to determine patients' percep-
tion of the care they received for their SLEEP APNEA condition.
Please respond to this questionnaire only if you have been diagnosed with OBSTRUCTIVE SLEEP APNEA and if you are at least 20
years old. Participation is anonymous, and the responses will be used only for research purposes and analyzed in aggregate. There is
no remuneration for participation.
1. Was the physician who managed your sleep apnea a SLEEP EXPERT?You can check this website if your sleep physician is certified in sleep medicine.
(html link to AASM web site with list of certified sleep physicians)
Yes
No
Don’t know
2. Was the sleep center (the place where you had your sleep study or portable sleep study hooked up) certified by the American
Academy of Sleep Medicine?
You can check to see if your center is AASM accredited at this web site
(html link to AASM web site with list of certified sleep centers)
Yes
No
Don’t know
3. Did you receive ADEQUATE education about sleep apnea from your providers?
(Verbal, audiovisual aids, pamphlets, brochures or other)
Yes
No
Don’t know
4. Did such education improve your understanding of sleep apnea?
Yes
No
Don’t know
5. Did such education help you realize the risks associated with sleep apnea?Yes
No
Don’t know
6. If you did not receive satisfactory education regarding the risks of sleep apnea from your physician and sleep center, did you receive
it elsewhere?
Yes
No
Not applicable
7. How satisfied are you with the care you have received from your physician for your sleep apnea condition?
Very satisfied
SatisfiedNeutral
Dissatisfied
Very dissatisfied
8. How satisfied are you with the care you received from the sleep center?
Very satisfied
Satisfied
Neutral
Dissatisfied
Very dissatisfied
140
S Parthasarathy, PL Haynes, R Budhiraja et al
8/6/2019 Management of Obstructive Sleep Apnea
http://slidepdf.com/reader/full/management-of-obstructive-sleep-apnea 9/10
Journal of Clinical Sleep Medicine, Vol. 2, No. 2, 2006
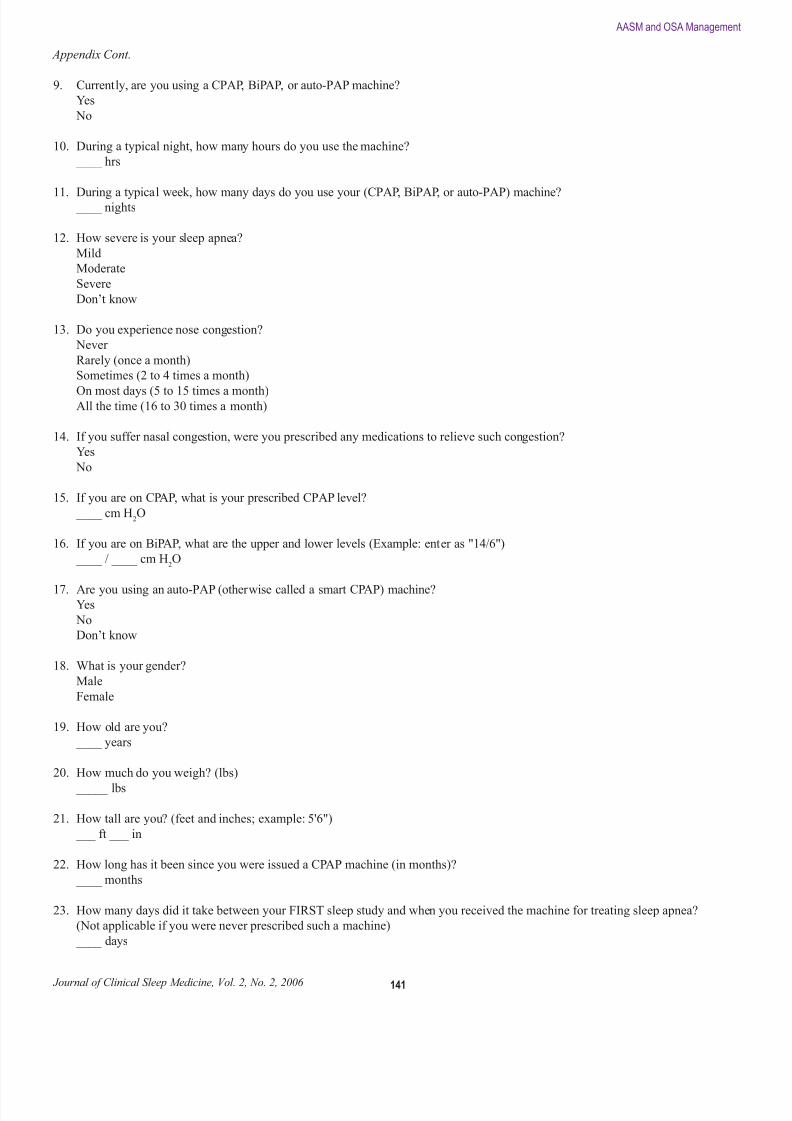
Appendix Cont.
9. Currently, are you using a CPAP, BiPAP, or auto-PAP machine?
Yes
No
10. During a typical night, how many hours do you use the machine?
____ hrs
11. During a typical week, how many days do you use your (CPAP, BiPAP, or auto-PAP) machine?____ nights
12. How severe is your sleep apnea?
Mild
Moderate
Severe
Don’t know
13. Do you experience nose congestion?
Never
Rarely (once a month)
Sometimes (2 to 4 times a month)
On most days (5 to 15 times a month)All the time (16 to 30 times a month)
14. If you suffer nasal congestion, were you prescribed any medications to relieve such congestion?
Yes
No
15. If you are on CPAP, what is your prescribed CPAP level?
____ cm H2O
16. If you are on BiPAP, what are the upper and lower levels (Example: enter as "14/6")
____ / ____ cm H2O
17. Are you using an auto-PAP (otherwise called a smart CPAP) machine?Yes
No
Don’t know
18. What is your gender?
Male
Female
19. How old are you?
____ years
20. How much do you weigh? (lbs)
_____ lbs
21. How tall are you? (feet and inches; example: 5'6")
___ ft ___ in
22. How long has it been since you were issued a CPAP machine (in months)?
____ months
23. How many days did it take between your FIRST sleep study and when you received the machine for treating sleep apnea?
(Not applicable if you were never prescribed such a machine)
____ days
141
AASM and OSA Management
8/6/2019 Management of Obstructive Sleep Apnea
http://slidepdf.com/reader/full/management-of-obstructive-sleep-apnea 10/10
Journal of Clinical Sleep Medicine Vol 2 No 2 2006
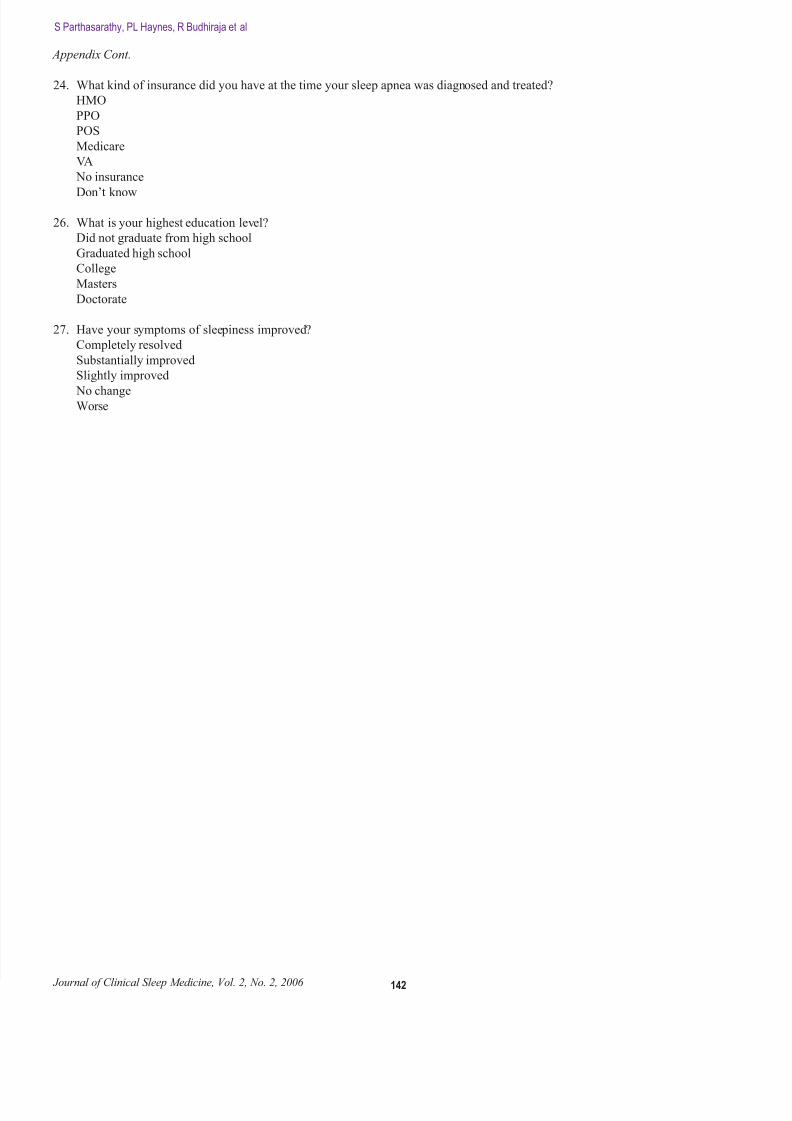
Appendix Cont.
24. What kind of insurance did you have at the time your sleep apnea was diagnosed and treated?
HMO
PPO
POS
Medicare
VA
No insurance
Don’t know
26. What is your highest education level?
Did not graduate from high school
Graduated high school
College
Masters
Doctorate
27. Have your symptoms of sleepiness improved?
Completely resolved
Substantially improved
Slightly improved
No changeWorse
142
S Parthasarathy, PL Haynes, R Budhiraja et al