Embed Size (px)
Citation preview
MANAGEMENT AND BIOLOGY OF BLACK BEARS
IN PENNSYLVANIA
Ten Year Plan (2006-2015)
i
MANAGEMENT AND BIOLOGY OF BLACK BEARS
IN PENNSYLVANIA
Ten Year Plan (2006-2015)
Prepared by Mark A. Ternent Wildlife Biologist
Bureau of Wildlife Management Pennsylvania Game Commission
2001 Elmerton Avenue Harrisburg, PA 17110-9797
July 2006
i
EXECUTIVE SUMMARY
Many Pennsylvanians value the presence of bears even if they seldom see one. Bears are a source of recreation for hunters, wildlife photographers, and people who enjoy watching wildlife. Bears also can be an indicator of ecosystem health, a symbol of wilderness, and have economic impacts. With little doubt, bears are a valuable resource in Pennsylvania that should be managed wisely. At one time, bear populations were precariously low in Pennsylvania. However, their abundance and distribution has increased substantially during recent decades, and bears now occur at record numbers throughout most of the state. Their recovery is a wildlife success story, but as bear numbers increase and more people choose to live in areas occupied by bears, human-bear conflicts also increase. A comprehensive plan for managing our bear resource is needed, particularly one that benefits many different groups of people, addresses the growing number of conflicts, and avoids management mistakes made in the past. A plan for managing Pennsylvania’s bear resource over the next 10 years is presented in this document. The process begins with a mission statement to maintain healthy black bear populations in suitable habitats throughout the Commonwealth that provide hunting and viewing recreation without human-bear conflicts exceeding levels acceptable to citizens of Pennsylvania. Four goals necessary for achieving the mission are defined: (1) Ensure that black bear populations remain healthy and self-sustaining; (2) Minimize loss of forested habitats and improve quality of existing forests for black bears; (3) Maintain human-bear conflicts at acceptable levels; and (4) Provide bear-related recreational opportunities. Necessary steps, referred to as objectives in the plan, for accomplishing each goal are identified. For example, develop population targets for individual Wildlife Management Units; accurately monitor survival, mortality, and population status; monitor and improve bear habitats; improve methods for reducing nuisance bear behavior; provide hunting opportunities; and enhance bear viewing or photography. A list of strategies accompanies each objective. Implementing the strategies will require personnel and budget commitments, yet resources are always limited. To assist with implementation planning, appendices are included that summarize suggested target dates and personnel who may be affected. Additional appendices summarize laws and policies that relate to bears in Pennsylvania, bear hunting regulations in other states, literature published about Pennsylvania bears, input gathered from a stakeholder meeting that was used to develop the goals and objectives, and a summary of public comments received on a previous draft of this document. A comprehensive review of what we know about the biology of bears in Pennsylvania, their history of population decline and recovery, economic impacts, public interest, and current population and habitat conditions is provided. Twenty-one tables and figures are used to present information from 25 years of ongoing bear research and management. Bear management techniques from across North America also are summarized. Each technique is explained, and advantages, disadvantages, or application in Pennsylvania is discussed.
ii

MISSION STATEMENT, GOALS, OBJECTIVES, AND STRATEGIES Mission Statement for Bear Management in Pennsylvania
Maintain healthy black bear populations in suitable habitats throughout the Commonwealth that provide hunting and viewing recreation without human-bear conflicts exceeding levels acceptable to citizens of Pennsylvania.
Four work areas are apparent in this mission statement: adequately manage and monitor bear populations, habitat, conflicts, and recreational opportunity. These work areas were used to develop four primary goals, which are listed below. A course of action that contains objectives (major tasks) and strategies (how to accomplish a task) is outlined under each goal. Input from a group of black bear stakeholders was used in developing the mission statement, goals, and objectives (see Appendix 1). A target date for completing, or starting in cases where work will be repeated annually, is included with each objective and strategy. Target dates and affected personnel groups are summarized in Appendix 2 and 3, respectively, to help with budget and resource planning. GOAL 1. ENSURE THAT BLACK BEAR POPULATIONS REMAIN
HEALTHY AND SELF-SUSTAINING (Population Goal). Objective 1.1 Develop population objectives (e.g., desired population size, density or
trend) for each Wildlife Management Unit by April 1, 2009. Strategies
1.1.1 Survey Pennsylvania residents to determine satisfaction with current bear populations by July 1, 2008; repeat surveys every 5 years.
1.1.2 Annually document the type and number of human-bear conflicts in each
WMU.
Objective 1.2 Maintain a system for monitoring the harvest of bears in each WMU. Strategies
1.2.1 Annually collect harvest data by WMU using mandatory check stations.
Objective 1.3 Implement a system for monitoring the status of bear populations in each WMU by December 31, 2012.
iii
Strategies
1.3.1 Annually estimate population size in each WMU using mark-recapture methods.
1.3.2 Develop a model for predicting population trends and potential impacts of
management proposals by July 1, 2009. 1.3.3 If data are insufficient for developing a reliable model, develop
appropriate research proposals by July 1, 2010. 1.3.4 Develop a surveillance program to detect changes in reproduction,
survival, and animal health/condition by July 1, 2012. GOAL 2. MINIMIZE LOSS OF FORESTED HABITATS AND IMPROVE
QUALITY OF EXISTING FORESTS FOR BLACK BEARS (Habitat Goal).
Objective 2.1 Develop a system for monitoring quality and availability of black bear
habitat in each WMU by December 31, 2011. Strategies
2.1.1 Develop a list of forest characteristics that are important to bears and report measures of these characteristics by WMU every 5 years beginning by July 1, 2011 include in the report status of any potential threats to these characteristics.
2.1.2 Annually measure wildlife food conditions in each WMU. 2.1.3 Implement an annual hard-mast (nut crop) survey, which is currently
being developed by the Northeast Wild Turkey Technical Committee, by July 1, 2008.
Objective 2.2 Implement steps to improve forested habitats for black bears by December
31, 2013. Strategies
2.2.1 Increase participation in forest conservation programs, such as the Forest Stewardship Program, the Forest Wildlife Cooperator Program, and the Conservation Reserve Program (for forested riparian areas) by July 1, 2009.
2.2.2 Annually purchase forestlands in the primary bear range for addition to the
State Game Lands system.
iv
2.2.3 Identify land management practices that improve habitat conditions for black bears (e.g., Best Management Practices) by July 1, 2011.
2.2.4 Incorporate management practices identified in Strategy 2.2.3 into habitat
plans on State Game Lands by July 1, 2012. 2.2.5 Develop education/outreach materials describing land management
practices that are beneficial to bears (e.g., Strategy 2.2.3) and distribute to private forest owners by July 1, 2013.
GOAL 3. MAINTAIN HUMAN-BEAR CONFLICTS AT ACCEPTABLE
LEVELS (Human-Bear Conflict Goal). Objective 3.1 Develop or improve methods for reducing nuisance bear behavior by
December 31, 2012. Strategies
3.1.1 Annually remove any bear from the population that is deemed a chronic nuisance because of repeated conflicts.
3.1.2 Develop and distribute new informational materials about how to avoid
conflicts with bears by July 1, 2008; target audiences and topics that are not part of current outreach efforts.
3.1.3 Evaluate aversive conditioning or other management practices available
for use on individual bears to reduce nuisance behavior and develop Best Management Practice (BMP) recommendations by December 31, 2010.
3.1.4 If the effectiveness of a management practice as it would be applied in
Pennsylvania is unknown, submit appropriate research proposals by July 1, 2012.
Objective 3.2 Use hunting for reducing bear abundance in local areas where human-bear
encounters are above cultural carrying capacity (CCC) and bear abundance is believed to be a contributing factor by December 31, 2008.
Strategies
3.2.1 Develop criteria by December 31, 2007 for selecting and delineating a local management area; criteria should be designed so that added harvest in the area has minimal impact on population objectives in the WMU (e.g., Objective 1.1).
v
3.2.2 By July 1, 2008, implement the use of measurable goals (e.g., bear abundance, harvest rate, number of conflicts, etc.) to help evaluate success of increased harvest in local management areas; annually adjust hunting dates and methods to achieve goals.
GOAL 4. PROVIDE RECREATIONAL OPPORTUNITIES THAT INVOLVE
BLACK BEARS (Recreation Goal). Objective 4.1 Annually allow black bear hunting during a season that is compatible with
all other objectives in this plan. Strategies
4.1.1 Establish harvest goals for each WMU by July 1, 2009; harvest goals should be derived by comparing population status (Objective 1.3) with the desired population level (Objective 1.1).
4.1.2 Annually have a general hunting season for bear during November that is
not concurrent with any other big game seasons. 4.1.3 Identify by July 1, 2010, WMUs where harvest is not meeting goals
established in Strategy 4.1.1 and identify hunting opportunities beyond those established by Strategy 4.1.2 that could be added in these WMUs.
4.1.4 Calculate by July 1, 2011, the recreational benefit (e.g., participation,
approval rating, etc.) for new hunting opportunities identified in Strategy 4.1.3 and incorporate those with the greatest benefit into annual season and bag limit recommendations.
Objective 4.2 Increase awareness and promotion of other recreational opportunities
besides hunting by December 31, 2010. Strategies
4.2.1 Incorporate information about viewing and photographing free-ranging bears into new or existing education/outreach materials (e.g., brochures, videos, slide programs, web page, news releases) by July 1, 2010.
vi
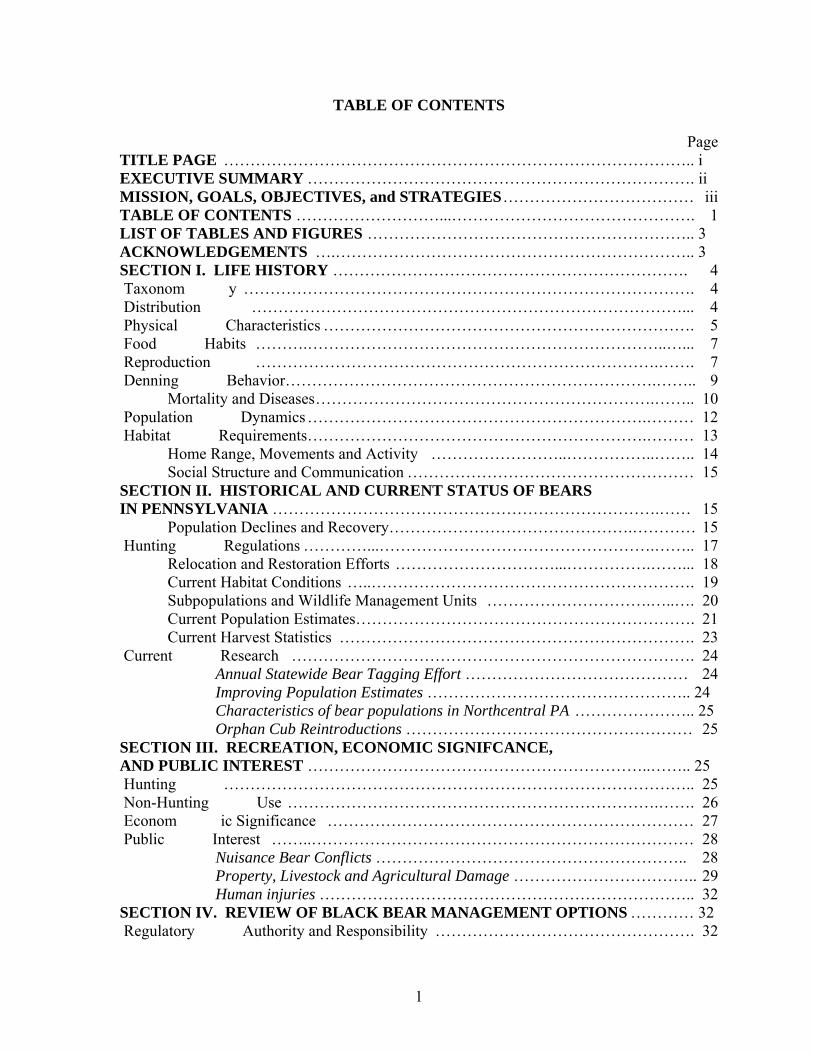
TABLE OF CONTENTS Page TITLE PAGE …………………………………………………………………………….. i EXECUTIVE SUMMARY ………………………………………………………………. ii MISSION, GOALS, OBJECTIVES, and STRATEGIES ……………………………… iii TABLE OF CONTENTS ………………………...………………………………………. 1 LIST OF TABLES AND FIGURES …………………………………………………….. 3 ACKNOWLEDGEMENTS ….………………………………………………………….. 3 SECTION I. LIFE HISTORY …………………………………………………………. 4 Taxonom y …………………………………………………………………………. 4 Distribution ………………………………………………………………………... 4 Physical Characteristics ……………………………………………………………. 5 Food Habits ……….…………………………………………………………..…... 7 Reproduction ………………………………………………………………….……. 7 Denning Behavior…………………………………………………………….…….. 9 Mortality and Diseases ……………………………………………………….…….. 10 Population Dynamics ……………………………………………………….……… 12 Habitat Requirements……………………………………………………….……… 13 Home Range, Movements and Activity ……………………..……………..…….. 14 Social Structure and Communication ……………………………………………… 15 SECTION II. HISTORICAL AND CURRENT STATUS OF BEARS IN PENNSYLVANIA ……………………………………………………………….…… 15 Population Declines and Recovery……………………………………….………… 15 Hunting Regulations …………...…………………………………………….…….. 17 Relocation and Restoration Efforts …………………………...…………….……... 18 Current Habitat Conditions …..……………………………………………………. 19 Subpopulations and Wildlife Management Units ………………………….…..…. 20 Current Population Estimates………………………………………………………. 21 Current Harvest Statistics …………………………………………………………. 23 Current Research …………………………………………………………………. 24 Annual Statewide Bear Tagging Effort …………………………………… 24 Improving Population Estimates ………………………………………….. 24 Characteristics of bear populations in Northcentral PA ………………….. 25 Orphan Cub Reintroductions ……………………………………………… 25 SECTION III. RECREATION, ECONOMIC SIGNIFCANCE, AND PUBLIC INTEREST ………………………………………………………..…….. 25 Hunting …………………………………………………………………………….. 25 Non-Hunting Use …………………………………………………………….……. 26 Econom ic Significance …………………………………………………………… 27 Public Interest ……..……………………………………………………………… 28 Nuisance Bear Conflicts ………………………………………………….. 28 Property, Livestock and Agricultural Damage …………………………….. 29 Human injuries …………………………………………………………….. 32 SECTION IV. REVIEW OF BLACK BEAR MANAGEMENT OPTIONS ………… 32 Regulatory Authority and Responsibility …………………………………………. 32
1
Options That Are Used To Manage Bear Populations …………………………….. 32 Hunting…..…………………………………………………………………. 32 Hound Hunting …….………………………………………………. 33 Baiting …………………………………………………………….. 35 Archery Hunting ………………………………………………….. 36 Trapping …………………………………………………………… 37 Reservoir Areas …………………………………………………………... 38 Immunocontraception ……………………………………………………... 38 Habitat Manipulations …………………………………………………….. 39 Orphan Cub Rehabilitation and Adoptions ………………………………... 40 Options That Are Used To Manage Nuisance Bears……………………………….. 41 Information and Education ………………………………..……………… 41 Food and Waste Management …………………………..………………... 41 Aversive Conditioning …………………………………………………….. 42 Repellents ………………………………………………………………….. 43 Electric Fencing ……………………………..……………………………. 44 Translocations ……………………………………………………………... 44 Euthanasia …..…………………..………………………………………… 46 Reimbursements …………………………………………………………… 47 Supplemental Feeding …………………………………………………….. 48 SECTION V. LITERATURE CITED..…………………………………………………. 49 APPENDIX 1. How the mission, goals, and objectives were developed …………….….. 54 Invited stakeholders ……………………………………………………………….. 54 Shaping the vision: characteristics of a successful plan ……………………….….. 55 Identifying goals ……………………………………………………….……….….. 55 Identifying values …………………………………………………..………….….. 56 APPENDIX 2. Target dates for completing objectives and strategies ………..…………. 57 APPENDIX 3. Personnel that may be required to help implement strategies ………..….. 59 APPENDIX 4. Black bear literature pertaining to Pennsylvania not cited in report …..… 60 APPENDIX 5. Highlights of black bear regulations in the PA Game Code. …………….. 62 Buying and selling of bear parts …………………………………………………… 62 Killing bears in self-defense ………………………………………………………. 62 Killing bears to protect property …………………………………………………… 62 Da mage compensation payments ………………………………………………….. 63 Electric fence assistance program …………………………………………………. 63 Prohibiting the feeding of bears …………………………………………………… 63 Hunting restrictions ………………………………………………………………… 64 Possession of vehicle-killed bears …………………………………………………. 64 APPENDIX 6. Pennsylvania Nuisance Black Bear Policy ……………….………………. 65 Bears in boroughs, towns, and cities ………………………………………………. 65 Bears exhibiting aggressive behavior ……………………………………………… 66 Bears causing property damage …………………………………………………… 66 Injured or orphaned bears …………………………………………………………. 66 APPENDIX 7. Summary of black bear hunting regulations in the U.S. ……….….…….. 68 APPENDIX 8. Game Commission administrative boundaries …...……………………… 70 APPENDIX 9. Summary of public comments……………………………………………. 71
2
LIST OF FIGURES AND TABLES Page Figure 1. Current distribution of the American black bear in the eastern U.S. ……… 5 Figure 2. Primary bear range in Pennsylvania. ………………………………….…… 5 Figure 3. Average live weight of black bears in Pennsylvania by sex and age. ……... 6 Figure 4. Litter size for black bears in Pennsylvania. ………………………..……… 8 Figure 5. Age when female black bears produce their first surviving litter. ……….... 9 Figure 6. Number of bears killed annually in Pennsylvania by vehicles. ……………. 12 Figure 7. Number of black bears harvested annually. ………………………….……. 16 Figure 8. Types and distribution of forests in Pennsylvania. ………………….…….. 19 Figure 9. Wildlife Management Unit (WMU) boundaries ………………..…………. 20 Figure 10. Characteristics of black bear subpopulations in Pennsylvania. ………….… 22 Figure 11. Estimates of bear population size in Pennsylvania. ………………….……. 23 Figure 12. Seasonal trends for human-bear conflicts during 2003–05 ……….……….. 28 Figure 13. Distribution of human-bear conflicts reported during 2003–05……………. 29 Figure 14. Size of archery bear harvests in NY, VA, and WV ……………….…….…. 36 Figure 15. Number of captures that ended in relocation of a bear. ……………….…… 45 Table 1. Pennsylvania forestland trends during select years. ……………………… 16 Table 2. Statewide black bear harvest statistics. ……………………………….…… 26 Table 3. Number and costs of annual beehive damage claims ……………………… 30 Table 4. Number and costs of annual livestock damage claims ………………….… 31 Table 5. Number and costs of electric fences provided to beehive owners. ………… 44 Table 6. Number and costs of bear damage claims approved for payment. ………… 47
ACKNOWLEDGEMENTS
Many people including employees of the Pennsylvania Game Commission, Cooperative Wildlife Research Unit staff at Pennsylvania State University, graduate students and volunteers helped to collect the data discussed in this document. All data contained herein are subject to revision from corrections, improved analyses, and/or regrouping of data. Cover drawing by Doug Pifer.
© 2006 Pennsylvania Game Commission
3
SECTION I. LIFE HISTORY Life history traits of black bears in Pennsylvania are well documented. There are more than 100 articles published in popular magazines, scientific journals, books, conference proceedings, and agency reports that focus on some aspect of Pennsylvania black bears. Data are available on more than 65,000 individual bears handled since the mid 1970s, 9,600 of which were marked with ear tags. Few jurisdictions have such a wealth of information. The life history of Pennsylvania black bears is summarized below. A review of life history is important because not all populations of black bears have identical biological characteristics, and some characteristics are notably different in Pennsylvania. Understanding the biology of Pennsylvania’s black bear allows management strategies to be developed that are specific to our state. Taxonomy Bears are large-bodied members of the mammalian order Carnivora, family Ursidae that evolved from small tree-climbing ancestors (Miacids) almost 25 million years ago (Herrero 1999). There are eight species of bears worldwide occupying all continents, except Australia, Antarctica, and Africa. Six species that are of relatively recent evolutionary origin belong to the genus Ursus. The other two species, the spectacled bear and giant panda, belong to different genera and are from much older lineages. Three species of bear occur in North America: the polar bear (Ursus maritimus), the brown or grizzly bear (Ursus arctos), and the American black bear (Ursus americanus). The American black bear is the only species living in Pennsylvania and the eastern United States (Pelton 1982, Servheen 1990). As many as 16 subspecies of the American black bear have been described based on differences in size, distribution and color (Hall 1981). The subspecies typically reported for Pennsylvania is Ursus americanus americanus (Whitaker and Hamilton 1998). Distribution The American black bear once occupied all forested regions in North America (Hall 1981, Pelton and Van Manen 1997), but habitat loss, overharvest, and predator control campaigns led to their disappearance from some areas. Today black bears occur across most of Canada, in at least 35 U.S. states, and in northern Mexico (Servheen 1990, Pelton et al. 1999). In the eastern United States, black bears primarily live in a continuous band extending along the Appalachian Mountains from Maine to Georgia. Isolated populations also occur in some areas of Tennessee, Georgia, Florida, Mississippi, Alabama, and Louisiana (Fig. 1). Bears in Pennsylvania are contiguous with populations in New York, New Jersey, West Virginia, and Maryland. Sightings are possible in all 67 counties, however, the primary range is limited to about three-quarters of the state. Areas currently outside the primary range include the southwest counties of Greene, Washington, Beaver and western Allegheny,
4

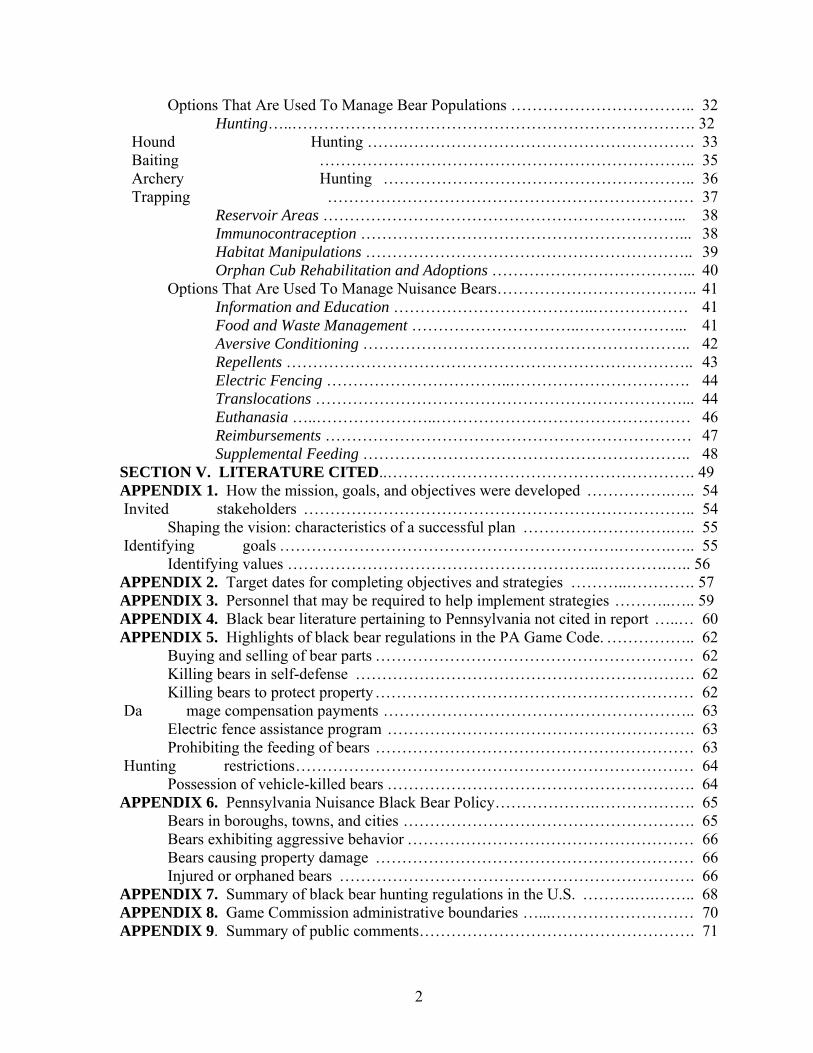
and the southeast corner of the state from Adams County east, south of the Blue Mountains (Fig. 2). These areas lack large forested habitats and, instead, contain significant agricultural or urban development. Physical Characteristics
Figure 1. Current distribution of the American black bear in the eastern United States (modified after Whitaker and Hamilton 1998).
At birth, black bears in Pennsylvania weigh 10 to 16 ounces. They are 8 to 11 inches long and covered with fine (about one-tenth inch long) hair. Tears are poorly developed buds less than one-half inch in length, and their eyes are closed for the first six weeks(Alt 1987). Newborn cubs are capable of crawling short distances and tendbe attracted toward warm objects, which may help them nurse in the den.
heir
to
rowth is rapid during the first year.
0s
y age two, males in Pennsylvania 0
t
ack
r th
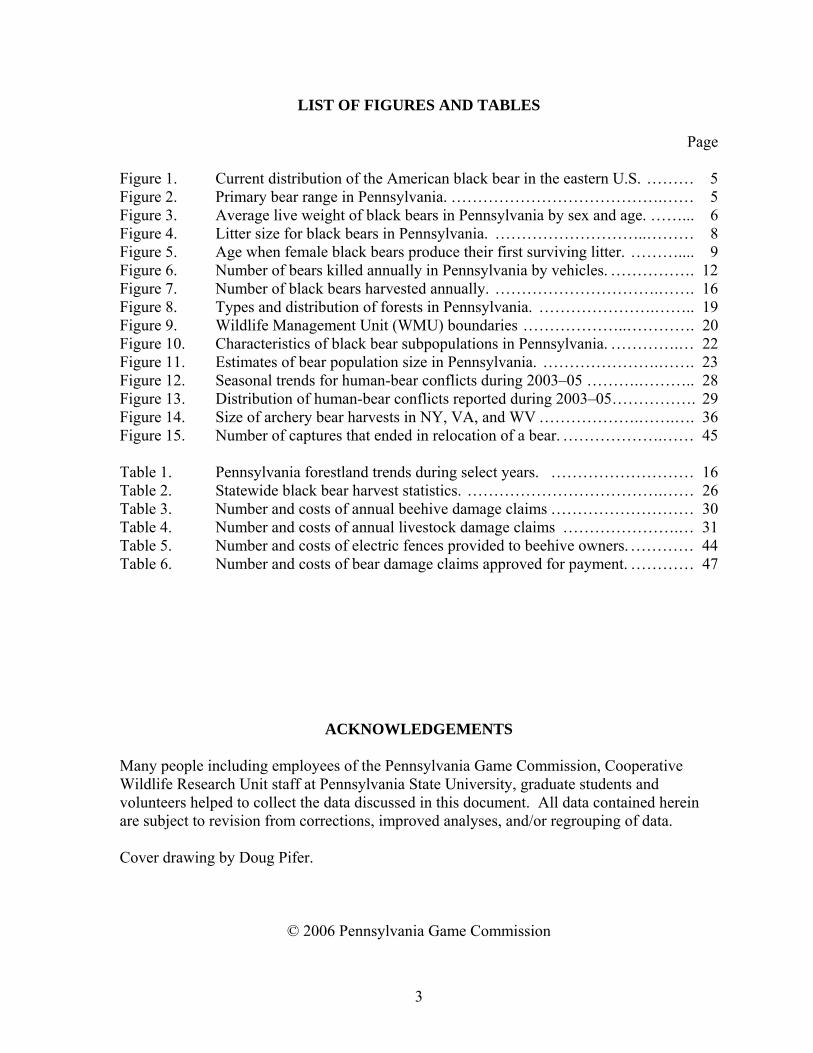
GAt two months, cubs typically weigh five pounds. By mid November (11 months old), they average 80 pounds and may be as large as 140 pounds (Alt 1980a, unpublished PGC data).Interestingly, cubs of this age once averaged 20 to 30 pounds less in Pennsylvania during the early 190(Gerstell 1939). Baverage 240 pounds and females, 18pounds. Full growth is usually reached by age five for females, or nine for males, and average adult weights stabilize near 250 and 500pounds, respectively (Fig. 3). Adult males are 70 to 74 incheslong and at least 30 inches high athe shoulder. Adult females are 59to 62 inches long and rarely more than 30 inches at the shoulder (Eveland 1973, Alt 1980b). Blbears in parts of Pennsylvania appear to grow faster and largethan almost anywhere else in NorAmerica (Alt 1980b).
Figure 2. Primary bear range in Pennsylvania by County based on occurrence of forest habitats and frequency of bear sightings.
5
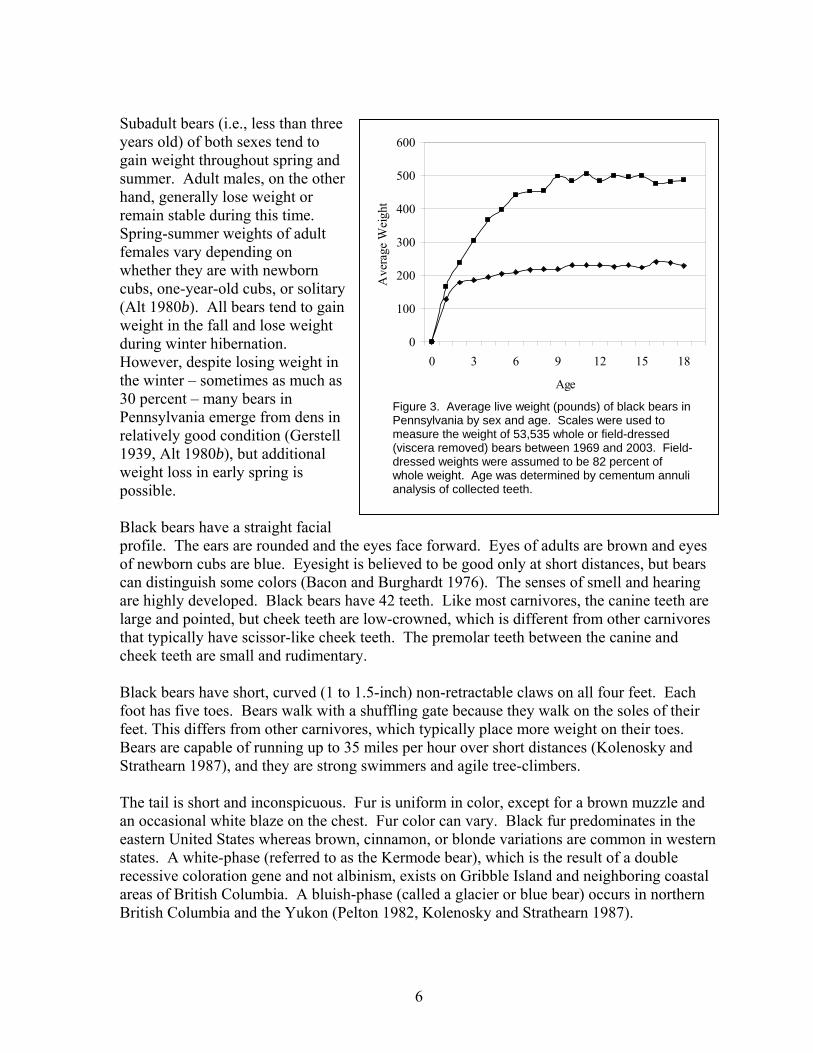
Subadult bears (i.e., less than three
d
rn ary
ight in
ens in
lack bears have a straight facial the eyes face forward. Eyes of adults are brown and eyes
lack bears have short, curved (1 to 1.5-inch) non-retractable claws on all four feet. Each
he tail is short and inconspicuous. Fur is uniform in color, except for a brown muzzle and
rn
stal
0
100
200
300
400
500
600
0 3 6 9 12 15 18
AgeA
vera
ge W
eigh
t
Figure 3. Average live weight (pounds) of black bears in Pennsylvania by sex and age. Scales were used to measure the weight of 53,535 whole or field-dressed (viscera removed) bears between 1969 and 2003. Field-dressed weights were assumed to be 82 percent of whole weight. Age was determined by cementum annuli analysis of collected teeth.
years old) of both sexes tend to gain weight throughout spring ansummer. Adult males, on the other hand, generally lose weight or remain stable during this time. Spring-summer weights of adultfemales vary depending on whether they are with newbocubs, one-year-old cubs, or solit(Alt 1980b). All bears tend to gain weight in the fall and lose weight during winter hibernation. However, despite losing wethe winter – sometimes as much as 30 percent – many bears in Pennsylvania emerge from drelatively good condition (Gerstell 1939, Alt 1980b), but additional weight loss in early spring is possible. Bprofile. The ears are rounded and of newborn cubs are blue. Eyesight is believed to be good only at short distances, but bears can distinguish some colors (Bacon and Burghardt 1976). The senses of smell and hearing are highly developed. Black bears have 42 teeth. Like most carnivores, the canine teeth arelarge and pointed, but cheek teeth are low-crowned, which is different from other carnivores that typically have scissor-like cheek teeth. The premolar teeth between the canine and cheek teeth are small and rudimentary. Bfoot has five toes. Bears walk with a shuffling gate because they walk on the soles of their feet. This differs from other carnivores, which typically place more weight on their toes. Bears are capable of running up to 35 miles per hour over short distances (Kolenosky and Strathearn 1987), and they are strong swimmers and agile tree-climbers. Tan occasional white blaze on the chest. Fur color can vary. Black fur predominates in the eastern United States whereas brown, cinnamon, or blonde variations are common in westestates. A white-phase (referred to as the Kermode bear), which is the result of a double recessive coloration gene and not albinism, exists on Gribble Island and neighboring coaareas of British Columbia. A bluish-phase (called a glacier or blue bear) occurs in northern British Columbia and the Yukon (Pelton 1982, Kolenosky and Strathearn 1987).
6
In Pennsylvania most bears have black fur with less than one percent being brown. Sightings
21).
ood Habits
of brown-phase bears tend to be concentrated in northcentral counties (True 1882, Alt 1981a). Historical accounts of white (likely albino) and red-tinted black bears in Pennsylvania also exist (Blackman 1873, Rhoads 1903, Shoemaker and French 19 F
lack bears are opportunistic omnivores that tend to capitalize on whatever food is easiest to
mericana)
ruits and berries become increasingly important during summer and fall. Examples in y
s
ers related
corns (Quercus spp.), beechnuts (Fagus grandifolia), apples (Malus spp.), and occasionally
s, and
eproduction
Bobtain. They have a varied diet including both plant and animal matter, but greater than 75 percent of the diet is typically vegetation. In early spring, bears feed on succulent new plantgrowth near wetlands, riparian habitats, and wet forest openings. Skunk cabbage (Symplocarpus foetidus), sedges (Carex spp.), grass, and squawroot (Conopholis aare important foods. Tree buds, catkins, and new leaves also are eaten, along with any acorns remaining from the previous year. Colonial insects (mostly ants and bees) are added to the diet as spring progresses. FPennsylvania include blueberry (Vaccinium spp.), elderberry (Sambucus spp.), blackberr(Rubus spp.), juneberry (Amelanchier spp.), pokeberry (Phytolacca spp.), wild grapes (Vitispp.), and fruits from chokecherry (Prunus virginiana), dogwood (Cornus spp.), hawthorn (Crataegus spp.), cucumber magnolia (Magnolia acuminata), and black cherry (Prunus serotina) trees (Bennett et al. 1943, Arner 1948). Bears also prey on mice, squirrels, groundhogs, beaver, and newborn white-tailed deer. In a recent study in central Pennsylvania, bears killed 16 of 218 fawns (7 percent) fitted with radio-transmitt(Vreeland 2002). Agricultural crops (mostly corn), bee hives and honey, and human-foods (e.g., birdfeed, garbage, pet foods) are eaten, especially if they are readily available or when natural food supplies are poor. Ahazelnuts (Corylus spp.) or fruit from black gum trees (Nyssa sylvatica) are typical fall foods for bears in Pennsylvania (Bennett et al. 1943, Arner 1948). Because black bears need to accumulate large fat reserves prior to hibernating, these foods, particularly acorns and beechnuts, are critical. When fall nut crops are poor, bears tend to den early, weigh lesproduce fewer and smaller cubs. Availability of fall foods also influences the number of bears struck by automobiles, nuisance activity, and hunter success rates. R
lack bears breed during summer. Females may be in estrus as early as May 18 or as late as
tive
BSeptember 12, but the peak breeding period for females in Pennsylvania is June 15 to July 15 (Alt 1982, Alt 1989). Black bears are promiscuous. Males mate with multiple females during the course of a single breeding season, and although a male may stay with a recepfemale for two or three days, some females mate with more than one male. Adult males will fight one another for the opportunity to breed.
7
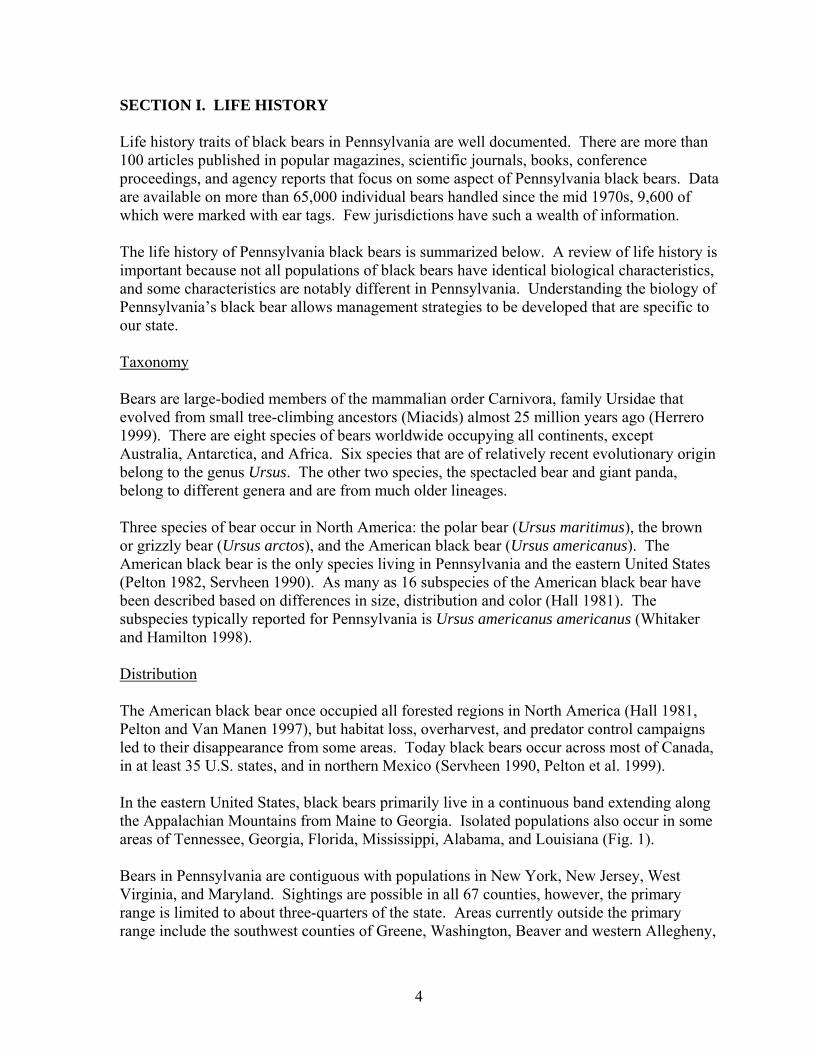
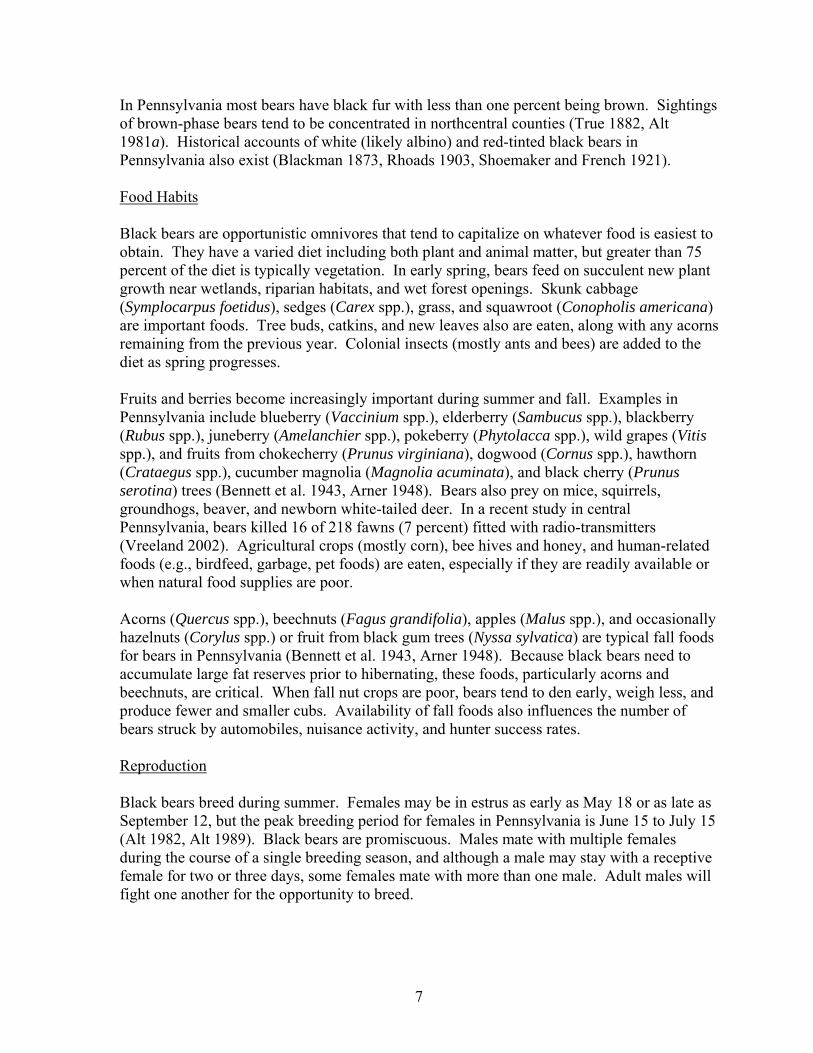
Female black bears exhibit delayed implantation (Wimsatt 1963). Eggs are fertilized immediately, but development is suspended shortly afterward at the 16-cell stage (blastocyst). Dormant blastocysts float freely in the uterus for several months before implanting and resuming embryo development. In Pennsylvania, implantation occurs between mid-November and early December (Kordek and Lindzey 1980). Delayed implantation is beneficial because it postpones investment of nutritional resources until after the critical fall foraging period. If fat reserves are poor because of an unexpected food shortage, pregnancy (dormant blastocysts) can be aborted without a large loss in nutritional investment, freeing the female to breed again next summer. If reproductive failure is widespread, cub production in the population becomes synchronized where all females including those that aborted pregnancies and those that did not breed (i.e., were with offspring) breed the following year. This leads to a cycle of high cub production one year followed by low cub production the next year. However, reproductive failure is uncommon in Pennsylvania and typically occurs in less than 9 percent of the breeding female population (Alt 1982), therefore, breeding synchronies are rare. Cubs in Pennsylvania are born during the first three weeks of January while females are in dens (Matson 1954, Alt 1983a, Alt 1989). Birth dates are not widespread despite a relatively long breeding season, which is probably caused by the synchronization of implantations. Cubs weigh 10 to 16 ounces at birth but develop quickly. Bear milk can have a fat content that approaches 30 percent and may be the highest of any land mammal (Hock and Larson 1966, Jenness et al. 1972). Bear milk also is high in calcium and iron, even though females have no dietary intake during hibernation. Serum blood analyses from hibernating bears have suggested that the source may be bone decomposition (Matula et al. 1980). The average size of litters in Pennsylvania is 2.7 cubs, but they range between 1 and 5 (PGC unpublished dFig. 4). In northeast Pennsylvania, the average litter size is reported as 3.0 cubs, with litters of 2 being about as common as litters of 4 (Alt 1981b, Alt 1982, Alt 1989).
0
10
20
30
40
50
1 2 3 4 5
Litter Size
Perc
ent o
f Obs
erve
d L
itter
s
Figure 4. Prevalence of different-sized litters for black bears in Pennsylvania. Average litter size was 2.7 cubs. Values are based on 642 litters observed during capture or winter den visits of 473 bears between 1975 and 2003.
ata;
Older females produce larger litters. In a study of litter size in northeast Pennsylvania, average age of bears that produced litters of 1 was 4 years; litters of 2, 5.5 years; litters of 3, 6.2 years; litters of 4, 7.8 years, and litters of 5, 9.5 years (Alt 1982). Sex ratios within litters are typically equal, but the incidence of males may increase slightly in larger litters (Alt 1981b, Alt 1982). Cubs stay with their mother for 17
8
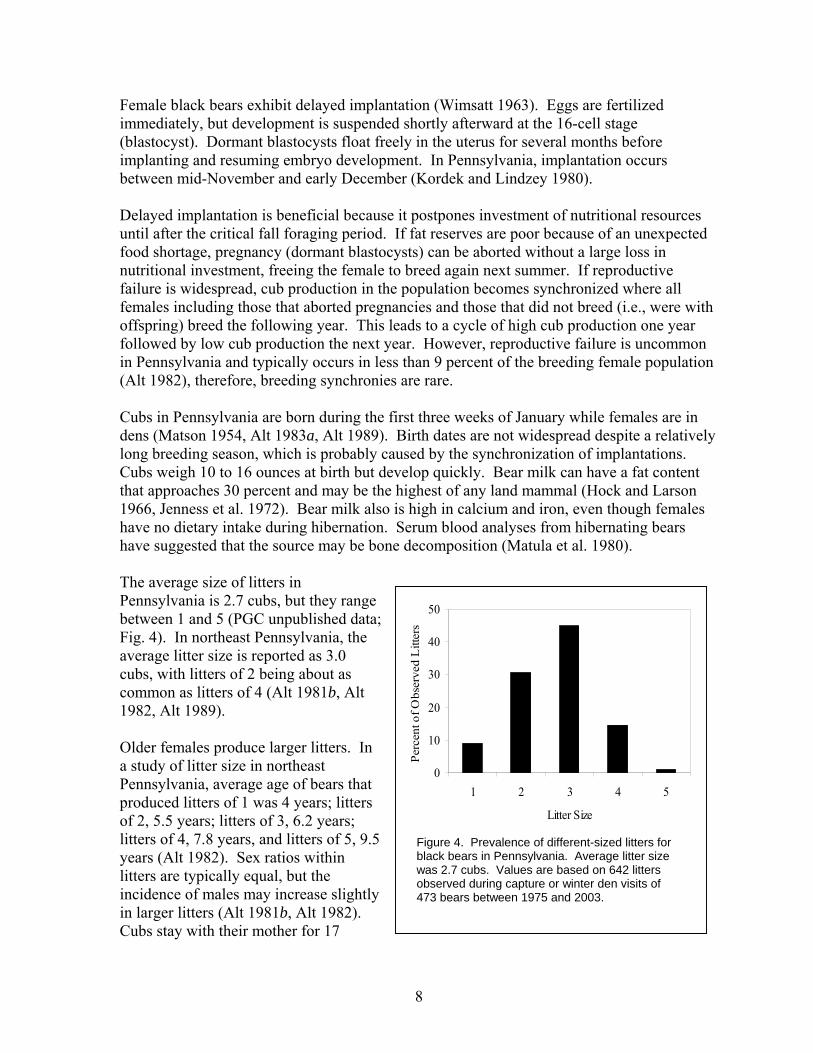
months, denning together the winter after birth and separating in late May the following spring. Adult females do not breed while with offspring; thus, breeding typically occurs every other year. In any given year, 47 to 49 percent of adult female bears in Pennsylvania are with cubs (Kordek and Lindzey 1980, Alt 1982). Pennsylvania bears begin to produce cubs at an earlier age than almost anywhere else in North America (see Coy 1999 for a summary). Females typically give birth to their first litter at age 3 or 4, although bears as young as 2 have produced cubs (i.e., bred as a yearling the same summer they separated from their mother; Alt 1989; Fig. 5). Virtually all females are breeding by age three (Kordek and Lindzey 1980). Males are capable of breeding as yearlings, but they typically do not reach sexual maturity until several years later.
0
20
40
60
80
100
2 3 4 5
Age
Perc
ent o
f Obs
erve
d Fe
mal
es
Figure 5. Age when female black bears produced their first surviving litter. Values are based on observations of 34 bears in winter dens during 1974–1989 in northeast Pennsylvania (Alt 1989).
Denning Behavior Black bears hibernate during winter months as a way to avoid food shortages. Their body temperature decreases from a normal range of 37–38° C to 31–36° C, which is different from almost all other hibernators with body temperatures that drop to near ambient conditions (Folk et al. 1972, Folk et al. 1976). Heart rate decreases from 40 beats per minute to 8–10 beats per minute, and metabolism may drop 40 percent. Although bears appear lethargic during hibernation, they are easily aroused and capable of fleeing. Bears do not eat, drink, defecate, or urinate while hibernating. Basic protein and water needs are partially met by (metabolically) recycling urea, and other adaptations hamper the loss of muscle tone and bone density. The start of hibernation can vary from year to year depending on food availability, beginning later in years when food is plentiful and earlier in years when food is scarce. However, regardless of food conditions, pregnant females typically den first, followed by females with cubs from the previous winter and juveniles of both sexes. Adult males are the last group to den, sometimes remaining active into January. Pregnant females may begin denning in early November prior to Pennsylvania’s bear-hunting season, which affords them added protection that males typically do not receive (Matson 1954, Alt 1980c). Den emergence occurs in reverse order of den entrance. Adult males begin to leave dens in late February–early March, whereas females with newborn cubs wait until April. Black bears den in a variety of places. They utilize cavities in rocks, root masses and standing trees, crawl under fallen trees and brushpiles, excavate dens, and build ground nests. Dens have been discovered in road culverts (Alt 1983b), under porches, and under houses.
9
Den selection may vary from one year to the next, as does den location. Dens are seldom reused. In northeast Pennsylvania, only 4.8 percent of dens monitored over a 10-year period were used more than once, and they tended to be permanent dens such as rock cavities that were reused by closely related females (Alt and Gruttadauria 1984). Most dens, regardless of type, are lined with dry leaves, grass, broken twigs, or some other material collected by the bear. Pregnant females tend to select sheltered dens more so than other bears. Seventy-nine percent of pregnant female dens studied in northeast Pennsylvania were rock cavities, brushpiles, or excavations (Alt 1984a). Conversely, ground nests and open brush piles are more typical of males, though some females do use them. Although protective during the winter, sheltered dens can be susceptible to spring flooding. Between 1973 and 1983, 19 percent of dens with cubs studied in northeast Pennsylvania flooded and at least 15 cubs were known to have died (Alt 1984a). Mortality and Disease Bears are long-lived animals. Individuals in their mid teens are part of the harvest each year. The oldest bear confirmed in Pennsylvania was 30 and died of natural causes in Pike County during the summer of 2001 (Rose 2001). A few bears, which were believed to be one or two years older, also have been reported, but accuracy of the age was unknown. Age is determined by counting the number of concentric rings visible in a cross section of a tooth, analogous to the rings in wood that are used to determine age of trees. A microscope and staining process are required, but the resulting age determination can be very accurate (Harshyne et al. 1998). Cub survival during the first year of life is estimated to be 80 percent. Cub mortality occurs more frequently in first-time litters than subsequent litters. Alt (1982) reported that 28 percent of litters in northeast Pennsylvania experience some level of mortality, and 9 percent lose their litter entirely. However, if a litter is lost early enough, the female can rebreed and produce a new litter that winter (Alt 1981b, Alt 1982). Yearling (1½ year-old bears) mortality is not well documented, but it is probably greater than any other group because of aggression from older male bears, nutritional stress, a propensity to be involved with human-bear conflicts, and inexperience at avoiding vehicles or hunters. Alt (1980c) reported that yearlings in northeast Pennsylvania experienced more hunting mortality than any other group, averaging 36 percent. Annual mortality for two-year-old and older bears in Pennsylvania is reported to be 41 percent (females) to 48 percent (males; Diefenbach and Alt 1998). Disease, predation, and starvation probably have little impact on adult survival. Bears have no natural predators; adult males may kill cubs to promote breeding opportunities or attack dispersing subadults to defend a home range, but neither is well documented (Garshelis 1994). Starvation is uncommon because people rarely report seeing emaciated bears in Pennsylvania, and none of the diseases or parasites that inflict bears are considered high mortality risks (Quinn 1981).
10
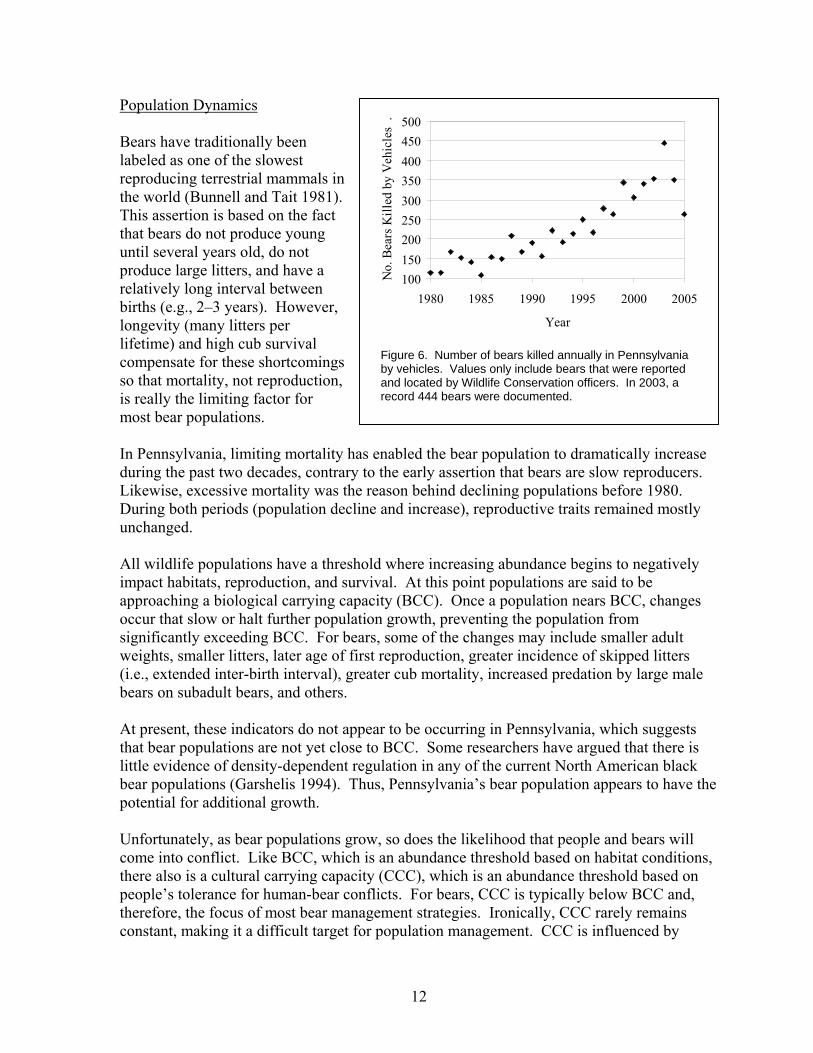
Intestinal roundworms (i.e., Baylisascaris transfuga) and tapeworms (Taenia pisiformis and T. saginata) are common in bears, but they rarely occur in numbers sufficient to interfere with digestion or nutrition (Quinn 1981), although hunters may be surprised to find them during field-dressing of animals. Likewise, tissue parasites such as Toxoplasma gondii (Briscoe et al. 1993, Dubey et al. 1995) and Trichinella spiralis (Schad et al. 1986), which may have human health implications, occur in bears but are not thought to cause mortality. Mange, which is caused by mite infestations on the surface of the skin, is detectable in about 1.6 percent of harvested bears based on samples collected during the 1996 hunting season (PGC unpublished data). Mange can lead to severe hair loss, itching, lesions, and scabs on the surface of the skin, but the incidence of mortality is unknown. Severely emaciated bears with mange have been documented, so some mortality is likely. But a lack of social contact between animals hampers widespread outbreaks and not all infestations are debilitating. Most black bear mortality in Pennsylvania is caused by human activities. Hunting is the largest factor. Among bears two years old and older, hunting accounts for 48 percent (males) to 37 percent (females) of all deaths. About 23 percent of the male population and 16 percent of the female population is removed annually by hunting (Diefenbach and Alt 1998), yet hunting has not limited population growth. Other forms of mortality that are caused by people include vehicle collisions, being shot for crop damage, poaching, and removal of chronic nuisances. Vulnerability to hunting varies depending on sex and age. Young bears (2 to 3 years old) tend to have almost twice the vulnerability of older bears. Young females are more vulnerable than young males, but female vulnerability decreases with age and becomes much less than males as adults. Male vulnerability, on the other hand, decreases very little over time (Alt 1980c). Vulnerability is measured by the percent of tagged bears that show up in the harvest. Vehicle collisions are the second greatest human-caused mortality factor. They account for 10 percent of all documented deaths and may kill between 2 and 4 percent of the population annually (PGC unpublished data). Wildlife conservation officers annual inspect 300 to 350 dead bears along roadways and the number is increasing (Fig. 6). Vehicle mortality rates are likely to increase as bears expand more into heavily populated areas, traffic volumes increase, rural roads improve to accommodate faster speeds, and new roads appear. An average of 59 bears are reported dead annually from all other human-related causes. Most (37 percent) are bears shot illegally during a big game hunting season. Cases of poaching outside of a hunting season are uncommon (typically less than 5 per year), which suggests that the activity is not a significant problem in Pennsylvania, but the full extent is not well known. Examples of illegal trafficking in gall bladders, paws, and other bear parts have been documented in Pennsylvania, and poaching is known to be prevalent in other North American and Asian bear populations (Williamson 2002).
11
Population Dynamics
Figure 6. Number of bears killed annually in Pennsylvania by vehicles. Values only include bears that were reported and located by Wildlife Conservation officers. In 2003, a record 444 bears were documented.
100150200250300350400450500
1980 1985 1990 1995 2000 2005
Year
No.
Bea
rs K
illed
by
Veh
icle
s .
Bears have traditionally been labeled as one of the slowest reproducing terrestrial mammals in the world (Bunnell and Tait 1981). This assertion is based on the fact that bears do not produce young until several years old, do not produce large litters, and have a relatively long interval between births (e.g., 2–3 years). However, longevity (many litters per lifetime) and high cub survival compensate for these shortcomings so that mortality, not reproduction, is really the limiting factor for most bear populations. In Pennsylvania, limiting mortality has enabled the bear population to dramatically increase during the past two decades, contrary to the early assertion that bears are slow reproducers. Likewise, excessive mortality was the reason behind declining populations before 1980. During both periods (population decline and increase), reproductive traits remained mostly unchanged. All wildlife populations have a threshold where increasing abundance begins to negatively impact habitats, reproduction, and survival. At this point populations are said to be approaching a biological carrying capacity (BCC). Once a population nears BCC, changes occur that slow or halt further population growth, preventing the population from significantly exceeding BCC. For bears, some of the changes may include smaller adult weights, smaller litters, later age of first reproduction, greater incidence of skipped litters (i.e., extended inter-birth interval), greater cub mortality, increased predation by large male bears on subadult bears, and others. At present, these indicators do not appear to be occurring in Pennsylvania, which suggests that bear populations are not yet close to BCC. Some researchers have argued that there is little evidence of density-dependent regulation in any of the current North American black bear populations (Garshelis 1994). Thus, Pennsylvania’s bear population appears to have the potential for additional growth. Unfortunately, as bear populations grow, so does the likelihood that people and bears will come into conflict. Like BCC, which is an abundance threshold based on habitat conditions, there also is a cultural carrying capacity (CCC), which is an abundance threshold based on people’s tolerance for human-bear conflicts. For bears, CCC is typically below BCC and, therefore, the focus of most bear management strategies. Ironically, CCC rarely remains constant, making it a difficult target for population management. CCC is influenced by
12
trends in nuisance bear activity, occurrence of highly emotional human-bear conflicts (e.g., human fatality, pet predation, significant economic losses), effectiveness of bear awareness campaigns, and people’s prior experiences with bears. There are no formal estimates of CCC for bears in Pennsylvania, but the number of people reporting conflicts has increased, which may suggest that we are near or above it in some areas. Wildlife populations also can become too small where uncertainty about annual food crops, risk of disease outbreak, loss of genetic diversity, or insufficient reproduction can jeopardize their continued existence. The minimum viable population size (MVP) for bears is not well documented. If conditions are right, populations as small as 40 individuals are thought to be viable, based on modeling done with black bears in Florida and grizzly bears in the Yellowstone Ecosystem. In Pennsylvania during the early 1970s, bears were estimated to number less than 2,000 and that population remained viable (Eveland 1973). Habitat Requirements Black bears prefer areas that have forest cover, but a variety of forest types may be used. Bears in the southwest U.S. live in chaparral or pinyon-juniper woodlands; in the north and west they live in coniferous forests, and in the southeast they use cypress swamps and coastal flatwoods (Pelton et al. 1999). In Pennsylvania and the eastern U.S., bears primarily live in temperate deciduous forests. A heterogeneous forest is preferred because it provides a greater diversity of foods. In poor food years, a diverse forest can still produce some food because not all crops may be affected the same, unlike a forest that has no food diversity. In Pennsylvania, the optimal habitat would include forest stands dominated by mature, hard-mast-producing trees interspersed with a diversity of soft-mast trees, understory shrubs, and vines, punctuated with herbaceous and grass-covered openings. Forest openings (e.g., closed roads, edges of wetlands, recent clear-cuts, and agricultural fields) are important for feeding on emerging grasses and herbaceous vegetation, an in mid-summer they provide insects and berries. Bears also require hiding cover, which they use for escape and resting. Examples in Pennsylvania are swamps, mountain laurel or rhododendron thickets, Eastern hemlock stands, regenerating clearcuts, riparian thickets, and wind-thrown areas. Two additional habitat components, denning cavities and water, are widely available and do not significantly influence abundance or distribution of bears. Black bears can survive in forested habitats that are scattered among other land uses. Some uses, like agriculture and home sites, may be an enhancement because of added foraging opportunities if forest cover is nearby. However, placing more people among bears increases the opportunity for problems, which usually decreases CCC, despite the benefit to BCC. Landscape uses that restrict movements or remove substantial amounts of forest, such as roads with heavy traffic or urban development, are detrimental. Habitat loss and fragmentation are urgent issues today for many bear populations worldwide (Herrero 1999).
13
Threats to oak trees, which may include over-browsing by deer, insect infestations, excessive cutting, and acidic precipitation, also are a concern in the eastern U.S. (Vaughan 2002). Home Range, Movements and Activity Black bears travel with changes in food availability. The area that encompasses a bear’s movements is called a home range. Home range size and shape can vary seasonally, annually, geographically, and between different sex and age groups. Male home ranges are about four-times larger than female home ranges. In northeast Pennsylvania, male home ranges averaged 63 square miles (173 square kilometers) and were 8 to 16 miles across (13–26 kilometers), whereas female home ranges averaged 15 square miles (41 square kilometers) and were 3 to 8 miles wide (5–13 kilometers; Alt 1980d, Alt et al. 1980). Females with newborn cubs have small home ranges that gradually increase as cubs mature, which results in a fall home range that is larger than at any other time of the year. Conversely, adult males and solitary females have their largest home ranges during mid summer when breeding activity is at a peak (Alt et al. 1976, Alt 1977, Alt 1980d, Alt et al. 1980). Adjacent male home ranges may overlap some, but adjacent female home ranges generally overlap more. A home range for a single adult male may encompass several female home ranges. Young males disperse away from their mother’s home range before establishing a territory whereas young females do not. Average dispersal distances for male bears in Pennsylvania is 14 miles (23 kilometers; Alt 1977, Alt 1978). Black bears are most active at dusk and dawn, and only semi-active during midday. Nocturnal activity is uncommon unless they are avoiding daytime disturbances by people. Activity intensifies during the breeding season and again in the fall prior to hibernation. If fall food supplies are scarce, activity will be limited and bears will den early. Conversely, an abundant nut crop will extend fall activity and postpone denning. In the spring, activity may be suppressed for a short time immediately after emerging from dens until food becomes more readily available. Black bears can travel long distances to exploit food sources such as concentrated berry or nut crops, feeders, landfills, and agricultural fields (Garshelis and Pelton 1981, Rogers 1987). These movements typically occur in the fall when food is most critical. Evidence of long distance movements can be seen in Pennsylvania’s northern counties during years of poor beechnut production. These counties, where beech is more common than oak, typically harvest fewer bears when beech crops fail, but harvest will increase in southerly adjacent counties where oak is more abundant, which suggests that bears are moving from one area to the other. Black bears are capable of returning home if relocated outside their home range. Homing tendencies are strongest for adult males. Subadult males, females relocated with offspring too young to travel, and bears moved greater than 40 air miles (Sauer and Free 1969, Alt et
14
al. 1977, Rogers 1986, Shull et al. 1994) tend to return less. Bears relocated greater than 100 air miles rarely return (Alt et al. 1982). Social Structure and Communication Black bears are solitary except for females accompanied by young or adult pairs during the breeding season. Spacing is maintained through a dominance hierarchy (Rogers 1977). Large bears intimidate smaller bears by using threatening gestures: huffing sounds, chopping jaws, stamping feet, or charging. Actual fights are uncommon except by competing males during the breeding season or females protecting young. Family groups communicate using a variety of sounds such as the pulsating “humming” of nursing young, squalling of scared cubs, and a low grunting sound by the female to assemble her cubs (Pelton et al. 1999). Tree marking, characterized by bears biting, clawing, and rubbing against trees, is another form of communication. Tree rubbing tends to peak during summer and normally occurs at the same or nearby tree year after year. Genetic analysis of hair left on rub trees suggests that multiple bears use the same sites. Thus, tree rubbing is assumed to be part of establishing social structure, but why black bears mark trees is still open to question (Pelton et al. 1999). SECTION II. HISTORICAL AND CURRENT STATUS OF BEARS IN PENNSYLVANIA Population Declines and Recovery At the time of European settlement large numbers of black bears likely existed throughout Pennsylvania. Mature forests covered 95 percent of the state (Table 1) and mortality from people was minimal. However, conversion of forest lands to agriculture and overharvest for their hide, meat and grease resulted in black bear declines by the 1880s. Around 1900, prime black bear hides were worth $12 and meat, 8 cents a pound (Rhoads 1903), which suggests that killing bears was profitable. No regulations existed to protect bears from year-round or excessive killing. Samuel Rhoads, author of The Mammals of Pennsylvania and New Jersey, described the abundance of bears in 1903 as, “Once uniformly and abundantly represented in every county of the two states. Now almost exterminated in N.J. …in the most densely populated counties of Pa. it is unknown, and in about half of those remaining it is found only as a straggler.” As agriculture and the demand for wood products grew, more forests were lost and indiscriminant killing by people who perceived bears as a threat to crops or livestock increased. Forests that were not converted to agriculture were cut for timber. By 1900, forest coverage had decreased to 32 percent of the state (Table 1), reducing habitat conditions for all forest-dwelling wildlife. A few years later the American chestnut, which was an important food for bears in the remaining forests, died because of disease. Before the chestnut blight of 1908–1913, it is estimated that 20 percent of the trees in Pennsylvania were
15

chestnuts (DeCoster 1995). By 1920, bear numbers were significantly down across the state and their distribution was restricted to a handful of northcentral and northeast counties.
Table 1. Pennsylvania forestland trends during selected years, 1660–1995 (from DeCoster 1995).
Year Forested Acresa % of Total Landb
1688 27,400,000 95 1700 27,400,000 95 Bear populations began to improve once
forests started to regenerate. By 1930, forests had reclaimed almost 4 million acres (Table 1). Regeneration was occurring where forests had been cut and on marginal agricultural lands that were being abandoned. Stricter hunting regulations and restocking efforts aided the recovery. Annual reports written by the Game Commission throughout the 1920s indicated that bear populations were increasing substantially.
1800 25,000,000 87 1860 21,000,000 73 1900 9,100,000 32 1930 13,000,000 45 1960 16,200,000 56 1990 17,000,000 59 1995 17,000,000 59aLand that is at least 10 percent stocked with trees of any size, or land from which trees have been removed to less than 10 percent stocking but remains undeveloped and available to regenerate trees, and land planted to trees. bBased on 28.78 million acres total land area.
From the 1940s to the 1970s, forested habitats continued to improve over most of the state (Table 1), but bear recovery stalled and population declines reappeared in some areas. The reason was believed to be overharvest caused by increasing hunting pressure (Giles and Kordek 1979, Lindzey et al. 1979, Alt 1980e, Alt and Lindzey 1980, Lindzey et al. 1983). By the mid 1970s, an estimated 250,000 people were pursuing bears during the annual hunting season. Bear hunting was eventually closed 3 out of 10 years during the 1970s (1970, 1977, and 1978) because of concern for low bear numbers and heavy hunting pressure. There are no quantitative estimates for how many bears lived in Pennsylvania during the mid 1900s, but there are harvest figures for every year since 1915. If the bear population was growing, a commensurate increase in harvest also should have occurred, especially because of the growing interest in bear hunting. But harvests remained stable to decreasing for decades and averaged 400 bears per year between 1937 and 1975 (Fig. 7). As a result, bears likely numbered between 2,000 and 4,000 statewide (i.e., 10 to 20 percent annual harvest rate) for more than half of the 20th century, despite widespread forest regeneration and some restocking.
0
500
1915 1930 1945 1960 1975 1990 2005
Year
1,000
1,500
2,000
2,500
3,000
3,500
4,000
4,500
Har
vest
Figure 7. Annual black bear harvests in Pennsylvania, 1915–2005.
16
Following the back-to-back closed seasons in 1977 and 1978, the single-day hunting season in 1979 yielded a record 736 bears. Thereafter, the bear population entered a new era of recovery. Annual population estimates, harvest, hunter success, sightings, and vehicle collisions began to increase; later in the 1990s, human-bear conflicts increased. Today, bears are more abundant than at any other time since European settlement, and about four times more abundant than 25 years ago when the trend began. The area occupied by bears likewise has increased to record levels. Several factors are thought to be responsible for the growth in bear numbers during the past two decades. First, the two years of no hunting in 1977 and 1978 allowed recovery to begin. This was the only time in Pennsylvania’s history to have two consecutive years of no bear hunting. Within three years of the closed seasons, a bear license was created that reduced the number of hunters by about 50 percent. Restocking efforts in the early 1980s and natural dispersal then began to repopulated peripheral areas of the bear range. Bear hunting was temporarily closed in peripheral areas to improve survival of newly arrived bears. Meanwhile, forests had matured and expanded to the point that annual food supplies were becoming reliable. Access to human-related foods also was increasing because of a growing human population (residential and recreational) in forested areas. A better availability of food would have aided bears to produce larger litters, starting at an earlier age, and with better cub survival. Hunting seasons throughout the recovery period also tended to protect females (i.e., short with opening date occurring after the start of hibernation). Hunting Regulations Pennsylvania was one of the first states to establish a regulated hunting season for bear that eliminated year-round hunting. The season began in 1905 and many regulation changes followed during the next five decades. The most noticeable trend was to shorten hunting seasons and move opening dates later into the fall. For example, bear hunting occurred during October 1–March 1 in 1905; October 1–January 1 in 1911; October 15–December 15 in 1915; and November 1–December 15 in 1930. By 1936, the season was less than two weeks long and completely within the month of November. Once in 1934 and three times during the 1970s (1970, 1977, and 1978), bear season was closed entirely. By 1979, the season was a single day hunt in mid December. Since then, seasons have slowly lengthened. In 1982 the season was extended to 2 days; in 1986, to 3 days; and in 2002, to 9 days in select areas (primarily in northeast Pennsylvania). Despite having longer seasons, opening day has remained constant – typically the Monday before Thanksgiving in late November. While season dates were changing, the area open to hunting also changed, shrinking when the population was declining and expanding when numbers improved. Today, bear hunting is permitted statewide. Increasingly restrictive regulations also occurred with method of take, number of animals that could be harvested (bag limit), and type of animal. There were no restrictions with the 1905 season, but steel-jawed traps and deadfalls were prohibited in 1911; log-pen traps were
17
outlawed in 1915; ammunition was limited to single-projectile bullets in 1921; and use of dogs was banned in 1935. The use of bait to attract bears was prohibited about the same time. Bag limits were reduced to one bear per hunter in 1915, and cubs less than one-year-old were protected in 1925. All of these restrictions remain in place today except for the law protecting cubs, which was removed in 1980. Starting in 1973, hunters were required to bring bears to an established check station. Check stations are still used although the number in operation has gradually expanded. Today there are 28 stations scattered across 27 counties (Lycoming County has two) that are manned by Game Commission employees each day of the season. Hunters must bring his or her bear to a check station within 24 hours of harvest. Hunters are prohibited from selling edible parts of bears, which includes gall bladders, but they can sell non-edible parts within 90 days of the season after visiting a check station (see Appendix 5 for details). In 1981, the State Legislature created a bear license that must be purchased in addition to a general hunting license before hunting bear. The annual allocation was set at 100,000. Allocation limits were removed in 1989, and today there is no limit on the number of bear licenses available. Bear licenses were only sold in the Harrisburg Headquarters building or regional Game Commission offices (six locations) at first, but beginning in 1997 they were made available at all issuing agents statewide (greater than 1,000 locations). Relocation and Restoration Efforts Range expansion is limited in black bear populations because females rarely disperse far from where they are born. It may take several generations before female bears occupy new areas, even through contiguous suitable habitats. Consequently, the Game Commission has periodically trapped and transferred large numbers of bears to restock areas of the state where bears were absent or in low numbers. For example, Executive Director Seth Gordon wrote in 1923, “during the last two seasons almost fifty black bears have been trapped and transferred to refuges in portions of the state where many years ago the timber was removed, forest fires followed, and the last bears were killed out. Through this effort five different sections of the state have been restocked with black bears, and all indications are that they are thriving splendidly” (Gordon 1923, p. 42). Most of these bears were captured in Potter County where they were plentiful, but causing livestock depredations. By 1926, almost 100 bears had been trapped and transferred (Truman 1926). Another large-scale trap and transfer effort occurred during 1979–1984. Seventy-two black bears (22 adult females with 25 cubs, 1 yearling, and 24 cubs that were born within 30 days of release) were relocated from northcentral and northeastern Pennsylvania to southwestern Pennsylvania (primarily Somerset County and eastern Westmoreland County). The objective was to bolster the bear population where habitat conditions were favorable but resident bear numbers low (Alt 1979, Alt 1980f). Subsequent monitoring revealed that many of the bears survived and went on to produce multiple litters in the new area. Thirteen bears produced a minimum of 20 litters, consisting of at least 54 offspring during 11 years following their
18
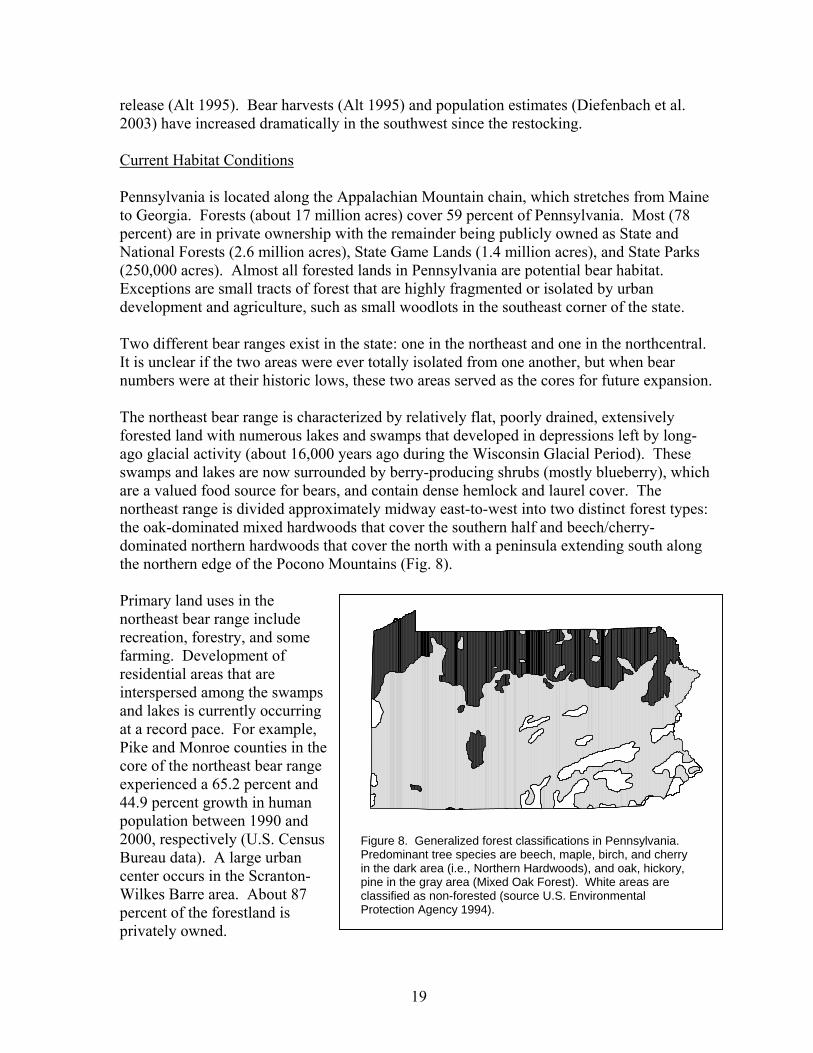
release (Alt 1995). Bear harvests (Alt 1995) and population estimates (Diefenbach et al. 2003) have increased dramatically in the southwest since the restocking. Current Habitat Conditions Pennsylvania is located along the Appalachian Mountain chain, which stretches from Maine to Georgia. Forests (about 17 million acres) cover 59 percent of Pennsylvania. Most (78 percent) are in private ownership with the remainder being publicly owned as State and National Forests (2.6 million acres), State Game Lands (1.4 million acres), and State Parks (250,000 acres). Almost all forested lands in Pennsylvania are potential bear habitat. Exceptions are small tracts of forest that are highly fragmented or isolated by urban development and agriculture, such as small woodlots in the southeast corner of the state. Two different bear ranges exist in the state: one in the northeast and one in the northcentral. It is unclear if the two areas were ever totally isolated from one another, but when bear numbers were at their historic lows, these two areas served as the cores for future expansion. The northeast bear range is characterized by relatively flat, poorly drained, extensively forested land with numerous lakes and swamps that developed in depressions left by long-ago glacial activity (about 16,000 years ago during the Wisconsin Glacial Period). These swamps and lakes are now surrounded by berry-producing shrubs (mostly blueberry), which are a valued food source for bears, and contain dense hemlock and laurel cover. The northeast range is divided approximately midway east-to-west into two distinct forest types: the oak-dominated mixed hardwoods that cover the southern half and beech/cherry-dominated northern hardwoods that cover the north with a peninsula extending south along the northern edge of the Pocono Mountains (Fig. 8). Primary land uses in the northeast bear range include recreation, forestry, and some farming. Development of residential areas that are interspersed among the swamps and lakes is currently occurring at a record pace. For example, Pike and Monroe counties in the core of the northeast bear range experienced a 65.2 percent and 44.9 percent growth in human population between 1990 and 2000, respectively (U.S. Census Bureau data). A large urban center occurs in the Scranton-Wilkes Barre area. About 87 percent of the forestland is privately owned.
Figure 8. Generalized forest classifications in Pennsylvania. Predominant tree species are beech, maple, birch, and cherry in the dark area (i.e., Northern Hardwoods), and oak, hickory, pine in the gray area (Mixed Oak Forest). White areas are classified as non-forested (source U.S. Environmental Protection Agency 1994).
19
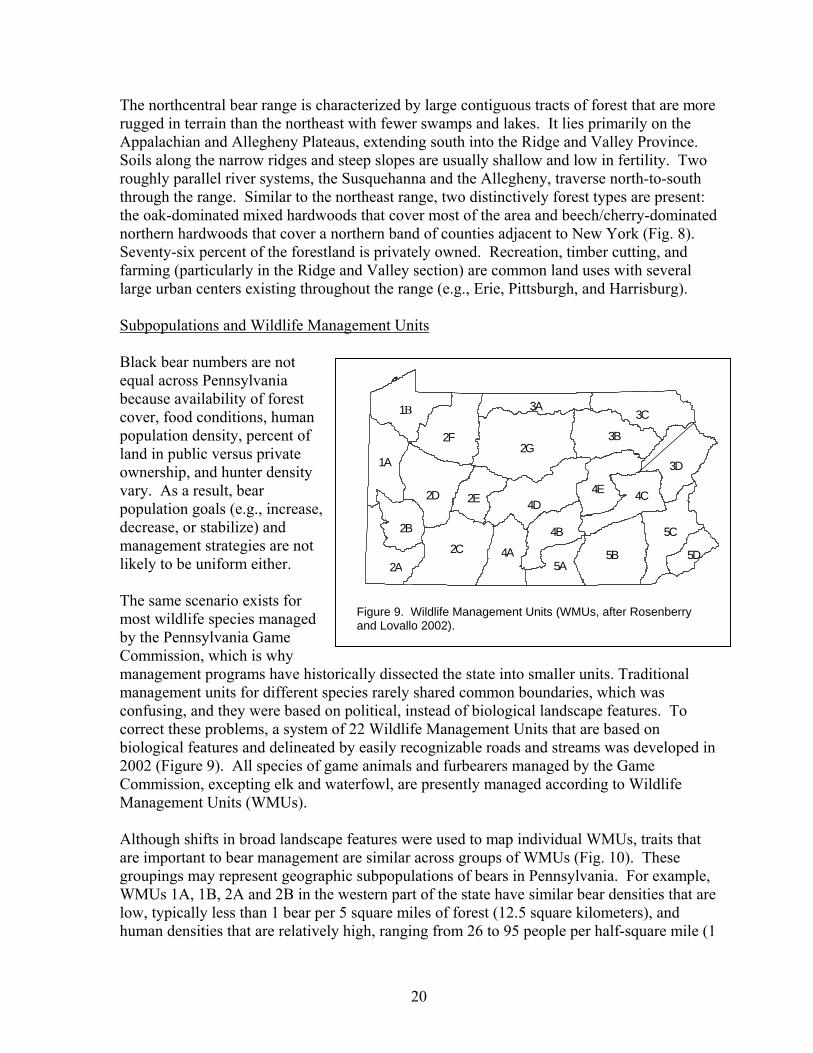
The northcentral bear range is characterized by large contiguous tracts of forest that are more rugged in terrain than the northeast with fewer swamps and lakes. It lies primarily on the Appalachian and Allegheny Plateaus, extending south into the Ridge and Valley Province. Soils along the narrow ridges and steep slopes are usually shallow and low in fertility. Two roughly parallel river systems, the Susquehanna and the Allegheny, traverse north-to-south through the range. Similar to the northeast range, two distinctively forest types are present: the oak-dominated mixed hardwoods that cover most of the area and beech/cherry-dominated northern hardwoods that cover a northern band of counties adjacent to New York (Fig. 8). Seventy-six percent of the forestland is privately owned. Recreation, timber cutting, and farming (particularly in the Ridge and Valley section) are common land uses with several large urban centers existing throughout the range (e.g., Erie, Pittsburgh, and Harrisburg). Subpopulations and Wildlife Management Units Black bear numbers are not equal across Pennsylvania because availability of forest cover, food conditions, human population density, percent of land in public versus private ownership, and hunter density vary. As a result, bear population goals (e.g., increase, decrease, or stabilize) and management strategies are not likely to be uniform either. The same scenario exists for most wildlife species managed by the Pennsylvania Game Commission, which is why management programs have historically dissected the state into smaller units. Traditional management units for different species rarely shared common boundaries, which was confusing, and they were based on political, instead of biological landscape features. To correct these problems, a system of 22 Wildlife Management Units that are based on biological features and delineated by easily recognizable roads and streams was developed in 2002 (Figure 9). All species of game animals and furbearers managed by the Game Commission, excepting elk and waterfowl, are presently managed according to Wildlife Management Units (WMUs).
2G
2C 5 B
4D
2F
2D
3 B
1B
3D
5C
3 C
1A
2A4A
4 E 4 C
4B
3A
2B
5A
2E
5D
Figure 9. Wildlife Management Units (WMUs, after Rosenberry and Lovallo 2002).
Although shifts in broad landscape features were used to map individual WMUs, traits that are important to bear management are similar across groups of WMUs (Fig. 10). These groupings may represent geographic subpopulations of bears in Pennsylvania. For example, WMUs 1A, 1B, 2A and 2B in the western part of the state have similar bear densities that are low, typically less than 1 bear per 5 square miles of forest (12.5 square kilometers), and human densities that are relatively high, ranging from 26 to 95 people per half-square mile (1
20
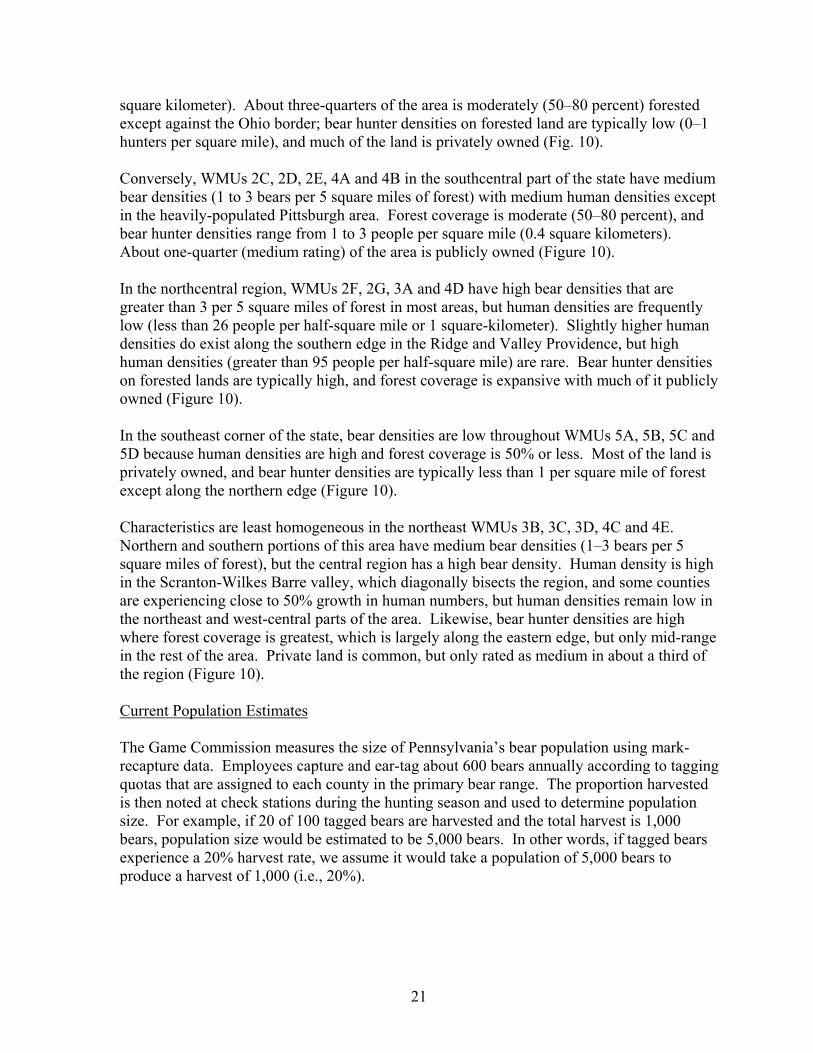
square kilometer). About three-quarters of the area is moderately (50–80 percent) forested except against the Ohio border; bear hunter densities on forested land are typically low (0–1 hunters per square mile), and much of the land is privately owned (Fig. 10). Conversely, WMUs 2C, 2D, 2E, 4A and 4B in the southcentral part of the state have medium bear densities (1 to 3 bears per 5 square miles of forest) with medium human densities except in the heavily-populated Pittsburgh area. Forest coverage is moderate (50–80 percent), and bear hunter densities range from 1 to 3 people per square mile (0.4 square kilometers). About one-quarter (medium rating) of the area is publicly owned (Figure 10). In the northcentral region, WMUs 2F, 2G, 3A and 4D have high bear densities that are greater than 3 per 5 square miles of forest in most areas, but human densities are frequently low (less than 26 people per half-square mile or 1 square-kilometer). Slightly higher human densities do exist along the southern edge in the Ridge and Valley Providence, but high human densities (greater than 95 people per half-square mile) are rare. Bear hunter densities on forested lands are typically high, and forest coverage is expansive with much of it publicly owned (Figure 10). In the southeast corner of the state, bear densities are low throughout WMUs 5A, 5B, 5C and 5D because human densities are high and forest coverage is 50% or less. Most of the land is privately owned, and bear hunter densities are typically less than 1 per square mile of forest except along the northern edge (Figure 10). Characteristics are least homogeneous in the northeast WMUs 3B, 3C, 3D, 4C and 4E. Northern and southern portions of this area have medium bear densities (1–3 bears per 5 square miles of forest), but the central region has a high bear density. Human density is high in the Scranton-Wilkes Barre valley, which diagonally bisects the region, and some counties are experiencing close to 50% growth in human numbers, but human densities remain low in the northeast and west-central parts of the area. Likewise, bear hunter densities are high where forest coverage is greatest, which is largely along the eastern edge, but only mid-range in the rest of the area. Private land is common, but only rated as medium in about a third of the region (Figure 10). Current Population Estimates The Game Commission measures the size of Pennsylvania’s bear population using mark-recapture data. Employees capture and ear-tag about 600 bears annually according to tagging quotas that are assigned to each county in the primary bear range. The proportion harvested is then noted at check stations during the hunting season and used to determine population size. For example, if 20 of 100 tagged bears are harvested and the total harvest is 1,000 bears, population size would be estimated to be 5,000 bears. In other words, if tagged bears experience a 20% harvest rate, we assume it would take a population of 5,000 bears to produce a harvest of 1,000 (i.e., 20%).
21
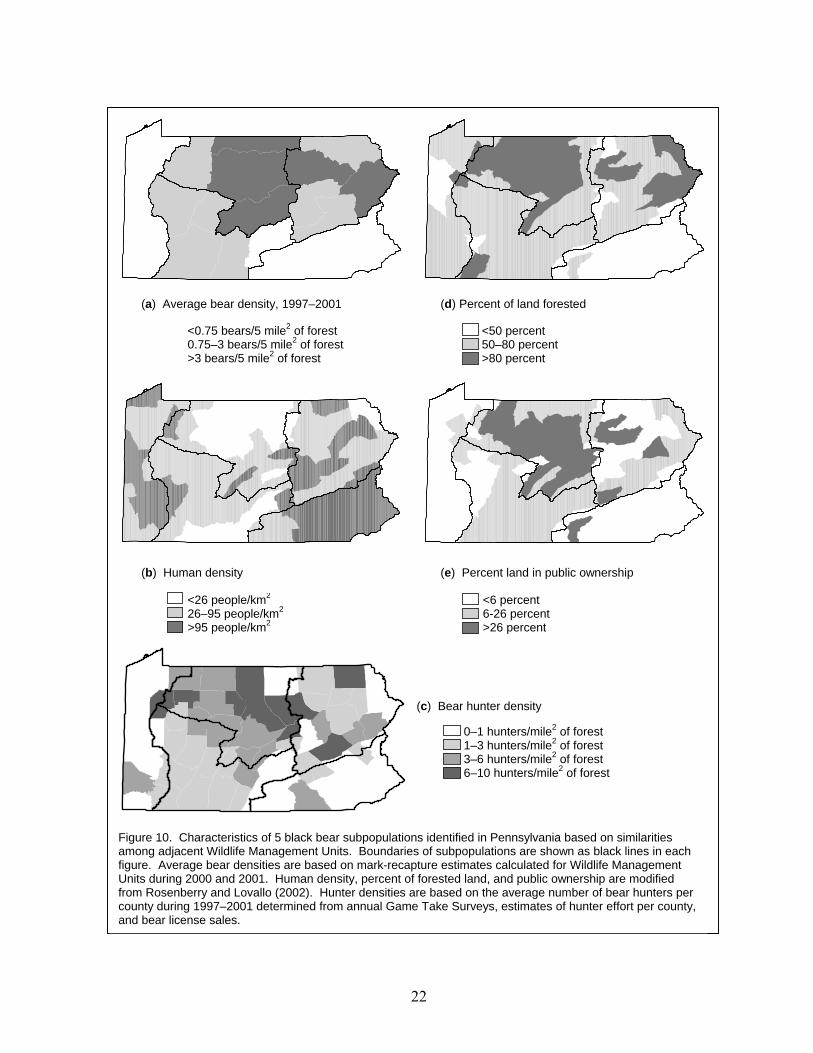
Figure 10. Characteristics of 5 black bear subpopulations identified in Pennsylvania based on similarities among adjacent Wildlife Management Units. Boundaries of subpopulations are shown as black lines in each figure. Average bear densities are based on mark-recapture estimates calculated for Wildlife Management Units during 2000 and 2001. Human density, percent of forested land, and public ownership are modified from Rosenberry and Lovallo (2002). Hunter densities are based on the average number of bear hunters per county during 1997–2001 determined from annual Game Take Surveys, estimates of hunter effort per county, and bear license sales.
(a) Average bear density, 1997–2001 (d) Percent of land forested
<0.75 bears/5 mile2 of forest 0.75–3 bears/5 mile2 of forest>3 bears/5 mile2 of forest
(b) Human density (e) Percent land in public ownership
<50 percent50–80 percent >80 percent
<26 people/km2
26–95 people/km2
>95 people/km2
<6 percent6-26 percent >26 percent
0–1 hunters/mile2 of forest 1–3 hunters/mile2 of forest 3–6 hunters/mile2 of forest 6–10 hunters/mile2 of forest
(c) Bear hunter density
22

We verify that ear-tags are not overlooked or incorrectly recorded at check stations by sending a letter to all successful hunters after the hunting season. The letter informs the hunter of his or her bear’s age and asks if a capture history report was received for bears that were tagged. Failing to receive a capture report at the check station or in the mail with their age letter indicates that tags were not recorded correctly. Mark-recapture population estimates do have some limitations. The two most problematic ones for Pennsylvania are (1) marking enough bears annually so that estimates are precise and accurate; and (2) assuming that bears that are marked have an equal chance of being recaptured in the harvest. We are studying statistical variations of the mark-recapture method we use to hopefully address these problems (see Current Research section for more details). Thus, we may switch to another method ocalculating population sizein the future and the valuereported here could change,but the trend should resimilar.
f
s
main
o Figure 11. Mark-recapture population estimates for black bears in Pennsylvania. Dotted lines indicate 95 percent confidence intervals or range of reliability surrounding each estimate.
3,000
5,000
7,000
9,000
11,000
13,000
15,000
17,000
19,000
1980 1985 1990 1995 2000 2005
Year
Popu
latio
n Es
timat
e .
Annual population estimates were increasing an average of 394 bears per year between 1983 and 2000, but estimates in the last six years (2000–2005) have been relatively stable (Figure 11). In 2005, Pennsylvania’s black bear population was estimated tbe 15,713 animals (95 percent confidence interval was 13,404–18,575). Current Harvest Statistics Pennsylvania’s statewide bear season is currently managed to harvest 20 percent of the bear population annually (i.e., 20 percent harvest rate). Harvest rate is calculated as the proportion of tagged bears harvested and has averaged 20.3 percent since 1986 with very little variation (95 percent confidence interval = 18.9 percent to 21.8 percent; Table 2). The 20 percent harvest objective was initially adopted to stabilize the bear population at 10,000 animals, but current population estimates now exceed that level. A general hunting license (resident $20.00; nonresident $101.00) and bear license (resident $16.00; nonresident $36.00) are required to hunt bear. In 2005, a record 140,151 bear licenses were sold, although license sales have been increasing steadily since about 1994 (Table 2). Nonresidents typically comprise 3-4% of bear license sales.
23
About 3 percent, or 1 in 35 hunters, are successful at harvesting a bear, which is an increase from 1.7 percent (1 in 60 hunters) during the late 1980s (Table 2). Better success is most likely the result of increased bear abundance, but weather and food conditions greatly influence year-to-year variations. Harvests also have been steadily increasing over the past 20 years (Figure 7). The seven largest harvests on record have occurred in the last eight years, and annual harvests now average more than 3,000 bears (Table 2). Equal numbers of males and females are typically harvested. However, males predominate in younger age classes (1 to 3 years old), while females increasingly outnumber males in older age classes. The average age of harvested bears is 2.2 years. Average live-weights of harvested bears are 82 pounds for cubs; 203 pounds for 1 to 3 year-old males; 160 pounds for 1 to 3 year-old females; 441 pounds for adult males; and 217 pounds for adult females. Large bears (i.e., more than 400 pounds) are harvested from a wide geographic area. In 2005, 41 of 52 counties harvested at least one bear with a live weight over 400 pounds, and there were 61 bears from 27 counties that had estimated live weights greater than 500 pounds (PGC unpublished data). Current Research Annual Statewide Bear Tagging Effort Ear-tag data are the foundation of our population estimates and harvest rate calculations (see discussion above). Bears also are tagged annually to monitor age structure, growth and development, reproduction, survival, dispersal, and distribution characteristics, as well as documenting histories for bears involved in nuisance situations. The annual statewide tagging effort is expected to continue. Improving Population Estimates As the bear population increases, a larger number of bears should be tagged each year to maintain reasonably accurate population estimates, but time and personnel resources are finite. Therefore, together with the Pennsylvania State University Cooperative Fish and Wildlife Research Unit, we are researching statistical variations of the Lincoln-Petersen mark-recapture estimator for alternative analyses. An important assumption when using mark-recapture data is that bears fitted with ear tags remain available for harvest (recapture) after they are marked. However, we have evidence that this assumption may be violated because some bears begin hibernation before hunting season, making them underrepresented in the harvest. The severity of underrepresentation varies from year to year based on changing food conditions, with more bears choosing to den early in poorer food years. By studying the timing of denning under different food conditions, we hope to better account for this variation and subsequently improve population estimates without tagging larger samples of bears.
24

Characteristics of Reproduction and Survival in the Northcentral Bear Range Most of the information we presently have on black bear reproduction in Pennsylvania came from studies conducted in the northeast region of the state. There are noticeable differences in habitat, land uses, and human demographics between this region and the northcentral bear range that may influence parameters such as litter size, breeding age, growth and development, and survival. We are presently monitoring a sample of adult female bears fitted with radio-collars in northcentral Pennsylvania to determine if there are significant differences from values currently believed to be representative of bears statewide. Orphan Cub Reintroductions We currently maintain radio-collars on 10 to 20 adult female bears to use as surrogate mothers for orphaned cubs. Depending on the time of year and condition of the cub, orphans can be successfully added to a foster litter. Other alternatives are to temporarily hold cubs in captivity until they are believed to be self-sufficient and then release them without a mother, euthanasia, or permanent captivity (e.g., at a zoo or research facility). SECTION III. RECREATION, ECONOMIC SIGNIFICANCE, AND PUBLIC INTEREST Hunting Black bear hunting for recreation, food, or clothing has a long tradition in North America. Currently, black bears are classified as a game species in 34 states, although four have no open hunting season (Alabama, Nebraska, Nevada, and Oklahoma; Scheick 2002) and two have only recently opened a season (Maryland and New Jersey). Nineteen states require a special license (bear or big game) in addition to a general hunting license to hunt bear, thus a minimum estimate of bear hunters is now close to 500,000 people (Pelton et al. 1999). Twelve to thirteen percent of Pennsylvania’s hunters purchase a bear license and the number is steadily increasing; a record 140,151 hunters purchased a bear licenses in 2005 (Table 2). Game Take Survey results from 2002 and 2003 indicate that Pennsylvania hunters spend about 220,000 man-days a year hunting bear (one person for one day = one man-day). Pennsylvania black bear hunters are predominately male and have an average age of 40. Hunters come from all over North America to participate in Pennsylvania’s bear season. Since 1980, hunters from 40 states and several Canadian provinces have traveled to Pennsylvania and been successful at harvesting a bear (i.e., were interviewed at a check station). About 2,500 nonresident bear licenses are sold annually, which represents 4 percent of the hunters who come to Pennsylvania, however, a record 5,260 nonresidents purchased a bear licenses in 2005. The Game Commission regularly receives requests to expand bear hunting opportunities. Expanding bear hunting opportunities was a common theme to many of the comments
25
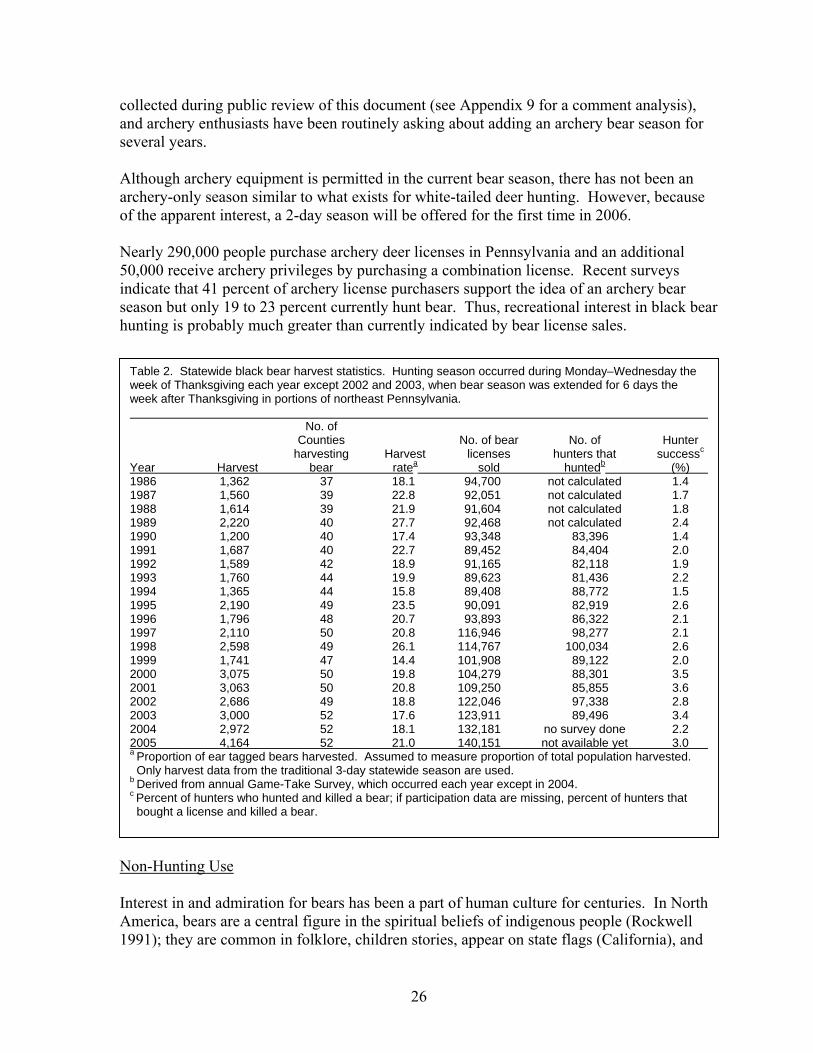
collected during public review of this document (see Appendix 9 for a comment analysis), and archery enthusiasts have been routinely asking about adding an archery bear season for several years. Although archery equipment is permitted in the current bear season, there has not been an archery-only season similar to what exists for white-tailed deer hunting. However, because of the apparent interest, a 2-day season will be offered for the first time in 2006. Nearly 290,000 people purchase archery deer licenses in Pennsylvania and an additional 50,000 receive archery privileges by purchasing a combination license. Recent surveys indicate that 41 percent of archery license purchasers support the idea of an archery bear season but only 19 to 23 percent currently hunt bear. Thus, recreational interest in black bear hunting is probably much greater than currently indicated by bear license sales.
Table 2. Statewide black bear harvest statistics. Hunting season occurred during Monday–Wednesday the week of Thanksgiving each year except 2002 and 2003, when bear season was extended for 6 days the week after Thanksgiving in portions of northeast Pennsylvania. No. of Counties No. of bear No. of Hunter harvesting Harvest licenses hunters that successc
Year Harvest bear ratea sold huntedb (%)1986 1,362 37 18.1 94,700 not calculated 1.4 1987 1,560 39 22.8 92,051 not calculated 1.7 1988 1,614 39 21.9 91,604 not calculated 1.8 1989 2,220 40 27.7 92,468 not calculated 2.4 1990 1,200 40 17.4 93,348 83,396 1.4 1991 1,687 40 22.7 89,452 84,404 2.0 1992 1,589 42 18.9 91,165 82,118 1.9 1993 1,760 44 19.9 89,623 81,436 2.2 1994 1,365 44 15.8 89,408 88,772 1.5 1995 2,190 49 23.5 90,091 82,919 2.6 1996 1,796 48 20.7 93,893 86,322 2.1 1997 2,110 50 20.8 116,946 98,277 2.1 1998 2,598 49 26.1 114,767 100,034 2.6 1999 1,741 47 14.4 101,908 89,122 2.0 2000 3,075 50 19.8 104,279 88,301 3.5 2001 3,063 50 20.8 109,250 85,855 3.6 2002 2,686 49 18.8 122,046 97,338 2.8 2003 3,000 52 17.6 123,911 89,496 3.4 2004 2,972 52 18.1 132,181 no survey done 2.2 2005 4,164 52 21.0 140,151 not available yet 3.0a Proportion of ear tagged bears harvested. Assumed to measure proportion of total population harvested. Only harvest data from the traditional 3-day statewide season are used. b Derived from annual Game-Take Survey, which occurred each year except in 2004. c Percent of hunters who hunted and killed a bear; if participation data are missing, percent of hunters that bought a license and killed a bear.
Non-Hunting Use Interest in and admiration for bears has been a part of human culture for centuries. In North America, bears are a central figure in the spiritual beliefs of indigenous people (Rockwell 1991); they are common in folklore, children stories, appear on state flags (California), and
26
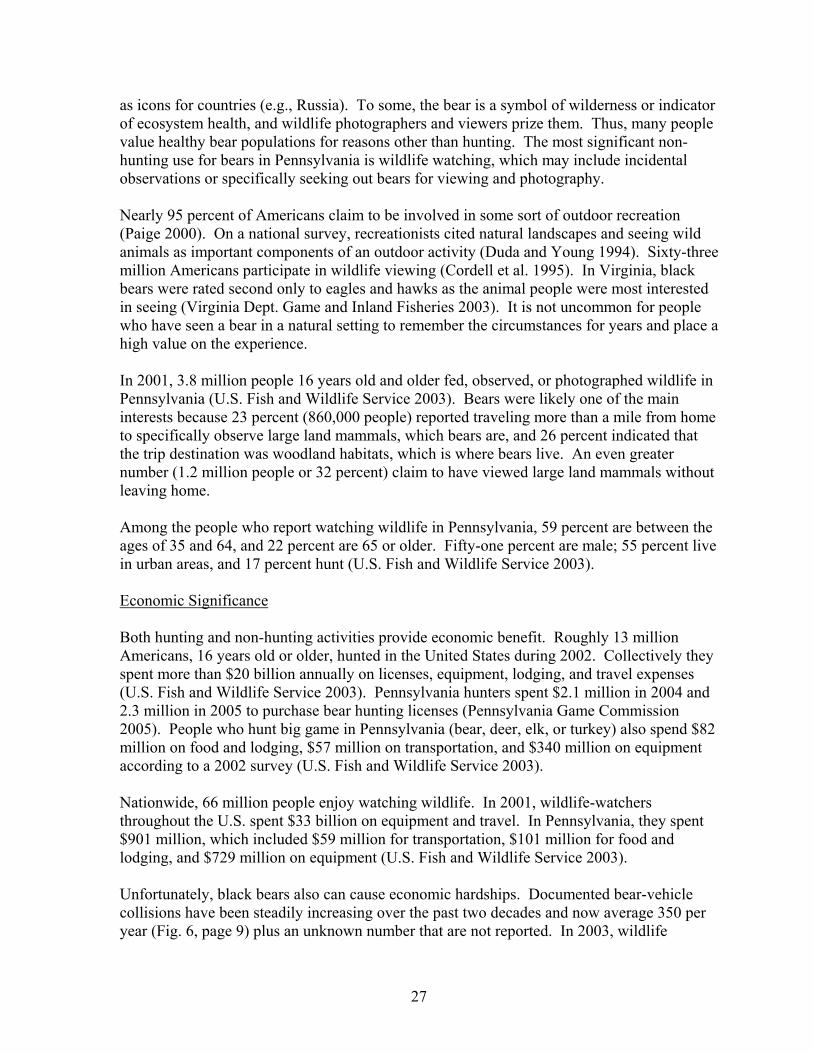
as icons for countries (e.g., Russia). To some, the bear is a symbol of wilderness or indicator of ecosystem health, and wildlife photographers and viewers prize them. Thus, many people value healthy bear populations for reasons other than hunting. The most significant non-hunting use for bears in Pennsylvania is wildlife watching, which may include incidental observations or specifically seeking out bears for viewing and photography. Nearly 95 percent of Americans claim to be involved in some sort of outdoor recreation (Paige 2000). On a national survey, recreationists cited natural landscapes and seeing wild animals as important components of an outdoor activity (Duda and Young 1994). Sixty-three million Americans participate in wildlife viewing (Cordell et al. 1995). In Virginia, black bears were rated second only to eagles and hawks as the animal people were most interested in seeing (Virginia Dept. Game and Inland Fisheries 2003). It is not uncommon for people who have seen a bear in a natural setting to remember the circumstances for years and place a high value on the experience. In 2001, 3.8 million people 16 years old and older fed, observed, or photographed wildlife in Pennsylvania (U.S. Fish and Wildlife Service 2003). Bears were likely one of the main interests because 23 percent (860,000 people) reported traveling more than a mile from home to specifically observe large land mammals, which bears are, and 26 percent indicated that the trip destination was woodland habitats, which is where bears live. An even greater number (1.2 million people or 32 percent) claim to have viewed large land mammals without leaving home. Among the people who report watching wildlife in Pennsylvania, 59 percent are between the ages of 35 and 64, and 22 percent are 65 or older. Fifty-one percent are male; 55 percent live in urban areas, and 17 percent hunt (U.S. Fish and Wildlife Service 2003). Economic Significance Both hunting and non-hunting activities provide economic benefit. Roughly 13 million Americans, 16 years old or older, hunted in the United States during 2002. Collectively they spent more than $20 billion annually on licenses, equipment, lodging, and travel expenses (U.S. Fish and Wildlife Service 2003). Pennsylvania hunters spent $2.1 million in 2004 and 2.3 million in 2005 to purchase bear hunting licenses (Pennsylvania Game Commission 2005). People who hunt big game in Pennsylvania (bear, deer, elk, or turkey) also spend $82 million on food and lodging, $57 million on transportation, and $340 million on equipment according to a 2002 survey (U.S. Fish and Wildlife Service 2003). Nationwide, 66 million people enjoy watching wildlife. In 2001, wildlife-watchers throughout the U.S. spent $33 billion on equipment and travel. In Pennsylvania, they spent $901 million, which included $59 million for transportation, $101 million for food and lodging, and $729 million on equipment (U.S. Fish and Wildlife Service 2003). Unfortunately, black bears also can cause economic hardships. Documented bear-vehicle collisions have been steadily increasing over the past two decades and now average 350 per year (Fig. 6, page 9) plus an unknown number that are not reported. In 2003, wildlife
27
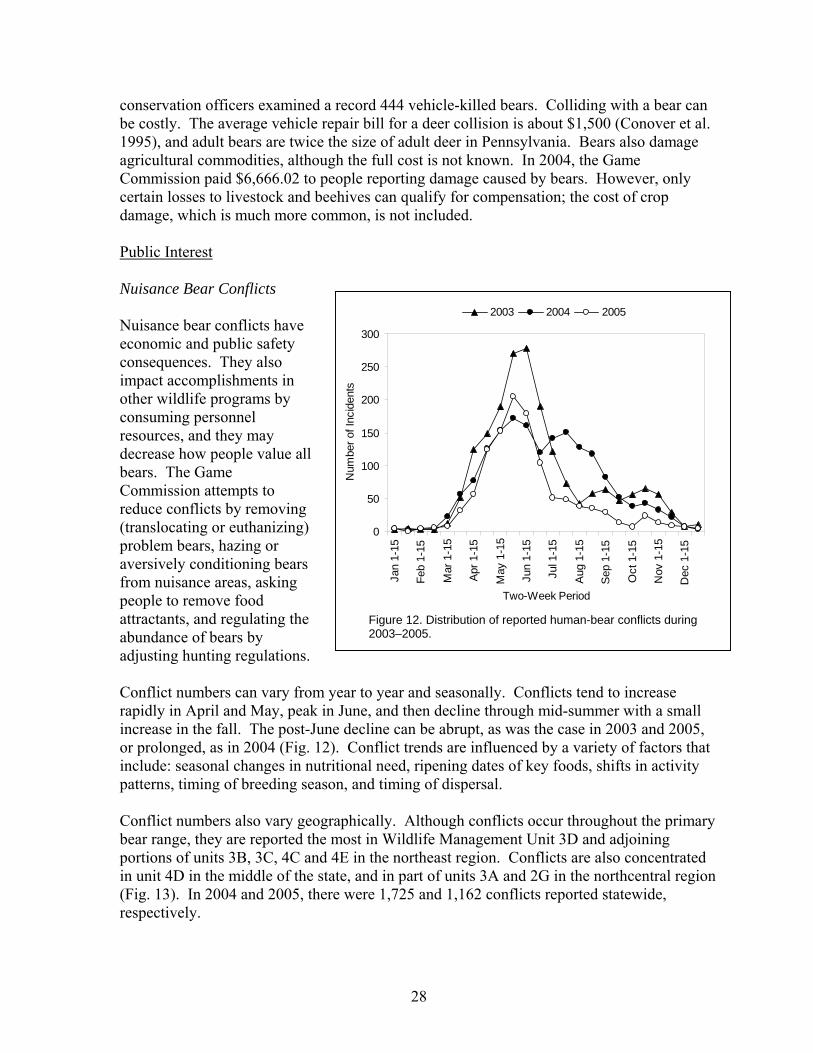
conservation officers examined a record 444 vehicle-killed bears. Colliding with a bear can be costly. The average vehicle repair bill for a deer collision is about $1,500 (Conover et al. 1995), and adult bears are twice the size of adult deer in Pennsylvania. Bears also damage agricultural commodities, although the full cost is not known. In 2004, the Game Commission paid $6,666.02 to people reporting damage caused by bears. However, only certain losses to livestock and beehives can qualify for compensation; the cost of crop damage, which is much more common, is not included. Public Interest Nuisance Bear Conflicts
0
50
100
150
200
250
300
Jan
1-15
Feb
1-15
Mar
1-1
5
Apr 1
-15
May
1-1
5
Jun
1-15
Jul 1
-15
Aug
1-15
Sep
1-15
Oct
1-1
5
Nov
1-1
5
Dec
1-1
5
Two-Week Period
Num
ber o
f Inc
iden
ts
2003 2004 2005
Figure 12. Distribution of reported human-bear conflicts during 2003–2005.
Nuisance bear conflicts have economic and public safety consequences. They also impact accomplishments in other wildlife programs by consuming personnel resources, and they may decrease how people value abears. The Game Commission attempts to reduce conflicts by removing (translocating or euthanizing) problem bears, hazing or aversively conditioning bears from nuisance areas, asking people to remove food attractants, and regulating the abundance of bears by adjusting hunting regulations.
ll
Conflict numbers can vary from year to year and seasonally. Conflicts tend to increase rapidly in April and May, peak in June, and then decline through mid-summer with a small increase in the fall. The post-June decline can be abrupt, as was the case in 2003 and 2005, or prolonged, as in 2004 (Fig. 12). Conflict trends are influenced by a variety of factors that include: seasonal changes in nutritional need, ripening dates of key foods, shifts in activity patterns, timing of breeding season, and timing of dispersal. Conflict numbers also vary geographically. Although conflicts occur throughout the primary bear range, they are reported the most in Wildlife Management Unit 3D and adjoining portions of units 3B, 3C, 4C and 4E in the northeast region. Conflicts are also concentrated in unit 4D in the middle of the state, and in part of units 3A and 2G in the northcentral region (Fig. 13). In 2004 and 2005, there were 1,725 and 1,162 conflicts reported statewide, respectively.
28
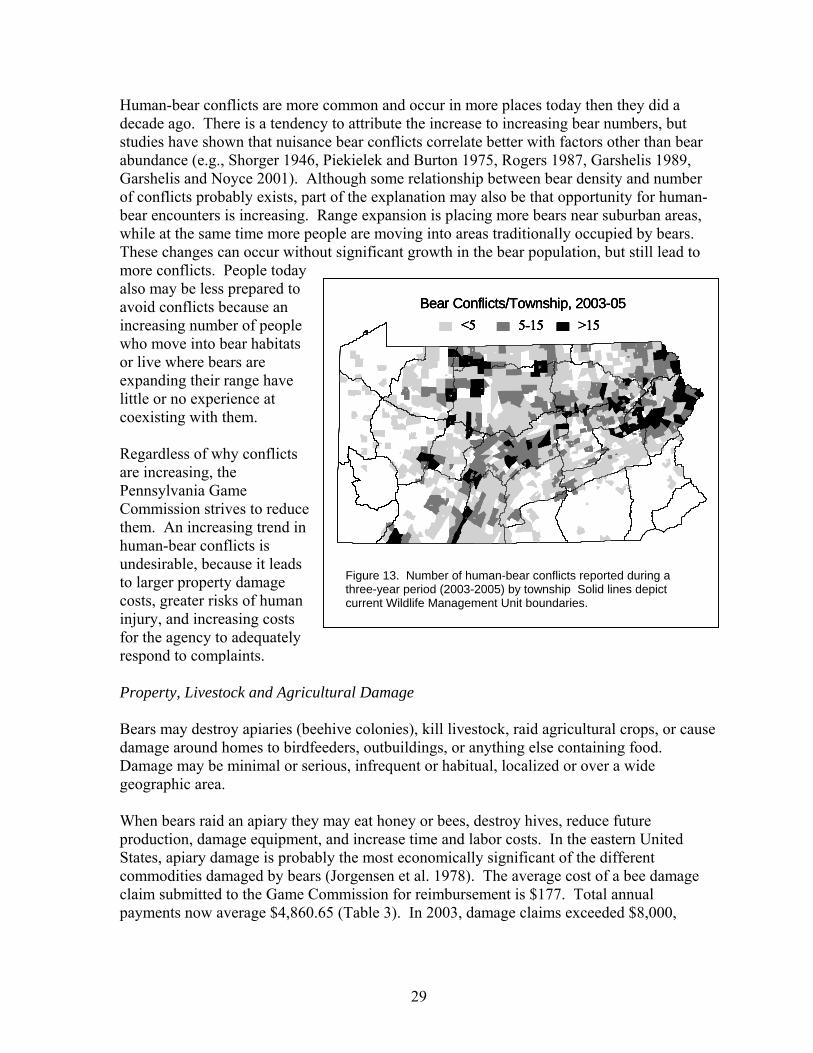
Human-bear conflicts are more common and occur in more places today then they did a decade ago. There is a tendency to attribute the increase to increasing bear numbers, but studies have shown that nuisance bear conflicts correlate better with factors other than bear abundance (e.g., Shorger 1946, Piekielek and Burton 1975, Rogers 1987, Garshelis 1989, Garshelis and Noyce 2001). Although some relationship between bear density and number of conflicts probably exists, part of the explanation may also be that opportunity for human-bear encounters is increasing. Range expansion is placing more bears near suburban areas, while at the same time more people are moving into areas traditionally occupied by bears. These changes can occur without significant growth in the bear population, but still lead to more conflicts. People today also may be less prepared to avoid conflicts because an increasing number of people who move into bear habitats or live where bears are expanding their range have little or no experience at coexisting with them.
<5 5-15 >15Bear Conflicts/Township, 2003-05
<5 5-15 >15Bear Conflicts/Township, 2003-05
<5 5-15 >15<5 5-15 >15Bear Conflicts/Township, 2003-05
Figure 13. Number of human-bear conflicts reported during a three-year period (2003-2005) by township Solid lines depict current Wildlife Management Unit boundaries.
Regardless of why conflicts are increasing, the Pennsylvania Game Commission strives to reduce them. An increasing trend in human-bear conflicts is undesirable, because it leads to larger property damage costs, greater risks of human injury, and increasing costs for the agency to adequately respond to complaints. Property, Livestock and Agricultural Damage Bears may destroy apiaries (beehive colonies), kill livestock, raid agricultural crops, or cause damage around homes to birdfeeders, outbuildings, or anything else containing food. Damage may be minimal or serious, infrequent or habitual, localized or over a wide geographic area. When bears raid an apiary they may eat honey or bees, destroy hives, reduce future production, damage equipment, and increase time and labor costs. In the eastern United States, apiary damage is probably the most economically significant of the different commodities damaged by bears (Jorgensen et al. 1978). The average cost of a bee damage claim submitted to the Game Commission for reimbursement is $177. Total annual payments now average $4,860.65 (Table 3). In 2003, damage claims exceeded $8,000,
29
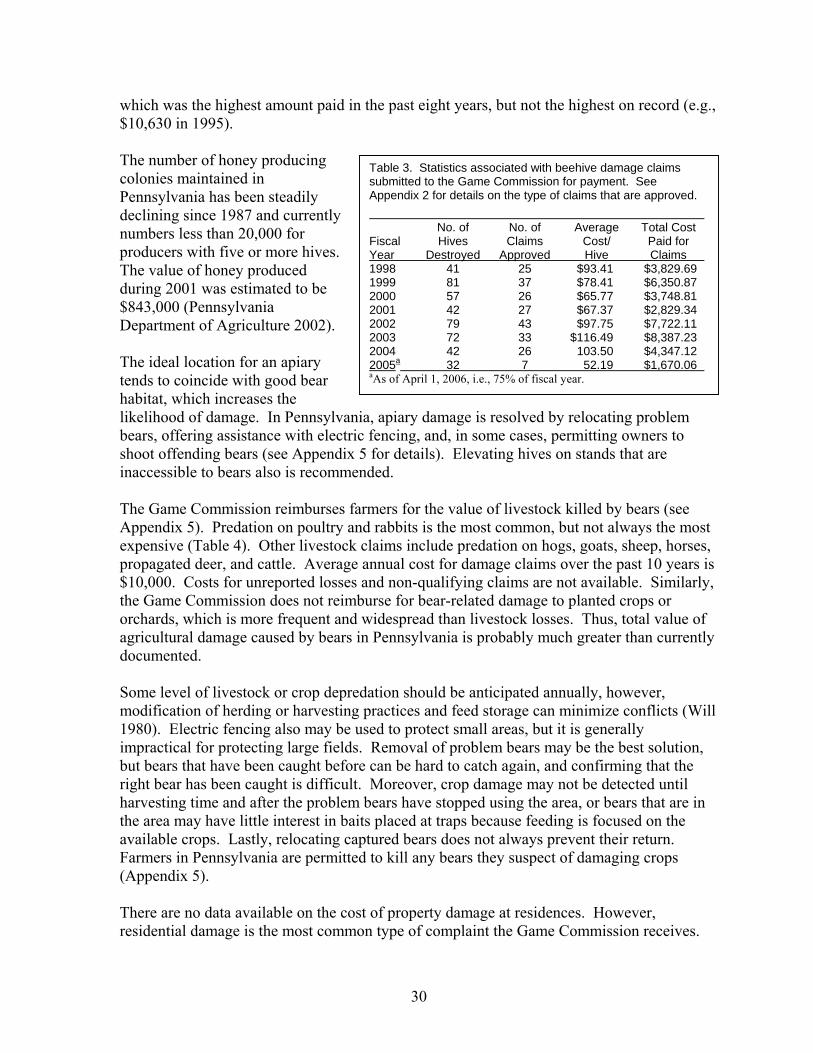
which was the highest amount paid in the past eight years, but not the highest on record (e.g., $10,630 in 1995). The number of honey producing colonies maintained in Pennsylvania has been steadily declining since 1987 and currently numbers less than 20,000 for producers with five or more hives. The value of honey produced during 2001 was estimated to be $843,000 (Pennsylvania Department of Agriculture 2002). The ideal location for an apiary tends to coincide with good bear habitat, which increases the likelihood of damage. In Pennsylvania, apiary damage is resolved by relocating problem bears, offering assistance with electric fencing, and, in some cases, permitting owners to shoot offending bears (see Appendix 5 for details). Elevating hives on stands that are inaccessible to bears also is recommended.
Table 3. Statistics associated with beehive damage claims submitted to the Game Commission for payment. See Appendix 2 for details on the type of claims that are approved. No. of No. of Average Total Cost Fiscal Hives Claims Cost/ Paid for Year Destroyed Approved Hive Claims 1998 41 25 $93.41 $3,829.69 1999 81 37 $78.41 $6,350.87 2000 57 26 $65.77 $3,748.81 2001 42 27 $67.37 $2,829.34 2002 79 43 $97.75 $7,722.11 2003 72 33 $116.49 $8,387.23 2004 42 26 103.50 $4,347.12 2005a 32 7 52.19 $1,670.06 aAs of April 1, 2006, i.e., 75% of fiscal year.
The Game Commission reimburses farmers for the value of livestock killed by bears (see Appendix 5). Predation on poultry and rabbits is the most common, but not always the most expensive (Table 4). Other livestock claims include predation on hogs, goats, sheep, horses, propagated deer, and cattle. Average annual cost for damage claims over the past 10 years is $10,000. Costs for unreported losses and non-qualifying claims are not available. Similarly, the Game Commission does not reimburse for bear-related damage to planted crops or orchards, which is more frequent and widespread than livestock losses. Thus, total value of agricultural damage caused by bears in Pennsylvania is probably much greater than currently documented. Some level of livestock or crop depredation should be anticipated annually, however, modification of herding or harvesting practices and feed storage can minimize conflicts (Will 1980). Electric fencing also may be used to protect small areas, but it is generally impractical for protecting large fields. Removal of problem bears may be the best solution, but bears that have been caught before can be hard to catch again, and confirming that the right bear has been caught is difficult. Moreover, crop damage may not be detected until harvesting time and after the problem bears have stopped using the area, or bears that are in the area may have little interest in baits placed at traps because feeding is focused on the available crops. Lastly, relocating captured bears does not always prevent their return. Farmers in Pennsylvania are permitted to kill any bears they suspect of damaging crops (Appendix 5). There are no data available on the cost of property damage at residences. However, residential damage is the most common type of complaint the Game Commission receives.
30
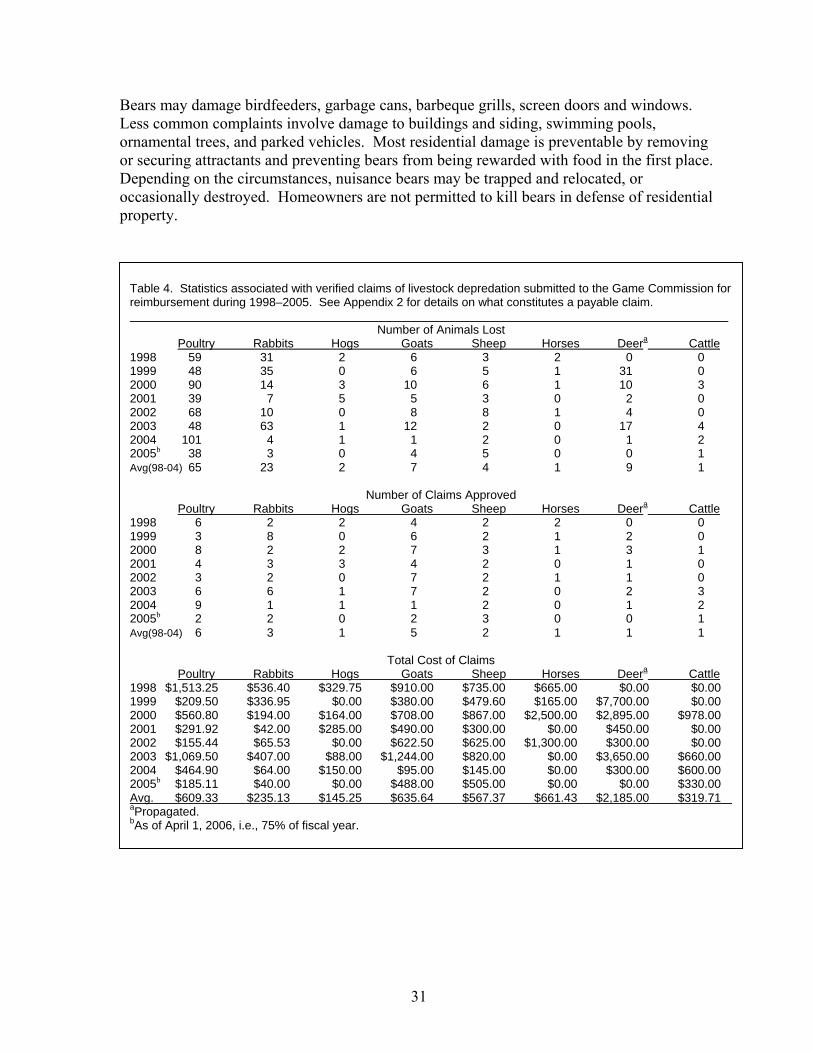
Bears may damage birdfeeders, garbage cans, barbeque grills, screen doors and windows. Less common complaints involve damage to buildings and siding, swimming pools, ornamental trees, and parked vehicles. Most residential damage is preventable by removing or securing attractants and preventing bears from being rewarded with food in the first place. Depending on the circumstances, nuisance bears may be trapped and relocated, or occasionally destroyed. Homeowners are not permitted to kill bears in defense of residential property.
Table 4. Statistics associated with verified claims of livestock depredation submitted to the Game Commission for reimbursement during 1998–2005. See Appendix 2 for details on what constitutes a payable claim. Number of Animals Lost Poultry Rabbits Hogs Goats Sheep Horses Deera Cattle 1998 59 31 2 6 3 2 0 01999 48 35 0 6 5 1 31 0 2000 90 14 3 10 6 1 10 3 2001 39 7 5 5 3 0 2 0 2002 68 10 0 8 8 1 4 0 2003 48 63 1 12 2 0 17 4 2004 101 4 1 1 2 0 1 2 2005b 38 3 0 4 5 0 0 1 Avg(98-04) 65 23 2 7 4 1 9 1 Number of Claims Approved Poultry Rabbits Hogs Goats Sheep Horses Deera Cattle 1998 6 2 2 4 2 2 0 01999 3 8 0 6 2 1 2 02000 8 2 2 7 3 1 3 1 2001 4 3 3 4 2 0 1 0 2002 3 2 0 7 2 1 1 0 2003 6 6 1 7 2 0 2 3 2004 9 1 1 1 2 0 1 2 2005b 2 2 0 2 3 0 0 1 Avg(98-04) 6 3 1 5 2 1 1 1 Total Cost of Claims Poultry Rabbits Hogs Goats Sheep Horses Deera Cattle 1998 $1,513.25 $536.40 $329.75 $910.00 $735.00 $665.00 $0.00 $0.001999 $209.50 $336.95 $0.00 $380.00 $479.60 $165.00 $7,700.00 $0.002000 $560.80 $194.00 $164.00 $708.00 $867.00 $2,500.00 $2,895.00 $978.00 2001 $291.92 $42.00 $285.00 $490.00 $300.00 $0.00 $450.00 $0.00 2002 $155.44 $65.53 $0.00 $622.50 $625.00 $1,300.00 $300.00 $0.00 2003 $1,069.50 $407.00 $88.00 $1,244.00 $820.00 $0.00 $3,650.00 $660.00 2004 $464.90 $64.00 $150.00 $95.00 $145.00 $0.00 $300.00 $600.00 2005b $185.11 $40.00 $0.00 $488.00 $505.00 $0.00 $0.00 $330.00 Avg. $609.33 $235.13 $145.25 $635.64 $567.37 $661.43 $2,185.00 $319.71 aPropagated. bAs of April 1, 2006, i.e., 75% of fiscal year.
31
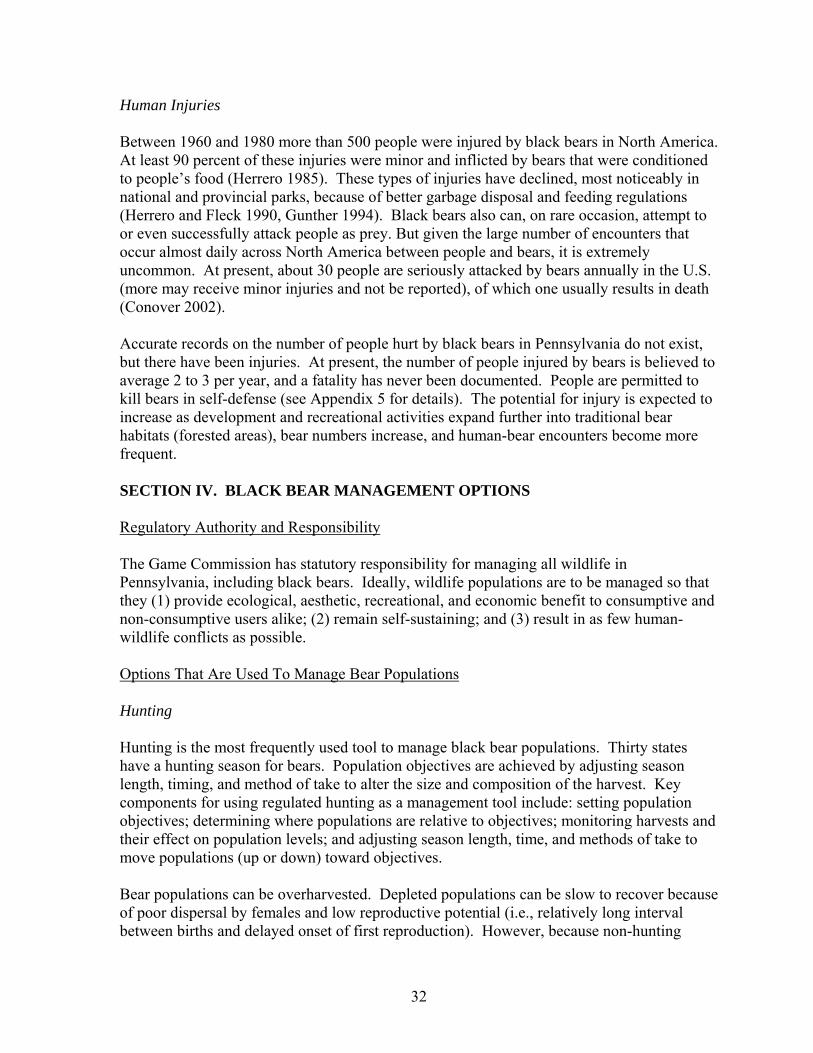
Human Injuries Between 1960 and 1980 more than 500 people were injured by black bears in North America. At least 90 percent of these injuries were minor and inflicted by bears that were conditioned to people’s food (Herrero 1985). These types of injuries have declined, most noticeably in national and provincial parks, because of better garbage disposal and feeding regulations (Herrero and Fleck 1990, Gunther 1994). Black bears also can, on rare occasion, attempt to or even successfully attack people as prey. But given the large number of encounters that occur almost daily across North America between people and bears, it is extremely uncommon. At present, about 30 people are seriously attacked by bears annually in the U.S. (more may receive minor injuries and not be reported), of which one usually results in death (Conover 2002). Accurate records on the number of people hurt by black bears in Pennsylvania do not exist, but there have been injuries. At present, the number of people injured by bears is believed to average 2 to 3 per year, and a fatality has never been documented. People are permitted to kill bears in self-defense (see Appendix 5 for details). The potential for injury is expected to increase as development and recreational activities expand further into traditional bear habitats (forested areas), bear numbers increase, and human-bear encounters become more frequent. SECTION IV. BLACK BEAR MANAGEMENT OPTIONS Regulatory Authority and Responsibility The Game Commission has statutory responsibility for managing all wildlife in Pennsylvania, including black bears. Ideally, wildlife populations are to be managed so that they (1) provide ecological, aesthetic, recreational, and economic benefit to consumptive and non-consumptive users alike; (2) remain self-sustaining; and (3) result in as few human-wildlife conflicts as possible. Options That Are Used To Manage Bear Populations Hunting Hunting is the most frequently used tool to manage black bear populations. Thirty states have a hunting season for bears. Population objectives are achieved by adjusting season length, timing, and method of take to alter the size and composition of the harvest. Key components for using regulated hunting as a management tool include: setting population objectives; determining where populations are relative to objectives; monitoring harvests and their effect on population levels; and adjusting season length, time, and methods of take to move populations (up or down) toward objectives. Bear populations can be overharvested. Depleted populations can be slow to recover because of poor dispersal by females and low reproductive potential (i.e., relatively long interval between births and delayed onset of first reproduction). However, because non-hunting
32
mortality is often low, they do rebound if factors that allowed overexploitation are corrected. Closing the bear season in 1977 and 1978, maintaining short seasons thereafter, and creating a bear license in 1981 are examples of how overexploitation was corrected in Pennsylvania. Nonetheless, despite having the ability to reverse declining populations, conservative hunting seasons are preferred to avoid repeated cycles of overharvest and recovery. High adult mortality, which leads to a population dominated by young animals, can alter productivity by reducing the number of females that are of reproductive age and average litter size, since young bears tend to produce smaller litters. Therefore, vulnerability of adult females is an important consideration when setting the length, timing, and methods of hunting. A high percentage or increasing trend in female harvest is indicative of overharvest. Social considerations, such as a desire for trophy-size animals, satisfaction with success rates, perceived quality of hunting experiences, cub orphaning, and disturbance of other recreationists or wildlife, also are important factors when determining season parameters. If populations are below management objectives, hunting regulations can be adjusted to reduce female harvest. The simplest change is to shorten seasons or restrict the number of hunters. However, other alternatives that maintain hunting opportunity exist. For example, fall seasons can be opened after females start to den, which protects them from harvest. In Pennsylvania, the percent of solitary (pregnant) females denned during the traditional late November season may approach 50 percent some years (Alt et al. 1976, Alt 1980c). Likewise, spring seasons can be set to start before females emerge from dens, but after males and subadults are active. Some states also restrict the harvest of cubs, small bears, or bears visibly accompanied by cubs to protect females. However, the use of “cub laws” has been abandoned in Pennsylvania, because cubs are indistinguishable from subadults under most hunting conditions (Alt 1980a). If populations are above management objectives, regulations should be adjusted to increase harvest. Larger harvests can be achieved by making seasons longer, adding special seasons, allowing hunting methods that improve success (e.g., baiting), and/or overlapping seasons with other hunting opportunities (e.g., deer hunting). The most common black bear hunting method in Pennsylvania is organized drives. Hunting party size is restricted by regulation to 25 people or less. Still hunting, where hunters move through the woods alone or wait for game to come by, also is popular. The majority of bear hunters carry a rifle although archery equipment, crossbows, muzzleloaders, handguns, and shotguns are permitted in most parts of the state. Below is a discussion of four additional hunting methods that are currently not permitted in Pennsylvania, but are used elsewhere in North America. Hound Hunting In hound hunting, bears are pursued by dogs and harvested after being treed or while passing another hunter. Forty-two percent of states with open bear hunting seasons permit the use of dogs (see Appendix 7). Pennsylvania banned the use of dogs for bear hunting in 1935. Pursuit with hounds outside of the hunting season (i.e., training) also is prohibited.
33
Hound hunting is popular because it increases hunter success, allows hunters to be selective in what they kill, and provides a gratifying opportunity for dog owners to train and watch their animals. In many places where it is permitted, hound hunting has become a strong part of the bear hunting culture. In some areas, social hunts are the norm, with 10 or more hunters and twice that many hounds involved (DuBrock et al. 1978, Elowe 1990). Hunting with hounds generally improves hunter success, but numerous variables are important and success is not guaranteed. Experience of the hounds, bear behavior, terrain, weather, time of year, habitat conditions, and ability of houndsmen to locate fresh tracks for pursuit moderate success. An average to good pack of hounds with knowledgeable handlers may tree 30 percent of the bears they actually run (Elowe 1990). In Michigan, where hound hunting is popular, houndsmen had a success rate of 17 to 32 percent, depending on whether or not bait was used to initiate the chase, whereas still hunters had a success rate of 11 percent (Peyton 1989). In Virginia, between 11 percent and 20 percent of houndsmen are successful (Inman and Vaughan 2002), and a similar success rate was reported for New Hampshire (Litvaitis and Kane 1994). Because much of Pennsylvania’s bear habitat is extensively roaded and composed of linear ridges with open understories, pursuit with hounds would significantly increase hunter success. The current success rate without hounds is between 2 and 3 percent, and at this rate 20 percent of the bear population is harvested. Steps would need to be taken to limit harvest if hound hunting was permitted; including possible changes to the existing season structure and license allocations. There are several biological concerns related to hound hunting. Female black bears have smaller home ranges than males, which can make them more vulnerable to hound hunting in highly-roaded areas. Females with cubs are especially vulnerable because they are reluctant to leave cubs and repeatedly circle back or quickly tree (Allen 1984). However, houndsmen can be selective for males and release smaller bears that are typically female, although 40 percent of houndsmen in a Virginia survey did not or could not identify sex of treed bears (Inman and Vaughn 2002). Pursuit with hounds also may impose stress, disrupt reproduction, and alter foraging effectiveness of bears or other wildlife. Family groups may become separated, or cubs occasionally killed by hounds. However, several studies have concluded that most biological impacts from hound hunting are minimal (Allen 1984, Massopust and Anderson 1984), and the issue of hound hunting is largely social. Hunting bears with hounds has come under considerable public attack, or at least, hard scrutiny (Elowe 1990). In 5 of 7 states where the issue was brought to public ballot, bear hunting with hounds was closed (Inman and Vaughn 2002). Some people view it as unethical because of a perceived advantage over the bear. Chases may disturb recreationists, including hunters, and cross private lands posted against trespass. Hound hunting can be highly visible. People may see or hear chases, or see vehicles with packs of dogs searching for tracks. Finally, hound hunting is usually not well received by non-hound hunters. In a survey of Michigan bear hunters, a large majority of still hunters (those that did not use bait
34
or hounds) believed using dogs was an unethical method of hunting that took an unfair number of bears, interfered with their own hunting, and should be stopped (Peyton 1989). Pursuit-only seasons are allowed in some jurisdictions to provide training opportunities. They have not been permitted in Pennsylvania to minimize disturbance of wildlife, recreationists, property owners, and to prevent illegal taking of bear or possible separation of bear families. More importantly, though, because hound hunting is not a legal hunting method in Pennsylvania, a training season has not been considered necessary. Some people have suggested that training seasons are beneficial because they reduce success rates (pursued bears become harder to harvest) and can be used to chase nuisance bears from problem areas (e.g., cornfields). Baiting With bait hunting, a steady supply of food is used to attract bears closer to hunters or make them more visible. Bait site location and bait replenishment routines are designed to encourage visitation during daylight hours. Baits are usually placed prior to hunting near them, and several sites may be maintained simultaneously. Ten states that permit bear hunting allow baiting (38 percent; Appendix 7). Baiting is not allowed in Pennsylvania (Appendix 5). Baiting is an effective harvest method with hunter success rates commonly ranging from 25 to 50 percent. However, success rates vary regionally and seasonally according to fluctuations in natural food crops, bear densities, habitat characteristics, and prevalence of commercial guides and outfitters (McLaughlin and Smith 1990). Like hound hunting, the legalization of bait in Pennsylvania would be a concern because of the potential for greater success rates, and steps would likely have to be taken to limit harvest. Although baiting is widely practiced, it has received a considerable amount of public criticism over issues of fair chase and conflicts with other land uses (McLaughlin and Smith 1990). Some people consider the use of bait as unethical and an unfair advantage. Recreationists who encounter baits may consider them unsightly, and littering from baits can occur. Baiting may condition bears to associate people with food and possibly lead to increased nuisance bear problems, or attract bears to areas where they have a greater chance of causing trouble. Baiting also may increase bear-vehicle collisions and the potential for disease transmission. Finally, baiting may invite more poaching activity, because hunters see more bears. However, it is important to note that baiting conflicts are highly dependent on where and how bait is used. Baiting can be a reliable method for increasing hunter selectivity. Bears that come to bait are usually visible for longer periods and provide better opportunity for judging size and sex than bears seen by still hunters. Baiting also may augment natural food supplies and mitigate the effects of poor food years. In some places across North America, harvest objectives are difficult to achieve without the use of bait, because hunter numbers or success is too low, making it a necessary management tool. Baiting also may provide increased hunting success
35
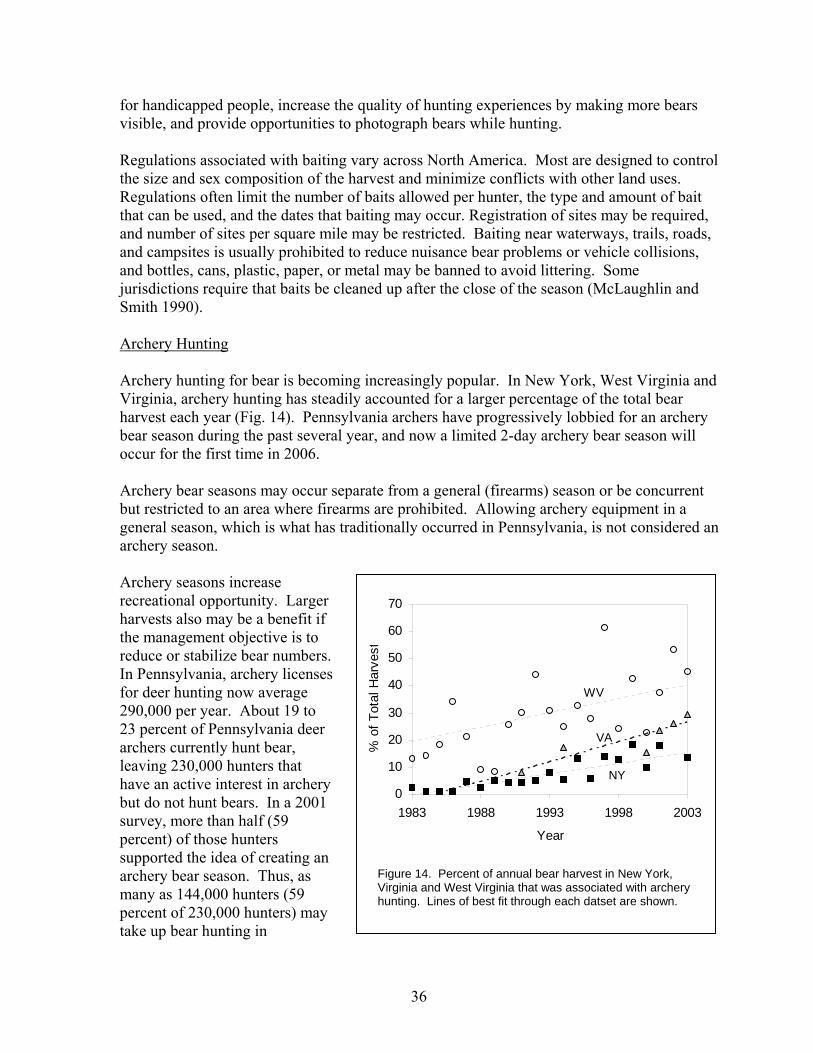
for handicapped people, increase the quality of hunting experiences by making more bears visible, and provide opportunities to photograph bears while hunting. Regulations associated with baiting vary across North America. Most are designed to control the size and sex composition of the harvest and minimize conflicts with other land uses. Regulations often limit the number of baits allowed per hunter, the type and amount of bait that can be used, and the dates that baiting may occur. Registration of sites may be required, and number of sites per square mile may be restricted. Baiting near waterways, trails, roads, and campsites is usually prohibited to reduce nuisance bear problems or vehicle collisions, and bottles, cans, plastic, paper, or metal may be banned to avoid littering. Some jurisdictions require that baits be cleaned up after the close of the season (McLaughlin and Smith 1990). Archery Hunting Archery hunting for bear is becoming increasingly popular. In New York, West Virginia and Virginia, archery hunting has steadily accounted for a larger percentage of the total bear harvest each year (Fig. 14). Pennsylvania archers have progressively lobbied for an archery bear season during the past several year, and now a limited 2-day archery bear season will occur for the first time in 2006. Archery bear seasons may occur separate from a general (firearms) season or be concurrent but restricted to an area where firearms are prohibited. Allowing archery equipment in a general season, which is what has traditionally occurred in Pennsylvania, is not considered an archery season. Archery seasons increase recreational opportunity. Larger harvests also may be a benefit if the management objective is to reduce or stabilize bear numbers. In Pennsylvania, archery licenses for deer hunting now average 290,000 per year. About 19 to 23 percent of Pennsylvania deer archers currently hunt bear, leaving 230,000 hunters that have an active interest in archery but do not hunt bears. In a 2001 survey, more than half (59 percent) of those hunters supported the idea of creating an archery bear season. Thus, as many as 144,000 hunters (59 percent of 230,000 hunters) may take up bear hunting in
0
10
20
30
40
50
60
70
1983 1988 1993 1998 2003
Year
% o
f Tot
al H
arve
st
NY
WV
VA
Figure 14. Percent of annual bear harvest in New York, Virginia and West Virginia that was associated with archery hunting. Lines of best fit through each datset are shown.
36
Pennsylvania if an archery season was created, but actual participation would depend on season timing, length, and location. Two earlier surveys in Pennsylvania had similar results. In 1990, seven public hearings focusing on bear management were held throughout the state during January and February. Attendants were able to submit comments on proposed regulation changes, of which one dealt with creating an archery bear season. Forty-six percent of the comments supported the change (Alt 1990). In 1995, hunters receiving the annual Game Take Survey were asked if they supported a primitive-sporting arms season for bear, which would be limited to archery and/or muzzleloading firearms. Thirty-eight percent supported the change (PGC unpublished data). There are potential costs to adding an archery bear season. If too many hunters participate or success rates are too high, steps would need to be taken to limit the total harvest. They may include restricting the number of licenses available, developing an allocation system that apportions licenses between multiple seasons, or adjusting season dates (shorter or later) to reduce hunter success. Yet, in the 1990 bear management hearings, more than 79 percent of comments favored leaving the three-day bear season unchanged (Alt 1990). Check stations, which are manned by Game Commission personnel, may need to be open longer, and depending on season dates, adding another season may limit research or nuisance relocation work, because Game Commission personnel are prohibited from immobilizing black bears within 30 days of a hunting season. Finally, some segments of the public are concerned that archery hunting may increase wounding rates or illegal baiting activity, but little research has been done to confirm it. Archery bear harvests tend to be correlated with fall mast (acorn) conditions. In years when mast conditions are poor, archery harvests go up, and vice versa in years when mast is abundant (Martin 2001, Igo 2001). This trend is opposite of what is observed for firearms seasons. Thus, a possible outcome from adding an archery season may be fewer low-harvest years. The affect of having periodic low-harvest years is not well understood, but they may mitigate the impact of periodic high-harvest years. Trapping Trapping usually accounts for only a small proportion of the total harvest where it is permitted. In eastern North America, four providences in Canada (Quebec, Nova Scotia, Newfoundland, Ontario) and one state (Maine) allow bear trapping. Trapping is not permitted in Pennsylvania. The advantages of trapping are increased recreational opportunity, better success among hunters, and increased opportunity to harvest wary bears that may only be active at night. The use of traps can allow a hunter to be successful when other commitments such as work or family prevent him or her from participating in a traditional firearms season. When used in combination with bait, trapping can result in high success, which would be a concern if permitted in Pennsylvania.
37
The disadvantages with bear trapping are primarily social. It may be viewed as unfair, lacking in fair-chase, cruel and inhumane, or a public safety risk. Where it is permitted, regulations often restrict the size, type, and number of traps that can be set to prevent capture of more than one bear. Signs and fencing may be required around the trap to alert people, and trap modifications may be required to prevent traps from closing on non-target animals like pets or small bears. Reservoir Areas Reservoir areas are places where bears are lightly hunted or not hunted at all and bear abundance is limited only by the capacity of the habitat. Reservoir areas help to replenish bear numbers in adjacent areas where hunting pressure may be high by providing a steady supply of dispersing bears. However, because female bears rarely disperse far, the opportunity to influence productivity (number of young produced) is limited. Most bears that disperse from reservoir areas are male. Reservoir areas, known as Wildlife Refuge Areas, were an important part of game management history in Pennsylvania (Kosack 1995). Today, reservoir areas where hunting is purposefully restricted to propagate game are not used, but reservoir-like areas exist in places because poor road access, trespass postings, regulations (e.g., safety zones or some Natural Areas and State Parks), or private leasing of hunting rights restrict hunter access. For example, in central Pennsylvania on the southern portion of the Sproul State Forest, which is a popular area for bear hunting, 73 percent of bear hunters hunt on 56 percent of the landscape – the area that is within one-half mile of a road. Hunter densities in these areas are approximately 1.4 hunters per square mile. On the remaining land (44 percent of the forest) hunter densities drop to 0.5 hunters per square mile, in effect creating reservoir areas (D. Diefenbach, PGC/PSU unpublished data). Other similar scenarios are believed to exist throughout much of the northcentral bear range. Immunocontraception Immunocontraception uses an animal’s own immune system to disrupt reproduction. Vaccines are administered to the animal that fool the immune system into producing antibodies that interfere with sperm formation, egg development, fertilization, or implantation. Vaccines that target the egg’s zona pellucida (ZP), the layer surrounding a mature mammalian egg, have received the most attention (Fagerstone et al. 2002). Injections of ZP proteins into the bloodstream cause the immune system to identify the proteins as foreign bodies and develop antibodies against them. This, in turn, interferes with sperm penetration of the ZP (Conover 2002). A common source of ZP protein is pig ovaries, and this type of ZP is referred to as porcine zona pellucida (PZP). Current immunocontraceptive technology appears to be best suited for captive-animal studies with limited field applications (Miller et al 1998, Fagerstone et al. 2002). The greatest drawbacks to using it on free-ranging wildlife are (1) vaccinating enough animals to produce a population effect, (2) recognizing which animals have been vaccinated, and (3) resolving
38
possible human health effects from eating vaccinated animals. In some cases, re-dosing may be needed at multiple-year intervals to maintain contraception. More importantly, though, immunocontraception does not reduce the current population size, it only reduces recruitment of new animals, and other population reduction methods may still be required. Some models have suggested that greater than 80 percent of the female bears in an area would need to be vaccinated before a population effect could be sustained. This would be a nearly impossible goal given that black bears are solitary, secretive, widely dispersed animals that live in relatively thick habitats. Presently, no ZP vaccines have been given FDA approval for use in bears. Habitat Manipulations Habitat condition influences the abundance and diversity of food, which can affect reproductive rates, survival, hunter success rates, nuisance bear activity, and the number of bear-vehicle collisions. Poor food availability usually reduces litter size, increases the age of sexual maturity, and encourages bears to travel more looking for food (i.e., more nuisance activity and vehicle collisions), whereas the opposite occurs when food is consistently abundant. Habitat diversity can help minimize the effects of key food crop failures by providing alternative foods, and it ensures that other habitat needs, such as adequate escape cover, are met. Habitat manipulations that improve food availability, diversity, or provide escape cover can bolster bear populations, and also may alleviate some human-bear conflicts. Improving the regeneration of hard mast trees (e.g., oaks), planting soft mast trees and shrubs, diversifying forests with multi-age stands, maintaining openings for berry-producing plants, and protecting patches of dense hemlock, mountain laurel, or swamps are all ways that forests can be improved for bears in Pennsylvania. Conversely, forest management practices that fragment bear habitat or remove key foods (e.g., overharvesting mature oak trees) are detrimental. Forest insect pests and pathogens can impact bear populations if they kill or inhibit regeneration of mast-producing trees and shrubs. For example, Gypsy moth (Lymantria dispar), beech scale, and dogwood anthracnose (Discula sp.) may eventually reduce the availability of important foods for bears in Pennsylvania. Likewise, overbrowsing by white-tailed deer, acid rain, conversion of oak-dominated stands into maple/cherry-dominated stands after cutting, and excessive timber harvesting can reduce the abundance of oak trees through time. Management practices that mitigate or avoid these problems are beneficial to bears. Costs associated with habitat manipulations or pest/pathogen control vary depending on the activity. But in many cases, adding bears into current forest planning should be inexpensive, because most forest management practices and goals are compatible with bear management. Moreover, many wildlife species, in addition to bears, benefit from promoting mast-producing shrubs and trees. The real challenge with managing forests to improve habitat for bears is that 78 percent of Pennsylvania’s forestlands (>12.4 million acres) is privately
39
owned. Fortunately, the Game Commission does own 1.4 million acres of State Game Lands where the primary land management goal is to improve habitat conditions for wildlife. Orphan Cub Rehabilitation and Adoptions Black bear cubs can become orphans if they are inadvertently separated from a litter or the mother is killed (e.g., hit by car, removed due to nuisance activity, shot in self-defense, or killed illegally). Once an orphan is reported to the Game Commission, there are five options: (1) return it immediately to the wild without a mother; (2) add it to another litter of cubs (adoption); (3) temporarily hold it in captivity and release without a mother once it develops more; (4) place it in permanent captivity; or (5) euthanasia. Returning orphaned cubs to the wild (options 1-3) has little biological significance because so few are handled each year, but it is preferred because public support for permanent captivity or euthanasia is lacking. Several techniques for reintroducing orphans have been reported (Clarke et al. 1980, Alt 1984b, Alt and Beecham 1984, Carney and Vaughan 1987, Siebert et al. 1999, Clark et al. 2002b). Adoptions, where a cub is added to another bear’s litter, can occur by dropping orphans into a den, adding them to a family of bears captured and immobilized in a culvert-style trap, or by treeing free-ranging cubs and sending the orphan up the tree with them. These techniques are primarily used if the orphan is less than 4 months old because older, free-ranging cubs are often hard to tree or capture. In Pennsylvania, we attempt to place healthy, normally developed cubs with an adoptive litter if it is orphaned before mid May. Cubs can be released without a mother when an adoptive litter is unavailable, but survival may be better if releases are timed when a natural food source is abundant. In Pennsylvania, we usually hold orphans for 1-2 months when an adoptive litter is unavailable and release them during July when blueberry crops are ripe. Of 43 cubs we released in July without a mother, 22 or 51 percent were known to have survived because they where later recaptured or recovered in a hunting season (unpublished PGC data). Orphan cubs also can be held through the first denning period and released the following spring as year-old bears. But this technique is not used in Pennsylvania because of the increased risk of habituating captive bears to people, which may encourage nuisance bear problems after they are released. Releasing orphan cubs can be costly. An adequate sample of female bears must be fitted with radio-collars so that adoptive litters can be readily found if needed. Radio-collared bears should be located periodically, and they must be visited annually at den sites to maintenance radio-collars, readjust collar fit, and determine if cubs are present. Orphans should be placed with an adoptive litter as soon as possible to prevent them from imprinting on people. Thus, personnel may need to work extra hours on short notice to transport cubs, locate a suitable litter, and carry out the release. If orphans are not going to be placed with an adoptive litter, a temporary holding facility must be maintained with personnel available for daily care of cubs and food purchased or collected. Nevertheless, despite these costs, orphan cub reintroductions are done because of social pressure to avoid euthanasia or permanent captivity, and they are likely to continue in Pennsylvania if adequately funded.
40
Options That Are Used To Manage Nuisance Bears Information and Education Disseminating information about bears is a common and potentially successful means of reducing human-bear conflicts. Information can be offered on how to deter unwanted bears from returning (reactive), or it can be distributed to help people prevent conflicts from developing (proactive). People tend to view bears as intelligent, culturally significant, charismatic, and similar to humans (Kellert 1994). This contributes to human-bear conflicts because people are tempted to encourage, or at least not discourage, viewing opportunities around their homes. They may feed bears or make no effort to keep bears from accessing garbage and other foods until significant property damage occurs. Furthermore, the number of people moving into bear habitats is growing. Many of these people come from urban centers that lack bears, so they have little knowledge about preventing human-bear conflicts. Bears also are recolonizing new areas where people have little knowledge about them. The result is that education and information needs are continuous and growing. Informational materials may include advice on how to identify and remove attractants, build an electric fence, or why wildlife feeding is problematic. Guidance on how to interpret bear behavior, react in an encounter, and what to expect when living in bear country also are important. The importance of managing bear populations and what the consequences are if bears are allowed to access food should be clear. There are several ways to distribute advice and information. Game Commission employees routinely provide advice over the phone and in person every time a person contacts the agency about a bear complaint. Unfortunately, though, this only educates people after they have had a problem and does not provide guidance to people who may experience a problem in the future. This is why information materials and outreach efforts should target the general public wherever bears are found, not just individuals reporting conflicts. Venues may include the Internet, programs to school or civic groups, newspapers, radio, brochures, and videos. The Game Commission currently uses all of these methods, but improving large-audience outreach efforts was recently identified as a need (Ternent et al. 2001). The costs associated with developing and circulating information and education materials can be significant. During the 2004-2005 fiscal year, expenditures in the Game Commission’s Bureau of Information and Education totaled $3.6 million (5.5 percent of the agency’s budget), although sales of printed materials and videos generated some revenue. Food and Waste Management Most human-bear conflicts occur because bears have discovered a food source near residential areas. These foods may be the result of intentional wildlife feeding (e.g., birdfeeders or other types of feeders), pets (e.g., unattended food dishes), gardens and fruit trees, compost piles, seasonal decorations (e.g., cornstalks or pumpkins in the fall), or
41
garbage. Eliminating these attractants can discourage bears from frequenting an area and learning to associate people with food. Once bears are rewarded with food, they become conditioned to expect similar rewards in other similar situations. Food-conditioned bears, in an attempt to exploit their newly discovered food resource, will approach people and homes to search for more food. They can lose their fear of people and become bold at acquiring food, leading to an increased risk of property damage or human injury. Policies that reduce the availability of food and waste around homes have obvious benefits for reducing human-bear conflicts. The Game Commission adopted a regulation in January 2003 that prohibits the intentional and, in certain situations, unintentional feeding of bears statewide. Similar regulations exist in New York, Virginia, New Jersey, and other jurisdictions. Almost all national parks in the United States have laws that prohibit the feeding of wildlife, and nuisance bear conflicts have decreased substantially since their passage, despite increases in the number of visitors and bears (Gunther 1994). Thus, maintaining or improving no-feeding regulations should help to alleviate nuisance bear conflicts in Pennsylvania (Ternent et al. 2001). Other activities that could reduce food and waste around homes include: providing assistance to communities for purchase of bear-resistant garbage containers; changing municipal codes to require better handling of garbage, and intensifing efforts to inform people about how to eliminate food attractants. The cost of better food and waste management may be high depending on the activity. Cost is commonly cited as the reason for not replacing traditional dumpsters with bear-resistant models, and some people may perceive feeding bans as recreational or private-rights infringements. The benefits, however, from reducing human-bear conflicts can be significant. Lowering the number of human-bear conflicts reduces property damage caused by bears, lessens the potential for human injuries, and saves time and money used to resolve conflicts. Thus, food and waste management is applicable to bear management in Pennsylvania. Aversive Conditioning Animals can be conditioned to avoid nuisance behaviors by exposing them to uncomfortable (pain, noise, nausea, or harassing) stimuli whenever they occur. The learning paradigm is referred to as aversive conditioning and is frequently suggested as a tool for reducing nuisance bear problems. However, it is not widely used in Pennsylvania, and there have been few studies done to evaluate its effectiveness at altering long-term behaviors. Common conditioning agents include red pepper capsaicin sprays (Hunt 1984, Rogers 1984, Hyngstrom 1994), rubber bullets (Gillin et al. 1994, Schirokauer and Boyd 1998), emetic compounds (Colvin 1975, Ternent and Garshelis 1999), and electric shock. The process of capturing and immobilizing a bear also has been suggested as aversive (Clark 1999).
42
One advantage of aversive conditioning is that conflicts can be resolved without removing the animal. This would be important if management programs are trying to preserve or increase bear numbers, offending animals are highly valued, trap shy or too expensive to move, suitable relocation sites are limited, or public sentiment disapproves of removal. Some of these scenarios exist in Pennsylvania. If bears must be relocated, aversive conditioning can occur at the time of release. Unfortunately, bears treated with aversive conditioning sometimes learn to only avoid a site rather than a behavior. They may avoid a particular backyard or campground where treated, but continue to cause problems at a new location. Aversive conditioning also can be ineffective on strongly habituated bears (McCullough 1982), making it better suited for young or first-time offenders, and some techniques might be perceived as cruel. Aversive conditioning also can be labor- and time-intensive, or impractical because of safety. Moreover, aversive conditioning addresses only the symptoms of nuisance activity (bears visiting a site) and not the cause (food availability). Thus, food attractants must be removed to maintain aversions or else treated bears will learn that negative stimuli are temporary, and new bears also may be attracted. Despite the shortcomings, aversive conditioning is becoming a popular component of bear management programs throughout North America, and increasing its use in Pennsylvania has been recommended (Ternent et al. 2001). The costs associated with aversive conditioning depend on the techniques used and how they are applied. Some techniques require training, special equipment, and supplies, and all are likely to increase the time spent handling a nuisance bear. Additional funding will therefore be needed if its use is expanded in Pennsylvania. Repellents Repellents are devices or substances that encourage a bear to leave an area. They are similar to aversive conditioning, except that pairing between stimuli and behavior may be less obvious and not lead to learned avoidance. Examples include ammonia, loud noises, motion-activated lights or water-spraying devices, and red pepper (Capsaicin) sprays used to repel attacking bears. Capsaicin, sprayed directly on mucus membranes of the mouth, nose, and eyes, is effective at repelling black bears (Hunt 1984, Rogers 1984); however, the odor of Capsaicin may attract bears if sprayed on other objects (Smith 1998). Capsaicin spray is primarily used to divert charging bears at close range (<30 feet), and is widely available to people recreating in bear habitats. Bears have been successfully repelled from bait sites using ammonia (Hunt 1984), but some eventually ignore it. For example, bears that repeatedly raided garbage cans in Juneau, Alaska were not repelled when cans were treated with ammonia (McCarthy and Seavoy 1994). Ammonia is widely available and occasionally recommended by the Game Commission for repelling nuisance bears from backyards.
43
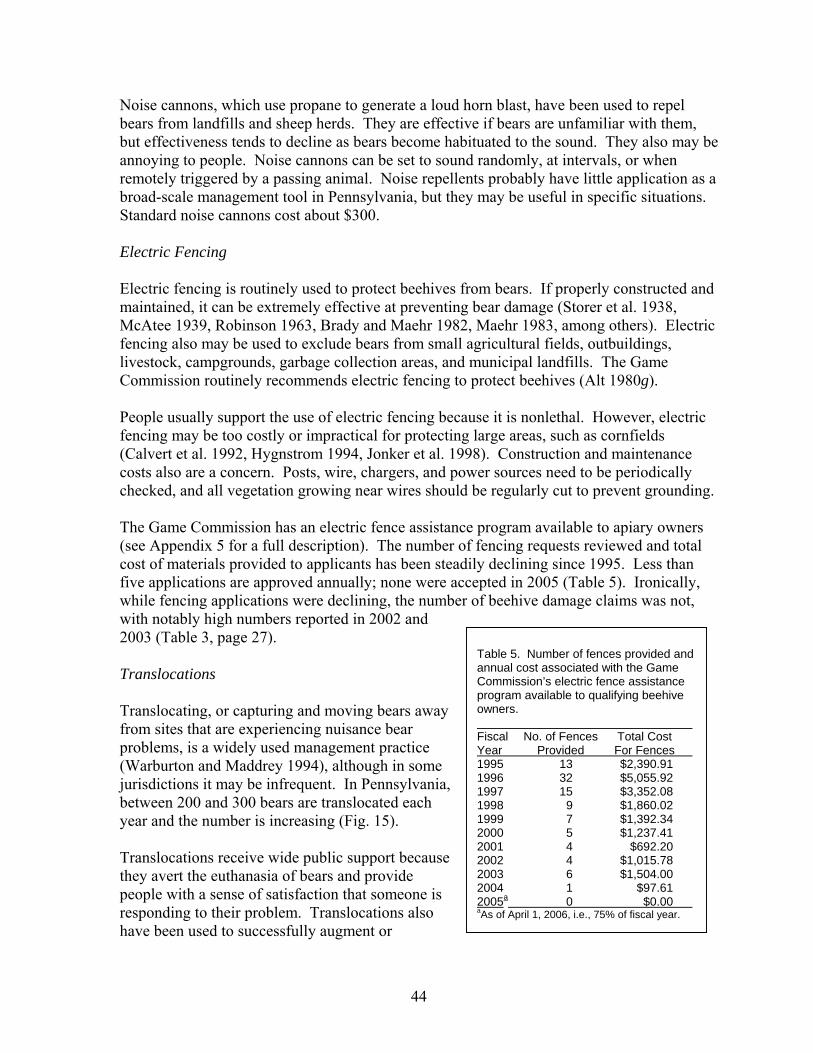
Noise cannons, which use propane to generate a loud horn blast, have been used to repel bears from landfills and sheep herds. They are effective if bears are unfamiliar with them, but effectiveness tends to decline as bears become habituated to the sound. They also may be annoying to people. Noise cannons can be set to sound randomly, at intervals, or when remotely triggered by a passing animal. Noise repellents probably have little application as a broad-scale management tool in Pennsylvania, but they may be useful in specific situations. Standard noise cannons cost about $300. Electric Fencing Electric fencing is routinely used to protect beehives from bears. If properly constructed and maintained, it can be extremely effective at preventing bear damage (Storer et al. 1938, McAtee 1939, Robinson 1963, Brady and Maehr 1982, Maehr 1983, among others). Electric fencing also may be used to exclude bears from small agricultural fields, outbuildings, livestock, campgrounds, garbage collection areas, and municipal landfills. The Game Commission routinely recommends electric fencing to protect beehives (Alt 1980g). People usually support the use of electric fencing because it is nonlethal. However, electric fencing may be too costly or impractical for protecting large areas, such as cornfields (Calvert et al. 1992, Hygnstrom 1994, Jonker et al. 1998). Construction and maintenance costs also are a concern. Posts, wire, chargers, and power sources need to be periodically checked, and all vegetation growing near wires should be regularly cut to prevent grounding. The Game Commission has an electric fence assistance program available to apiary owners (see Appendix 5 for a full description). The number of fencing requests reviewed and total cost of materials provided to applicants has been steadily declining since 1995. Less than five applications are approved annually; none were accepted in 2005 (Table 5). Ironically, while fencing applications were declining, the number of beehive damage claims was not, with notably high numbers reported in 2002 and 2003 (Table 3, page 27).
Table 5. Number of fences provided and annual cost associated with the Game Commission’s electric fence assistance program available to qualifying beehive owners. Fiscal No. of Fences Total Cost Year Provided For Fences 1995 13 $2,390.91 1996 32 $5,055.92 1997 15 $3,352.08 1998 9 $1,860.02 1999 7 $1,392.34 2000 5 $1,237.41 2001 4 $692.20 2002 4 $1,015.78 2003 6 $1,504.00 2004 1 $97.61 2005a 0 $0.00 aAs of April 1, 2006, i.e., 75% of fiscal year.
Translocations Translocating, or capturing and moving bears away from sites that are experiencing nuisance bear problems, is a widely used management practice (Warburton and Maddrey 1994), although in some jurisdictions it may be infrequent. In Pennsylvania, between 200 and 300 bears are translocated each year and the number is increasing (Fig. 15). Translocations receive wide public support because they avert the euthanasia of bears and provide people with a sense of satisfaction that someone is responding to their problem. Translocations also have been used to successfully augment or
44
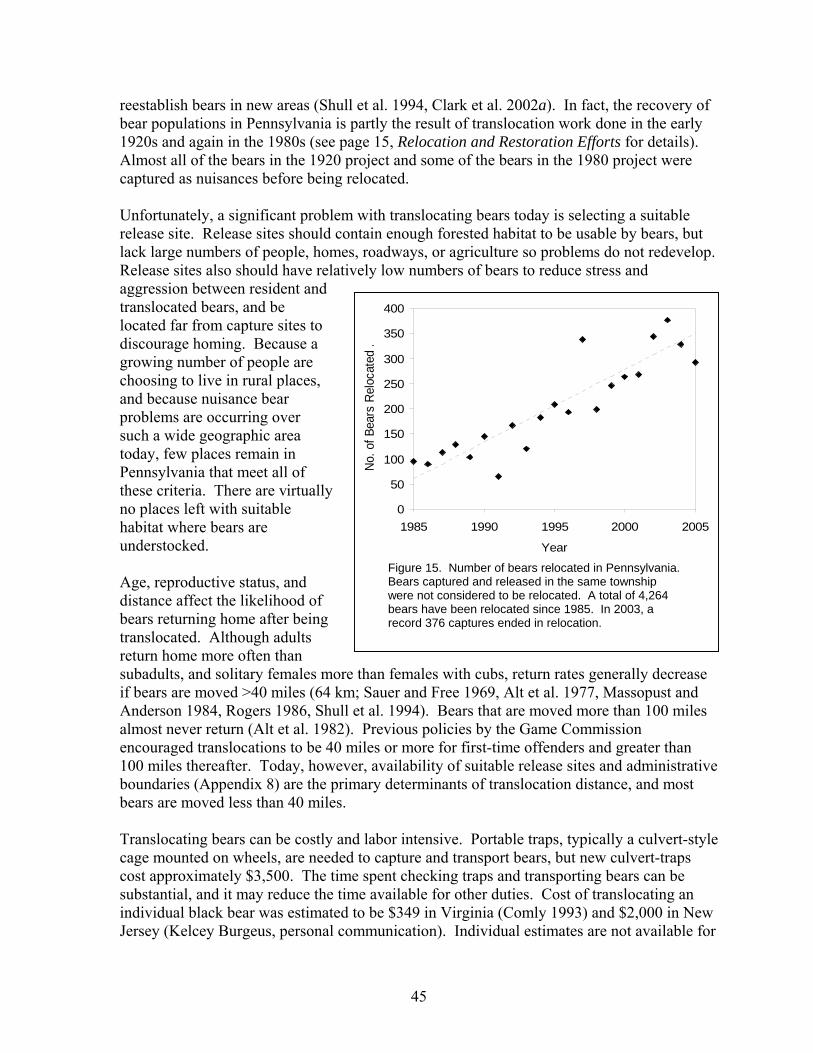
reestablish bears in new areas (Shull et al. 1994, Clark et al. 2002a). In fact, the recovery of bear populations in Pennsylvania is partly the result of translocation work done in the early 1920s and again in the 1980s (see page 15, Relocation and Restoration Efforts for details). Almost all of the bears in the 1920 project and some of the bears in the 1980 project were captured as nuisances before being relocated. Unfortunately, a significant problem with translocating bears today is selecting a suitable release site. Release sites should contain enough forested habitat to be usable by bears, but lack large numbers of people, homes, roadways, or agriculture so problems do not redevelop. Release sites also should have relatively low numbers of bears to reduce stress and aggression between resident and translocated bears, and be located far from capture sites to discourage homing. Because a growing number of people are choosing to live in rural places, and because nuisance bear problems are occurring over such a wide geographic area today, few places remain in Pennsylvania that meet all of these criteria. There are vno places left with suitable habitat where bears are understocked.
irtually
Age, reproductive status, and distance affect the likelihood of bears returning home after being translocated. Although adults return home more often than subadults, and solitary females more than females with cubs, return rates generally decrease if bears are moved >40 miles (64 km; Sauer and Free 1969, Alt et al. 1977, Massopust and Anderson 1984, Rogers 1986, Shull et al. 1994). Bears that are moved more than 100 miles almost never return (Alt et al. 1982). Previous policies by the Game Commission encouraged translocations to be 40 miles or more for first-time offenders and greater than 100 miles thereafter. Today, however, availability of suitable release sites and administrative boundaries (Appendix 8) are the primary determinants of translocation distance, and most bears are moved less than 40 miles.
Figure 15. Number of bears relocated in Pennsylvania. Bears captured and released in the same township were not considered to be relocated. A total of 4,264 bears have been relocated since 1985. In 2003, a record 376 captures ended in relocation.
0
50
100
150
200
250
300
350
400
1985 1990 1995 2000 2005
Year
No. o
f Bea
rs R
eloc
ated
.
Translocating bears can be costly and labor intensive. Portable traps, typically a culvert-style cage mounted on wheels, are needed to capture and transport bears, but new culvert-traps cost approximately $3,500. The time spent checking traps and transporting bears can be substantial, and it may reduce the time available for other duties. Cost of translocating an individual black bear was estimated to be $349 in Virginia (Comly 1993) and $2,000 in New Jersey (Kelcey Burgeus, personal communication). Individual estimates are not available for
45

Pennsylvania, but Game Commission employees logged 7,884 hours during 2002 responding to nuisance bear complaints, which often resulted in the relocation of a bear. Translocations can have short-term effects on reproduction. In Virginia, translocated females failed to produce cubs the first winter after being moved but reproduced normally thereafter (Comly 1993, Godfrey 1996). Opposition to translocations also may come from local hunters who fear that their chance of harvesting a bear will be reduced. Bears that are moved may experience greater mortality rates from vehicle collisions as they attempt to return home (Alt et al. 1982), and translocations that require bears to be immobilized cannot be performed within 30 days of a hunting season to avoid residual drugs in harvested bears.
Despite the problems, translocations are effective at reducing nuisance bear activity (McArthur 1981, Fies et al. 1987), including in Pennsylvania (Alt et al. 1977, Alt 1980h, McLaughlin et al. 1981). Some bears are only a brief nuisance when dispersing or when poor natural food crops urge them closer to people, and an occasional translocation resolves the problem. Although adult bears frequently return after being moved, many avoid the location that led to their capture (Alt 1980h, McLaughlin et al. 1981). Translocations also provide time to secure/remove attractants, harvest crops that were being damaged, and avoid the destruction of bears until hunters have an opportunity to legally harvest them, which is considered a better use of the resource. Thus, translocations are a common management practice of the Game Commission that will likely continue if funding is adequate (see Appendix 6 for current policy). Euthanasia Euthanasia is a relatively uncommon management practice for black bears, except for animals that present an immediate threat to human safety or have repeatedly been involved in human-bear conflicts (Warburton and Maddrey 1994). In general, people tend to prefer non-lethal options for bears that are not chronic nuisances. The Game Commission typically euthanizes less than 15 nuisance bears a year. Permanent removal guarantees that target animals will not repeat nuisance activity, which can be a problem with other non-lethal management options (e.g., translocations, aversive conditioning, public education). If a nuisance bear is a female, removing her also can prevent problems from perpetuating by avoiding future offspring that learn the same behaviors. Relying on hunting to remove problem bears is not always feasible. Hunting can control bear numbers but it may not be selective for individual bears, particularly if they live in areas closed to hunting, such as safety zones or private communities. If problem bears are female, their small home ranges may preclude them from being harvested on adjacent lands. Consequently, nuisance activity in residential areas can remain high, because of just one or two particularly bold bears despite high harvests. This problem is exacerbated if lands surrounding residential areas are closed to public hunting. Targeted removal may be the only way to eliminate these bears from the population.
46
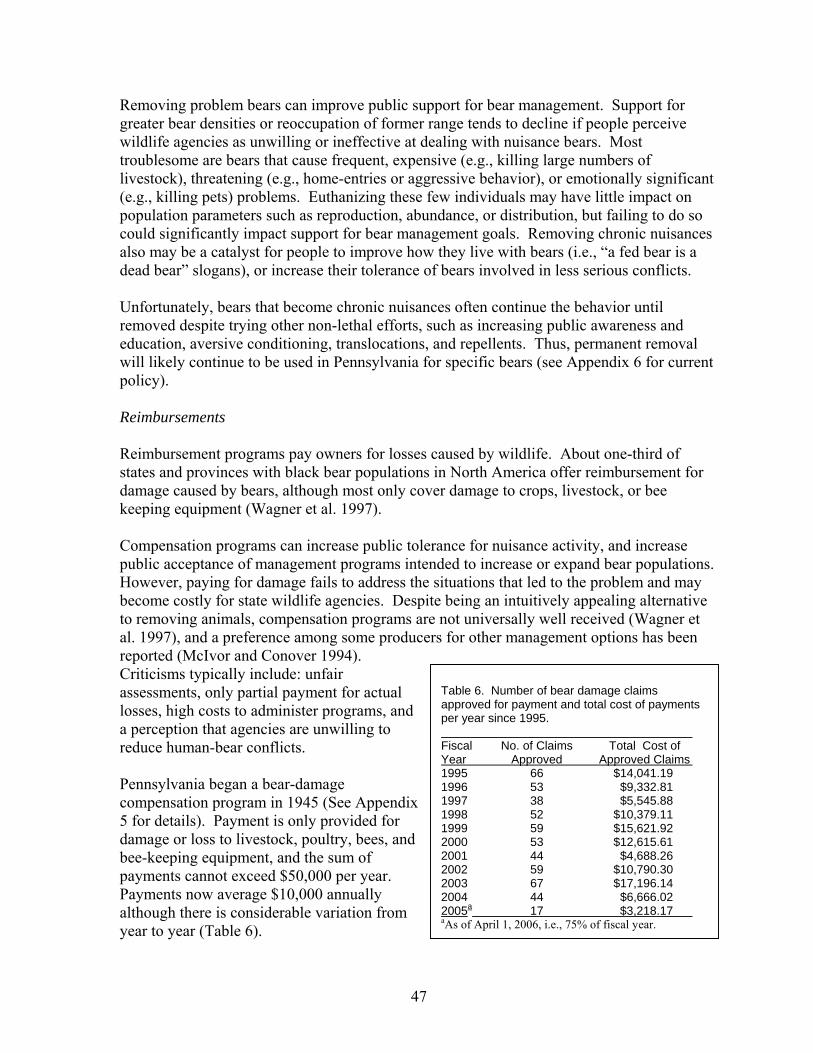
Removing problem bears can improve public support for bear management. Support for greater bear densities or reoccupation of former range tends to decline if people perceive wildlife agencies as unwilling or ineffective at dealing with nuisance bears. Most troublesome are bears that cause frequent, expensive (e.g., killing large numbers of livestock), threatening (e.g., home-entries or aggressive behavior), or emotionally significant (e.g., killing pets) problems. Euthanizing these few individuals may have little impact on population parameters such as reproduction, abundance, or distribution, but failing to do so could significantly impact support for bear management goals. Removing chronic nuisances also may be a catalyst for people to improve how they live with bears (i.e., “a fed bear is a dead bear” slogans), or increase their tolerance of bears involved in less serious conflicts. Unfortunately, bears that become chronic nuisances often continue the behavior until removed despite trying other non-lethal efforts, such as increasing public awareness and education, aversive conditioning, translocations, and repellents. Thus, permanent removal will likely continue to be used in Pennsylvania for specific bears (see Appendix 6 for current policy). Reimbursements Reimbursement programs pay owners for losses caused by wildlife. About one-third of states and provinces with black bear populations in North America offer reimbursement for damage caused by bears, although most only cover damage to crops, livestock, or bee keeping equipment (Wagner et al. 1997). Compensation programs can increase public tolerance for nuisance activity, and increase public acceptance of management programs intended to increase or expand bear populations. However, paying for damage fails to address the situations that led to the problem and may become costly for state wildlife agencies. Despite being an intuitively appealing alternative to removing animals, compensation programs are not universally well received (Wagner et al. 1997), and a preference among some producers for other management options has been reported (McIvor and Conover 1994). Criticisms typically include: unfair assessments, only partial payment for actual losses, high costs to administer programs, and a perception that agencies are unwilling to reduce human-bear conflicts.
Table 6. Number of bear damage claims approved for payment and total cost of payments per year since 1995. Fiscal No. of Claims Total Cost of Year Approved Approved Claims 1995 66 $14,041.19 1996 53 $9,332.81 1997 38 $5,545.88 1998 52 $10,379.11 1999 59 $15,621.92 2000 53 $12,615.61 2001 44 $4,688.26 2002 59 $10,790.30 2003 67 $17,196.14 2004 44 $6,666.02 2005a 17 $3,218.17 aAs of April 1, 2006, i.e., 75% of fiscal year.
Pennsylvania began a bear-damage compensation program in 1945 (See Appendix 5 for details). Payment is only provided for damage or loss to livestock, poultry, bees, and bee-keeping equipment, and the sum of payments cannot exceed $50,000 per year. Payments now average $10,000 annually although there is considerable variation from year to year (Table 6).
47
Supplemental Feeding Supplemental feeding has two management applications. First, it can be used to improve nutritional condition, which results in greater cub production. Bears that have access to supplemental food typically produce larger litters at an earlier age and have better cub survival (Rogers 1987, McLean and Pelton 1990). Supplemental feeding for nutrition is usually supported by the public because of a sense of satisfaction in helping wildlife, and it may increase wildlife viewing opportunities. However, black bear populations in Pennsylvania are not currently experiencing low reproductive rates or survival, so supplemental feeding for nutritional reasons is not justified. Supplemental feeding also can be used to discourage damage caused by bears (diversion feeding). For example, commercial timber companies in the Pacific Northwest have successfully used feeders and large amounts of food to divert bears from debarking trees and eating the underlying sapwood. Similarly, supplemental food also can be used to divert nuisance bears out of areas where hunting is not permitted or practical, increasing their chance of harvest. The use of diversion feeding is best suited for short-term problems or those that do not occur on a regular basis (Conover 2002). Diversion feeding can be expensive, labor intensive, and result in undesirable concentrations of animals. Furthermore, it may result in worse damage by habituating animals to people, conditioning animals to expect food, and attracting animals that normally would not be there. In fact many jurisdictions, including Pennsylvania, have adopted policies that prohibit the feeding of bears since it encourages nuisance bear problems. Because most bear conflicts in Pennsylvania occur in or near places where people live, supplemental feeding to divert damage is not practical. Diversion feeding in areas of minimal human use may have some application.
48
SECTION IV. LITERATURE CITED Allen, R. B. 1984. Experimental pursuit of black bears with
trained bear dogs. Proceedings of the Eastern Black Bear Workshop on Bear Management and Research 7:54–58.
Alt, G. L. 1977. Home range, annual activity patterns, and movements of black bears in northeastern Pennsylvania. M.S. Thesis, Pennsy lvania State University, University Park, Pennsylvania. 67pp.
Alt, G. L. 1978. Dispersal patterns of black bears in northeastern Pennsylvania: a preliminary report. Proceedings of the Eastern Black Bear W orkshop on Bear Management and Research 4:186–199.
Alt, G. L. 1979. Bear populati on establishment. Bureau of Wildlife Management annual job progress reports. Pennsylvania Game Co mmission, Harrisburg, Pennsylvania. Unpublished report.
Alt, G. L. 1980 a. Pennsy lvania's "Cub Law" controversy. Pennsylvania Game News 51(6):23–27.
Alt, G. L. 1980 b. Rate of growth and size of Pennsy lvania black bears. Pennsylvania Game News 51(12):7–17.
Alt, G. L. 1980 c. Hunting vulnerability of bears. Pennsylvania Game News 51(7):7–10
Alt, G. L. 1980 d. Home range and movements of Pennsylvania black bear. Pennsy lvania Game News 51(11):10–15.
Alt, G. L. 1980 e. Management of Pennsy lvania’s black bear: past, present, and future. Pennsylvania Game News 51(10):18–21.
Alt, G. L. 1980 f. Annual job progress reports for the Pennsylvania bear project (1979–80): Job Number 3, bear population establishment. Pennsy lvania Game Commission, Harrisburg, Pennsylvania. Unpublished report.
Alt, G. L. 1980 g. How do y ou handle a hungry bear? Pennsylvania Game News 51(2):15–17.
Alt, G. L. 1980h. Relocating nuisance bears. Pennsy lvania Game News 51(3):20–22.
Alt, G. L. 1981 a. Color phases of the black bear. Pennsylvania Game News 52(9):13–15.
Alt, G. L. 1981 b. Reproductive biology of black bears of northeastern Pennsy lvania. Transactions of the Northeastern Fish and Wildlife Conference 38:88–89. Abstract only.
Alt, G. L. 1982. Reproductive biology of Pennsylvania black bears. Pennsylvania Game News 53(2):9–15.
Alt, G. L. 1983 a. Timing of parturition of black bears (Ursus americanus) in northeastern Pennsy lvania. Journal of Mammalogy 64:305–307.
Alt, G. L. 1983 b. Bear dens under interstate highway. Pennsylvania Game News 54(8):8–10.
Alt, G. L. 1984 a. Black bear cub m ortality due to flooding of natal dens. Journal of Wildlife Management 48:1432–1434.
Alt, G. L. 1984 b. Cub adoption in the black bear. Journal of Mammalogy 65:511–512.
Alt, G. L. 1987. Characteristics of bear cubs at birth. Pennsylvania Game News 58(1):10–13.
Alt, G. L. 1989. Reproductive biology of female black bears and early growth and development of cubs in northeastern Pennsy lvania. Ph.D. Disse rtation, We st Virginia University, Morgantown, W est Virginia. 127pp.
Alt, G. L. 1990. Bear management in the 1990s. Pennsylvania Game News 61(9):7–11.
Alt, G. L. 1995. Black bear population establishment in southwestern Pennsy lvania. Final Report for Project 06230-Job 23002, Pennsy lvania Game Commission, Harrisburg, Pennsylvania. 14pp.
Alt, G. L., R. J. Askey , D. E. Jones, and D. C. Madl. 1982 (abstract only ). Movem ents and m ortality of black bears relocated 100+ air-miles in Pennsylvania. Transactions of the Northeastern Fish and Wildlife Conference 39:16. Abstract only.
Alt, G. L., F. W. Alt, and J. S. Lindzey. 1976. Home range and activity patterns of black bears in northeastern Pennsylvania. Transactions of the Northeastern Fish and Wildlife Conference 33:45–56.
Alt, G. L., and J. J. Beecham . 1984. Reintroduction of orphaned black bear cubs into the wild. W ildlife Society Bulletin 12:169–174.
Alt, G. L., and J. M. Gru ttadauria. 1984. Reuse of black bear dens in northeastern Pennsy lvania. Journal of Wildlife Management 48:236–239.
Alt, G. L., and J. S. Lindzey. 1980. Management of Pennsylvania's black bear: past, present, and future. Transactions of the Northeastern Fish and Wildlife Conference 37:58–70.
Alt, G. L., G. J. Matula, Jr., F. W . Alt, and J. S. Lindzey . 1977. Movements of translocated nuisance black bears of northeastern Pennsy lvania. Transactions of the Northeastern Fish and Wildlife Conference 34:119–126.
Alt, G. L., G. J. Matula, Jr., F. W . Alt, and J. S. Lindzey . 1980. Dy namics of home ra nge and movements of adult black bears in northeastern Pennsy lvania. International Conference on Bear Res earch and Management 4:131–136.
Arner, D. H. 1948. Fall food of the black bear in Pennsylvania. Pennsylvania Game News 19(9):13.
Bacon, E. S., and G. M. Burghardt. 1976. Learning and color discrimination in the Am erican black bear. International Conference on Bear Res earch and Management 3:27–36.
Bennett, L. J., P. F. Englis h, and R. L. Watts. 1943. The food habits of the black bear in Pennsy lvania. Journal of Mammalogy 24:25–31.
Blackman, E. C. 1873. Histor y of Susquehanna County. Claxton, Remsen & Haffe lfinger, Philadelphia, Pennsylvania. 640pp. Microfilm reproduction. 1973.
Brady, J. R., and D. S. Maehr. 1982. A new method for dealing with apiary-raiding black bears. Proceedings of the Annual Conference of the Southeastern Association of Fish and Wildlife Agencies 36:571–577.
49
Briscoe, N., J. G. Humphrey s, and J. P. Dubey . 1993. Prevalence of Toxoplasma gondii infections in Pennsylvania black bears, Ursus americanus. Journal of Wildlife Diseases 29:599–601.
Bunnell, F. L., and D. E. N. Tait. 1981. Population dynamics of bears — implications. Pages 75–98 in C. W. Fowler and T. D. S mith, editors. Dynamics of large mammal populations. John Wiley & Sons, New York, New York.
Calvert, R, D. Slate, P. DeBow. 1992. An integrated approach to bear dam age management in New Hampshire. Proceedings of the Eas tern Black Bear Workshop on Bear Management and Research 11:96 –107.
Carney, D. W., and M. R. Vaughan. 1987. Survival of introduced black bear cubs in Shenandoah National Park, Virginia. International Conference on Bear Research and Management 7:83–85.
Clark, J. E. 1999. Capture a nd on-site release of nuisance black bears and survival of orphaned black bears released in the Great Smoky Mountains. M.S. Thesis, University of Tennessee, Knoxville, Tennessee.
Clark, J. D., D. Huber, and C. Servheen. 2002 a. Bear reintroductions: lessons a nd challenges. Ursus 13:335–345.
Clark, J. E., M. R. Pelton, B. J. Wear, and D. R. Ratajczak. 2002b. Survival of orphaned black bears released in the Smoky Mountains. Ursus 13:269–273.
Clarke, S. H., J. O’Pezio, and C. Hackford. 1980. Fostering black bear cubs in the wild. International Conference on Bear Research and Management 4:163–166.
Colvin, T. R. 1975. Aversive conditioning black bear to honey utilizing lithium chloride. Proceedings of the Annual Conference of the Southeastern Association of Fish and Wildlife Agencies 29:450–453.
Comly, L. M. 1993. Survival, reproduction, and movements of trans located nuis ance black bears in Virginia. M.S. Thesis, Virginia Polytechnic Institute and State University, Blacksburg, Virginia.
Conover, M. 2002. Resolving human-wildlife conflicts, the science of wildlife dam age management. Lewis Publishers, CRC Press Comp any, Washington, D.C. 418pp.
Conover, M. R., W. C. Pitt, K. K. Kessler, T. J. DuBow, and W. A. Sanborn. 1995. Re view of human injuries, illnesses, and economic losses caused by wildlife in the United States. Wildlife Society Bulletin 23:407–414.
Cordell, H. K., B. L. McDona ld, R. J. Teasley , and J. Bergsrom. 1995. NSRE: National survey on recreation and the environment. Sporting Goods Manufacturers Association, North P alm Beach, F lorida and United States Department of Agri culture Forest Service, Washington, D.C.
Coy, P. L. 1999. Geographic variation in reproduction of Minnesota black bears . M .S. Thes is, University of Minnesota, Minneapolis, Minnesota. 104pp.
DeCoster, L. A. 1995. The legacy of Penn’s woods: a history of the Pennsy lvania Bureau of Forestry. Pennsylvania Historical and Museum Commission, Harrisburg, Pennsylvania. 95pp.
Diefenbach, D. R., and G. L. Alt. 1998. Modeling and evaluation of ear tag loss in black bears. Journal of Wildlife Management 62:1292–1300
Diefenbach, D. R., J. L. Laake, and G. L. Alt. 2003. In review. Spatio-temporal and demographic variation in the harvest of black bears in Pennsy lvania. Journal of Wildlife Management 00:000–000.
Dubey, J. P., J. G. Humphr eys, and P. Thulliez. 1995. Prevalence of viable Toxoplasma gondii tissue c ysts and antibodies to T. gondii by various serologic tests in black bears ( Ursus americanus) from Pennsy lvania. Journal of Parasitology 81:109–112.
DuBrock, C. W., A. R. Tipt on, and J. B. Whelan. 1978. Evaluation of bear hunters survey and its implications on black bear m anagement in Virginia. P roceedings of the Annual Conference of the Southeast Association of Fish and Wildlife Agencies 32:202–207.
Duda, M. D., and K. C. Young. 1994. Americans and wildlife diversity . Responsive Management, Harrisonburg, Virginia.
Elowe, K. D. 1990. Bear hunting with hounds: techniques and effects on bears and the public. P roceedings of the Eastern Black Bear Workshop on Bear Management and Research 10:101–109.
Environmental Resources Res earch Institute. 1996. Digital map: Pennsy lvania’s physiographic regions, PA Explorer CD-ROM edition. Pennsy lvania State University, University Park, Pennsylvania.
Eveland, J.F. 1973. Popula tion dy namics, movements, morphology, and habitat characteristics of black bear in Pennsylvania. M.S. Thesis, Pennsy lvania State University, University Park, Pennsylvania. 157pp.
Fagerstone, K. A., M. A. Coffey , P. D. Curtis, R. A. Dolbeer, G. J. Killian, L. A. Miller, and L. M. Wilmot. 2002. Wildlife fertility control. Wildlife Society Technical Review 02-2. 29pp.
Fies, M. L., D. D. Martin, and G. T. Blank, Jr. 1987. Movements and rates of return of translocated black bears in Virginia. International Conference on Bear Research and Management 7:369–372.
Folk, G. E., M. A. Folk, and J. J. Monor. 1972. Physiological condition of three s pecies of bears in winter dens. International Conference on Bear Research and Management 2:107–124.
Folk, G. E., A. Larson, and M. A. Folk. 1976. Physiology of hibernating bears. International Conference on Bear Research and Management 3:373–380.
Garshelis, D. L. 1989. Nuisance bear activity and
management in Mi nnesota. Pages 169–180 in M. Bromley, editor. Bear-people conflicts – proceedings of a sy mposium on management strategies. Northwest Territories Department of Natural Resources, Yellowknife, Northwest Territories.
Garshelis, D. L. 1994. De nsity-dependent population regulation of black bears. Pages 3–14 in M. Ta ylor, editor. Density -dependent population regulation in black, brown, and polar bears. International Conference on Bear Research and Mana gement Monograph Series Number 3. 43 pp.
50

Garshelis, D. L., and K. V. Noyce. 2001. Trends in black bear-human conflicts during a 2-decade burgeoning bear population. Western Black Bear Workshop 7:13. Abstract only.
Garshelis, D. L., and M. R. Pelton. 1981. Movements of black bears in the Great Smoky Mountains National Park. Journal of Wildlife Management 47:405–412.
Gerstell, R. 1939. The growth and size of Pennsylvania black bears. Pennsylvania Game News 10(8):4–7.
Giles, J. M., and W. S. Kordek. 1979. Pennsy lvania bear hunting, recent trends and future pros pects. Pennsylvania Game News 50(12):15–17.
Gillin, C. M., F. M. Ham mond, C. M. Peterson. 1994. Evaluation of an aversive conditioning technique used on female grizzly bears in the Yellowstone Ecosystem. International Conference On Bear Research and Management 9(1):503–512.
Godfrey, C. L. 1996. Repr oductive biology and denning ecology of Virginia's exploited black bear population. M.S. Thesis, Virginia Poly technic Institute and State University, Blacksburg, Virginia.
Gordon, S. E. 1923. Raising native game in a wild state on refuges – trapping and releasing the surplus on shot-out territory. Proceedings of the International As sociation of Game, Fish, and Conservation Commissioners 17:38–44.
Gunther, K. A. 1994. Bear management in Yellowstone National Park, 1960–93. International Conference on Bear Research and Management 9(1):549–560.
Hall, E. R. 1981. The mamma ls of North America. 2nd edition. John Wiley & Sons, New York, New York. 1181pp.
Harshyne, W. A., D. D. Diefenbach, G. L. Alt, and G. M. Matson. 1998. Analysis of error from cementum-annuli age estimates of known-age Pennsylvania black bears. Journal of Wildlife Management 62:1281–1291.
Herrero, S. 1985. Bear attacks: their causes and avoidance. Nick Lyons Books, Winchester Press, Piscataway, New Jersey. 287pp.
Herrero, S. 1999. In troduction. Pages 144–156 in C. Servheen, S. Herrero, and B. P eyton, compilers. Bears. Status survey and conservation action plan. IUCN/SSC Bear and Polar Bear Specialist Groups. IUCN, Gland, Switzerland and Cambridge, United Kingdom. 309pp.
Herrero, S., and S. Fleck. 1990. Injury to people inflicted by black, grizzly or polar bears : recent trends and new insights. International Conference on Bear Research and Management 8:25–32.
Hock, R. J., and A. M. Larson. 1966. Com position of black bear milk. Journal of Mammalogy 47:539–540.
Hunt, C. L. 1984. Behavioral re sponses of bears to tests of repellents, deterrents, and aversive conditioning. M.S. Thesis, University of Montana, Missoula, Montana.
Hyngstrom, S. E. 1994. Bl ack bears. Pages c5–c15 in S.E. Hygnstrom, R. M. Timm, and G. E. Larson, editors. Prevention and control of wildlife damage. University of Nebraska Press, Lincoln, Nebraska.
Igo, W. K. 2001. W est Virginia status report. Proceedings of the Eastern Black Bear Workshop on Bear Management and Research 16:88–98.
Inman, K. H., and M. R. Va ughan. 2002. Hunter effort and success rates of hunting bears with hounds in Virginia. Ursus 13:223–230.
Jenness, R., A. W. Erickson, and J. J. Craighead. 1972. Some comparative aspects of milk from four species of bears. Journal of Mammalogy 53:34–47.
Jonker, S. A., J. A. Parkhurst, R. Field, and T. K. Fuller. 1998. Black bear depredation on agricultural commodities in Massachusetts. W ildlife Society Bulletin 26:318–324.
Jorgensen, C. J. , R. H. Conley, R. J. Hamilton, and O. T. Sanders. 1978. Management of black bear depredation problems. P roceedings of the Eas tern Black Bear Workshop on Bear Management and Research 4:297–321.
Kellert, S. R. 1994. Public attitudes toward bears and their conservation. International Conference on Bear Research and Management 9(1):43–50.
Kolenosky, G. B., and S. M. Strathearn. 1987. Black bear. Pages 442–455 in M. Novak, J. A. Baker, M. E. Obbard, and B. M allock, editors . W ild furbearer management and conservation in North America. Ontario Ministry of Natural Resources, Toronto, Canada.
Kordek, W. S., and J. S. Lindzey . 1980. Preliminary analysis of female reproductive tracts from Pennsylvania black bears. International Conference on Bear Research and Management 4:159–161.
Kosack, J. The Pennsy lvania Game Commission 1895–1995, 100 years of wildlife conservation. Pennsy lvania Game Commission, Harrisburg, Pennsylvania. 233pp.
Lindzey, J. S., G. L. A lt, W. S. Kordek, and G. J. Matula, Jr. 1979. Hunting, bear populations, and stress. Research Paper Number 230 of the Pennsylvania Cooperative Wildlife Research Unit, Pennsy lvania State University, University Park, Pennsylvania. 8pp.
Lindezey, J. S., G.L. Alt, C. R. McLaughlin, and W. S. Kordek. 1983. Population response of Pennsy lvania black bears to hunting. International Conference on Bear Research and Management 5:34–39.
Litvaitis, J.A., and D.M. Kane. 1994. Relationship of hunting technique and hunter selectivity to composition of black bear harves t. W ildlife S ociety Bulletin 22:604–606.
Maehr, D. S. 1983. Black bear depredation on bee y ards in Florida. P roceedings of the Eastern Wildlife Damage Control Conference 1:133–135.
Martin, D. 2001. Virginia status report. Proceedings of the Eastern Black Bear Workshop on Bear Management and Research 16:87–88.
Massopust, J. L., and R. K. Anderson. 1984. Homing tendencies of trans located nuis ance black bears in northern Wisconsin. P roceedings of the Eas tern Black Bear Workshop on Bear Management and Research 7:66–73.
Massopust, J. L., and R. K. Anderson. 1984. The response of black bears to being chased by hunting dogs. Proceedings of the Eastern Black Bear W orkshop on Bear Management and Research 7:59–65.
Matson, J. R. 1954. Observations on the dormant phase of a female black bear. Journal of Mammalogy 35:28–35.
51
Matula, G. J., J r., J . S . Lindzey , and H . Rothenbacher. 1980. Sex, age, and seasonal differences in the blood profile of black bears captured in northeastern Pennsylvania. International Conference on Bear Research and Management 4:49–56.
McArthur, K. L. 1981. Factors contributing to effectiveness of black bear transplants. Journal of Wildlife Management 45:102–110.
McCarthy, T. M., and R. J. Seavoy . 1994. Reducing nonsport losses attributable to food conditioning: human and bear behavior modification in an urban environment. International Conference on Bear Research and Management 9(1):75–84.
McAtee, W. L. 1939. The electric fence in wildlife management. Journal of Wildlife Management 31:928–929.
McCullough, D. R. 1982. Beha vior, bears, and humans. Wildlife Society Bulletin 10:27–33.
McIvor, D. E., and M. R. Conover. 1994. Perceptions of farmers and non-farmers to wards management of problem wildlife. Wildlif e Society Bulletin 22:212–221.
McLaughlin, C. R. 1981. Home range, movements, and denning behavior of female black bears in northcentral Pennsylvania. M.S. Thesis, Pennsy lvania State University, University Park, Pennsylvania. 63pp.
McLaughlin, C. R. , C. J. Bake r, W. E. Drake, and G. W . Waldman. 1981. Movements of tagged black bears in northcentral Pennsylvania, a preliminary report. Pennsylvania Game Co mmission, Harrisburg, Pennsylvania. 17pp. Unpublished report.
McLaughlin, C. R., C. J. Ba ker, A. Sallade, and J. Tamblyn. 1981. Characteris tics and movements of translocated nuis ance black bears in northcentral Pennsylvania. Pennsy lvania Game Commission, Harrisburg, Pennsylvania. 31pp. Unpublished report.
McLaughlin, C. R., and H. L. Smith. 1990. Baiting black bears: hunting techniques and management issues. Proceedings of the Eastern Black Bear W orkshop on Bear Management and Research 10:110–119.
McLean, P. K., and M. R. Pelton. 1990. Some demographic comparisons of wild and panhandler bears in the Smoky Mountains. International Conference on Bear Research and Management 8:105–112.
Miller, L. A., B. E. Johns , and D. J. Elias. 1998. Immunocontraception as a wildlife m anagement tool: some perspectives. Wildlife Society Bulletin 26:237–243.
Paige, L. C. 2000. America’s wildlife: the challenge ahead. International Association of Fish and W ildlife Agencies. Washington, D.C.
Pelton, M. R. 1982. Black bear ( Ursus americanus). Pages 504–514 in J. A. Chapman and G. A. Feldhamer, editors. Wild mammals of North America. The John Hopkins University Press, Baltimore, Maryland.
Pelton, M. R., A. B. Coley, T. H. Eason, D. L. Martinez, J. A. Pederson, F. T. Van Ma nen, and K. M. Weaver. 1999. American black bear conservation action plan. Pages 144–156 in C. Servheen, S. Herrero, and B. Peyton, compilers. Bears. S tatus s urvey and conservation action plan. IUCN/SSC Bear and Polar Bear Specialist Groups. IUCN, Gland, Switzerland and Cambridge, United Kingdom. 309pp.
Pennsylvania Department of Agriculture. 2002. Pennsylvania agricultural statistics 2001–2002. Pennsylvania Agricultural Statistics Service, Pennsylvania Department of Agriculture, Harrisburg, Pennsylvania. 113pp.
Pennsylvania Game Commi ssion. 2005. Pennsylvania Game Commission annual re port, 2003–04. Available online at www.pgc.state.pa.us, Reports & Minutes.
Peyton, B. 1989. A profile of Michigan bear hunters and bear hunting issues. Wildlife Society Bulletin 17:463–470.
Piekielek, W., and T. S. Burton. 1965. A black bear population study in northern California. California Fish and Game 61:4–25.
Quinn, R. 1981. Parasites of black bears in Pennsy lvania. M.S. Thesis, Pennsylvania State University, University Park, Pennsylvania. 70pp.
Rhoads, S. N. 1903. The ma mmals of Pennsy lvania and New Jersey. Privately published, Philadelphia, Pennsylvania. 266pp.
Robinson, F. A. 1963. Beekeeping among the bears. American Bee Journal 103:454– 456.
Rockwell, D. 1991. Giving voice to bear: North American Indian rituals, myths, and im ages of the bear. Roberts Rinehart, Niwot, Colorado. 224pp.
Rogers, L. L. 1977. Social re lationships, movements, and population dynamics of black bears in northeastern Minnesota. Ph.D. Dissertation, University of Minnesota, Minneapolis. 194 pp.
Rogers, L. L. 1984. Reactions of free-ranging black bears to capsaicin spray repellent. W ildlife Society Bulletin 12:59–61.
Rogers, L. L. 1986. Effects of translocation distance on frequency of return by adult black bears. Wildlife Society Bulletin 14:76–80.
Rogers, L. L. 1987. Effects of food supply and kinship on social behavior, movements, and population growth of black bears in northeastern Minnesota. Wildlife Monograph 97. 72pp.
Rose, L. 2001. Bears on the rise. Pennsylvania Game News 72(11):11–13.
Rosenberry, C. S., and M. L. Lovallo. 2002. A uniform system of management units for managing Pennsylvania’s wildlife resources. Pennsy lvania Game Commission, Harrisburg, Pennsy lvania. 40pp. Unpublished report.
Sauer, P. R., and S. Free. 1969. Movements of tagged bears in the Adirondacks. New York Fish and Game Journal 16:205–223.
52
Schad, G. A., D. A. Leiby, C. H. Duffy, K. D. Murrell, and G. L. Alt. 1986. Trichinella spiralis in the black bear (Ursus americanus) of Pennsy lvania: distribution, prevalence and intensity of infection. Journal of Wildlife Diseases 22:36–41.
Scheick, B. K. 2002. A survey of regulations on black bears in the United States. International Bear News 11(4):24–25.
Schirokauer, D. W., and H. M. Boy d. 1998. Bear-human conflict management in Denali National Park and Preserve 1982–94. Ursus 10:395–403.
Servheen, C. 1990. The status and conservation of the bears of the world. International Conference on Bear Research and Management Monograph Series Number 2. 32pp.
Shoemaker, H. W., and J. C. French. 1921. The black bear of Pennsy lvania. Times Tr ibune Company , Altoona, Pennsylvania. 92pp.
Shull, S. D., M. R. Vaughan, and L. Comly . 1994. Use of nuisance bears for restoration purposes. Proceedings of the Eastern Black Bear Workshop on Bear Management and Research 12:107–114.
Shorger, A. W. 1946. Influx of bears into St. Louis Co., Minnesota. Journal of Mammalogy 27:177.
Siebert, S . G., W . H. S tiver, K. D. Delozier, and M. R. Pelton. 1999. Reuniting black bear cubs to their natural mother. P roceedings of the Eas tern Black Bear Workshop on Bear Management and Research 14:58–59.
Smith, T. S. 1998. Attraction of brown bears to red pepper spray deterrent: caveats for us e. Wildlife Society Bulletin 26:92–94.
Storer, T. I., G. H. Vanse ll, and B. D. Moses. 1938. Protection of mountain apiaries from bears by the use of electric fences. Journal of Wildlife Management 2:172–178.
Ternent, M. A., and D. L. Garshelis. 1999. Taste-aversion conditioning to reduce nuisance activity by black bears in a Minnesota m ilitary reservation. W ildlife Society Bulletin 27:720–728.
Ternent, M. A., T. Conway, R. M. Hough, G. Feaser, R. D. Buss, S. E. Harshaw, and M. S. Rutkowski. 2001. Recommendations for reducing nuisance black bear conflicts in Pennsylvania. Report of the Nuisance Black Bear Management Committ ee, Pennsy lvania Game Commission, Harrisburg, Pennsylvania. 24pp.
True, F. W. 1882. On a cinnamon bear from Pennsylvania. Proceedings of the Academ y of Natural S ciences of Philadelphia 5:653–656.
Truman, J. B. 1926. Biennial report of the Board of Game Commissioners of the Commonwealth of Pennsylvania for the 1925–1926 biennium. Pennsy lvania Game Commission, Harrisburg, Pennsylvania.
United States Environmental Protection Agency . 1994. Digital map of forest cove r types derived from F. H. Eyre. 1980. Forest cover ty pes of the United States and Canada. S ociety of Am erican F oresters. Bethesda, Maryland. 148 pp. Digitized by S.H. Azevedo. 1989. Forest Ozone Team, United States Environmental Protection Agency Environmental Research Lab, Corvallis, Oregon.
United States Fish and Wildlife Service. 2003. 2001 national survey of fishing, hunting, and wildlife-associated recreation: P ennsylvania. United S tates Department of the Interior Fish and Wildlife Service and United States Departme nt of Commerce Census Bureau, Washington, D.C. 46pp.
Vaughn, M. 2002. Oak trees, acorns, and bears. In M. J. McShea and W . N. Healy , editors . Oak forest ecosystems – ecology and management for wildlife. The John Hopkins University Press, Baltim ore, Maryland. 432 pp.
Virginia Department of Game and Inland Fisheries. 2003. Virginia black bear management plan. Virginia Department of Game and In land Fisheries. Richmond, Virginia.
Vreeland, J. J. 2002. Fawn survival in Pennsylvania. Pennsylvania Game News 73(9):12–16.
Wagner, K. K., R. H. Schmidt, and M.R. Conover. 1997. Compensation programs for wildlife damage in North America. Wildlife Society Bulletin 25:312–319.
Warburton, G. S., and R. C. Maddrey . 1994. Survey of nuisance bear program s in eastern North America. Proceedings of the Eastern Black Bear W orkshop on Bear Management and Research 12:115–123.
Whitaker, J. O., Jr., and W. J. Hamilton, Jr. 1998. Mammals of the eastern United States. Cornell University Press, Ithaca, New York.
Will, G. B. 1980. Black bear-hum an conflicts and management considerations to m inimize and correct these problems. Proceedings of the Eastern Black Bear Workshop on Bear Management and Research 5:75–88.
Williamson, D. F. 2002. In the black: status, m anagement, and trade of the Am erican black bear (Ursus americanus) in North America. TRAFFIC North America, World Wildlife Fund, Washington, D.C. 161pp.
Wimsatt, W. A. 1963. Delayed implantation in the Ursidae, with particular reference to the black bear (Ursus americanus Pallus). Pages 49–76 in A. C. Enders, editor. Delay ed im plantation. University of Chicago Press, Chicago, Illinois.
53
APPENDIX 1. Establishing the mission, goals, and objectives for Pennsylvania’s bear management plan. Introduction Stakeholders from 6 areas of interest were invited to an all-day meeting to discuss what they value about Pennsylvania’s black bear resource. Organizations that were contacted include: Sportsmen Interests Environmental Conservation Interests PA Federation of Sportsmen’s Clubs PA Audubon Society Unified Sportsmen of Pennsylvania Western Pennsylvania Conservancy United Bowhunters of Pennsylvania The Nature Conservancy Pennsylvania Nite Hunters Pennsylvania Wildlife Federation Fox Chasers Association Governor’s Sportsmen’s Advisory Council Local, County, and State Regulatory Interests Agricultural Interests County Commissioners Assoc. of PA Pennsylvania Farm Bureau State Assoc. of Township Supervisors Pennsylvania Vegetable Growers Association State Legislature Pennsylvania State Grange Private Apiary Owner/Operator Game Commission Employees Pennsylvania Department of Agriculture Wildlife Conservation Officers Habitat Biologist Public & Private Forestry Interests Regional Directors Forest Investments Associates Kane Hardwood Inc. USDA Forest Serv.-Allegheny Nat. Forest PA Dept. of Cons. & Natural Resources An invitation letter was sent to each participant along with pages 1-49 and appendices 1-5 of this document so that participants would be knowledgeable of black bear biology, population status, history, management, and current issues before attending. The meeting was held at the State College Ramada Inn on October 17, 2003, from 9:30 am to 3:30 pm. Frances Teslar and Paul Hindmarsh, management consultants from the Bureau of Management Consulting in the Governor’s Office of Administration, facilitated the meeting. The objective of the meeting was to gather input from groups that have an interest in how bear populations in Pennsylvania are managed. Specifically, we wanted participants to (1) develop a mission statement for bear management in Pennsylvania; (2) agree upon goals that are important to that mission, and (3) list values they consider important, which we could use to develop objectives and strategies for achieving those goals.
54
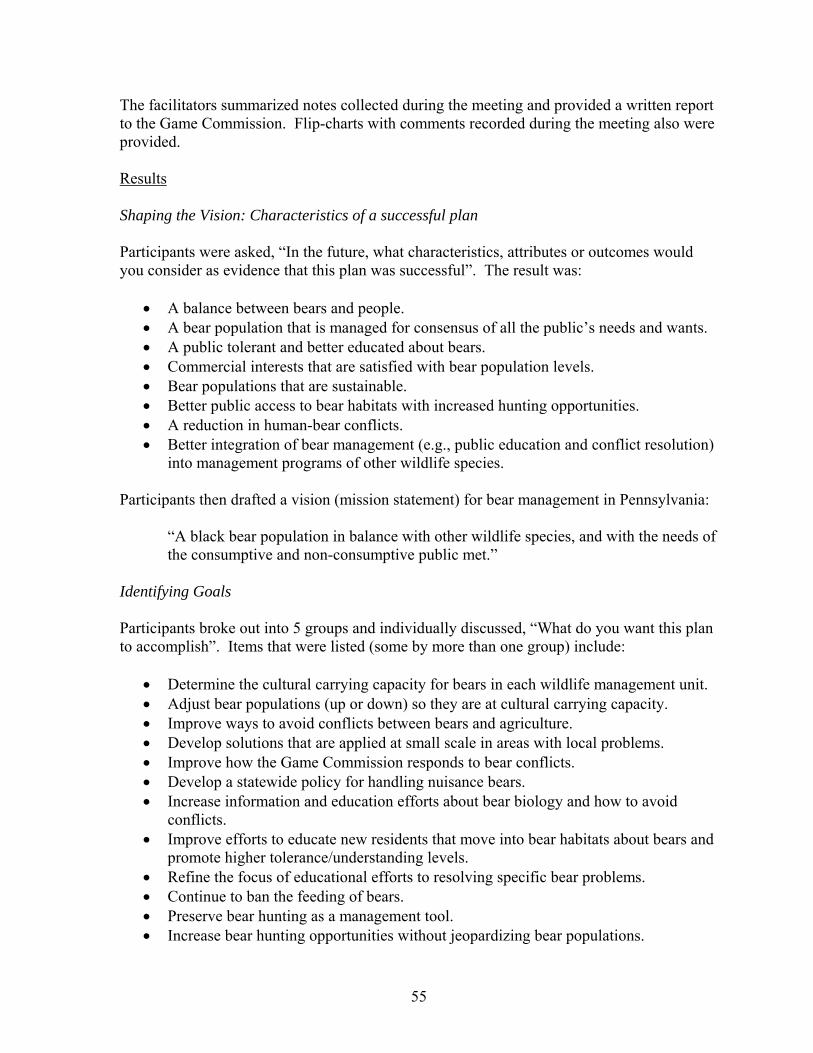
The facilitators summarized notes collected during the meeting and provided a written report to the Game Commission. Flip-charts with comments recorded during the meeting also were provided. Results Shaping the Vision: Characteristics of a successful plan Participants were asked, “In the future, what characteristics, attributes or outcomes would you consider as evidence that this plan was successful”. The result was:
• A balance between bears and people. • A bear population that is managed for consensus of all the public’s needs and wants. • A public tolerant and better educated about bears. • Commercial interests that are satisfied with bear population levels. • Bear populations that are sustainable. • Better public access to bear habitats with increased hunting opportunities. • A reduction in human-bear conflicts. • Better integration of bear management (e.g., public education and conflict resolution)
into management programs of other wildlife species. Participants then drafted a vision (mission statement) for bear management in Pennsylvania:
“A black bear population in balance with other wildlife species, and with the needs of the consumptive and non-consumptive public met.”
Identifying Goals Participants broke out into 5 groups and individually discussed, “What do you want this plan to accomplish”. Items that were listed (some by more than one group) include:
• Determine the cultural carrying capacity for bears in each wildlife management unit. • Adjust bear populations (up or down) so they are at cultural carrying capacity. • Improve ways to avoid conflicts between bears and agriculture. • Develop solutions that are applied at small scale in areas with local problems. • Improve how the Game Commission responds to bear conflicts. • Develop a statewide policy for handling nuisance bears. • Increase information and education efforts about bear biology and how to avoid
conflicts. • Improve efforts to educate new residents that move into bear habitats about bears and
promote higher tolerance/understanding levels. • Refine the focus of educational efforts to resolving specific bear problems. • Continue to ban the feeding of bears. • Preserve bear hunting as a management tool. • Increase bear hunting opportunities without jeopardizing bear populations.
55
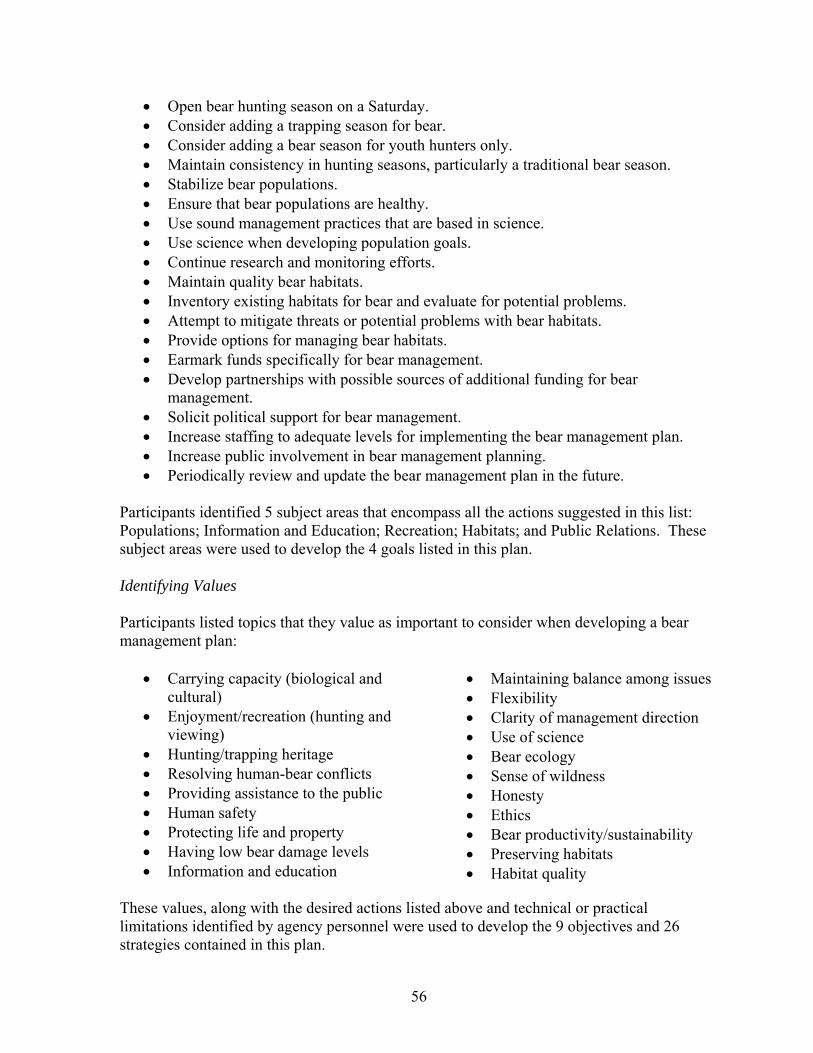
• Open bear hunting season on a Saturday. • Consider adding a trapping season for bear. • Consider adding a bear season for youth hunters only. • Maintain consistency in hunting seasons, particularly a traditional bear season. • Stabilize bear populations. • Ensure that bear populations are healthy. • Use sound management practices that are based in science. • Use science when developing population goals. • Continue research and monitoring efforts. • Maintain quality bear habitats. • Inventory existing habitats for bear and evaluate for potential problems. • Attempt to mitigate threats or potential problems with bear habitats. • Provide options for managing bear habitats. • Earmark funds specifically for bear management. • Develop partnerships with possible sources of additional funding for bear
management. • Solicit political support for bear management. • Increase staffing to adequate levels for implementing the bear management plan. • Increase public involvement in bear management planning. • Periodically review and update the bear management plan in the future.
Participants identified 5 subject areas that encompass all the actions suggested in this list: Populations; Information and Education; Recreation; Habitats; and Public Relations. These subject areas were used to develop the 4 goals listed in this plan. Identifying Values Participants listed topics that they value as important to consider when developing a bear management plan:
• Carrying capacity (biological and cultural)
• Enjoyment/recreation (hunting and viewing)
• Hunting/trapping heritage • Resolving human-bear conflicts • Providing assistance to the public • Human safety • Protecting life and property • Having low bear damage levels • Information and education
• Maintaining balance among issues • Flexibility • Clarity of management direction • Use of science • Bear ecology • Sense of wildness • Honesty • Ethics • Bear productivity/sustainability • Preserving habitats • Habitat quality
These values, along with the desired actions listed above and technical or practical limitations identified by agency personnel were used to develop the 9 objectives and 26 strategies contained in this plan.
56
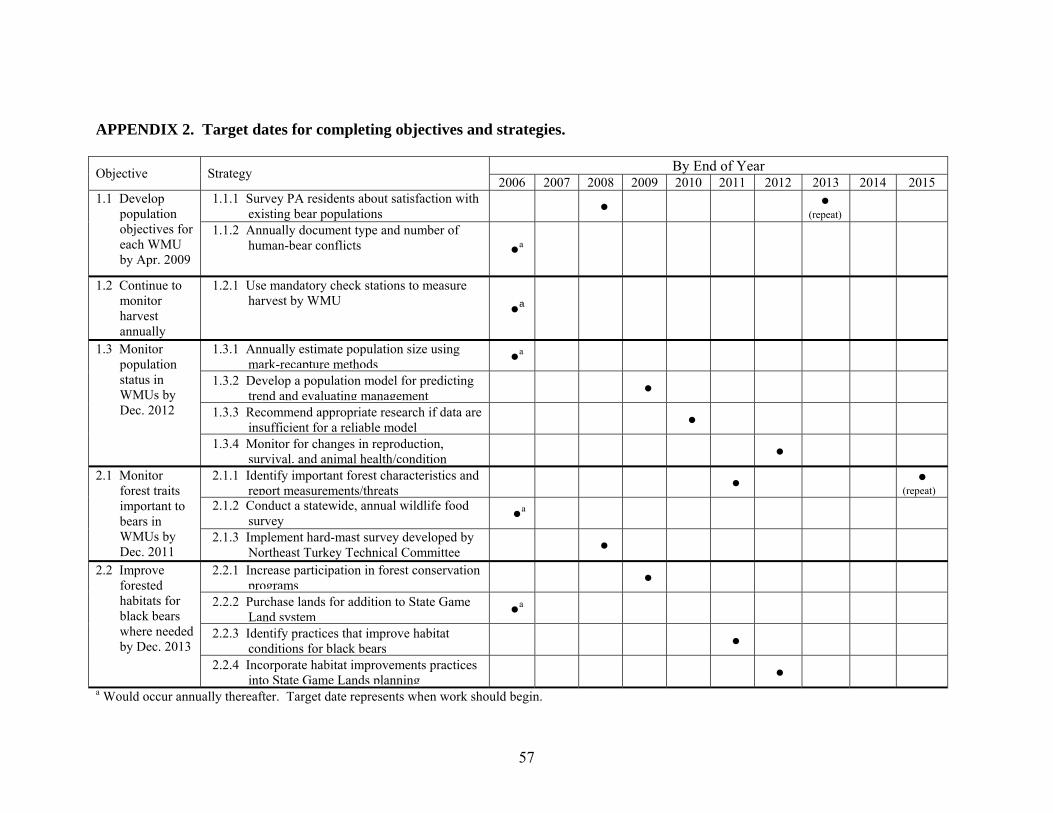
57
APPENDIX 2. Target dates for completing objectives and strategies.
By End of Year Objective Strategy 2006 2007 2008 2009 2010 2011 2012 2013 2014 2015
1.1.1 Survey PA residents about satisfaction with existing bear populations ●
● (repeat) 1.1 Develop
population objectives for each WMU by Apr. 2009
1.1.2 Annually document type and number of human-bear conflicts ●a
1.2 Continue to monitor harvest annually
1.2.1 Use mandatory check stations to measure harvest by WMU ●a
1.3.1 Annually estimate population size using mark-recapture methods ●a
1.3.2 Develop a population model for predicting trend and evaluating management ●
1.3.3 Recommend appropriate research if data are insufficient for a reliable model ●
1.3 Monitor population status in WMUs by Dec. 2012
1.3.4 Monitor for changes in reproduction, survival, and animal health/condition ●
2.1.1 Identify important forest characteristics and report measurements/threats ● ●
(repeat) 2.1.2 Conduct a statewide, annual wildlife food
survey ●a
2.1 Monitor forest traits important to bears in WMUs by Dec. 2011
2.1.3 Implement hard-mast survey developed by Northeast Turkey Technical Committee
●
2.2.1 Increase participation in forest conservation programs ●
2.2.2 Purchase lands for addition to State Game Land system ●a
2.2.3 Identify practices that improve habitat conditions for black bears ●
2.2 Improve forested habitats for black bears where needed by Dec. 2013
2.2.4 Incorporate habitat improvements practices into State Game Lands planning ●
a Would occur annually thereafter. Target date represents when work should begin.
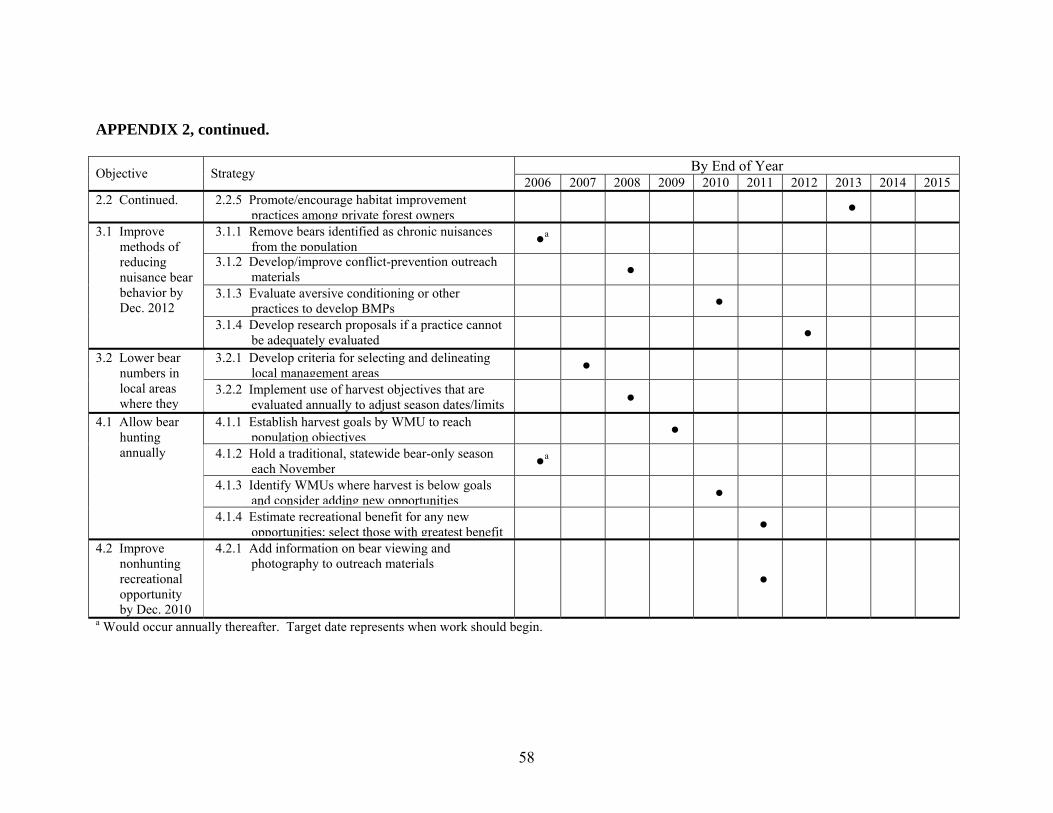
APPENDIX 2, continued.
By End of Year Objective Strategy 2006 2007 2008 2009 2010 2011 2012 2013 2014 2015
2.2 Continued. 2.2.5 Promote/encourage habitat improvement practices among private forest owners ●
3.1.1 Remove bears identified as chronic nuisances from the population ●a
3.1.2 Develop/improve conflict-prevention outreach materials ●
3.1.3 Evaluate aversive conditioning or other practices to develop BMPs ●
3.1 Improve methods of reducing nuisance bear behavior by Dec. 2012
3.1.4 Develop research proposals if a practice cannot be adequately evaluated ●
3.2.1 Develop criteria for selecting and delineating local management areas ● 3.2 Lower bear
numbers in local areas where they
3.2.2 Implement use of harvest objectives that are evaluated annually to adjust season dates/limits ●
4.1.1 Establish harvest goals by WMU to reach population objectives ●
4.1.2 Hold a traditional, statewide bear-only season each November ●a
4.1.3 Identify WMUs where harvest is below goals and consider adding new opportunities ●
4.1 Allow bear hunting annually
4.1.4 Estimate recreational benefit for any new opportunities; select those with greatest benefit ●
4.2 Improve nonhunting recreational opportunity by Dec. 2010
4.2.1 Add information on bear viewing and photography to outreach materials
●
a Would occur annually thereafter. Target date represents when work should begin.
58
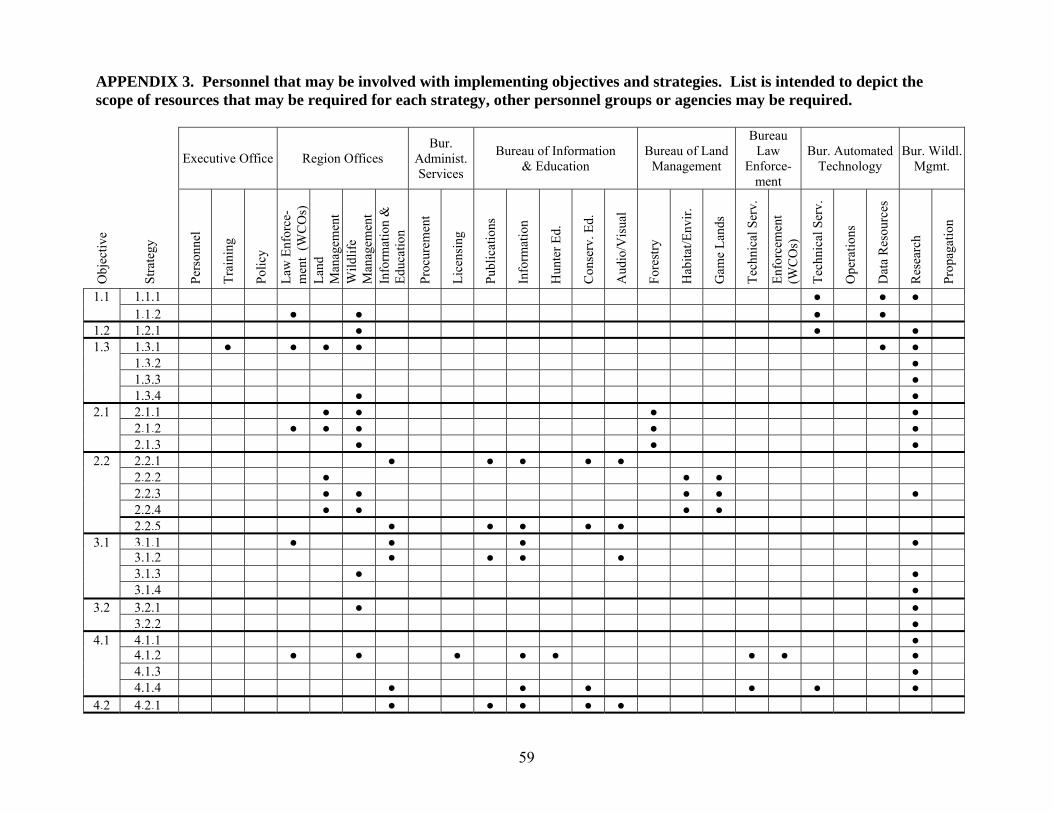
APPENDIX 3. Personnel that may be involved with implementing objectives and strategies. List is intended to depict the scope of resources that may be required for each strategy, other personnel groups or agencies may be required.
Executive Office Region Offices Bur.
Administ. Services
Bureau of Information & Education
Bureau of Land Management
Bureau Law
Enforce-ment
Bur. Automated Technology
Bur. Wildl. Mgmt.
Obj
ectiv
e
Stra
tegy
Pers
onne
l
Trai
ning
Polic
y
Law
Enf
orce
-m
ent
(WC
Os)
La
nd
Man
agem
ent
Wild
life
Man
agem
ent
Info
rmat
ion
&
Educ
atio
n
Proc
urem
ent
Lice
nsin
g
Publ
icat
ions
Info
rmat
ion
Hun
ter E
d.
Con
serv
. Ed.
Aud
io/V
isua
l
Fore
stry
Hab
itat/E
nvir.
Gam
e La
nds
Tech
nica
l Ser
v.
Enfo
rcem
ent
(WC
Os)
Tech
nica
l Ser
v.
Ope
ratio
ns
Dat
a R
esou
rces
Res
earc
h
Prop
agat
ion
1.1.1 ● ● ● 1.1 1.1.2 ● ● ● ●
1.2 1.2.1 ● ● ●1.3.1 ● ● ● ● ● ●1.3.2 ●1.3.3 ●
1.3
1.3.4 ● ●2.1.1 ● ● ● ●2.1.2 ● ● ● ● ●
2.1
2.1.3 ● ● ●2.2.1 ● ● ● ● ● 2.2.2 ● ● ●2.2.3 ● ● ● ● ●2.2.4 ● ● ● ●
2.2
2.2.5 ● ● ● ● ● 3.1.1 ● ● ● ●3.1.2 ● ● ● ● 3.1.3 ● ●
3.1
3.1.4 ● 3.2.1 ● ●3.2 3.2.2 ●4.1.1 ●4.1.2 ● ● ● ● ● ● ● ● 4.1.3 ●
4.1
4.1.4 ● ● ● ● ● ● 4.2 4.2.1 ● ● ● ● ●
59
60
APPENDIX 4. Additional literature that pertains to black bears in Pennsylvania but was not cited in the report. Alt, G. L. 1978. 14 1/2 miles of bear tracks. Pennsy lvania
Game News 49(6):24– 29. Alt, G. L. 1979. Where the hunters came from and where
they went: three y ears of bear harves ts. P ennsylvania Game News 50(11):26– 29.
Alt, G. L. 1979. Training and information manual for bear project cooperators. Penns ylvania Game Commission, Harrisburg, Pennsylvania. 24pp. Mimeographed.
Alt, G. L. 1980. Bears, beehives, and beekeepers. Gleanings in Bee Culture 108:137– 140.
Alt, G. L. 1980. Factors affecting bear harvests. Pennsylvania Game News 51(8):23– 25.
Alt, G. L. 1980. Preliminary results of Pennsylvania’s 1979 bear harvest. Pennsylvania Game News 51(4):13– 20.
Alt, G. L. 1980. Pennsy lvania bear harvest trends. Pennsylvania Game News 51(9):8– 15.
Alt, G. L. 1981. Bear hibernation: subject of ecological and medical research. Pennsylvania Game News 52(5):15– 16.
Alt, G. L. 1981. Results of Pennsy lvania’s 1980 bear harvest. Pennsylvania Game News 52(10):20– 25.
Alt, G. L. 1982. Result’s of Pennsylvania’s 1981 bear season. Pennsylvania Game News 53(5):18– 25.
Alt, G. L. 1983. Result’s of Pennsylvania’s 1982 bear season. Pennsylvania Game News 54(5):17– 21.
Alt, G. L. 1984. Result’s of Pennsylvania’s 1983 bear season. Pennsylvania Game News 55(12):26– 30.
Alt, G. L. 1986. 1985 bear season results. Pennsylvania Game News 57(4):20– 22.
Alt, G. L. 1988. 1987 bear season results. Pennsylvania Game News 59(4):43– 45.
Alt, G. L. 1992. Just one mo re time. Pennsy lvania Game News 63(4):3– 6.
Alt, G. L. 1994. 1993 bear season results. Pennsylvania Game News 65(3):22– 23.
Alt, G. L. 1996. 1995 bear season results. Pennsylvania Game News 67(6):9– 13.
Alt, G. L. 1998. 1997 bear season results. Pennsylvania Game News 69(4):12– 15.
Alt, G. L. 1999. 1998 bear season results. Pennsylvania Game News 70(8):10– 13.
Alt, G. L., and J. S. Lindzey. 1980. Movements and behavior of bears tracked by radio. Science in Agriculture, Pennsylvania State University , College of Agriculture, Agricultural Experiment Station 28(1)7.
Alt, G. L., C. R. McLaughlin , and K. H. Pollock. 1985. Ear tag loss by black bears in Pennsy lvania. Journal of Wildlife Management 49:316– 320.
Anonymous. 1952. The black bear in Pennsylvania. Pennsylvania Game News 23(4):11– 18.
Falker, S. T., and M. C. Brittingham. 1998. Black bears. Wildlife damage control publication Number 3. Pennsylvania State University , College of Agricultural Sciences Cooperative Extension, University Park, Pennsylvania. 3pp.
Fegely, T. 1980. Black monster of the Promised Land. Pennsylvania Game News 51(11):21– 24.
Fergus, C. Black bear. Wildlife Notes 175-29, Black bear. Pennsylvania Game Co mmission, Harrisburg, Pennsylvania. 2pp. Informational brochure.
Giles, J. M. 1978. Bear management: an increasing worldwide concern. Pennsy lvania Game News 49(8):23– 25.
Giles, J. M. 1981. A brief acc ount of the m anagement and natural history of the Pennsy lvania black bear. Pennsylvania Game News 52(4):26– 33.
Giles, J. M. 1982. Bear 424-956. Pennsylvania Game News 53(4):8– 9.
Giles, J. M., and W. K. Shope. 1981. Aging the 1979 Pennsylvania hunter-killed black bears. Pennsy lvania Game News 52(2):19– 20.
Gordon, S. E. 1922. The black bear as a game animal in Pennsylvania. Bulletin of the American Game Protective Association 2(1):2– 5.
Kirkpatrick, C. E. , D. A. Le iby, D. Abraham, and C. H. Duffy III. 1986. Gongylonema pulchrum molin (Nematoda: Gongy lonematidae) in black bears (Ursus americanus pallus) from Pennsy lvania. Journal of Wildlife Diseases 22:119– 121.
Kordek, W. S. 1973. An investigation of the structure, stability, and m ovements of Pennsy lvania black bear with particular emphasis on Pike county . M.S. Thesis, Pennsylvania State Univers ity, Univers ity P ark, Pennsylvania. 77pp.
Kordek, W. S., and J. M. Giles. 1978. Weights of Pennsylvania bears. Pe nnsylvania Game News 49(10):8– 9.
Kulp, B. 1987. How I got the Number 3 bear. Pennsy lvania Game News 58(2):26– 30.
Lindzey, J. S., W. S. Kordek, and et al. 1976. The black bear in Pennsy lvania: stat us, movements, values, and management. International Conference on Bear Research and Management 3:215– 224.
Marks, T. A. 1998. Bear da ys. Pennsy lvania Game News 69(3):32– 33.
Matula, G. J. 1976. Behavioral and phy siological characteristics of black bears in northeas tern Pennsylvania. M.S. Thesis, Pennsy lvania State University, University Park, Pennsylvania. 187pp.
Matula, G. J., Jr., and J. S. Lindzey. 1976. Blood analysis, a potential res earch tool for s tudies of black bears . Transactions of the Northeastern Fish and Wildlife Conference 33:57– 69.
Maugans, B. 1987. Number 1 black bear. Pennsylvania Game News 58(2):3.
Pennsylvania Game Commi ssion. 1975. Pennsylvania hunting facts: hunting seasons and bag limits, game harvests and related st atistics from 1915 through 1974. Pennsylvania Game Co mmission, Harrisburg, Pennsylvania. Informational brochure.
Pennsylvania Game Commi ssion. 2000. Living with Pennsylvania’s black bear. Pennsy lvania Game Commission, Harrisburg, Pennsy lvania. 6pp. Informational brochure.

Pennsylvania General A ssembly. 1905. Pages 248– 255 in Laws of the General Assem bly of the Commonwealth of Pennsylvania passed at the session of 1905. WM. Stanley Ray, State Printer of Pennsylvania, Harrisburg, Pennsylvania.
Pennsylvania General A ssembly. 1919. Pages 822– 829 in Laws of the General Assem bly of the Commonwealth of Pennsylvania passed at th e session of 1919. J.L.L. Kuhn, Printer to the Commonwealth, Harrisburg, Pennsylvania.
Pennsylvania General A ssembly. 1921. Pages 420– 421 in Laws of the General Assem bly of the Commonwealth of Pennsy lvania passed at the session of 1921. J.L.L. Kuhn, Printer to the Commonwealth, Harrisburg, Pennsylvania.
Rose, L. 2001. Bear check stations, a wealth of information. Pennsylvania Game News 72(2)19– 21.
Storm, G. L., G. L. Alt, G. J. Matula Jr., and R. A. Nelson. 1988. Blood chemistry of black bears from Pennsylvania during winter dormancy . Journal of Wildlife Diseases 24:515– 521.
Ternent, M. A. 2002. 2001 bear season. Pennsy lvania Game News 73(8):8– 12.
Wakefield, G. C. 1969. Movements, habitat, and population characteristics of the Am erican black bear in Pennsylvania. M.S. Thesis, Pennsy lvania State University, University Park, Pennsylvania. 95pp.
Wakefield, G. C. 1972. A su mmary of the black bear population characteristics in Pennsy lvania. International Conference on Bear Res earch and Management 2:43– 52.
Wutsch, A. 2001. Have y ou ever eaten bear meat? Pennsylvania Game News 72(11):31– 33.
61
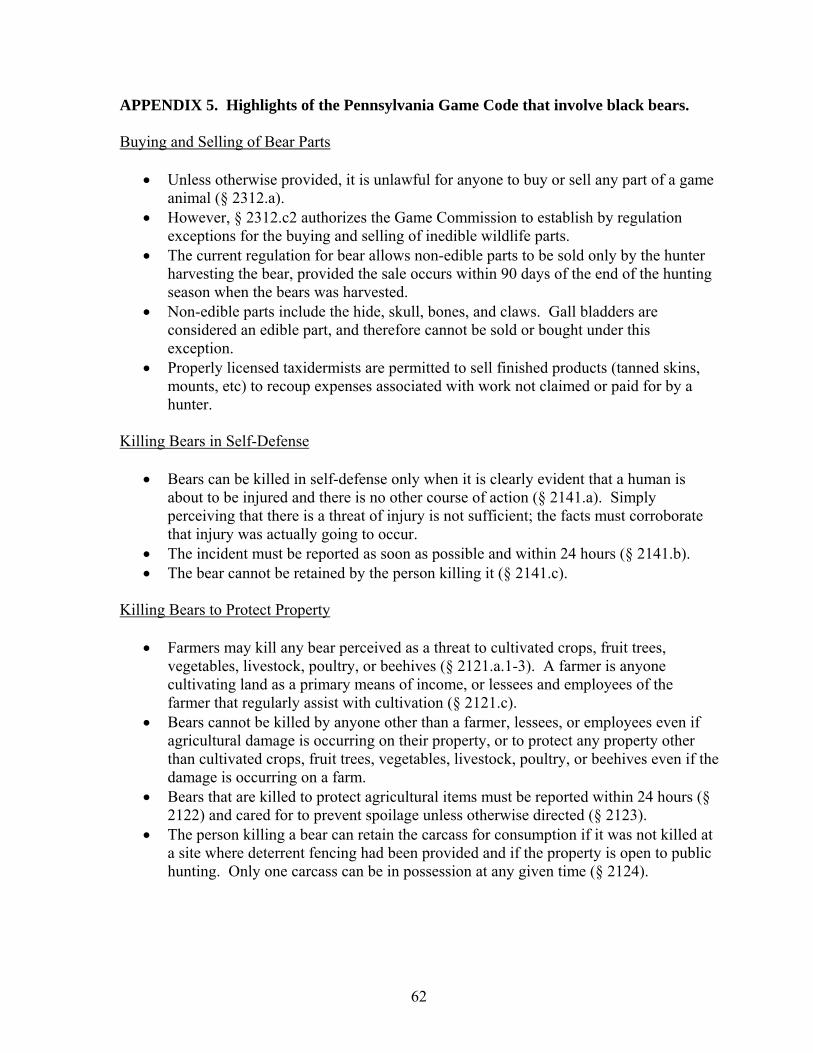
APPENDIX 5. Highlights of the Pennsylvania Game Code that involve black bears. Buying and Selling of Bear Parts
• Unless otherwise provided, it is unlawful for anyone to buy or sell any part of a game animal (§ 2312.a).
• However, § 2312.c2 authorizes the Game Commission to establish by regulation exceptions for the buying and selling of inedible wildlife parts.
• The current regulation for bear allows non-edible parts to be sold only by the hunter harvesting the bear, provided the sale occurs within 90 days of the end of the hunting season when the bears was harvested.
• Non-edible parts include the hide, skull, bones, and claws. Gall bladders are considered an edible part, and therefore cannot be sold or bought under this exception.
• Properly licensed taxidermists are permitted to sell finished products (tanned skins, mounts, etc) to recoup expenses associated with work not claimed or paid for by a hunter.
Killing Bears in Self-Defense
• Bears can be killed in self-defense only when it is clearly evident that a human is about to be injured and there is no other course of action (§ 2141.a). Simply perceiving that there is a threat of injury is not sufficient; the facts must corroborate that injury was actually going to occur.
• The incident must be reported as soon as possible and within 24 hours (§ 2141.b). • The bear cannot be retained by the person killing it (§ 2141.c).
Killing Bears to Protect Property
• Farmers may kill any bear perceived as a threat to cultivated crops, fruit trees, vegetables, livestock, poultry, or beehives (§ 2121.a.1-3). A farmer is anyone cultivating land as a primary means of income, or lessees and employees of the farmer that regularly assist with cultivation (§ 2121.c).
• Bears cannot be killed by anyone other than a farmer, lessees, or employees even if agricultural damage is occurring on their property, or to protect any property other than cultivated crops, fruit trees, vegetables, livestock, poultry, or beehives even if the damage is occurring on a farm.
• Bears that are killed to protect agricultural items must be reported within 24 hours (§ 2122) and cared for to prevent spoilage unless otherwise directed (§ 2123).
• The person killing a bear can retain the carcass for consumption if it was not killed at a site where deterrent fencing had been provided and if the property is open to public hunting. Only one carcass can be in possession at any given time (§ 2124).
62
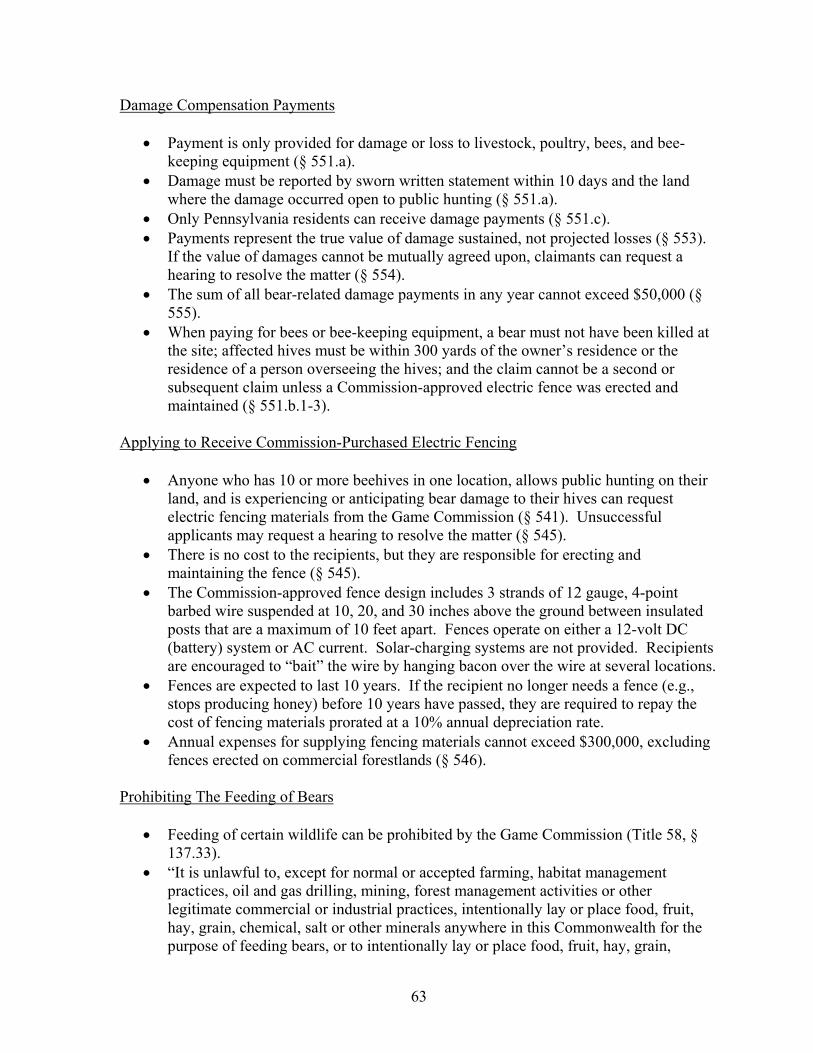
Damage Compensation Payments
• Payment is only provided for damage or loss to livestock, poultry, bees, and bee-keeping equipment (§ 551.a).
• Damage must be reported by sworn written statement within 10 days and the land where the damage occurred open to public hunting (§ 551.a).
• Only Pennsylvania residents can receive damage payments (§ 551.c). • Payments represent the true value of damage sustained, not projected losses (§ 553).
If the value of damages cannot be mutually agreed upon, claimants can request a hearing to resolve the matter (§ 554).
• The sum of all bear-related damage payments in any year cannot exceed $50,000 (§ 555).
• When paying for bees or bee-keeping equipment, a bear must not have been killed at the site; affected hives must be within 300 yards of the owner’s residence or the residence of a person overseeing the hives; and the claim cannot be a second or subsequent claim unless a Commission-approved electric fence was erected and maintained (§ 551.b.1-3).
Applying to Receive Commission-Purchased Electric Fencing
• Anyone who has 10 or more beehives in one location, allows public hunting on their land, and is experiencing or anticipating bear damage to their hives can request electric fencing materials from the Game Commission (§ 541). Unsuccessful applicants may request a hearing to resolve the matter (§ 545).
• There is no cost to the recipients, but they are responsible for erecting and maintaining the fence (§ 545).
• The Commission-approved fence design includes 3 strands of 12 gauge, 4-point barbed wire suspended at 10, 20, and 30 inches above the ground between insulated posts that are a maximum of 10 feet apart. Fences operate on either a 12-volt DC (battery) system or AC current. Solar-charging systems are not provided. Recipients are encouraged to “bait” the wire by hanging bacon over the wire at several locations.
• Fences are expected to last 10 years. If the recipient no longer needs a fence (e.g., stops producing honey) before 10 years have passed, they are required to repay the cost of fencing materials prorated at a 10% annual depreciation rate.
• Annual expenses for supplying fencing materials cannot exceed $300,000, excluding fences erected on commercial forestlands (§ 546).
Prohibiting The Feeding of Bears
• Feeding of certain wildlife can be prohibited by the Game Commission (Title 58, § 137.33).
• “It is unlawful to, except for normal or accepted farming, habitat management practices, oil and gas drilling, mining, forest management activities or other legitimate commercial or industrial practices, intentionally lay or place food, fruit, hay, grain, chemical, salt or other minerals anywhere in this Commonwealth for the purpose of feeding bears, or to intentionally lay or place food, fruit, hay, grain,
63
chemical, salt or other minerals that may cause bear to congregate or habituate an area. If songbird feeders are being used by bears, the Commission may issue a written notice prohibiting the songbird feeding.”
• Regulation given final approval at April 2003 Board of Game Commissioners meeting.
• Expiration (sunset) date of October 2004 removed from regulation in July 2004. Hunting Restrictions
• Only manually operated centerfire rifles, handguns and shotguns; muzzleloading firearms of any caliber; long, recurve, and compound bows; or crossbows can be used.
• Bullets must be designed to expand on impact, and bullets or balls must be all-lead. Buckshot is illegal. Arrows must be fitted with broadheads of cutting edge design.
• Hunters cannot use electronic devices to locate bears fitted with radiotransmitters or alert other hunters to the presence of game. Electronic calls, and any device that emits a beam of light onto the animal also are prohibited.
• Hunting near bait or areas baited within the past 30 days is prohibited (Title 34, § 2308.a8). Lures or scents are considered bait and cannot be used.
• Bears in dens cannot be killed or harassed. • Organized parties of hunters cannot exceed 25 people, and they must maintain a
roster of hunters belonging to the group. (Title 58, § 141.42) • It is unlawful to hunt, disturb, or chase bears within 150 yards of any building (i.e.,
Safety Zone) without the permission of the occupants. • It is unlawful to hunt from a vehicle, have a loaded firearm in a vehicle, or exit a
vehicle and shoot at bears unless the hunter has moved at least 25 yards from the roadway. Shooting at bears on roads open to public travel, and shooting over a road is prohibited unless the bullet trajectory is high enough to not be a danger.
• At least 250 square inches of fluorescent orange on the head, chest and back combined so as to be visible 360 degrees is required while hunting bear.
• Hunters are required to make a reasonable effort to retrieve any bears injured or killed.
• Bears must be tagged by the successful hunter before being moved. • Tagged bears must be taken to an established check station within 24 hours of
harvest. Hunters must bring their hunting license, bear license, and proof of identification with them to the check station (Title 34, § 2323.a2).
• Bears cannot be hunted on Sunday. Possession of Vehicle-Killed Bears
• Unlike deer, individuals that kill a bear with a vehicle cannot pick up the carcass and keep it in their possession (Title 34, § 2307).
• However, carcasses of vehicle-killed bears that are salvageable may be sold by the Game Commission, including to the individuals who struck the bear (Title 58 §147.141).
64
APPENDIX 6. Pennsylvania Nuisance Black Bear Policy approved by Board of Game Commissioners, January 23, 2001.
****** BUREAU OF WILDLIFE MANAGEMENT
Policy Item – A request to approve an agency policy concerning the handling of black bear conflicts. Commentary: Pennsylvania’s black bear population has noticeably increased and expanded in range since the late 1970s. From two core areas in the northcentral and northeast regions, the population has grown to include an estimated 10,000+ animals distributed across two-thirds of the state. Expansion of human development and residential areas into occupied bear habitats has also occurred. Unsurprisingly, the number of human-bear conflicts has increased, and responding to bear incidents is now a common duty for many Pennsylvania Game Commission personnel in all regions of the state. Teaching people about bears resolves many of the conflicts encountered and information/education efforts are currently used by all regions, but some incidents require additional action. A policy for dealing with these incidents was needed to provide direction and address a growing public concern. 5501 – Bear Response Policy Bear in Boroughs, Towns and Cities Public Education, Hazing, and Coordination with Local Authorities Transient bears pose minimal threat to public safety under m ost circumstances, and educating the public about bears may be the only required intervention. However, if a Pennsylvania Game Commission employee or Deputy Wildlife Conservation Officer considers it unlikely that a bear will leave an area on its own, he or she w ill work with local authorities to haze the bear away from the borough, town or city. Hazing includes any activity intended to m ove or lure a black bear in a desired direction, such as crowd control, traffic control, or noise (i.e., cracker shells). Immobilization and Relocation is authorized when it has been determ ined that a bear cannot leave an area on its own, creates a traffic or othe r hazard, or is in imminent danger. The bear will be relocated to the nearest suitable habitat. Destruction is authorized when a bear presents an i mminent threat to public health or saf ety and immobilization is not feasible, or when a bear is deem ed a hum an-habituated nuisance and previous relocation efforts have failed to resolve the problem.
65
Bear Exhibiting Aggressive Behavior Reducing Attractants, Hazing, Aversive Conditioning, or Tranquilization and Relocation Foods that encourage bears to aggressively approach hum ans should be discouraged or removed. Bears exhibiting aggressive behavi or m ay be hazed, subjected to aversive conditioning, or immobilized and relocated to a suitable, non-conflict area depending on the situation. Aversive conditioning m ay include the use of rubber bullets, pepper spray, water, loud noises or other devices and activities that associate a negative stim ulus with the unwanted bear behavior. Aggression due to defense of young outside of residential areas will not be interpreted as unnatural or unprovoked behavior. Destruction is authorized if a bear exhibits aggression that presents an im minent threat to public health or safety. Any Pennsylvani a Game Commission employee or Deputy W ildlife Conservation Officer m ay m ake this em ergency determ ination and take action without consent from the Region Director or his designee. In those instances where action m ust precede regional notification, a full report will be made to the Region Director im mediately after the animal is destroyed and the scene controlled. Property Damage Preventative Measures Taken by Landowner Pennsylvania Gam e Com mission em ployees and Deputy W ildlife Conservation Officers will work with landowners and hom eowners to prevent or m inimize bear-related conflicts on their properties by providing technical advice (e.g., on the use of bird and other wildlife feeder s, securing food sources, etc.) or assistance (e.g., permanent fencing as provided under Title 34, temporary fencing, repellent, equipment for hazing bear, etc.). Hazing and Aversive Conditioning is authorized if preventative m easures fail to adequately reduce damage. Immobilization and Relocation is authorized if preventative m easures, hazing, or aversive conditioning fail to reduce damage or are impractical. Relocation should occur in a suitable, non-conflict area as far as possible from the site of damage. Destruction is authorized if the responsible bear is identifiable, a clear history of persistent property dam age is apparent, and previous re location ef forts have f ailed to resolve the problem. Injured or Orphaned Bears Immobilization and Relocation Bears are resilient and can recover from most injuries without assistance. However, bears that threaten public safety or appear to require treatment for recovery may be immobilized and relocated to the nearest suitable habitat.
66

Orphaned bears cubs will be placed with an adoptive female bear. If adoption is not possible, orphaned cubs will be rehabilitated and released to the wild if hum an habituation did not occurred during captivity. Destruction is authorized when chance of recovery from injury is deem ed unlikely or impractical, or if human habituation precludes release into the wild. General Comments Any bear that is immobilized will be inspected for ear-tags and tagged in both ears prior to release. Any carcass that results from destruction of a black bear will be utilized in an appropriate manner as determined by the Region Director or his designee.
******
67

APPENDIX 7. Summary of black bear hunting regulations in the U.S. (modified from Scheick 2002). Dog State or Listed Any Bear Hunting Province Status Season Season Baiting Comments Alabama Game No No No Small population in very southern Alabama only. Alaska Gam e Yes Yes Yes Dogs and bait require permits, use of dogs is very rare. Arizona Game Yes Yes No* *Baiting season in commission rules, but has not been authorized in over 15 years. Arkansas Game Yes No No* *No harvest over bait, can bait 30 days prior to start of season. California Gam e Yes Yes No Colorado Gam e Yes No No Connecticut Protected No No No Delaware Exotic No No No No wild bear population since colonial times. Florida Threatened* No No No** *State designation except in 2 counties with no listed status, **Baiting for deer is legal on private lands, which feeds bears. Georgia Gam e Yes Yes No* *No harvest over bait, can bait all year except for during season or 2 week prior. Hawaii Unclassified* No No No *Not part of historic or current bear range. Idaho Gam e Yes Yes Yes Illinois Extirpated No No No No wild bear population, may be some transients. Indiana Extirpated No No No Iowa Game No No No No wild bear population, occasional transients from Minnesota or Wisconsin. Kansas Wildlife No No No No wild bear population, incidental sightings in extreme southeast and far west. Kentucky Protected No No No Louisiana Threatened* No No No *Federal designation. Maine Game No Yes Yes Trapping also permitted. Maryland Game Yes No No First season occurred in fall 2004. Massachusetts Gam e Yes No No Michigan Gam e Yes Yes Yes Minnesota Game Yes No Yes Mississippi Endangered* No No No** *State designation, southern half also Federally designated as Threatened for U. a. luteolus, **Feeding wildlife is legal. Missouri Rare No No No
68
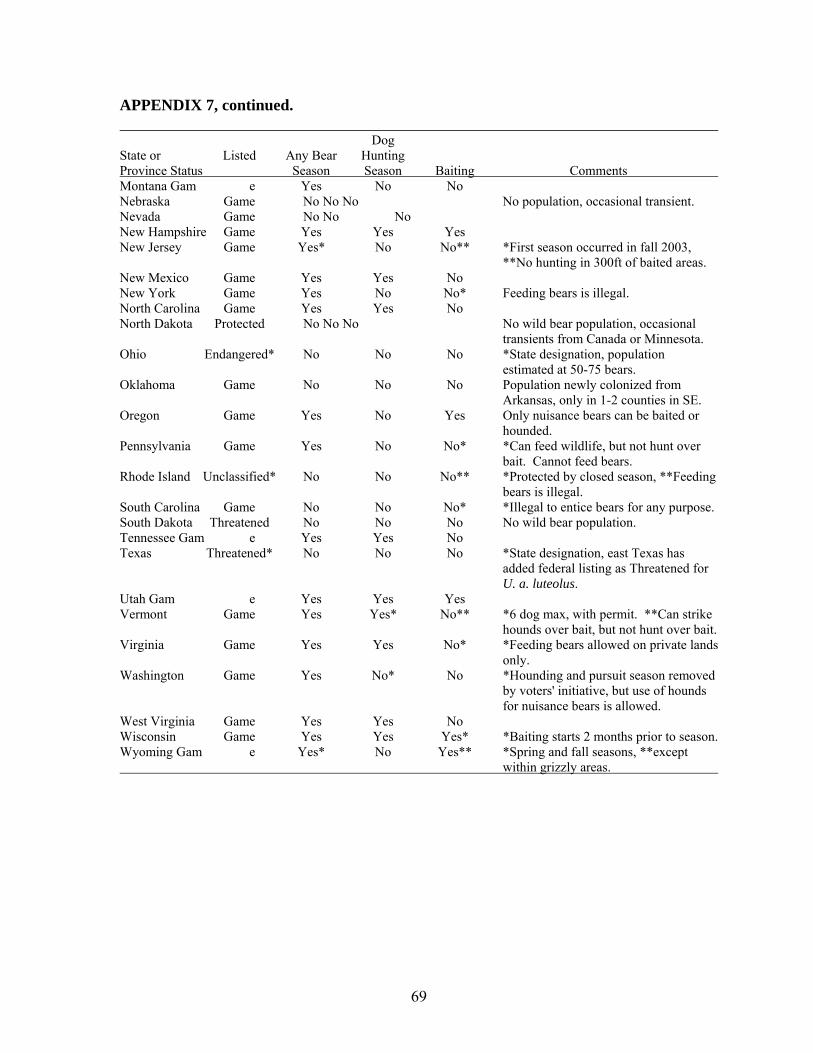
APPENDIX 7, continued. Dog State or Listed Any Bear Hunting Province Status Season Season Baiting Comments Montana Gam e Yes No No Nebraska Game No No No No population, occasional transient. Nevada Game No No No New Hampshire Game Yes Yes Yes New Jersey Game Yes* No No** *First season occurred in fall 2003, **No hunting in 300ft of baited areas. New Mexico Game Yes Yes No New York Game Yes No No* Feeding bears is illegal. North Carolina Game Yes Yes No North Dakota Protected No No No No wild bear population, occasional transients from Canada or Minnesota. Ohio Endangered* No No No *State designation, population estimated at 50-75 bears. Oklahoma Game No No No Population newly colonized from Arkansas, only in 1-2 counties in SE. Oregon Game Yes No Yes Only nuisance bears can be baited or hounded. Pennsylvania Game Yes No No* *Can feed wildlife, but not hunt over bait. Cannot feed bears. Rhode Island Unclassified* No No No** *Protected by closed season, **Feeding bears is illegal. South Carolina Game No No No* *Illegal to entice bears for any purpose. South Dakota Threatened No No No No wild bear population. Tennessee Gam e Yes Yes No Texas Threatened* No No No *State designation, east Texas has added federal listing as Threatened for U. a. luteolus. Utah Gam e Yes Yes Yes Vermont Game Yes Yes* No** *6 dog max, with permit. **Can strike hounds over bait, but not hunt over bait. Virginia Game Yes Yes No* *Feeding bears allowed on private lands only. Washington Game Yes No* No *Hounding and pursuit season removed by voters' initiative, but use of hounds for nuisance bears is allowed. West Virginia Game Yes Yes No Wisconsin Game Yes Yes Yes* *Baiting starts 2 months prior to season. Wyoming Gam e Yes* No Yes** *Spring and fall seasons, **except within grizzly areas.
69
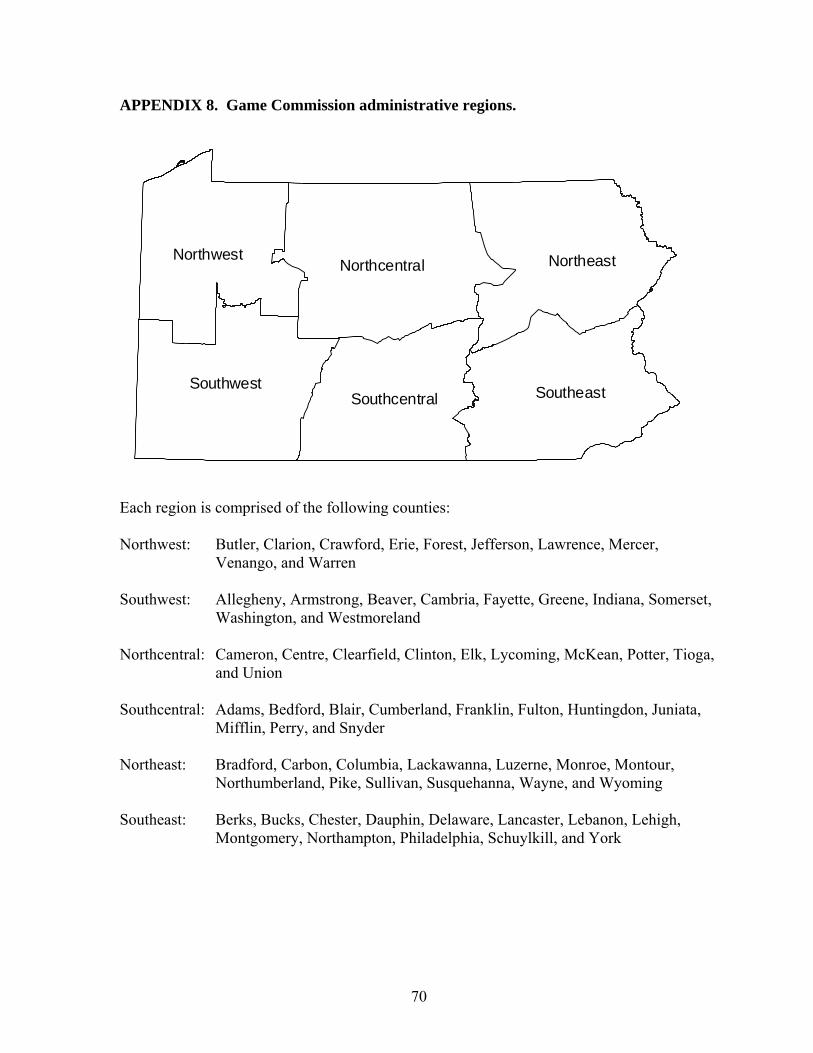
APPENDIX 8. Game Commission administrative regions.
NortheastNorthcentral
Southwest Southeast
Northwest
Southcentral
Each region is comprised of the following counties: Northwest: Butler, Clarion, Crawford, Erie, Forest, Jefferson, Lawrence, Mercer,
Venango, and Warren Southwest: Allegheny, Armstrong, Beaver, Cambria, Fayette, Greene, Indiana, Somerset,
Washington, and Westmoreland Northcentral: Cameron, Centre, Clearfield, Clinton, Elk, Lycoming, McKean, Potter, Tioga,
and Union Southcentral: Adams, Bedford, Blair, Cumberland, Franklin, Fulton, Huntingdon, Juniata,
Mifflin, Perry, and Snyder Northeast: Bradford, Carbon, Columbia, Lackawanna, Luzerne, Monroe, Montour,
Northumberland, Pike, Sullivan, Susquehanna, Wayne, and Wyoming Southeast: Berks, Bucks, Chester, Dauphin, Delaware, Lancaster, Lebanon, Lehigh,
Montgomery, Northampton, Philadelphia, Schuylkill, and York
70
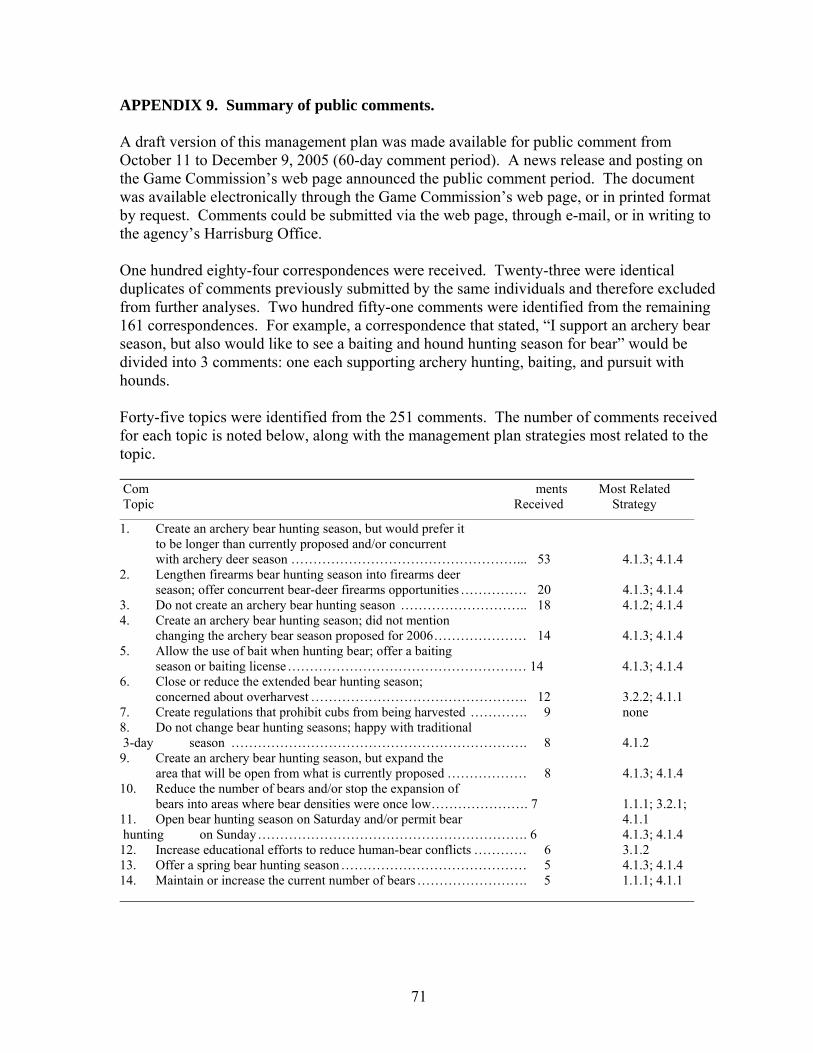
APPENDIX 9. Summary of public comments. A draft version of this management plan was made available for public comment from October 11 to December 9, 2005 (60-day comment period). A news release and posting on the Game Commission’s web page announced the public comment period. The document was available electronically through the Game Commission’s web page, or in printed format by request. Comments could be submitted via the web page, through e-mail, or in writing to the agency’s Harrisburg Office. One hundred eighty-four correspondences were received. Twenty-three were identical duplicates of comments previously submitted by the same individuals and therefore excluded from further analyses. Two hundred fifty-one comments were identified from the remaining 161 correspondences. For example, a correspondence that stated, “I support an archery bear season, but also would like to see a baiting and hound hunting season for bear” would be divided into 3 comments: one each supporting archery hunting, baiting, and pursuit with hounds. Forty-five topics were identified from the 251 comments. The number of comments received for each topic is noted below, along with the management plan strategies most related to the topic. Com ments Most Related Topic Received Strategy
1. Create an archery bear hunting season, but would prefer it to be longer than currently proposed and/or concurrent with archery deer season ……………………………………………... 53 4.1.3; 4.1.4 2. Lengthen firearms bear hunting season into firearms deer season; offer concurrent bear-deer firearms opportunities …………… 20 4.1.3; 4.1.4 3. Do not create an archery bear hunting season ……………………….. 18 4.1.2; 4.1.4 4. Create an archery bear hunting season; did not mention changing the archery bear season proposed for 2006 ………………… 14 4.1.3; 4.1.4 5. Allow the use of bait when hunting bear; offer a baiting season or baiting license ……………………………………………… 14 4.1.3; 4.1.4 6. Close or reduce the extended bear hunting season; concerned about overharvest …………………………………………. 12 3.2.2; 4.1.1 7. Create regulations that prohibit cubs from being harvested …………. 9 none 8. Do not change bear hunting seasons; happy with traditional 3-day season …………………………………………………………. 8 4.1.2 9. Create an archery bear hunting season, but expand the area that will be open from what is currently proposed ……………… 8 4.1.3; 4.1.4 10. Reduce the number of bears and/or stop the expansion of bears into areas where bear densities were once low…………………. 7 1.1.1; 3.2.1; 11. Open bear hunting season on Saturday and/or permit bear 4.1.1 hunting on Sunday ……………………………………………………. 6 4.1.3; 4.1.4 12. Increase educational efforts to reduce human-bear conflicts ………… 6 3.1.2 13. Offer a spring bear hunting season …………………………………… 5 4.1.3; 4.1.4 14. Maintain or increase the current number of bears ……………………. 5 1.1.1; 4.1.1
71
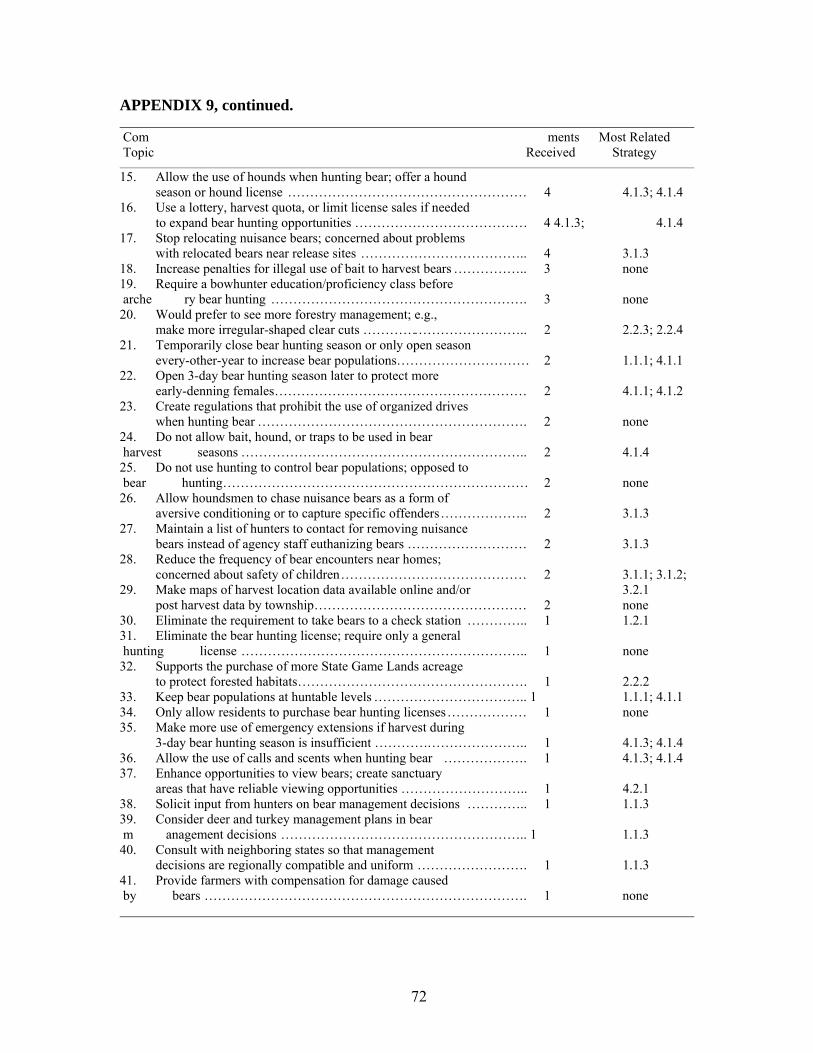
APPENDIX 9, continued. Com ments Most Related Topic Received Strategy
15. Allow the use of hounds when hunting bear; offer a hound season or hound license ……………………………………………… 4 4.1.3; 4.1.4 16. Use a lottery, harvest quota, or limit license sales if needed to expand bear hunting opportunities ………………………………… 4 4.1.3; 4.1.4 17. Stop relocating nuisance bears; concerned about problems with relocated bears near release sites ……………………………….. 4 3.1.3 18. Increase penalties for illegal use of bait to harvest bears …………….. 3 none 19. Require a bowhunter education/proficiency class before arche ry bear hunting …………………………………………………. 3 none 20. Would prefer to see more forestry management; e.g., make more irregular-shaped clear cuts ……………………………….. 2 2.2.3; 2.2.4 21. Temporarily close bear hunting season or only open season every-other-year to increase bear populations………………………… 2 1.1.1; 4.1.1 22. Open 3-day bear hunting season later to protect more early-denning females………………………………………………… 2 4.1.1; 4.1.2 23. Create regulations that prohibit the use of organized drives when hunting bear ……………………………………………………. 2 none 24. Do not allow bait, hound, or traps to be used in bear harvest seasons ……………………………………………………….. 2 4.1.4 25. Do not use hunting to control bear populations; opposed to bear hunting…………………………………………………………… 2 none 26. Allow houndsmen to chase nuisance bears as a form of aversive conditioning or to capture specific offenders ……………….. 2 3.1.3 27. Maintain a list of hunters to contact for removing nuisance bears instead of agency staff euthanizing bears ……………………… 2 3.1.3 28. Reduce the frequency of bear encounters near homes; concerned about safety of children …………………………………… 2 3.1.1; 3.1.2; 29. Make maps of harvest location data available online and/or 3.2.1 post harvest data by township ………………………………………… 2 none 30. Eliminate the requirement to take bears to a check station ………….. 1 1.2.1 31. Eliminate the bear hunting license; require only a general hunting license ……………………………………………………….. 1 none 32. Supports the purchase of more State Game Lands acreage to protect forested habitats ……………………………………………. 1 2.2.2 33. Keep bear populations at huntable levels …………………………….. 1 1.1.1; 4.1.1 34. Only allow residents to purchase bear hunting licenses ……………… 1 none 35. Make more use of emergency extensions if harvest during 3-day bear hunting season is insufficient …………………………….. 1 4.1.3; 4.1.4 36. Allow the use of calls and scents when hunting bear ………………. 1 4.1.3; 4.1.4 37. Enhance opportunities to view bears; create sanctuary areas that have reliable viewing opportunities ……………………….. 1 4.2.1 38. Solicit input from hunters on bear management decisions ………….. 1 1.1.3 39. Consider deer and turkey management plans in bear m anagement decisions ……………………………………………….. 1 1.1.3 40. Consult with neighboring states so that management decisions are regionally compatible and uniform ……………………. 1 1.1.3 41. Provide farmers with compensation for damage caused by bears ………………………………………………………………. 1 none
72
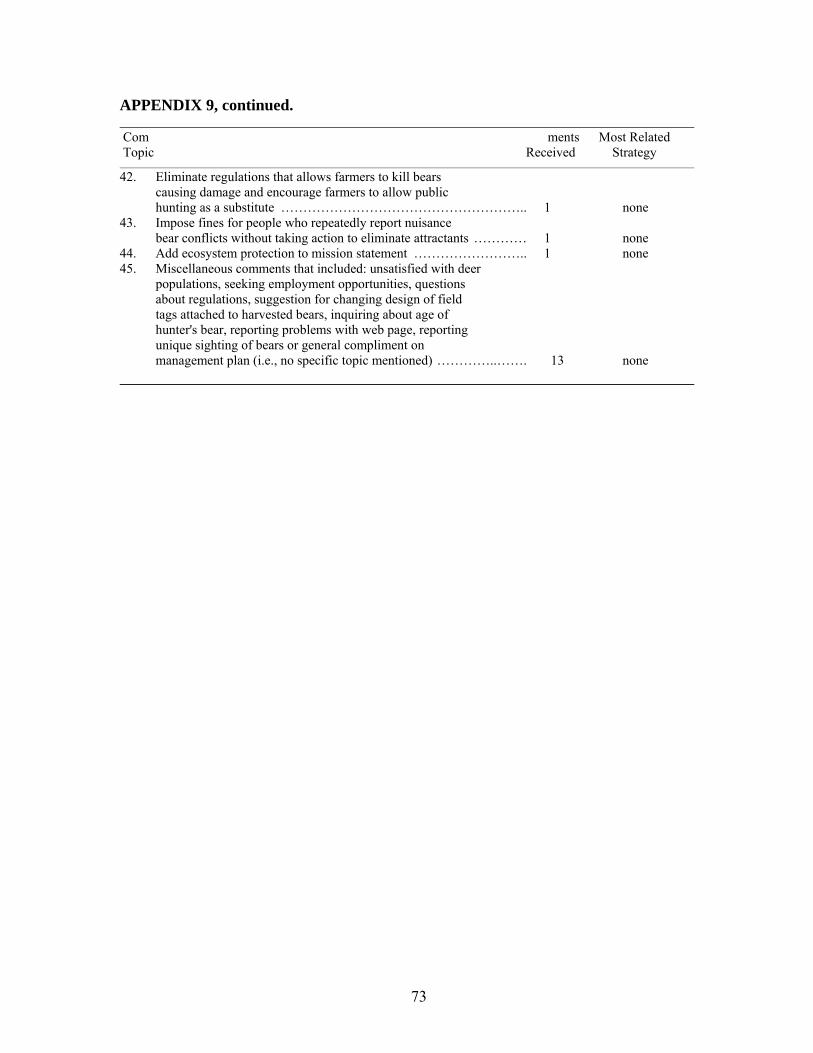
APPENDIX 9, continued. Com ments Most Related Topic Received Strategy
42. Eliminate regulations that allows farmers to kill bears causing damage and encourage farmers to allow public hunting as a substitute ……………………………………………….. 1 none 43. Impose fines for people who repeatedly report nuisance bear conflicts without taking action to eliminate attractants ………… 1 none 44. Add ecosystem protection to mission statement …………………….. 1 none 45. Miscellaneous comments that included: unsatisfied with deer populations, seeking employment opportunities, questions about regulations, suggestion for changing design of field tags attached to harvested bears, inquiring about age of hunter's bear, reporting problems with web page, reporting unique sighting of bears or general compliment on management plan (i.e., no specific topic mentioned) …………..……. 13 none
73

74