Embed Size (px)
Citation preview
Managerial Accounting2nd Edition
J. O'Callaghan
Managerial Accounting
by:J. O'Callaghan
Copyright © 2002 John Wiley & Sons, Inc. All rights reserved.
John Wiley & Sons, Inc.New York
0471413658
Due to electronic permissions issues, some material may have been removed from this chapter,though reference to it may occur in the text. The University of Phoenix has determined that thecontent presented herein satisfies the requirements for this course.
ii
Table of Contents
CHAPTER 1MANAGERIAL ACCOUNTING BASICS............................................................................. 5
COMPARING MANAGERIAL AND FINANCIAL ACCOUNTING........................... 6ETHICAL STANDARDS FOR MANAGERIAL ACCOUNTANTS............................... 7MANAGEMENT FUNCTIONS........................................................................................... 7
MANAGERIAL COST CONCEPTS....................................................................................... 9MANUFACTURING COSTS............................................................................................... 9PRODUCT VERSUS PERIOD COSTS............................................................................... 11
MANUFACTURING COSTS IN FINANCIAL STATEMENTS..................................... 13INCOME STATEMENT...................................................................................................... 13BALANCE SHEET............................................................................................................... 16COST CONCEPTS‐A REVIEW.......................................................................................... 18
CONTEMPORARY DEVELOPMENTS IN MANAGERIAL ACCOUNTING............. 20SERVICE INDUSTRY TRENDS......................................................................................... 20VALUE CHAIN MANAGEMENT.................................................................................... 22
APPENDIX 1A ACCOUNTING CYCLE FOR A MANUFACTURING COMPANY... 27WORK SHEET........................................................................................................................... 28CLOSING ENTRIES................................................................................................................ 30SUMMARY OF STUDY OBJECTIVE FOR APPENDIX 1A............................................. 32GLOSSARYū 67
CHAPTER 2COST ACCOUNTING SYSTEMS......................................................................................... 72
JOB ORDER COST SYSTEM.............................................................................................. 73PROCESS COST SYSTEM................................................................................................... 73
JOB ORDER COST FLOW...................................................................................................... 75ACCUMULATING MANUFACTURING COSTS.......................................................... 76ASSIGNING MANUFACTURING COSTS TO WORK IN PROCESS......................... 78ASSIGNING COSTS TO FINISHED GOODS.................................................................. 89ASSIGNING COSTS TO COST OF GOODS SOLD........................................................ 90SUMMARY OF JOB ORDER COST FLOWS.................................................................... 90
REPORTING JOB COST DATA............................................................................................ 92UNDER‐ OR OVERAPPLIED MANUFACTURING OVERHEAD................................ 93
INTERIM BALANCES........................................................................................................ 93YEAR‐END BALANCE....................................................................................................... 94
GLOSSARY.............................................................................................................................. 130CHAPTER 3
THE NATURE OF PROCESS COST SYSTEMS............................................................... 136USES OF PROCESS COST SYSTEMS............................................................................. 136
Managerial AccountingTable of Contents
iii
SIMILARITIES AND DIFFERENCES BETWEEN JOB ORDER COST AND PROCESSCOST SYSTEMS................................................................................................................. 138PROCESS COST FLOW.................................................................................................... 140ASSIGNMENT OF MANUFACTURING COSTS—JOURNAL ENTRIES................ 140
EQUIVALENT UNITS........................................................................................................... 145WEIGHTED‐AVERAGE METHOD................................................................................ 145REFINEMENTS ON THE WEIGHTED‐AVERAGE METHOD.................................. 146PRODUCTION COST REPORT....................................................................................... 148
COMPREHENSIVE EXAMPLE OF PROCESS COSTING............................................. 149COMPUTE THE PHYSICAL UNIT FLOW (STEP 1).................................................... 149COMPUTE EQUIVALENT UNITS OF PRODUCTION (STEP 2).............................. 150COMPUTE UNIT PRODUCTION COSTS (STEP 3)..................................................... 151PREPARE A COST RECONCILIATION SCHEDULE (STEP 4)................................. 152PREPARING THE PRODUCTION COST REPORT..................................................... 153
FINAL COMMENTS.............................................................................................................. 155APPENDIX 3A FIFO METHOD........................................................................................... 162EQUIVALENT UNITS UNDERFIFO................................................................................. 162
ILLUSTRATION................................................................................................................. 163COMPREHENSIVE EXAMPLE........................................................................................... 164
COMPUTE THE PHYSICAL UNIT FLOW (STEP 1).................................................... 165COMPUTE EQUIVALENT UNITS OF PRODUCTION (STEP 2).............................. 166COMPUTE UNIT PRODUCTION COSTS (STEP 3)..................................................... 167PREPARE A COST RECONCILIATION SCHEDULE (STEP 4)................................. 168PREPARING THE PRODUCTION COST REPORT..................................................... 169
FIFO AND WEIGHTED‐AVERAGE................................................................................... 171SUMMARY OF STUDY OBJECTIVE FOR APPENDIX 3A........................................... 171GLOSSARY.............................................................................................................................. 207
CHAPTER 4ACTIVITY‐BASED COSTING VERSUS TRADITIONAL COSTING........................ 213
TRADITIONAL COSTING SYSTEMS............................................................................ 213THE NEED FOR A NEW COSTING SYSTEM.............................................................. 214ACTIVITY‐BASED COSTING.......................................................................................... 215
ILLUSTRATION OF TRADITIONAL COSTING VERSUS ABC................................ 217UNIT COSTS UNDER TRADITIONAL COSTING...................................................... 217UNIT COSTS UNDER ABC.............................................................................................. 217COMPARING UNIT COSTS............................................................................................ 221
ACTIVITY‐BASED COSTING: A CLOSER LOOK......................................................... 224BENEFITS OF ABC............................................................................................................ 224LIMITATIONS OF ABC.................................................................................................... 225WHEN TO SWITCH TO ABC.......................................................................................... 226VALUE‐ADDED VERSUS NONVALUE‐ADDED ACTIVITIES................................ 226
ACTIVITY‐BASED COSTING IN SERVICE INDUSTRIES......................................... 228
Managerial AccountingTable of Contents
iv
TRADITIONAL COSTING EXAMPLE.......................................................................... 229ACTIVITY‐BASED COSTING EXAMPLE..................................................................... 230
JUST‐IN‐TIME PROCESSING............................................................................................ 232OBJECTIVE OF JIT PROCESSING.................................................................................. 233ELEMENTS OF JIT PROCESSING.................................................................................. 233BENEFITS OF JIT PROCESSING..................................................................................... 234
APPENDIX 4A HIERARCHY OF ACTIVITY LEVELS................................................... 238SUMMARY OF STUDY OBJECTIVE FOR APPENDIX 4A........................................... 241GLOSSARY.............................................................................................................................. 280
CHAPTER 5COST BEHAVIOR ANALYSIS............................................................................................ 287
VARIABLE COSTS............................................................................................................ 288FIXED COSTS..................................................................................................................... 289RELEVANT RANGE......................................................................................................... 290MIXED COSTS.................................................................................................................... 292IMPORTANCE OF IDENTIFYING VARIABLE AND FIXED COSTS....................... 295
COST‐VOLUME‐PROFIT ANALYSIS............................................................................... 296BASIC COMPONENTS..................................................................................................... 297CVP INCOME STATEMENT........................................................................................... 297BREAK‐EVEN ANALYSIS............................................................................................... 301MARGIN OF SAFETY....................................................................................................... 307TARGET NET INCOME................................................................................................... 308CVP AND CHANGES IN THE BUSINESS ENVIRONMENT.................................... 310CVP INCOME STATEMENT REVISITED..................................................................... 313
APPENDIX 5A VARIABLE COSTING.............................................................................. 317EFFECTS OF VARIABLE COSTING ON INCOME........................................................ 318RATIONALE FOR VARIABLE COSTING....................................................................... 320SUMMARY OF STUDY OBJECTIVE FOR APPENDIX 5A........................................... 321GLOSSARY.............................................................................................................................. 344
CHAPTER 6BUDGETING BASICS........................................................................................................... 350
BUDGETING AND ACCOUNTING.............................................................................. 351THE BENEFITS OF BUDGETING................................................................................... 351ESSENTIALS OF EFFECTIVE BUDGETING................................................................. 352LENGTH OF THE BUDGET PERIOD............................................................................ 352THE BUDGETING PROCESS.......................................................................................... 352BUDGETING AND HUMAN BEHAVIOR.................................................................... 353BUDGETING AND LONG‐RANGE PLANNING....................................................... 354THE MASTER BUDGET................................................................................................... 355
PREPARING THE OPERATING BUDGETS.................................................................... 356SALES BUDGET................................................................................................................. 356PRODUCTION BUDGET................................................................................................. 357
Managerial AccountingTable of Contents
v
DIRECT MATERIALS BUDGET...................................................................................... 358DIRECT LABOR BUDGET............................................................................................... 360MANUFACTURING OVERHEAD BUDGET............................................................... 360SELLING AND ADMINISTRATIVE EXPENSE BUDGET.......................................... 361BUDGETED INCOME STATEMENT............................................................................. 363
PREPARING THE FINANCIAL BUDGETS..................................................................... 364CASH BUDGET.................................................................................................................. 364BUDGETED BALANCE SHEET...................................................................................... 368
BUDGETING IN NONMANUFACTURING COMPANIES......................................... 370MERCHANDISERS........................................................................................................... 370SERVICE ENTERPRISES.................................................................................................. 372NOT‐FOR‐PROFIT ORGANIZATIONS......................................................................... 373
GLOSSARY.............................................................................................................................. 407CHAPTER 7
CONCEPT OF BUDGETARY CONTROL......................................................................... 413STATIC BUDGET REPORTS............................................................................................... 414
ILLUSTRATIONS.............................................................................................................. 415USES AND LIMITATIONS.............................................................................................. 416
FLEXIBLE BUDGETS............................................................................................................. 417WHY FLEXIBLE BUDGETS?............................................................................................ 418DEVELOPING THE FLEXIBLE BUDGET...................................................................... 421FLEXIBLE BUDGET—A CASE STUDY......................................................................... 421FLEXIBLE BUDGET REPORTS........................................................................................ 424MANAGEMENT BY EXCEPTION................................................................................. 425
THE CONCEPT OF RESPONSIBILITY ACCOUNTING............................................... 427CONTROLLABLE VERSUS NONCONTROLLABLE REVENUES AND COSTS.... 429RESPONSIBILITY REPORTING SYSTEM..................................................................... 430
TYPES OF RESPONSIBILITY CENTERS.......................................................................... 432RESPONSIBILITY ACCOUNTING FOR COST CENTERS......................................... 433RESPONSIBILITY ACCOUNTING FOR PROFIT CENTERS..................................... 434RESPONSIBILITY ACCOUNTING FOR INVESTMENT CENTERS......................... 437PRINCIPLES OF PERFORMANCE EVALUATION.................................................... 440
APPENDIX 7A RESIDUAL INCOME—ANOTHER PERFORMANCEMEASUREMENT.................................................................................................................... 446RESIDUAL INCOME COMPARED TOROI..................................................................... 447RESIDUAL INCOME WEAKNESS.................................................................................... 448SUMMARY OF STUDY OBJECTIVE FOR APPENDIX 7A........................................... 449GLOSSARY.............................................................................................................................. 485
CHAPTER 8THE NEED FOR STANDARDS........................................................................................... 490
DISTINGUISHING BETWEEN STANDARDS AND BUDGETS............................... 491WHY STANDARD COSTS?............................................................................................. 491
Managerial AccountingTable of Contents
vi
SETTING STANDARD COSTS—A DIFFICULT TASK................................................ 492IDEAL VERSUS NORMAL STANDARDS.................................................................... 493A CASE STUDY................................................................................................................. 493
VARIANCES FROM STANDARDS................................................................................... 498ANALYZING VARIANCES............................................................................................. 499REPORTING VARIANCES.............................................................................................. 513STATEMENT PRESENTATION OF VARIANCES....................................................... 514
APPENDIX 8A STANDARD COST ACCOUNTING SYSTEM................................... 519JOURNAL ENTRIES.............................................................................................................. 520LEDGER ACCOUNTS........................................................................................................... 522SUMMARY OF STUDY OBJECTIVE FOR APPENDIX 8A........................................... 523GLOSSARY.............................................................................................................................. 551
CHAPTER 9MANAGEMENT'S DECISION‐MAKING PROCESS.................................................... 557
INCREMENTAL ANALYSIS APPROACH................................................................... 557HOW INCREMENTAL ANALYSIS WORKS................................................................ 558
TYPES OF INCREMENTAL ANALYSIS........................................................................... 559ACCEPT AN ORDER AT A SPECIAL PRICE............................................................... 560MAKE OR BUY.................................................................................................................. 560SELL OR PROCESS FURTHER........................................................................................ 563RETAIN OR REPLACE EQUIPMENT........................................................................... 566ELIMINATE AN UNPROFITABLE SEGMENT............................................................ 567
SALES MIX.............................................................................................................................. 570BREAK‐EVEN SALES....................................................................................................... 570LIMITED RESOURCES..................................................................................................... 572
OTHER CONSIDERATIONS IN DECISION MAKING............................................... 574QUALITATIVE FACTORS............................................................................................... 574RELATIONSHIP OF INCREMENTAL ANALYSIS AND ACTIVITY‐BASED COSTING.5 7 5
GLOSSARY.............................................................................................................................. 604CHAPTER 10
THE CAPITAL BUDGETING EVALUATION PROCESS............................................. 611CASH FLOW INFORMATION....................................................................................... 612ILLUSTRATIVE DATA..................................................................................................... 613
CASH PAYBACK.................................................................................................................... 614NET PRESENT VALUE METHOD..................................................................................... 615
EQUAL ANNUAL CASH FLOWS.................................................................................. 616UNEQUAL ANNUAL CASH FLOWS........................................................................... 617CHOOSING A DISCOUNT RATE.................................................................................. 618SIMPLIFYING ASSUMPTIONS...................................................................................... 619COMPREHENSIVE EXAMPLE....................................................................................... 621
ADDITIONAL CONSIDERATIONS................................................................................. 622
Managerial AccountingTable of Contents
vii
INTANGIBLE BENEFITS................................................................................................. 622MUTUALLY EXCLUSIVE PROJECTS............................................................................ 624RISK ANALYSIS................................................................................................................ 626POST‐AUDIT OF INVESTMENT PROJECTS................................................................ 627
OTHER CAPITAL BUDGETING TECHNIQUES........................................................... 628INTERNAL RATE OF RETURN METHOD.................................................................. 628COMPARING DISCOUNTED CASH FLOW METHODS.......................................... 630ANNUAL RATE OF RETURN METHOD..................................................................... 631
GLOSSARY.............................................................................................................................. 660CHAPTER 11
SECTION 1 EXTERNAL SALES.......................................................................................... 666PRICING IN A COMPETITIVE MARKET....................................................................... 668COST‐PLUS PRICING.......................................................................................................... 669
LIMITATIONS OF COST‐PLUS PRICING.................................................................... 671TIME AND MATERIAL PRICING..................................................................................... 674SECTION 2 INTERNAL SALES.......................................................................................... 678NEGOTIATED TRANSFER PRICES.................................................................................. 680
NO EXCESS CAPACITY................................................................................................... 680EXCESS CAPACITY.......................................................................................................... 681VARIABLE COSTS............................................................................................................ 682SPECIAL ORDER............................................................................................................... 683SUMMARY OF NEGOTIATED TRANSFER PRICING APPROACH....................... 683
COST‐BASED TRANSFER PRICES................................................................................... 684MARKET‐BASED TRANSFER PRICES............................................................................. 685EFFECT OF OUTSOURCING ON TRANSFER PRICING............................................. 686TRANSFERS BETWEEN DIVISIONS IN DIFFERENT COUNTRIES........................ 686APPENDIX 11A OTHER COST APPROACHES TO PRICING.................................... 691ABSORPTION COST APPROACH.................................................................................... 691CONTRIBUTION (VARIABLE COST) APPROACH..................................................... 694SUMMARY OF STUDY OBJECTIVE FOR APPENDIX 11A......................................... 696COMPREHENSIVE PROBLEM: CHAPTERS 1–11.......................................................... 723GLOSSARY.............................................................................................................................. 730
CHAPTER 12THE STATEMENT OF CASH FLOWS: PURPOSE AND FORMAT............................ 735
PURPOSE OF THE STATEMENT OF CASH FLOWS................................................. 736MEANING OF “CASH FLOWS”.................................................................................... 736CLASSIFICATION OF CASH FLOWS........................................................................... 737SIGNIFICANT NONCASH ACTIVITIES....................................................................... 738FORMAT OF THE STATEMENT OF CASH FLOWS.................................................. 740THE CORPORATE LIFE CYCLE..................................................................................... 741USEFULNESS OF THE STATEMENT OF CASH FLOWS.......................................... 743PREPARING THE STATEMENT OF CASH FLOWS................................................... 744
Managerial AccountingTable of Contents
viii
INDIRECT AND DIRECT METHODS........................................................................... 745SECTION 1 STATEMENT OF CASH FLOWS—INDIRECT METHOD..................... 747FIRST YEAR OF OPERATIONS—2002.............................................................................. 747
STEP 1: DETERMINE THE NET INCREASE/DECREASE IN CASH........................ 748STEP 2: DETERMINE NET CASH PROVIDED/USED BY OPERATINGACTIVITIES........................................................................................................................ 749STEP 3: DETERMINE NET CASH PROVIDED/USED BY INVESTING ANDFINANCING ACTIVITIES............................................................................................... 751STATEMENT OF CASH FLOWS—2002........................................................................ 752
SECOND YEAR OF OPERATIONS—2003........................................................................ 753STEP 1: DETERMINE THE NET INCREASE/DECREASE IN CASH........................ 754STEP 2: DETERMINE NET CASH PROVIDED/USED BY OPERATINGACTIVITIES........................................................................................................................ 754STEP 3: DETERMINE NET CASH PROVIDED/USED BY INVESTING ANDFINANCING ACTIVITIES............................................................................................... 756STATEMENT OF CASH FLOWS—2003........................................................................ 758SUMMARY OF CONVERSION TO NET CASH PROVIDED BY OPERATINGACTIVITIES—INDIRECT METHOD............................................................................. 758
SECTION 1 STATEMENT OF CASH FLOWS—DIRECT METHOD.......................... 762FIRST YEAR OF OPERATIONS—2002.............................................................................. 762
STEP 1: DETERMINE THE NET INCREASE/DECREASE IN CASH........................ 764STEP 2: DETERMINE NET CASH PROVIDED/USED BY OPERATINGACTIVITIES........................................................................................................................ 764STEP 3: DETERMINE NET CASH PROVIDED/USED BY INVESTING ANDFINANCING ACTIVITIES............................................................................................... 769STATEMENT OF CASH FLOWS—2002........................................................................ 770
SECOND YEAR OF OPERATIONS—2003........................................................................ 771STEP 1: DETERMINE THE NET INCREASE/DECREASE IN CASH........................ 772STEP 2: DETERMINE NET CASH PROVIDED/USED BY OPERATINGACTIVITIES........................................................................................................................ 772STEP 3: DETERMINE NET CASH PROVIDED/USED BY INVESTING ANDFINANCING ACTIVITIES............................................................................................... 775STATEMENT OF CASH FLOWS—2003........................................................................ 776
USING CASH FLOWS TO EVALUATE A COMPANY................................................. 779FREE CASH FLOW............................................................................................................ 779CAPITAL EXPENDITURE RATIO.................................................................................. 781ASSESSING LIQUIDITY, SOLVENCY, AND PROFITABILITY USINGCASH FLOWS.................................................................................................................... 782
GLOSSARY.............................................................................................................................. 836CHAPTER 13
EARNING POWER AND IRREGULAR ITEMS.............................................................. 842DISCONTINUED OPERATIONS.................................................................................... 843
Managerial AccountingTable of Contents
ix
EXTRAORDINARY ITEMS.............................................................................................. 844CHANGES IN ACCOUNTING PRINCIPLE................................................................. 847COMPREHENSIVE INCOME......................................................................................... 849
COMPARATIVE ANALYSIS............................................................................................... 849HORIZONTAL ANALYSIS.............................................................................................. 851VERTICAL ANALYSIS..................................................................................................... 855
RATIO ANALYSIS................................................................................................................. 859LIQUIDITY RATIOS.......................................................................................................... 862SOLVENCY RATIOS......................................................................................................... 867PROFITABILITY RATIOS................................................................................................. 870
LIMITATIONS OF FINANCIAL ANALYSIS................................................................... 878ESTIMATES........................................................................................................................ 878COST....ū 878ALTERNATIVE ACCOUNTING METHODS............................................................... 879ATYPICAL DATA............................................................................................................. 879DIVERSIFICATION........................................................................................................... 879
GLOSSARY.............................................................................................................................. 931APPENDIX A
THE ANNUAL REPORT....................................................................................................... 935FINANCIAL HIGHLIGHTS................................................................................................. 936
Corporate Principles ......................................................................................................... 936Corporate Profile ............................................................................................................... 937
LETTER TO THE STOCKHOLDERS................................................................................. 937To Our Shareholders ........................................................................................................ 937Operating Report .............................................................................................................. 939
MANAGEMENT DISCUSSION AND ANALYSIS........................................................ 942Management's Discussion and Analysis of Financial Condition and Results ofOperations .......................................................................................................................... 942
FINANCIAL STATEMENTS AND ACCOMPANYING NOTES................................. 948Notes to Consolidated Financial Statements ................................................................ 953
AUDITOR'S REPORT............................................................................................................ 966Report of Independent Accountants .............................................................................. 967
SUPPLEMENTARY FINANCIAL INFORMATION....................................................... 967APPENDIX BAPPENDIX C
NATURE OF INTEREST....................................................................................................... 977SIMPLE INTEREST............................................................................................................ 978COMPOUND INTEREST................................................................................................. 978
SECTION 1 FUTURE VALUE CONCEPTS....................................................................... 979FUTURE VALUE OF A SINGLE AMOUNT..................................................................... 979FUTURE VALUE OF AN ANNUITY.................................................................................. 982SECTION 2 PRESENT VALUE CONCEPTS..................................................................... 985
Managerial AccountingTable of Contents
x
PRESENT VALUE VARIABLES.......................................................................................... 985PRESENT VALUE OF A SINGLE AMOUNT................................................................... 985PRESENT VALUE OF AN ANNUITY................................................................................ 988TIME PERIODS AND DISCOUNTING............................................................................ 991COMPUTING THE PRESENT VALUES IN A CAPITAL BUDGETINGDECISIONū 991GLOSSARY............................................................................................................................ 1000
APPENDIX DETHICAL BEHAVIOR FOR PRACTITIONERS OF MANAGEMENT ACCOUNTINGAND FINANCIAL MANAGEMENT............................................................................... 1001STANDARDS OF ETHICAL CONDUCT FOR PRACTITIONERS OF MANAGEMENTACCOUNTING AND FINANCIAL MANAGEMENT................................................. 1002
COMPETENCE................................................................................................................ 1002CONFIDENTIALITY....................................................................................................... 1002INTEGRITY....................................................................................................................... 1003OBJECTIVITY................................................................................................................... 1003RESOLUTION OF ETHICAL CONFLICT................................................................... 1003
AFTERWORDCASE‐1....ū 1007CARD‐MART SWIMS IN THE DOT‐COM SEA: JOB ORDER COSTING............. 1007
THE BUSINESS SITUATION......................................................................................... 1007CASE‐2....ū 1010CARD‐MART SWIMS IN THE DOT‐COM SEA: ACTIVITY‐BASED COSTING.. 1010
THE BUSINESS SITUATION......................................................................................... 1011CASE‐3....ū 1016CARD‐MART SWIMS IN THE DOT‐COM SEA: CAPITAL BUDGETING............ 1016
THE BUSINESS SITUATION......................................................................................... 1016CASE‐4....ū 1019CARD‐MART SWIMS IN THE DOT‐COM SEA: TRANSFER PRICING ISSUES. 1019
THE BUSINESS SITUATION......................................................................................... 1019CASE‐5....ū 1022RICHLAND CIRCULAR CLUB PRO RODEO ROUNDUP......................................... 1022
THE BUSINESS SITUATION......................................................................................... 1022
Managerial AccountingTable of Contents
xi
Managerial AccountingTable of Contents
xii
Chapter 8
Performance Evaluation Through Standard Costs
Navigator
• Scan Study Objectives
• Read Feature Story
• Read Preview
• Read text and answer Before You Go On
p. 327 □ p. 332 □ p. 341 □
• Work Using the Decision Toolkit
• Review Summary of Study Objectives
• Work Demonstration Problem
• Answer Self‐Study Questions
• Complete Assignments
Managerial AccountingChapter 8
Page 487
STUDY OBJECTIVES
After studying this chapter, you should be able to:
1. Distinguish between a standard and a budget.
2. Identify the advantages of standard costs.
3. Describe how standards are set.
4. State the formulas for determining direct materials and direct labor variances.
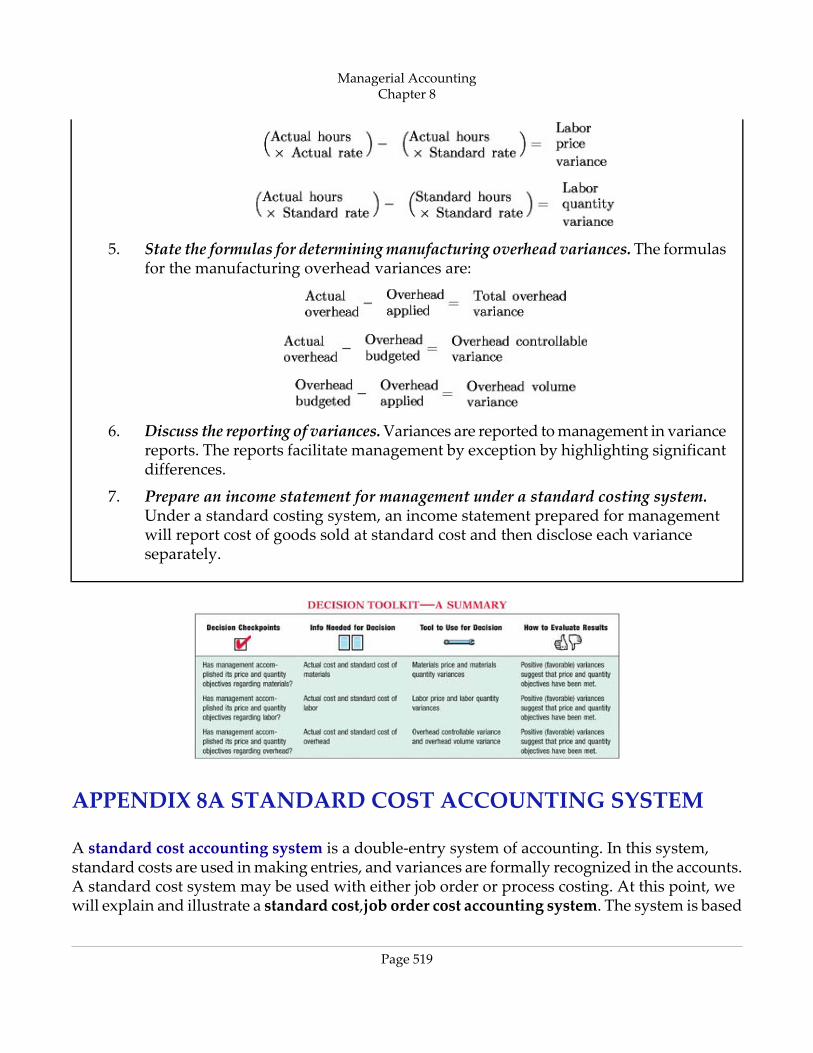
5. State the formulas for determining manufacturing overhead variances.
6. Discuss the reporting of variances.
7. Prepare an income statement for management under a standard costing system.
Managerial AccountingChapter 8
Page 488
Feature Story
HIGHLIGHTING PERFORMANCE EFFICIENCY
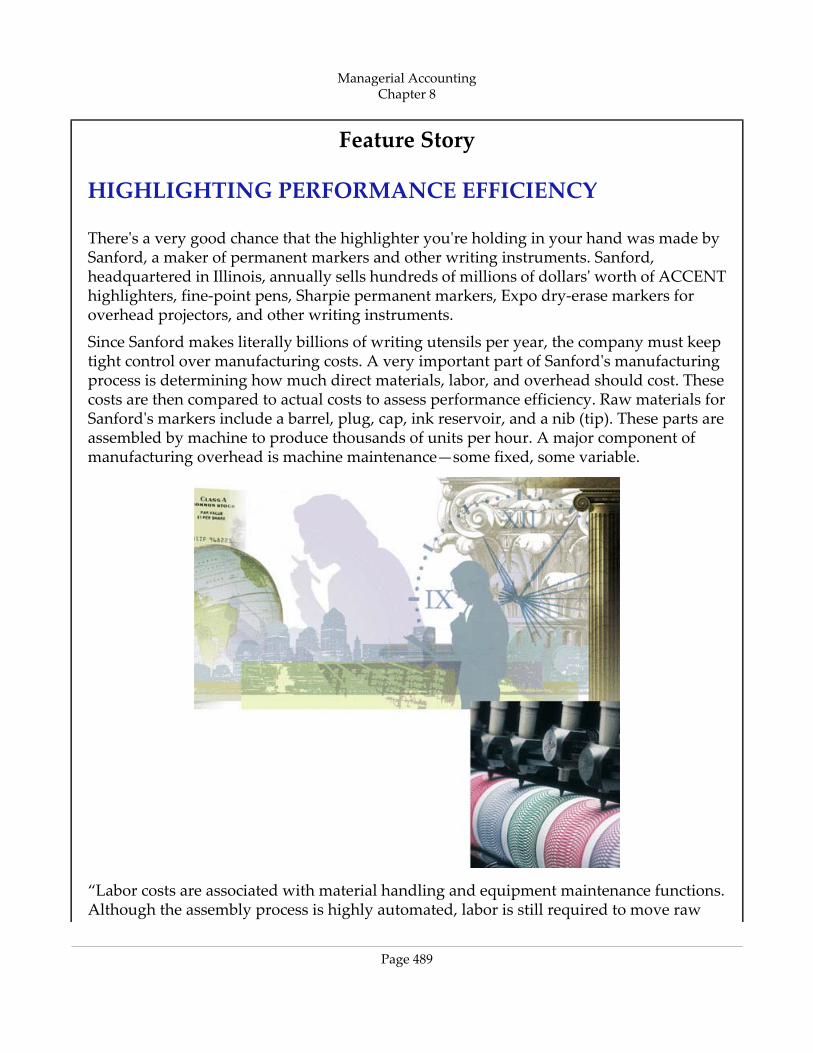
There's a very good chance that the highlighter you're holding in your hand was made bySanford, a maker of permanent markers and other writing instruments. Sanford,headquartered in Illinois, annually sells hundreds of millions of dollars' worth of ACCENThighlighters, fine‐point pens, Sharpie permanent markers, Expo dry‐erase markers foroverhead projectors, and other writing instruments.
Since Sanford makes literally billions of writing utensils per year, the company must keeptight control over manufacturing costs. A very important part of Sanford's manufacturingprocess is determining how much direct materials, labor, and overhead should cost. Thesecosts are then compared to actual costs to assess performance efficiency. Raw materials forSanford's markers include a barrel, plug, cap, ink reservoir, and a nib (tip). These parts areassembled by machine to produce thousands of units per hour. A major component ofmanufacturing overhead is machine maintenance—some fixed, some variable.
“Labor costs are associated with material handling and equipment maintenance functions.Although the assembly process is highly automated, labor is still required to move raw
Managerial AccountingChapter 8
Page 489
materials to the machine and to package the finished product. In addition, highly skilledtechnicians are required to service and maintain each piece of equipment,” says Mike Orr,vice president, operations.
Labor rates are predictable because the hourly workers are covered by a union contract. Thestory is the same with the fringe benefits and some supervisory salaries. Even volume levelsare fairly predictable—demand for the product is high—so fixed overhead is efficientlyabsorbed. Raw material standard costs are based on the previous year's actual prices plusany anticipated inflation. Lately, though, inflation has been so low that the company isconsidering any price increase in raw material to be unfavorable because its standards willremain unchanged.
PREVIEW OF CHAPTER 8
Standards are a fact of life. You met the admission standards for the school you are attending.The vehicle that you drive had to meet certain governmental emissions standards. Thehamburgers and salads you eat in a restaurant have to meet certain health and nutritionalstandards before they can be sold. And, as described in our Feature Story, Sanford Corp.develops standards for the costs of its materials, labor, and overhead which it compares withits actual costs. The reason for standards in these cases is very simple: They help to ensurethat overall product quality is high. Without standards, quality control is lost.
In this chapter we continue the study of controlling costs. You will learn how to developstandard costs that permit the evaluation of performance.
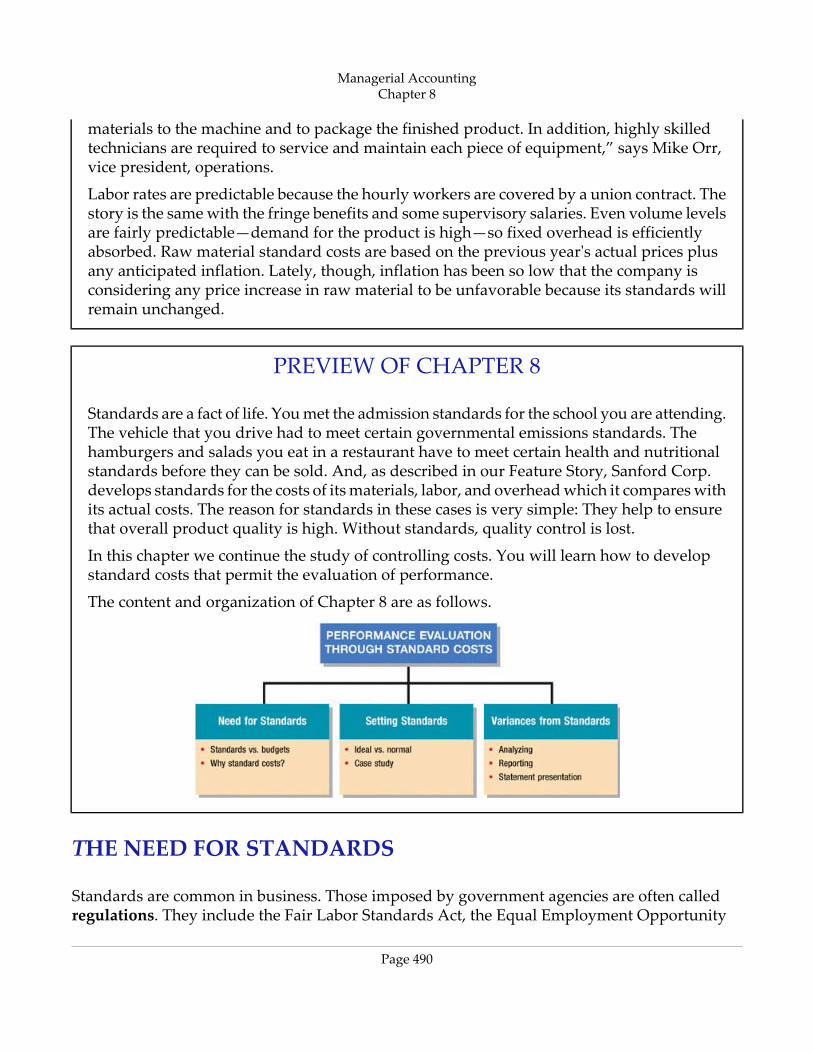
The content and organization of Chapter 8 are as follows.
THE NEED FOR STANDARDS
Standards are common in business. Those imposed by government agencies are often calledregulations. They include the Fair Labor Standards Act, the Equal Employment Opportunity
Managerial AccountingChapter 8
Page 490
Act, and a multitude of environmental standards. Standards established internally by a companymay extend to personnel matters, such as employee absenteeism and ethical codes of conduct,quality control standards for products, and standard costs for goods and services. In managerialaccounting, standard costs are predetermined unit costs, which are used as measures ofperformance.
We will focus on manufacturing operations in the remainder of this chapter. But you should alsorecognize that standard costs also apply to many types of service businesses as well. For example,a fast‐food restaurant such as McDonald's knows the price it should pay for pickles, beef, buns,and other ingredients. It also knows how much time it should take an employee to flip hamburgers.If too much is paid for pickles or too much time is taken to prepare Big Macs, the deviations arenoticed and corrective action is taken. Standard costs also may be used in not‐for‐profit enterprisessuch as universities, charitable organizations, and governmental agencies.
DISTINGUISHING BETWEEN STANDARDS AND BUDGETS
In concept, standards and budgets are essentially the same. Both are predetermined costs, andboth contribute to management planning and control. There is a difference, however, in the waythe terms are expressed. A standard is a unit amount. A budget is a total amount. Thus, it iscustomary to state that the standard cost of direct labor for a unit of product is $10. If 5,000 unitsof the product are produced, the $50,000 of direct labor is the budgeted labor cost. A standardis the budgeted cost per unit of product. A standard is therefore concerned with each individualcost component that makes up the entire budget.
There are important accounting differences between budgets and standards. Except in theapplication of manufacturing overhead to jobs and processes, budget data are not journalizedin cost accounting systems. In contrast, as will be illustrated in the appendix to this chapter,standard costs may be incorporated into cost accounting systems. Also, a company may reportits inventories at standard cost in its financial statements, but it would not report inventories atbudgeted costs.
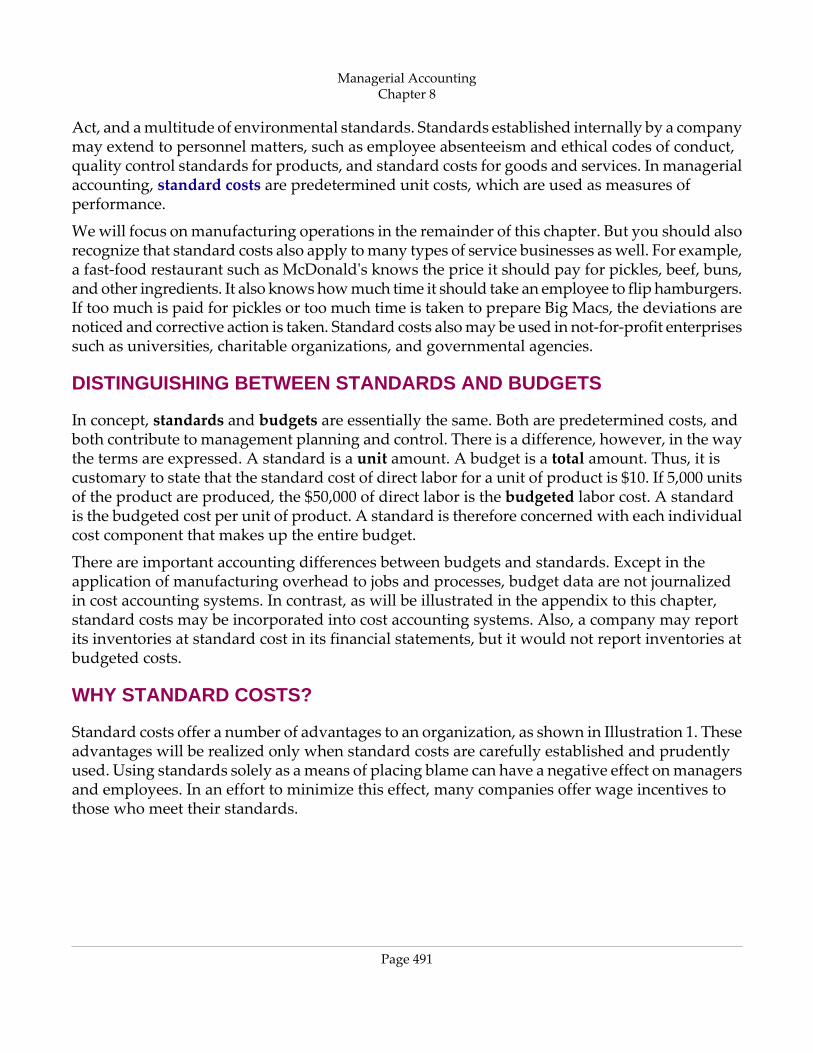
WHY STANDARD COSTS?
Standard costs offer a number of advantages to an organization, as shown in Illustration 1. Theseadvantages will be realized only when standard costs are carefully established and prudentlyused. Using standards solely as a means of placing blame can have a negative effect on managersand employees. In an effort to minimize this effect, many companies offer wage incentives tothose who meet their standards.
Managerial AccountingChapter 8
Page 491
Advantages of standard costs
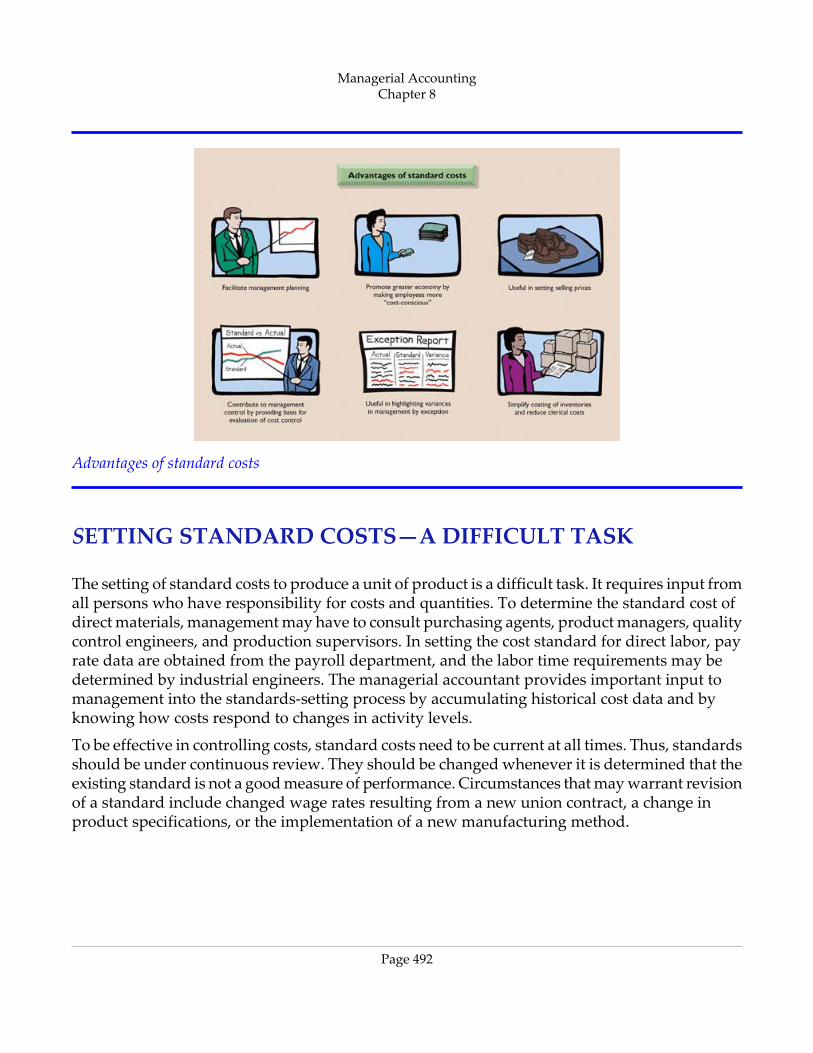
SETTING STANDARD COSTS—A DIFFICULT TASK
The setting of standard costs to produce a unit of product is a difficult task. It requires input fromall persons who have responsibility for costs and quantities. To determine the standard cost ofdirect materials, management may have to consult purchasing agents, product managers, qualitycontrol engineers, and production supervisors. In setting the cost standard for direct labor, payrate data are obtained from the payroll department, and the labor time requirements may bedetermined by industrial engineers. The managerial accountant provides important input tomanagement into the standards‐setting process by accumulating historical cost data and byknowing how costs respond to changes in activity levels.
To be effective in controlling costs, standard costs need to be current at all times. Thus, standardsshould be under continuous review. They should be changed whenever it is determined that theexisting standard is not a good measure of performance. Circumstances that may warrant revisionof a standard include changed wage rates resulting from a new union contract, a change inproduct specifications, or the implementation of a new manufacturing method.
Managerial AccountingChapter 8
Page 492
IDEAL VERSUS NORMAL STANDARDS
Standards may be set at one of two levels: ideal or normal. Ideal standards represent optimumlevels of performance under perfect operating conditions. Normal standards represent efficientlevels of performance that are attainable under expected operating conditions.
Some managers believe ideal standards will stimulate workers to ever‐increasing improvement.However, most managers believe that ideal standards lower the morale of the entire workforcebecause they are so difficult, if not impossible, to meet. Very few companies use ideal standards.
Most companies that use standards set them at a normal level. Properly set, normal standardsshould be rigorous but attainable. Normal standards allow for rest periods, machine breakdowns,and other “normal” contingencies in the production process. It will be assumed in the remainderof this chapter that standard costs are set at a normal level.
A CASE STUDY
To establish the standard cost of producing a product, it is necessary to establish standards foreach manufacturing cost element—direct materials, direct labor, and manufacturing overhead.The standard for each element is derived from the standard price to be paid and the standardquantity to be used. To illustrate, we will look at a case study of how standard costs are set. Inthis extended example, we will assume that Xonic, Inc. wishes to use standard costs to measureperformance in filling an order for 1,000 gallons of Weed‐O, a liquid weed killer.
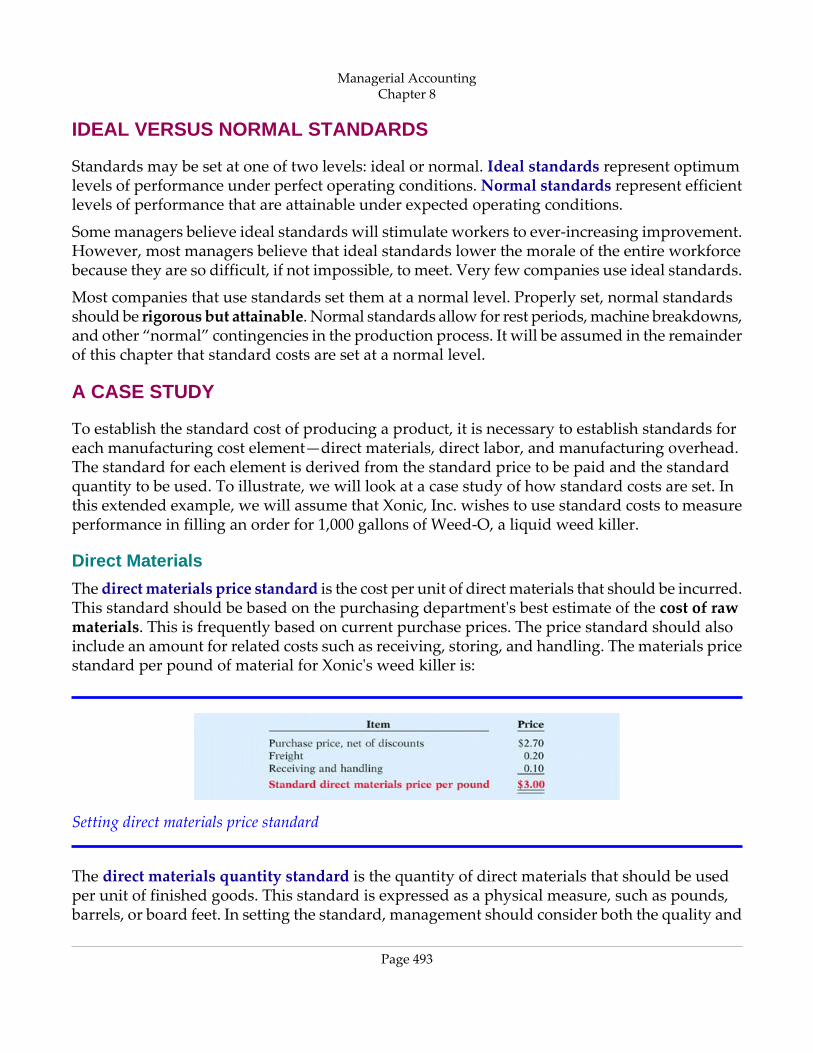
Direct Materials
The direct materials price standard is the cost per unit of direct materials that should be incurred.This standard should be based on the purchasing department's best estimate of the cost of rawmaterials. This is frequently based on current purchase prices. The price standard should alsoinclude an amount for related costs such as receiving, storing, and handling. The materials pricestandard per pound of material for Xonic's weed killer is:
Setting direct materials price standard
The direct materials quantity standard is the quantity of direct materials that should be usedper unit of finished goods. This standard is expressed as a physical measure, such as pounds,barrels, or board feet. In setting the standard, management should consider both the quality and
Managerial AccountingChapter 8
Page 493
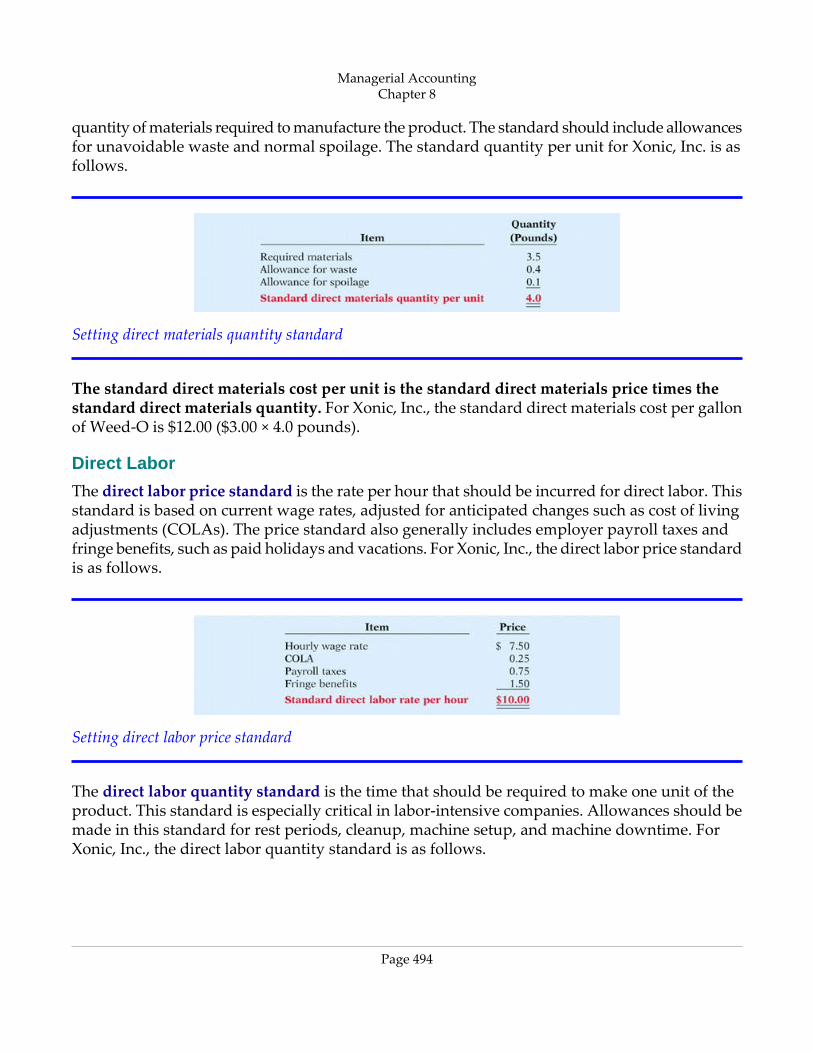
quantity of materials required to manufacture the product. The standard should include allowancesfor unavoidable waste and normal spoilage. The standard quantity per unit for Xonic, Inc. is asfollows.
Setting direct materials quantity standard
The standard direct materials cost per unit is the standard direct materials price times thestandard direct materials quantity. For Xonic, Inc., the standard direct materials cost per gallonof Weed‐O is $12.00 ($3.00 × 4.0 pounds).
Direct Labor
The direct labor price standard is the rate per hour that should be incurred for direct labor. Thisstandard is based on current wage rates, adjusted for anticipated changes such as cost of livingadjustments (COLAs). The price standard also generally includes employer payroll taxes andfringe benefits, such as paid holidays and vacations. For Xonic, Inc., the direct labor price standardis as follows.
Setting direct labor price standard
The direct labor quantity standard is the time that should be required to make one unit of theproduct. This standard is especially critical in labor‐intensive companies. Allowances should bemade in this standard for rest periods, cleanup, machine setup, and machine downtime. ForXonic, Inc., the direct labor quantity standard is as follows.
Managerial AccountingChapter 8
Page 494
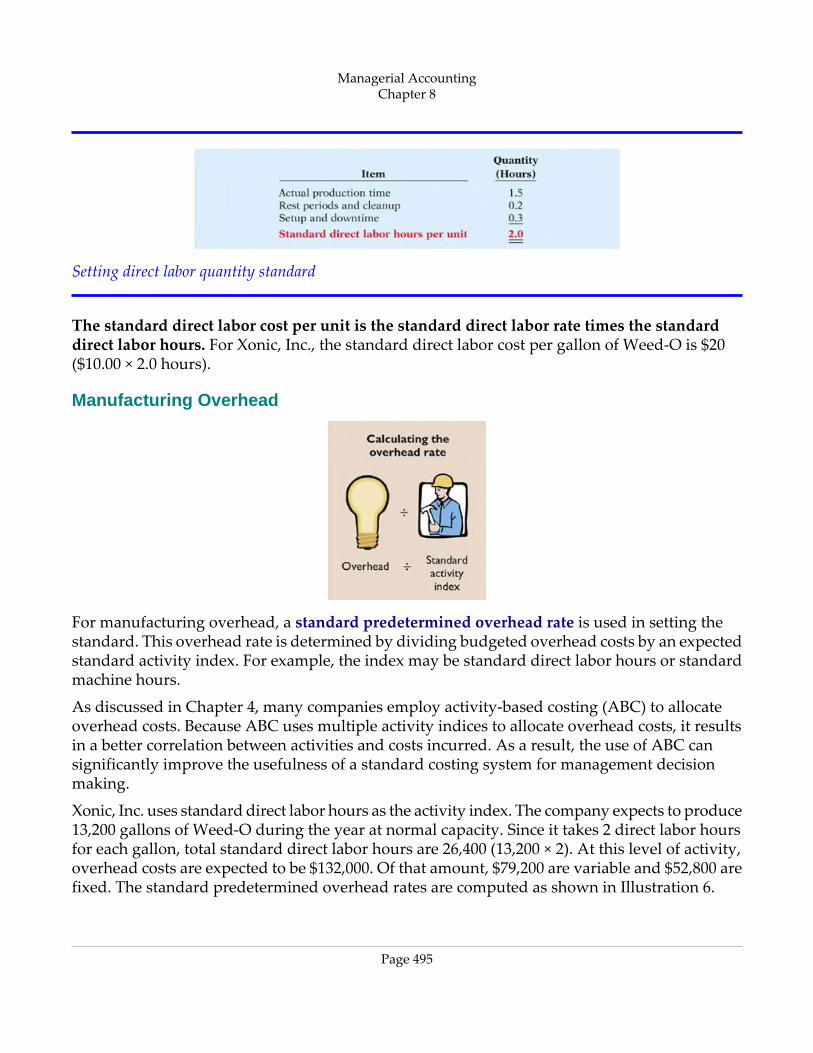
Setting direct labor quantity standard
The standard direct labor cost per unit is the standard direct labor rate times the standarddirect labor hours. For Xonic, Inc., the standard direct labor cost per gallon of Weed‐O is $20($10.00 × 2.0 hours).
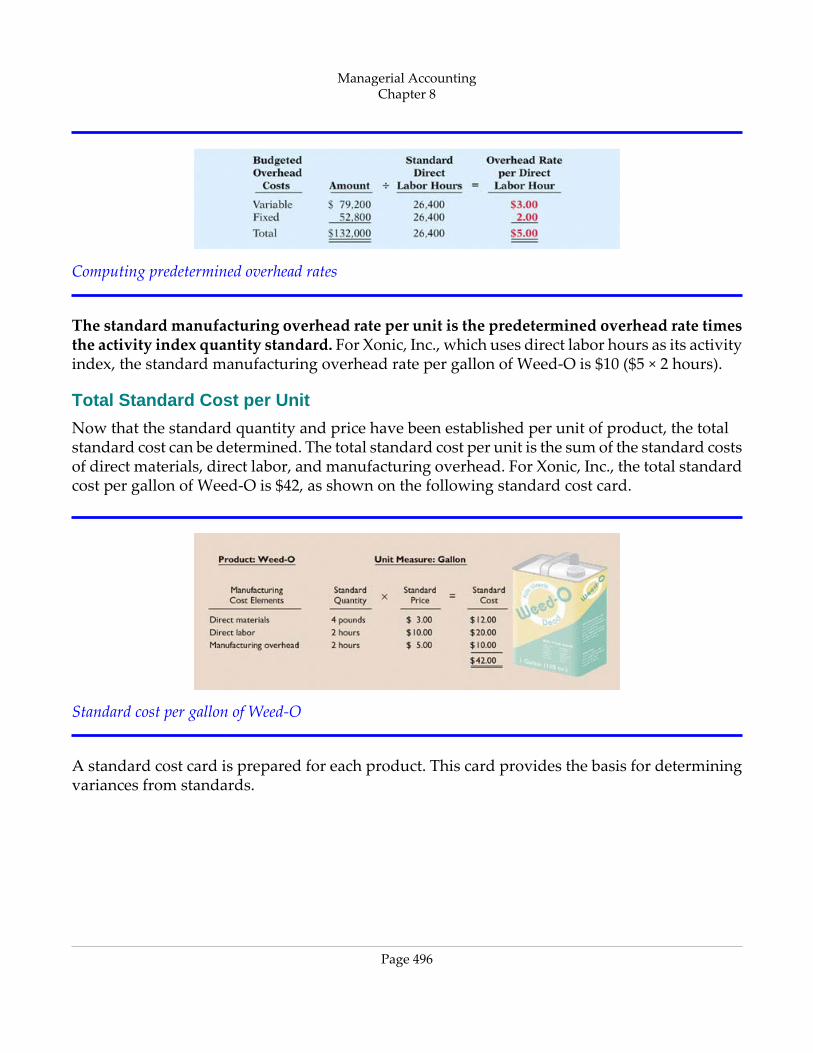
Manufacturing Overhead
For manufacturing overhead, a standard predetermined overhead rate is used in setting thestandard. This overhead rate is determined by dividing budgeted overhead costs by an expectedstandard activity index. For example, the index may be standard direct labor hours or standardmachine hours.
As discussed in Chapter 4, many companies employ activity‐based costing (ABC) to allocateoverhead costs. Because ABC uses multiple activity indices to allocate overhead costs, it resultsin a better correlation between activities and costs incurred. As a result, the use of ABC cansignificantly improve the usefulness of a standard costing system for management decisionmaking.
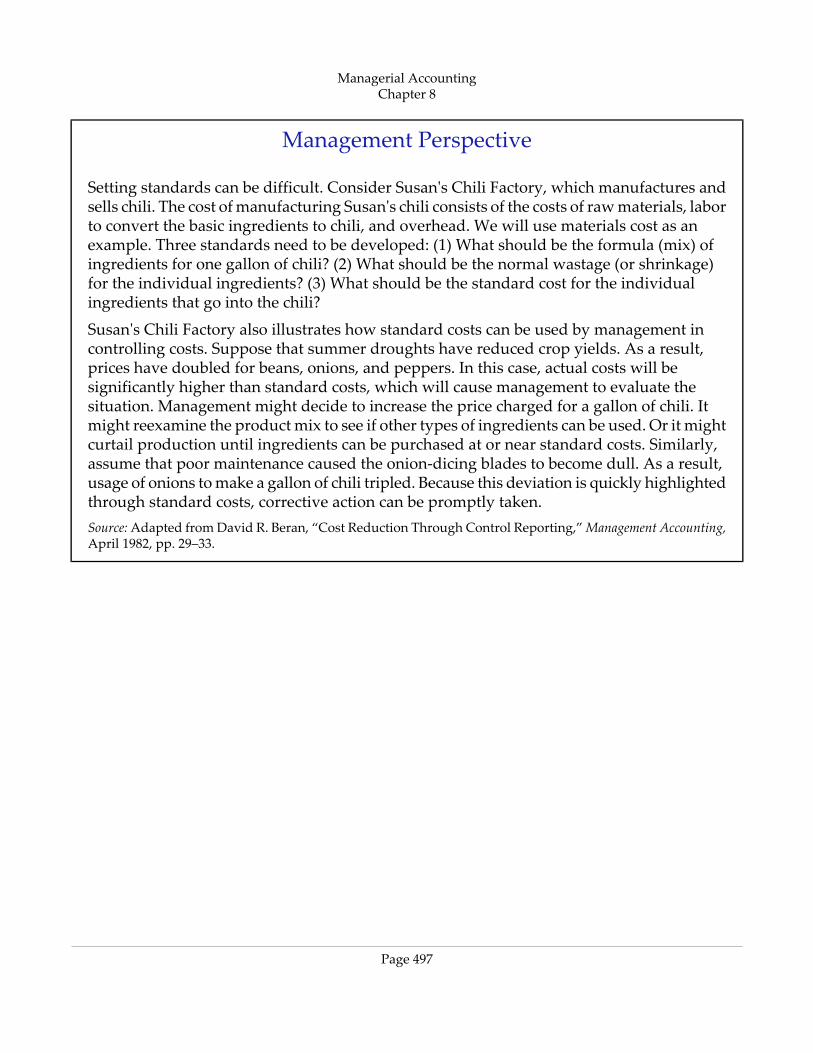
Xonic, Inc. uses standard direct labor hours as the activity index. The company expects to produce13,200 gallons of Weed‐O during the year at normal capacity. Since it takes 2 direct labor hoursfor each gallon, total standard direct labor hours are 26,400 (13,200 × 2). At this level of activity,overhead costs are expected to be $132,000. Of that amount, $79,200 are variable and $52,800 arefixed. The standard predetermined overhead rates are computed as shown in Illustration 6.
Managerial AccountingChapter 8
Page 495
Computing predetermined overhead rates
The standard manufacturing overhead rate per unit is the predetermined overhead rate timesthe activity index quantity standard. For Xonic, Inc., which uses direct labor hours as its activityindex, the standard manufacturing overhead rate per gallon of Weed‐O is $10 ($5 × 2 hours).
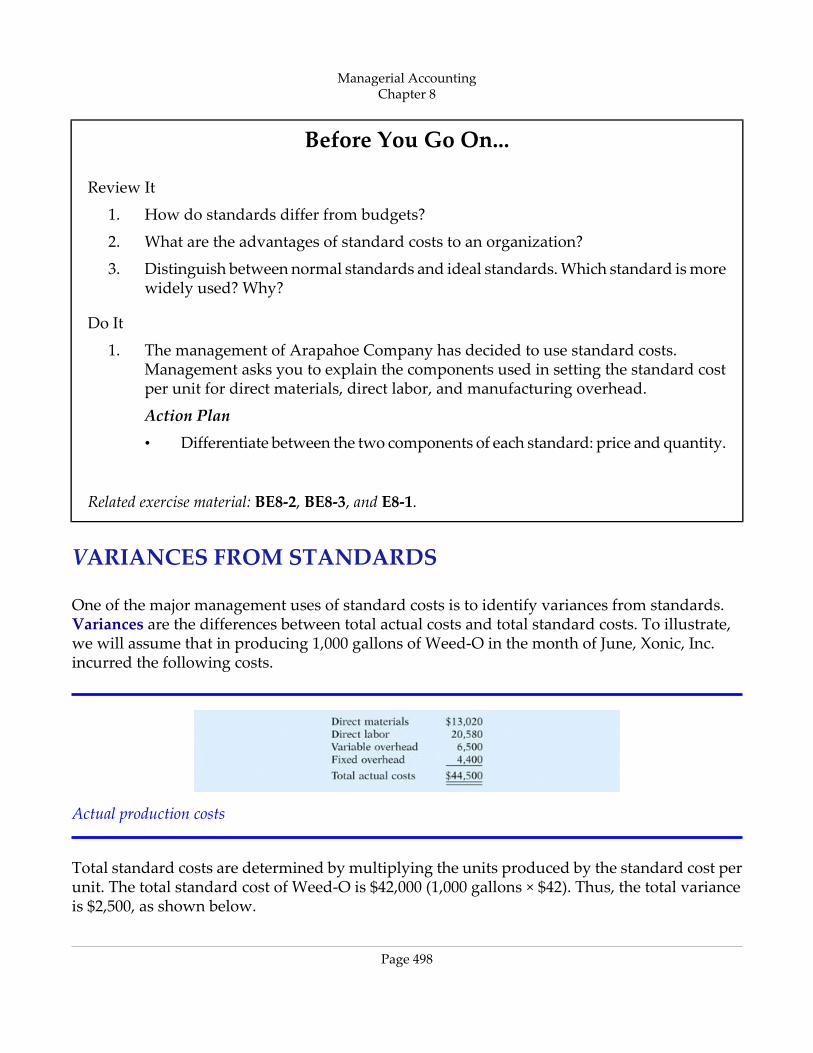
Total Standard Cost per Unit
Now that the standard quantity and price have been established per unit of product, the totalstandard cost can be determined. The total standard cost per unit is the sum of the standard costsof direct materials, direct labor, and manufacturing overhead. For Xonic, Inc., the total standardcost per gallon of Weed‐O is $42, as shown on the following standard cost card.
Standard cost per gallon of Weed‐O
A standard cost card is prepared for each product. This card provides the basis for determiningvariances from standards.
Managerial AccountingChapter 8
Page 496
Management Perspective
Setting standards can be difficult. Consider Susan's Chili Factory, which manufactures andsells chili. The cost of manufacturing Susan's chili consists of the costs of raw materials, laborto convert the basic ingredients to chili, and overhead. We will use materials cost as anexample. Three standards need to be developed: (1) What should be the formula (mix) ofingredients for one gallon of chili? (2) What should be the normal wastage (or shrinkage)for the individual ingredients? (3) What should be the standard cost for the individualingredients that go into the chili?
Susan's Chili Factory also illustrates how standard costs can be used by management incontrolling costs. Suppose that summer droughts have reduced crop yields. As a result,prices have doubled for beans, onions, and peppers. In this case, actual costs will besignificantly higher than standard costs, which will cause management to evaluate thesituation. Management might decide to increase the price charged for a gallon of chili. Itmight reexamine the product mix to see if other types of ingredients can be used. Or it mightcurtail production until ingredients can be purchased at or near standard costs. Similarly,assume that poor maintenance caused the onion‐dicing blades to become dull. As a result,usage of onions to make a gallon of chili tripled. Because this deviation is quickly highlightedthrough standard costs, corrective action can be promptly taken.Source: Adapted from David R. Beran, “Cost Reduction Through Control Reporting,” Management Accounting,April 1982, pp. 29–33.
Managerial AccountingChapter 8
Page 497
Before You Go On...
Review It
1. How do standards differ from budgets?
2. What are the advantages of standard costs to an organization?
3. Distinguish between normal standards and ideal standards. Which standard is morewidely used? Why?
Do It
1. The management of Arapahoe Company has decided to use standard costs.Management asks you to explain the components used in setting the standard costper unit for direct materials, direct labor, and manufacturing overhead.
Action Plan
• Differentiate between the two components of each standard: price and quantity.
Related exercise material: BE8‐2, BE8‐3, and E8‐1.
VARIANCES FROM STANDARDS
One of the major management uses of standard costs is to identify variances from standards.Variances are the differences between total actual costs and total standard costs. To illustrate,we will assume that in producing 1,000 gallons of Weed‐O in the month of June, Xonic, Inc.incurred the following costs.
Actual production costs
Total standard costs are determined by multiplying the units produced by the standard cost perunit. The total standard cost of Weed‐O is $42,000 (1,000 gallons × $42). Thus, the total varianceis $2,500, as shown below.
Managerial AccountingChapter 8
Page 498
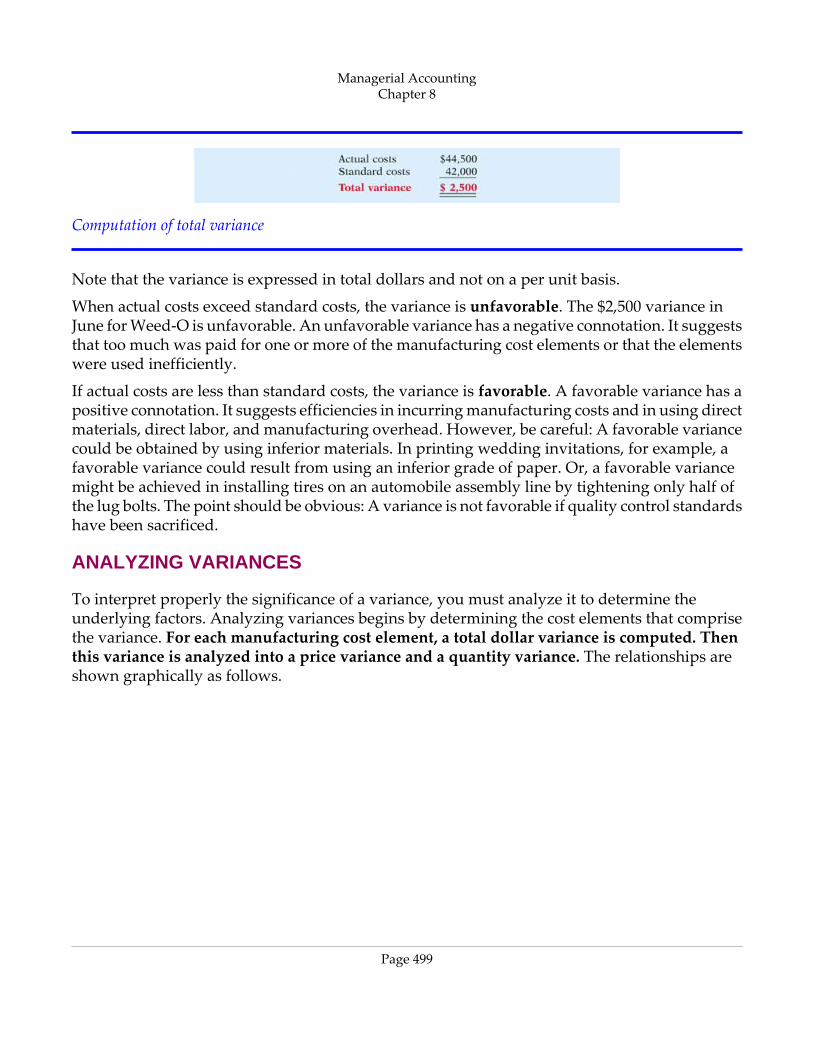
Computation of total variance
Note that the variance is expressed in total dollars and not on a per unit basis.
When actual costs exceed standard costs, the variance is unfavorable. The $2,500 variance inJune for Weed‐O is unfavorable. An unfavorable variance has a negative connotation. It suggeststhat too much was paid for one or more of the manufacturing cost elements or that the elementswere used inefficiently.
If actual costs are less than standard costs, the variance is favorable. A favorable variance has apositive connotation. It suggests efficiencies in incurring manufacturing costs and in using directmaterials, direct labor, and manufacturing overhead. However, be careful: A favorable variancecould be obtained by using inferior materials. In printing wedding invitations, for example, afavorable variance could result from using an inferior grade of paper. Or, a favorable variancemight be achieved in installing tires on an automobile assembly line by tightening only half ofthe lug bolts. The point should be obvious: A variance is not favorable if quality control standardshave been sacrificed.
ANALYZING VARIANCES
To interpret properly the significance of a variance, you must analyze it to determine theunderlying factors. Analyzing variances begins by determining the cost elements that comprisethe variance. For each manufacturing cost element, a total dollar variance is computed. Thenthis variance is analyzed into a price variance and a quantity variance. The relationships areshown graphically as follows.
Managerial AccountingChapter 8
Page 499
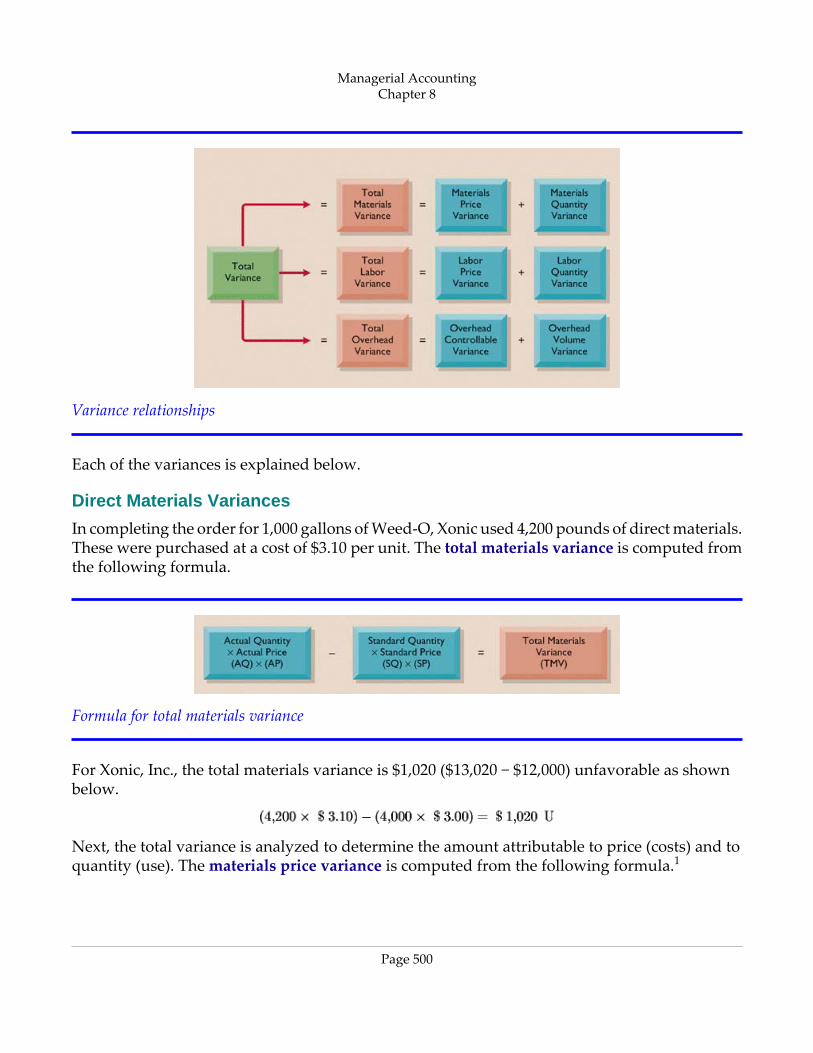
Variance relationships
Each of the variances is explained below.
Direct Materials Variances
In completing the order for 1,000 gallons of Weed‐O, Xonic used 4,200 pounds of direct materials.These were purchased at a cost of $3.10 per unit. The total materials variance is computed fromthe following formula.
Formula for total materials variance
For Xonic, Inc., the total materials variance is $1,020 ($13,020 − $12,000) unfavorable as shownbelow.
Next, the total variance is analyzed to determine the amount attributable to price (costs) and toquantity (use). The materials price variance is computed from the following formula.1
Managerial AccountingChapter 8
Page 500
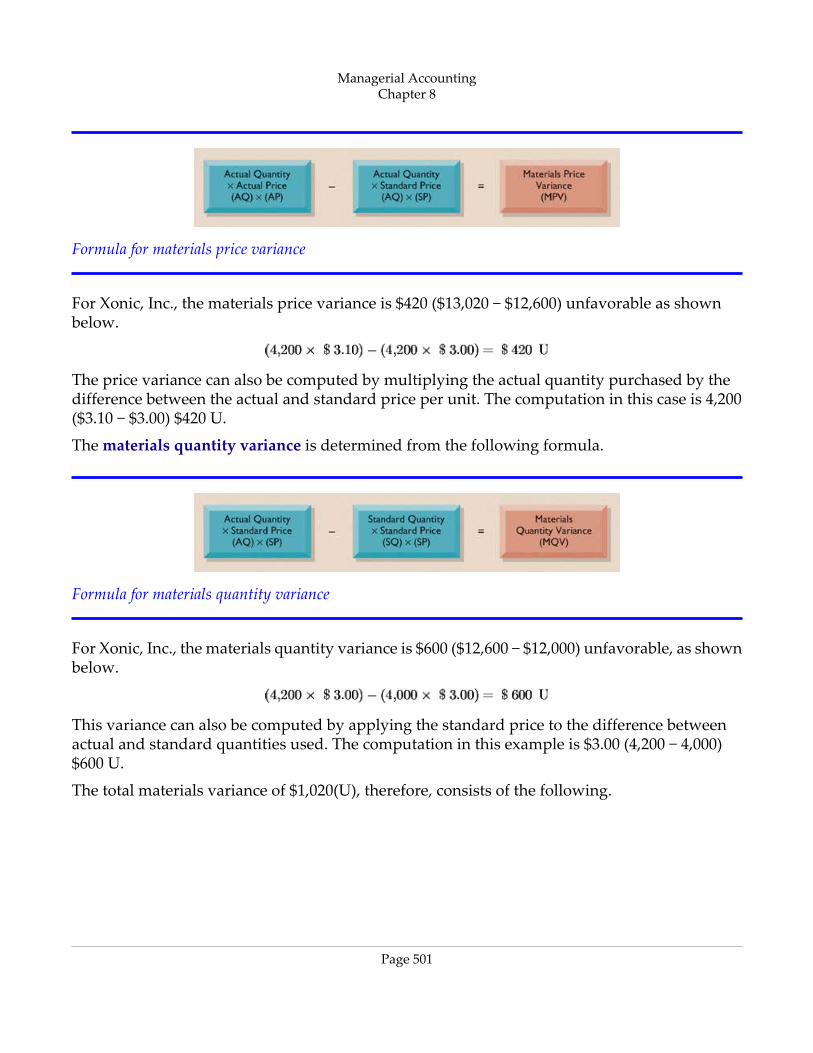
Formula for materials price variance
For Xonic, Inc., the materials price variance is $420 ($13,020 − $12,600) unfavorable as shownbelow.
The price variance can also be computed by multiplying the actual quantity purchased by thedifference between the actual and standard price per unit. The computation in this case is 4,200($3.10 − $3.00) $420 U.
The materials quantity variance is determined from the following formula.
Formula for materials quantity variance
For Xonic, Inc., the materials quantity variance is $600 ($12,600 − $12,000) unfavorable, as shownbelow.
This variance can also be computed by applying the standard price to the difference betweenactual and standard quantities used. The computation in this example is $3.00 (4,200 − 4,000)$600 U.
The total materials variance of $1,020(U), therefore, consists of the following.
Managerial AccountingChapter 8
Page 501
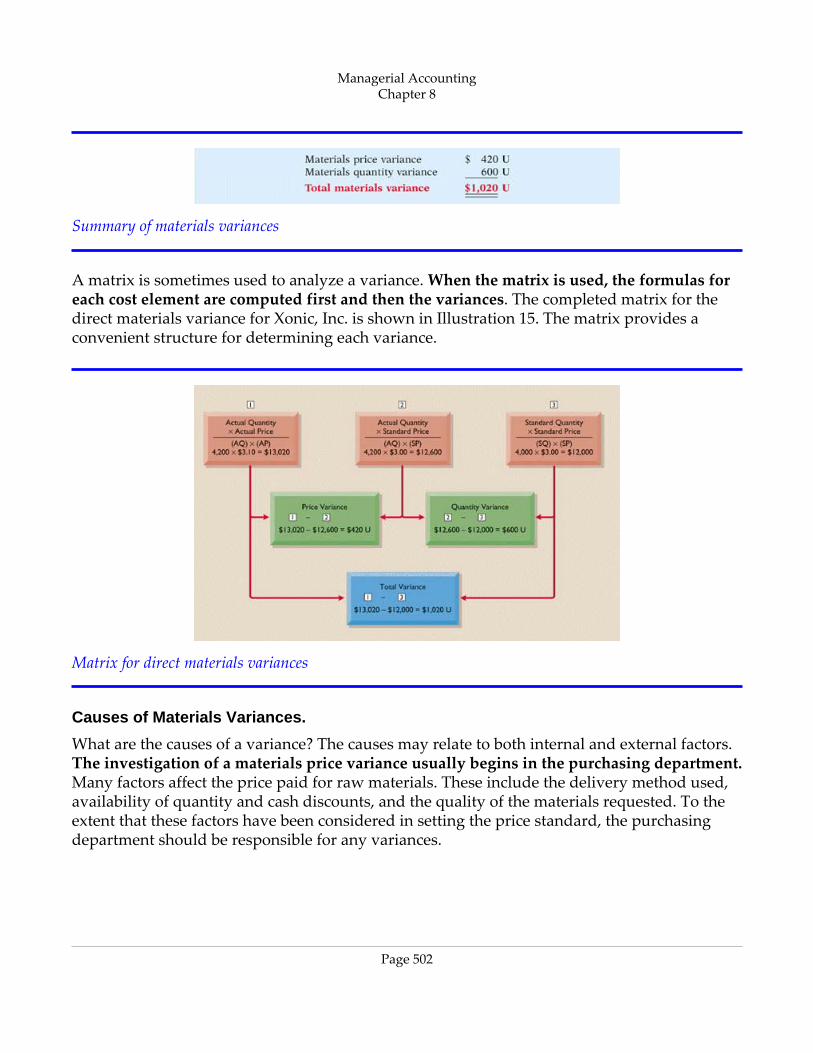
Summary of materials variances
A matrix is sometimes used to analyze a variance. When the matrix is used, the formulas foreach cost element are computed first and then the variances. The completed matrix for thedirect materials variance for Xonic, Inc. is shown in Illustration 15. The matrix provides aconvenient structure for determining each variance.
Matrix for direct materials variances
Causes of Materials Variances.
What are the causes of a variance? The causes may relate to both internal and external factors.The investigation of a materials price variance usually begins in the purchasing department.Many factors affect the price paid for raw materials. These include the delivery method used,availability of quantity and cash discounts, and the quality of the materials requested. To theextent that these factors have been considered in setting the price standard, the purchasingdepartment should be responsible for any variances.
Managerial AccountingChapter 8
Page 502
However, a variance may be beyond the control of the purchasing department. Sometimes, forexample, prices may rise faster than expected. Moreover, actions by groups over which thecompany has no control, such as the OPEC nations' oil price increases, may cause an unfavorablevariance. There are also times when a production department may be responsible for the pricevariance. This may occur when a rush order forces the company to pay a higher price for thematerials.
The starting point for determining the cause(s) of an unfavorable materials quantity variance isin the production department. If the variances are due to inexperienced workers, faulty machinery,or carelessness, the production department would be responsible. However, if the materialsobtained by the purchasing department were of inferior quality, then the purchasing departmentshould be responsible.
Management Perspective
If purchase price variances are used as a basis for measuring performance, purchasingdepartments often will continually search for the lowest‐cost item. However, this basis canbecome counterproductive if it leads to late deliveries of the goods or the purchase ofinferior‐quality goods.
Managerial AccountingChapter 8
Page 503
Before You Go On...
Review It
1. What are the three main components of the total variance from standard cost?
2. What are the formulas for computing the total, price, and quantity variances fordirect materials?
Do It
1. The standard cost of Product XX includes two units of direct materials at $8.00 perunit. During July, 22,000 units of direct materials are purchased at $7.50 and usedto produce 10,000 units. Compute the total, price, and quantity variances for materials.
Action Plan
Use the formulas for computing each of the materials variances:
•
•
•
Related exercise material: BE8‐4, BE8‐5, BE8‐6, BE8‐7, BE8‐8, E8‐2, E8‐3, E8‐4, E8‐6, E8‐7, E8‐8,E8‐9, and E8‐12.
Direct Labor Variances
The process of determining direct labor variances is the same as for determining the directmaterials variances. In completing the Weed‐O order, Xonic, Inc. incurred 2,100 direct labor hoursat an average hourly rate of $9.80. The standard hours allowed for the units produced were 2,000hours (1,000 units × 2 hours). The standard labor rate was $10 per hour. The total labor varianceis obtained from the following formula.
Managerial AccountingChapter 8
Page 504
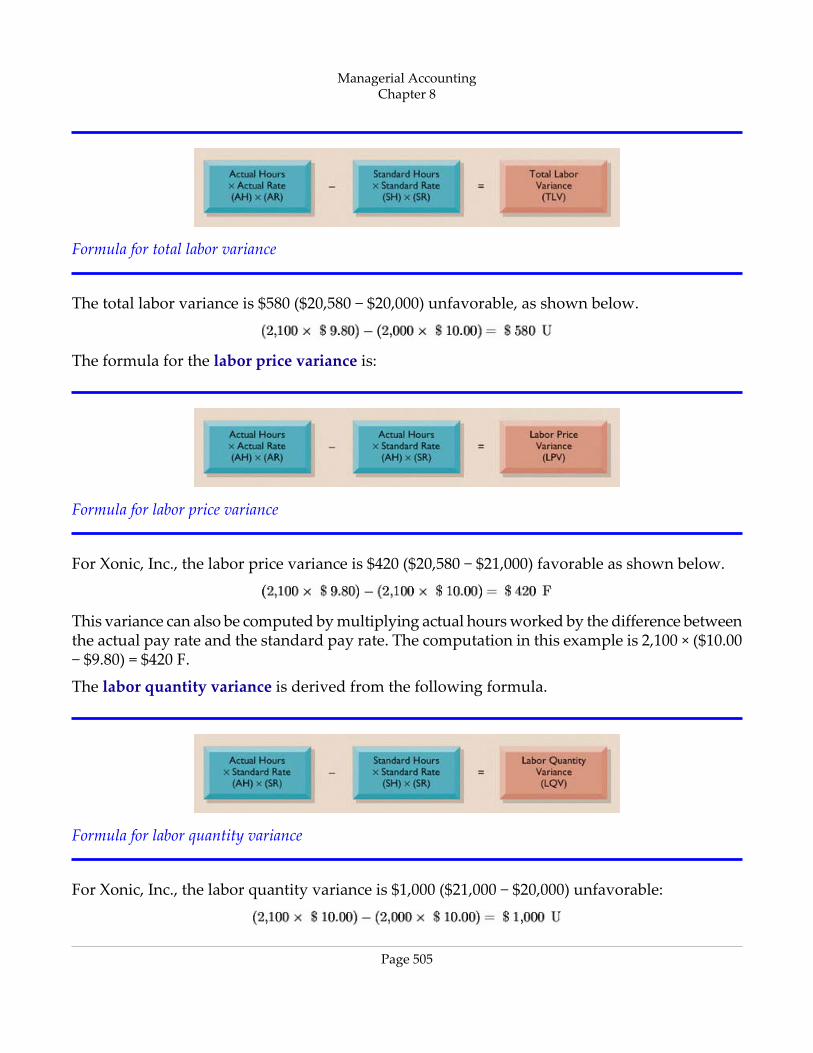
Formula for total labor variance
The total labor variance is $580 ($20,580 − $20,000) unfavorable, as shown below.
The formula for the labor price variance is:
Formula for labor price variance
For Xonic, Inc., the labor price variance is $420 ($20,580 − $21,000) favorable as shown below.
This variance can also be computed by multiplying actual hours worked by the difference betweenthe actual pay rate and the standard pay rate. The computation in this example is 2,100 × ($10.00− $9.80) = $420 F.
The labor quantity variance is derived from the following formula.
Formula for labor quantity variance
For Xonic, Inc., the labor quantity variance is $1,000 ($21,000 − $20,000) unfavorable:
Managerial AccountingChapter 8
Page 505
The same result can be obtained by multiplying the standard rate by the difference betweenactual hours worked and standard hours allowed. In this case the computation is $10.00 × (2,100− 2,000) = $1,000 U.
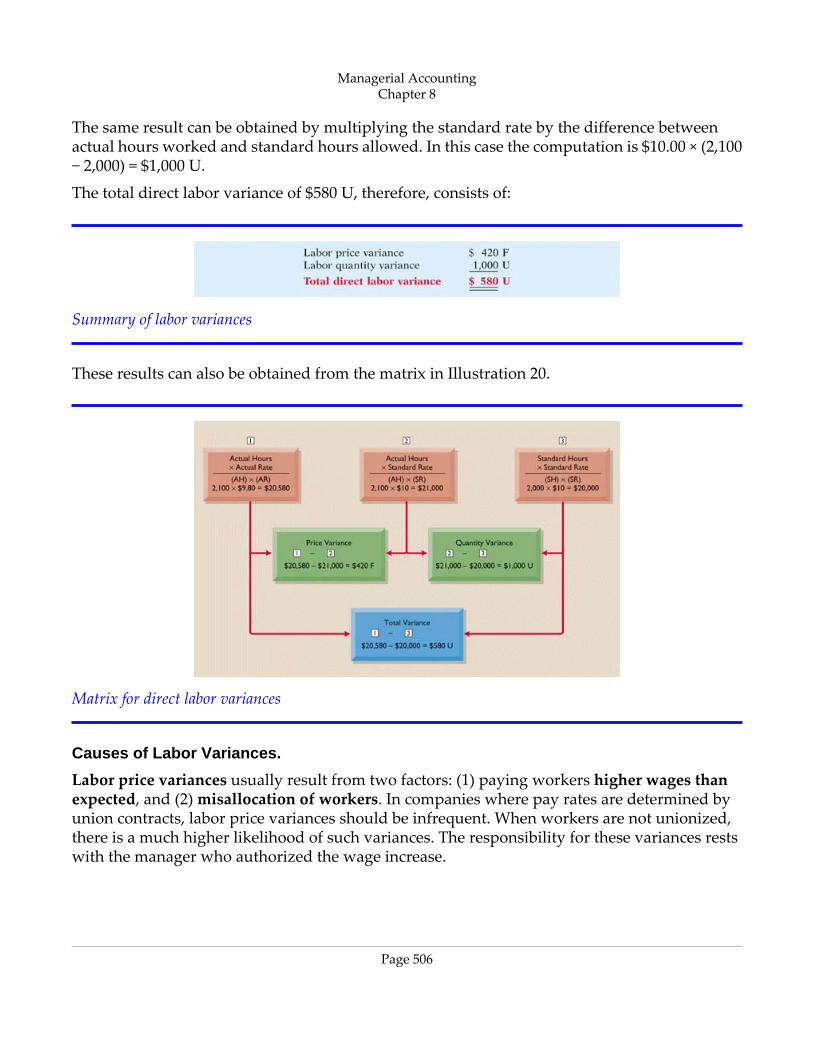
The total direct labor variance of $580 U, therefore, consists of:
Summary of labor variances
These results can also be obtained from the matrix in Illustration 20.
Matrix for direct labor variances
Causes of Labor Variances.
Labor price variances usually result from two factors: (1) paying workers higher wages thanexpected, and (2) misallocation of workers. In companies where pay rates are determined byunion contracts, labor price variances should be infrequent. When workers are not unionized,there is a much higher likelihood of such variances. The responsibility for these variances restswith the manager who authorized the wage increase.
Managerial AccountingChapter 8
Page 506
Misallocation of the workforce refers to using skilled workers in place of unskilled workers andvice versa. The use of an inexperienced worker instead of an experienced one will result in afavorable price variance because of the lower pay rate of the unskilled worker. An unfavorableprice variance would result if a skilled worker were substituted for an inexperienced one. Theproduction department generally is responsible for labor price variances resulting frommisallocation of the workforce.
Labor quantity variances relate to the efficiency of workers. The cause of a quantity variancegenerally can be traced to the production department. The causes of an unfavorable variancemay be poor training, worker fatigue, faulty machinery, or carelessness. These causes are theresponsibility of the production department. However, if the excess time is due to inferiormaterials, the responsibility falls outside the production department.
Service Company Perspective
At United Parcel Service (UPS) performance standards are set by industrial engineers formany tasks performed by UPS employees. For example, a UPS driver is expected to walk ata pace of three feet per second when going to a customer's door and knock rather than takethe time to look for a doorbell. UPS executives attribute the company's success to its abilityto manage and hold labor accountable.
Managerial AccountingChapter 8
Page 507
Manufacturing Overhead Variances
The computation of the manufacturing overhead variances is conceptually the same as thecomputation of the materials and labor variances. However, the task is more challenging formanufacturing overhead because both variable and fixed overhead costs must be considered.
Total Overhead Variance.
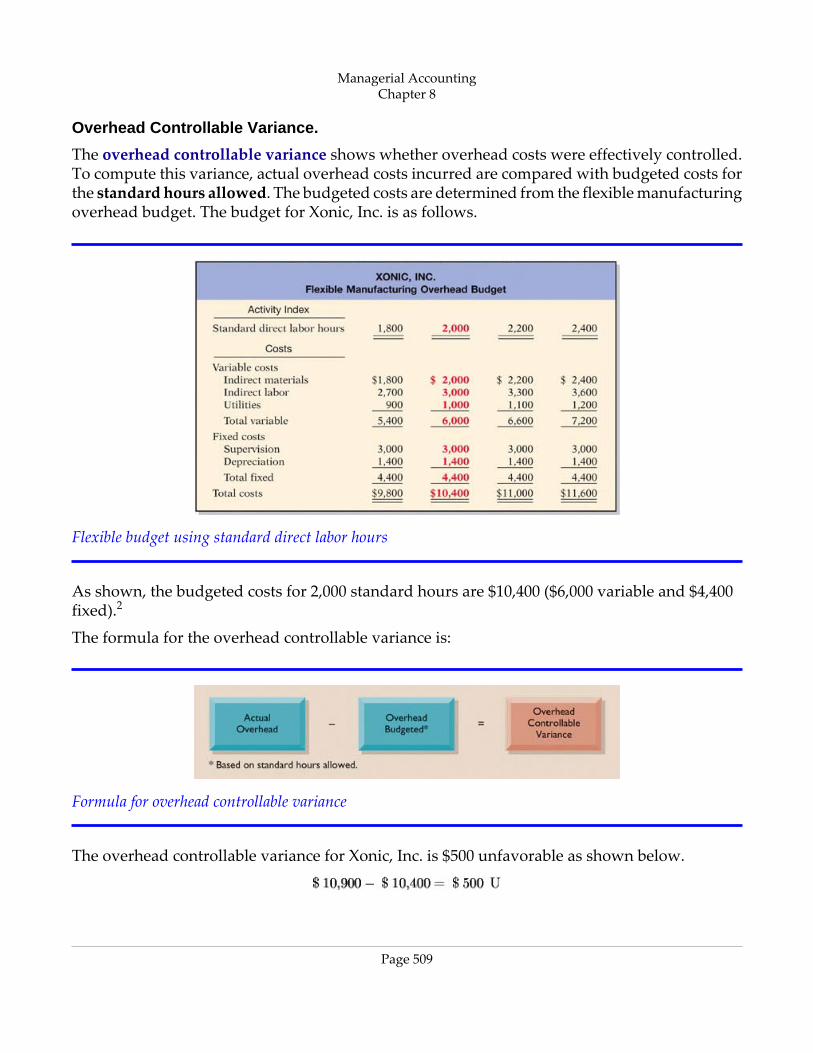
The total overhead variance is the difference between actual overhead costs and overhead costsapplied to work done. As indicated earlier, manufacturing overhead costs incurred by Xonicwere $10,900, as follows.
Actual overhead costs
With standard costs, manufacturing overhead costs are applied to work in process on the basisof the standard hours allowed for the work done. Standard hours allowed are the hours thatshould have been worked for the units produced. For the Weed‐O order, the standard hoursallowed are 2,000. The predetermined overhead rate is $5 per direct labor hour. Thus, overheadapplied is $10,000 (2,000 × $5). Note that actual hours of direct labor (2,100) are not used inapplying manufacturing overhead.
The formula for the total overhead variance is:
Formula for total overhead variance
Thus, for Xonic, Inc., the total overhead variance is $900 unfavorable as shown below.
The overhead variance is generally analyzed through a price variance and a quantity variance.The name usually given to the price variance is the overhead controllable variance, whereas thequantity variance is referred to as the overhead volume variance.
Managerial AccountingChapter 8
Page 508
Overhead Controllable Variance.
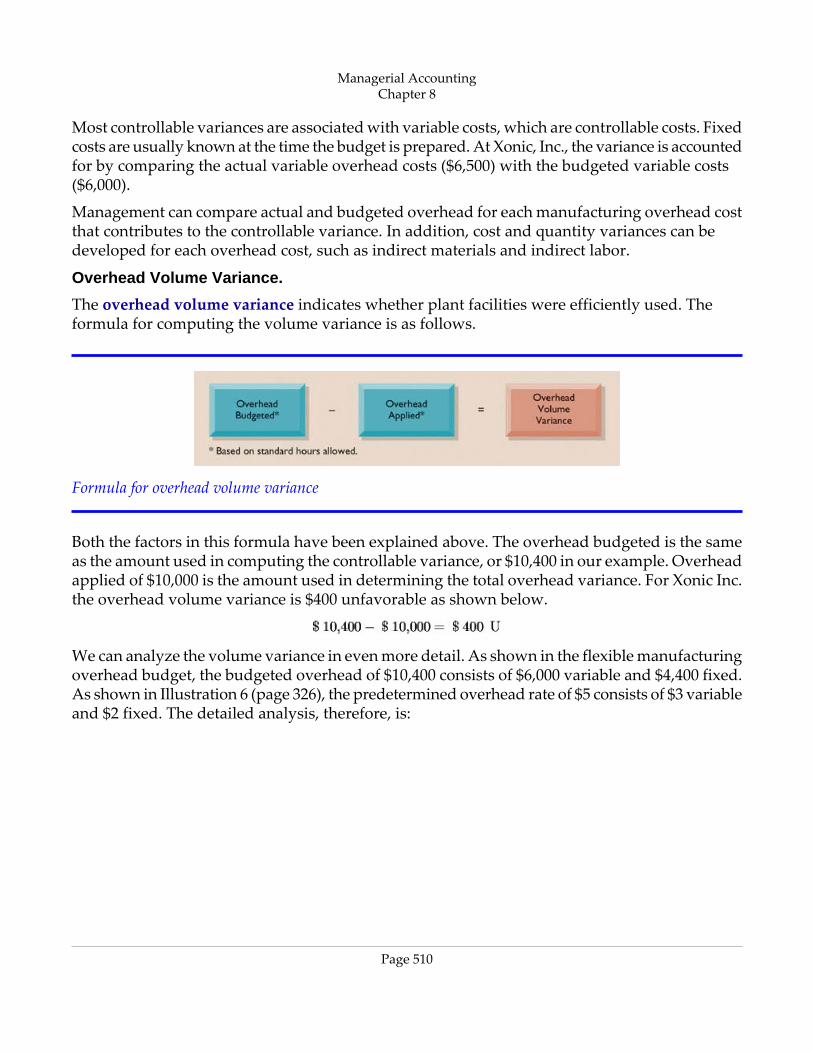
The overhead controllable variance shows whether overhead costs were effectively controlled.To compute this variance, actual overhead costs incurred are compared with budgeted costs forthe standard hours allowed. The budgeted costs are determined from the flexible manufacturingoverhead budget. The budget for Xonic, Inc. is as follows.
Flexible budget using standard direct labor hours
As shown, the budgeted costs for 2,000 standard hours are $10,400 ($6,000 variable and $4,400fixed).2
The formula for the overhead controllable variance is:
Formula for overhead controllable variance
The overhead controllable variance for Xonic, Inc. is $500 unfavorable as shown below.
Managerial AccountingChapter 8
Page 509
Most controllable variances are associated with variable costs, which are controllable costs. Fixedcosts are usually known at the time the budget is prepared. At Xonic, Inc., the variance is accountedfor by comparing the actual variable overhead costs ($6,500) with the budgeted variable costs($6,000).
Management can compare actual and budgeted overhead for each manufacturing overhead costthat contributes to the controllable variance. In addition, cost and quantity variances can bedeveloped for each overhead cost, such as indirect materials and indirect labor.
Overhead Volume Variance.
The overhead volume variance indicates whether plant facilities were efficiently used. Theformula for computing the volume variance is as follows.
Formula for overhead volume variance
Both the factors in this formula have been explained above. The overhead budgeted is the sameas the amount used in computing the controllable variance, or $10,400 in our example. Overheadapplied of $10,000 is the amount used in determining the total overhead variance. For Xonic Inc.the overhead volume variance is $400 unfavorable as shown below.
We can analyze the volume variance in even more detail. As shown in the flexible manufacturingoverhead budget, the budgeted overhead of $10,400 consists of $6,000 variable and $4,400 fixed.As shown in Illustration 6 (page 326), the predetermined overhead rate of $5 consists of $3 variableand $2 fixed. The detailed analysis, therefore, is:
Managerial AccountingChapter 8
Page 510
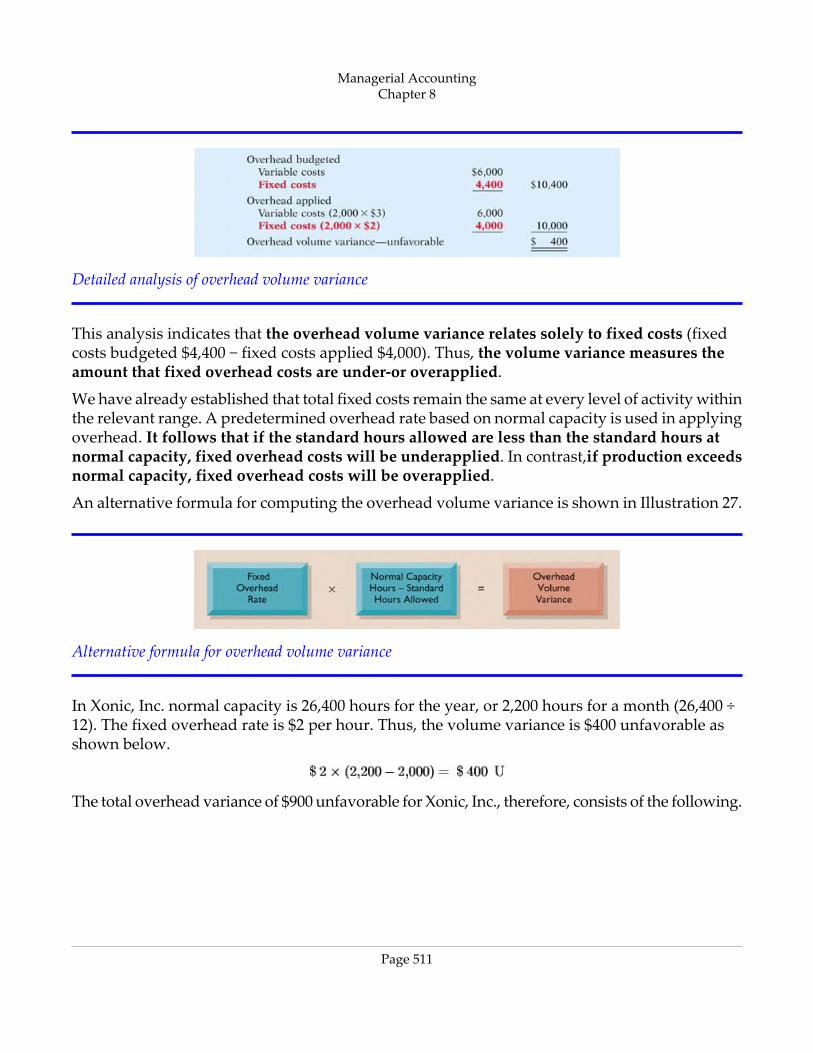
Detailed analysis of overhead volume variance
This analysis indicates that the overhead volume variance relates solely to fixed costs (fixedcosts budgeted $4,400 − fixed costs applied $4,000). Thus, the volume variance measures theamount that fixed overhead costs are under‐or overapplied.
We have already established that total fixed costs remain the same at every level of activity withinthe relevant range. A predetermined overhead rate based on normal capacity is used in applyingoverhead. It follows that if the standard hours allowed are less than the standard hours atnormal capacity, fixed overhead costs will be underapplied. In contrast,if production exceedsnormal capacity, fixed overhead costs will be overapplied.
An alternative formula for computing the overhead volume variance is shown in Illustration 27.
Alternative formula for overhead volume variance
In Xonic, Inc. normal capacity is 26,400 hours for the year, or 2,200 hours for a month (26,400 ÷12). The fixed overhead rate is $2 per hour. Thus, the volume variance is $400 unfavorable asshown below.
The total overhead variance of $900 unfavorable for Xonic, Inc., therefore, consists of the following.
Managerial AccountingChapter 8
Page 511
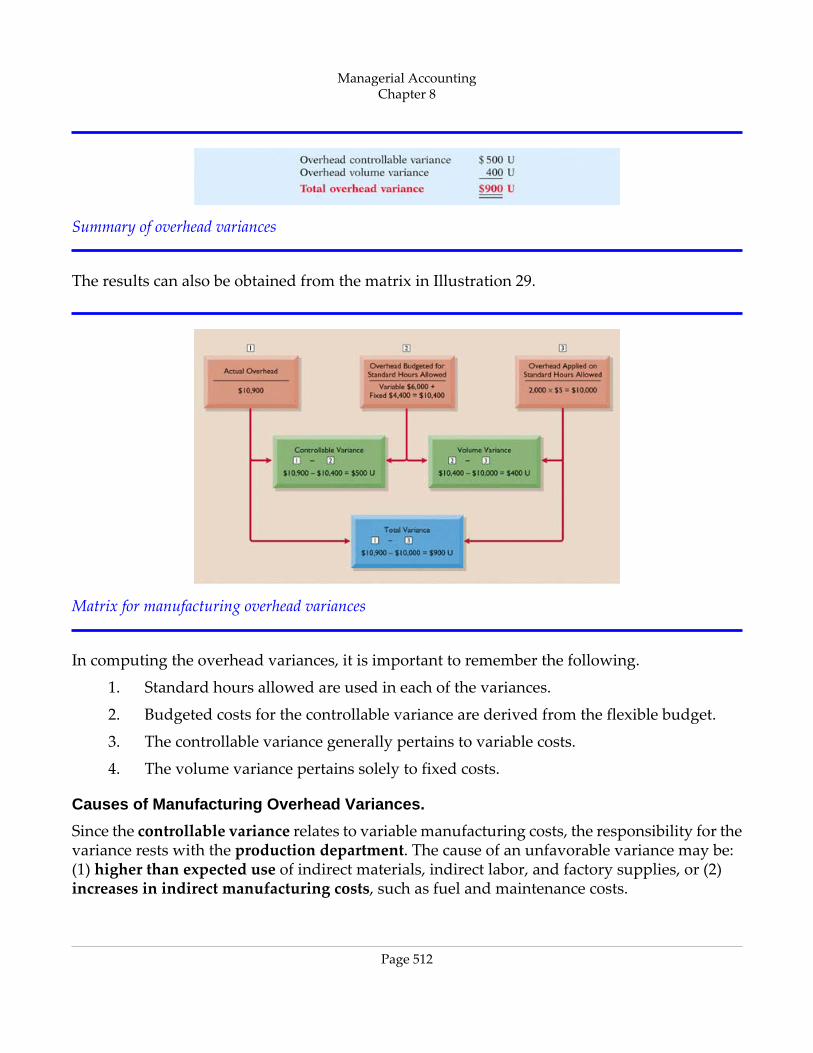
Summary of overhead variances
The results can also be obtained from the matrix in Illustration 29.
Matrix for manufacturing overhead variances
In computing the overhead variances, it is important to remember the following.
1. Standard hours allowed are used in each of the variances.
2. Budgeted costs for the controllable variance are derived from the flexible budget.
3. The controllable variance generally pertains to variable costs.
4. The volume variance pertains solely to fixed costs.
Causes of Manufacturing Overhead Variances.
Since the controllable variance relates to variable manufacturing costs, the responsibility for thevariance rests with the production department. The cause of an unfavorable variance may be:(1) higher than expected use of indirect materials, indirect labor, and factory supplies, or (2)increases in indirect manufacturing costs, such as fuel and maintenance costs.
Managerial AccountingChapter 8
Page 512
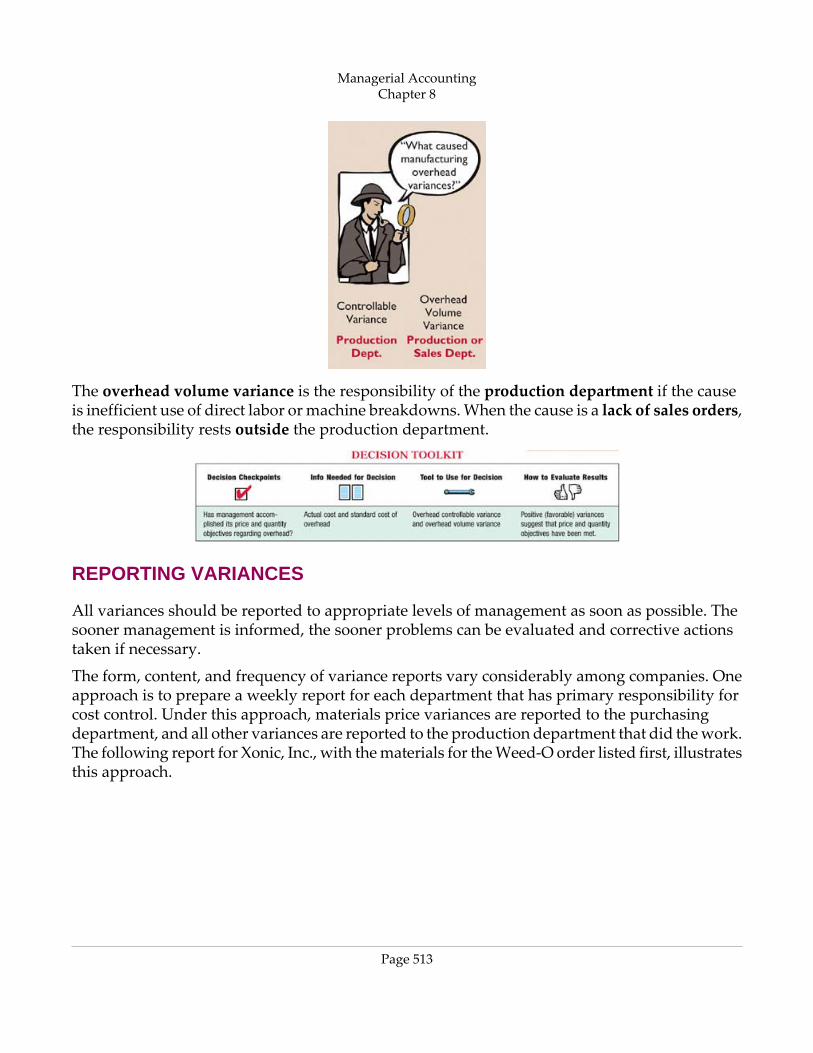
The overhead volume variance is the responsibility of the production department if the causeis inefficient use of direct labor or machine breakdowns. When the cause is a lack of sales orders,the responsibility rests outside the production department.
REPORTING VARIANCES
All variances should be reported to appropriate levels of management as soon as possible. Thesooner management is informed, the sooner problems can be evaluated and corrective actionstaken if necessary.
The form, content, and frequency of variance reports vary considerably among companies. Oneapproach is to prepare a weekly report for each department that has primary responsibility forcost control. Under this approach, materials price variances are reported to the purchasingdepartment, and all other variances are reported to the production department that did the work.The following report for Xonic, Inc., with the materials for the Weed‐O order listed first, illustratesthis approach.
Managerial AccountingChapter 8
Page 513
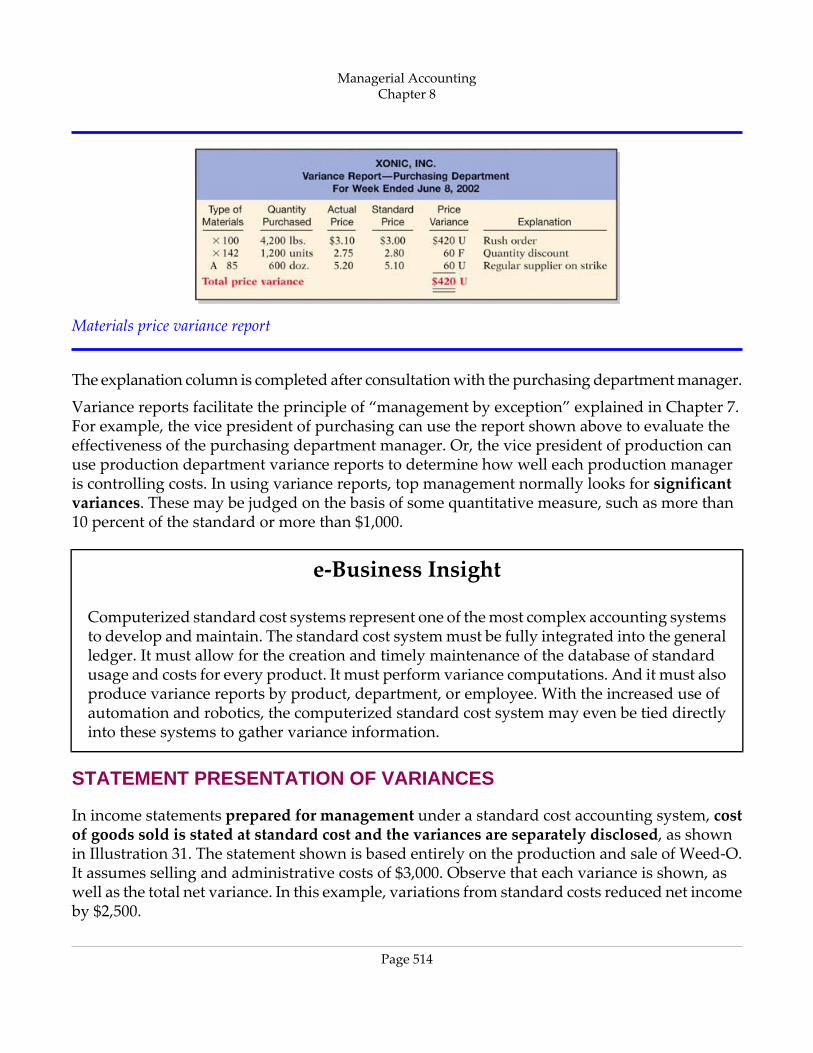
Materials price variance report
The explanation column is completed after consultation with the purchasing department manager.
Variance reports facilitate the principle of “management by exception” explained in Chapter 7.For example, the vice president of purchasing can use the report shown above to evaluate theeffectiveness of the purchasing department manager. Or, the vice president of production canuse production department variance reports to determine how well each production manageris controlling costs. In using variance reports, top management normally looks for significantvariances. These may be judged on the basis of some quantitative measure, such as more than10 percent of the standard or more than $1,000.
e‐Business Insight
Computerized standard cost systems represent one of the most complex accounting systemsto develop and maintain. The standard cost system must be fully integrated into the generalledger. It must allow for the creation and timely maintenance of the database of standardusage and costs for every product. It must perform variance computations. And it must alsoproduce variance reports by product, department, or employee. With the increased use ofautomation and robotics, the computerized standard cost system may even be tied directlyinto these systems to gather variance information.
STATEMENT PRESENTATION OF VARIANCES
In income statements prepared for management under a standard cost accounting system, costof goods sold is stated at standard cost and the variances are separately disclosed, as shownin Illustration 31. The statement shown is based entirely on the production and sale of Weed‐O.It assumes selling and administrative costs of $3,000. Observe that each variance is shown, aswell as the total net variance. In this example, variations from standard costs reduced net incomeby $2,500.
Managerial AccountingChapter 8
Page 514
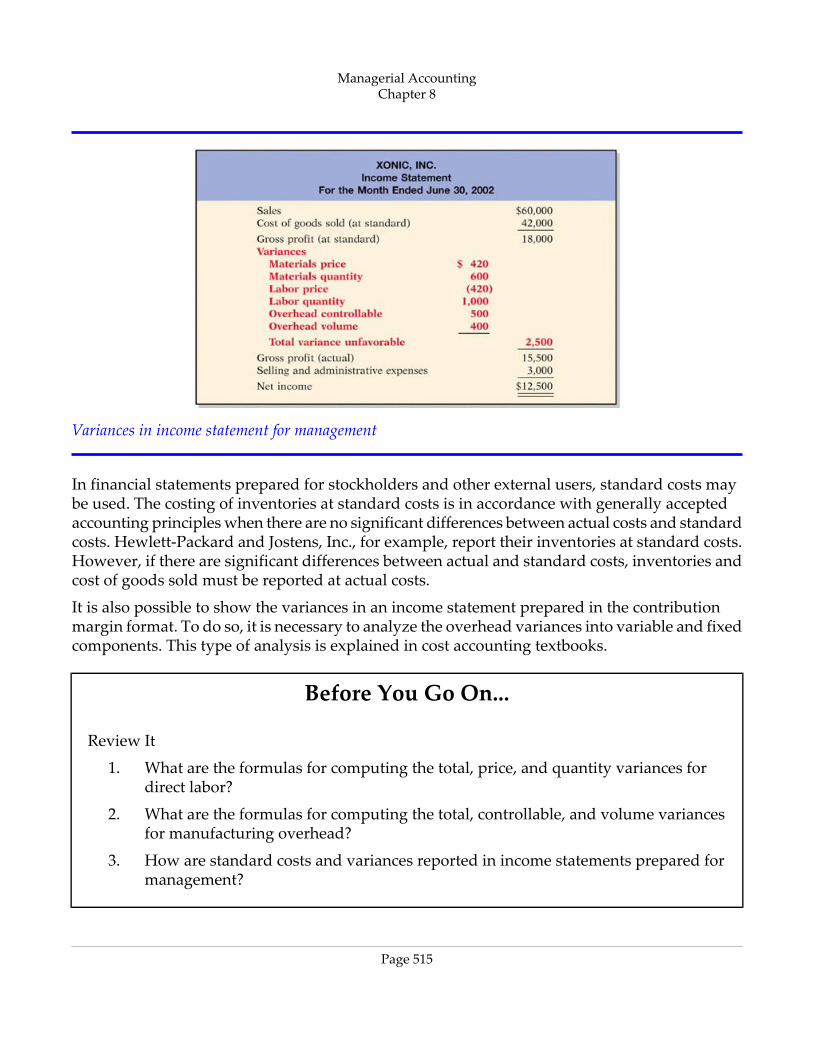
Variances in income statement for management
In financial statements prepared for stockholders and other external users, standard costs maybe used. The costing of inventories at standard costs is in accordance with generally acceptedaccounting principles when there are no significant differences between actual costs and standardcosts. Hewlett‐Packard and Jostens, Inc., for example, report their inventories at standard costs.However, if there are significant differences between actual and standard costs, inventories andcost of goods sold must be reported at actual costs.
It is also possible to show the variances in an income statement prepared in the contributionmargin format. To do so, it is necessary to analyze the overhead variances into variable and fixedcomponents. This type of analysis is explained in cost accounting textbooks.
Before You Go On...
Review It
1. What are the formulas for computing the total, price, and quantity variances fordirect labor?
2. What are the formulas for computing the total, controllable, and volume variancesfor manufacturing overhead?
3. How are standard costs and variances reported in income statements prepared formanagement?
Managerial AccountingChapter 8
Page 515
USING THE DECISION TOOLKIT
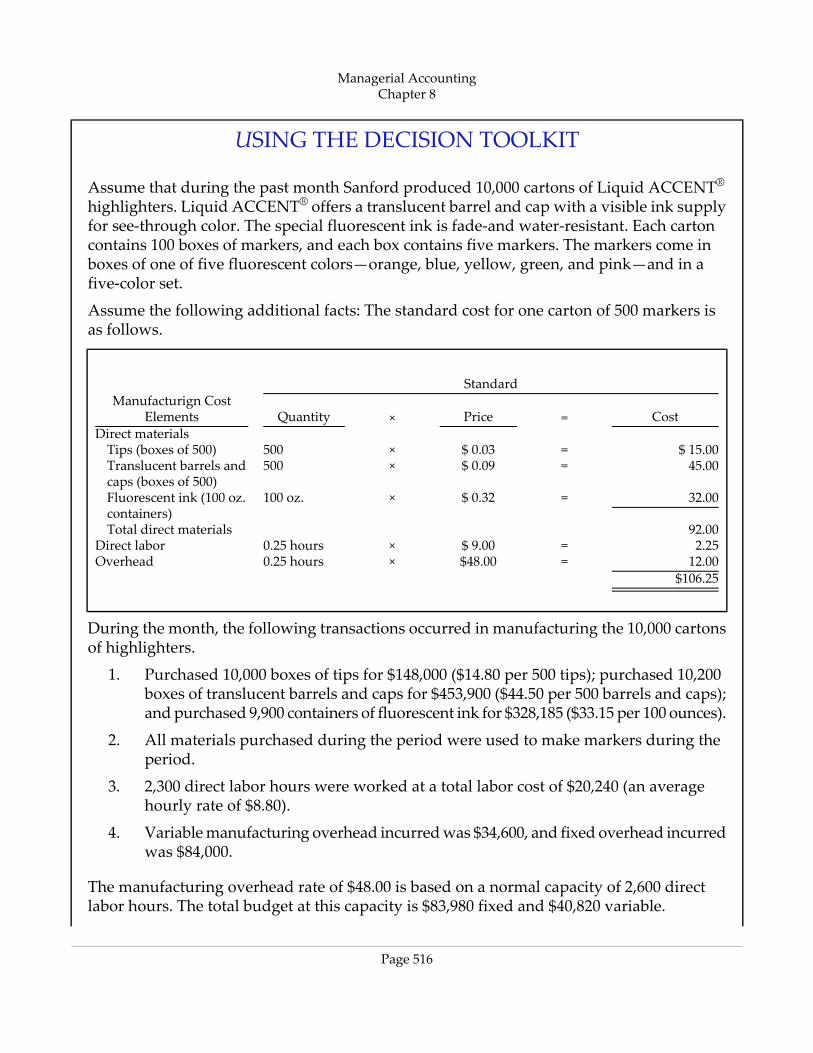
Assume that during the past month Sanford produced 10,000 cartons of Liquid ACCENT®highlighters. Liquid ACCENT® offers a translucent barrel and cap with a visible ink supplyfor see‐through color. The special fluorescent ink is fade‐and water‐resistant. Each cartoncontains 100 boxes of markers, and each box contains five markers. The markers come inboxes of one of five fluorescent colors—orange, blue, yellow, green, and pink—and in afive‐color set.
Assume the following additional facts: The standard cost for one carton of 500 markers isas follows.
Standard
Cost=Price×QuantityManufacturign Cost
ElementsDirect materials
$ 15.00=$ 0.03×500Tips (boxes of 500)45.00=$ 0.09×500Translucent barrels and
caps (boxes of 500)32.00=$ 0.32×100 oz.Fluorescent ink (100 oz.
containers)92.00Total direct materials2.25=$ 9.00×0.25 hoursDirect labor12.00=$48.00×0.25 hoursOverhead
$106.25
During the month, the following transactions occurred in manufacturing the 10,000 cartonsof highlighters.
1. Purchased 10,000 boxes of tips for $148,000 ($14.80 per 500 tips); purchased 10,200boxes of translucent barrels and caps for $453,900 ($44.50 per 500 barrels and caps);and purchased 9,900 containers of fluorescent ink for $328,185 ($33.15 per 100 ounces).
2. All materials purchased during the period were used to make markers during theperiod.
3. 2,300 direct labor hours were worked at a total labor cost of $20,240 (an averagehourly rate of $8.80).
4. Variable manufacturing overhead incurred was $34,600, and fixed overhead incurredwas $84,000.
The manufacturing overhead rate of $48.00 is based on a normal capacity of 2,600 directlabor hours. The total budget at this capacity is $83,980 fixed and $40,820 variable.
Managerial AccountingChapter 8
Page 516
Instructions
1. Determine whether Sanford met its price and quantity objectives relative to materials,labor, and overhead.
Managerial AccountingChapter 8
Page 517
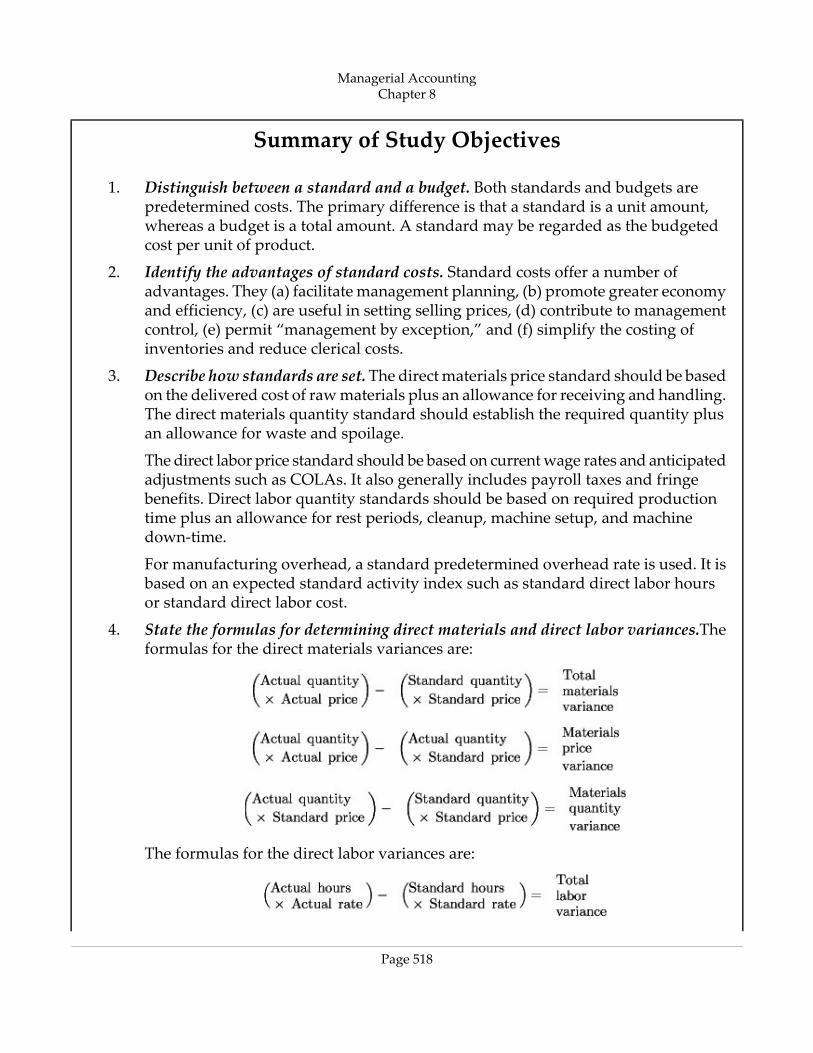
Summary of Study Objectives
1. Distinguish between a standard and a budget. Both standards and budgets arepredetermined costs. The primary difference is that a standard is a unit amount,whereas a budget is a total amount. A standard may be regarded as the budgetedcost per unit of product.
2. Identify the advantages of standard costs. Standard costs offer a number ofadvantages. They (a) facilitate management planning, (b) promote greater economyand efficiency, (c) are useful in setting selling prices, (d) contribute to managementcontrol, (e) permit “management by exception,” and (f) simplify the costing ofinventories and reduce clerical costs.
3. Describe how standards are set.The direct materials price standard should be basedon the delivered cost of raw materials plus an allowance for receiving and handling.The direct materials quantity standard should establish the required quantity plusan allowance for waste and spoilage.
The direct labor price standard should be based on current wage rates and anticipatedadjustments such as COLAs. It also generally includes payroll taxes and fringebenefits. Direct labor quantity standards should be based on required productiontime plus an allowance for rest periods, cleanup, machine setup, and machinedown‐time.
For manufacturing overhead, a standard predetermined overhead rate is used. It isbased on an expected standard activity index such as standard direct labor hoursor standard direct labor cost.
4. State the formulas for determining direct materials and direct labor variances.Theformulas for the direct materials variances are:
The formulas for the direct labor variances are:
Managerial AccountingChapter 8
Page 518
5. State the formulas for determining manufacturing overhead variances.The formulasfor the manufacturing overhead variances are:
6. Discuss the reporting of variances.Variances are reported to management in variancereports. The reports facilitate management by exception by highlighting significantdifferences.
7. Prepare an income statement for management under a standard costing system.Under a standard costing system, an income statement prepared for managementwill report cost of goods sold at standard cost and then disclose each varianceseparately.
APPENDIX 8A STANDARD COST ACCOUNTING SYSTEM
A standard cost accounting system is a double‐entry system of accounting. In this system,standard costs are used in making entries, and variances are formally recognized in the accounts.A standard cost system may be used with either job order or process costing. At this point, wewill explain and illustrate a standard cost,job order cost accounting system. The system is based
Managerial AccountingChapter 8
Page 519
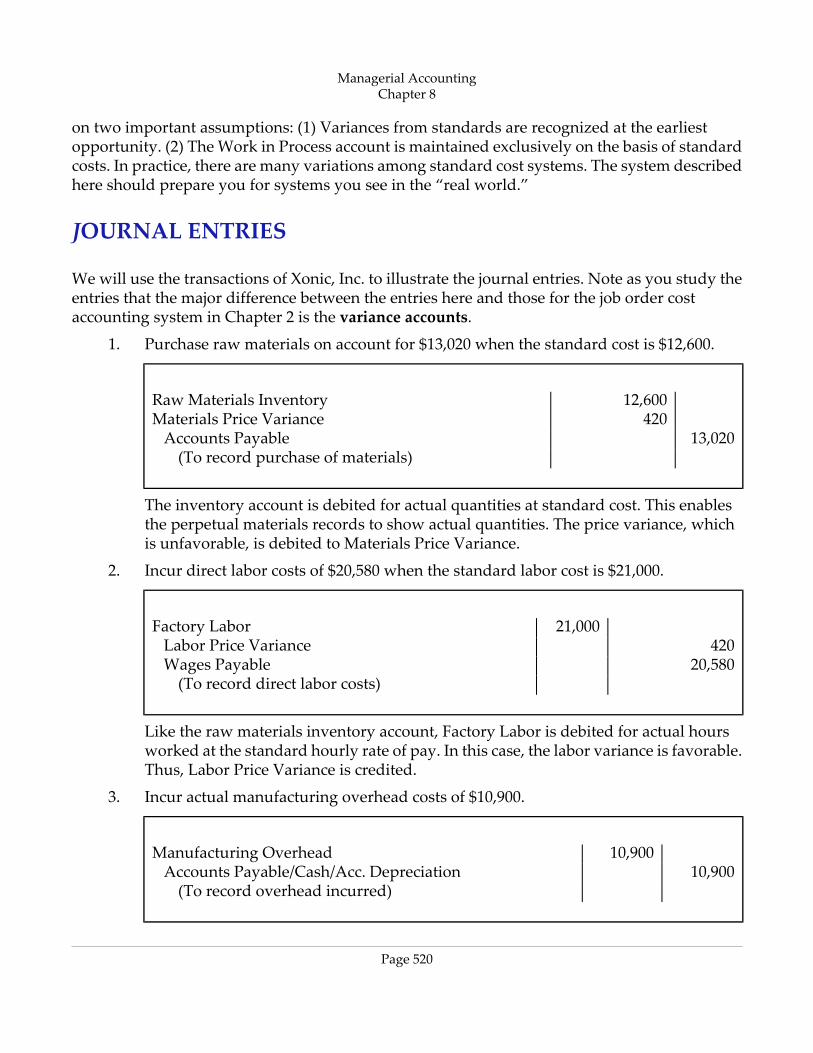
on two important assumptions: (1) Variances from standards are recognized at the earliestopportunity. (2) The Work in Process account is maintained exclusively on the basis of standardcosts. In practice, there are many variations among standard cost systems. The system describedhere should prepare you for systems you see in the “real world.”
JOURNAL ENTRIES
We will use the transactions of Xonic, Inc. to illustrate the journal entries. Note as you study theentries that the major difference between the entries here and those for the job order costaccounting system in Chapter 2 is the variance accounts.
1. Purchase raw materials on account for $13,020 when the standard cost is $12,600.
12,600Raw Materials Inventory420Materials Price Variance
13,020Accounts Payable(To record purchase of materials)
The inventory account is debited for actual quantities at standard cost. This enablesthe perpetual materials records to show actual quantities. The price variance, whichis unfavorable, is debited to Materials Price Variance.
2. Incur direct labor costs of $20,580 when the standard labor cost is $21,000.
21,000Factory Labor420Labor Price Variance
20,580Wages Payable(To record direct labor costs)
Like the raw materials inventory account, Factory Labor is debited for actual hoursworked at the standard hourly rate of pay. In this case, the labor variance is favorable.Thus, Labor Price Variance is credited.
3. Incur actual manufacturing overhead costs of $10,900.
10,900Manufacturing Overhead10,900Accounts Payable/Cash/Acc. Depreciation
(To record overhead incurred)
Managerial AccountingChapter 8
Page 520
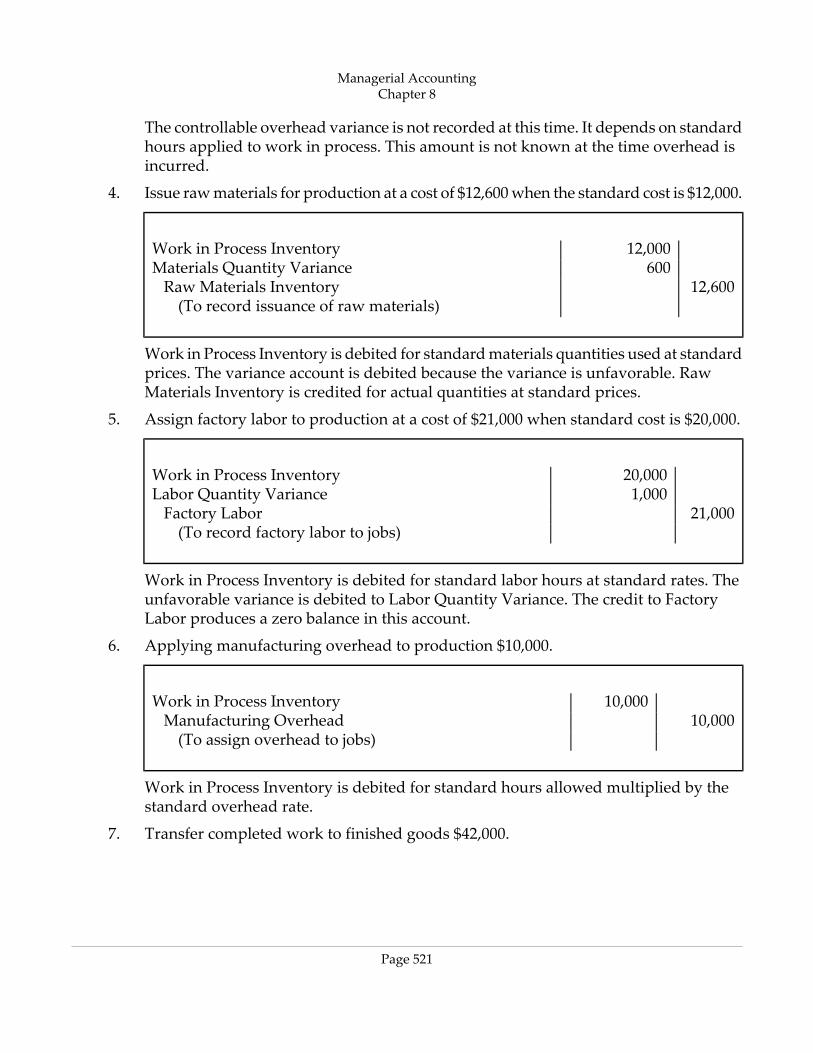
The controllable overhead variance is not recorded at this time. It depends on standardhours applied to work in process. This amount is not known at the time overhead isincurred.
4. Issue raw materials for production at a cost of $12,600 when the standard cost is $12,000.
12,000Work in Process Inventory600Materials Quantity Variance
12,600Raw Materials Inventory(To record issuance of raw materials)
Work in Process Inventory is debited for standard materials quantities used at standardprices. The variance account is debited because the variance is unfavorable. RawMaterials Inventory is credited for actual quantities at standard prices.
5. Assign factory labor to production at a cost of $21,000 when standard cost is $20,000.
20,000Work in Process Inventory1,000Labor Quantity Variance
21,000Factory Labor(To record factory labor to jobs)
Work in Process Inventory is debited for standard labor hours at standard rates. Theunfavorable variance is debited to Labor Quantity Variance. The credit to FactoryLabor produces a zero balance in this account.
6. Applying manufacturing overhead to production $10,000.
10,000Work in Process Inventory10,000Manufacturing Overhead
(To assign overhead to jobs)
Work in Process Inventory is debited for standard hours allowed multiplied by thestandard overhead rate.
7. Transfer completed work to finished goods $42,000.
Managerial AccountingChapter 8
Page 521
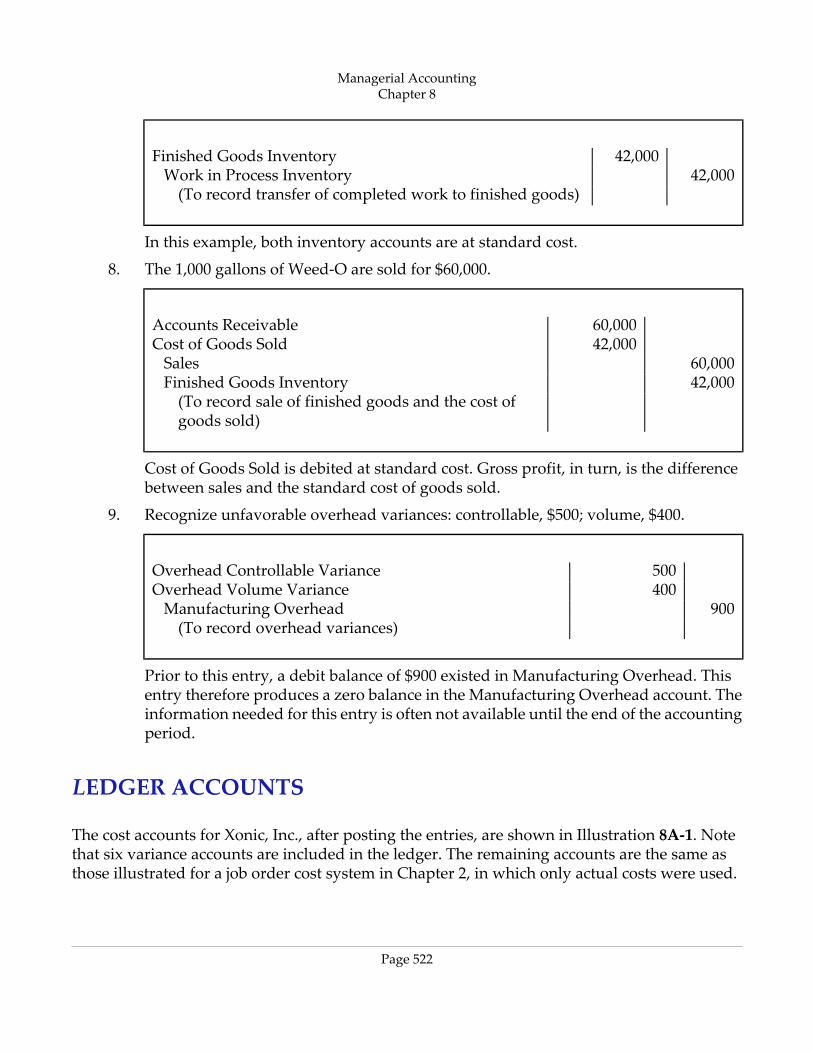
42,000Finished Goods Inventory42,000Work in Process Inventory
(To record transfer of completed work to finished goods)
In this example, both inventory accounts are at standard cost.
8. The 1,000 gallons of Weed‐O are sold for $60,000.
60,000Accounts Receivable42,000Cost of Goods Sold
60,000Sales42,000Finished Goods Inventory
(To record sale of finished goods and the cost ofgoods sold)
Cost of Goods Sold is debited at standard cost. Gross profit, in turn, is the differencebetween sales and the standard cost of goods sold.
9. Recognize unfavorable overhead variances: controllable, $500; volume, $400.
500Overhead Controllable Variance400Overhead Volume Variance
900Manufacturing Overhead(To record overhead variances)
Prior to this entry, a debit balance of $900 existed in Manufacturing Overhead. Thisentry therefore produces a zero balance in the Manufacturing Overhead account. Theinformation needed for this entry is often not available until the end of the accountingperiod.
LEDGER ACCOUNTS
The cost accounts for Xonic, Inc., after posting the entries, are shown in Illustration 8A‐1. Notethat six variance accounts are included in the ledger. The remaining accounts are the same asthose illustrated for a job order cost system in Chapter 2, in which only actual costs were used.
Managerial AccountingChapter 8
Page 522
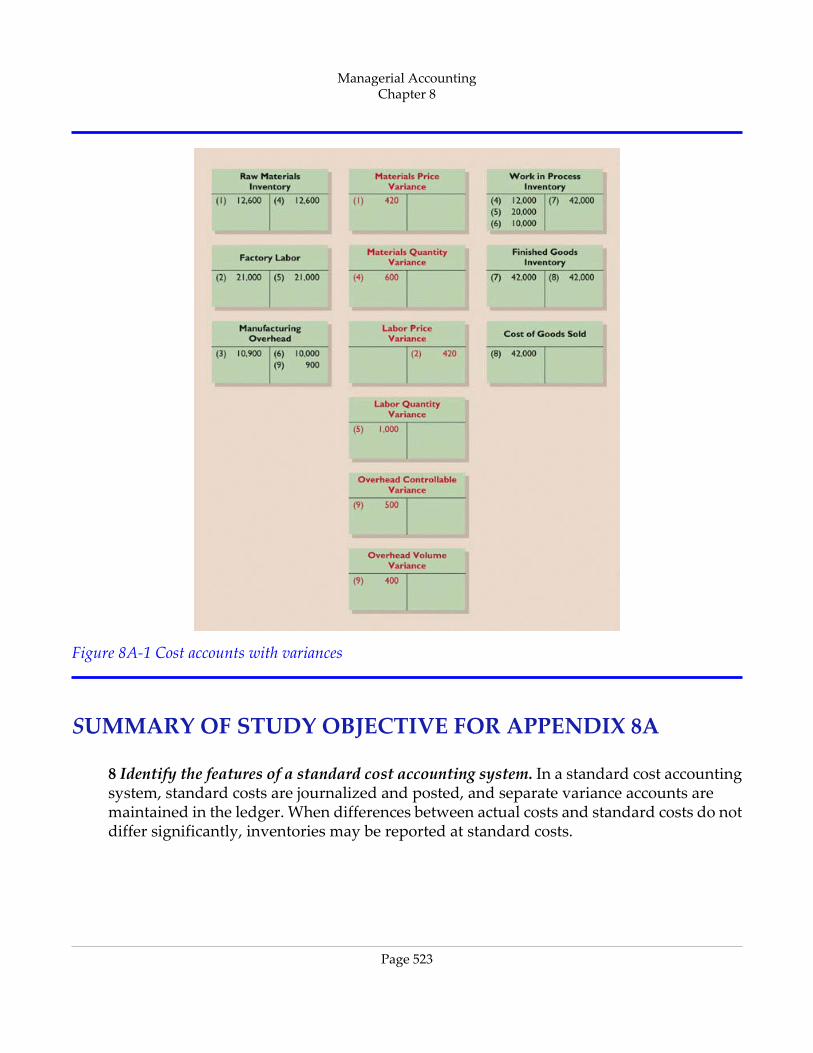
Figure 8A‐1 Cost accounts with variances
SUMMARY OF STUDY OBJECTIVE FOR APPENDIX 8A
8 Identify the features of a standard cost accounting system. In a standard cost accountingsystem, standard costs are journalized and posted, and separate variance accounts aremaintained in the ledger. When differences between actual costs and standard costs do notdiffer significantly, inventories may be reported at standard costs.
Managerial AccountingChapter 8
Page 523
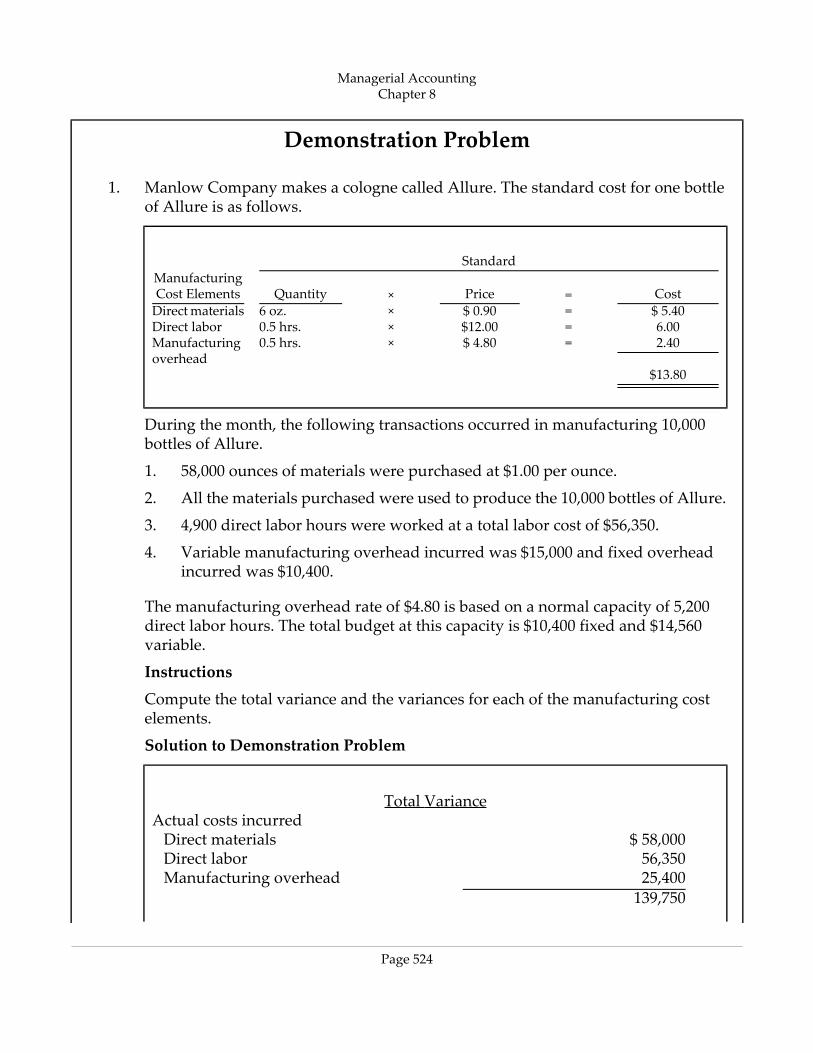
Demonstration Problem
1. Manlow Company makes a cologne called Allure. The standard cost for one bottleof Allure is as follows.
Standard
Cost=Price×QuantityManufacturingCost Elements
$ 5.40=$ 0.90×6 oz.Direct materials6.00=$12.00×0.5 hrs.Direct labor2.40=$ 4.80×0.5 hrs.Manufacturing
overhead$13.80
During the month, the following transactions occurred in manufacturing 10,000bottles of Allure.
1. 58,000 ounces of materials were purchased at $1.00 per ounce.
2. All the materials purchased were used to produce the 10,000 bottles of Allure.
3. 4,900 direct labor hours were worked at a total labor cost of $56,350.
4. Variable manufacturing overhead incurred was $15,000 and fixed overheadincurred was $10,400.
The manufacturing overhead rate of $4.80 is based on a normal capacity of 5,200direct labor hours. The total budget at this capacity is $10,400 fixed and $14,560variable.
Instructions
Compute the total variance and the variances for each of the manufacturing costelements.
Solution to Demonstration Problem
Total VarianceActual costs incurred
$ 58,000Direct materials56,350Direct labor25,400Manufacturing overhead139,750
Managerial AccountingChapter 8
Page 524
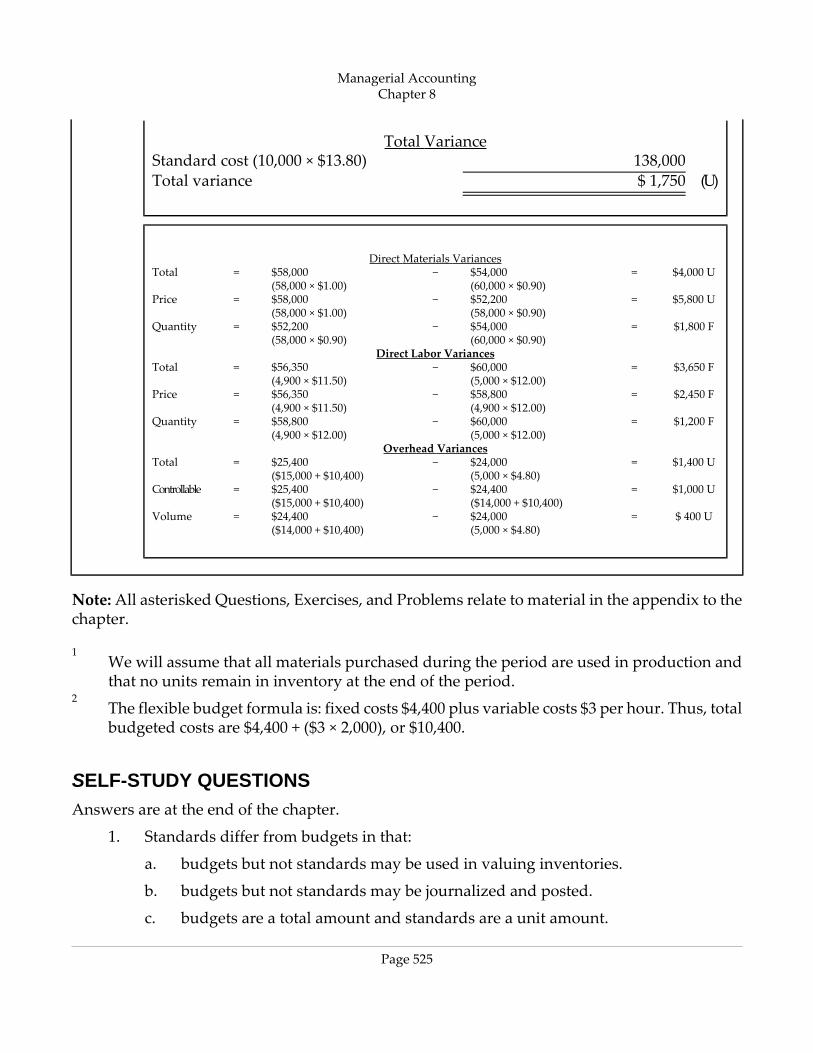
Total Variance138,000Standard cost (10,000 × $13.80)
(U)$ 1,750Total variance
Direct Materials Variances$4,000 U=$54,000−$58,000=Total
(60,000 × $0.90)(58,000 × $1.00)$5,800 U=$52,200−$58,000=Price
(58,000 × $0.90)(58,000 × $1.00)$1,800 F=$54,000−$52,200=Quantity
(60,000 × $0.90)(58,000 × $0.90)Direct Labor Variances
$3,650 F=$60,000−$56,350=Total(5,000 × $12.00)(4,900 × $11.50)
$2,450 F=$58,800−$56,350=Price(4,900 × $12.00)(4,900 × $11.50)
$1,200 F=$60,000−$58,800=Quantity(5,000 × $12.00)(4,900 × $12.00)
Overhead Variances$1,400 U=$24,000−$25,400=Total
(5,000 × $4.80)($15,000 + $10,400)$1,000 U=$24,400−$25,400=Controllable
($14,000 + $10,400)($15,000 + $10,400)$ 400 U=$24,000−$24,400=Volume
(5,000 × $4.80)($14,000 + $10,400)
Note:All asterisked Questions, Exercises, and Problems relate to material in the appendix to thechapter.
1We will assume that all materials purchased during the period are used in production andthat no units remain in inventory at the end of the period.
2The flexible budget formula is: fixed costs $4,400 plus variable costs $3 per hour. Thus, totalbudgeted costs are $4,400 + ($3 × 2,000), or $10,400.
SELF-STUDY QUESTIONSAnswers are at the end of the chapter.
1. Standards differ from budgets in that:
a. budgets but not standards may be used in valuing inventories.
b. budgets but not standards may be journalized and posted.
c. budgets are a total amount and standards are a unit amount.
Managerial AccountingChapter 8
Page 525
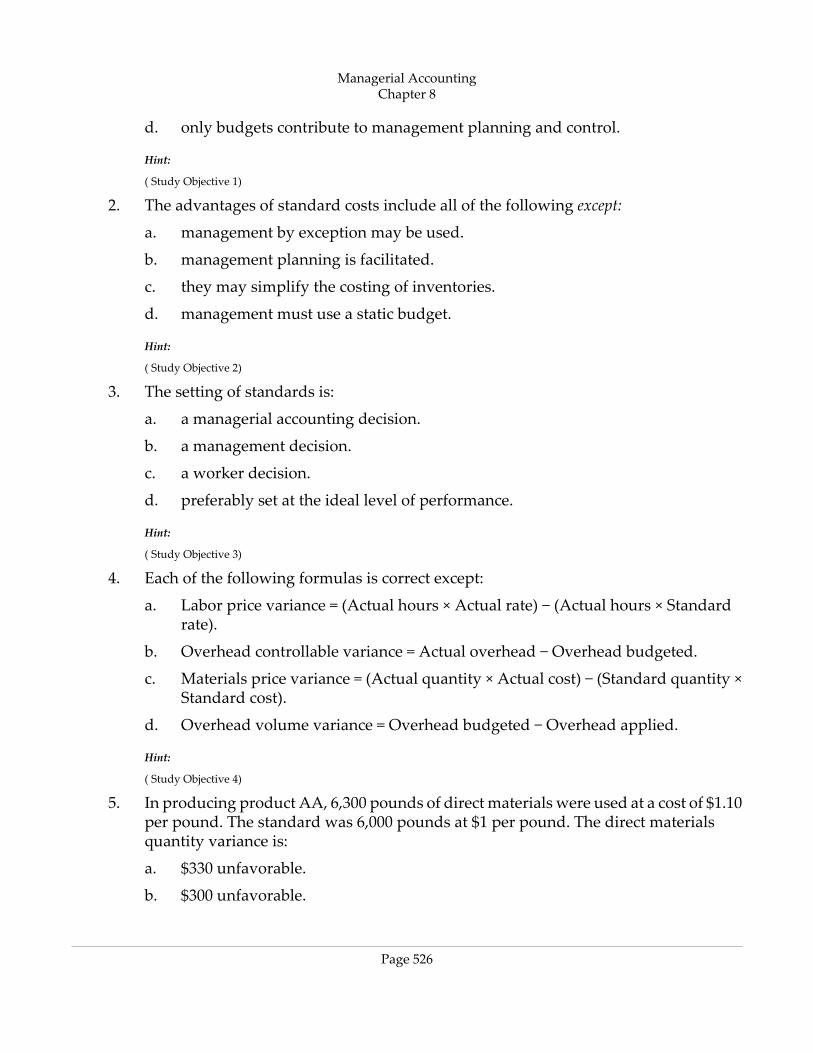
d. only budgets contribute to management planning and control.
Hint:
( Study Objective 1)
2. The advantages of standard costs include all of the following except:
a. management by exception may be used.
b. management planning is facilitated.
c. they may simplify the costing of inventories.
d. management must use a static budget.
Hint:
( Study Objective 2)
3. The setting of standards is:
a. a managerial accounting decision.
b. a management decision.
c. a worker decision.
d. preferably set at the ideal level of performance.
Hint:
( Study Objective 3)
4. Each of the following formulas is correct except:
a. Labor price variance = (Actual hours × Actual rate) − (Actual hours × Standardrate).
b. Overhead controllable variance = Actual overhead − Overhead budgeted.
c. Materials price variance = (Actual quantity × Actual cost) − (Standard quantity ×Standard cost).
d. Overhead volume variance = Overhead budgeted − Overhead applied.
Hint:
( Study Objective 4)
5. In producing product AA, 6,300 pounds of direct materials were used at a cost of $1.10per pound. The standard was 6,000 pounds at $1 per pound. The direct materialsquantity variance is:
a. $330 unfavorable.
b. $300 unfavorable.
Managerial AccountingChapter 8
Page 526
c. $600 unfavorable.
d. $630 unfavorable.
Hint:
( Study Objective 4)
6. In producing product ZZ, 14,800 direct labor hours were used at a rate of $8.20 perhour. The standard was 15,000 hours at $8.00 per hour. Based on these data, the directlabor:
a. quantity variance is $1,600 favorable.
b. quantity variance is $1,600 unfavorable.
c. price variance is $2,960 favorable.
d. price variance is $3,000 unfavorable.
Hint:
( Study Objective 4)
7. Which of the following is correct about overhead variances?
a. The controllable variance generally pertains to fixed overhead costs.
b. The volume variance pertains solely to variable overhead costs.
c. Standard hours actually worked are used in each variance.
d. Budgeted overhead costs are based on the flexible overhead budget.
Hint:
( Study Objective 5)
8. The formula for computing the total overhead variance is:
a. actual overhead less overhead applied.
b. overhead budgeted less overhead applied.
c. actual overhead less overhead budgeted.
d. No correct answer given.
Hint:
( Study Objective 5)
9. Which of the following is incorrect about variance reports?
a. They facilitate “management by exception.”
b. They should only be sent to the top level of management.
c. They should be prepared as soon as possible.
Managerial AccountingChapter 8
Page 527
d. They may vary in form, content, and frequency among companies.
Hint:
( Study Objective 6)
10. Which of the following is incorrect about a standard cost accounting system?
a. It is applicable to job order costing.
b. It is applicable to process costing.
c. It is a single‐entry system.
d. It keeps separate accounts for each variance.
Hint:
( Study Objective 8)
QUESTIONS1. a. “Standard costs are the expected total cost of completing a job.” Is this correct?
Explain.
b. “A standard imposed by a governmental agency is known as a regulation.” Doyou agree? Explain.
2. a. Explain the similarities and differences between standards and budgets.
b. Contrast the accounting for standards and budgets.
3. Standard costs facilitate management planning. What are the other advantages ofstandard costs?
4. Contrast the roles of the management accountant and management in setting standardcosts.
5. Distinguish between an ideal standard and a normal standard.
6. What factors should be considered in setting (a) the materials price standard and (b)the materials quantity standard?
7. “The objective in setting the direct labor quantity standard is to determine the aggregatetime required to make one unit of product.” Do you agree? What allowances shouldbe made in setting this standard?
8. How is the predetermined overhead rate determined when standard costs are used?
9. What is the difference between a favorable cost variance and an unfavorable costvariance?
Managerial AccountingChapter 8
Page 528
10. In each of the following formulas, supply the words that should be inserted for eachnumber in parentheses.
a. (Actual quantity × (1)) − (Standard quantity × (2)) = Total materials variance
b. ((3) × Actual price) − (Actual quantity × (4)) = Materials price variance
c. (Actual quantity × (5)) − ((6) × Standard price) = Materials quantity variance
11. In the direct labor variance matrix, there are three factors: (1) Actual hours × Actualrate, (2) Actual hours × Standard rate, and (3) Standard hours × Standard rate. Usingthe numbers, indicate the formulas for each of the direct labor variances.
12. Dant Company's standard predetermined overhead rate is $6.00 per direct labor hour.For the month of June, 26,000 actual hours were worked, and 27,500 standard hourswere allowed. Normal capacity hours were 28,000. How much overhead was applied?
13. If the $6.00 per hour overhead rate in question 12 consists of $4.00 variable, and actualoverhead costs were $163,000, what is the overhead controllable variance for June? Isthe variance favorable or unfavorable?
14. Using the data in questions 12 and 13, what is the overhead volume variance for June?Is the variance favorable or unfavorable?
15. What is the purpose of computing the overhead volume variance? What is the basicformula for this variance?
16. Ellen Landis does not understand why the overhead volume variance indicates thatfixed overhead costs are under‐ or overapplied. Clarify this matter for Ellen.
17. Stan LaRue is attempting to outline the important points about overhead variances ona class examination. List four points that Stan should include in his outline.
18. How often should variances be reported to management? What principle may be usedwith variance reports?
19. What circumstances may cause the purchasing department to be responsible for bothan unfavorable materials price variance and an unfavorable materials quantity variance?
20. (a) How are variances reported in income statements prepared for management? (b)May standard costs be used in preparing financial statements for stock‐holders? Explain.
21. (a) Explain the basic features of a standard cost accounting system. (b) What type ofbalance will exist in the variance account when (1) the materials price variance isunfavorable and (2) the labor quantity variance is favorable?
Managerial AccountingChapter 8
Page 529
BRIEF EXERCISESBE8‐1 Tumbo Company uses both standards and budgets. For the year, estimated
production of Product X is 500,000 units. Total estimated costs for materials andlabor are $1,200,000 and $1,600,000. Compute the estimates for (a) a standard costand (b) a budgeted cost.Hint:
Distinguish between a standard and a budget.
( Study Objective 1)
BE8‐2 Nurmi Company accumulates the following data concerning raw materials inmaking one gallon of finished product: (1) Price—net purchase price $3.50, freight‐in$0.20, and receiving and handling $0.10. (2) Quantity—required materials 2.6pounds, allowance for waste and spoilage 0.4 pounds. Compute the following.
a. Standard direct materials price per gallon.
b. Standard direct materials quantity per gallon.
c. Total standard material cost per gallon.
Hint:
Set direct materials standard.
( Study Objective 3)
BE8‐3 Labor data for making one gallon of finished product in Nurmi Company are asfollows: (1) Price—hourly wage rate $10.00, payroll taxes $0.80, and fringe benefits$1.20. (2) Quantity—actual production time 1.6 hours, rest periods and clean up0.25 hours, and setup and downtime 0.15 hours. Compute the following.
a. Standard direct labor rate per hour.
b. Standard direct labor hours per gallon.
c. Standard labor cost per gallon.
Hint:
Set direct labor standard.
( Study Objective 3)
BE8‐4 Nadia Company's standard materials cost per unit of output is $8 (2 pounds ×$4.00). During July, the company purchases and uses 3,300 pounds of materialscosting $13,365 in making 1,500 units of finished product. Compute the total, price,and quantity materials variances.Hint:
Compute direct materials variances.
( Study Objective 4)
Managerial AccountingChapter 8
Page 530
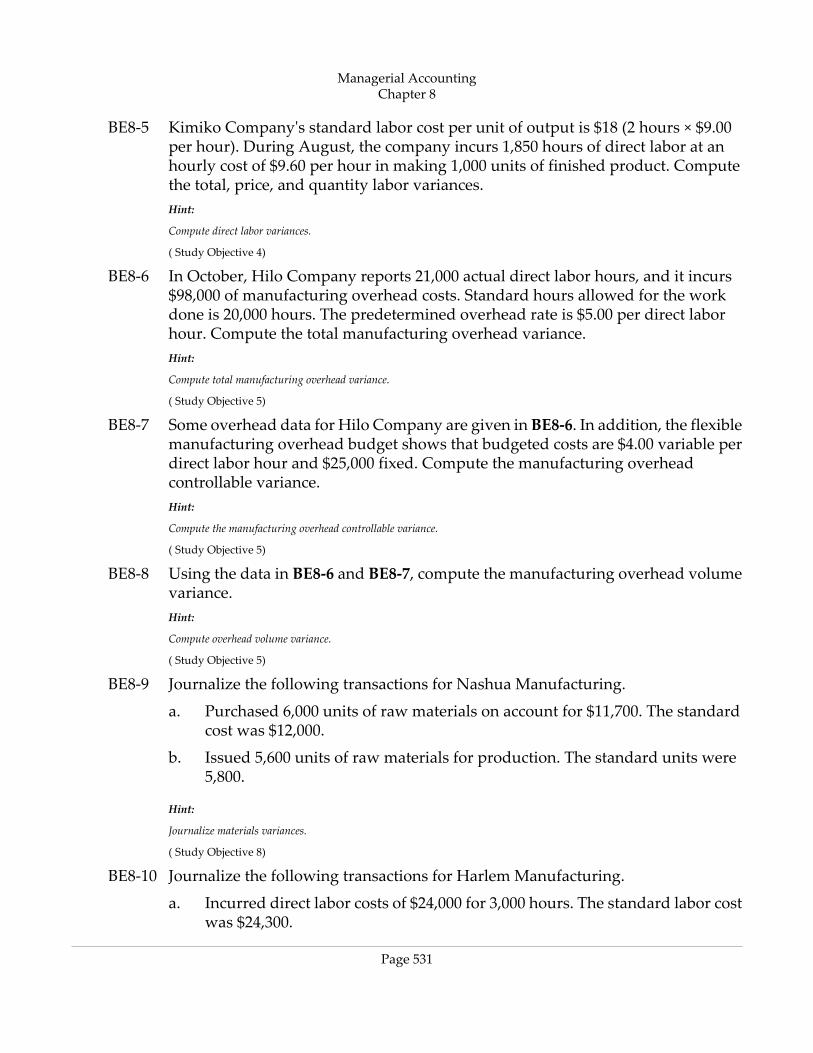
BE8‐5 Kimiko Company's standard labor cost per unit of output is $18 (2 hours × $9.00per hour). During August, the company incurs 1,850 hours of direct labor at anhourly cost of $9.60 per hour in making 1,000 units of finished product. Computethe total, price, and quantity labor variances.Hint:
Compute direct labor variances.
( Study Objective 4)
BE8‐6 In October, Hilo Company reports 21,000 actual direct labor hours, and it incurs$98,000 of manufacturing overhead costs. Standard hours allowed for the workdone is 20,000 hours. The predetermined overhead rate is $5.00 per direct laborhour. Compute the total manufacturing overhead variance.Hint:
Compute total manufacturing overhead variance.
( Study Objective 5)
BE8‐7 Some overhead data for Hilo Company are given in BE8‐6. In addition, the flexiblemanufacturing overhead budget shows that budgeted costs are $4.00 variable perdirect labor hour and $25,000 fixed. Compute the manufacturing overheadcontrollable variance.Hint:
Compute the manufacturing overhead controllable variance.
( Study Objective 5)
BE8‐8 Using the data in BE8‐6 and BE8‐7, compute the manufacturing overhead volumevariance.Hint:
Compute overhead volume variance.
( Study Objective 5)
BE8‐9 Journalize the following transactions for Nashua Manufacturing.
a. Purchased 6,000 units of raw materials on account for $11,700. The standardcost was $12,000.
b. Issued 5,600 units of raw materials for production. The standard units were5,800.
Hint:
Journalize materials variances.
( Study Objective 8)
BE8‐10 Journalize the following transactions for Harlem Manufacturing.
a. Incurred direct labor costs of $24,000 for 3,000 hours. The standard labor costwas $24,300.
Managerial AccountingChapter 8
Page 531
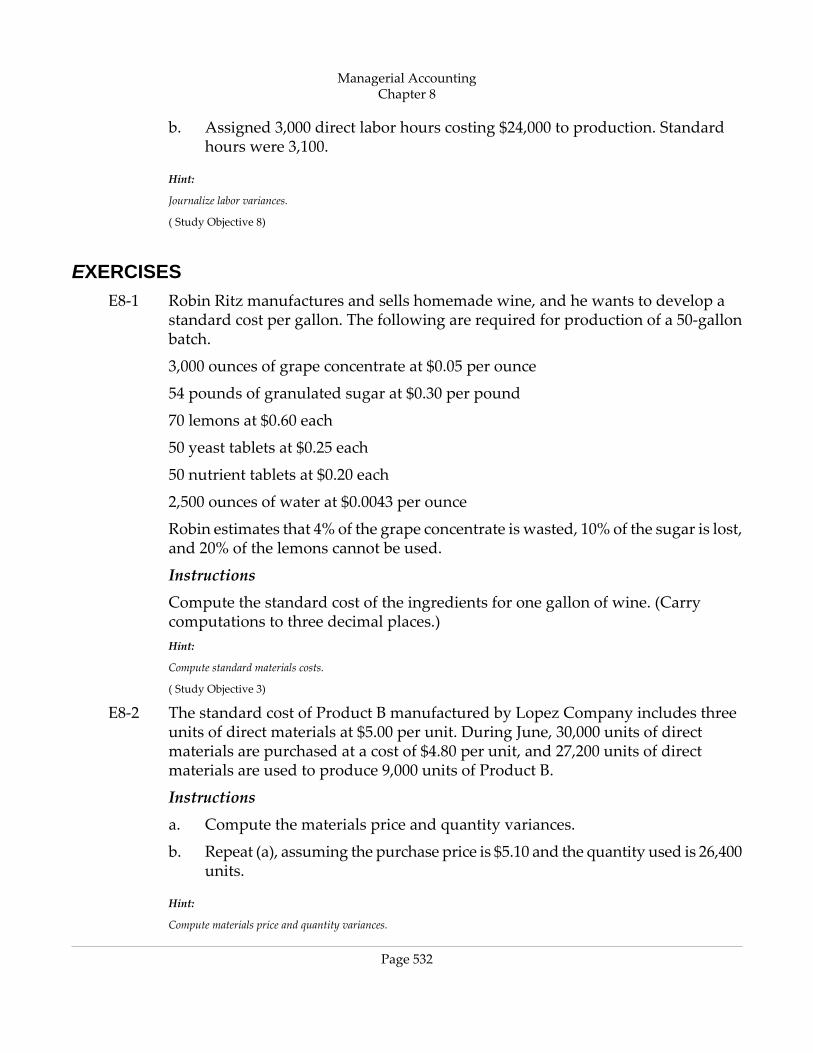
b. Assigned 3,000 direct labor hours costing $24,000 to production. Standardhours were 3,100.
Hint:
Journalize labor variances.
( Study Objective 8)
EXERCISESE8‐1 Robin Ritz manufactures and sells homemade wine, and he wants to develop a
standard cost per gallon. The following are required for production of a 50‐gallonbatch.
3,000 ounces of grape concentrate at $0.05 per ounce
54 pounds of granulated sugar at $0.30 per pound
70 lemons at $0.60 each
50 yeast tablets at $0.25 each
50 nutrient tablets at $0.20 each
2,500 ounces of water at $0.0043 per ounce
Robin estimates that 4% of the grape concentrate is wasted, 10% of the sugar is lost,and 20% of the lemons cannot be used.
Instructions
Compute the standard cost of the ingredients for one gallon of wine. (Carrycomputations to three decimal places.)Hint:
Compute standard materials costs.
( Study Objective 3)
E8‐2 The standard cost of Product B manufactured by Lopez Company includes threeunits of direct materials at $5.00 per unit. During June, 30,000 units of directmaterials are purchased at a cost of $4.80 per unit, and 27,200 units of directmaterials are used to produce 9,000 units of Product B.
Instructions
a. Compute the materials price and quantity variances.
b. Repeat (a), assuming the purchase price is $5.10 and the quantity used is 26,400units.
Hint:
Compute materials price and quantity variances.
Managerial AccountingChapter 8
Page 532
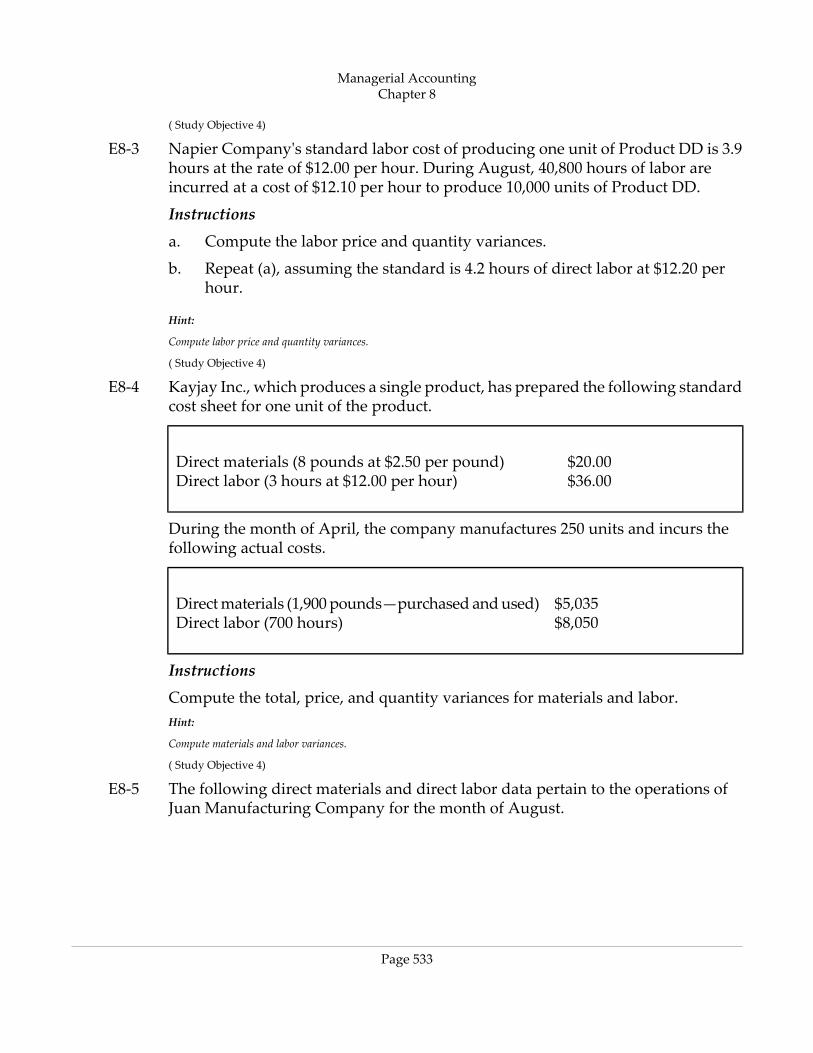
( Study Objective 4)
E8‐3 Napier Company's standard labor cost of producing one unit of Product DD is 3.9hours at the rate of $12.00 per hour. During August, 40,800 hours of labor areincurred at a cost of $12.10 per hour to produce 10,000 units of Product DD.
Instructions
a. Compute the labor price and quantity variances.
b. Repeat (a), assuming the standard is 4.2 hours of direct labor at $12.20 perhour.
Hint:
Compute labor price and quantity variances.
( Study Objective 4)
E8‐4 Kayjay Inc., which produces a single product, has prepared the following standardcost sheet for one unit of the product.
$20.00Direct materials (8 pounds at $2.50 per pound)$36.00Direct labor (3 hours at $12.00 per hour)
During the month of April, the company manufactures 250 units and incurs thefollowing actual costs.
$5,035Direct materials (1,900 pounds—purchased and used)$8,050Direct labor (700 hours)
Instructions
Compute the total, price, and quantity variances for materials and labor.Hint:
Compute materials and labor variances.
( Study Objective 4)
E8‐5 The following direct materials and direct labor data pertain to the operations ofJuan Manufacturing Company for the month of August.
Managerial AccountingChapter 8
Page 533
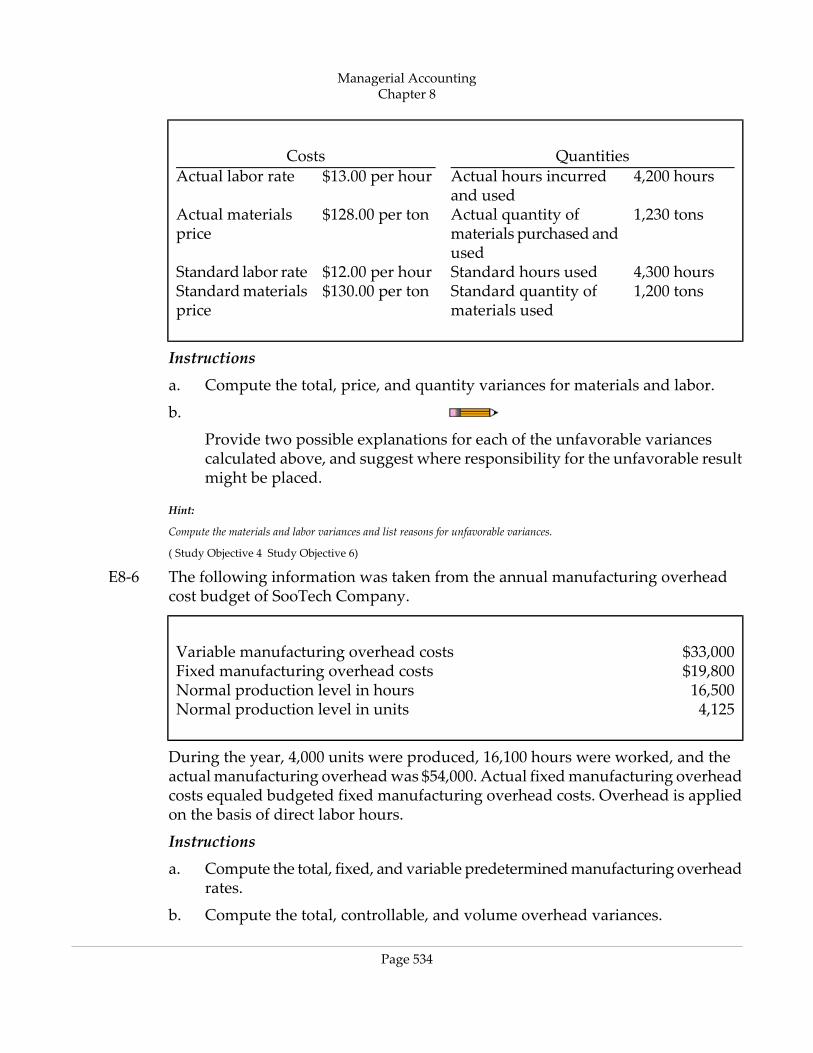
QuantitiesCosts4,200 hoursActual hours incurred
and used$13.00 per hourActual labor rate
1,230 tonsActual quantity ofmaterials purchased andused
$128.00 per tonActual materialsprice
4,300 hoursStandard hours used$12.00 per hourStandard labor rate1,200 tonsStandard quantity of
materials used$130.00 per tonStandard materials
price
Instructions
a. Compute the total, price, and quantity variances for materials and labor.
b.
Provide two possible explanations for each of the unfavorable variancescalculated above, and suggest where responsibility for the unfavorable resultmight be placed.
Hint:
Compute the materials and labor variances and list reasons for unfavorable variances.
( Study Objective 4 Study Objective 6)
E8‐6 The following information was taken from the annual manufacturing overheadcost budget of SooTech Company.
$33,000Variable manufacturing overhead costs$19,800Fixed manufacturing overhead costs16,500Normal production level in hours4,125Normal production level in units
During the year, 4,000 units were produced, 16,100 hours were worked, and theactual manufacturing overhead was $54,000. Actual fixed manufacturing overheadcosts equaled budgeted fixed manufacturing overhead costs. Overhead is appliedon the basis of direct labor hours.
Instructions
a. Compute the total, fixed, and variable predetermined manufacturing overheadrates.
b. Compute the total, controllable, and volume overhead variances.
Managerial AccountingChapter 8
Page 534
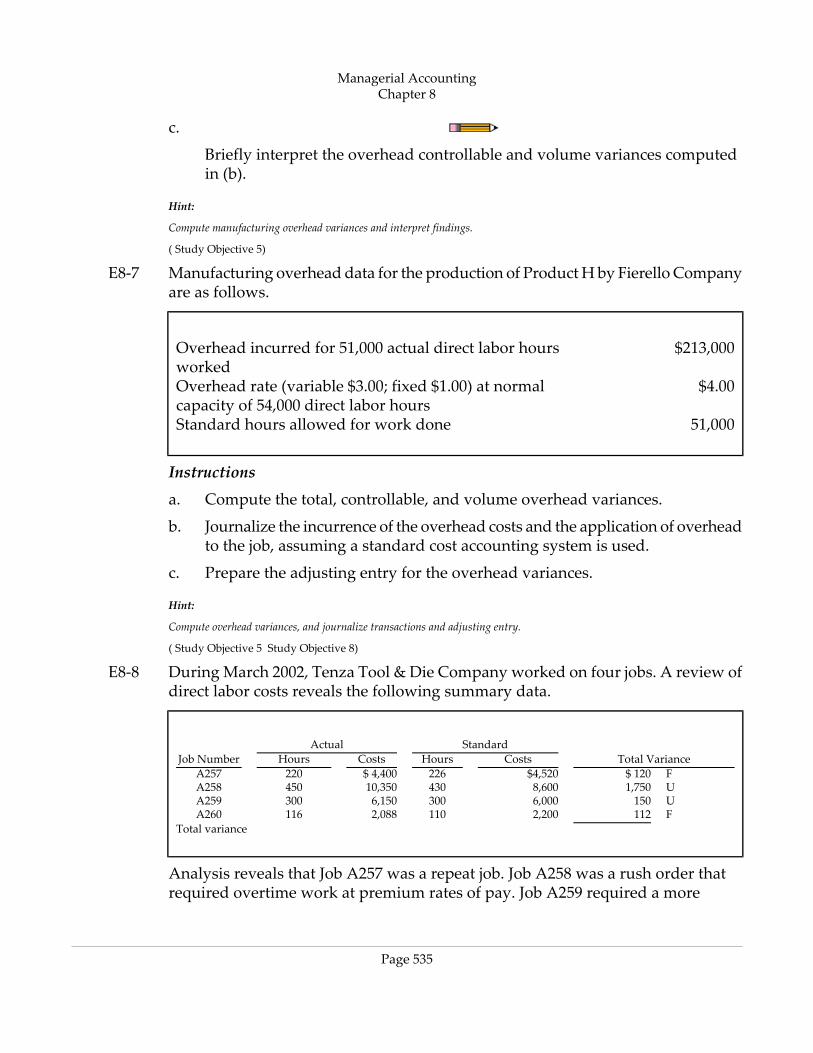
c.
Briefly interpret the overhead controllable and volume variances computedin (b).
Hint:
Compute manufacturing overhead variances and interpret findings.
( Study Objective 5)
E8‐7 Manufacturing overhead data for the production of Product H by Fierello Companyare as follows.
$213,000Overhead incurred for 51,000 actual direct labor hoursworked
$4.00Overhead rate (variable $3.00; fixed $1.00) at normalcapacity of 54,000 direct labor hours
51,000Standard hours allowed for work done
Instructions
a. Compute the total, controllable, and volume overhead variances.
b. Journalize the incurrence of the overhead costs and the application of overheadto the job, assuming a standard cost accounting system is used.
c. Prepare the adjusting entry for the overhead variances.
Hint:
Compute overhead variances, and journalize transactions and adjusting entry.
( Study Objective 5 Study Objective 8)
E8‐8 During March 2002, Tenza Tool & Die Company worked on four jobs. A review ofdirect labor costs reveals the following summary data.
StandardActualTotal VarianceCostsHoursCostsHoursJob Number
F$ 120$4,520226$ 4,400220A257U1,7508,60043010,350450A258U1506,0003006,150300A259F1122,2001102,088116A260
Total variance
Analysis reveals that Job A257 was a repeat job. Job A258 was a rush order thatrequired overtime work at premium rates of pay. Job A259 required a more
Managerial AccountingChapter 8
Page 535
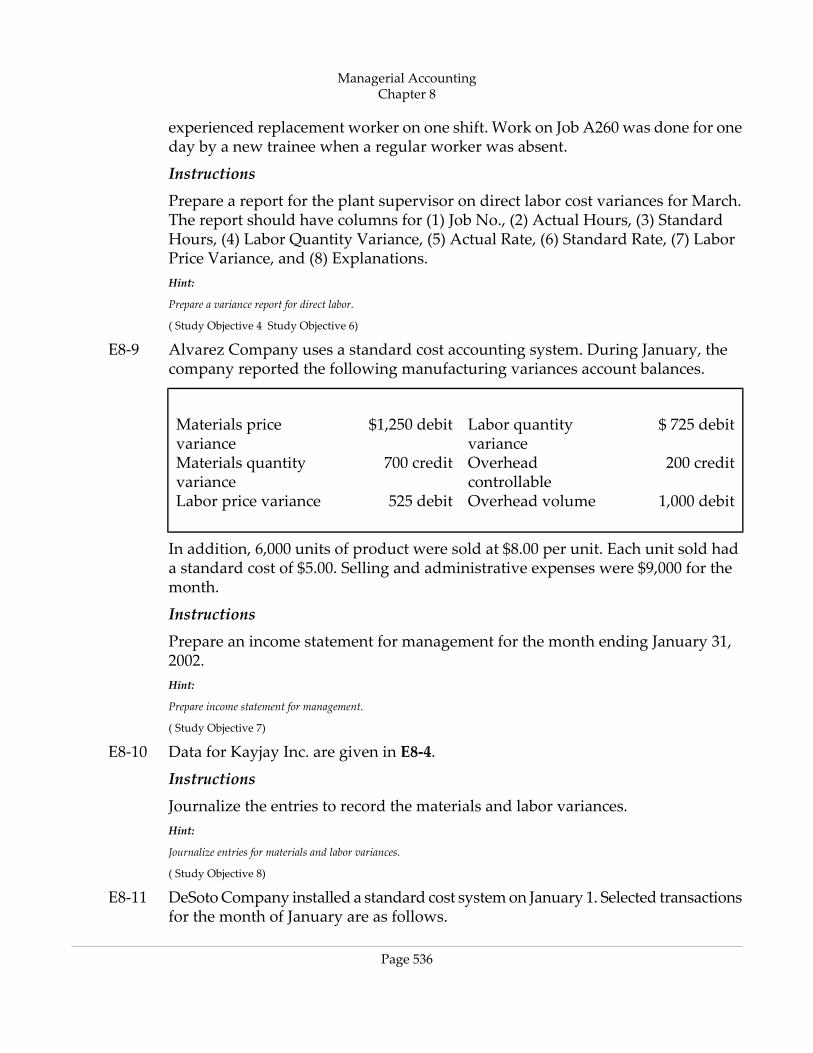
experienced replacement worker on one shift. Work on Job A260 was done for oneday by a new trainee when a regular worker was absent.
Instructions
Prepare a report for the plant supervisor on direct labor cost variances for March.The report should have columns for (1) Job No., (2) Actual Hours, (3) StandardHours, (4) Labor Quantity Variance, (5) Actual Rate, (6) Standard Rate, (7) LaborPrice Variance, and (8) Explanations.Hint:
Prepare a variance report for direct labor.
( Study Objective 4 Study Objective 6)
E8‐9 Alvarez Company uses a standard cost accounting system. During January, thecompany reported the following manufacturing variances account balances.
$ 725 debitLabor quantityvariance
$1,250 debitMaterials pricevariance
200 creditOverheadcontrollable
700 creditMaterials quantityvariance
1,000 debitOverhead volume525 debitLabor price variance
In addition, 6,000 units of product were sold at $8.00 per unit. Each unit sold hada standard cost of $5.00. Selling and administrative expenses were $9,000 for themonth.
Instructions
Prepare an income statement for management for the month ending January 31,2002.Hint:
Prepare income statement for management.
( Study Objective 7)
E8‐10 Data for Kayjay Inc. are given in E8‐4.
Instructions
Journalize the entries to record the materials and labor variances.Hint:
Journalize entries for materials and labor variances.
( Study Objective 8)
E8‐11 DeSoto Company installed a standard cost system on January 1. Selected transactionsfor the month of January are as follows.
Managerial AccountingChapter 8
Page 536
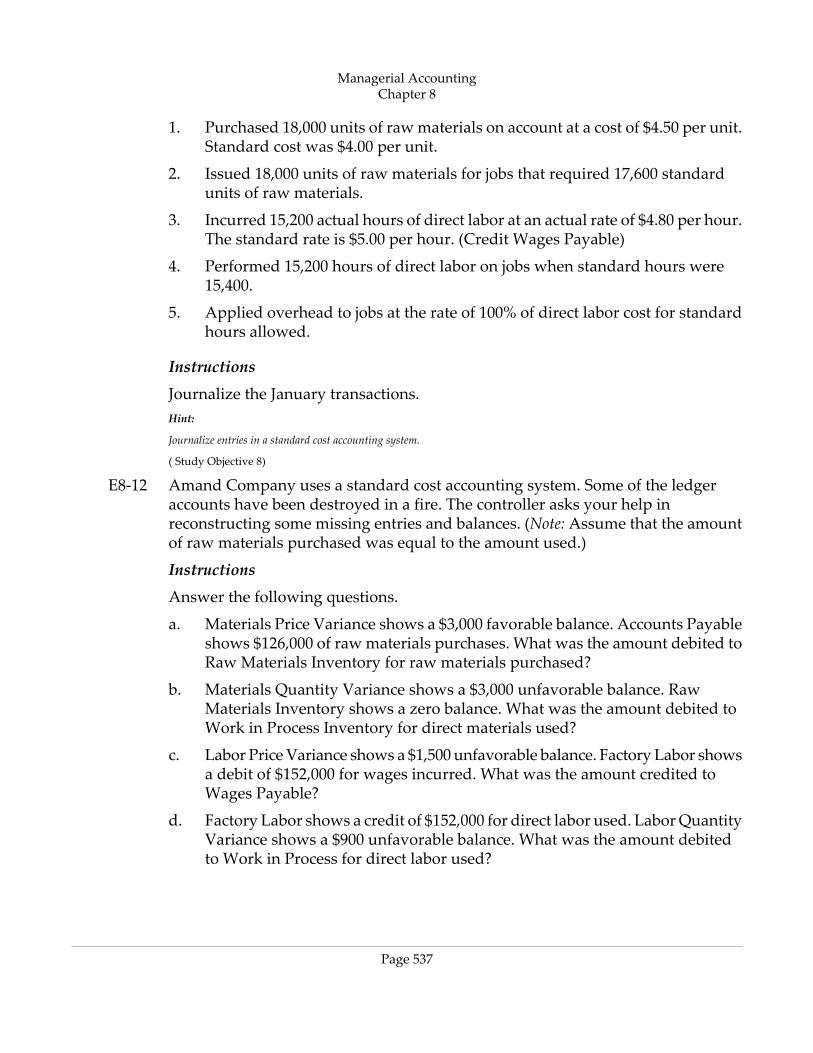
Purchased 18,000 units of raw materials on account at a cost of $4.50 per unit.Standard cost was $4.00 per unit.
1.
2. Issued 18,000 units of raw materials for jobs that required 17,600 standardunits of raw materials.
3. Incurred 15,200 actual hours of direct labor at an actual rate of $4.80 per hour.The standard rate is $5.00 per hour. (Credit Wages Payable)
4. Performed 15,200 hours of direct labor on jobs when standard hours were15,400.
5. Applied overhead to jobs at the rate of 100% of direct labor cost for standardhours allowed.
Instructions
Journalize the January transactions.Hint:
Journalize entries in a standard cost accounting system.
( Study Objective 8)
E8‐12 Amand Company uses a standard cost accounting system. Some of the ledgeraccounts have been destroyed in a fire. The controller asks your help inreconstructing some missing entries and balances. (Note: Assume that the amountof raw materials purchased was equal to the amount used.)
Instructions
Answer the following questions.
a. Materials Price Variance shows a $3,000 favorable balance. Accounts Payableshows $126,000 of raw materials purchases. What was the amount debited toRaw Materials Inventory for raw materials purchased?
b. Materials Quantity Variance shows a $3,000 unfavorable balance. RawMaterials Inventory shows a zero balance. What was the amount debited toWork in Process Inventory for direct materials used?
c. Labor Price Variance shows a $1,500 unfavorable balance. Factory Labor showsa debit of $152,000 for wages incurred. What was the amount credited toWages Payable?
d. Factory Labor shows a credit of $152,000 for direct labor used. Labor QuantityVariance shows a $900 unfavorable balance. What was the amount debitedto Work in Process for direct labor used?
Managerial AccountingChapter 8
Page 537
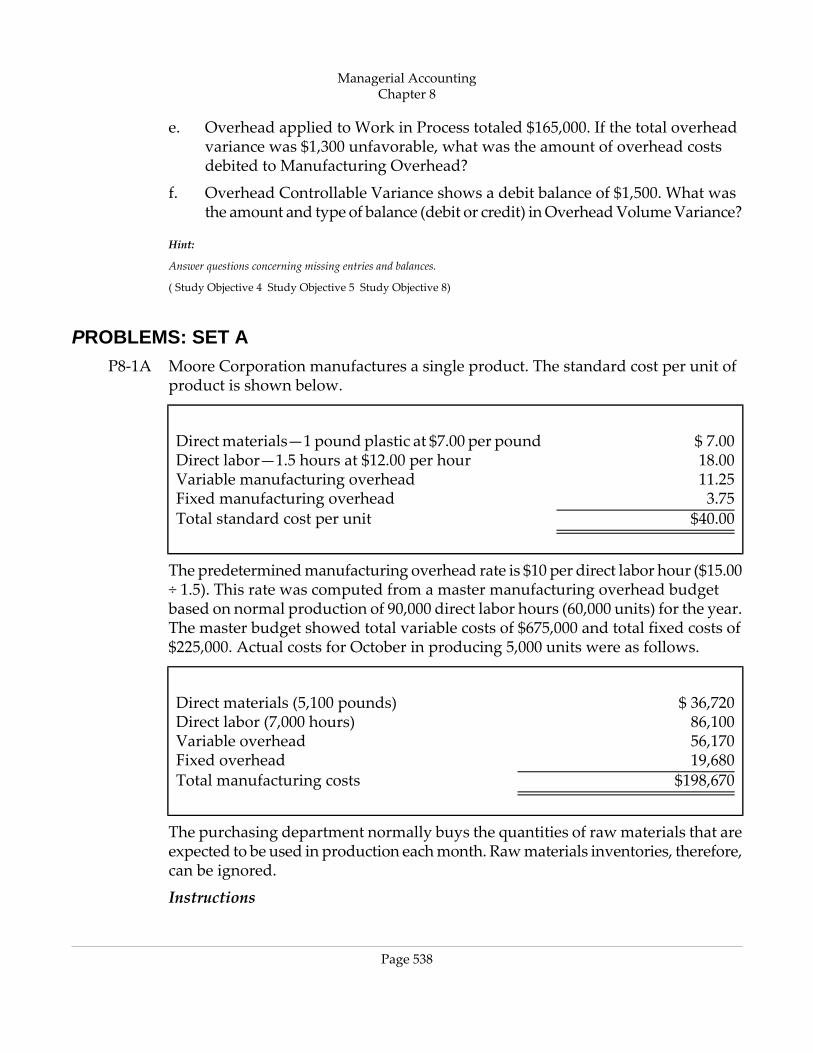
e. Overhead applied to Work in Process totaled $165,000. If the total overheadvariance was $1,300 unfavorable, what was the amount of overhead costsdebited to Manufacturing Overhead?
f. Overhead Controllable Variance shows a debit balance of $1,500. What wasthe amount and type of balance (debit or credit) in Overhead Volume Variance?
Hint:
Answer questions concerning missing entries and balances.
( Study Objective 4 Study Objective 5 Study Objective 8)
PROBLEMS: SET AP8‐1A Moore Corporation manufactures a single product. The standard cost per unit of
product is shown below.
$ 7.00Direct materials—1 pound plastic at $7.00 per pound18.00Direct labor—1.5 hours at $12.00 per hour11.25Variable manufacturing overhead3.75Fixed manufacturing overhead
$40.00Total standard cost per unit
The predetermined manufacturing overhead rate is $10 per direct labor hour ($15.00÷ 1.5). This rate was computed from a master manufacturing overhead budgetbased on normal production of 90,000 direct labor hours (60,000 units) for the year.The master budget showed total variable costs of $675,000 and total fixed costs of$225,000. Actual costs for October in producing 5,000 units were as follows.
$ 36,720Direct materials (5,100 pounds)86,100Direct labor (7,000 hours)56,170Variable overhead19,680Fixed overhead
$198,670Total manufacturing costs
The purchasing department normally buys the quantities of raw materials that areexpected to be used in production each month. Raw materials inventories, therefore,can be ignored.
Instructions
Managerial AccountingChapter 8
Page 538
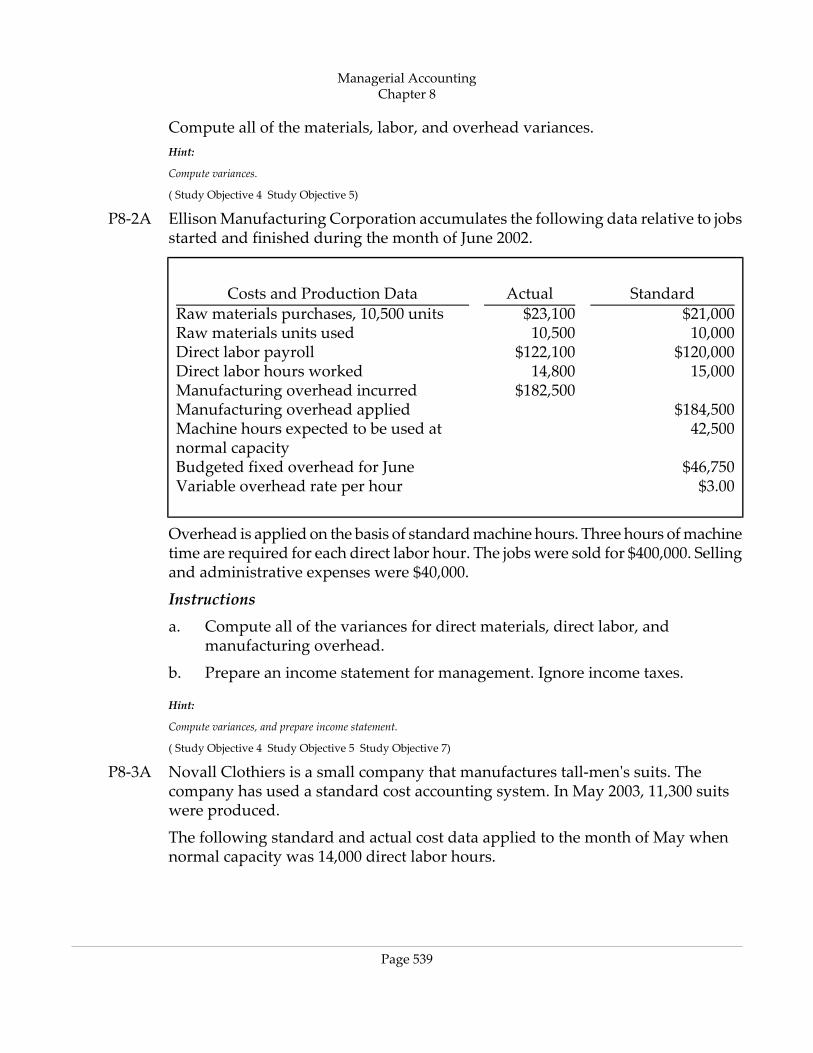
Compute all of the materials, labor, and overhead variances.Hint:
Compute variances.
( Study Objective 4 Study Objective 5)
P8‐2A Ellison Manufacturing Corporation accumulates the following data relative to jobsstarted and finished during the month of June 2002.
StandardActualCosts and Production Data$21,000$23,100Raw materials purchases, 10,500 units10,00010,500Raw materials units used
$120,000$122,100Direct labor payroll15,00014,800Direct labor hours worked
$182,500Manufacturing overhead incurred$184,500Manufacturing overhead applied42,500Machine hours expected to be used at
normal capacity$46,750Budgeted fixed overhead for June$3.00Variable overhead rate per hour
Overhead is applied on the basis of standard machine hours. Three hours of machinetime are required for each direct labor hour. The jobs were sold for $400,000. Sellingand administrative expenses were $40,000.
Instructions
a. Compute all of the variances for direct materials, direct labor, andmanufacturing overhead.
b. Prepare an income statement for management. Ignore income taxes.
Hint:
Compute variances, and prepare income statement.
( Study Objective 4 Study Objective 5 Study Objective 7)
P8‐3A Novall Clothiers is a small company that manufactures tall‐men's suits. Thecompany has used a standard cost accounting system. In May 2003, 11,300 suitswere produced.
The following standard and actual cost data applied to the month of May whennormal capacity was 14,000 direct labor hours.
Managerial AccountingChapter 8
Page 539
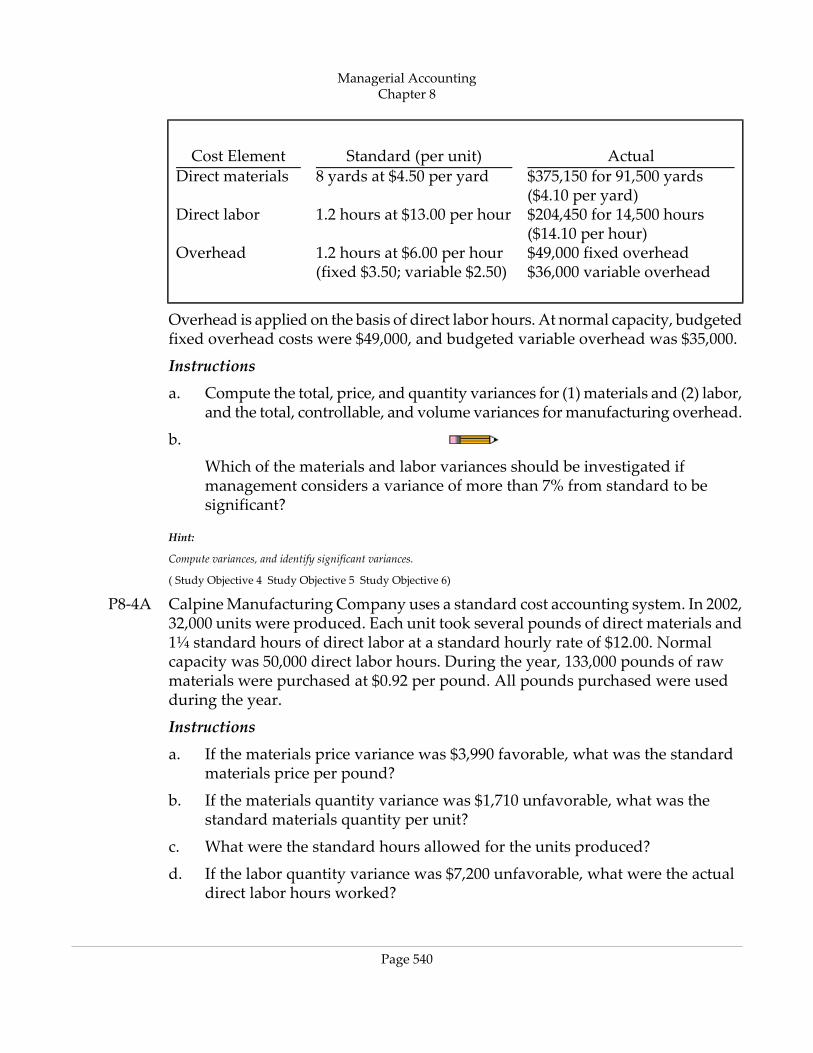
ActualStandard (per unit)Cost Element$375,150 for 91,500 yards($4.10 per yard)
8 yards at $4.50 per yardDirect materials
$204,450 for 14,500 hours($14.10 per hour)
1.2 hours at $13.00 per hourDirect labor
$49,000 fixed overhead$36,000 variable overhead
1.2 hours at $6.00 per hour(fixed $3.50; variable $2.50)
Overhead
Overhead is applied on the basis of direct labor hours. At normal capacity, budgetedfixed overhead costs were $49,000, and budgeted variable overhead was $35,000.
Instructions
a. Compute the total, price, and quantity variances for (1) materials and (2) labor,and the total, controllable, and volume variances for manufacturing overhead.
b.
Which of the materials and labor variances should be investigated ifmanagement considers a variance of more than 7% from standard to besignificant?
Hint:
Compute variances, and identify significant variances.
( Study Objective 4 Study Objective 5 Study Objective 6)
P8‐4A Calpine Manufacturing Company uses a standard cost accounting system. In 2002,32,000 units were produced. Each unit took several pounds of direct materials and1¼ standard hours of direct labor at a standard hourly rate of $12.00. Normalcapacity was 50,000 direct labor hours. During the year, 133,000 pounds of rawmaterials were purchased at $0.92 per pound. All pounds purchased were usedduring the year.
Instructions
a. If the materials price variance was $3,990 favorable, what was the standardmaterials price per pound?
b. If the materials quantity variance was $1,710 unfavorable, what was thestandard materials quantity per unit?
c. What were the standard hours allowed for the units produced?
d. If the labor quantity variance was $7,200 unfavorable, what were the actualdirect labor hours worked?
Managerial AccountingChapter 8
Page 540
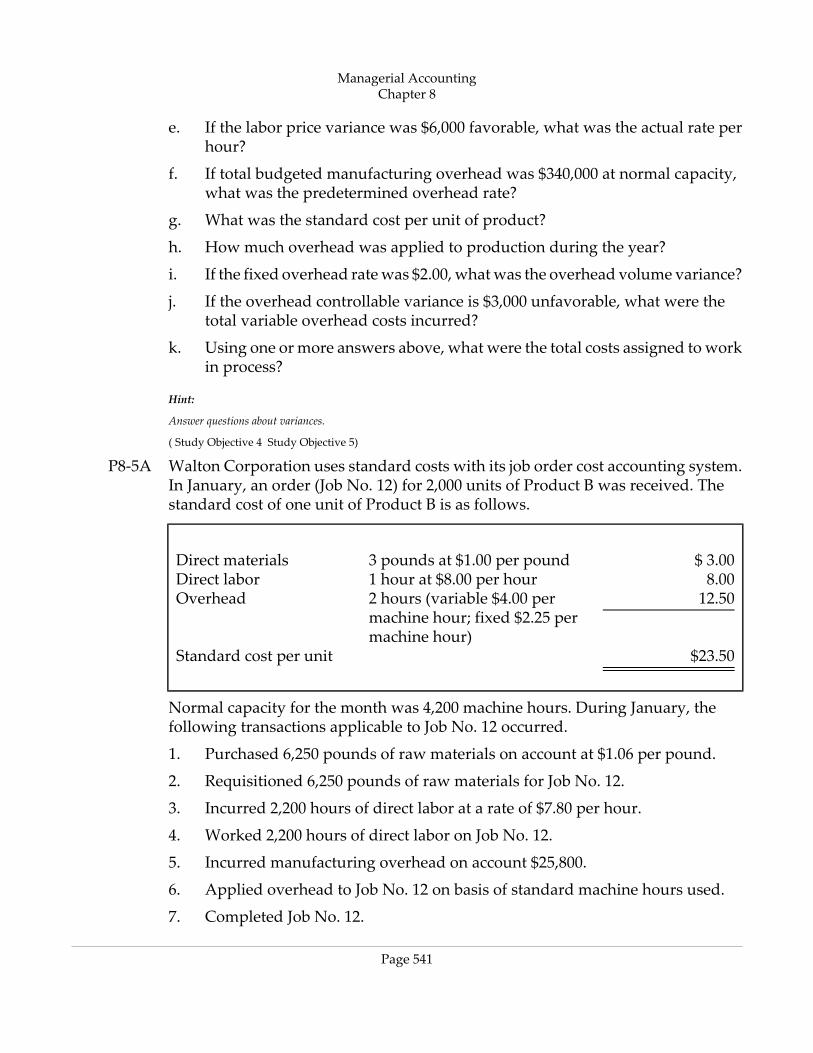
e. If the labor price variance was $6,000 favorable, what was the actual rate perhour?
f. If total budgeted manufacturing overhead was $340,000 at normal capacity,what was the predetermined overhead rate?
g. What was the standard cost per unit of product?
h. How much overhead was applied to production during the year?
i. If the fixed overhead rate was $2.00, what was the overhead volume variance?
j. If the overhead controllable variance is $3,000 unfavorable, what were thetotal variable overhead costs incurred?
k. Using one or more answers above, what were the total costs assigned to workin process?
Hint:
Answer questions about variances.
( Study Objective 4 Study Objective 5)
P8‐5A Walton Corporation uses standard costs with its job order cost accounting system.In January, an order (Job No. 12) for 2,000 units of Product B was received. Thestandard cost of one unit of Product B is as follows.
$ 3.003 pounds at $1.00 per poundDirect materials8.001 hour at $8.00 per hourDirect labor12.502 hours (variable $4.00 per
machine hour; fixed $2.25 permachine hour)
Overhead
$23.50Standard cost per unit
Normal capacity for the month was 4,200 machine hours. During January, thefollowing transactions applicable to Job No. 12 occurred.
1. Purchased 6,250 pounds of raw materials on account at $1.06 per pound.
2. Requisitioned 6,250 pounds of raw materials for Job No. 12.
3. Incurred 2,200 hours of direct labor at a rate of $7.80 per hour.
4. Worked 2,200 hours of direct labor on Job No. 12.
5. Incurred manufacturing overhead on account $25,800.
6. Applied overhead to Job No. 12 on basis of standard machine hours used.
7. Completed Job No. 12.
Managerial AccountingChapter 8
Page 541
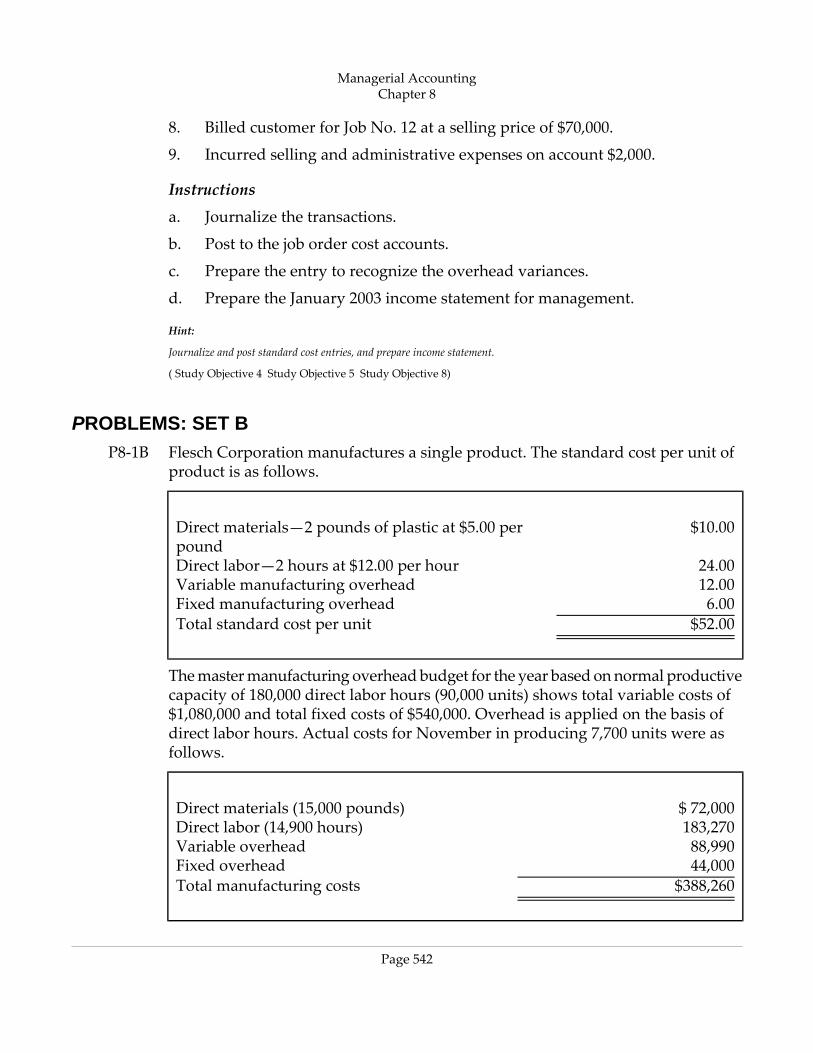
8. Billed customer for Job No. 12 at a selling price of $70,000.
9. Incurred selling and administrative expenses on account $2,000.
Instructions
a. Journalize the transactions.
b. Post to the job order cost accounts.
c. Prepare the entry to recognize the overhead variances.
d. Prepare the January 2003 income statement for management.
Hint:
Journalize and post standard cost entries, and prepare income statement.
( Study Objective 4 Study Objective 5 Study Objective 8)
PROBLEMS: SET BP8‐1B Flesch Corporation manufactures a single product. The standard cost per unit of
product is as follows.
$10.00Direct materials—2 pounds of plastic at $5.00 perpound
24.00Direct labor—2 hours at $12.00 per hour12.00Variable manufacturing overhead6.00Fixed manufacturing overhead
$52.00Total standard cost per unit
The master manufacturing overhead budget for the year based on normal productivecapacity of 180,000 direct labor hours (90,000 units) shows total variable costs of$1,080,000 and total fixed costs of $540,000. Overhead is applied on the basis ofdirect labor hours. Actual costs for November in producing 7,700 units were asfollows.
$ 72,000Direct materials (15,000 pounds)183,270Direct labor (14,900 hours)88,990Variable overhead44,000Fixed overhead
$388,260Total manufacturing costs
Managerial AccountingChapter 8
Page 542
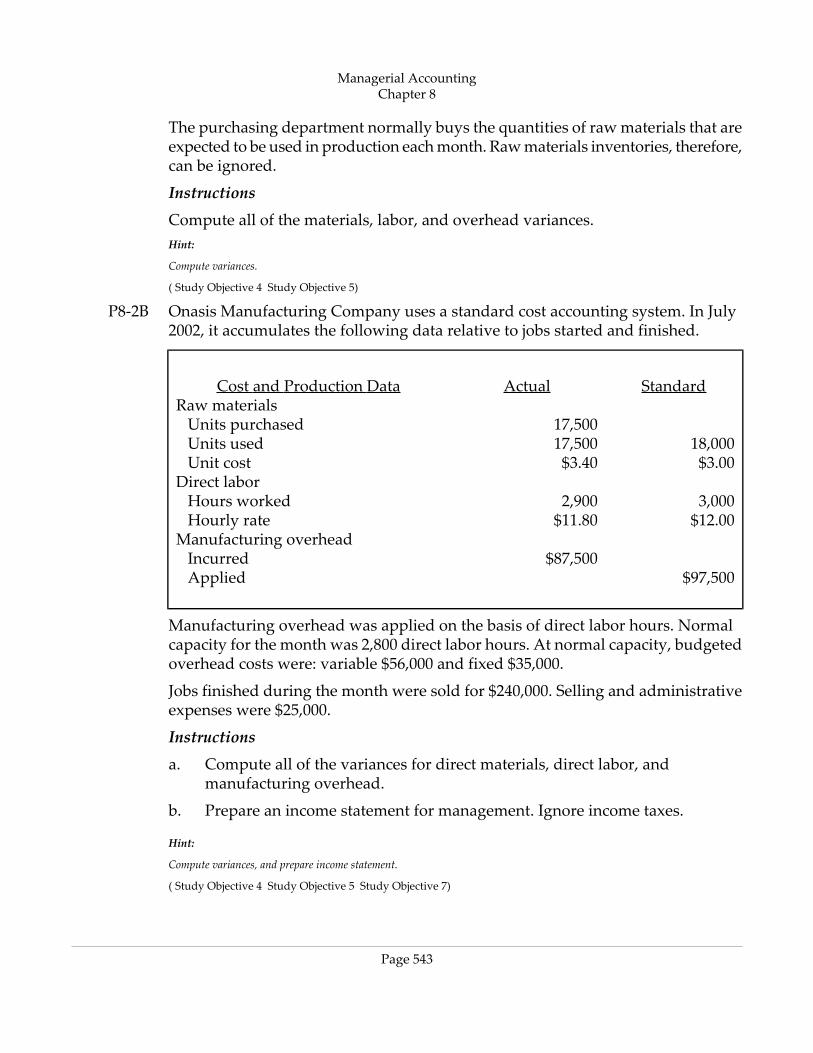
The purchasing department normally buys the quantities of raw materials that areexpected to be used in production each month. Raw materials inventories, therefore,can be ignored.
Instructions
Compute all of the materials, labor, and overhead variances.Hint:
Compute variances.
( Study Objective 4 Study Objective 5)
P8‐2B Onasis Manufacturing Company uses a standard cost accounting system. In July2002, it accumulates the following data relative to jobs started and finished.
StandardActualCost and Production DataRaw materials
17,500Units purchased18,00017,500Units used$3.00$3.40Unit cost
Direct labor3,0002,900Hours worked$12.00$11.80Hourly rate
Manufacturing overhead$87,500Incurred
$97,500Applied
Manufacturing overhead was applied on the basis of direct labor hours. Normalcapacity for the month was 2,800 direct labor hours. At normal capacity, budgetedoverhead costs were: variable $56,000 and fixed $35,000.
Jobs finished during the month were sold for $240,000. Selling and administrativeexpenses were $25,000.
Instructions
a. Compute all of the variances for direct materials, direct labor, andmanufacturing overhead.
b. Prepare an income statement for management. Ignore income taxes.
Hint:
Compute variances, and prepare income statement.
( Study Objective 4 Study Objective 5 Study Objective 7)
Managerial AccountingChapter 8
Page 543
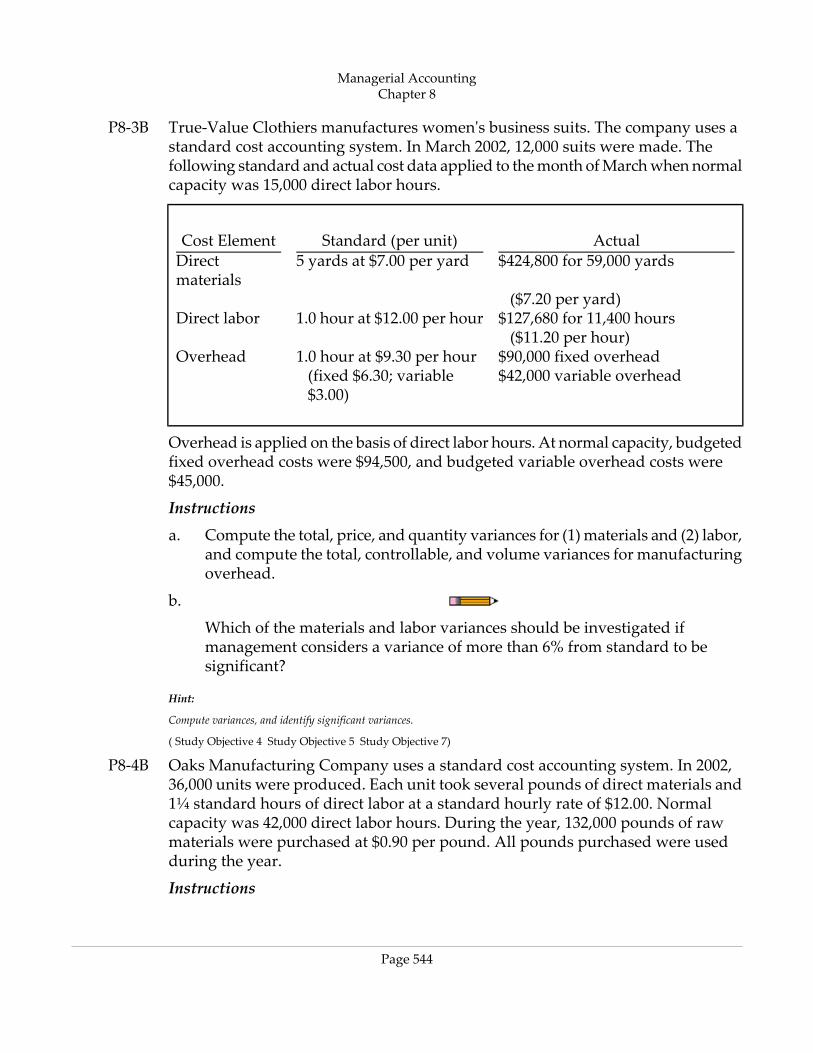
P8‐3B True‐Value Clothiers manufactures women's business suits. The company uses astandard cost accounting system. In March 2002, 12,000 suits were made. Thefollowing standard and actual cost data applied to the month of March when normalcapacity was 15,000 direct labor hours.
ActualStandard (per unit)Cost Element$424,800 for 59,000 yards5 yards at $7.00 per yardDirect
materials($7.20 per yard)
$127,680 for 11,400 hours1.0 hour at $12.00 per hourDirect labor($11.20 per hour)
$90,000 fixed overhead1.0 hour at $9.30 per hourOverhead$42,000 variable overhead(fixed $6.30; variable
$3.00)
Overhead is applied on the basis of direct labor hours. At normal capacity, budgetedfixed overhead costs were $94,500, and budgeted variable overhead costs were$45,000.
Instructions
a. Compute the total, price, and quantity variances for (1) materials and (2) labor,and compute the total, controllable, and volume variances for manufacturingoverhead.
b.
Which of the materials and labor variances should be investigated ifmanagement considers a variance of more than 6% from standard to besignificant?
Hint:
Compute variances, and identify significant variances.
( Study Objective 4 Study Objective 5 Study Objective 7)
P8‐4B Oaks Manufacturing Company uses a standard cost accounting system. In 2002,36,000 units were produced. Each unit took several pounds of direct materials and1¼ standard hours of direct labor at a standard hourly rate of $12.00. Normalcapacity was 42,000 direct labor hours. During the year, 132,000 pounds of rawmaterials were purchased at $0.90 per pound. All pounds purchased were usedduring the year.
Instructions
Managerial AccountingChapter 8
Page 544
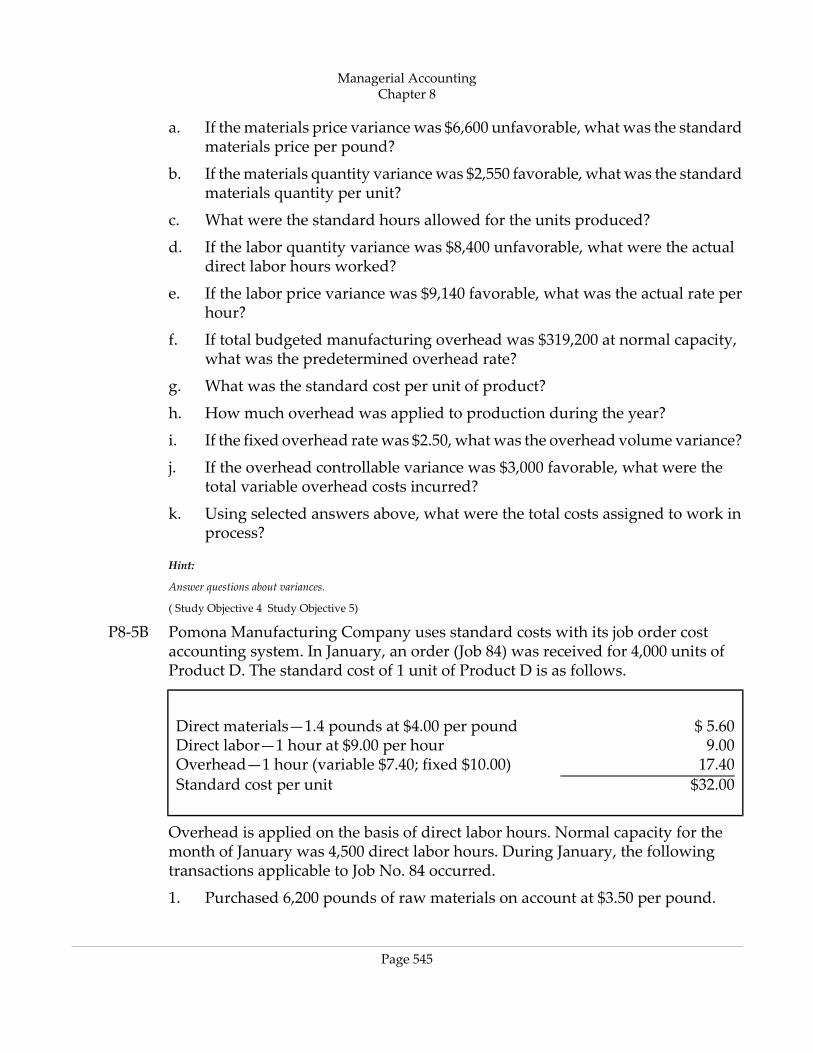
a. If the materials price variance was $6,600 unfavorable, what was the standardmaterials price per pound?
b. If the materials quantity variance was $2,550 favorable, what was the standardmaterials quantity per unit?
c. What were the standard hours allowed for the units produced?
d. If the labor quantity variance was $8,400 unfavorable, what were the actualdirect labor hours worked?
e. If the labor price variance was $9,140 favorable, what was the actual rate perhour?
f. If total budgeted manufacturing overhead was $319,200 at normal capacity,what was the predetermined overhead rate?
g. What was the standard cost per unit of product?
h. How much overhead was applied to production during the year?
i. If the fixed overhead rate was $2.50, what was the overhead volume variance?
j. If the overhead controllable variance was $3,000 favorable, what were thetotal variable overhead costs incurred?
k. Using selected answers above, what were the total costs assigned to work inprocess?
Hint:
Answer questions about variances.
( Study Objective 4 Study Objective 5)
P8‐5B Pomona Manufacturing Company uses standard costs with its job order costaccounting system. In January, an order (Job 84) was received for 4,000 units ofProduct D. The standard cost of 1 unit of Product D is as follows.
$ 5.60Direct materials—1.4 pounds at $4.00 per pound9.00Direct labor—1 hour at $9.00 per hour17.40Overhead—1 hour (variable $7.40; fixed $10.00)$32.00Standard cost per unit
Overhead is applied on the basis of direct labor hours. Normal capacity for themonth of January was 4,500 direct labor hours. During January, the followingtransactions applicable to Job No. 84 occurred.
1. Purchased 6,200 pounds of raw materials on account at $3.50 per pound.
Managerial AccountingChapter 8
Page 545
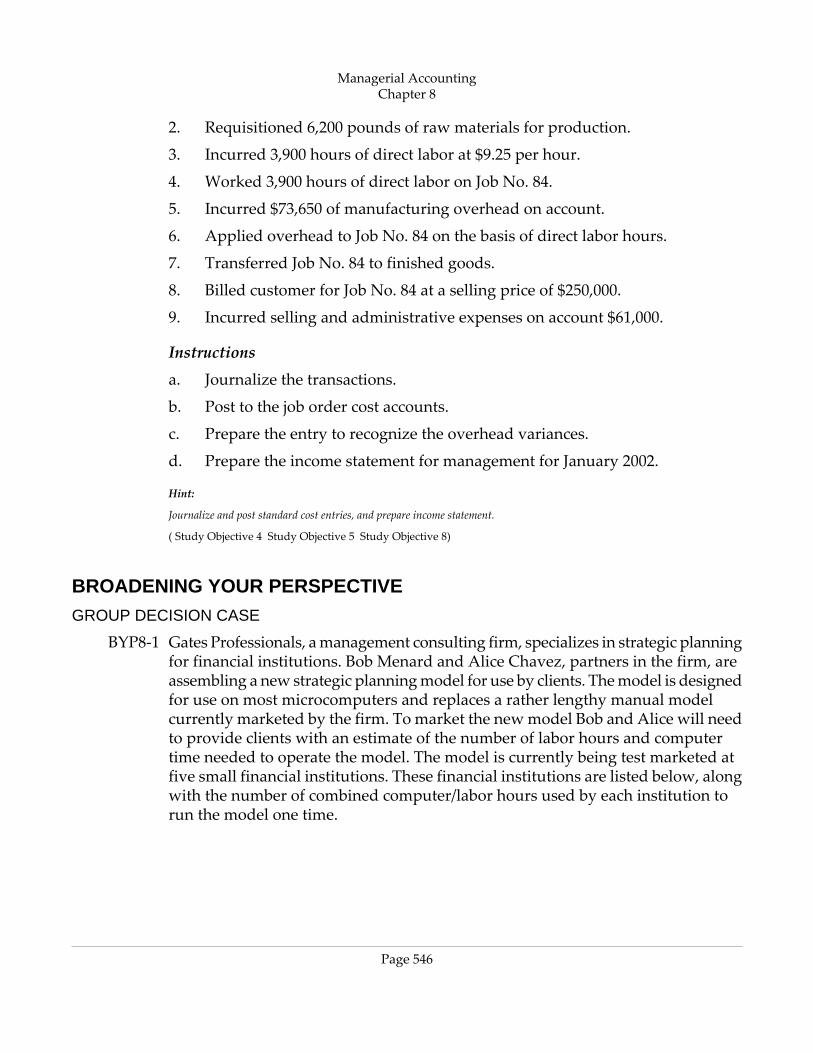
2. Requisitioned 6,200 pounds of raw materials for production.
3. Incurred 3,900 hours of direct labor at $9.25 per hour.
4. Worked 3,900 hours of direct labor on Job No. 84.
5. Incurred $73,650 of manufacturing overhead on account.
6. Applied overhead to Job No. 84 on the basis of direct labor hours.
7. Transferred Job No. 84 to finished goods.
8. Billed customer for Job No. 84 at a selling price of $250,000.
9. Incurred selling and administrative expenses on account $61,000.
Instructions
a. Journalize the transactions.
b. Post to the job order cost accounts.
c. Prepare the entry to recognize the overhead variances.
d. Prepare the income statement for management for January 2002.
Hint:
Journalize and post standard cost entries, and prepare income statement.
( Study Objective 4 Study Objective 5 Study Objective 8)
BROADENING YOUR PERSPECTIVEGROUP DECISION CASE
BYP8‐1 Gates Professionals, a management consulting firm, specializes in strategic planningfor financial institutions. Bob Menard and Alice Chavez, partners in the firm, areassembling a new strategic planning model for use by clients. The model is designedfor use on most microcomputers and replaces a rather lengthy manual modelcurrently marketed by the firm. To market the new model Bob and Alice will needto provide clients with an estimate of the number of labor hours and computertime needed to operate the model. The model is currently being test marketed atfive small financial institutions. These financial institutions are listed below, alongwith the number of combined computer/labor hours used by each institution torun the model one time.
Managerial AccountingChapter 8
Page 546
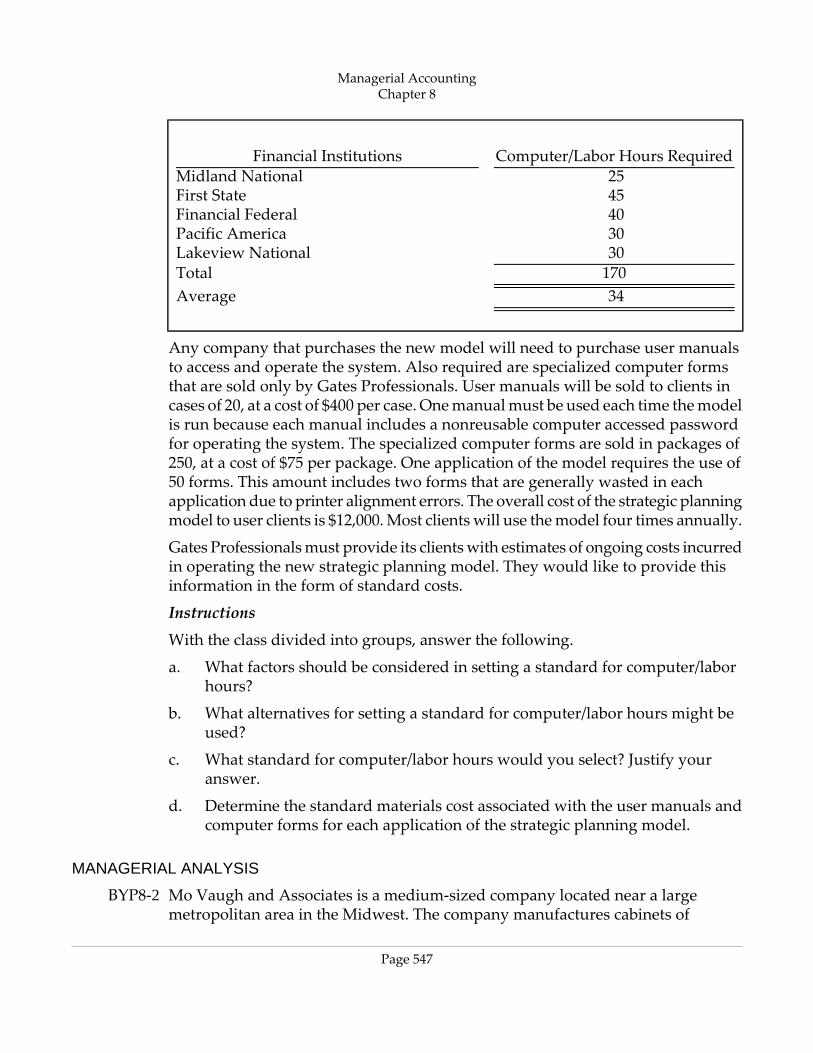
Computer/Labor Hours RequiredFinancial Institutions 25Midland National 45First State 40Financial Federal 30Pacific America 30Lakeview National170Total 34Average
Any company that purchases the new model will need to purchase user manualsto access and operate the system. Also required are specialized computer formsthat are sold only by Gates Professionals. User manuals will be sold to clients incases of 20, at a cost of $400 per case. One manual must be used each time the modelis run because each manual includes a nonreusable computer accessed passwordfor operating the system. The specialized computer forms are sold in packages of250, at a cost of $75 per package. One application of the model requires the use of50 forms. This amount includes two forms that are generally wasted in eachapplication due to printer alignment errors. The overall cost of the strategic planningmodel to user clients is $12,000. Most clients will use the model four times annually.
Gates Professionals must provide its clients with estimates of ongoing costs incurredin operating the new strategic planning model. They would like to provide thisinformation in the form of standard costs.
Instructions
With the class divided into groups, answer the following.
a. What factors should be considered in setting a standard for computer/laborhours?
b. What alternatives for setting a standard for computer/labor hours might beused?
c. What standard for computer/labor hours would you select? Justify youranswer.
d. Determine the standard materials cost associated with the user manuals andcomputer forms for each application of the strategic planning model.
MANAGERIAL ANALYSIS
BYP8‐2 Mo Vaugh and Associates is a medium‐sized company located near a largemetropolitan area in the Midwest. The company manufactures cabinets of
Managerial AccountingChapter 8
Page 547
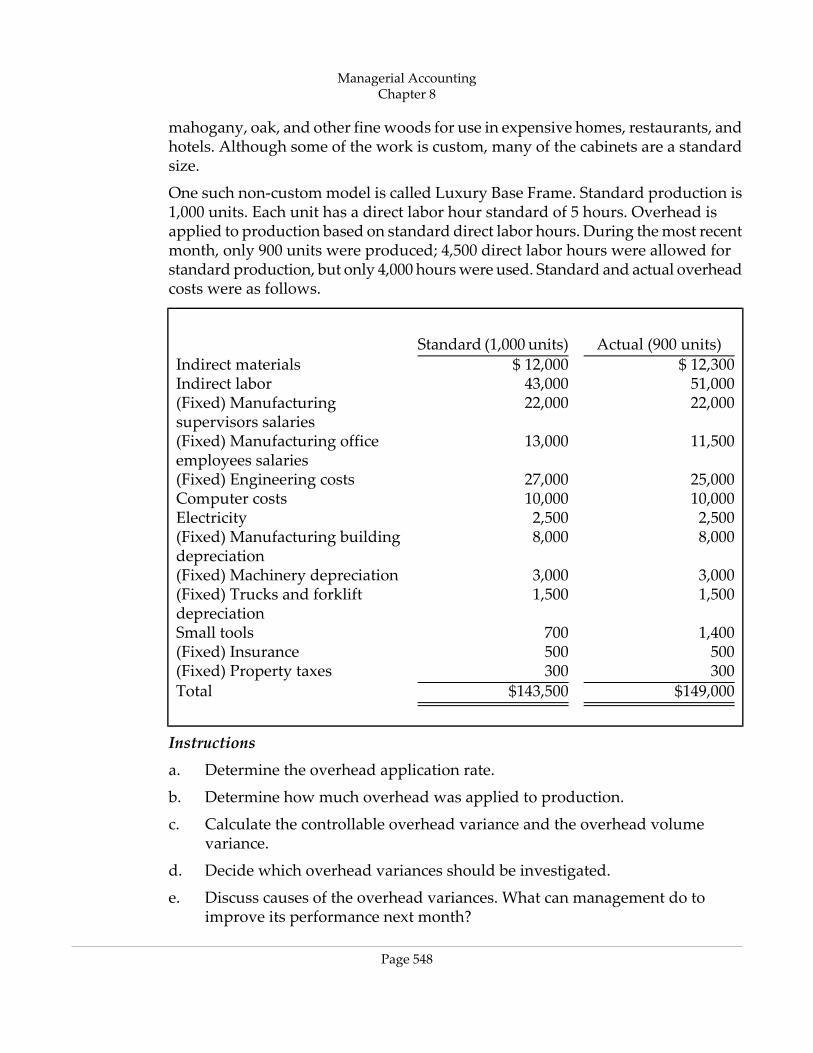
mahogany, oak, and other fine woods for use in expensive homes, restaurants, andhotels. Although some of the work is custom, many of the cabinets are a standardsize.
One such non‐custom model is called Luxury Base Frame. Standard production is1,000 units. Each unit has a direct labor hour standard of 5 hours. Overhead isapplied to production based on standard direct labor hours. During the most recentmonth, only 900 units were produced; 4,500 direct labor hours were allowed forstandard production, but only 4,000 hours were used. Standard and actual overheadcosts were as follows.
Actual (900 units)Standard (1,000 units)$ 12,300$ 12,000Indirect materials51,00043,000Indirect labor22,00022,000(Fixed) Manufacturing
supervisors salaries11,50013,000(Fixed) Manufacturing office
employees salaries25,00027,000(Fixed) Engineering costs10,00010,000Computer costs2,5002,500Electricity8,0008,000(Fixed) Manufacturing building
depreciation3,0003,000(Fixed) Machinery depreciation1,5001,500(Fixed) Trucks and forklift
depreciation1,400700Small tools500500(Fixed) Insurance300300(Fixed) Property taxes
$149,000$143,500Total
Instructions
a. Determine the overhead application rate.
b. Determine how much overhead was applied to production.
c. Calculate the controllable overhead variance and the overhead volumevariance.
d. Decide which overhead variances should be investigated.
e. Discuss causes of the overhead variances. What can management do toimprove its performance next month?
Managerial AccountingChapter 8
Page 548
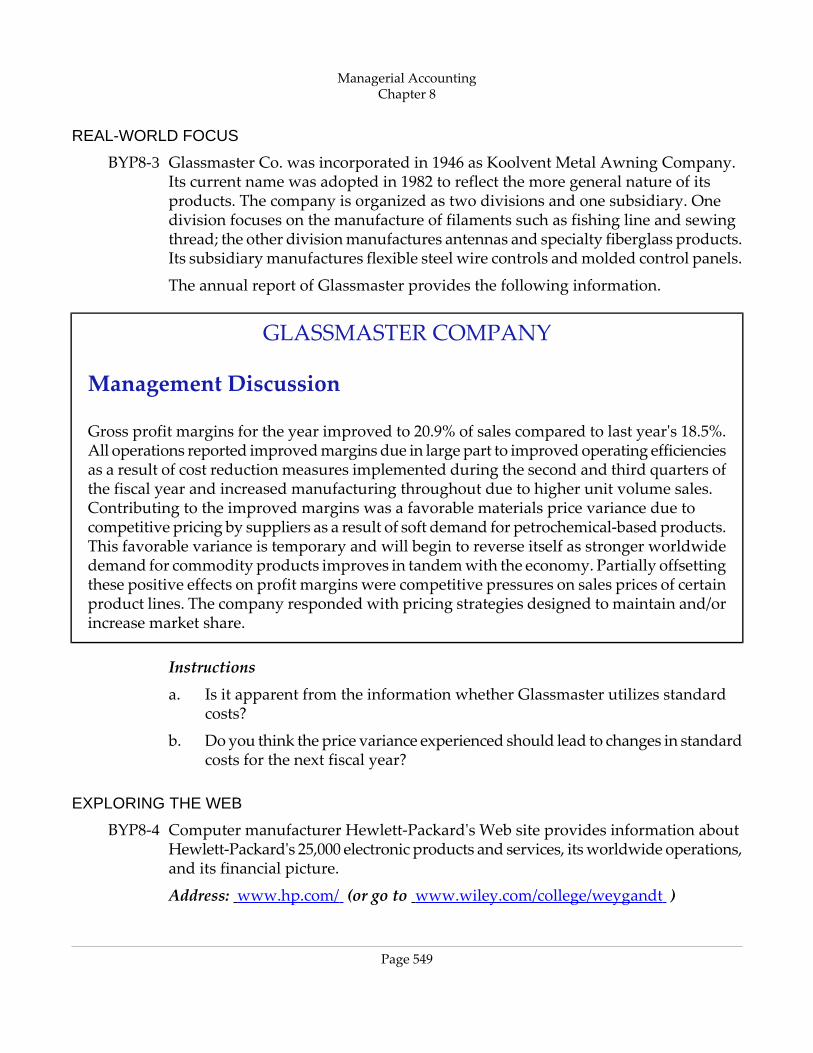
REAL-WORLD FOCUS
BYP8‐3 Glassmaster Co. was incorporated in 1946 as Koolvent Metal Awning Company.Its current name was adopted in 1982 to reflect the more general nature of itsproducts. The company is organized as two divisions and one subsidiary. Onedivision focuses on the manufacture of filaments such as fishing line and sewingthread; the other division manufactures antennas and specialty fiberglass products.Its subsidiary manufactures flexible steel wire controls and molded control panels.
The annual report of Glassmaster provides the following information.
GLASSMASTER COMPANY
Management Discussion
Gross profit margins for the year improved to 20.9% of sales compared to last year's 18.5%.All operations reported improved margins due in large part to improved operating efficienciesas a result of cost reduction measures implemented during the second and third quarters ofthe fiscal year and increased manufacturing throughout due to higher unit volume sales.Contributing to the improved margins was a favorable materials price variance due tocompetitive pricing by suppliers as a result of soft demand for petrochemical‐based products.This favorable variance is temporary and will begin to reverse itself as stronger worldwidedemand for commodity products improves in tandem with the economy. Partially offsettingthese positive effects on profit margins were competitive pressures on sales prices of certainproduct lines. The company responded with pricing strategies designed to maintain and/orincrease market share.
Instructions
a. Is it apparent from the information whether Glassmaster utilizes standardcosts?
b. Do you think the price variance experienced should lead to changes in standardcosts for the next fiscal year?
EXPLORING THE WEB
BYP8‐4 Computer manufacturer Hewlett‐Packard's Web site provides information aboutHewlett‐Packard's 25,000 electronic products and services, its worldwide operations,and its financial picture.
Address: www.hp.com/ (or go to www.wiley.com/college/weygandt )
Managerial AccountingChapter 8
Page 549
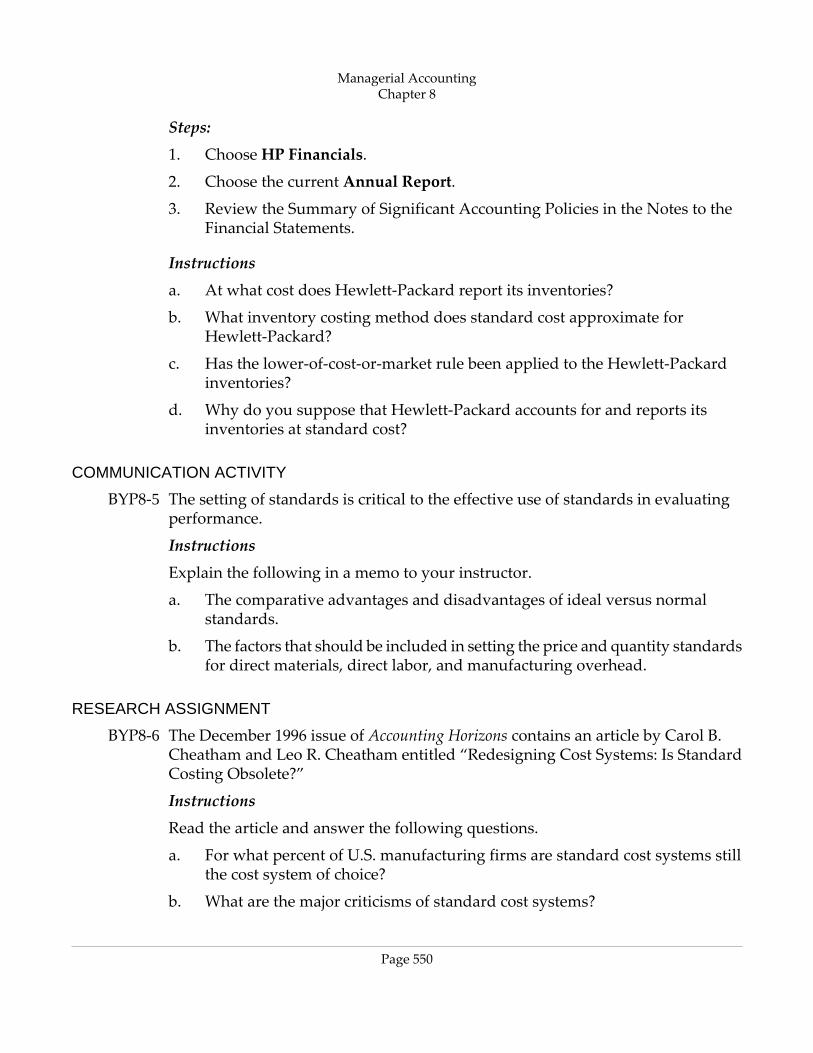
Steps:
1. Choose HP Financials.
2. Choose the current Annual Report.
3. Review the Summary of Significant Accounting Policies in the Notes to theFinancial Statements.
Instructions
a. At what cost does Hewlett‐Packard report its inventories?
b. What inventory costing method does standard cost approximate forHewlett‐Packard?
c. Has the lower‐of‐cost‐or‐market rule been applied to the Hewlett‐Packardinventories?
d. Why do you suppose that Hewlett‐Packard accounts for and reports itsinventories at standard cost?
COMMUNICATION ACTIVITY
BYP8‐5 The setting of standards is critical to the effective use of standards in evaluatingperformance.
Instructions
Explain the following in a memo to your instructor.
a. The comparative advantages and disadvantages of ideal versus normalstandards.
b. The factors that should be included in setting the price and quantity standardsfor direct materials, direct labor, and manufacturing overhead.
RESEARCH ASSIGNMENT
BYP8‐6 The December 1996 issue of Accounting Horizons contains an article by Carol B.Cheatham and Leo R. Cheatham entitled “Redesigning Cost Systems: Is StandardCosting Obsolete?”
Instructions
Read the article and answer the following questions.
a. For what percent of U.S. manufacturing firms are standard cost systems stillthe cost system of choice?
b. What are the major criticisms of standard cost systems?
Managerial AccountingChapter 8
Page 550
c. How does a standard cost system relate to activity‐based costing (ABC)? And,how might activity‐based costing (ABC) be used to enhance a company'scosting system when standard costing is the primary system?
d. What do the authors conclude from their study of standard cost systems?
ETHICS CASE
BYP8‐7 At Lofton Manufacturing Company, production workers in the Painting Departmentare paid on the basis of productivity. The labor time standard for a unit ofproduction is established through periodic time studies conducted by the FisherManagement Department. In a time study, the actual time required to complete aspecific task by a worker is observed. Allowances are then made for preparationtime, rest periods, and clean‐up time. Dion Young is one of several veterans in thePainting Department.
Dion is informed by Fisher Management that he will be used in the time study forthe painting of a new product. The findings will be the basis for establishing thelabor time standard for the next 6 months. During the test, Dion deliberately slowshis normal work pace in an effort to obtain a labor time standard that will be easyto meet. Because it is a new product, the Fisher Management representative whoconducted the test is unaware that Dion did not give the test his best effort.
Instructions
a. Who was benefited and who was harmed by Dion's actions?
b. Was Dion ethical in the way he performed the time study test?
c. What measure(s) might the company take to obtain valid data for setting thelabor time standard?
GLOSSARY
Direct labor pricestandard
The rate per hour that should be incurred for direct labor. (p. 325)
Direct laborquantity standard
The time that should be required to make one unit of product. (p. 325)
Direct materialsprice standard
The cost per unit of direct materials that should be incurred. (p. 324)
Direct materialsquantity standard
The quantity of direct materials that should be used per unit of finishedgoods. (p. 325)
Ideal standards Standards based on the optimum level of performance under perfectoperating conditions. (p. 324)
Managerial AccountingChapter 8
Page 551
Labor pricevariance
The difference between the actual hours times the actual rate and the actualhours times the standard rate for labor. (p. 333)
Labor quantityvariance
The difference between actual hours times the standard rate and standardhours times the standard rate for labor. (p. 333)
Materials pricevariance
The difference between the actual quantity times the actual price and theactual quantity times the standard price for materials. (p. 330)
Materials quantityvariance
The difference between the actual quantity times the standard price and thestandard quantity times the standard price for materials. (p. 330)
Normal standards Standards based on an efficient level of performance that are attainable underexpected operating conditions. (p. 324)
Overheadcontrollablevariance
The difference between actual overhead incurred and overhead budgetedfor the standard hours allowed. (p. 336)
Overhead volumevariance
The difference between overhead budgeted for the standard hours allowedand the overhead applied. (p. 337)
Standard costaccounting system
A double‐entry system of accounting in which standard costs are used inmaking entries and variances are recognized in the accounts. (p. 344)
Standard costs Predetermined unit costs which are used as measures of performance. (p.322)
Standard hoursallowed
The hours that should have been worked for the units produced. (p. 335)
Standardpredeterminedoverhead rate
An overhead rate determined by dividing budgeted overhead costs by anexpected standard activity index. (p. 326)
Total laborvariance
The difference between actual hours times the actual rate and standard hourstimes the standard rate for labor. (p. 333)
Total materialsvariance
The difference between the actual quantity times the actual price and thestandard quantity times the standard price of materials. (p. 329)
Total overheadvariance
The difference between actual overhead costs and overhead costs appliedto work done. (p. 335)
Variances The difference between total actual costs and total standard costs. (p. 328)
Managerial AccountingChapter 8
Page 552