Embed Size (px)
Citation preview
MANAGING HOSPITAL VOLUMES –
GERMANY AND EXPERIENCES FROM OECD COUNTRIES
Paris, April 2013
2
1. EXECUTIVE SUMMARY1
To help inform the BMG-OECD Conference on „Managing Hospital Volumes‟ to be held on the 11th April
2013 in Berlin, this paper has been produced by the OECD Secretariat to provide an international
perspective on Germany‟s situation and the current policy debate. The paper begins by comparing the
structure of the hospital sector in Germany and its level of volumes with other OECD countries. It then
provides a general background on how hospitals are financed in Germany. Finally, it provides some
observations on the operation of the German hospital system from an international perspective, with a view
to highlighting potential areas of discussion for policy makers.
Many OECD countries are currently grappling with the challenge of increases in hospital volumes.
Addressing this requires policy makers to deal with the question of what represents a „medically
appropriate‟ amount of care. This is difficult to answer, and is likely to vary across countries which have
different social preferences and often substantially different health care systems. Nonetheless, Germany‟s
level of hospital services has traditionally been higher than many OECD countries by a magnitude far
greater than differences in age, morbidity and social preferences for accessing care across countries could
justify. Compounding this situation is a high level of variation in the volume of services delivered across
Germany‟s Länder (states), raising the question of the extent to which this problem is driven by factors
specific to the health system.
While the German health care system may have the financial capacity (and appetite) to continue to
underwrite a very available hospital sector, the continual growth of hospital volumes from already high
levels risks entrenching incentives for the over-provision and over-supply of hospital services. This
situation ought to focus discussion and raise questions about whether high volumes of hospital services in
Germany – both in recent years and in general terms – are medically appropriate. To help aid this
discussion, this paper provides a number of observations about the structure and financing of hospitals in
Germany. After providing an overview to the hospital sector and illustrating that Germany has greater
volumes of hospital services when compared to other OECD countries, it argues that:
Germany has a more open-ended approach to the financing of hospital services and weaker
controls over the hospital budget than in many other OECD countries.
DRGs in Germany are almost strictly used for pricing, whereas other countries use DRGs as one of
many tools they have to influence hospital budgets
State governments do not have an incentive to rationalise hospital capacity where this may be
desirable.
The vast array of quality information available in Germany ought to be used to better direct
financing.
1 This paper has been authored by Ankit Kumar and Michael Schoenstein at the OECD Secretariat. The opinions
expressed and arguments employed here are the responsibility of the authors and do not necessarily reflect those of
the OECD. Figures used in this paper are sourced from OECD Health Data 2012, unless otherwise specified. The
authors wish to thank Ferdinand Rau and Irene Keinhorst from the Federal Ministry of Health for supporting this
project, and the National Association of Statutory Health Insurance Funds and the German Hospitals Association for
kindly giving up their time to discuss these matters. At the OECD, the authors wish to thank Kees van Gool, Gaetan
Lafortune, Michael Borowitz, Valérie Paris and Mark Pearson for their comments and suggestions.
3
2. THE GERMAN HOSPITAL SECTOR: A COMPARATIVE PERSPECTIVE
Germany has high levels of hospital availability, and a greater share of private hospitals than most
countries
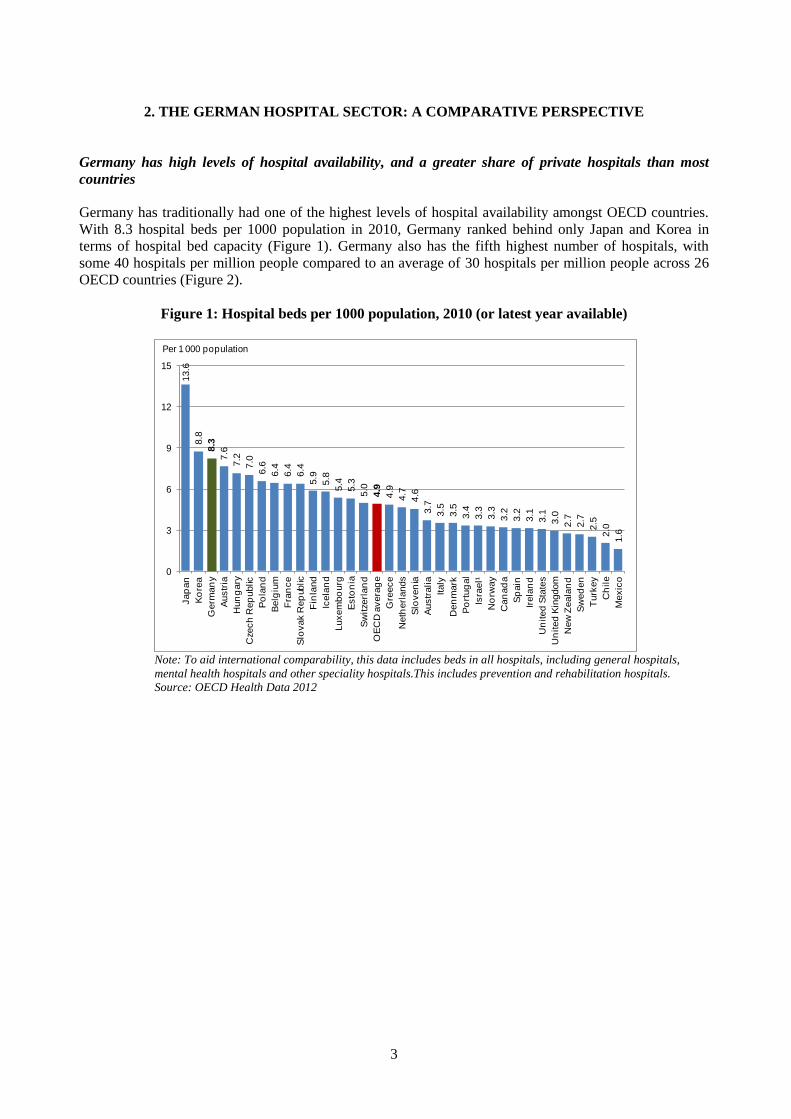
Germany has traditionally had one of the highest levels of hospital availability amongst OECD countries.
With 8.3 hospital beds per 1000 population in 2010, Germany ranked behind only Japan and Korea in
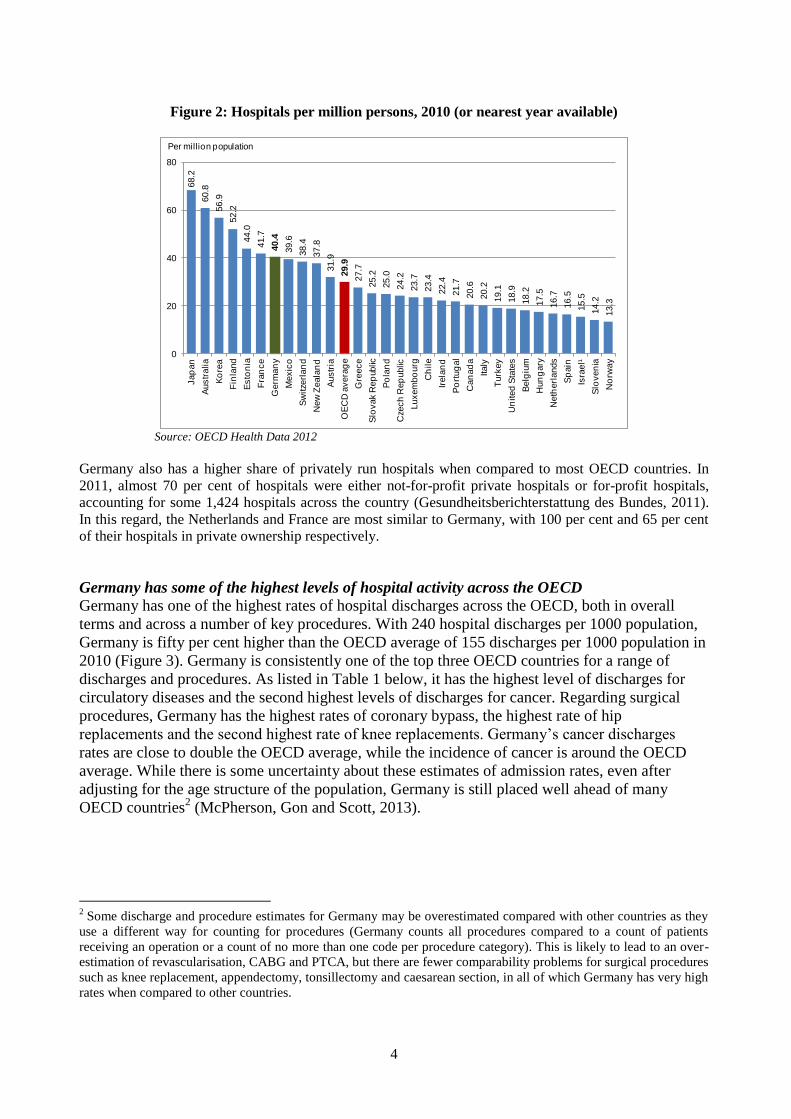
terms of hospital bed capacity (Figure 1). Germany also has the fifth highest number of hospitals, with
some 40 hospitals per million people compared to an average of 30 hospitals per million people across 26
OECD countries (Figure 2).
Figure 1: Hospital beds per 1000 population, 2010 (or latest year available)
13.6
8.8
8.3
7.6
7.2
7.0
6.6
6.4
6.4
6.4
5.9
5.8
5.4
5.3
5.0
4.9
4.9
4.7
4.6
3.7
3.5
3.5
3.4
3.3
3.3
3.2
3.2
3.1
3.1
3.0
2.7
2.7
2.5
2.0
1.6
0
3
6
9
12
15
Jap
an
Ko
rea
Germ
an
y
Austr
ia
Hun
gary
Czech
Rep
ublic
Po
lan
d
Belg
ium
Fra
nce
Slo
vak R
ep
ublic
Fin
land
Icela
nd
Luxem
bo
urg
Esto
nia
Sw
itzerl
an
d
OE
CD
avera
ge
Gre
ece
Neth
erl
ands
Slo
ven
ia
Austr
alia
Italy
Den
mark
Po
rtug
al
Isra
el¹
No
rway
Can
ad
a
Sp
ain
Irela
nd
Un
ited
Sta
tes
Un
ited
Kin
gdom
New
Zeala
nd
Sw
ed
en
Turk
ey
Ch
ile
Mexic
o
Per 1 000 population
Note: To aid international comparability, this data includes beds in all hospitals, including general hospitals,
mental health hospitals and other speciality hospitals.This includes prevention and rehabilitation hospitals.
Source: OECD Health Data 2012
4
Figure 2: Hospitals per million persons, 2010 (or nearest year available)
68.2
60.8
56.9
52.2
44.0
41.7
40.4
39.6
38.4
37.8
31.9
29.9
27.7
25.2
25.0
24.2
23.7
23.4
22.4
21.7
20.6
20.2
19.1
18.9
18.2
17.5
16.7
16.5
15.5
14.2
13.3
0
20
40
60
80
Jap
an
Austr
alia
Ko
rea
Fin
land
Esto
nia
Fra
nce
Germ
an
y
Mexic
o
Sw
itze
rlan
d
New
Zeala
nd
Austr
ia
OE
CD
avera
ge
Gre
ece
Slo
vak R
ep
ublic
Po
lan
d
Cze
ch
Rep
ublic
Luxem
bo
urg
Ch
ile
Irela
nd
Po
rtug
al
Can
ad
a
Italy
Turk
ey
Un
ited
Sta
tes
Belg
ium
Hun
gary
Neth
erl
ands
Sp
ain
Isra
el¹
Slo
ven
ia
No
rway
Per million population
Source: OECD Health Data 2012
Germany also has a higher share of privately run hospitals when compared to most OECD countries. In
2011, almost 70 per cent of hospitals were either not-for-profit private hospitals or for-profit hospitals,
accounting for some 1,424 hospitals across the country (Gesundheitsberichterstattung des Bundes, 2011).
In this regard, the Netherlands and France are most similar to Germany, with 100 per cent and 65 per cent
of their hospitals in private ownership respectively.
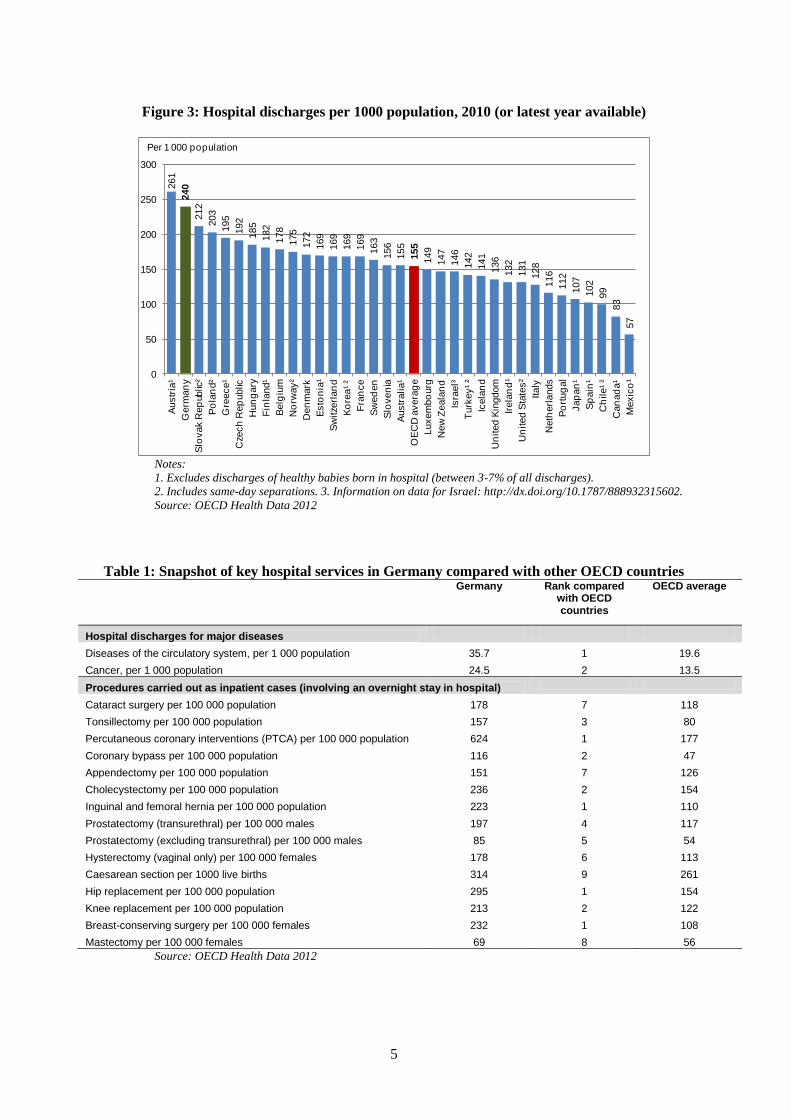
Germany has some of the highest levels of hospital activity across the OECD Germany has one of the highest rates of hospital discharges across the OECD, both in overall
terms and across a number of key procedures. With 240 hospital discharges per 1000 population,
Germany is fifty per cent higher than the OECD average of 155 discharges per 1000 population in
2010 (Figure 3). Germany is consistently one of the top three OECD countries for a range of
discharges and procedures. As listed in Table 1 below, it has the highest level of discharges for
circulatory diseases and the second highest levels of discharges for cancer. Regarding surgical
procedures, Germany has the highest rates of coronary bypass, the highest rate of hip
replacements and the second highest rate of knee replacements. Germany‟s cancer discharges
rates are close to double the OECD average, while the incidence of cancer is around the OECD
average. While there is some uncertainty about these estimates of admission rates, even after
adjusting for the age structure of the population, Germany is still placed well ahead of many
OECD countries2 (McPherson, Gon and Scott, 2013).
2 Some discharge and procedure estimates for Germany may be overestimated compared with other countries as they
use a different way for counting for procedures (Germany counts all procedures compared to a count of patients
receiving an operation or a count of no more than one code per procedure category). This is likely to lead to an over-
estimation of revascularisation, CABG and PTCA, but there are fewer comparability problems for surgical procedures
such as knee replacement, appendectomy, tonsillectomy and caesarean section, in all of which Germany has very high
rates when compared to other countries.
5
Figure 3: Hospital discharges per 1000 population, 2010 (or latest year available)
261
240
212
203
195
192
185
182
178
175
172
169
169
169
169
163
156
155
155
149
147
146
142
141
136
132
131
128
116
112
107
102
99
83
57
0
50
100
150
200
250
300A
ustr
ia¹
Germ
an
y
Slo
vak R
ep
ublic
²
Po
lan
d²
Gre
ece¹
Cze
ch
Rep
ublic
Hun
gary
Fin
land¹
Belg
ium
No
rway²
Den
mark
Esto
nia
¹
Sw
itze
rlan
d
Ko
rea¹ ²
Fra
nce
Sw
ed
en
Slo
ven
ia
Austr
alia¹
OE
CD
avera
ge
Luxem
bo
urg
New
Zeala
nd
Isra
el³
Turk
ey¹ ²
Icela
nd
Un
ited
Kin
gdom
Irela
nd
¹
Un
ited
Sta
tes²
Italy
Neth
erl
ands
Po
rtug
al
Jap
an
¹
Sp
ain
¹
Ch
ile¹ ²
Can
ad
a¹
Mexic
o¹
Per 1 000 population
Notes:
1. Excludes discharges of healthy babies born in hospital (between 3-7% of all discharges).
2. Includes same-day separations. 3. Information on data for Israel: http://dx.doi.org/10.1787/888932315602.
Source: OECD Health Data 2012
Table 1: Snapshot of key hospital services in Germany compared with other OECD countries
Germany Rank compared with OECD countries
OECD average
Hospital discharges for major diseases
Diseases of the circulatory system, per 1 000 population 35.7 1 19.6
Cancer, per 1 000 population 24.5 2 13.5
Procedures carried out as inpatient cases (involving an overnight stay in hospital)
Cataract surgery per 100 000 population 178 7 118
Tonsillectomy per 100 000 population 157 3 80
Percutaneous coronary interventions (PTCA) per 100 000 population 624 1 177
Coronary bypass per 100 000 population 116 2 47
Appendectomy per 100 000 population 151 7 126
Cholecystectomy per 100 000 population 236 2 154
Inguinal and femoral hernia per 100 000 population 223 1 110
Prostatectomy (transurethral) per 100 000 males 197 4 117
Prostatectomy (excluding transurethral) per 100 000 males 85 5 54
Hysterectomy (vaginal only) per 100 000 females 178 6 113
Caesarean section per 1000 live births 314 9 261
Hip replacement per 100 000 population 295 1 154
Knee replacement per 100 000 population 213 2 122
Breast-conserving surgery per 100 000 females 232 1 108
Mastectomy per 100 000 females 69 8 56
Source: OECD Health Data 2012
6
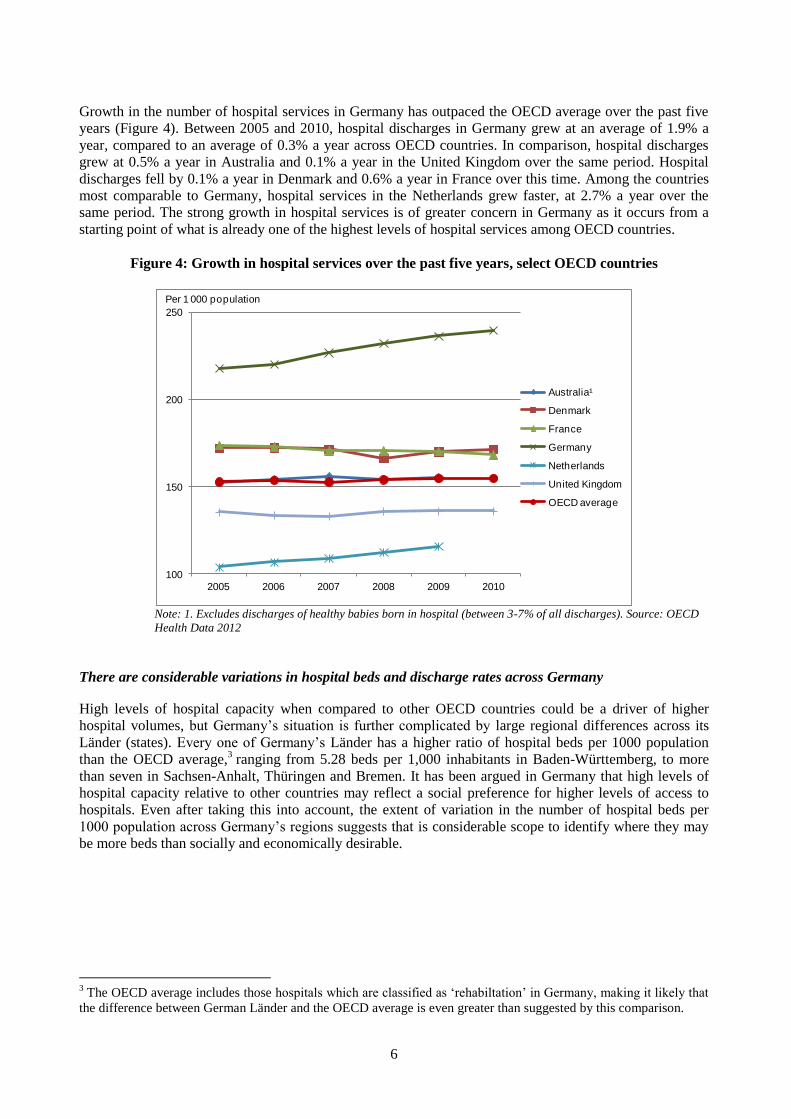
Growth in the number of hospital services in Germany has outpaced the OECD average over the past five
years (Figure 4). Between 2005 and 2010, hospital discharges in Germany grew at an average of 1.9% a
year, compared to an average of 0.3% a year across OECD countries. In comparison, hospital discharges
grew at 0.5% a year in Australia and 0.1% a year in the United Kingdom over the same period. Hospital
discharges fell by 0.1% a year in Denmark and 0.6% a year in France over this time. Among the countries
most comparable to Germany, hospital services in the Netherlands grew faster, at 2.7% a year over the
same period. The strong growth in hospital services is of greater concern in Germany as it occurs from a
starting point of what is already one of the highest levels of hospital services among OECD countries.
Figure 4: Growth in hospital services over the past five years, select OECD countries
100
150
200
250
2005 2006 2007 2008 2009 2010
Australia¹
Denmark
France
Germany
Netherlands
United Kingdom
OECD average
Per 1 000 population
Note: 1. Excludes discharges of healthy babies born in hospital (between 3-7% of all discharges). Source: OECD
Health Data 2012
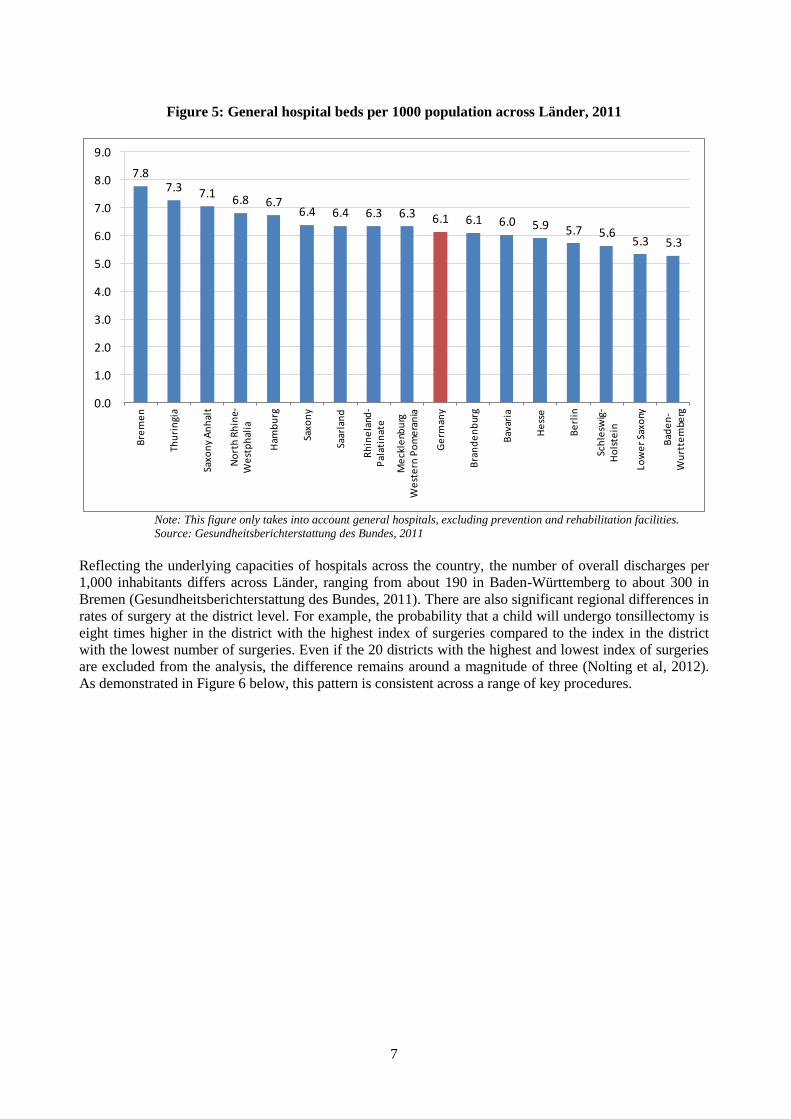
There are considerable variations in hospital beds and discharge rates across Germany
High levels of hospital capacity when compared to other OECD countries could be a driver of higher
hospital volumes, but Germany‟s situation is further complicated by large regional differences across its
Länder (states). Every one of Germany‟s Länder has a higher ratio of hospital beds per 1000 population
than the OECD average,3 ranging from 5.28 beds per 1,000 inhabitants in Baden-Württemberg, to more
than seven in Sachsen-Anhalt, Thüringen and Bremen. It has been argued in Germany that high levels of
hospital capacity relative to other countries may reflect a social preference for higher levels of access to
hospitals. Even after taking this into account, the extent of variation in the number of hospital beds per
1000 population across Germany‟s regions suggests that is considerable scope to identify where they may
be more beds than socially and economically desirable.
3 The OECD average includes those hospitals which are classified as „rehabiltation‟ in Germany, making it likely that
the difference between German Länder and the OECD average is even greater than suggested by this comparison.
7
Figure 5: General hospital beds per 1000 population across Länder, 2011
7.87.3 7.1
6.8 6.76.4 6.4 6.3 6.3 6.1 6.1 6.0 5.9 5.7 5.6
5.3 5.3
0.0
1.0
2.0
3.0
4.0
5.0
6.0
7.0
8.0
9.0B
rem
en
Thu
rin
gia
Saxo
ny
An
hal
t
No
rth
Rh
ine-
We
stp
hal
ia
Ham
bu
rg
Saxo
ny
Saar
lan
d
Rh
ine
land
-P
alat
inat
e
Me
ckle
nbu
rg
We
ste
rn P
om
era
nia
Ge
rman
y
Bra
nd
en
bur
g
Bav
aria
He
sse
Be
rlin
Sch
lesw
ig-
Ho
lste
in
Low
er
Saxo
ny
Bad
en
-W
urt
tem
berg
Note: This figure only takes into account general hospitals, excluding prevention and rehabilitation facilities.
Source: Gesundheitsberichterstattung des Bundes, 2011
Reflecting the underlying capacities of hospitals across the country, the number of overall discharges per
1,000 inhabitants differs across Länder, ranging from about 190 in Baden-Württemberg to about 300 in
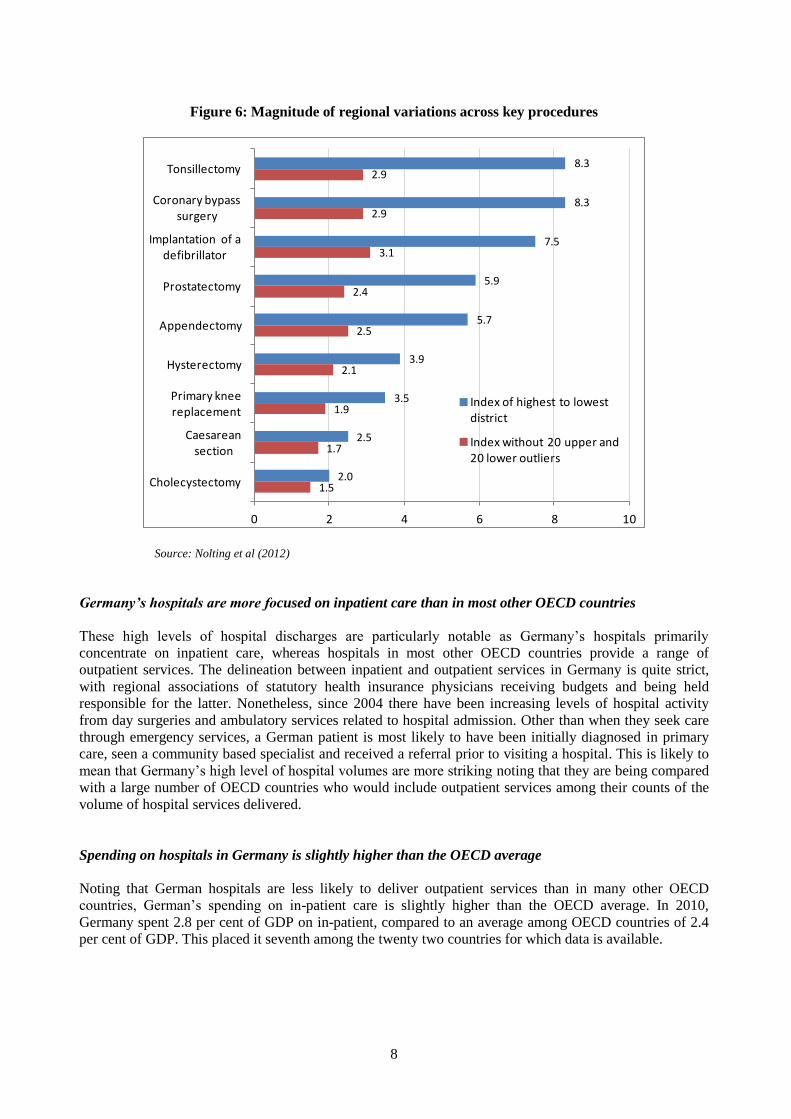
Bremen (Gesundheitsberichterstattung des Bundes, 2011). There are also significant regional differences in
rates of surgery at the district level. For example, the probability that a child will undergo tonsillectomy is
eight times higher in the district with the highest index of surgeries compared to the index in the district
with the lowest number of surgeries. Even if the 20 districts with the highest and lowest index of surgeries
are excluded from the analysis, the difference remains around a magnitude of three (Nolting et al, 2012).
As demonstrated in Figure 6 below, this pattern is consistent across a range of key procedures.
8
Figure 6: Magnitude of regional variations across key procedures
8.3
8.3
7.5
5.9
5.7
3.9
3.5
2.5
2.0
2.9
2.9
3.1
2.4
2.5
2.1
1.9
1.7
1.5
0 2 4 6 8 10
Tonsillectomy
Coronary bypass surgery
Implantation of a defibrillator
Prostatectomy
Appendectomy
Hysterectomy
Primary knee replacement
Caesarean section
Cholecystectomy
Index of highest to lowest district
Index without 20 upper and 20 lower outliers
Source: Nolting et al (2012)
Germany’s hospitals are more focused on inpatient care than in most other OECD countries
These high levels of hospital discharges are particularly notable as Germany‟s hospitals primarily
concentrate on inpatient care, whereas hospitals in most other OECD countries provide a range of
outpatient services. The delineation between inpatient and outpatient services in Germany is quite strict,
with regional associations of statutory health insurance physicians receiving budgets and being held
responsible for the latter. Nonetheless, since 2004 there have been increasing levels of hospital activity
from day surgeries and ambulatory services related to hospital admission. Other than when they seek care
through emergency services, a German patient is most likely to have been initially diagnosed in primary
care, seen a community based specialist and received a referral prior to visiting a hospital. This is likely to
mean that Germany‟s high level of hospital volumes are more striking noting that they are being compared
with a large number of OECD countries who would include outpatient services among their counts of the
volume of hospital services delivered.
Spending on hospitals in Germany is slightly higher than the OECD average
Noting that German hospitals are less likely to deliver outpatient services than in many other OECD
countries, German‟s spending on in-patient care is slightly higher than the OECD average. In 2010,
Germany spent 2.8 per cent of GDP on in-patient, compared to an average among OECD countries of 2.4
per cent of GDP. This placed it seventh among the twenty two countries for which data is available.
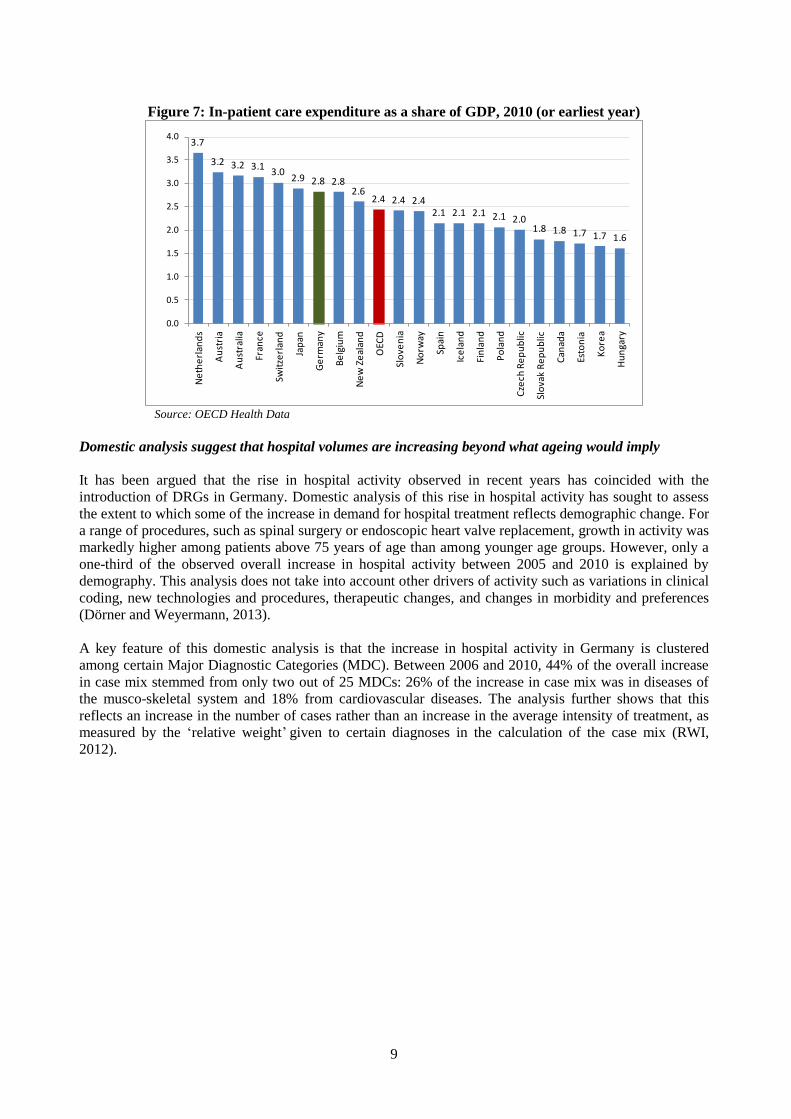
9
Figure 7: In-patient care expenditure as a share of GDP, 2010 (or earliest year)
3.7
3.2 3.2 3.13.0
2.9 2.8 2.82.6
2.4 2.4 2.42.1 2.1 2.1 2.1 2.0
1.8 1.8 1.7 1.7 1.6
0.0
0.5
1.0
1.5
2.0
2.5
3.0
3.5
4.0
Ne
the
rlan
ds
Au
stri
a
Au
stra
lia
Fran
ce
Swit
zerl
and
Jap
an
Ge
rman
y
Be
lgiu
m
Ne
w Z
eal
and
OEC
D
Slo
ven
ia
No
rway
Spai
n
Ice
lan
d
Fin
lan
d
Po
lan
d
Cze
ch R
ep
ub
lic
Slo
vak
Re
pu
blic
Can
ada
Esto
nia
Ko
rea
Hu
nga
ry
Source: OECD Health Data
Domestic analysis suggest that hospital volumes are increasing beyond what ageing would imply
It has been argued that the rise in hospital activity observed in recent years has coincided with the
introduction of DRGs in Germany. Domestic analysis of this rise in hospital activity has sought to assess
the extent to which some of the increase in demand for hospital treatment reflects demographic change. For
a range of procedures, such as spinal surgery or endoscopic heart valve replacement, growth in activity was
markedly higher among patients above 75 years of age than among younger age groups. However, only a
one-third of the observed overall increase in hospital activity between 2005 and 2010 is explained by
demography. This analysis does not take into account other drivers of activity such as variations in clinical
coding, new technologies and procedures, therapeutic changes, and changes in morbidity and preferences
(Dörner and Weyermann, 2013).
A key feature of this domestic analysis is that the increase in hospital activity in Germany is clustered
among certain Major Diagnostic Categories (MDC). Between 2006 and 2010, 44% of the overall increase
in case mix stemmed from only two out of 25 MDCs: 26% of the increase in case mix was in diseases of
the musco-skeletal system and 18% from cardiovascular diseases. The analysis further shows that this
reflects an increase in the number of cases rather than an increase in the average intensity of treatment, as
measured by the „relative weight‟ given to certain diagnoses in the calculation of the case mix (RWI,
2012).
10
3. OVERVIEW OF THE FINANCING OF HOSPITAL SERVICES IN GERMANY4
Hospitals are principally financed by insurers, though capital is a responsibility of state governments
Germany has a health care system founded on social insurance, where wage-based contributions for
employers and employees finance the provision of health care. Since 2009, all Germans have been required
to take out health insurance, providing access to a broad and comprehensive range of health care services
from primary care delivered by local GPs through to specialist hospital services. About 87% of the
population are insured with one of 134 statutory health insurance funds. These are private not-for-profit
organisations with independent governance and operate as social entities. The remaining 13% of the
population are covered through a substitute private health care policy, offering partly enhanced services
with partly higher premiums based on an individual risk assessment.
Responsibility for financing of hospital services for German patients with social health insurance is split
between federal government, the sixteen Länder (state) governments and most importantly, the statutory
health insurance funds (referred to herein as „sickness funds‟). While sickness funds finance the delivery of
hospital services for individuals, an individual sickness fund does not have the ability to vary prices or
volumes. Contracts with hospitals are undertaken collectively for all sickness funds at two levels, the
setting of an overall price tariff structure (detailing the relative weights of different services) at a national
level and negotiations on the overall level of prices at the regional level. Each of the Länder Governments
supplements financing from sickness funds with investments in capital and infrastructure for hospitals.
Hospitals are paid on the basis of DRGs
Since the period of reform and transition between 2003 and 2009, the bulk of operating costs in German
hospitals are now paid through a payment per case on the basis of DRGs. The German DRG system applies
to all hospitals (irrespective of whether they are public or private) and for all services except for psychiatric
care, psychosomatic medicine and psychotherapy. All hospital inpatient services are classified into one of
these groups on the basis of a patient‟s diagnosis, medical procedures provided, patient characteristics (age,
gender and newborn weight, length of stay, duration of ventilation, reason for hospital discharge and type
of admission). These DRG payments are also complemented by a number of supplementary fees that cover
certain complex and cost intensive services (e.g. pharmaceuticals in oncology) and other payments to
individual hospitals. In shifting from hospital budgets calculated on per diem charges, the policy
motivation behind the shift to DRGs was to encourage a more consistent and fairer allocation of resources,
reward hospitals that can deliver services more efficiently, and provide additional transparency on the
casemix and levels of services delivered by hospitals.
German DRGs prioritise paying the same rate across hospitals
A key principle behind the introduction of DRGs in Germany has been the attempt to rigourously „cost‟ all
services, with the end objective of paying all hospitals the same rate for the same service. This has seen the
number of DRG groups in Germany increase, as it seeks to create a highly specific schedule to cover a
large range of possible clinical services. Intially adapted from Australian Refined Diagnosis-Related
Groups (AR-DRG) which has 698 groups across 23 major diagnostic categories, Germany‟s DRG schedule
has grown to 1200 groups across 25 major diagnostic categories.
4 This section draws heavily from Geissler, A., Scheller-Kreinsen, D., Quentin, W. and Busse, R. (2011), „Germany:
Understanding G-DRGs‟, chapter 14 of in Diagnosis Related Groups in Europe, European Observatory. We refer the
reader who wishes to have a more intimate understanding of the structure and operation of DRGs in Germany to this
resource.
11
Hospitals were progressively shifted onto DRG payments as they developed the capacity to attribute all of
their activities into one of the new DRG-related cost categories, with an initial guarantee to receive no less
than their prior budgets under the per diem system. To calculate the costs associated with particular DRGs,
InEK (the German technical agency for DRGs) seeks data from a subset of hospitals and takes into account
the latest medical knowledge. As in other OECD countries, surveillance procedures are used to exclude
outlier cases („trim‟) from the calculation of cost weights.
As hospitals were shifted onto DRGs, policy makers were able to see the distribution of costs for casemix
adjusted services delivered in a hospital relative to their former budgets, making transparent an individual
hospital‟s „base rate‟ for services. This varied considerably across the country. Through an incremental
adjustment process, the payment of hospitals was shifted from being on the basis of an individual
hospital‟s average casemix adjusted cost (the hospital specific base rate) to the average casemix adjusted
cost for all hospitals in a Land (the state-wide base rate) by 2010. From 2010 state wide base rates shall
converge closer to a nationwide base rate.
12
4. KEY ISSUES IN HOSPITAL FINANCING IN GERMANY: OBSERVATIONS FROM AN
INTERNATIONAL PERSPECTIVE
Germany has not had a tradition of specifying an annual budget for hospitals that they are asked to keep to
over the course of the year. Prior to the introduction of DRGs, hospitals were formally set a global budget,
but if their billing of services on the basis of per diem rates exceeded their annual budget for the year, this
was usually reimbursed by the sickness funds and then taken into account in the following year‟s budget.
In this way, the use of global budgets provided financial certainty to hospitals that they would receive a
minimum amount of expected revenue for the forthcoming year.
Unlike other OECD countries, the German approach to the implementation of DRGs is that they are a
pricing tool and not an expenditure management tool. This is consistent with the principles of social
insurance in Germany at large, where there is a social preference for paying for high levels of accessibility
to care. To this end, the policy debate in Germany is often quick to equate setting a budget in advance and
obliging hospitals to keep within this as likely to compromise access (e.g. through waiting times).
Germany has not sought to use the policy tools available to it for prospective budgeting
The shift to DRG based financing in recent years has notionally seen an attempt to seek that hospitals take
on greater responsibility for keeping within a budget. All German hospitals are obliged to „contract‟
collectively with sickness funds on an annual basis, with contracts detailing a negotiated amount of
volumes. This continues the tradition of helping hospitals manage financial risk by signalling a minimum
amount of expected revenue, but in addition hospitals now face a reduction in the DRG reimbursement rate
if they undertake more cases that they negotiated. These reductions are framed to be quite steep, with
hospitals being asked to repay 65% of each service beyond their agreed volume.
While Germany has the institutions and information in place to undertake greater regulation of volumes, it
does not do so in practice. Hospitals are legally required to budget prospectively, however, in practice,
most negotiations take place in the same year that the budget is meant to be made for. It is estimated that
around three-quarters of hospitals do not conclude negotiations on contracts until late in the same year for
which the contract is being sought – e.g. a German hospital may not agree its contract of volumes of
services to be delivered in 2012 until September 2012. Hospitals are not obliged to settle a contract until
the end of the year for which the contract is valid (i.e. theoretically December 2012 for the 2012 year). In
part this is likely to reflect the process of setting DRG prices, with hospitals arguing that they require a
tariff structure at a national level and need time to undertake discussions between Länder hospital
associations and regional associations of statutory health funds on an appropriate base. With a national
tariff structure not being specified until late in the previous year, and Länder-specific base rates until the
end of the first quarter for which the contract is to be made, it would be difficult for hospitals to agree
contracts prospectively.
However, it is also in hospitals‟ interests to delay negotiations for as long as possible to minimise financial
risk. The greater the delay in agreeing volumes, the better the hospital is able to estimate its likely volumes
by the end of the year. Furthermore, information can be used in negotiations over volumes, which as they
continue to rise through the year, add weight to a higher annual volume target for that particular year.
Where a hospital estimates it will not be able to conclude a volume target in line with (or above) their
actual volumes, late conclusion of the contract provides a means of minimising the period of time for
which it runs a deficit (presuming that penalties kick in and the hospital cannot finance services it must
deliver from other means). That this process of agreeing volumes is regularly not concluded may reflect
that Germany has never really had a tradition of prospective budgeting for hospitals.
13
Some OECD countries proactively use DRGs and prospective budgets, and this does not necessarily
equate to waiting times
The experience of OECD countries suggests that the active regulation of prices and volumes throughout
the year can be consistent with high levels of accessibility. The Netherlands, France, Australia and the
United Kingdom each use DRG based financing but locate this within an overall global budget (see Table
2). The general approach taken is to specify „tolerance bands‟ for overruns in budgets beyond a negotiated
amount. In the Australian state of Victoria, these budgets are set for individual public hospitals (or groups
of public hospitals), who contract every year with the State Ministry of Health and specify a prospective
budget on the basis of a price-volume forecast. Indeed, while DRGs in Australia are used to estimate an
appropriate budget for a hospital‟s casemix and forecast demand, in practice public hospitals do not charge
government on the basis of the services they deliver. In this regard, Australia and the United Kingdom
could be argued to have DRG based budgeting rather than DRG based reimbursement.
While Australia and the United Kingdom are countries that have extended waiting times for hospitals, this
is not the case in the Netherlands and France, who also set prospective budgets around their DRG based
payments. In the Netherlands, a global budget is set across the entire hospitals sector, whereby if hospital
spending increase more than 2.5%, then excess spending is clawed back from hospitals on the basis of their
turnover (i.e. generally, large hospitals have to give back more). France deploys a mix of both setting
budgets at the hospital level and at the national level, and links this to a broader macroeconomic spending
target across the health sector (see case study in Box 1).
Box 1: Hospital price-volume regulation in France
There are key structural similarities between the French and German hospital systems. Both countries have
financing based on social insurance and socially value the availability of hospital services. In contrast to
Germany, social health care insurance in France is undertaken principally through the country‟s largest
independent health insurer and there is a greater proportion of public hospitals. Since the introduction of
DRG based financing („tarification à l’activité‟) almost a decade ago, France has developed a system to
dynamically monitor and regulate hospital prices and volumes together.
While DRGs are the major source of financing for hospitals, this is supplemented by other categories of
funds. These funds reimburse hospitals for teaching, research and innovation, emergencies, psychiatry,
certain rehabilitation services, services where it is difficult to identify costs per case (organ banks, care to
specific populations and mobile medical teams) and other services that must be maintained irrespective of
activity. The overall financing of France‟s hospital sector occurs within a global budgetary envelope for
health (and hospitals as a sub-component) set annually by the French Parliament.
Throughout the year, the French Ministry of Health seeks to continuously monitor if the combination of
DRG based payments and other payments are in line with amounts that would have previously been given
to hospitals under the system of block grants. The Ministry develops estimates of potential expenditure in
light of changes in data on service volumes and costs (pay, pensions, drug prices etc) and the estimated
effect of new policies that may affect hospital activity. The difference between the estimated envelope and
the Parliament‟s overall funding envelope informs the level of „productivity gains‟ sought from the
hospital sector every year.
The Ministry and the independent health insurer use this process to inform the combination of payments
provided to a hospital. In general terms, the financing of services to patients on the basis of DRGs varies
according to patient demand and is the funding priority. After DRGs are accounted for, the Ministry may
then change the amount of other payments outside DRGs in order to target what they assess a hospital
should receive in light of the need to meet budget constraints across all hospitals.
This system is used flexibly from year to year. In certain years, the Ministry may do the opposite: reduce
DRG rates across the board as an alternative (or complement) to cutting back on non-DRG payments made
14
to hospitals. Generally, a portion of non-DRG financing to hospitals is frozen through the year, and only
released gradually if volume growth expectations stay in line with the overall budget constraint. The
combination of varying DRGs across the board and varying the amount of other funding through the year
can help policy makers drive „productivity‟ improvements in hospitals and keep within budget constraints.
The philosophy behind this approach (noting the emphasis placed on accessibility of health care services in
France) is not to harvest „savings‟ from the hospital sector or reduce services, but rather to drive
efficiencies in an environment where it can be reasonably expected that re-organisation, improved
processes and a more streamlined patient journey ought to deliver productivity gains. It is acknowledged
that this process ought to operate within certain bounds, in order to avoid overburdening or leaving too
much slack.
This system inevitably leads to certain hospitals finding themselves in financial trouble. However, the
identification of financial difficulties in these hospitals is often a flag to policy makers of more substantial
concerns. Hospitals that demonstrate financial troubles are often those with greater capacity and poor
distribution of resources, characteristed by situations such as the insufficient development of alternatives to
hospitalisation, longer lengths of stay due to certain care models, the underuse of operating theatres (or a
surplus of supply), too many staff, the maintenance of facilities longer than needed (e.g. radiotheraphy) and
the misalignment of hospital‟s services relative to those in their region. These hospitals may also suffer
from management issues such as a divided medical community, a poor coding and allocation of costs,
human resources that are not well allocated and oversized expansion ambitions.
As well as helping identify poorly performing hospitals, the French system counters the natural tendency
of open ended DRG based financing to encourage institutions to increase their activity. Policy makers are
able to observe hospitals that increase activity more than others, and these hospitals face calls for greater
„productivity‟ improvements. Knowing that policy makers exercise influence over their budgets helps
encourage a greater focus on financial management at a hospital level.
Source: Inspection Générale des Affaires Sociales (2012)
DRGs are used to cover a wider range of costs in Germany than other OECD countries
Germany has developed an extensive DRG schedule, which has grown to almost double the size of the
Australian DRG system which it initially adopted. This reflects efforts by policy makers to individually
cost the broad diversity of services that any hospital is likely to provide, to the extent that Germany now
has many DRG groups which are only used by a number of hospitals that deliver complex services. In
overall terms, it is estimated that 85 per cent of a hospital‟s costs are reimbursed using DRG based
payments today. Of the remaining 15 per cent of costs, the bulk are for mental health. German DRGs are
intended to cover medical treatment, nursing care, the provision of pharmaceuticals and therapeutic
requirements as well as board and accommodation.
There exists a number of payments to supplement DRGs, but these make up a marginal amount of overall
hospital budgets, and account for the balance not reimbursed through DRGs. These payments include
supplementary fees for certain complex and cost intensive services, very expensive drugs, individually
negotiated payments for highly specialised services, and payments to reward medical innovation (Geissler
et al, 2011). Other than capital costs, the other major category of hospital expenses not accounted for by
DRG based payments are for teaching, training and research.
Critical to the German approach to DRGs and its commitment to rigourous costing is the idea that financial
controls should not stand in the way of patients accessing services. This has meant that while hospitals
receive price signals from DRGs, they have a high degree of control over their total budget through their
decisions on whom to treat, how many people they wish to treat in any one year, and which DRG group to
record them in.
15
In contrast, other OECD countries leave less discretion for hospitals to determine their own budgets. In
addition to overall budgets (discussed in the previous section), countries such as Australia, France, the
Netherlands and England can influence where money goes within the hospital sector. This is most often
done by increasing the „base rate‟ for certain hospitals based on organisational characteristics (such as the
size of the hospital, differences in input prices or teaching status). This approach is most often used to
subsidise larger and tertiary hospitals which often have a higher cost structure than the average hospital as
they undertake more research, operate highly sophisticated technologies and deal with the most complex
patient cases. Varying the base rate for tertiary hospitals can then also provide policy makers with the
ability to penalise certain hospitals for increases in volumes without having to reduce prices for all
hospitals.
Many OECD countries also exclude hospital functions where payments on the basis of DRGs may not be
suitable, which provides them with another lever to influence hospital budgets. The most prominent
example of the difference between Germany and other OECD countries is how centralised emergency
departments are paid. As DRG payments have evolved from old hospital budgets in Germany, there is a
presumption that emergency department costs are already „factored in‟ to DRG based payments and a
discount of 50 Euros per case is recouped from hospitals that do not have emergency departments. In
France, Canada, the United Kingdom and the Netherlands, funding for research, emergency services and a
range of special services are provided outside of the DRG system. France finances emergency departments
through an annual lump sum payment and a special tariff for patients that use an emergency department
who are not then admitted into hospital. Similarly, Australia provides a combination of both a higher
average casemix adjusted payment (a higher „base rate‟) and separate payments to support certain
emergency facilities.
Responsibility for funding hospital capital is located at the state level of government, which has an
interest in maintaining high levels of availability
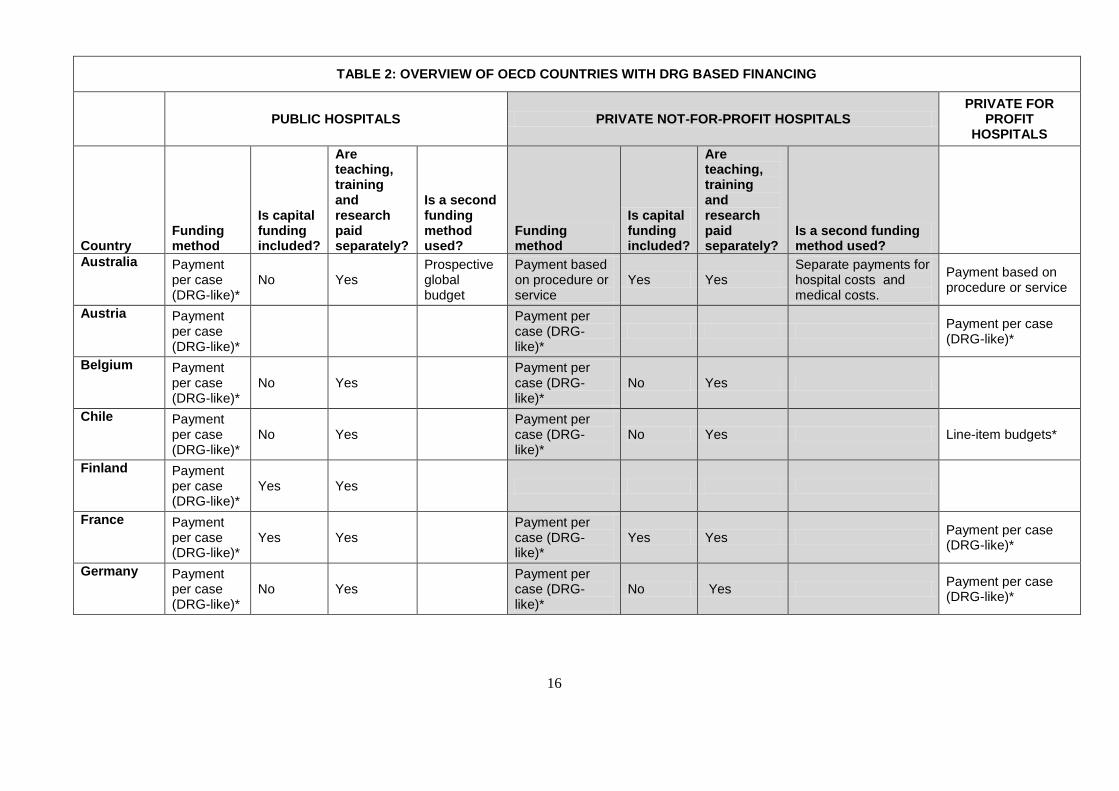
It is common for OECD countries to fund capital separately to DRG based payments. As shown in Table 3,
Australia, Belgium, Chile, Greece and Poland all do not include capital in DRGs. Those countries which
do include capital costs generally provide a payment towards the depreciation as part of DRG based
financing, but finance major capital investment through separate means. Germany is analogous to Australia
and Denmark in that the funding of hospital capital is complicated by two levels of Government. In both of
these countries, state-level governments are responsible for capital funding to hospitals. While it is difficult
to arrive at data to assess the extent of the situation in Germany, a constant concern in the Australian
system is that the lesser fiscal capacities of States reduce their ability to finance hospital capital, seeking
hospitals to recoup ongoing capital expenses through recurrent means. Similary, in Denmark the national
government was willing to provide a major capital injection into those regional hospitals not subject to
rationalisation. This was a critical factor that allowed Denmark to achieve major reforms to further
rationalise hospital capacity across the country (OECD, 2013).
In both Australia and Denmark, state or regional governments have been unwilling to rationalise hospital
capacity as they constitute major sources of employment. Both countries are different to Germany in that
their hospital delivery is dominated by public hospitals. Therefore states exercise overall budgetary control
on their hospitals and bear a large share of the additional recurrent costs for running these hospitals
associated with expansions in activity (or maintaining high levels of activity). In contrast, Germany has
weak budgetary control and state governments do not bear financial responsibility for recurrent costs in
their hospitals.
16
TABLE 2: OVERVIEW OF OECD COUNTRIES WITH DRG BASED FINANCING
PUBLIC HOSPITALS PRIVATE NOT-FOR-PROFIT HOSPITALS PRIVATE FOR
PROFIT HOSPITALS
Country Funding method
Is capital funding included?
Are teaching, training and research paid separately?
Is a second funding method used?
Funding method
Is capital funding included?
Are teaching, training and research paid separately?
Is a second funding method used?
Australia Payment per case (DRG-like)*
No Yes Prospective global budget
Payment based on procedure or service
Yes Yes Separate payments for hospital costs and medical costs.
Payment based on procedure or service
Austria Payment per case (DRG-like)*
Payment per case (DRG-like)*
Payment per case (DRG-like)*
Belgium Payment per case (DRG-like)*
No Yes Payment per case (DRG-like)*
No Yes
Chile Payment per case (DRG-like)*
No Yes Payment per case (DRG-like)*
No Yes Line-item budgets*
Finland Payment per case (DRG-like)*
Yes Yes
France Payment per case (DRG-like)*
Yes Yes Payment per case (DRG-like)*
Yes Yes Payment per case (DRG-like)*
Germany Payment per case (DRG-like)*
No Yes Payment per case (DRG-like)*
No Yes Payment per case (DRG-like)*
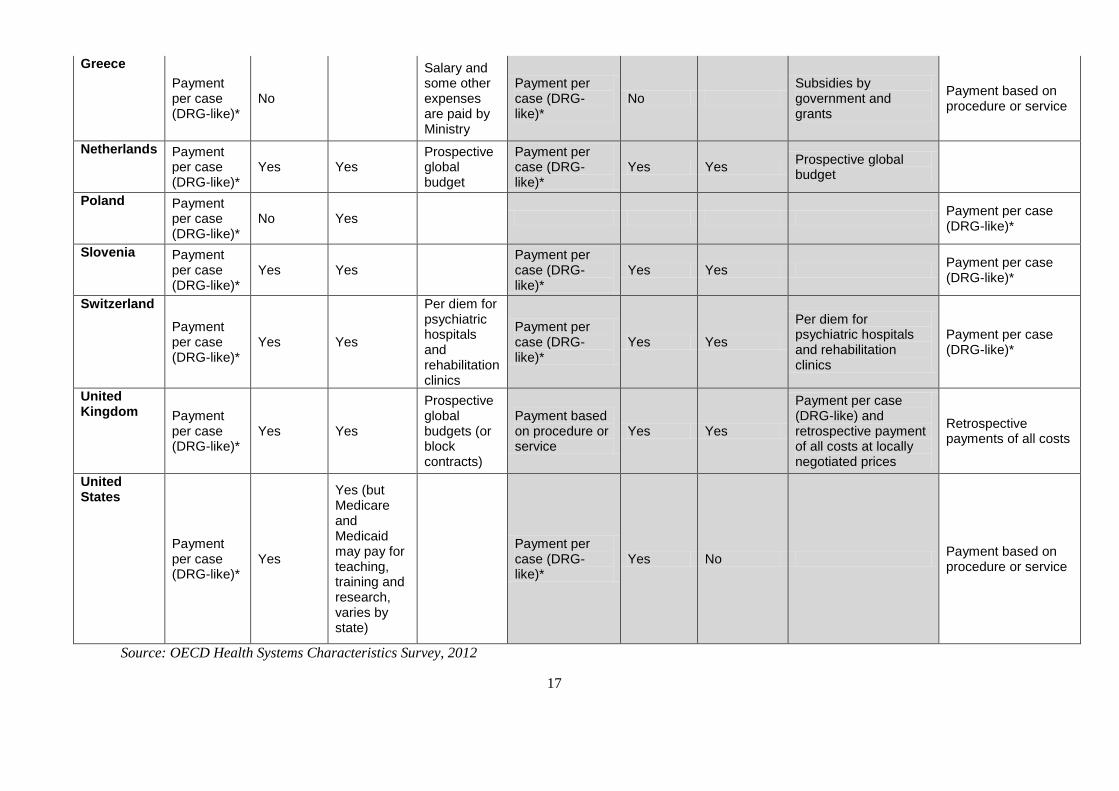
17
Greece
Payment per case (DRG-like)*
No
Salary and some other expenses are paid by Ministry
Payment per case (DRG-like)*
No Subsidies by government and grants
Payment based on procedure or service
Netherlands Payment per case (DRG-like)*
Yes Yes Prospective global budget
Payment per case (DRG-like)*
Yes Yes Prospective global budget
Poland Payment per case (DRG-like)*
No Yes Payment per case (DRG-like)*
Slovenia Payment per case (DRG-like)*
Yes Yes Payment per case (DRG-like)*
Yes Yes Payment per case (DRG-like)*
Switzerland
Payment per case (DRG-like)*
Yes Yes
Per diem for psychiatric hospitals and rehabilitation clinics
Payment per case (DRG-like)*
Yes Yes
Per diem for psychiatric hospitals and rehabilitation clinics
Payment per case (DRG-like)*
United Kingdom Payment
per case (DRG-like)*
Yes Yes
Prospective global budgets (or block contracts)
Payment based on procedure or service
Yes Yes
Payment per case (DRG-like) and retrospective payment of all costs at locally negotiated prices
Retrospective payments of all costs
United States
Payment per case (DRG-like)*
Yes
Yes (but Medicare and Medicaid may pay for teaching, training and research, varies by state)
Payment per case (DRG-like)*
Yes No Payment based on procedure or service
Source: OECD Health Systems Characteristics Survey, 2012
18
Germany collects a vast array of quality information, but little use is made of this to influence financing
Germany is a leader among OECD countries in the collection of information on quality of care. The
German Hospitals Federation (DKG) in conjunction with regional hospital associations operate a German
hospital directory aimed at informing patients and their doctors about the range of hospital services
available. Hospitals are legally required to produce quality reports every two years and submit them to the
Joint Federal Committee. Citizens are able to access the websites of statutory health fund associations
where these reports are made available, detailing an array of medical and surgical quality indicators such as
hip or knee replacements, hernia surgery, cataract surgery, gynaecological surgery and coronary artery
bypass grafting. While the number and scope of indicators varies across procedures, they generally cover
outcomes, readmission rates and process measures such as complication rates. On consumer information
portals run by a number of different providers, patients can search for hospitals according to diagnosis,
procedure or intervention and by geographical area, they can also search for quality information on the
basis of an indicator. Data on outcomes is supplemented by a traffic light system, where green represents a
hospital is within reasonable variation from a national average, and red indicates that it is outside these
limits (Busse, Nimptsch and Mansky, 2009 and Cacace et al, 2011).
With a view to improving quality, Germany provides a feedback loop to their hospitals before the
publication of these quality reports. The AQUA Institute that has been mandated by the Joint Federal
Committee along with regional offices for quality assurance compile results across individual hospitals and
feed this back to hospitals in the form of individualised reports and recommendations. Hospitals are able to
see how they perform relative to national indicators. In case they underperform on a given indictor the
hospitals may be required to formally comment on their results and where relevant suggest measures to
improve performance (e.g. continuous education)(Cacace et al, 2011).
Pay for performance may help at the margin – but Germany may need a more structural approach
In recent years, there have been a number of OECD countries that have tried to incorporate quality into
how hospital care has been financed, with varying degrees of success. The most systematic attempt to do
so has been operated by the Centres for Medicare and Medicaid in the United States for several years now.
A recent study compared 260 hospitals in the US pay for performance project against a control group of
780 hospitals not in the project. It found a majority of hospitals in the pay for performance project initially
achieved high performance scores compared to fewer than a third of control hospitals, but that differences
dissipated after five years (Werner et al., 2011). Based on the US model, Korea has also sought to
implement a pay for performance scheme across its tertiary hospitals to drive performance improvements
in acute myocardial infarction and the proportion of caesarean deliveries. This scheme is relatively new
and has not been formally evaluated, making it difficult to judge the extent to which the pay for
performance programme has driven improved performance, or merely mimicked a trajectory of gradually
improving performance that existed prior to the introduction of the scheme. A more sophisticated approach
that builds upon DRG based financing has been implemented in the US state of Maryland in recent years
(see Box 2 below). Each of these programmes combine very modest financial incentives and a strong focus
on data collection.
Box 2: Maryland’s Hospital Acquired Conditions Programme
Since the late 1970s, the US state of Maryland has operated a DRG based payment system for the state‟s
46 (public and private) hospitals. Since 2009, this has been supplemented by a new pay-for-performance
programme linking payments to hospital performance across 49 potentially avoidable hospital acquired
complications (listed in Table 4). This programme is administered by a state agency called the Health
Services Cost Review Commission (HSCRC) which is the principal financer of hospital services for
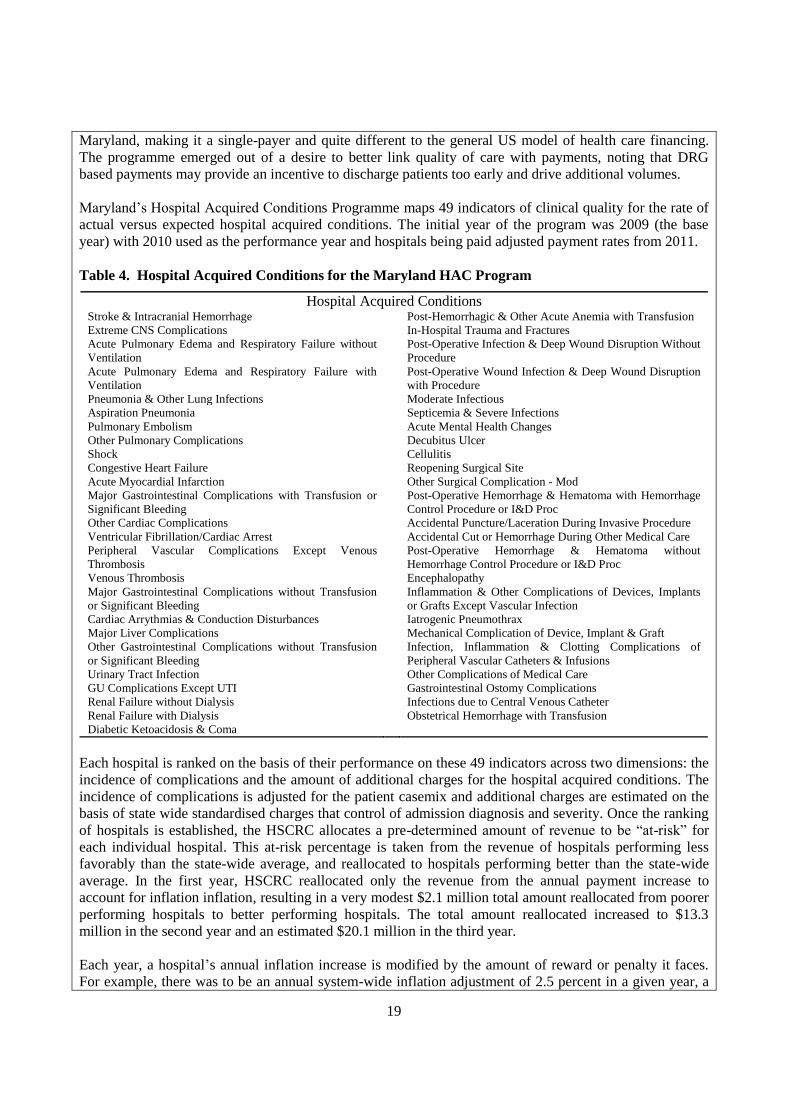
19
Maryland, making it a single-payer and quite different to the general US model of health care financing.
The programme emerged out of a desire to better link quality of care with payments, noting that DRG
based payments may provide an incentive to discharge patients too early and drive additional volumes.
Maryland‟s Hospital Acquired Conditions Programme maps 49 indicators of clinical quality for the rate of
actual versus expected hospital acquired conditions. The initial year of the program was 2009 (the base
year) with 2010 used as the performance year and hospitals being paid adjusted payment rates from 2011.
Table 4. Hospital Acquired Conditions for the Maryland HAC Program
Hospital Acquired Conditions Stroke & Intracranial Hemorrhage Post-Hemorrhagic & Other Acute Anemia with Transfusion
Extreme CNS Complications In-Hospital Trauma and Fractures
Acute Pulmonary Edema and Respiratory Failure without
Ventilation
Post-Operative Infection & Deep Wound Disruption Without
Procedure
Acute Pulmonary Edema and Respiratory Failure with
Ventilation
Post-Operative Wound Infection & Deep Wound Disruption
with Procedure
Pneumonia & Other Lung Infections Moderate Infectious
Aspiration Pneumonia Septicemia & Severe Infections
Pulmonary Embolism Acute Mental Health Changes
Other Pulmonary Complications Decubitus Ulcer
Shock Cellulitis
Congestive Heart Failure Reopening Surgical Site
Acute Myocardial Infarction Other Surgical Complication - Mod
Major Gastrointestinal Complications with Transfusion or
Significant Bleeding
Post-Operative Hemorrhage & Hematoma with Hemorrhage
Control Procedure or I&D Proc
Other Cardiac Complications Accidental Puncture/Laceration During Invasive Procedure
Ventricular Fibrillation/Cardiac Arrest Accidental Cut or Hemorrhage During Other Medical Care
Peripheral Vascular Complications Except Venous
Thrombosis
Post-Operative Hemorrhage & Hematoma without
Hemorrhage Control Procedure or I&D Proc
Venous Thrombosis Encephalopathy
Major Gastrointestinal Complications without Transfusion
or Significant Bleeding
Inflammation & Other Complications of Devices, Implants
or Grafts Except Vascular Infection
Cardiac Arrythmias & Conduction Disturbances Iatrogenic Pneumothrax
Major Liver Complications Mechanical Complication of Device, Implant & Graft
Other Gastrointestinal Complications without Transfusion
or Significant Bleeding
Infection, Inflammation & Clotting Complications of
Peripheral Vascular Catheters & Infusions
Urinary Tract Infection Other Complications of Medical Care
GU Complications Except UTI Gastrointestinal Ostomy Complications
Renal Failure without Dialysis Infections due to Central Venous Catheter
Renal Failure with Dialysis Obstetrical Hemorrhage with Transfusion
Diabetic Ketoacidosis & Coma
Each hospital is ranked on the basis of their performance on these 49 indicators across two dimensions: the
incidence of complications and the amount of additional charges for the hospital acquired conditions. The
incidence of complications is adjusted for the patient casemix and additional charges are estimated on the
basis of state wide standardised charges that control of admission diagnosis and severity. Once the ranking
of hospitals is established, the HSCRC allocates a pre-determined amount of revenue to be “at-risk” for
each individual hospital. This at-risk percentage is taken from the revenue of hospitals performing less
favorably than the state-wide average, and reallocated to hospitals performing better than the state-wide
average. In the first year, HSCRC reallocated only the revenue from the annual payment increase to
account for inflation inflation, resulting in a very modest $2.1 million total amount reallocated from poorer
performing hospitals to better performing hospitals. The total amount reallocated increased to $13.3
million in the second year and an estimated $20.1 million in the third year.
Each year, a hospital‟s annual inflation increase is modified by the amount of reward or penalty it faces.
For example, there was to be an annual system-wide inflation adjustment of 2.5 percent in a given year, a
20
hospital that performed well receive an increase to its hospital payment rates (to say, 3.343%). Likewise, a
poorer performing hospital would face a penalty of -0.76%, resulting in a net rate increase of only 1.74%.
An important feature of the MHAC program is that it created a specific tool for discussing, assessing and
evaluating overall and relative quality of care. The HSCRC provides state-wide performance data to each
hospital at the beginning of the year, which shows each hospital‟s position relative to state-wide
performance by complication category. The HSCRC also provides quarterly updates to hospitals so they
can track their performance. Providing hospitals with data showing their relative performance provides
clinical and financial staff with the actionable intelligence to identify areas of concern and then
systematically target these areas.
The HSCRC has noted improvements in patient outcomes and costs based on data from initial two years of
MHAC. The improvements were consistent across the HACs, with 75 percent of HACs included in the
program declining in both years. Though indicators relating to infections declined faster than the rest of the
indicators, which may indicate the impact of other clinical quality improvement projects being
implemented at the same time. Reviews have not yet established whether the increase in the hospital
acquired conditions excluded from MHAC may be the result of hospitals shifting the focus of their quality
efforts.
A focus on hospital acquired infections provides an alternative approach to link quality of care to financial
incentives than the more process-oriented measures. The focus on promoting a set of process measures can
be a highly prescriptive approach, e.g. for an Acute Myocardial Infarction hospitals have strong
incentivizes to provide all seven evidence based processes of care – aspirin upon admission, beta-blockers
upon discharge – whether that patient truly needs these prescribed interventions or not.
Source: Murray, R. in Cashin et al (2013)
A key rationale for introducing pay for performance based financing in other OECD countries was to
improve the collection of data on quality of care, an area in which Germany is already reasonably advanced.
The German Federal Ministry of Health mandated a study on the pay-for-performance in Germany (Veit et.
al., 2012) to evaluate available approaches and their potential for quality improvements. The current high
level of services undertaken in Germany also calls into question whether a programme seeking to drive
quality of care improvements at the margin would be of use. Rather, a more systematic approach may be
needed to assess whether Germany‟s citizens are receiving more services than is medically desirable.
To this end, the Germany Federal Ministry of Health, sickness funds and hospitals may wish to consider
further evaluation of variations in medical practice across the country to identify whether there are
hospitals that are systematically providing more services than the age and morbidity profile of their
catchment population would imply. Germany is fortunate in that it already has a market structure of social
insurers with an appetite to use quality of care data and that negotiation for hospital contracts is undertaken
at a regional level. Where regions are identified with considerably higher levels of procedures, German
policy makers may wish to contemplate whether it may be worthwhile to allow regional insurers´ groups to
selectively contract for a limited set of elective surgery procedures.
21
5. CONCLUSION
The relative ease of access to hospital services is a strength of the German health care system when
compared to other OECD countries. However, the considerably higher levels of hospital discharges when
compared to other countries and the large variation in these discharges within Germany are a cause for
concern. As the population ages, the health challenges faced by Germans are likely to be chronic diseases.
This implies that while hospitals continue to be a crucial pillar of the healthcare system, it will be
important to ensure that primary care is also supported to meet the additional demands of helping people
manage their chronic disease.
Germany is likely to require a combination of policies to better control hospital volumes. This should begin
with more focused efforts by both insurers and hospitals to contain recent growth in levels of activity. The
larger challenge will be to address the high overall levels of hospital services in Germany and ensure that
patients receive a medically appropriate level of care. It is particularly important that any policies in
relation to volumes in German hospitals are undertaken in such a way that they strengthen high quality
health care, for example by better combining quality data and hospital financing. This would help ensure
that Germans continue to benefit from health care that is among the best in the world.
22
REFERENCES
Busse, R., Nimptsch, U. and Mansky, T. (2009), „Measuring Monitoring And Managing Quality In
Germany‟s Hospitals‟, Health Affairs, 28 no.2
Cacace, M., Ettelt, S., Brereton, L., Pedersen, J., Nolte, E. (2011), „How health systems make available
information on service providers – Experience in seven countries‟, Technical Report, RAND Europe
Cashin, C., Chi, Y-L, Borowitz, M., Smith, P., Thomson, S. (2013), Paying for performance in healthcare:
implications for health system efficiency and accountability, OECD and the European Observatory
on Health Systems and Policies, Open University Press (forthcoming)
Dörner, S. and M. Weyermann (2013), „Entwicklung der Leistungen für hochbetagte Patienten“ in
Krankenhausreport 2013, Schattauer verlag: Stuttgart
Geissler, A., Scheller-Kreinsen, D., Quentin, W. and Busse, R. (2011), „Germany: Understanding G-
DRGs‟, chapter 14 of Diagnosis Related Groups in Europe: Moving towards transparency,
efficiency and quality in hospitals, European Observatory on Health Systems and Policy, Open
University Press
Gesundheitsberichterstattung des Bundes (2011) Krankenhäuser und Vorsorge- oder
Rehabilitationseinrichtungen (Anzahl und je 100.000 Einwohner) sowie Aufenthalte (Fallzahl,
Berechnungs-/Belegungstage und Verweildauer), nach Region, http://www.gbe-
bund.de/gbe10/i?i=115D, accessed on 22 February 2013
Inspection Générale des Affaires Sociales (2012), L’Hôpital : a report to the President, Parliament and
Government of France, Paris
McPherson, K., Gon, G., and Scott, M. (2013), „International Variations in a selected number of surgical
procedures‟, OECD Health Working Papers, DELSA/HEA/WD/HWP(2013)2, forthcoming
Nolting, H-D., Zich, K., Deckenbach, B., Gottberg, A., Lottman, K., Klemperer, D., Westrick, M. G.,
Schwenk, U. (2012), Healthcare Fact Check: Regional Variations in German Healthcare,
Bertelsmann Stiftung, Gutersloh
OECD (2013), OECD Reviews of Health Care Quality: Denmark 2013, Raising Standards, OECD
Publishing (forthcoming)
OECD (2012), OECD Health Data, Paris
Rheinisch-Westfälisches Institut für Wirtschaftsforschung (2012) Mengenentwicklung und
Mengensteuerung stationärer Leistungen – Endbericht, RWI: Essen
Werner, R.M., J.T. Kolstad, E.A. Stuart and D. Polsky (2011), “The Effect of Pay-for-Performance in
Hospitals: Lessons for Quality Improvement”, Health Affairs, Vol. 30, No. 4, pp. 690-698, April.
Veit, Ch., D. Hertle, S. Bungard, A. Trümner, V. Ganske, B. Meyer-Hofmann (2012) Pay-for-Performance
im Gesundheitswesen: Sachstandsbericht zu Evidenz und Realisierung sowie Darlegung der
Grundlagen für eine künftige Weiterentwicklung, Gutachten im Auftrag des Bundesministeriums für
Gesundheit, BQS Institut für Qualität und Patientensicherheit: Hamburg