Embed Size (px)
Citation preview
International Centre for Integrated Mountain Development
Kathmandu, Nepal
Mandira Singh Shrestha , Pradeep Dangol, Guna Nidhi
Paudyal, Shahriar Wahid, Gautam Rajkarnikar
Real-time flood outlook in the Narayani
basin
International conference on climate change
innovation and resilience 12-14 January 2015 Kathmandu, NEPAL
Presentation outline
• Distribution of disasters in Nepal
• Model framework
– Process
– Model platform
• Data available
• System of flow forecasts
• Dissemination
• Example of 2014 floods
• Challenges and road ahead
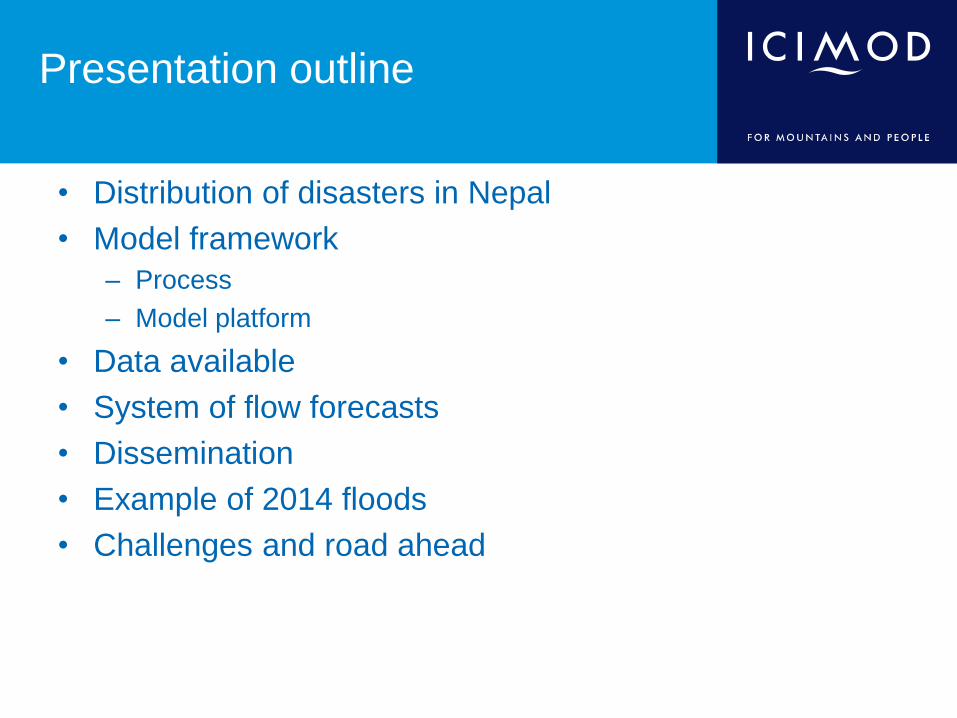
Distribution of disasters in Nepal:
1983-2010
Source: DWIDP Disaster Bulletin, 2011
About 35% of people killed are due
to floods and landslides
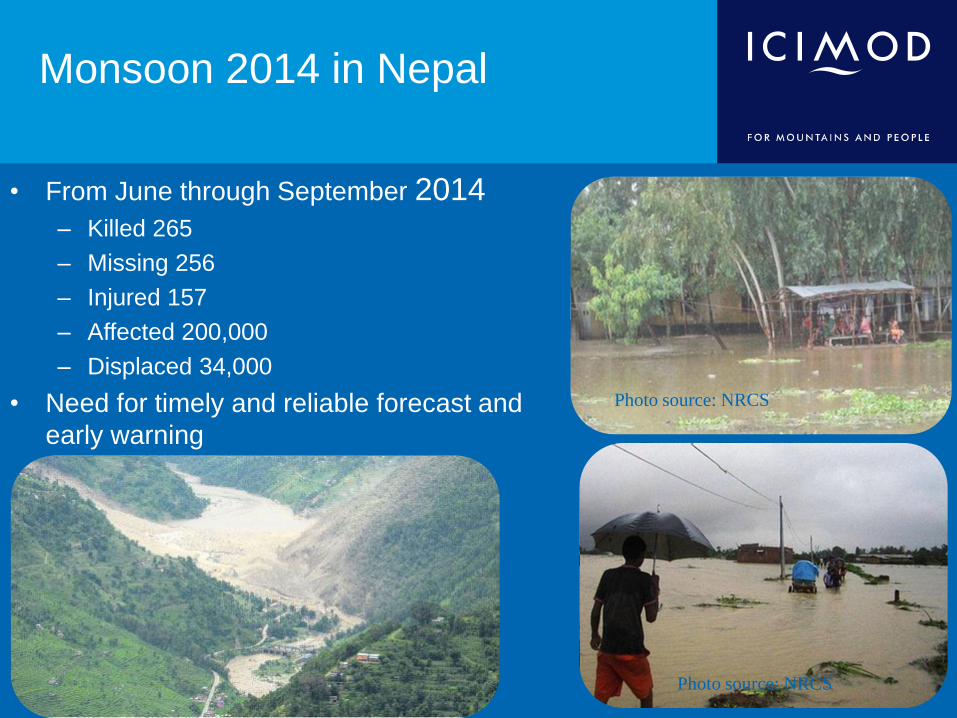
Monsoon 2014 in Nepal
• From June through September 2014 – Killed 265
– Missing 256
– Injured 157
– Affected 200,000
– Displaced 34,000
• Need for timely and reliable forecast and
early warning
Photo source: NRCS
Photo source: NRCS
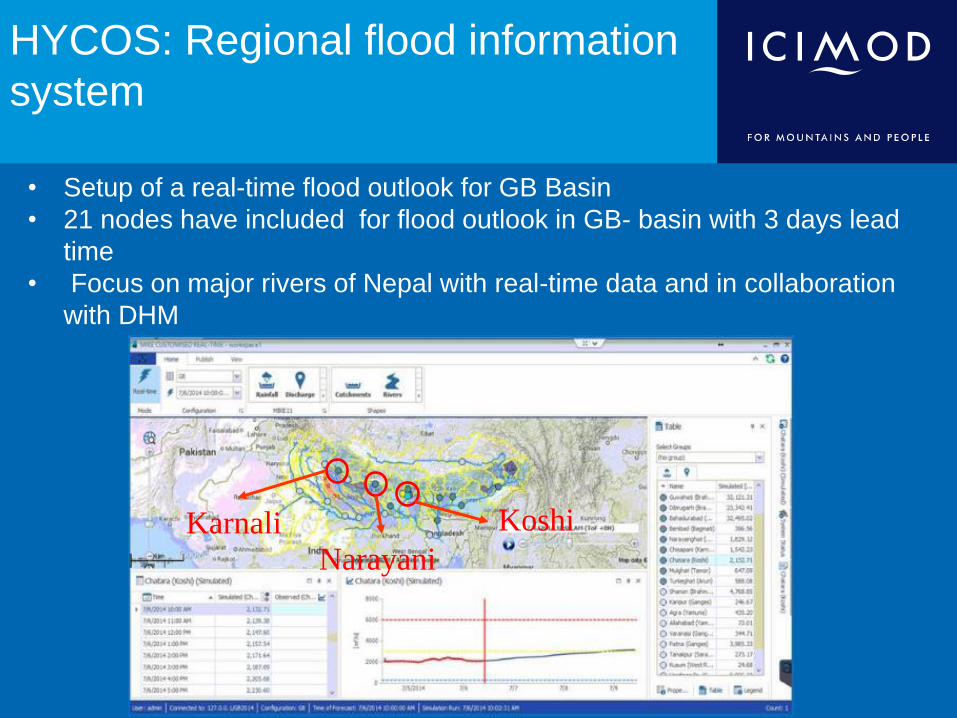
• Setup of a real-time flood outlook for GB Basin
• 21 nodes have included for flood outlook in GB- basin with 3 days lead
time
• Focus on major rivers of Nepal with real-time data and in collaboration
with DHM
HYCOS: Regional flood information
system
Karnali Narayani
Koshi
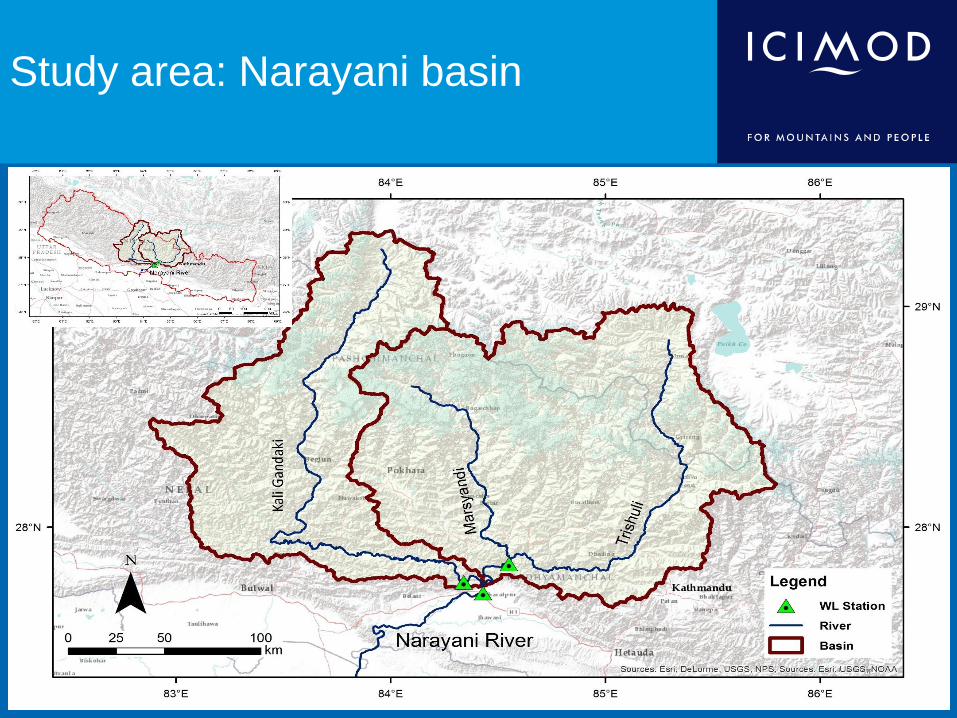
Study area: Narayani basin
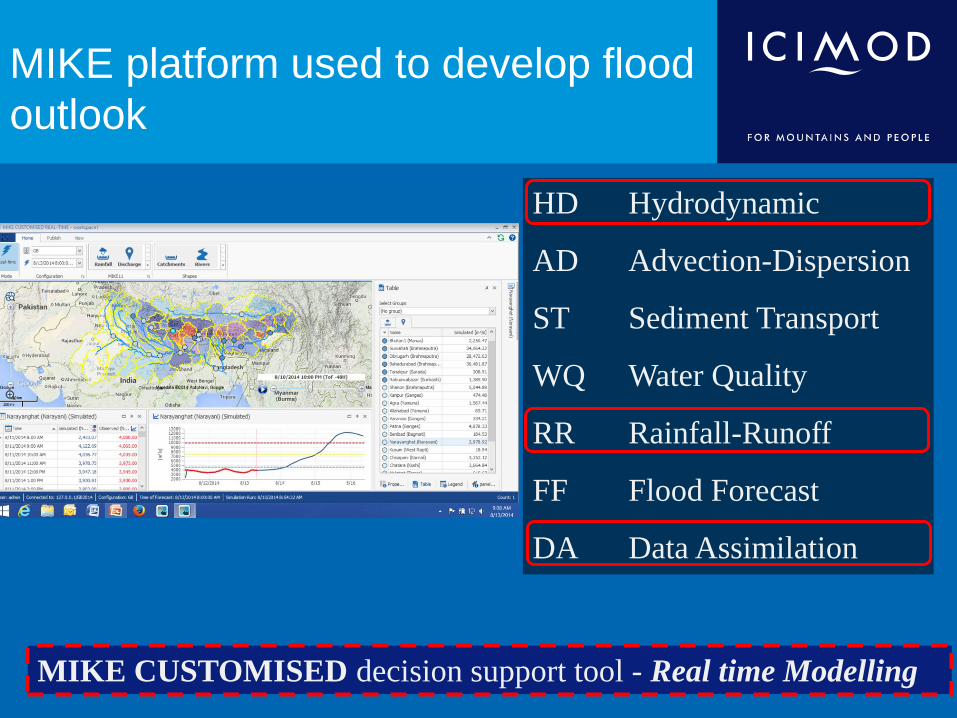
MIKE platform used to develop flood
outlook
HD Hydrodynamic
AD Advection-Dispersion
ST Sediment Transport
WQ Water Quality
RR Rainfall-Runoff
FF Flood Forecast
DA Data Assimilation
MIKE CUSTOMISED decision support tool - Real time Modelling
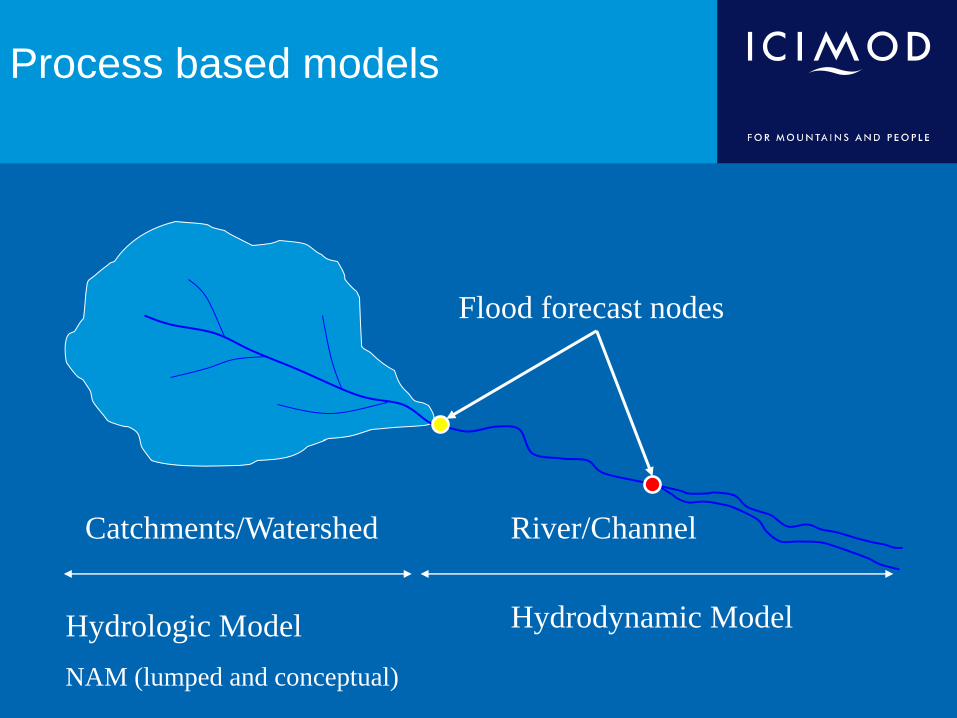
Process based models
Hydrologic Model
NAM (lumped and conceptual)
Hydrodynamic Model
Catchments/Watershed River/Channel
Flood forecast nodes
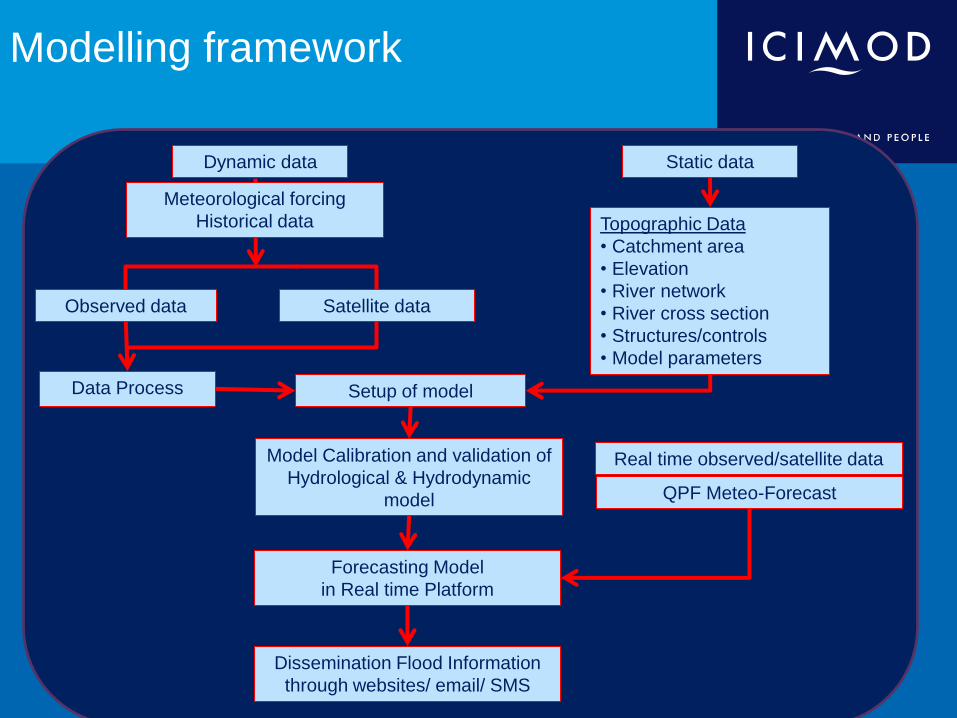
Modelling framework
Dynamic data
Observed data
Data Process Setup of model
Static data
Model Calibration and validation of
Hydrological & Hydrodynamic
model
Satellite data
Topographic Data
• Catchment area
• Elevation
• River network
• River cross section
• Structures/controls
• Model parameters
Meteorological forcing
Historical data
Real time observed/satellite data
QPF Meteo-Forecast
Forecasting Model
in Real time Platform
Dissemination Flood Information
through websites/ email/ SMS
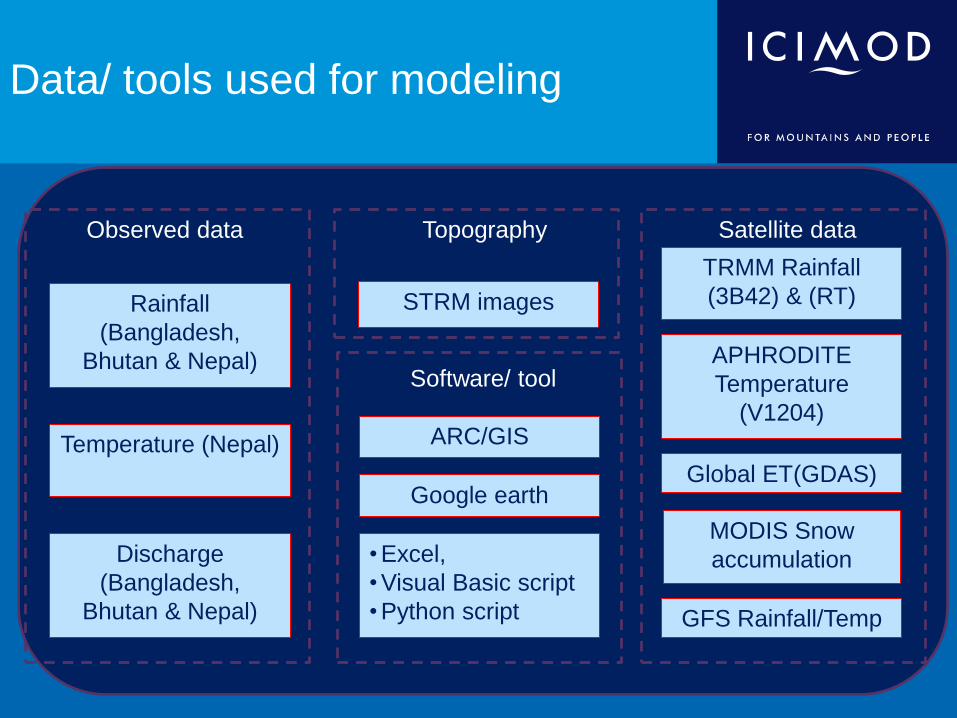
Data/ tools used for modeling
STRM images
Topography
Rainfall
(Bangladesh,
Bhutan & Nepal)
Observed data
ARC/GIS
TRMM Rainfall
(3B42) & (RT)
Satellite data
Software/ tool
MODIS Snow
accumulation
Google earth
Temperature (Nepal)
Discharge
(Bangladesh,
Bhutan & Nepal)
APHRODITE
Temperature
(V1204)
Global ET(GDAS)
• Excel,
• Visual Basic script
• Python script GFS Rainfall/Temp
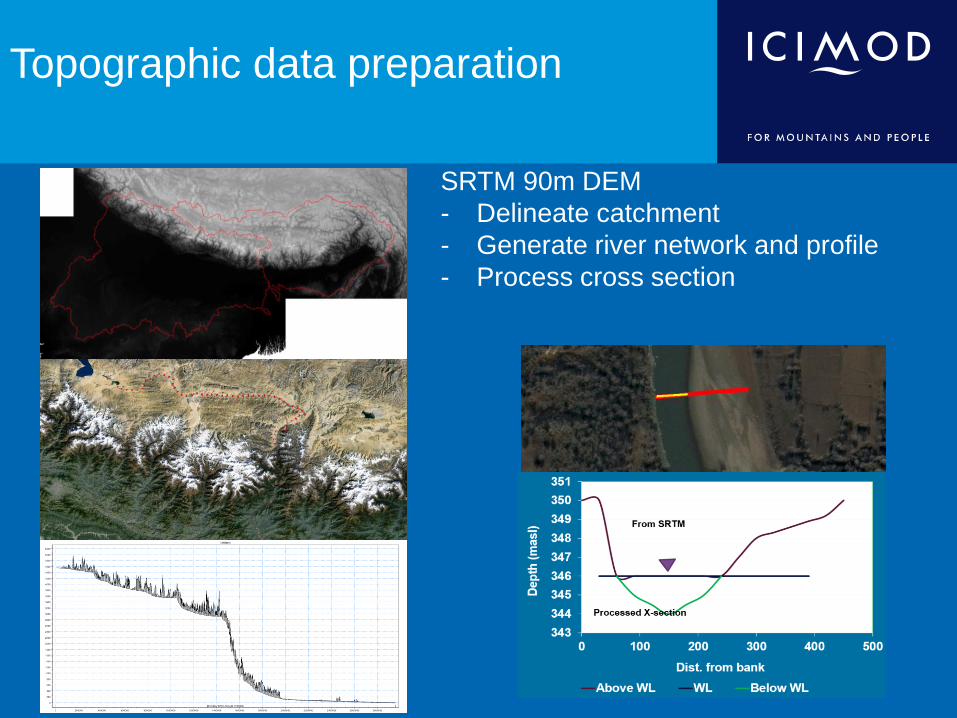
Topographic data preparation
SRTM 90m DEM
- Delineate catchment
- Generate river network and profile
- Process cross section
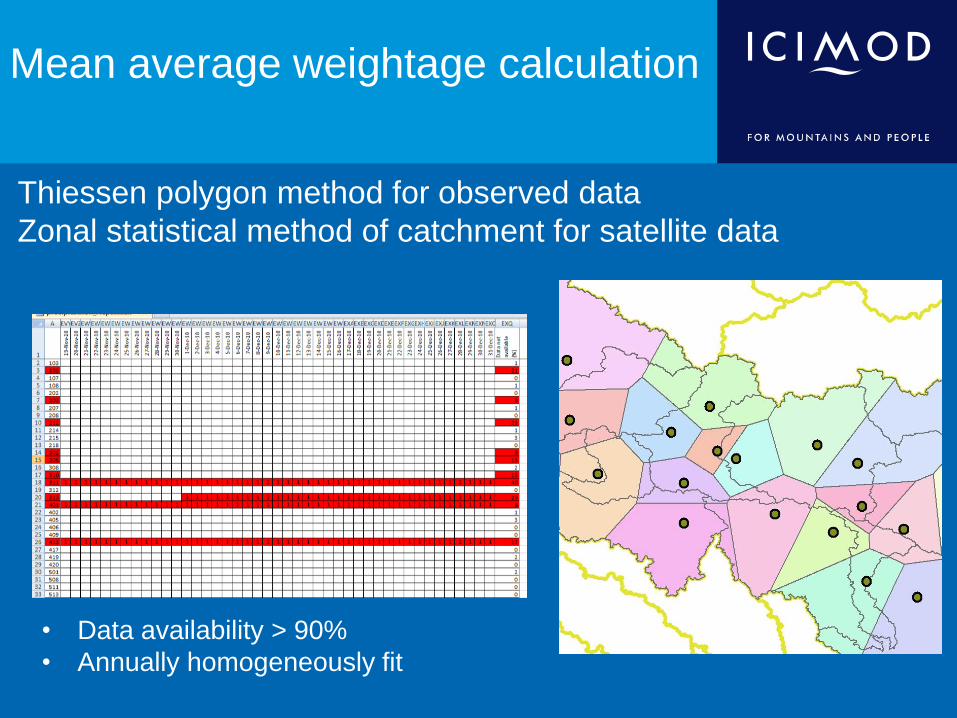
Mean average weightage calculation
Thiessen polygon method for observed data
Zonal statistical method of catchment for satellite data
• Data availability > 90%
• Annually homogeneously fit
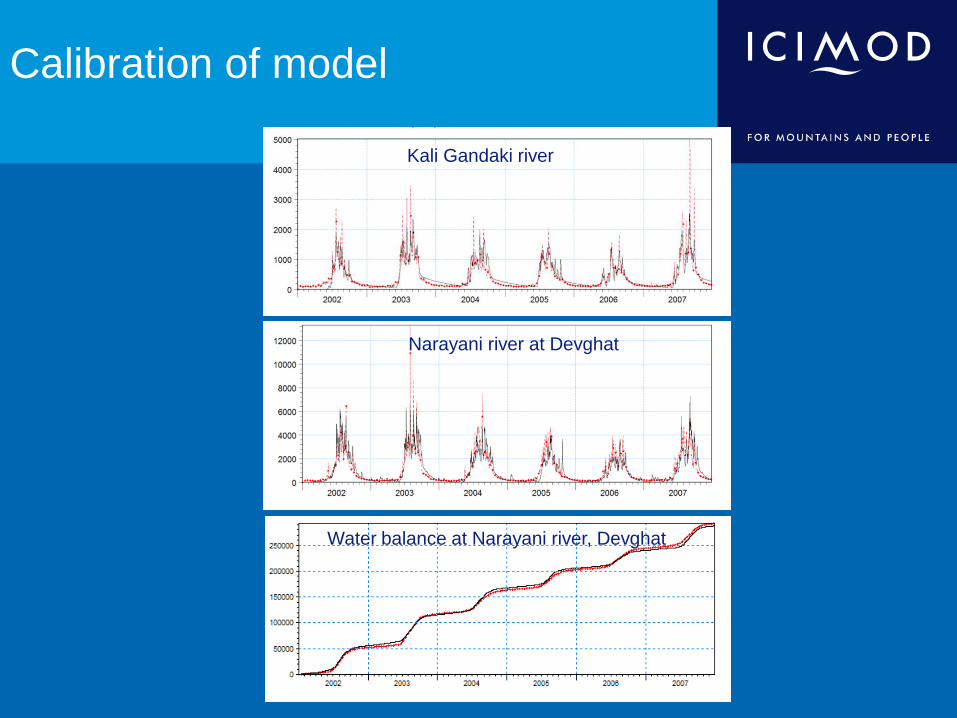
Calibration of model
Kali Gandaki river
Narayani river at Devghat
Water balance at Narayani river, Devghat
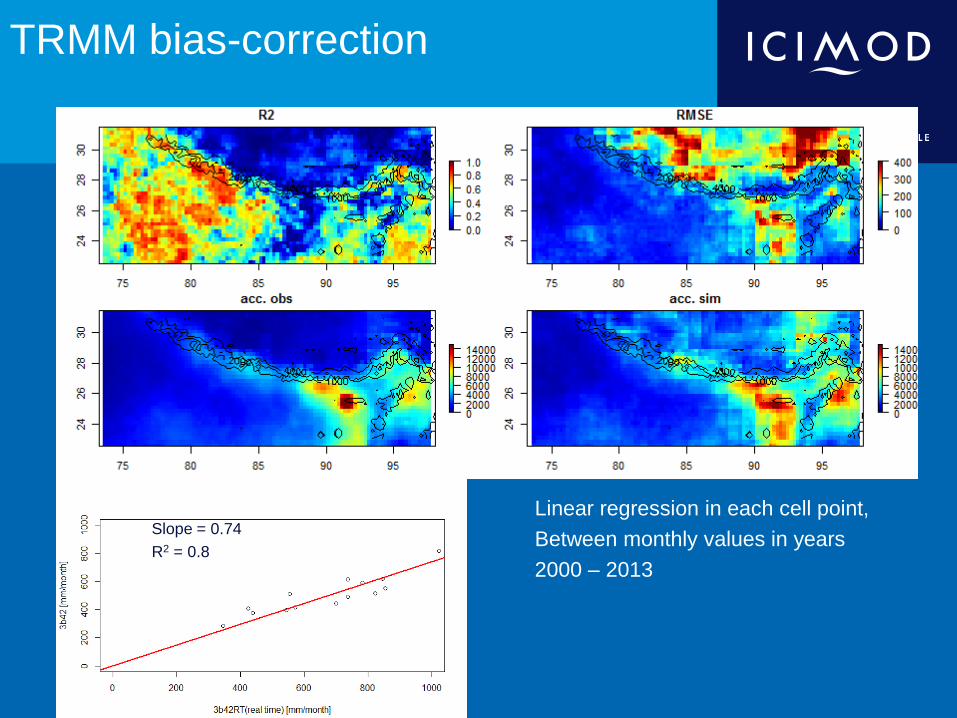
TRMM bias-correction
Linear regression in each cell point,
Between monthly values in years
2000 – 2013
Slope = 0.74
R2 = 0.8

HD simulation comparison –
at outlet of basin
TRMM 3b42 (RT)
TRMM 3b42
TRMM 3b42 bias
Observed Discharge
~50km
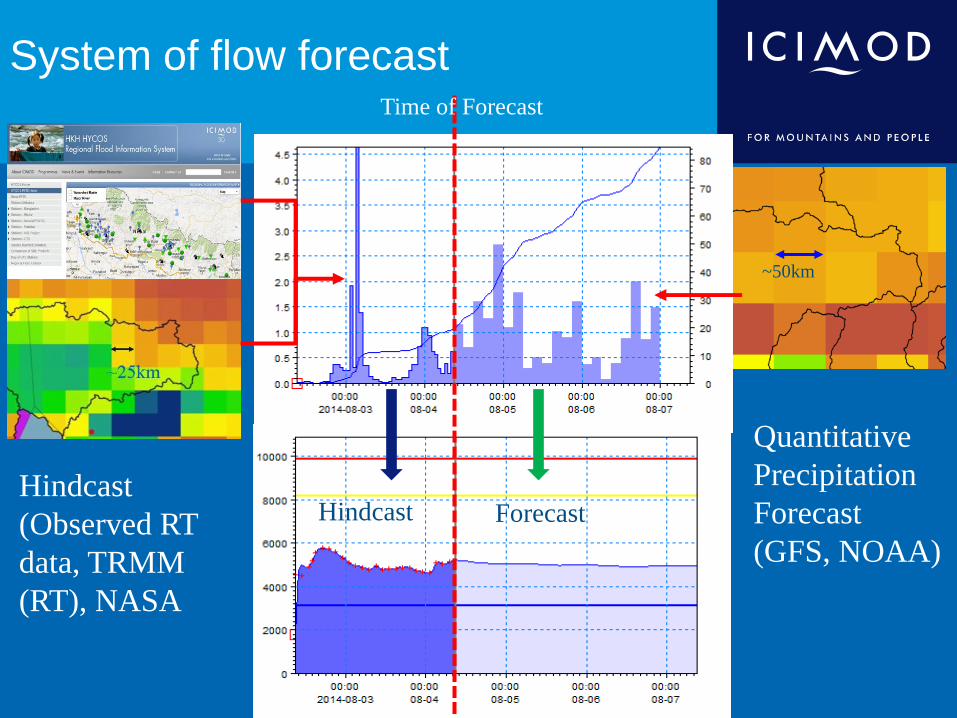
System of flow forecast
Hindcast
(Observed RT
data, TRMM
(RT), NASA
Quantitative
Precipitation
Forecast
(GFS, NOAA)
~25km
Hindcast Forecast
Time of Forecast
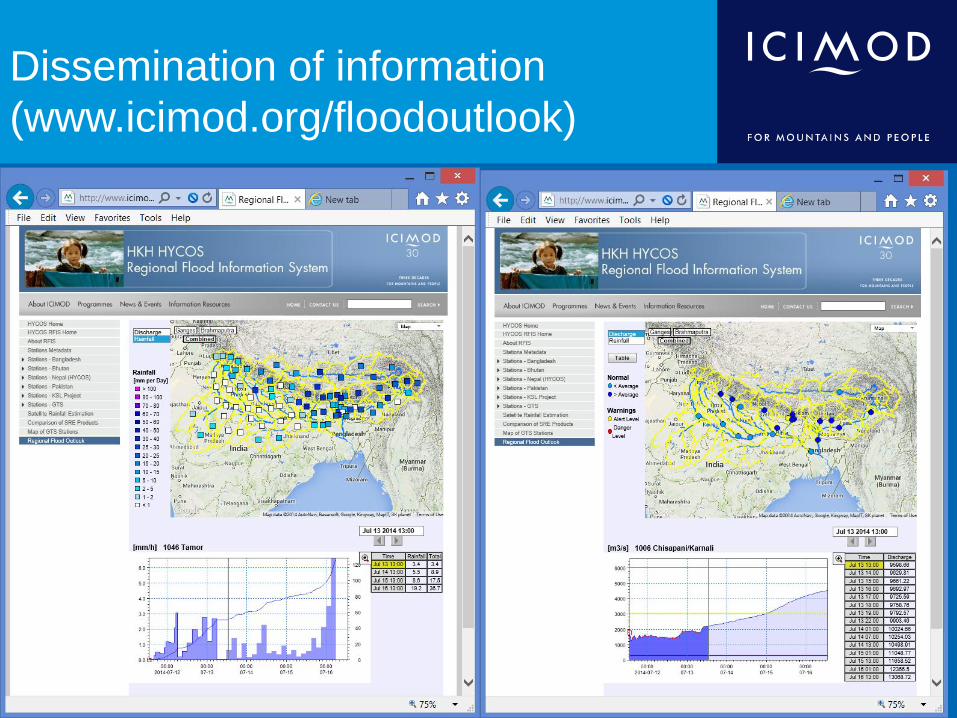
Dissemination of information
(www.icimod.org/floodoutlook)
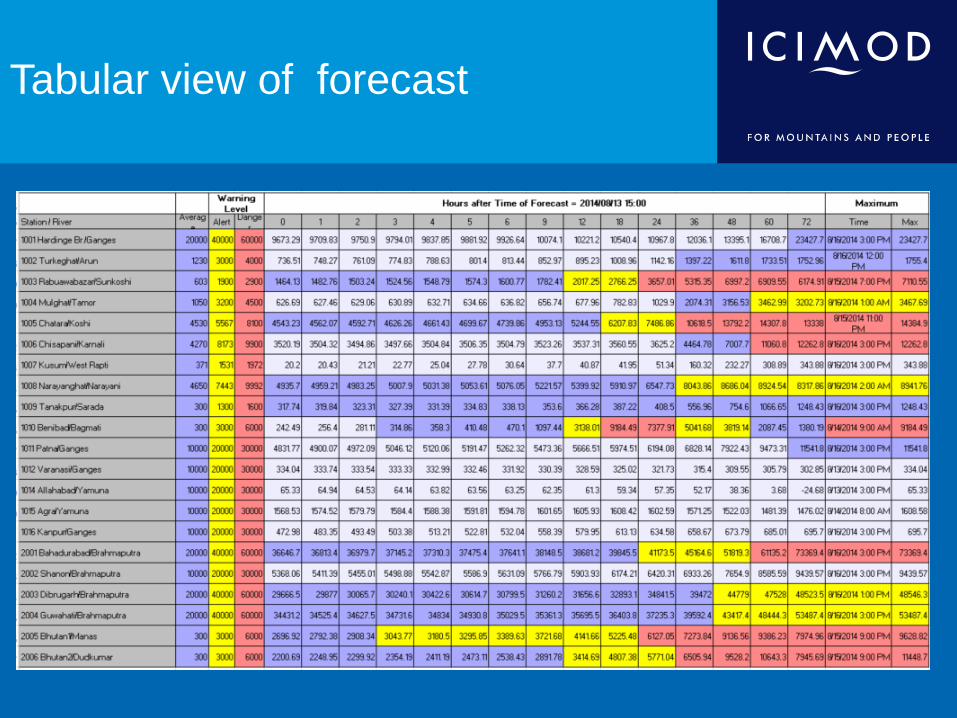
Tabular view of forecast
Results of forecast exercise in
August 2014
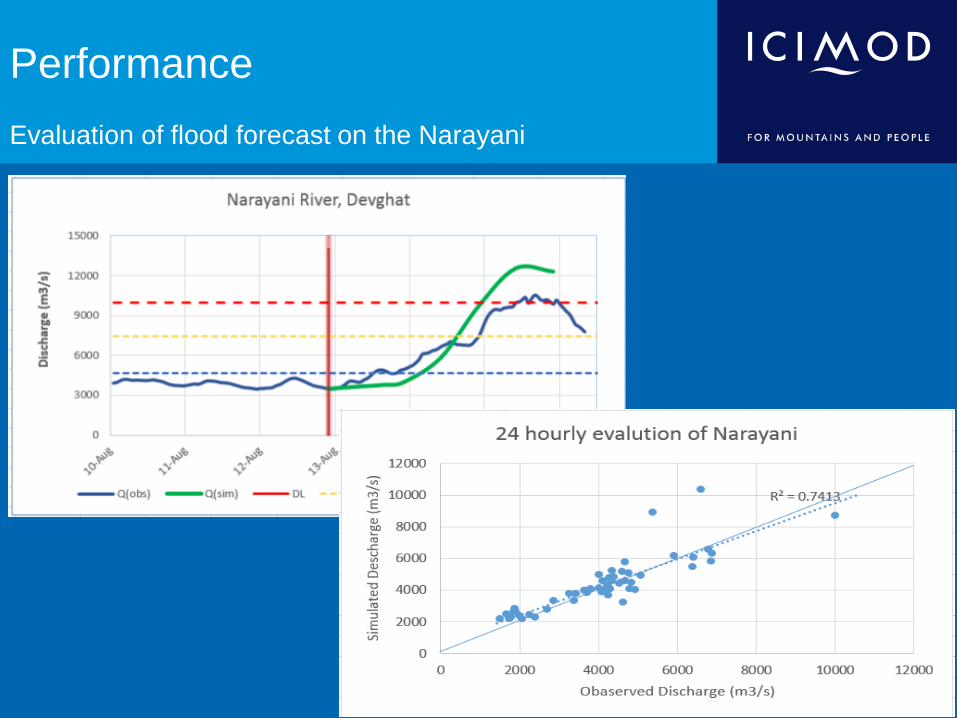
Performance
Evaluation of flood forecast on the Narayani
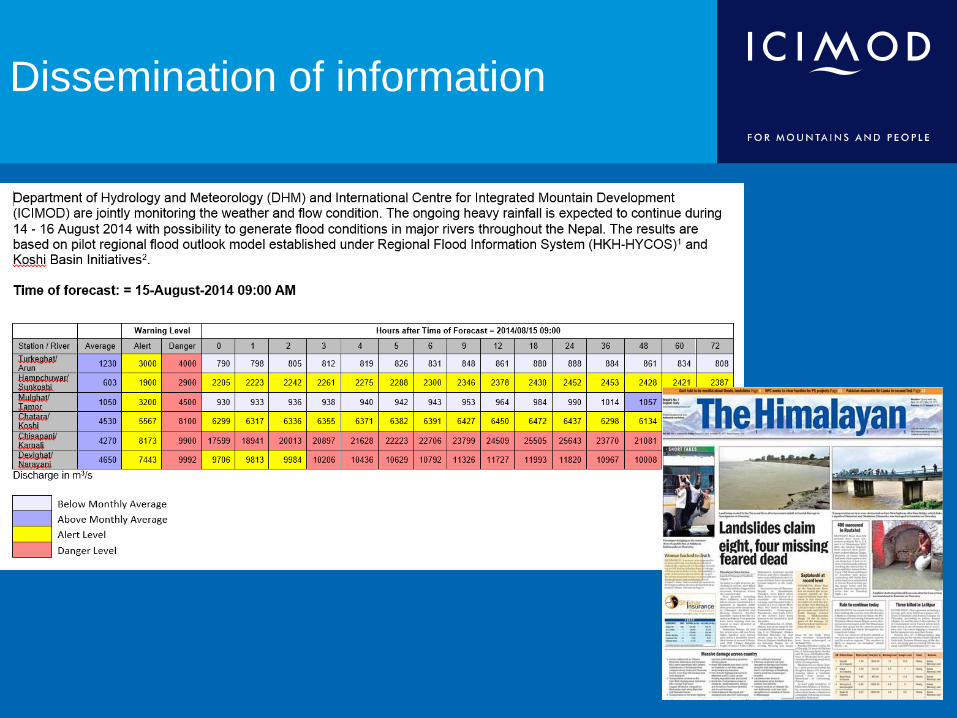
Dissemination of information
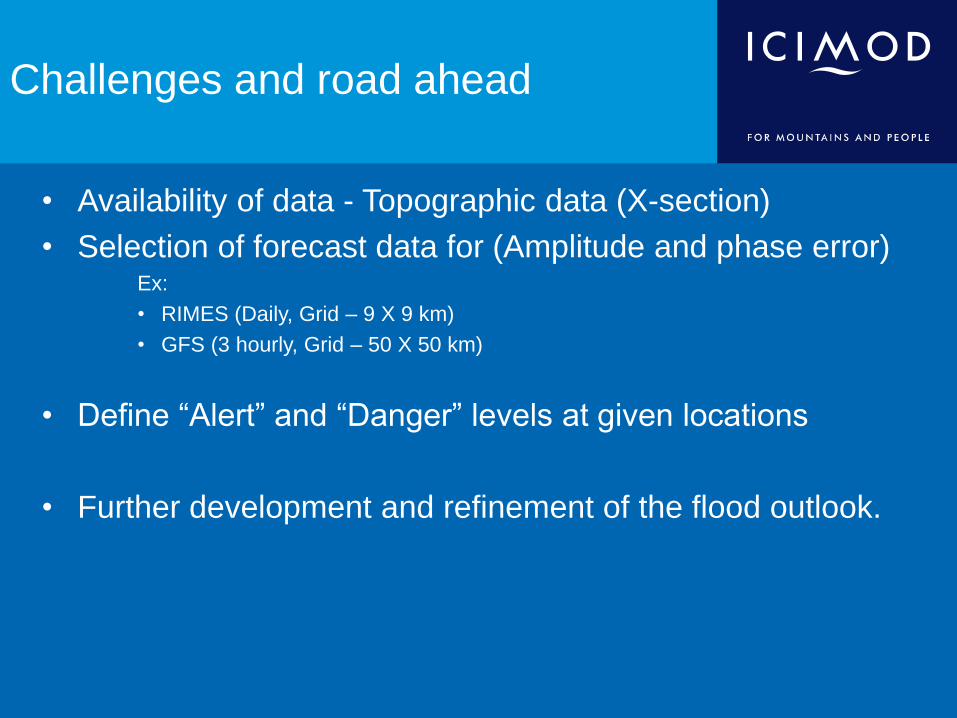
Challenges and road ahead
• Availability of data - Topographic data (X-section)
• Selection of forecast data for (Amplitude and phase error) Ex:
• RIMES (Daily, Grid – 9 X 9 km)
• GFS (3 hourly, Grid – 50 X 50 km)
• Define “Alert” and “Danger” levels at given locations
• Further development and refinement of the flood outlook.
Thank you