Embed Size (px)
Citation preview
8/7/2019 Manned Spaceflight Experiments Gemini 10 Mission Interim Report
http://slidepdf.com/reader/full/manned-spaceflight-experiments-gemini-10-mission-interim-report 1/146
NATIONAL AERONAUTICS AND SPACE
MSC TA-R-67-1
ADMINISTRATION
INTERIM REPORT
MANNED SPACEFLIGHT EXPERIMENTS
GEMINI X MISSION
JULY 18 - 21, 1966
ll• • •
:i:!:i::::-:::::
%
a_
SCIENCE AND APPLICATIONS DIRECTORATE
MANNED SPACECRAFT CENTER
HOUSTON, TEXAS
8/7/2019 Manned Spaceflight Experiments Gemini 10 Mission Interim Report
http://slidepdf.com/reader/full/manned-spaceflight-experiments-gemini-10-mission-interim-report 2/146
INTERIM REPORT
MANNED SPACEFLIGHT EXPERIMENTS
GEMINI X MISSION
July 18 - 21, 1966
Prepared by: Mission and Data Management Office
Science and Applications Directorate
Approved by :
Wilmot N. Hess
Director
Science and Applications Directorate
NATIONAL AERONAUTICS AND SPACE ADMINISTRATION
Manned Spacecraft Center
Houston, Texas
March 1967
8/7/2019 Manned Spaceflight Experiments Gemini 10 Mission Interim Report
http://slidepdf.com/reader/full/manned-spaceflight-experiments-gemini-10-mission-interim-report 3/146
¢_I _ .__'%
PI_EC.2T.DING PAGE BLANK NOT FL:,,_-_.
CONTENTS
iii
Section
INTRODUCTION ...........................
i. EXPERIMENT M405 (MSC-3), TRIAXIS MAGNETOMETER ........
2. EXPERIMENT M408 (MSC-6), BETA SPECTROMETER ..........
3. EXPERIMENT M409 (MSC-7), BREMSSTRAHLUNG SPECTROMETER .....
4. EXPERIMENT M410 (MSC-8), COLOR PATCH PHOTOGRAPHY .......
5. EXPERIMENT M412 (MSC-12), LANDMARK CONTRAST MEASUREMENTS . . .
6. EXPERIMENT S001 (S-I), ZODIACAL LIGHT PHOTOGRAPHY ......
7. EXPERIMENT S005 (S-5), SYNOPTIC TERRAIN PHOTOGRAPHY .....
8. EXPERIMENT S006 (S-6), SYNOPTIC WEATHER PHOTOGRAPHY .....
9. EXPERIMENT S010 (S-10), AGENA MICROMETEORITE COLLECTION . . .
10. EXPERIMENT S012 (S-12), MICROMETEORITE COLLECTION ......
11. EXPERIMENT S013 (S-13), ULTRAVIOLET ASTRONOMICAL CAMERA
12. EXPERIMENT S026 (S-26), ION-WAKE MEASUREMENT .........
13. EXPERIMENT D005 (D-5), STAR OCCULTATION NAVIGATION ......
14. EXPERIMENT D010 (D-IO), ION-SENSING ATTITUDE CONTROL .....
DISTRIBUTION LIST ........................
Page
i
9
21 v _
37 _J/
49 _J
55
59 _-
63 _,-
73 u/
81 :/
89 c_
97 _Jj
105 /"
i15 /_
125
135

8/7/2019 Manned Spaceflight Experiments Gemini 10 Mission Interim Report
http://slidepdf.com/reader/full/manned-spaceflight-experiments-gemini-10-mission-interim-report 4/146
TABLES
Tables
I
II
6-1
ii-I
EXPERIMENTSONGEMINIX .................
EXPERIMENTFLIGHTPLANFORGEMINIX ...........
PHOTOGRAPHSTAKENDURINGEXPERIMENTS001 (S-I) .....
REVISEDCENSUSOFSTARSONGEMINIX S013 (S-13)FILM
Page
2
4
61
......................... i00
8/7/2019 Manned Spaceflight Experiments Gemini 10 Mission Interim Report
http://slidepdf.com/reader/full/manned-spaceflight-experiments-gemini-10-mission-interim-report 5/146
v
Figure
i-i
1-2
1-3
i-4
1-5
1-6
1-7
2-1
2-2
2-3
2-4
2-5
2-6
3-1
3-2
3-3
3-4
FIGURES
Triaxis magnetometer ..................
Electronics unit ....................
Sensor unit ......................
Boom on test fixture ..................
Measurement of earth magnetic field in South Atlantic
Anomaly .......................
Measured field versus theoretical field ........
Field magnitude at varying altitudes ..........
Beta Spectrometer ...................
Electron detector cross section ............
Detector/analyzer block diagram ............
Pulse height analyzer .................
Program control circuitry ...............
Spectrometer view angle with magnetic field lines versus
relative counting rate ................
Measured average electron spectrum ...........
Predicted decay of artificial electron belt based on
Gemini X data ....................
Bremsstrahlung Spectrometer ..............
Bremsstrahlung Spectrometer block diagram .......
Data processor circuit .................
Relative count-time distributions for
revolution 20 ....................
Page
13
14
15
16
17
18
19
29
3O
31
32
33
B4
35
B6
42
43
44
45
8/7/2019 Manned Spaceflight Experiments Gemini 10 Mission Interim Report
http://slidepdf.com/reader/full/manned-spaceflight-experiments-gemini-10-mission-interim-report 6/146
vi
Figure
3-5
3-6
3-7
4-1
4-2
7-1
7-2
7-3
7-4
7-5
7-6
7-7
8-1
8-2
8-3
8-4
9-1
9-2
9-3
Relative count-time distributions for
revolution 32 .....................
Bremsstrahlung relative countrate-time spectra for
revolution 6 .....................
Bremsstrahlung relative countrate-time spectra for
revolution 34 .....................
Color patch photography experiment equipment ......
Method of photography by spacecraft pilot ........
View to the northeast over the Spanish Sahara and
Morocco ........................
A second view over the Sahara with Hamada du Dra to the
left .........................
View to the southeast over Niger ............
The Rio Grande Delta ..................
The China coast .....................
Southern Formosa ....................
Atolls in the Maldine Islands ..............
Convective cloud patterns of northern South America .
Open polygonal cells, 3 to 6 miles in diameter, formed
over the oceans ....................
Convective activity in a cloud mass over Indian
Ocean .........................
Equatorial cloud condition taken over Sumatra and
Malaya ........................
Agena micrometeorite collection unit before flight . • •
Collection unit after 4-months exposure .........
Macroscopic crater in stainless steel plate (light
micrograph - 500X) ..................
Page
46
47
48
52
53
66
67
68
69
7O
71
72
76
77
78
79
84
85
86
8/7/2019 Manned Spaceflight Experiments Gemini 10 Mission Interim Report
http://slidepdf.com/reader/full/manned-spaceflight-experiments-gemini-10-mission-interim-report 7/146
J
Figure
9-4
9-5
I0-i
10-2
10-3
10-4
ii-i
11-2
11-3
12-1
12-2
12-3
12-4
12-5
13-1
13-2
13-3
13-4
i4-i
Second macroscopic crater in stainless steel plate
(light micrograph - 500X) ..............
The second macroscopic crater stainless steel plate
(scanning electron micrograph - 500X) ........
Mounted micrometeorite collection hardwara ......
Micrometeorite collection unit with one cover
open ........................
Sample slides in second compartment in micrometeorite
collection unit ...................
Sample locations and descriptions ...........
Ultraviolet Astronomical Camera assembly mounted to
spacecraft .....................
Ultraviolet spectra of stars in the Carina-Vela region
of the southern Milky Way ..............
Key chart for figure 11-2 ...............
Placement of ion-wake measurement equipment on
GATV .............. . ..........
General ion-wake profile ...............
An electron detector sensor ..............
View of sensor circuitry ................
Gemini undocking maneuvers for ion-wake
measurements ....................
Star occulation photometer ..............
Telemetry intensity profile of star Vega .......
Telemetry intensity profile of star Arcturus .....
Telemetry intensity profile of star Denebola .....
Location of ion-sensing attitude control
equipment ......................
vii
Page
87
88
92
93
94
95
102
103
104
ii0
iii
112
113
ii4
i2i
122
i23
124
130

8/7/2019 Manned Spaceflight Experiments Gemini 10 Mission Interim Report
http://slidepdf.com/reader/full/manned-spaceflight-experiments-gemini-10-mission-interim-report 8/146
viii
Figure
14-2
14-3
14-4
14-5
Ion-sensing configuration ...............
Ion-sensing attitude control electronics system ....
Comparison of ion attitude yaw angle measurements with
inertial system ...................
Comparison of ion attitude pitch angle measurements
with inertial system ................
Page
131
132
133
134
8/7/2019 Manned Spaceflight Experiments Gemini 10 Mission Interim Report
http://slidepdf.com/reader/full/manned-spaceflight-experiments-gemini-10-mission-interim-report 9/146
INTERIMREPORT
MANNEDSPACEFLIGHTEXPERIMENTS
GEMINIX MISSION
INTRODUCTION
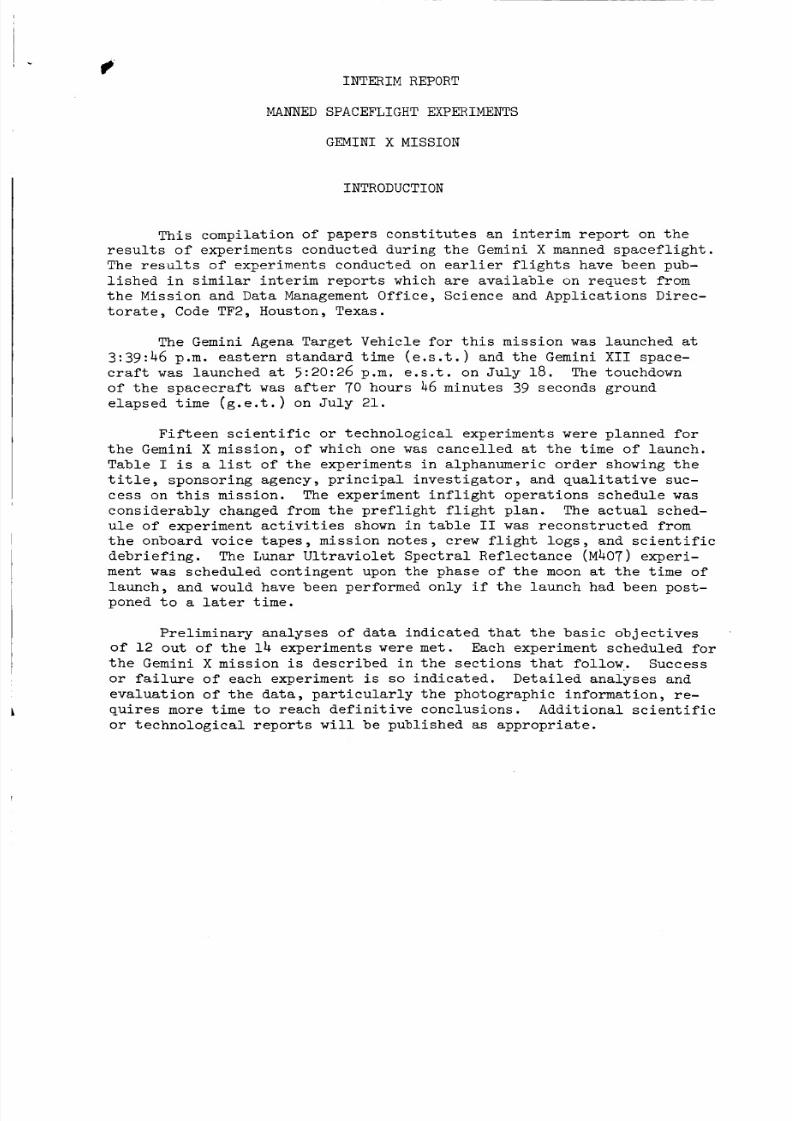
This compilation of papers constitutes an interim report on theresults of experiments conducted during the Gemini X mannedspaceflight.The results of experiments conducted on earlier flights have been pub-lished in similar interim reports which are avaiiW0ie on request fromthe Mission and Data ManagementOffice, Science and Applications Direc-torate, CodeTF2, Houston, Texas.
The Gemini AgenaTarget Vehicle for this mission was launched at3:39:46 p.m. eastern standard time (e.s.t.) and the Gemini XII space-craft was launched at 5:20:26 p.m, e.s.t, on July 18. The touchdownof the spacecraft was after 70 hours 46 minutes 39 seconds groundelapsed time (g.e.t.) on July 21.
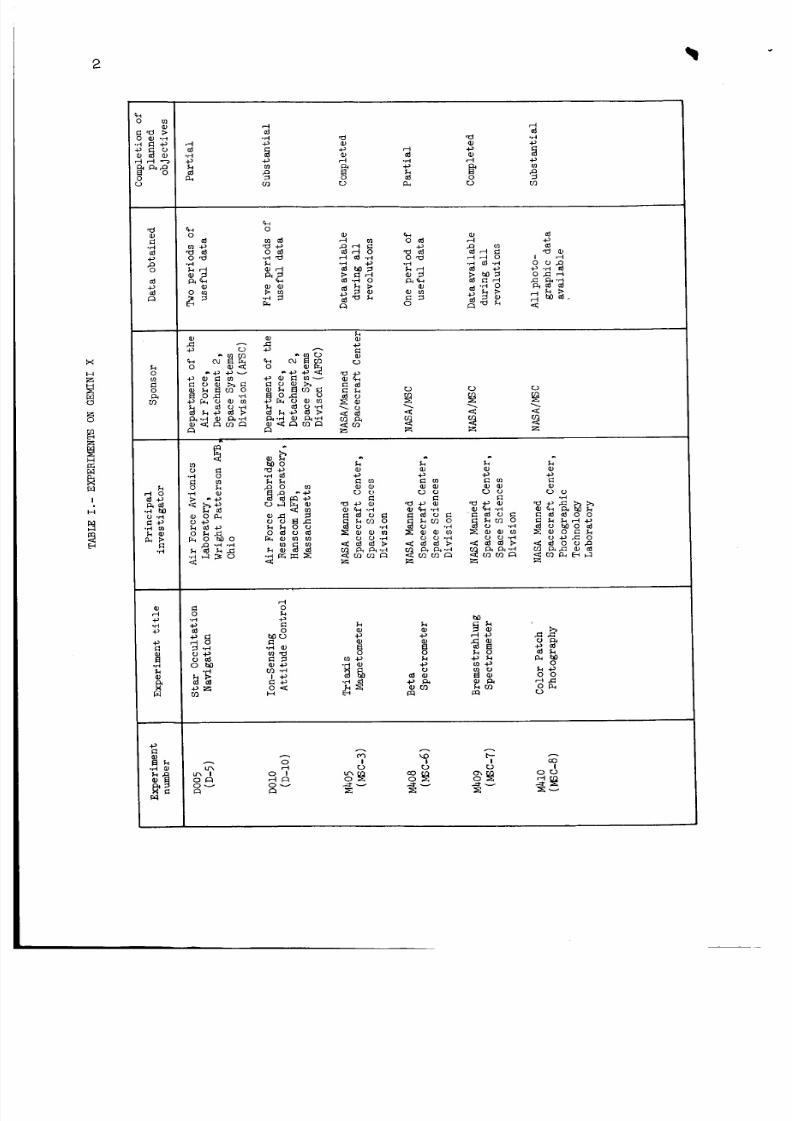
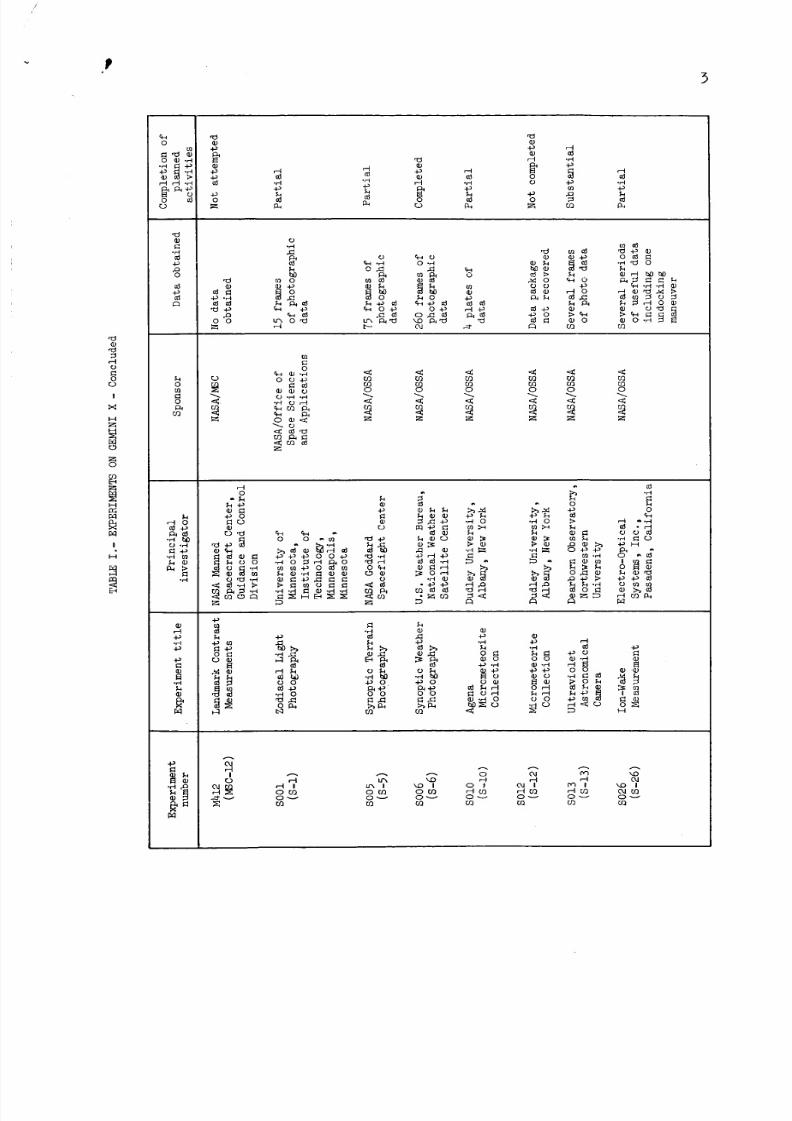
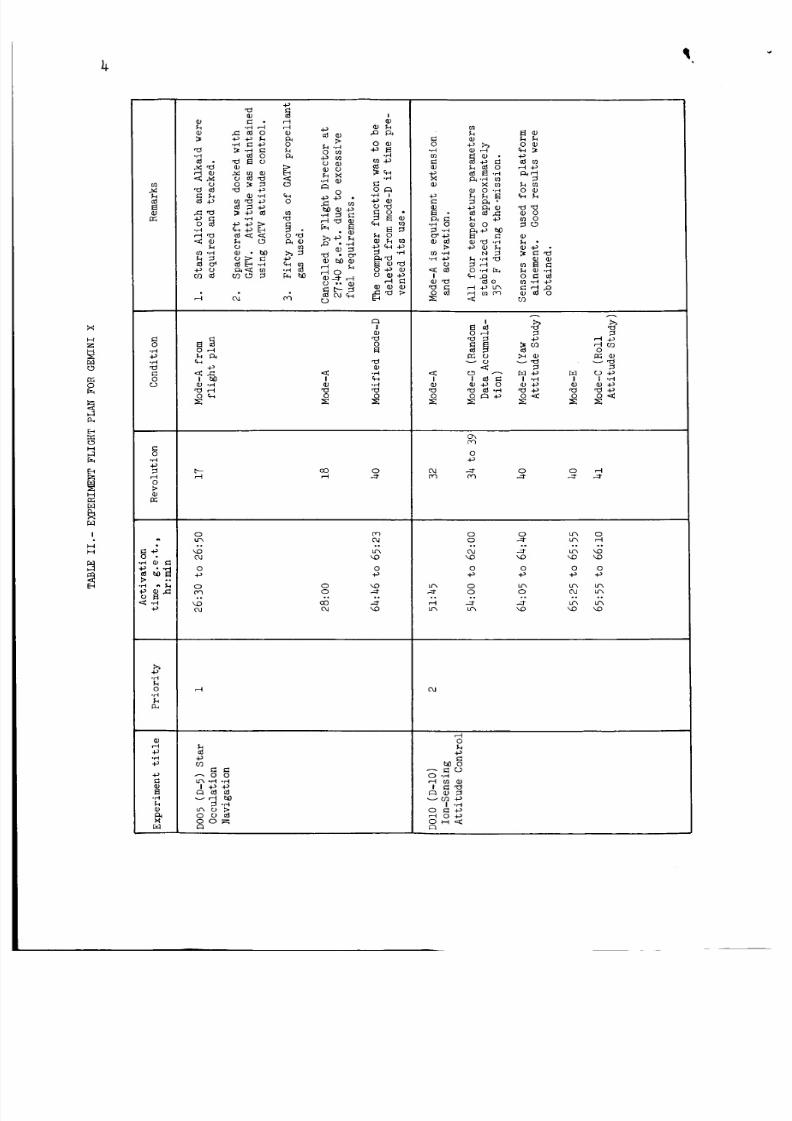
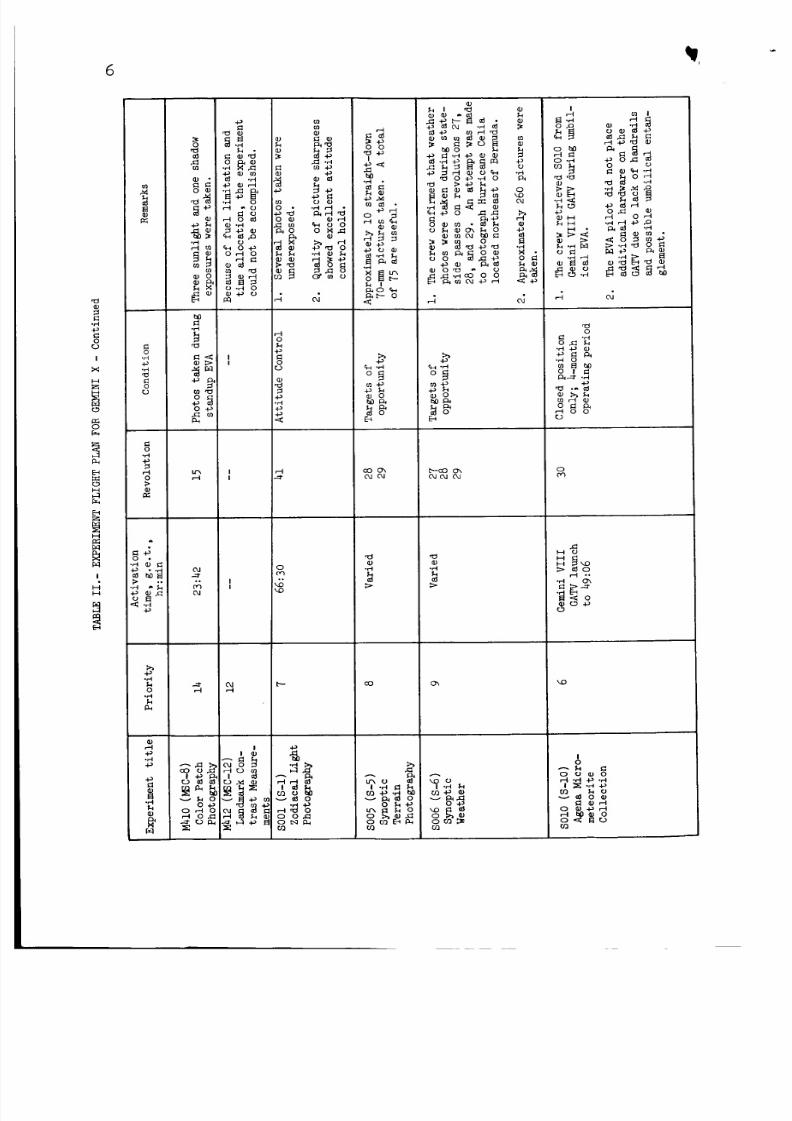
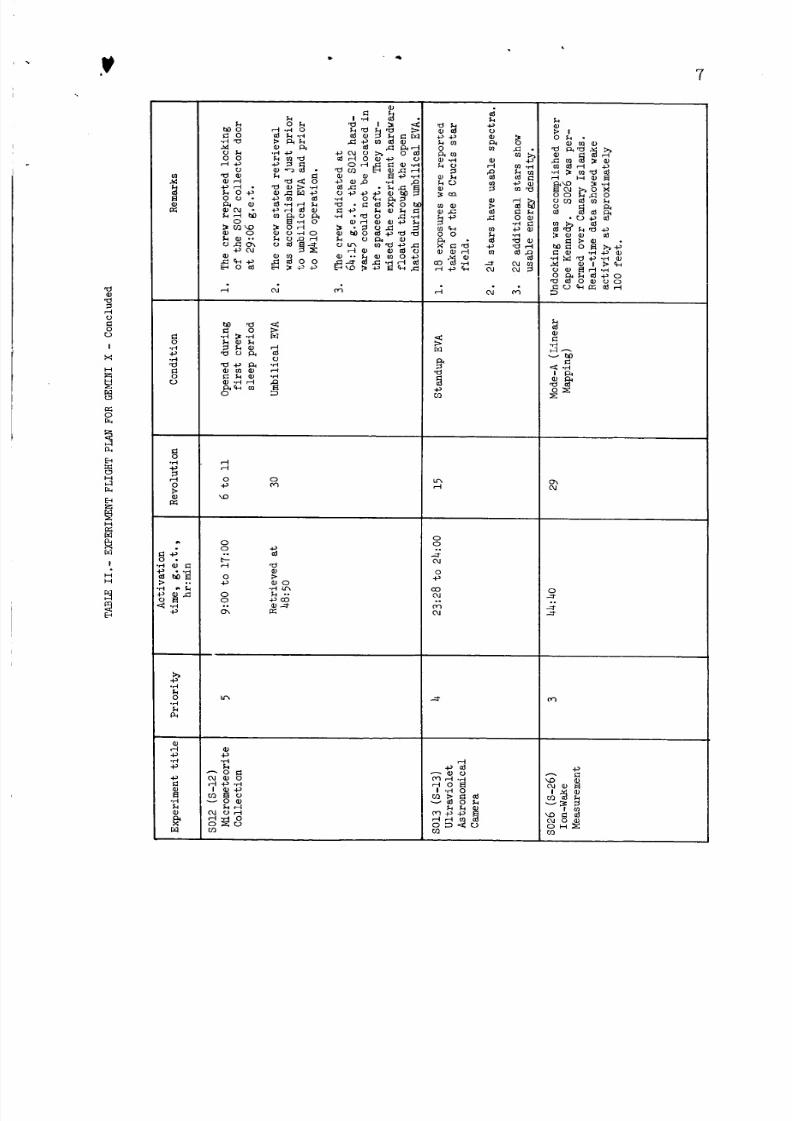
Fifteen scientific or technological experiments were planned forthe Gemini X mission, of which one wascancelled at the time of launch.Table I is a list of the experiments in alphanumeric order showing thetitle, sponsoring agency, principal investigator, and qualitative suc-cess on this mission. The experiment inflight operations schedule wasconsiderably changedfrom the preflight flight plan. The actual sched-
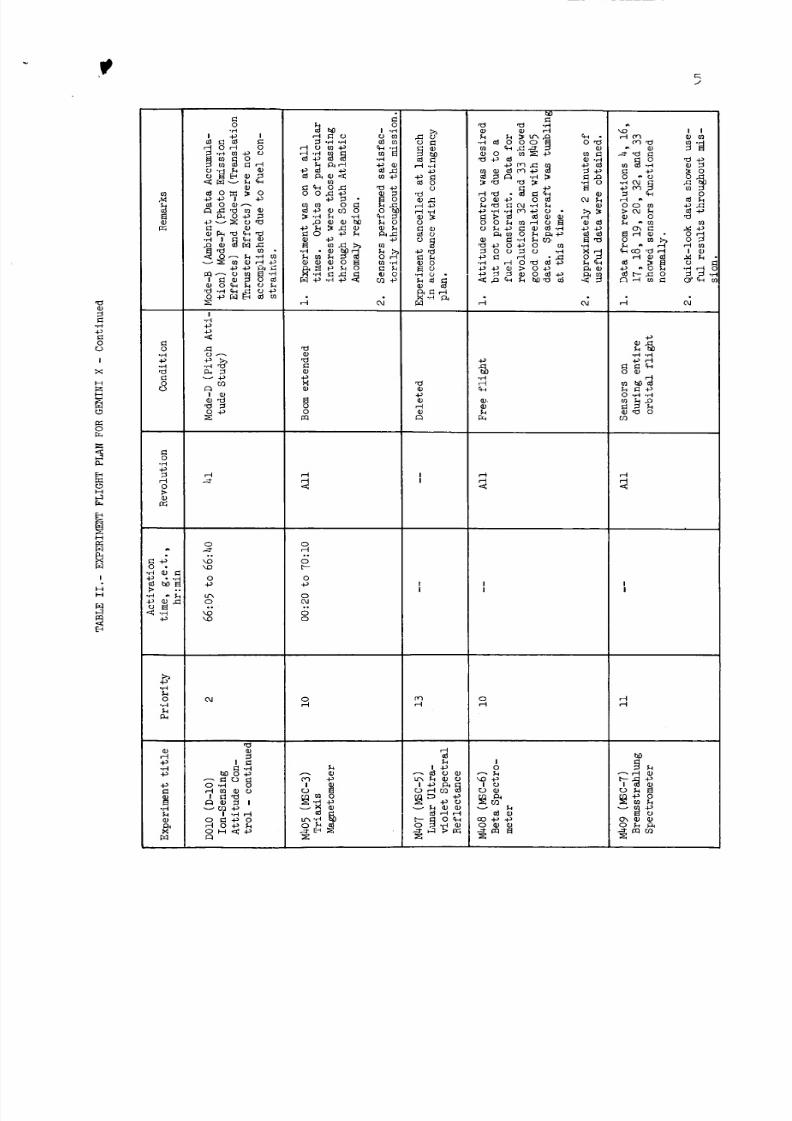
ule of experiment activities shownin table II was reconstructed fromthe onboard voice tapes, mission notes, crew flight logs, and scientificdebriefing. The Lunar Ultraviolet Spectral Reflectance (M407) experi-ment was scheduled contingent upon the phase of the moonat the time oflaunch, and would have been performed only if the launch had been post-poned to a later time.
Preliminary analyses of data indicated that the basic objectivesof 12 out of the 14 experiments were met. Each experiment scheduled forthe Gemini X mission is described in the sections that follow. Successor failure of each experiment is so indicated. Detailed analyses and
evaluation of the data, particularly the photographic information, re-quires more time to reach definitive conclusions. Additional scientificor technological reports will be published as appropriate.
8/7/2019 Manned Spaceflight Experiments Gemini 10 Mission Interim Report
http://slidepdf.com/reader/full/manned-spaceflight-experiments-gemini-10-mission-interim-report 10/146
o _;
0 I1) .H -_I•_1 I _- t_ ,--I -_
oH I1)
0 P._
I1)
Q),--t
0
_.)
,--t
+_if/
r_
,_1 _-_ 00
,_1 _ 0 (If 0
.I_ 0 _1 ._ ,_I ,-I _ .H
p_ _._ _ _.,-I 0
0 _1
,'_ _1O_
0
•r-I I_I"H
113
-p
l _-I
_ _'_
<
I
I-I
0
0
D_
,-I 0_.._
•el _1% I1)
©
_°°._ _ _o.. _o
c)
< <
c)
_ _o•_ o ._ c_
O_ o,._
•
m
C) o
o o .,_
P_.H
-p
._ _ _'_
+._m
0 0 -H
r_ r.Q
r...p o
_J o bOO _1
_o
_ ._ 4_
.p 0
•H 0 I_ _-_
-p_ O<
i.-,
{,.}+_
.,-I
}-i
.p
-p
bO
,.-I-P
pCI
P-I bO0
0 0
r_
._ e-I
_ r_ u_ I 0 I
"_1 o_C_ ,-I_
I
r..)
I I
r_ I0 _
8/7/2019 Manned Spaceflight Experiments Gemini 10 Mission Interim Report
http://slidepdf.com/reader/full/manned-spaceflight-experiments-gemini-10-mission-interim-report 11/146
0
0 _
o+_I1;
r-t
0o
0
4._
0_
,-I
.,-I4_
c_P_
.o
+_ _ 0 _ _._
_o _ _o _
4_ -¢-_"H 0 _ 0
o_o _ ._ o_
_-_ o_-_ 0
0 ® O.H E!
'00
,-Io
0
0
I
H
0
0
0 _ _Y__ _ o _ o0 _: "_ "_
o o
M
!
H
,--t
o _
,-_ 0 _o • _,cl -P ._ 0
°H _ _ 0
_;_ _oo_ ° +_oo_ _..o o_ _._ m _-_ 0 _z_ O(H • cl r"l
•,_ o _ ._ _. _ 0_ o r_ _ ._
0
_ _ o•r-I 0 h" r"l ".r'l
•,-4 0
0
r"l _l • •oH
_ _ _ o_o_ _ _ _, _°..
-H _0 ._ _
_ _ 0 -P 0 -P o 0 o
o .,.-I0 00 _ o r'-I
o
_._ _._ _o_ _o_ -_
__ 00_ Or_ Or_ r-'l r..Q• Ov O_ Ov O_
,-I ,-I (_1o..l I ('q ! _ I
,--I O_ ,--I_ OdrJ_O_ O_ O_
8/7/2019 Manned Spaceflight Experiments Gemini 10 Mission Interim Report
http://slidepdf.com/reader/full/manned-spaceflight-experiments-gemini-10-mission-interim-report 12/146
X
0r_
b4
r_
_q
I
N
Et
00
o
_J
0t_
0
0
h@
_,._0 •
4_
O
-p
4_
h
4_
-_. I , '- I r--I _ ¢)¢; ,._ I::Z,
•,'-I _" +'_ 0 ._ ._ 0
_-_ o_ _ o _ _ ._
o
_ o_ '_o o__+_ t_ _J +_ 0
_ _._ _,_ .
O "" (D r-4 _
r..)
o HP_
4_
I bO
0 _-_
[..._
0
OJ
0
4_
0oq
Od
.p
_ 0 0
!
o
I1)
O
_X',D
O
4_
o _o
oJ _
0 0
(D O.r-I 0 (D
._o _ o _ _o
cO _a ,x:J._ _ •
.._ _;_.o __ O .,-,,I_ ,_ • .,-I
_ n:J 0 _._ 4_
_o_ _ _o
<
I
0
°o
oJ
O
4_
bD O
O ,r4
rH 01
,--t o +_
o ,-I
I _ _- I .H
• +_ 0 _+_
0_+_ <_
o
4-)
O
© _ 4 _nc_ n:J 4_
0 0,_
o o _ oo
0 0 0 0
4° 4° 4-) 4 _
o _, _o
',.O
8/7/2019 Manned Spaceflight Experiments Gemini 10 Mission Interim Report
http://slidepdf.com/reader/full/manned-spaceflight-experiments-gemini-10-mission-interim-report 13/146
.M
0
O
I
H
O
e_
5
r_
r_
i
H
00
O
r'-I 0 ,-H 0
_ O_ _ O
c_
0 D_0
_,_
e-,
o
:_'_ ._
<._ ,_-I_ '.D
O o4
_0_o:_-_ ._._o _o
_ "_N,• , .- I _
0
,--I o _ 4.a
oo_ _o_i_ o _ _o_i __.I _ ©D_ 0
•._ ._ _o_ }_
_o _ _: _
°r-t ° I1)O
_ °
O"_
I1)m r,
•_ o
H
I1)
I1)
O
_q
,-.-I
o,--t
O
o
°.
O
o
O,-.-I
o_._ _
_._ _
ID
ID
©
C_
,--I
,-I
_ N @ ID
._ _ o__o_'_
0 _+ _ 0 _
0 N m_l o
I;:__ 0 _ p_4-_
4a
°H
_4
¢)
,--t,--I
0'--I
I0
4a
,-.t c_
_.o0 * 0
Oo m
II) o
% * r/l
_ _) •
,-.-I I1) i_1
gm_
,--t
_ N3_
o_._
_ n:21 or_
,-I
,--t,-.-I
t_0
_r-t @
o .o_o
0 _ _
I I
_'_
O
•O .1:::
_ m
•_ __ _._
8/7/2019 Manned Spaceflight Experiments Gemini 10 Mission Interim Report
http://slidepdf.com/reader/full/manned-spaceflight-experiments-gemini-10-mission-interim-report 14/146
6
.H4_
0
I
X
H
O
r._
E-I
I
o
.H
,'0
o
rj
o
o
P
,.._ ..i.a0 •
_: _ . ,- t4o
O
,'--t
.H
4._
.H
_ •
.el
o_ 0
_ _._o _
N)
,O
P,I
r't
_o
I
(1)
,%
,.-IO
..la
O
4o
,'-'1
OOr)
,Z'.D
4-_
O _
40
CO 4_
+_
g_
m _H O O
O O
I
4o_
CQ _ •
_0o ._
o_-_ ..I.a o .._ ,-_ ,__
_o_,_ ._'_
o_
o,-I0ra_
°rt%
4")
%
I
,-t.el
bll
.H
H
H
ml
_ "_
0 0 _,_
d
_J 4_4.a o ¢_
% I
+)
o_
-O %
coO',
o4 (Xl
I .H _ _
D_ .t.) .rt
_o_
m
.c: _,--I co +_o r. t
4_
o__4 _
(1) O
0.10.I t_
kO o
I.H
om_
@ .o
O
_ '_,
•el O
O ! "_
4")
OP_3
H_
_ _o
e-I °°
I0
0 ¢J _) 0
_ _I O __I ¢.) ,--I
8/7/2019 Manned Spaceflight Experiments Gemini 10 Mission Interim Report
http://slidepdf.com/reader/full/manned-spaceflight-experiments-gemini-10-mission-interim-report 15/146
"d¢J,-I0C.)
IXI.-I
0
r_
fl,
I
I-.-iH
[-.-i
0
0r_
,-.-I
0
•H ¢# l=l
,r-I
0 _
•._ _o_ .__ o_o o _o -_ _ o_._o _I I} . .' -I
,--I 4-_ •
0 0
0
¢} 0
If# ..0 .-_ OX
" I' _ 0 .I
g_g
_o_ _o_0 -,-I 0
oJ _4
0
o
_ _ ¢} .,_
o_
,-.-I,-t
0 0
0
b.-,--t ,_
4_ II/0
._ aa0 o°
°o _) -.::t
r_
+_
u_
_0 _-I_! ¢.I 0
v 0 I1}
e,l 0 r-I
g_8
00
0
co
(xl.°
4_o
_0 0 _ •
,--I 0"_I ,,-I 0
_o_
o ::::) ._ _.)
,._ 0 ¢;
.,.-I
m
_ o ® 00
D
0,1
f¢3
v_,_
T
8/7/2019 Manned Spaceflight Experiments Gemini 10 Mission Interim Report
http://slidepdf.com/reader/full/manned-spaceflight-experiments-gemini-10-mission-interim-report 16/146
PP,ECEDING PAGE BLANK NOT FILMEr2
i. EXPERIMENT M405 (MSC-3), TRIAXIS MAGNETOMETER
By William Dan Womack
NASA Manned Spacecraft Center
N 6 8- 1 4 ! 5 1
Knowledge of the magnetic field magnitude amd direction is most im-
portant for the evaluation of chargedparticle measurements, especially
where directional instrumentation is employed. Due to the directional-
ity of charged particles within magnetic fields, the measurement of those
particles becomes impossible when employing a directional measuring in-
strument without determining the direction of the magnetic field lines.
This report provides a description of the triaxis magnetometic ex-
perimental equipment and operation, and the experimental results obtained
from the Gemini Titan i0 (GT-IO) spacecraft. The results discussed are
based solely on data which were evaluated when this report was compiled.
OBJECTIVE
The object was to determine the direction and magnitude of the
earth's geomagnetic field in the South Atlantic Anomaly regions with re-
spect to experiment M408 (MSC-6). Experiment M408 (MSC-6), described in
section 2 of this report, consisted of a beta spectrometer, with a half-
angle of 15 ° , attached to the GT-IO spacecraft. The experiment M408
(MSC-6) was to determine the flux of charged particles external to space-
craft. The South Atlantic Anomaly region is between South America and
Africa. This region, bounded approximately by 30 ° E and 60 ° W longitude
and 15 ° S and 50 ° S latitude, is the only portion of the spacecraft tra-
jectory that presents any significant electron intensities.
EQUIPMENT
The experimental equipment consisted of the triaxis magnetometer and
an extendible boom.
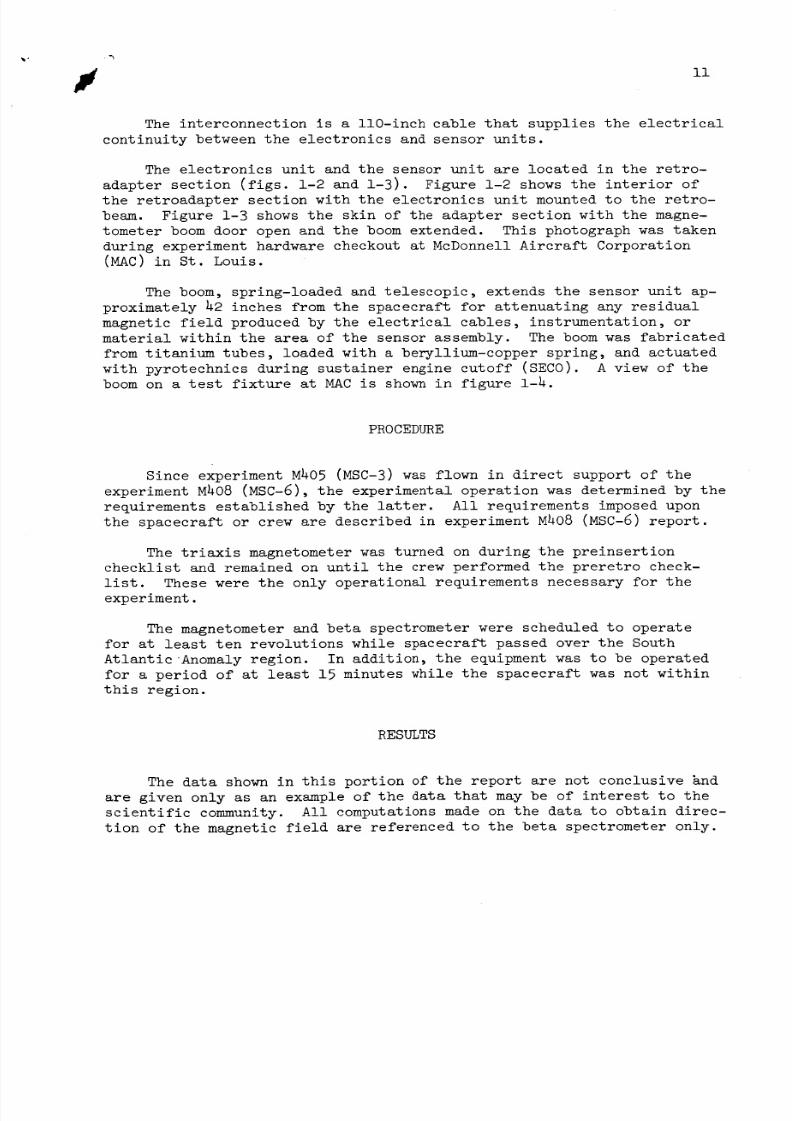
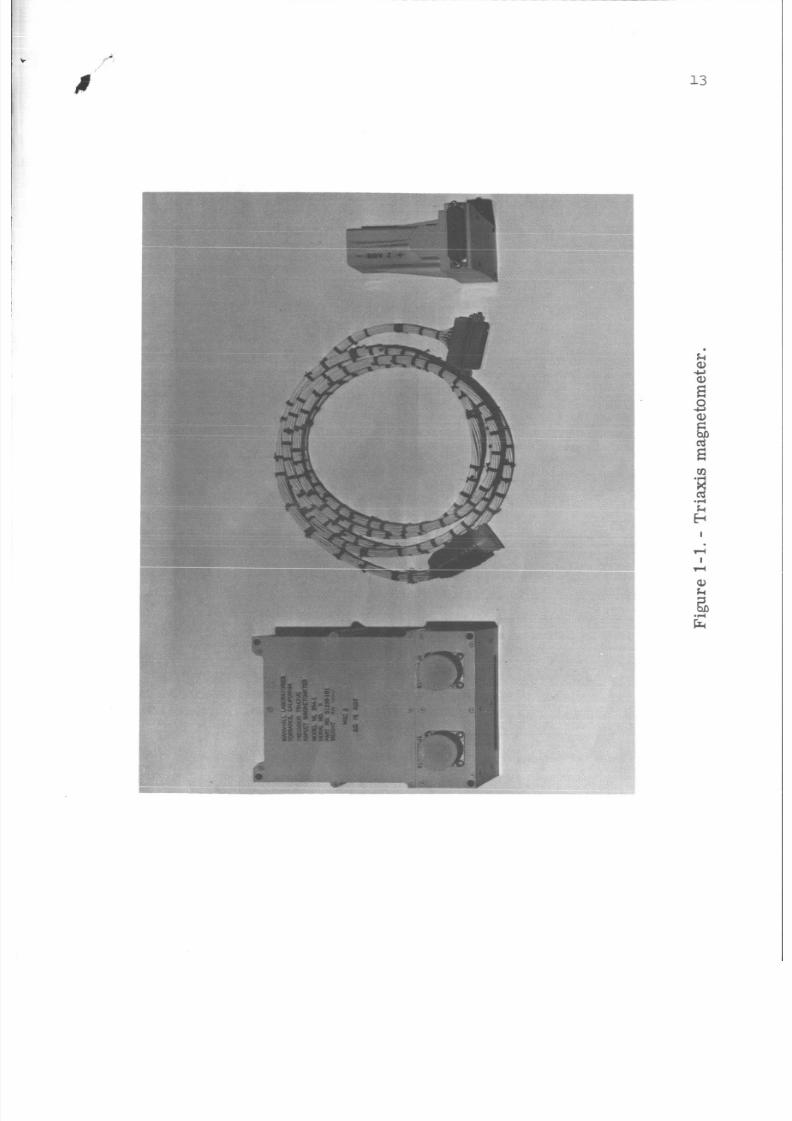
The triaxis magnetometer was a flux-gate variety which included an
electronic package, a sensor unit, and an interconnecting cable
(fig. l-l).
8/7/2019 Manned Spaceflight Experiments Gemini 10 Mission Interim Report
http://slidepdf.com/reader/full/manned-spaceflight-experiments-gemini-10-mission-interim-report 17/146
i0
The electronic package contained a dc-to-dc converter and threeelectronic subassemblies which supplied the necessary sensor-drive volt-ages, detected and transformed the vector field ac second-harmonic sig-nals, and converted these signals to a O- to 5-volt analog dc signal.
The sensor unit contains three identical second-harmonic sensorswhich have a core material driven into saturation by a 15-kc signalthrough a primary winding. A secondary winding obtains the second-harmonic frequency whenan external field is applied, and an auxiliarywinding nulls the residual field. The three sensor probes are mountedorthogonally in one package.
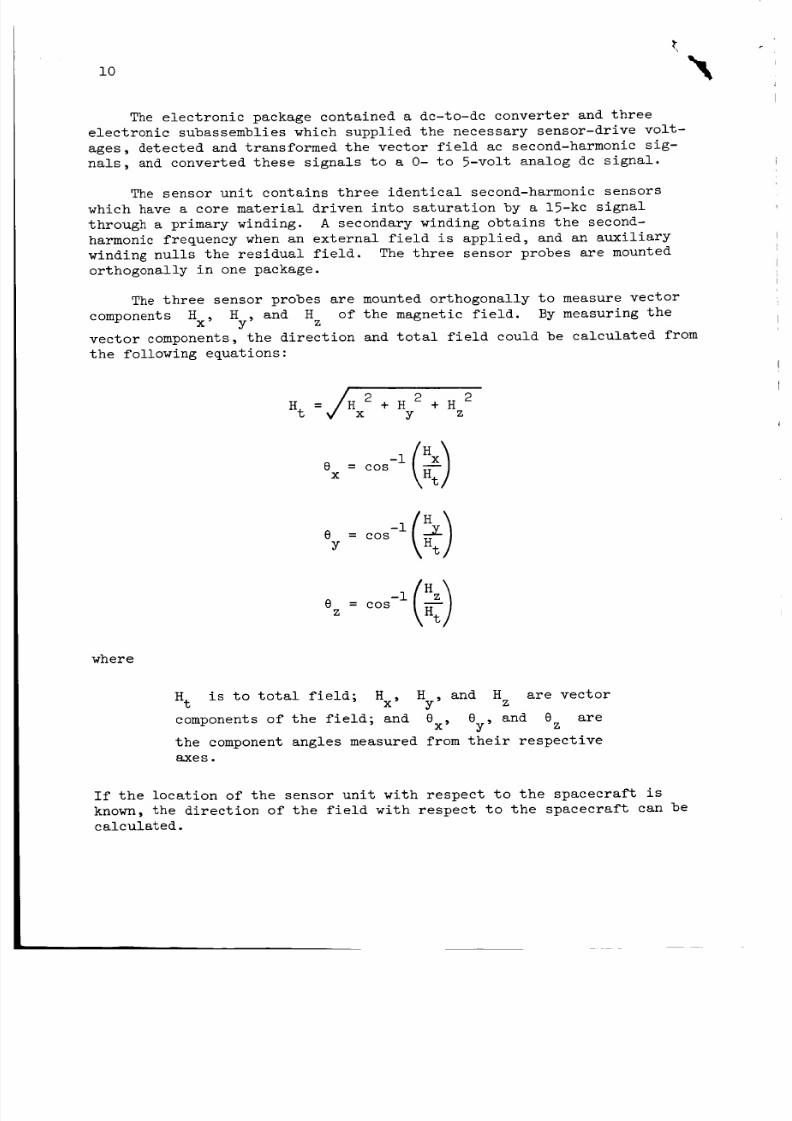
Thethree sensor probes are mounted orthogonally to measurevector
components Hx, Hy, and Hz of the magnetic field. By measuring thevector components, the direction and total field could be calculated from
the following equations:
Ht =/_/Hx2 + H 2 + H2
y z
where
Ht is to total field; Hx, Hy, and Hz are vectore, and e arecomponents of the field; and Qx' y z
the component angles measured from their respective
aD(es.
If the location of the sensor unit with respect to the spacecraft is
known, the direction of the field with respect to the spacecraft can be
calculated.
8/7/2019 Manned Spaceflight Experiments Gemini 10 Mission Interim Report
http://slidepdf.com/reader/full/manned-spaceflight-experiments-gemini-10-mission-interim-report 18/146
#ll
The interconnection is a ll0-inch cable that supplies the electrical
continuity between the electronics and sensor units.
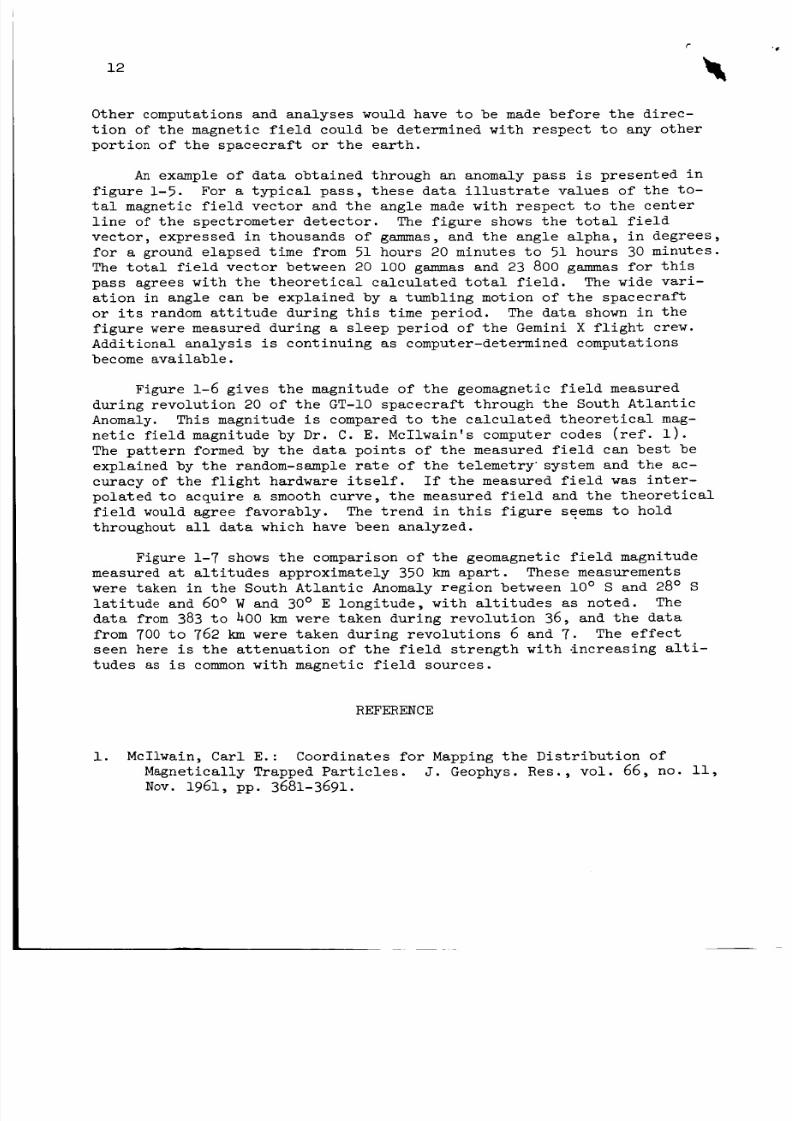
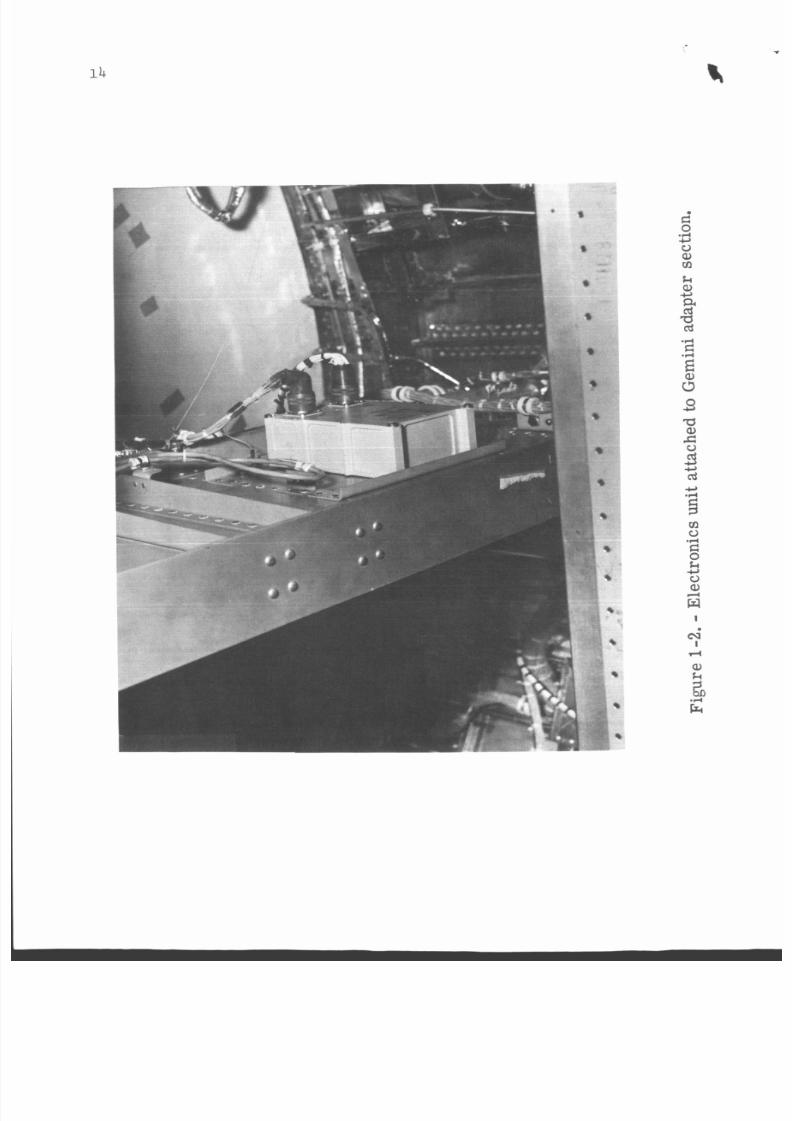
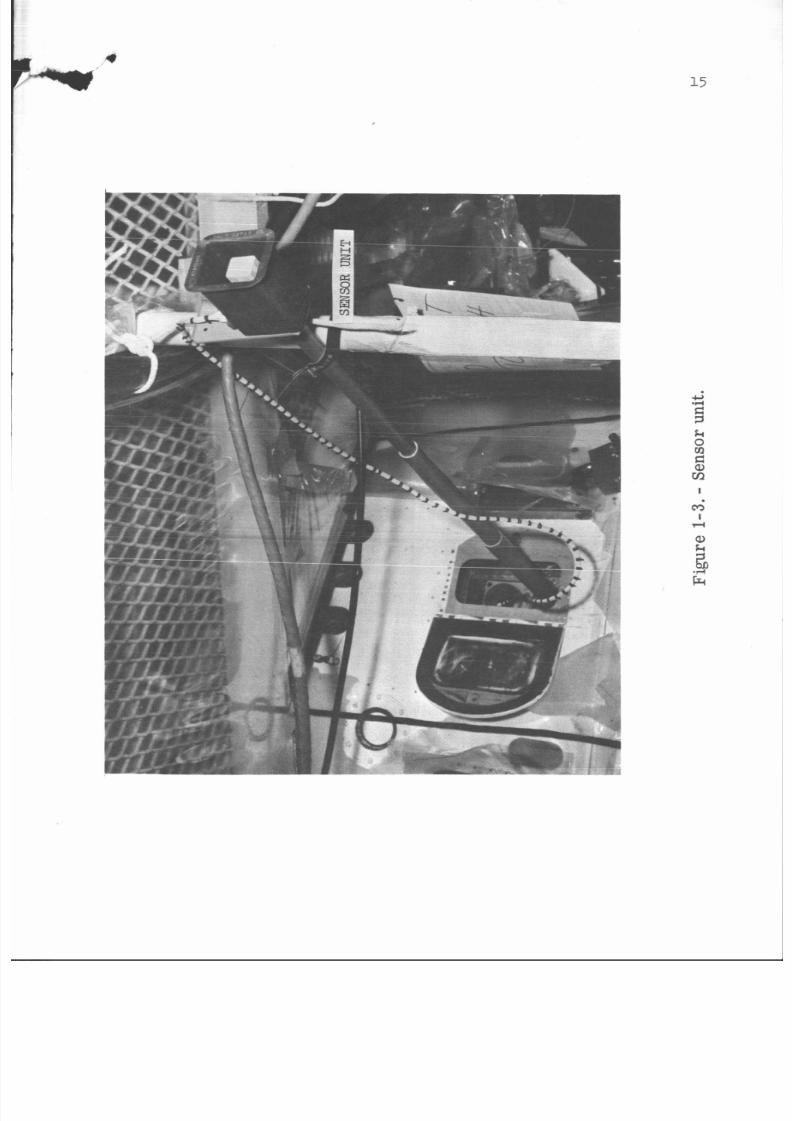
The electronics unit and the sensor unit are located in the retro-adapter section (figs. 1-2 and 1-3). Figure 1-2 shows the interior of
the retroadapter section with the electronics unit mounted to the retro-
beam. Figure 1-3 shows the skin of the adapter section with the magne-
tometer boom door open and the boom extended. This photograph was taken
during experiment hardware checkout at McDonnell Aircraft Corporation
(MAC) in St. Louis.
The boom, spring-loaded and telescopic, extends the sensor unit ap-
proximately 42 inches from the spacecraft for attenuating any residual
magnetic field produced by the electrical cables, instrumentation, or
material within the area of the sensor assembly. The boom was fabricated
from titanium tubes, loaded with a beryllium-copper spring, and actuated
with pyrotechnics during sustainer engine cutoff (SECO). A view of the
boom on a test fixture at MAC is shown in figure 1-4.
PROCEDURE
Since experiment M405 (MSC-3) was flown in direct support of the
experiment M408 (MSC-6), the experimental operation was determined by the
requirements established by the latter. All requirements imposed upon
the spacecraft or crew are described in experiment M408 (MSC-6) report.
The triaxis magnetometer was turned on during the preinsertion
checklist and remained on until the crew performed the preretro check-
list. These were the only operational requirements necessary for the
experiment.
The magnetometer and beta spectrometer were scheduled to operate
for at least ten revolutions while spacecraft passed over the South
AtlanticAnomaly region. In addition, the equipment was to be operated
for a period of at least 15 minutes while the spacecraft was not within
this region.
RESULTS
The data shown in this portion of the report are not conclusive _nd
are given only as an example of the data that may be of interest to the
scientific cor_munity. All computations made on the data to obtain direc-
tion of the magnetic field are referenced to the beta spectrometer only.
8/7/2019 Manned Spaceflight Experiments Gemini 10 Mission Interim Report
http://slidepdf.com/reader/full/manned-spaceflight-experiments-gemini-10-mission-interim-report 19/146
12
Other computations and analyses would have to be madebefore the direc-tion of the magnetic field could be determined with respect to any otherportion of the spacecraft or the earth.
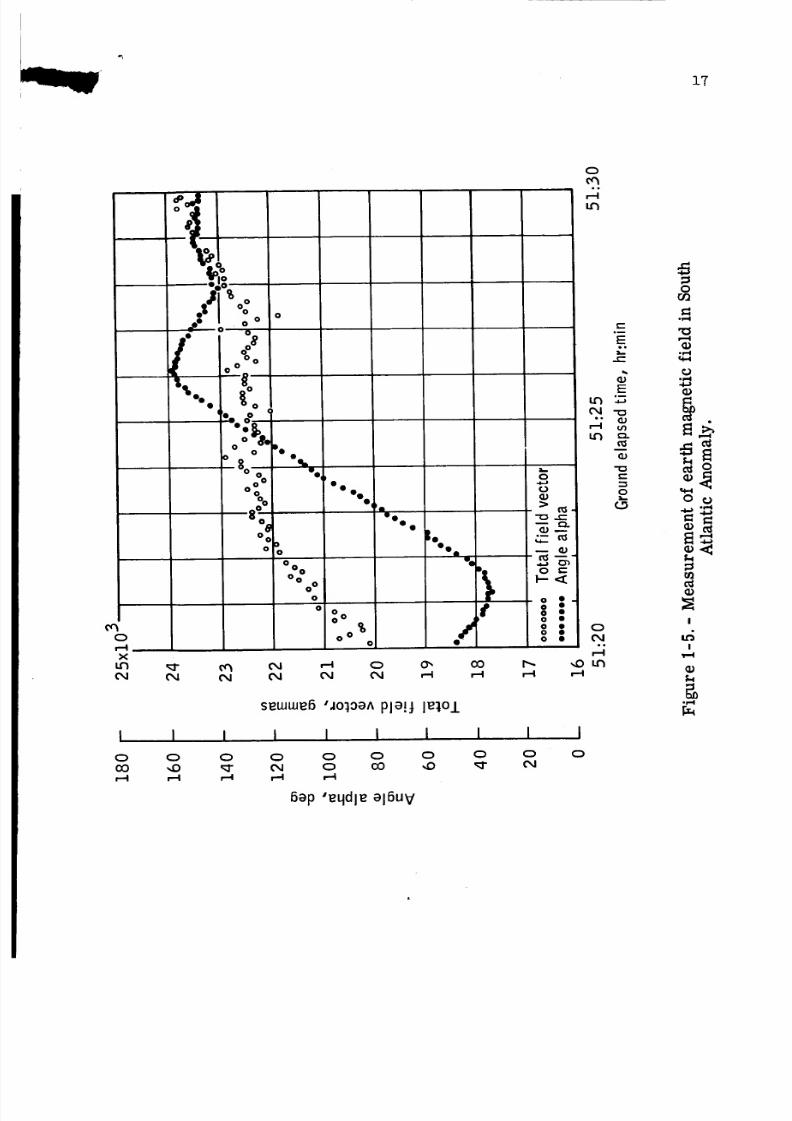
An exampleof data obtained through an anomaly pass is presented infigure 1-5. For a typical pass, these data illustrate values of the to-tal magnetic field vector and the angle madewith respect to the centerline of the spectrometer detector. The figure showsthe total fieldvector, expressed in thousands of gammas,and the angle alpha, in degrees,for a ground elapsed time from 51 hours 20 minutes to 51 hours 30 minutes.The total field vector between 20 100 gammasand 23 800 gammasfor thispass agrees with the theoretical calculated total field. The wide vari-ation in angle can be explained by a tumbling motion of the spacecraftor its randomattitude during this time period. The data shown in thefigure were measuredduring a sleep period of the Gemini X flight crew.
Additional analysis is continuing as computer-determined computationsbecomeavailable.
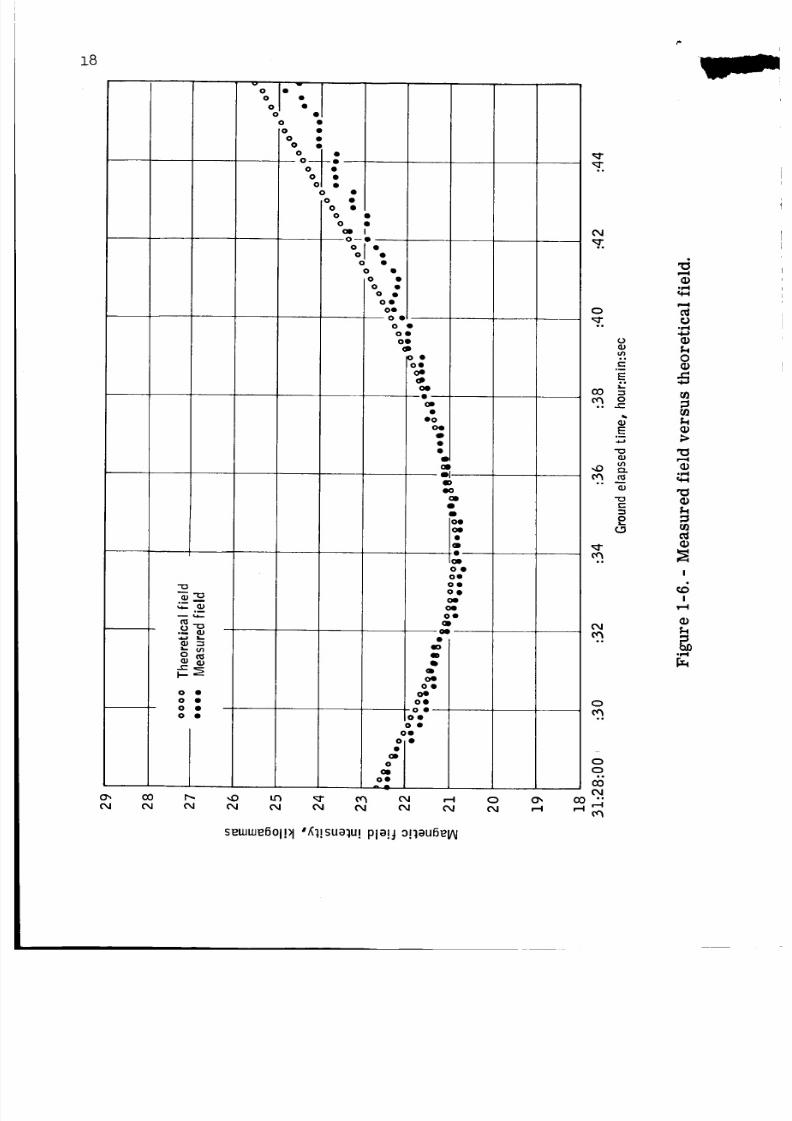
Figure 1-6 gives the magnitude of the geomagnetic field measuredduring revolution 20 of the GT-IO spacecraft through the South AtlanticAnomaly. This magnitude is comparedto the calculated theoretical mag-netic field magnitude by Dr. C. E. McIlwain's computer codes (ref. 1).The pattern formed by the data points of the measured field can best beexplained by the random-samplerate of the telemetry system and the ac-curacy of the flight hardware itself. If the measured field was inter-polated to acquire a smooth curve, the measuredfield and the theoretical
field would agree favorably. The trend in this figure seemsto holdthroughout all data which have been analyzed.
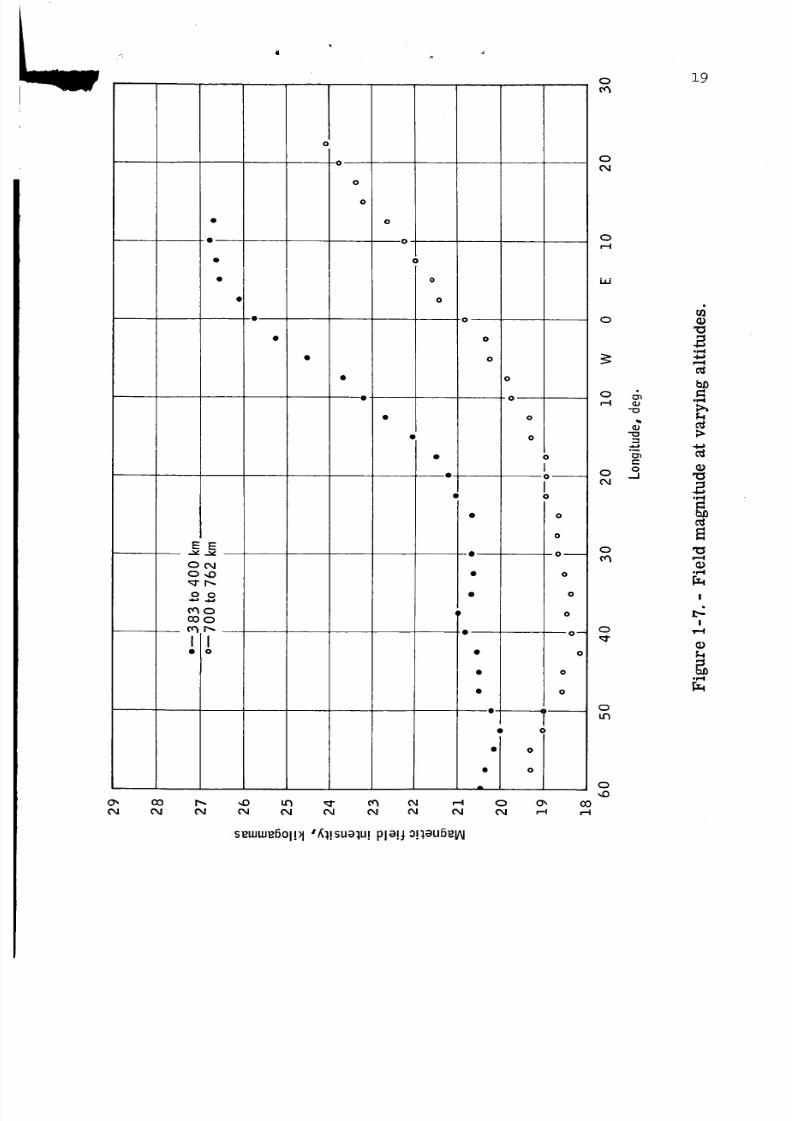
Figure 1-7 shows the comparison of the geomagnetic field magnitudemeasuredat altitudes approximately 350 km apart. Thesemeasurementswere taken in the South Atlantic Anomalyregion between lO° S and 28° Slatitude and 60° W and 30° E longitude, with altitudes as noted. Thedata from 383 to 400 kmwere taken during revolution 36, and the datafrom 700to 762 kmwere taken during revolutions 6 and 7. The effectseen here is the attenuation of the field strength with increasing alti-tudes as is commonwith magnetic field sources.
REFERENCE
l. McIlwain, Carl E.: Coordinates for Mapping the Distribution of
Magnetically Trapped Particles. J. Geophys. Res., vol. 66, no. ll,
Nov. 1961, pp. B681-3691.
8/7/2019 Manned Spaceflight Experiments Gemini 10 Mission Interim Report
http://slidepdf.com/reader/full/manned-spaceflight-experiments-gemini-10-mission-interim-report 20/146
13
ka,
a,
0
a,Gbn
cd
c,
E4 2
E
8/7/2019 Manned Spaceflight Experiments Gemini 10 Mission Interim Report
http://slidepdf.com/reader/full/manned-spaceflight-experiments-gemini-10-mission-interim-report 21/146
.14
--
8/7/2019 Manned Spaceflight Experiments Gemini 10 Mission Interim Report
http://slidepdf.com/reader/full/manned-spaceflight-experiments-gemini-10-mission-interim-report 22/146
4
,
w
15

8/7/2019 Manned Spaceflight Experiments Gemini 10 Mission Interim Report
http://slidepdf.com/reader/full/manned-spaceflight-experiments-gemini-10-mission-interim-report 23/146
16
f
i i -1I -I
Figure 1 -4 . - Boom on test fixture.
8/7/2019 Manned Spaceflight Experiments Gemini 10 Mission Interim Report
http://slidepdf.com/reader/full/manned-spaceflight-experiments-gemini-10-mission-interim-report 24/146
17
(q0
x
0,1
" _ 0
/%o0 000
/" 4o o
cq
oo
o
8o
o:°
$ o0o o
O
I I I
0 0 0cO ,.0
_ T--I
Do
Oo o
°O oO
o
0
o o
O00q Pdl
UO0 •
0
o o
%o o
o
|O
O01
%
/.-I 0 12, O0 I'_O,,J ('_ ,-I _ r-I
s_ww_6 ',ioloa^ pla!J l_10J.
I I I I
0 0 0 0Oq 0 cO ,,0.--I
6ap "ettdle al6UV
O°o
e-i
i.n
113
O
>
•-_ e-
_m
l_ o _-o •
¢ S"o •
o •
.,
,Din
I I I
O O O,_- C,I
e-o_
E
o.
E°_
e--
2
Or_
,P,,I
°P,,I
_ O
O _
I
I
.r,,I
8/7/2019 Manned Spaceflight Experiments Gemini 10 Mission Interim Report
http://slidepdf.com/reader/full/manned-spaceflight-experiments-gemini-10-mission-interim-report 25/146
18
°B
-£:
0 •
0 •0 •
0 ¢)
o .0
0 •
0 •
J°\-..tb
O •
O I,
O •
O •
O I
O
O
O--Q
0 •
0 •
0 •
0 g
0 •
O0
O0
00
0 •
O0
O0
0 •
00
oe
00
I
OI
O0
OQ
0
aD
elID
O0
(30
0
O0
O0
OI
0¢)
OI
Oa
0¢)
OO
OQ
O0
I0
IB
Q
Q
O0
OI
O4)
O0
0 •O0
0 •
Oe
0 •
GD
0
O0
,,C) L_ ,q- O_ _ i--I_ _ _ (_ (_
sewwe6OlPl ',_l!sualu! pla!j o!l_ufielAI
0 o_,
(_ r-I
°°
o
°.
()
°.
E..
O0 -_
_o
E
_o o
..
(-,
o
°°
°°
o
°°
oo
,°
co
c_
0(D
'0
c_(D
I
I
8/7/2019 Manned Spaceflight Experiments Gemini 10 Mission Interim Report
http://slidepdf.com/reader/full/manned-spaceflight-experiments-gemini-10-mission-interim-report 26/146
E
0o
I
E
0o
I0
0
0
0
0
0
0
I
0
SELuwEBoIPI ',_l!sualu! pla!J 0!lauBel/_
0
0
Q
0
0
0
0--
0
0
0
0
C_
0
0
0
0
0
0
0
0
0
0
O0
r--I
0c_
0c_
0i--I
LLJ
0
-C3
d.P°_
o
o
o
o
19
0'0
,i--I
°7-1
c_
or-I
c_
'0
c_.r-I
I
I
c_
.f-I
8/7/2019 Manned Spaceflight Experiments Gemini 10 Mission Interim Report
http://slidepdf.com/reader/full/manned-spaceflight-experiments-gemini-10-mission-interim-report 27/146
p[_ECEDING PAGE B_I_I_]:_IOT FIL,V,-....
21
2. EXPERIMENT M408 (MSC-6), BETA SPECTROMETER
By James Marbach
NASA Manned Spacecraft Center
SUMMARY
The beta spectrometer experiment was flown on the Gemini X mission
to determine, together with experiments M405 (MSC-3) and M409 (MSC-7),
the radiation environment both inside and outside the spacecraft through-
out the mission. Its specific purpose was to measure the flux, energy,
and spatial distribution of electrons encountered in the South Atlantic
Anomaly region of the inner Van Allen radiation belt. The equipment uti-
lized semiconductor detectors in a straightforward pulse-height-analyzer
(PHA) design to provide seven channels of flux information over the
energy range 0.41 _ E _ 4.61 MeV. A 15° half-angle collimator allowed
a determination of the directional distribution of the incident radiation.
The data revealed a spectrum similar to those measured on the
Gemini IV and the Gemini VII missions. There is evidence that the elec-
tron directions are almost entirely confined within a plane normal to the
earth's magnetic field direction as has been suggested by previous scien-
tific measurements.
OBJECTIVE
The beta spectrometer experiment flown on the Gemini X mission was
the third in a series of such measurements on Project Gemini. It was de-
signed to determine the radiation environment external to the spacecraft
encountered throughout typical manned earth-orbital missions. The data
from these experiments are necessary to assemble a concise and up-to-date
picture of the environment in order to estimate the radiation hazard to
be encountered on any specific mission. By comparing dose estimates us-ing this environment with actual measured doses made on each flight, a
knowledge of the reliability and accuracy of the mathematical technique
of hazard prediction is realized.
EQUIPMENT
The beta spectrometer is similar in function to the proton-electron
spectrometer for experiment M404, flown on previous Gemini missions;
however, it is quite different in design.
8/7/2019 Manned Spaceflight Experiments Gemini 10 Mission Interim Report
http://slidepdf.com/reader/full/manned-spaceflight-experiments-gemini-10-mission-interim-report 28/146
22
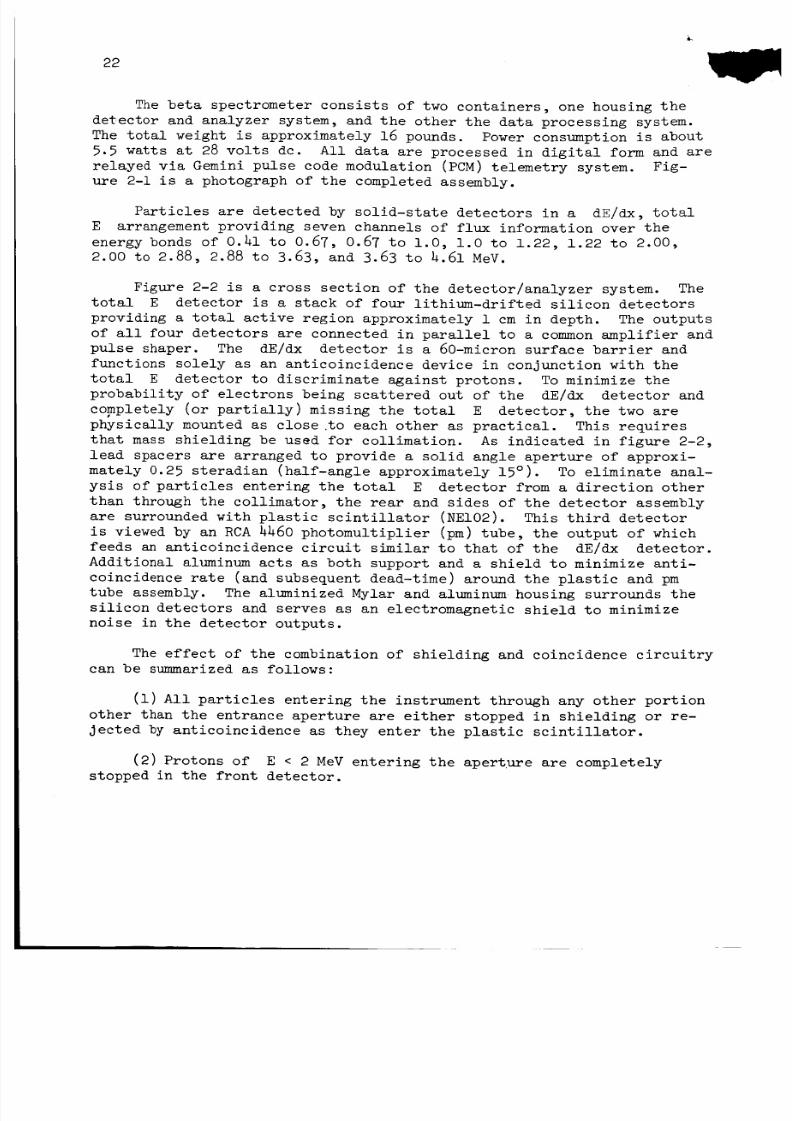
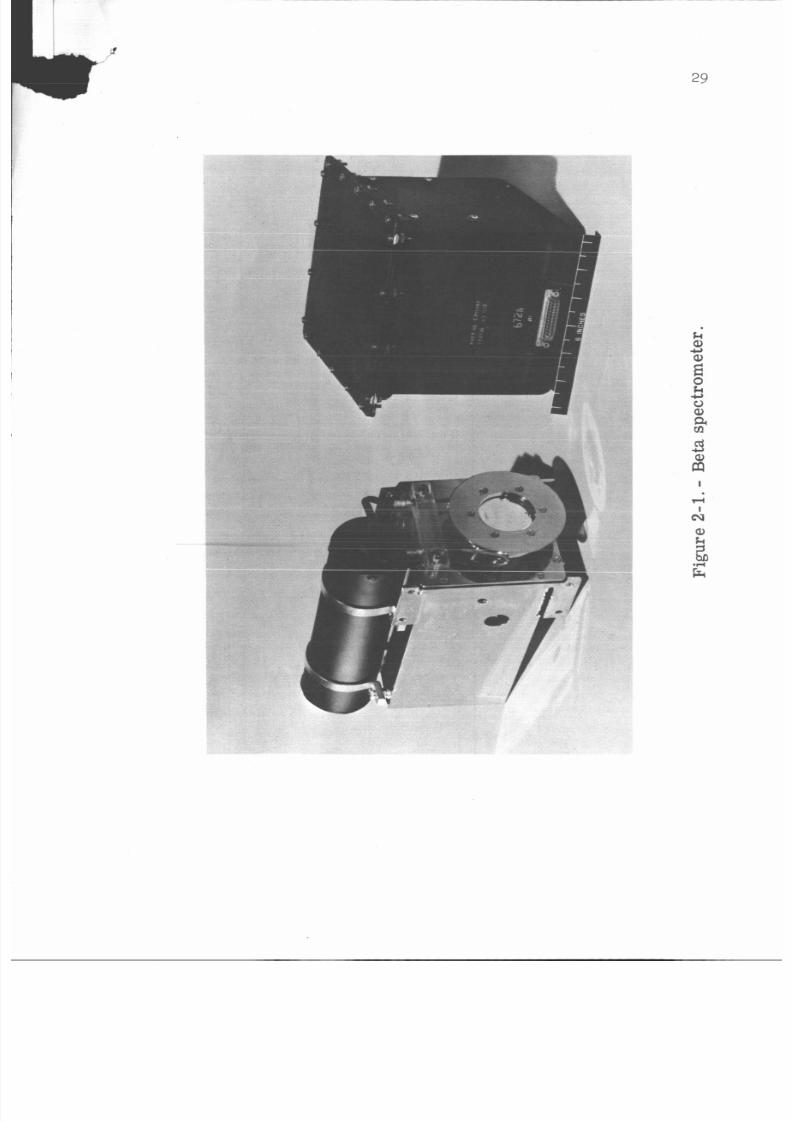
Thebeta spectrometer consists of two containers, one housing thedetector and analyzer system, and the other the data processing system.The total weight is approximately 16 pounds. Power consumption is about5.5 watts at 28 volts dc. All data are processed in digital form and are
relayed via Gemini pulse code modulation (PCM)telemetry system. Fig-ure 2-1 is a photograph of the completed assembly.
Particles are detected by solid-state detectors in a dE/dx, totalE arrangement providing seven channels of flux information over theenergy bonds of 0.41 to 0.67, 0.67 to 1.0, 1.0 to 1.22, 1.22 to 2.00,2.00 to 2.88, 2.88 to 3.63, and 3.63 to 4.61 MeV.
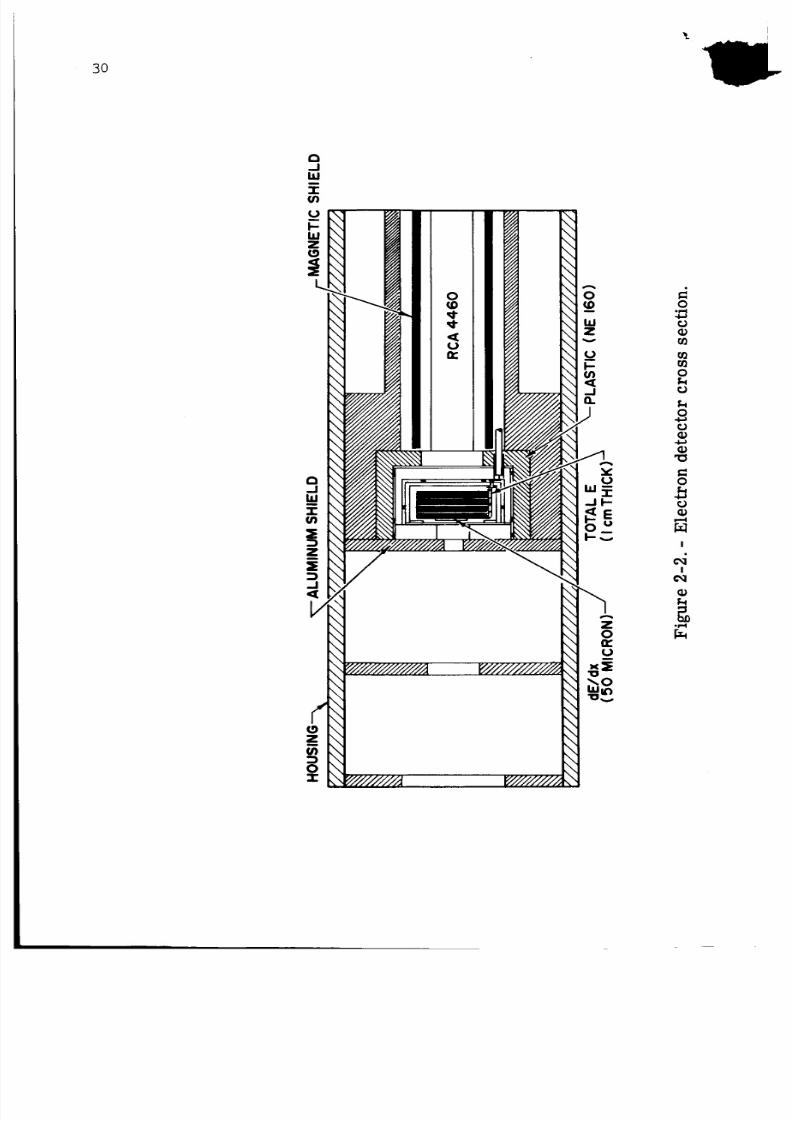
Figure 2-2 is a cross section of the detector/analyzer system. Thetotal E detector is a stack of four lithium-drifted silicon detectorsproviding a total active region approximately i cm in depth. The outputsof all four detectors are connected in parallel to a commonamplifier andpulse shaper. The dE/dx detector is a 60-micron surface barrier andfunctions solely as an anticoincidence device in conjunction with thetotal E detector to discriminate against protons. To minimize theprobability of electrons being scattered out of the dE/dx detector andcompletely (or partially) missing the total E detector, the two arephysically mounted as close .to each other as practical. This requiresthat mass shielding be used for collimation. As indicated in figure 2-2,lead spacers are arranged to provide a solid angle aperture of approxi-mately 0.25 steradian (half-angle approximately 15°). To eliminate anal-ysis of particles entering the total E detector from a direction otherthan through the collimator, the rear and sides of the detector assembly
are surrounded with plastic scintillator (NEI02). This third detectoris viewed by an RCA4460 photomultiplier (pm) tube, the output of whichfeeds an anticoincidence circuit similar to that of the dE/dx detector.Additional aluminumacts as both support and a shield to minimize anti-coincidence rate (and subsequent dead-time) around the plastic and pmtube assembly. The aluminized Mylar and aluminum housing surrounds thesilicon detectors and serves as an electromagnetic shield to minimizenoise in the detector outputs.
The effect of the combination of shielding and coincidence circuitrycan be summarizedas follows:
(i) All particles entering the instrument through any other portionother than the entrance aperture are either stopped in shielding or re-Jected by anticoincidence as they enter the plastic scintillator.
(2) Protons of E < 2 MeVentering the aperture are completelystopped in the front detector.
8/7/2019 Manned Spaceflight Experiments Gemini 10 Mission Interim Report
http://slidepdf.com/reader/full/manned-spaceflight-experiments-gemini-10-mission-interim-report 29/146
23
(3) Protons of 0.2 < E < 20 MeVwill deposit greater than 200 keVin the front detector. The threshold for coincidence rejection is ad-justed to 200 keV and these particles are not analyzed.
(4) Protons with E > 5.5 MeVwill deposit more than 4.6 MeVin thetotal E detector and will be out of the range of the PHAand rejectedon that basis.
(5) Protons with E > 70 MeVwill penetrate both silicon detectorsand enter the plastic coincidence scintillator for rejection.
(6) Electrons of E < 410 keV and of 4.6 < E < i0 MeVwill depositenergies in the total E detector that are outside the range of the PHA.
(7) Electrons of E > I0 MeVwill penetrate to the scintillator forrejection.
(8) Electrons of 0.41 _ E _ 4.6 MeVwill be analyzed.
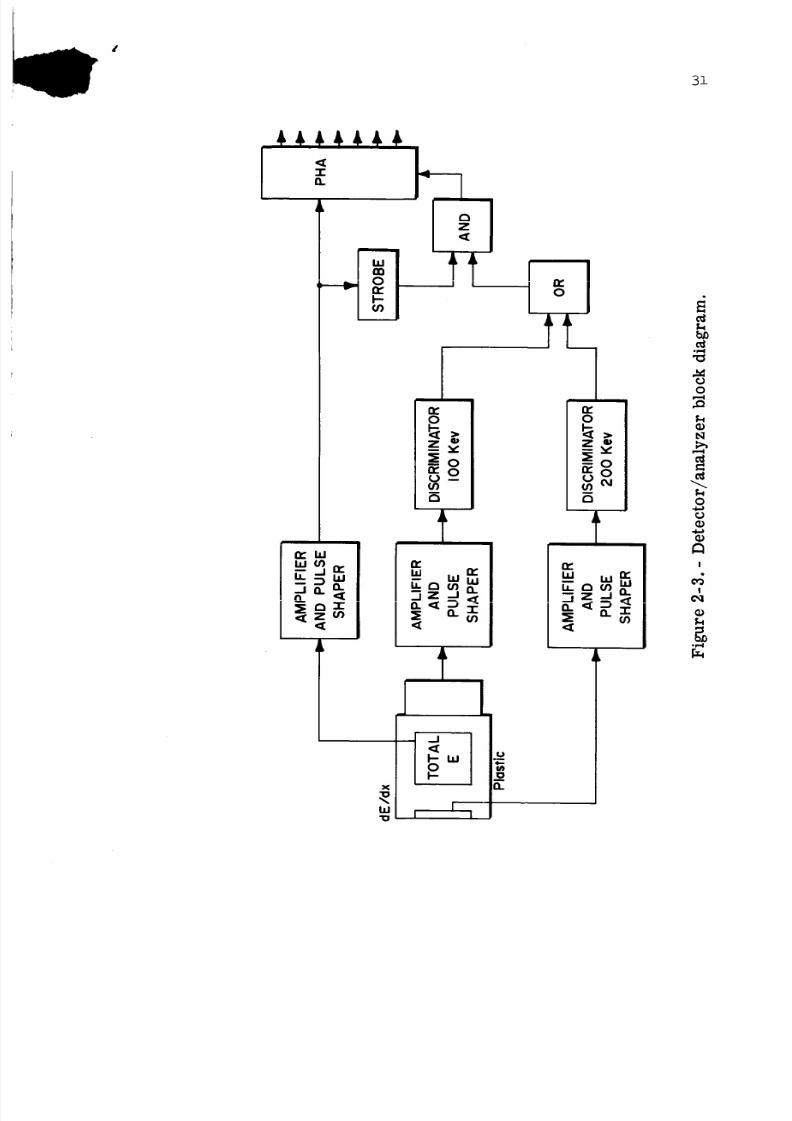
A block diagram of the detector/analyzer system is shownin fig-ure 2-3.
Pulses from either the dE/dx, total E, or scintillator detectorare routed into essentially identical charge-sensitive amplifiers. Theamplified and shaped pulses from the dE/dx and scintillator detectors
are fed into level discriminators which are adjusted to equivalent energydeposited of 200 keV and i00 keV, respectively. Whenan incoming pulseexceeds the threshold level, the discriminator triggers and remainslatched on for approximately 0.7 microsecond. The two discriminatoroutputs are then routed through a complementaryANDgate to a strobecontrol circuit.
The strobe pulse feeds an ANDgate together with the inhibit/enablelogic discriminator outputs. Its function is to hold the analyzer stor-age input closed to an analyzed pulse from the total E detector untilthe inhibit circuits have enoughtime to present an output should theyhave one.
Firing time of the strobe is adjusted to occur sufficiently downon the decay slope of the pulse to allow the latest and shortest, as wellas the earliest and shortest, inhibit pulses to be recognized.
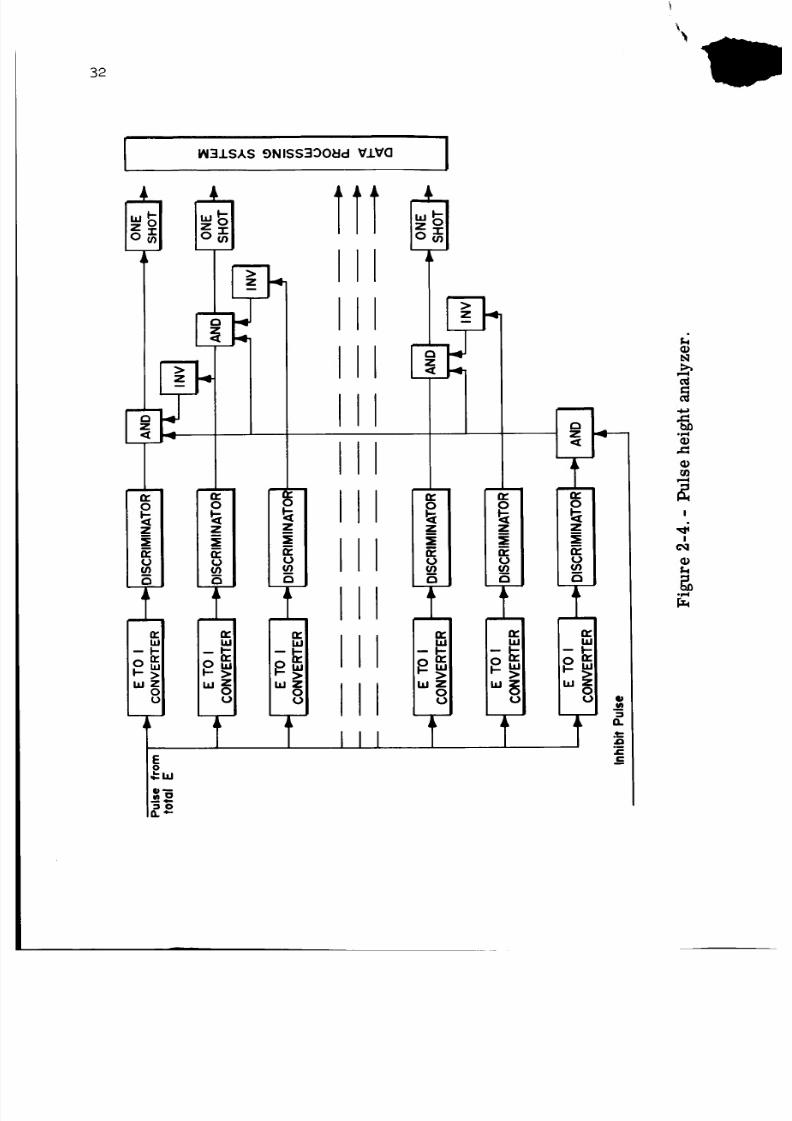
Figure 2-4 is a simplified block diagram of the pulse height ana-lyzer. The amplified and shaped signals from the total E detector areapplied to eight voltage-to-current converters, each of which feeds aturmel diode discriminator. Each discriminator is adjustable, to allowflexibility of the selected energy thresholds of about 50 percent of itsnominal levels. The first and eighth discriminators serve to define the
8/7/2019 Manned Spaceflight Experiments Gemini 10 Mission Interim Report
http://slidepdf.com/reader/full/manned-spaceflight-experiments-gemini-10-mission-interim-report 30/146
24
energy window of the analyzer. The discriminators are similar in opera-
tion to the inhibit logic discriminators, that is, they detect a level
and then latch on for approximately 0.7 microsecond. The ninth circuit
in the diagram is a dE/dt-to-I converter which operates the previously
mentioned strobe.
To obtain differential rather than integral spectra, interconnecting
logic circuitry is provided between each discriminator output after
strobe interrogation. As each discriminator fires, it inhibits the oUt-
put of its next lower neighbor, leaving a pulse present on the highest
energy line actuated.
A pulse that has been interrogated and accepted by the strobe cir-
cuit then feeds a one-shot multivibrator which is connected to the data
processing package.
Data pulses from the one shot multivibrators at the output of each
of the seven energy channels are routed directly to the digital data
processing system. Each channel is routed through a gate which is con-
trolled by the time-base generator to control sampling time. When the
gate is opened, pulses are fed into seven parallel, 14-bit scaler accumu-
lators. After the preset sampling has occurred, the gate is closed and
the information in the accumulators is shifted in parallel into seven
lh-bit shift registers. The registers are connected to seven parallel-
sampled, bilevel PCM telemetry channels. Each time the telemetry (TM)
channels are sampled the next register bit is shifted for readout. Sam-
pling rate is l0 per second so that 1.4 seconds are required to read outeach seven channel spectrum. Immediately after the accumulated data are
transferred, the input gates are opened to begin another sample. In this
way data are accumulated and read out at the same time.
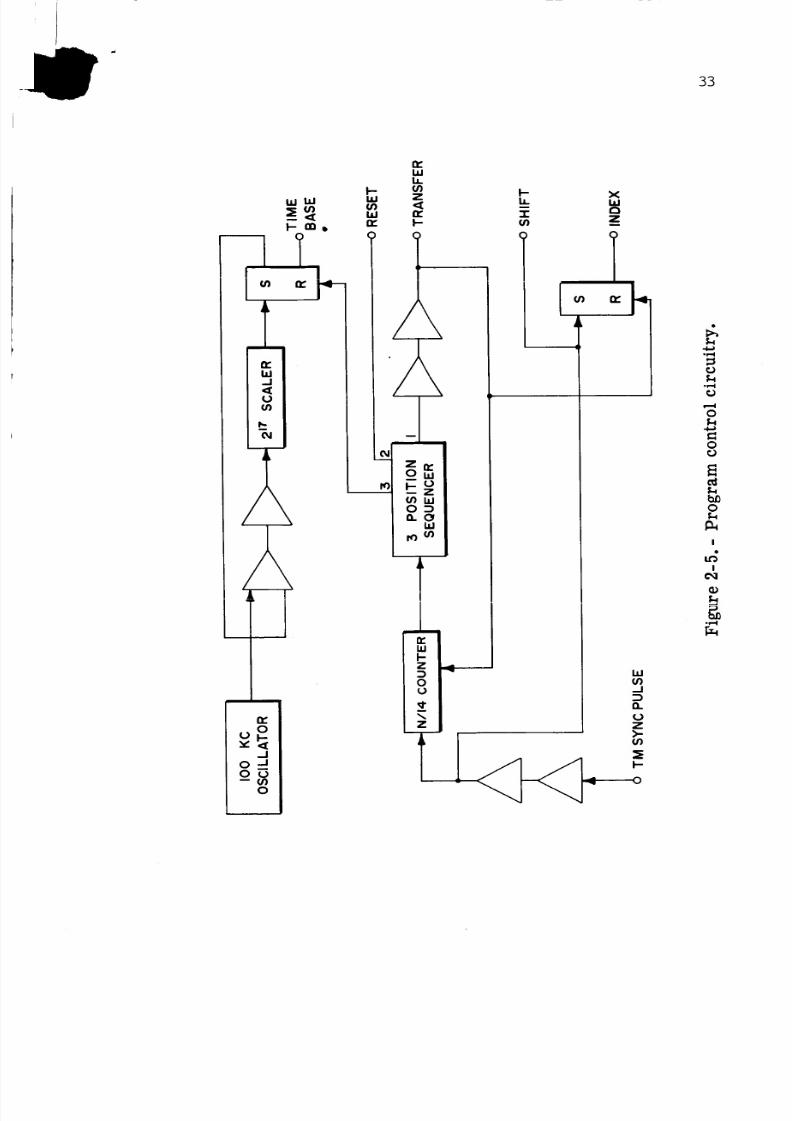
Figure 2-5 is a block diagram of the program control circuitry. All
sequences are slaved to a 10-per-second gate pulse that is obtained from
the PCM telemetry system. If it is assumed initially that the index
pulse is set and the ceunters in the control circuitry are at zero, the
sequencing can be traced as follows: A sync pulse enters the N/14 count-
er.. The falling edge of this pulse triggers the N/14 counter one step
and flips the index signal off. The index signal is routed to an eighth
bilevel TM channel that is sampled in parallel withthe seven energy
channels. Its function is to define the first register bit being sampled.
Simultaneously, this first sync pulse sends a shift command to all reg-
isters. The 2nd to 13th sync pulses advance the N/14 counter and shift
the register leaving them cleared. The N/14 counter, now filled, sends
a pulse to a three-position sequencer. This sequencer consists of six
cascaded one-shot multivibrators. After a 75-microsecond delay, a pulse
appears at terminal 1 of the sequencer, resets the N/14 counter and the
index flip-flop, and transfers data from the accumulators into the now
depleted registers. After another 75-microsecond delay, a pulse appears
8/7/2019 Manned Spaceflight Experiments Gemini 10 Mission Interim Report
http://slidepdf.com/reader/full/manned-spaceflight-experiments-gemini-10-mission-interim-report 31/146
25
at terminal 2 of the sequencer which resets all accumulators. After athird 75-microsecond delay, a pulse appears at terminal 3 of the sequen-cer initiating the time-base for controlling the input gates to the accu-
mulators. This completes the cycle and the next sequencecan begin.
The time-base generator works as follows. The pulse from terminal 3of the sequencer opens the input gates to the accumulator and simultane-ously gates a 100-kc crystal-controlled square waveoscillator into a
17-bit scaler. After 217 pulses, the time-base flip-flop is toggled,closing the input gates to the accumulators and the oscillator gate tothe scaler. The circuit will nowwait until a pulse from the sequencerreinitiates the cycle. The accumulator gates are open for 131 075 ±15 counts in the scaler which corresponds to 1.31057 ± 0.00015 seconds.Stability is better than 3 parts per 13 000 over the temperature range
of -65° to'÷170 ° F or ±0.102 percent.
It should be noted that although the output registers require1.4 seconds to be sampled, the accumulators are filled for only1.31 seconds. The difference is to allow for time required to transferthe accumulator information into the output registers.
To assure that the silicon semiconductor detectors are maintainedat room temperature or below (the noise figure improves with decreasingtemperature), an evaporative cooling device is incorporated into thedetector/analyzer. Water, stored in the cylindrical reservoir on the
top of the assembly in the left of figure 2-1, is fed to two identicalevaporators mounted to the side of the detector subassembly. The evap-orators consist of ceramic disks which allow the water to evaporatethrough to the vacuummaintained inside the instrument during orbit. Thewater is sealed inside the reservoir in a polyethylene bag which leavesapproximately half of the tank for air which is sealed at atmosphericpressure. During orbit, the 1-atmosphere pressure differential betweenthe inside of the tank and the vacuumoutside forces the water to theceramic evaporators where it slowly bleeds out and evaporates, absorbingthe heat of vaporization. The bleed rate is adjusted to approximately5 grams per hour total, which will maintain the detectors at room tem-perature or lower for 4 hours with the equipmentmounting structure tem-
perature at 120° F.
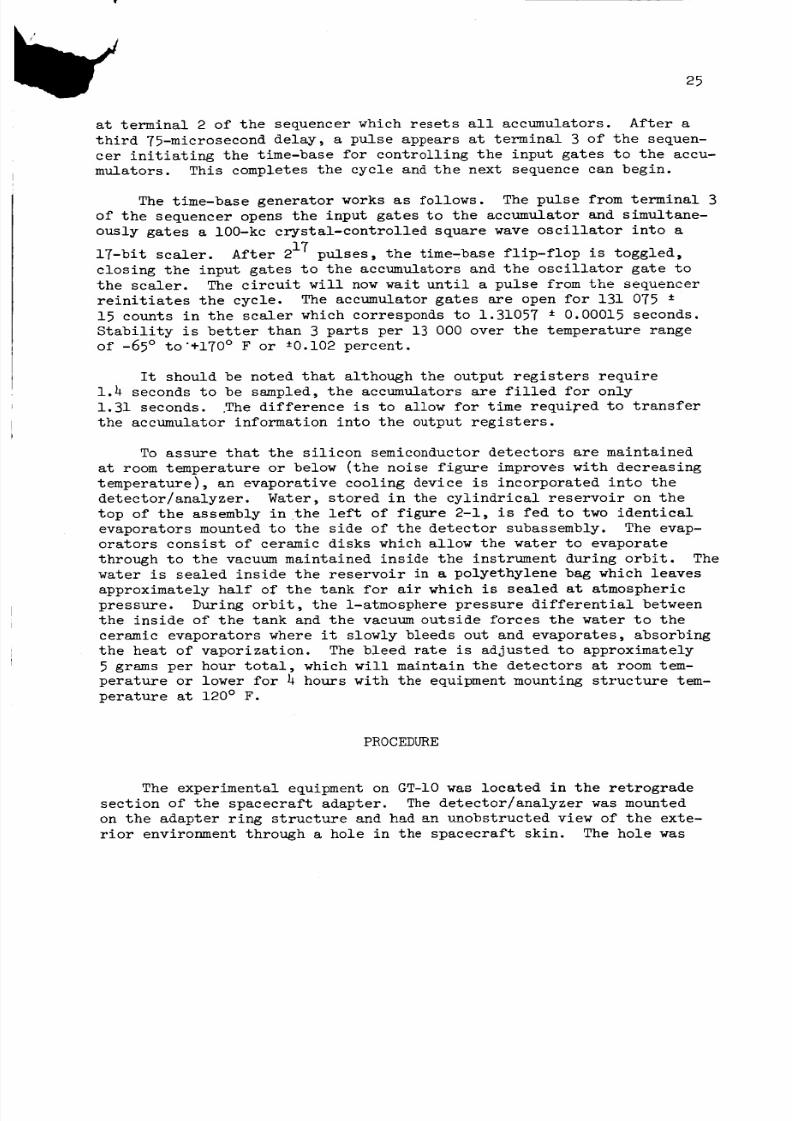
PROCEDURE
The experimental equipment on GT-IO was located in the retrograde
section of the spacecraft adapter. The detector/analyzer was mounted
on the adapter ring structure and had an unobstructed view of the exte-
rior environment through a hole in the spacecraft skin. The hole was
8/7/2019 Manned Spaceflight Experiments Gemini 10 Mission Interim Report
http://slidepdf.com/reader/full/manned-spaceflight-experiments-gemini-10-mission-interim-report 32/146
26
covered with a half-hinged door to protect the instrument during the
launch phase of the mission. It was automatically jettisoned during
spacecraft separation from the booster.
Operation of the equipment during the flight was accomplished by
means of a toggle switch on the control console of the pilot, who turned
on the instrument after orbit insertion and left it on throughout the
mission until just prior to retrofire.
To obtain information on the directionality of the electron radia-
tion encountered, it was necessary that the instrument see as many dif-
ferent directions in space as possible. Since the radiation is concen-
trated in the relatively small South Atlantic Anomaly region at Gemini
altitudes and is known to be trapped in the geomagnetic field, it was
important that the instrument be made to look at several angles with
respect to the magnetic field while in this area. To accomplish this
the crew was requested to execute a slow roll maneuver while in the South
Atlantic Anomaly which would rotate the instrument about the magnetic
f_eld lines. This maneuver sweeps the experiment sensors through the
normal to the field twice for every 360-degree roll of the spacecraft.
In addition to providing directionality information, this would also
assure several data points taken while the instrument is normal to the
magnetic field direction where the electron intensity is known to be
greatest.
The principal investigator was stationed at the Kokee tracking site
in Hawaii, where the dumped telemetry data were evaluated following each
of the anomaly passes. The requirements for controlled spacecraft atti-
tude could then be augmented or reduced during the mission, depending on
quick-look data obtained during other mission operations. The Triaxis
Magnetometer experiment (M405) provided instantaneous "magnetic attitude"
of the beta spectrometer so that the data received could be continuously
related to spacecraft attitude.
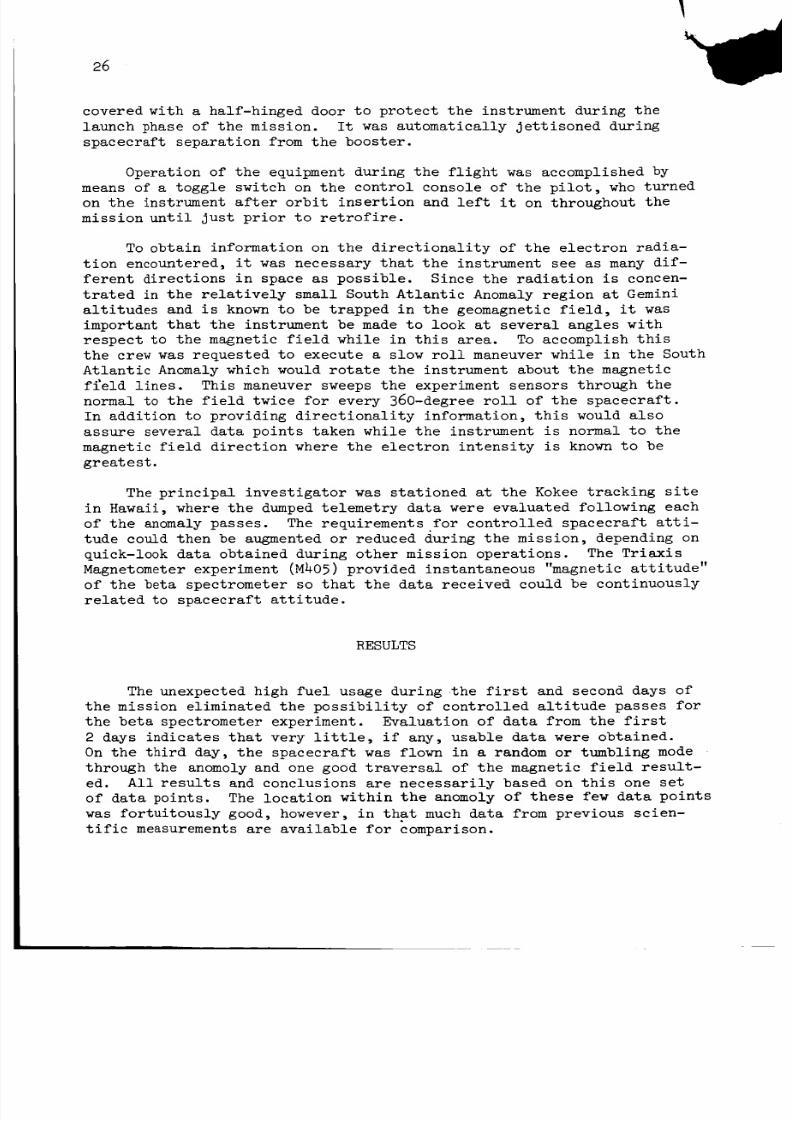
RESULTS
The unexpected high fuel usage during the first and second days ofthe mission eliminated the possibility of controlled altitude passes for
the beta spectrometer experiment. Evaluation of data from the first
2 days indicates that very little, if any, usable data were obtained.
On the third day, the spacecraft was flown in a random or tumbling mode
through the anomoly and one good traversal of the magnetic field result-
ed. All results and conclusions are necessarily based on this one set
of data points. The location within the anomoly of these few data points
was fortuitously good, however, in that much data from previous scien-
tific measurements are available for comparison.
8/7/2019 Manned Spaceflight Experiments Gemini 10 Mission Interim Report
http://slidepdf.com/reader/full/manned-spaceflight-experiments-gemini-10-mission-interim-report 33/146
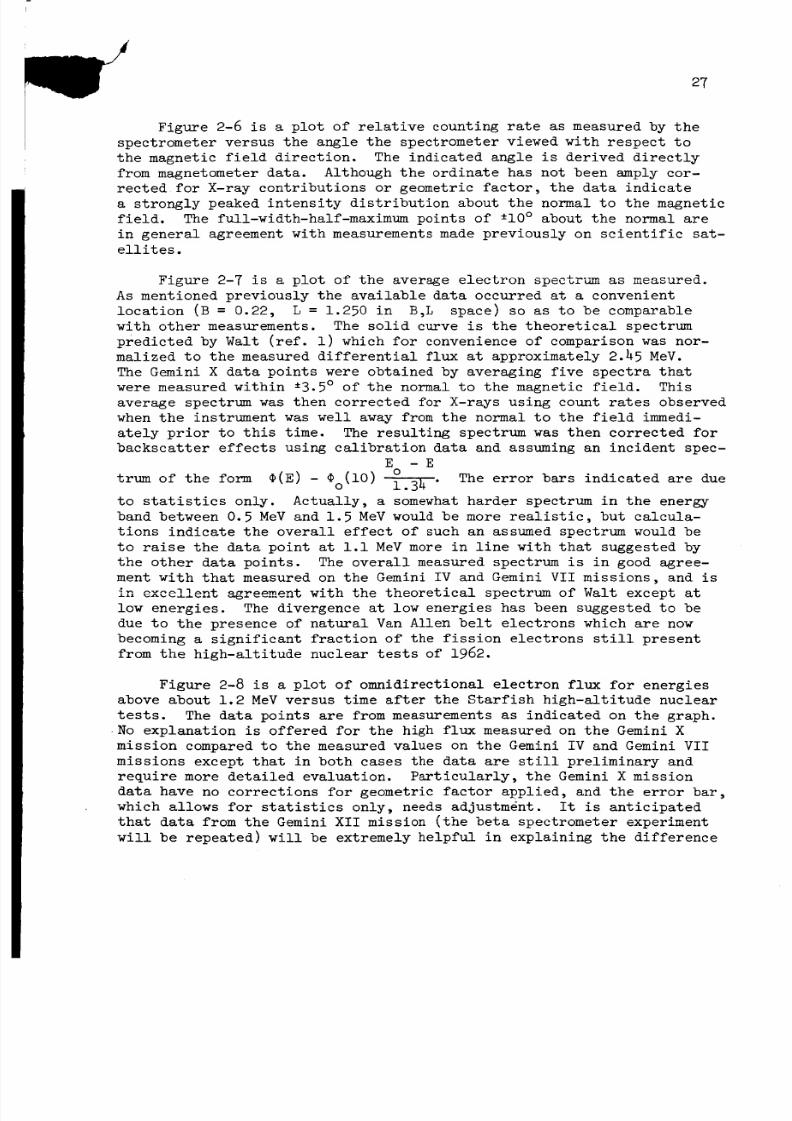
27
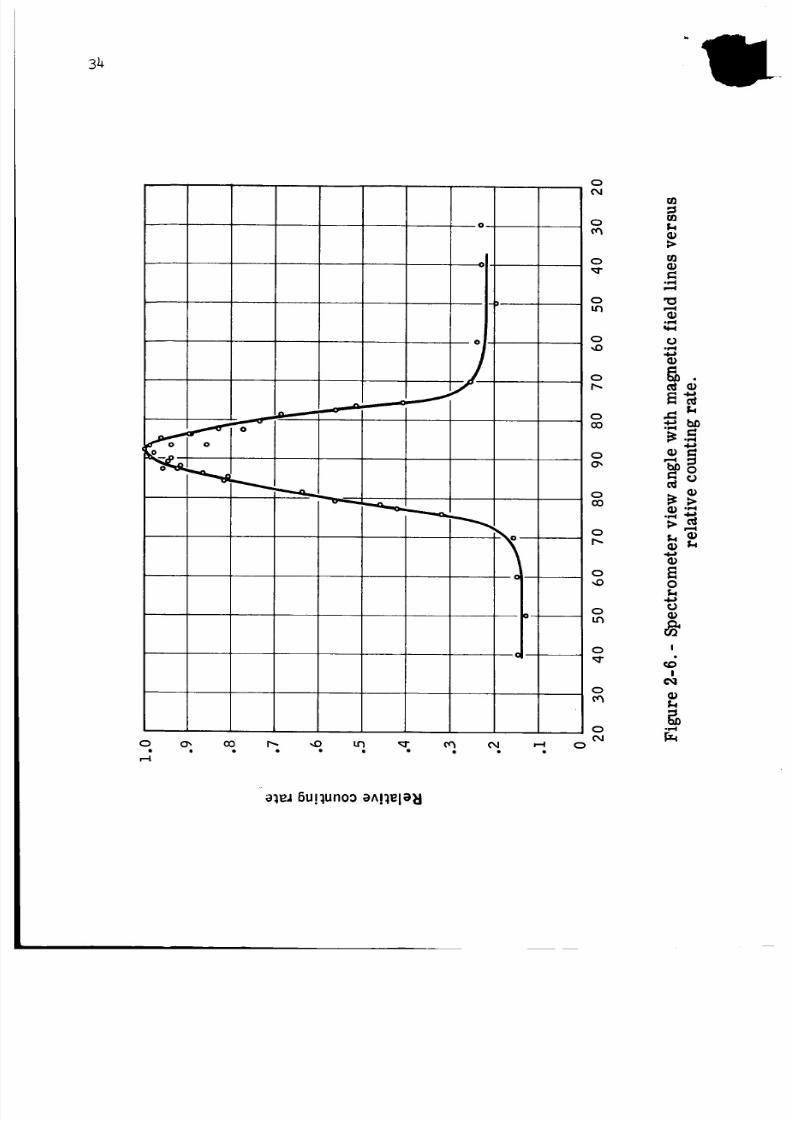
Figure 2-6 is a plot of relative counting rate as measured by the
spectrometer versus the angle the spectrometer viewed with respect to
the magnetic field direction. The indicated angle is derived directly
from magnetometer data. Although the ordinate has not been amply cor-rected for X-ray contributions or geometric factor, the data indicate
a strongly peaked intensity distribution about the normal to the magnetic
field. The full-width-half-maximum points of ±10 ° about the normal are
in general agreement with measurements made previously on scientific sat-
ellites.
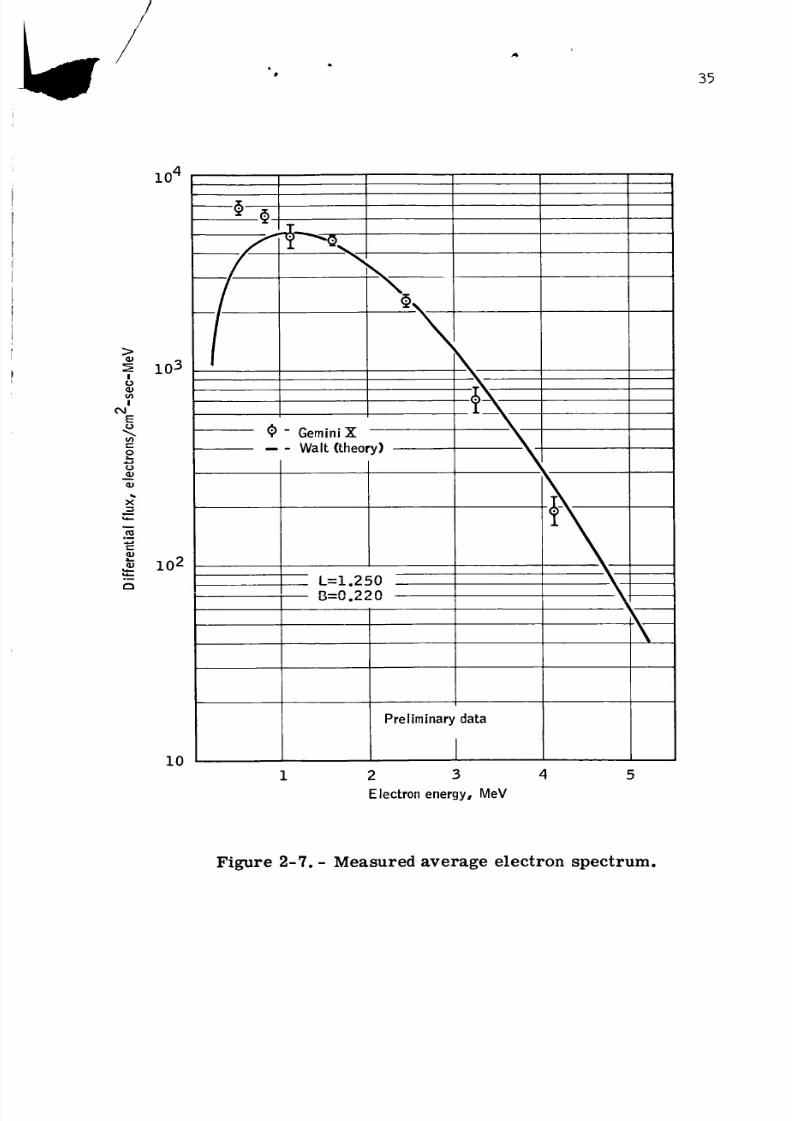
Figure 2-7 is a plot of the average electron spectrum as measured.
As mentioned previously the available data occurred at a convenient
location (B = 0.22, L = 1.250 in B,L space) so as to be comparable
with other measurements. The solid curve is the theoretical spectrum
predicted by Walt (ref. i) which for convenience of comparison was nor-
malized to the measured differential flux at approximately 2.45 MeV.
The Gemini X data points were obtained by averaging five spectra that
were measured within ±3.5 ° of the normal to the magnetic field. This
average spectrum was then corrected for X-rays using count rates observed
when the instrument was well away from the normal to the field immedi-
ately prior to this time. The resulting spectrum was then corrected for
backscatter effects using calibration data and assuming an incident spec-
E - E
trum of the form ¢(E) - ¢o(i0) oi.-_-_" The error bars indicated are due
to statistics only. Actually, a somewhat harder spectrum in the energy
band between 0.5 MeV and 1.5 MeV would be more realistic, but calcula-
tions indicate the overall effect of such an assumed spectrum would be
to raise the data point at i.i MeV more in line with that suggested by
the other data points. The overall measured spectrum is in good agree-
ment with that measured on the Gemini IV and Gemini VII missions, and is
in excellent agreement with the theoretical spectrum of Walt except at
low energies. The divergence at low energies has been suggested to be
due to the presence of natural Van Allen belt electrons which are now
becoming a significant fraction of the fission electrons still present
from the high-altitude nuclear tests of 1962.
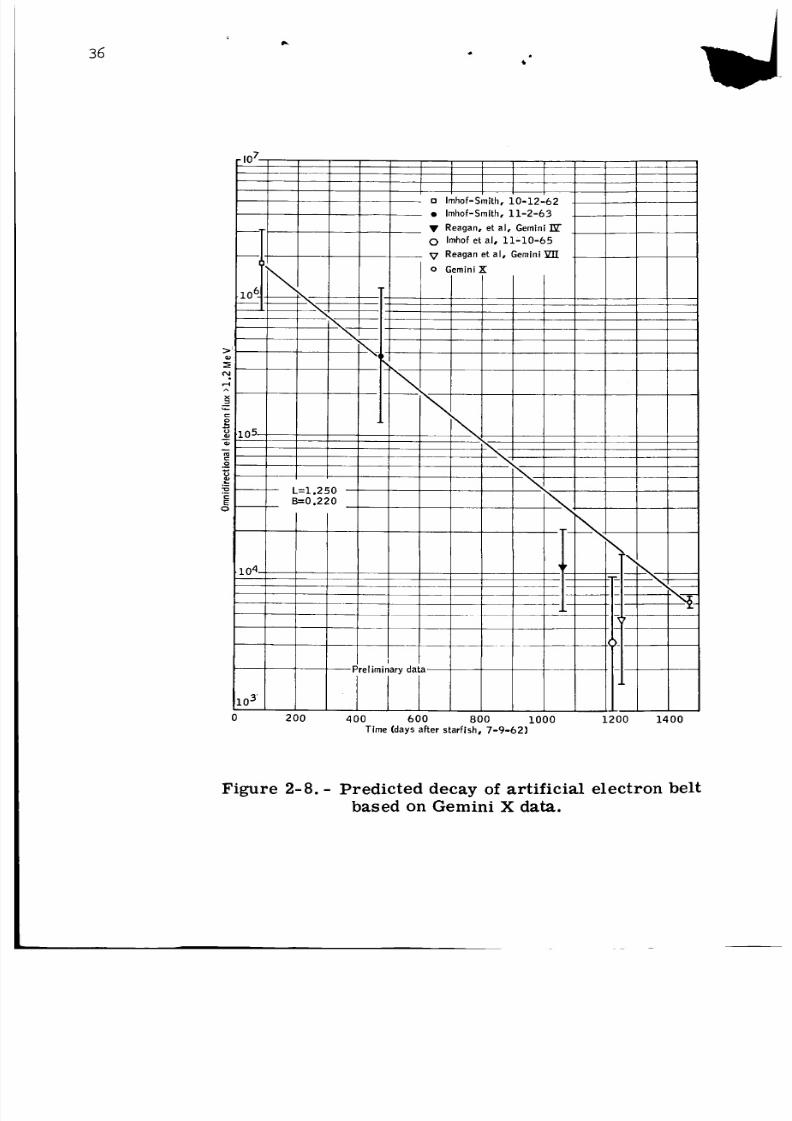
Figure 2-8 is a plot of omnidirectional electron flux for energies
above about 1.2 MeV versus time after the Starfish high-altitude nuclear
tests. The data points are from measurements as indicated on the graph.
No explanation is offered for the high flux measured on the Gemini X
mission compared to the measured values on the Gemini IV and Gemini VII
missions except that in both cases the data are still preliminary and
require more detailed evaluation. Particularly, the Gemini X mission
data have no corrections for geometric factor applied, and the error bar,
which allows for statistics only, needs adjustment. It is anticipated
that data from the Gemini XII mission (the beta spectrometer experiment
will be repeated) will be extremely helpful in explaining the difference
8/7/2019 Manned Spaceflight Experiments Gemini 10 Mission Interim Report
http://slidepdf.com/reader/full/manned-spaceflight-experiments-gemini-10-mission-interim-report 34/146
28
\
in decay constants as measured on the Gemini X, Gemini IV, and Gemini VII
missions.
Summaries. of the real-time data obtained during the mission indicate
that the equipment functioned exactly as planned. The detector was pro-vided with a specially designed cooler, and the detector temperature
followed a satisfactory profile. Shortly after being turned on, the de-
tector temperature sensor indicated temperatures of less than i0 ° C and
cooled to about 3 ° C on the second revolution. Throughout the rest of
the mission, temperatures remained between 2° and 3.5 ° C.
CONCLUSIONS
The beta spectrometer functioned as planned throughout the Gemini X
mission. The cool temperatures recorded from the instrument during the
mission indicate that the evaporative cooler, coupled with apparently
lower-than-expected spacecraft adapter temperatures, provided ideal oper-
ating conditions. The data provide a good picture of the electron direc-
tional distribution. The omnidirectional flux calculated appears to be
in good agreement with previous measurements. Detailed reports will be
published when additional data are received and evaluated.
REFERENCE
i. Walt, Martin: The Effects of Atmospheric Collisions on Geomagnet-
ically Trapped Electrons. J. Geophysical Res., vol. 69, 1964,
pp. 3947-3958.
8/7/2019 Manned Spaceflight Experiments Gemini 10 Mission Interim Report
http://slidepdf.com/reader/full/manned-spaceflight-experiments-gemini-10-mission-interim-report 35/146
29
k
Q,
Q,
0k
0Q,
aCn
-e,
E
4
8/7/2019 Manned Spaceflight Experiments Gemini 10 Mission Interim Report
http://slidepdf.com/reader/full/manned-spaceflight-experiments-gemini-10-mission-interim-report 36/146
I
30
\ NI
0
_N_ m
x,I Z
,N
,',,1 _
_Xl Q.
\1NI
U
,,,]m _:
NI\1
0
00
0
0
0
00
0
0t_
00
!
e,iI
go_,_
8/7/2019 Manned Spaceflight Experiments Gemini 10 Mission Interim Report
http://slidepdf.com/reader/full/manned-spaceflight-experiments-gemini-10-mission-interim-report 37/146
31
_AAAAA_
,
In-O
eI
n. I0
_ol
U
_oa.
A
X
LU"o
I-,,,
o
I I I
TII
I
°F-¢
ow-4
N
0
I
!
8/7/2019 Manned Spaceflight Experiments Gemini 10 Mission Interim Report
http://slidepdf.com/reader/full/manned-spaceflight-experiments-gemini-10-mission-interim-report 38/146
\
32
IAI':I.LSkS 9NISS':IOO_Id V.I.V(]
t_l,-_=__1zOo_I o_
- I
Z 1',4
Z
_ $I_ n- n- IU _ U I
Z Im |
_} U U I
(/) i Or)¢2
OmI->wz
E
8
_i I'--
"'___] ="'_ _
III z
l-i
°_,,,,,I
8/7/2019 Manned Spaceflight Experiments Gemini 10 Mission Interim Report
http://slidepdf.com/reader/full/manned-spaceflight-experiments-gemini-10-mission-interim-report 39/146
33
i...
_-7 0 o!
I I
IA
m
Lz.l_.I
0U)
n_ I0 1
(_ _ i
'v' ,_[ I
0 "_ mu
0 !
h,h(Jr)Z
I--
?
$iI
z_o,,,
(/) bJO_
0.0 h,
,m
i- I
_01"--
+1
I- Xb. I_1
_n z_
I+ t.
LIJ(i)
.-Ia.
0Z>-(l)
o_1
°l--I
i--I
0
0
t_
b_0
P_
I
I
8/7/2019 Manned Spaceflight Experiments Gemini 10 Mission Interim Report
http://slidepdf.com/reader/full/manned-spaceflight-experiments-gemini-10-mission-interim-report 40/146
34
o
o
i
oi
01
O
r_
O
(M
O
O
_-
O
O
_D
O
p_
O
OO
O
O_
O
O0
O
p_
O
_O
O
O
O
O
(XlO
(IQ
Q)
G)
"O
(D°f-I
bl) o
(D
(D
O
I
I
°_
eleJ 5u!lunoo eA!lele_l
8/7/2019 Manned Spaceflight Experiments Gemini 10 Mission Interim Report
http://slidepdf.com/reader/full/manned-spaceflight-experiments-gemini-10-mission-interim-report 41/146
/o
35
>
I¢.)
ul
I
E
e-
I
,i
°i
104
10 3
10 2
I0
.TL
i
- GeminiX -_ I-- - Walt (theory)
L=1.250 _kP_,=0.220 ---
\
Preliminary data
1 2 3 4 5
Electron energy, MeV
Figure 2-7.- Measured average electron spectrum.
8/7/2019 Manned Spaceflight Experiments Gemini 10 Mission Interim Report
http://slidepdf.com/reader/full/manned-spaceflight-experiments-gemini-10-mission-interim-report 42/146
36
¢%1
A
_goJ
.o
O m--
105 -
L=1.250 --
8=0.220
In Imhof-Smith, 10-12-62
• Imhof-Smlth, 11-2-63
• Reagan, et al, Gemini
O Imhof et al, ii;-i0-65
V Reagan et al, Gemini
o Gemini X
104- _V
10 3`
0
\
X'-4
___
Preliminary data
200 400 600 800 i000 1200 1400
Time (days after starfish, 7-9-62)
Figure 2-8.- Predicted decay of artificial electron belt
based on Gemini X data.
8/7/2019 Manned Spaceflight Experiments Gemini 10 Mission Interim Report
http://slidepdf.com/reader/full/manned-spaceflight-experiments-gemini-10-mission-interim-report 43/146
4o
Employing this output format the error due to compression is always pos-
itive and less than 5.9 percent so that the average error is approxi-
mately 3 percent.
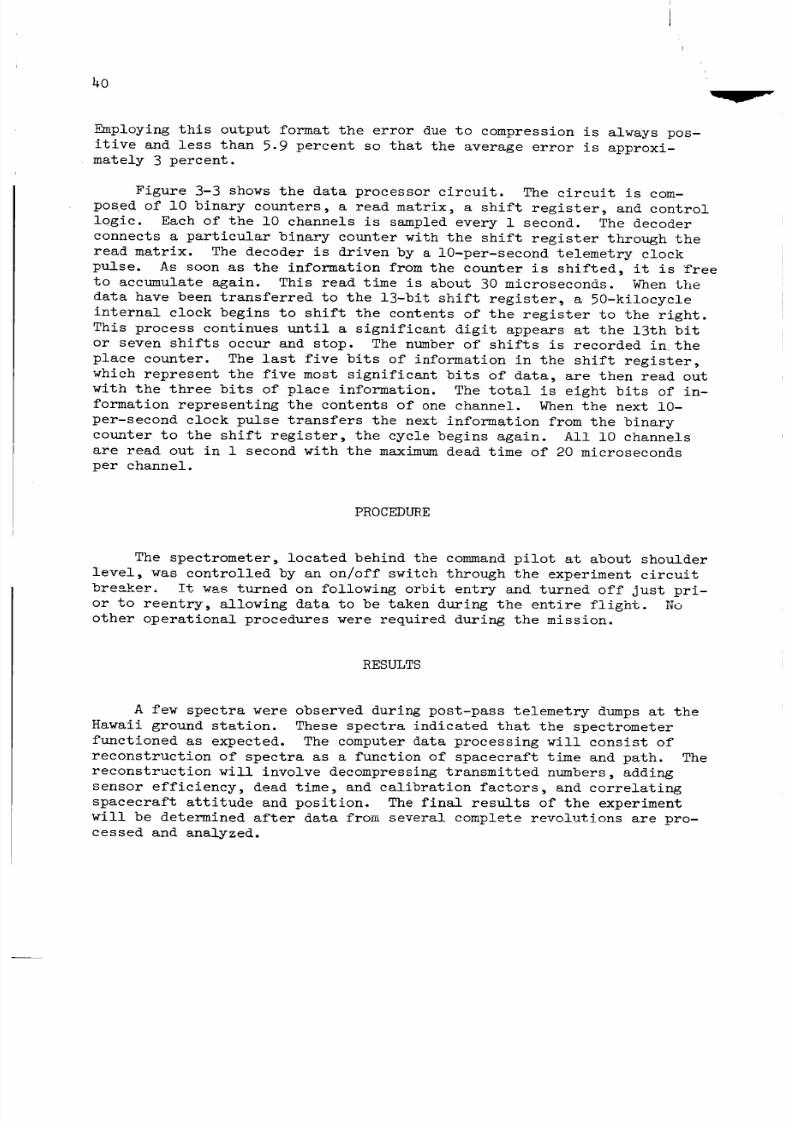
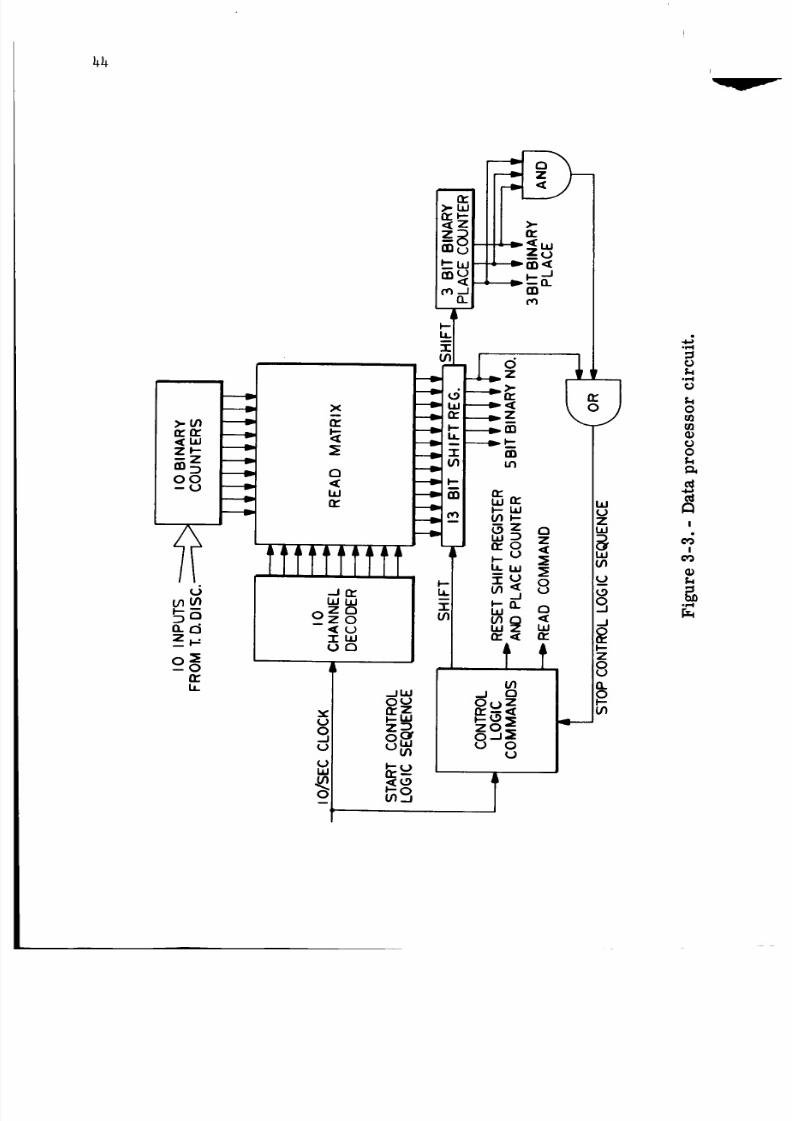
Figure 3-3 shows the data processor circuit. The circuit is com-
posed of i0 binary counters, a read matrix, a shift register, and control
logic. Each of the i0 channels is sampled every i second. The decoder
connects a particular binary counter with the shift register through the
read matrix. The decoder is driven by a 10-per-second telemetry clock
pulse. As soon as the information from the counter is shifted, it is Tree
to accumulate again. This read time is about 30 microseconds. _en the
data have been transferred to the 13-bit shift register, a 50-kilocycle
internal clock begins to shift the contents of the register to the right.
This process continues until a significant digit appears at the 13th bit
or seven shifts occur and stop. The number of shifts is recorded intheplace counter. The last five bits of information in the shift register,
which represent the five most significant bits of data, are then read out
with the three bits of place information. The total is eight bits of in-
formation representing the contents of one channel. When the next lO-
per-second clock pulse transfers the next information from the binary
counter to the shift register, the cycle begins again. All lO channels
are read out in 1 second with the maximum dead time of 20 microseconds
per channel.
PROCEDURE
The spectrometer, located behind the command pilot at about shoulder
level, was controlled by an on/off switch through the experiment circuit
breaker_ It was turned on following orbit entry and turned off just pri-
or to reentry, allowing data to be taken during the entire flight. No
other operational procedures were required during the mission.
RESULTS
A few spectra were observed during post-pass telemetry dumps at the
Hawaii ground station. These spectra indicated that the spectrometer
functioned as expected. The computer data processing will consist of
reconstruction of spectra as a function oZ spacecraft time and path. The
reconstruction will involve decompressing transmitted numbers, adding
sensor efficiency, dead time, and calibration factors, and correlating
spacecraft attitude and position. The final results of the experiment
will be determined after data from several complete revolutions are pro-
cessed and analyzed.
8/7/2019 Manned Spaceflight Experiments Gemini 10 Mission Interim Report
http://slidepdf.com/reader/full/manned-spaceflight-experiments-gemini-10-mission-interim-report 44/146
39
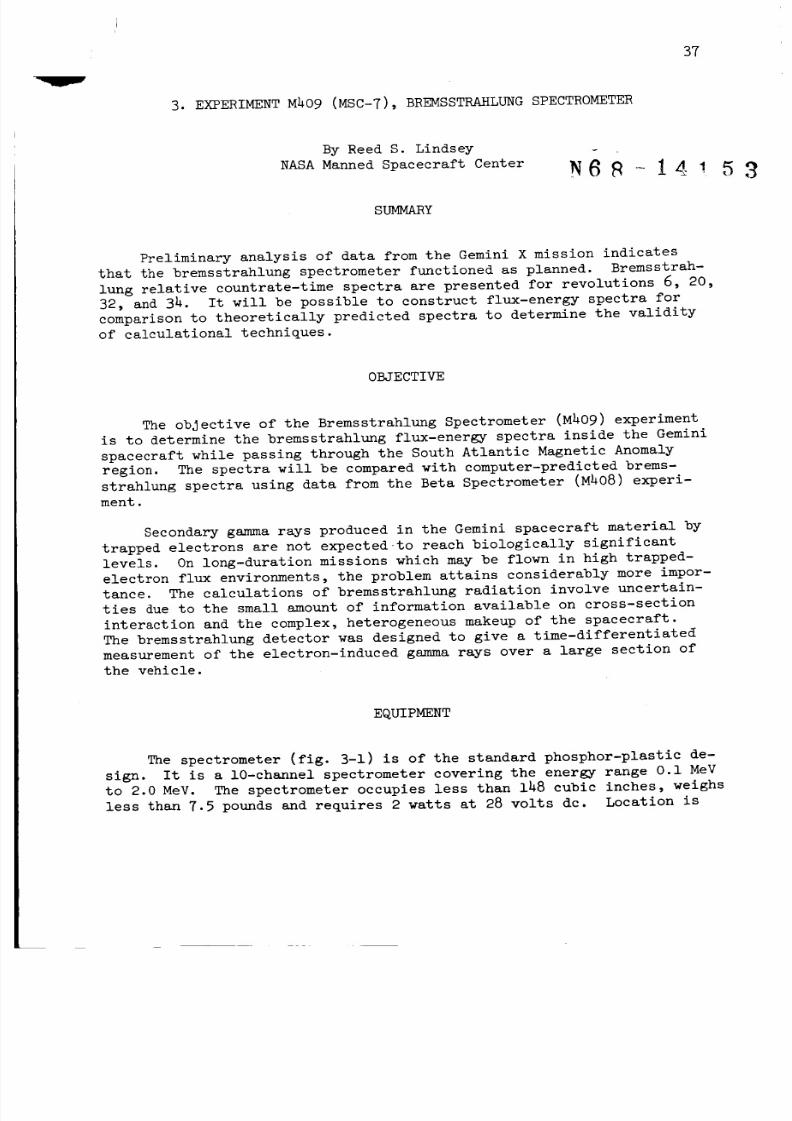
where a is the area of a detector having diameter D. The bremsstrah-
lung production rate into this solid angle is
D 2--4wd 2 × 10⁴ photons/sec = 2.5wD 2 × 10³ photons/sec
16d2
If the detector has a counting efficiency of 0.4, the count rate C is
C = wD 2 x 10³ photons/sec
A 1-inch detector diameter would, therefore, produce a maximum count
rate of
C = 2 x 10⁴ photons/sec
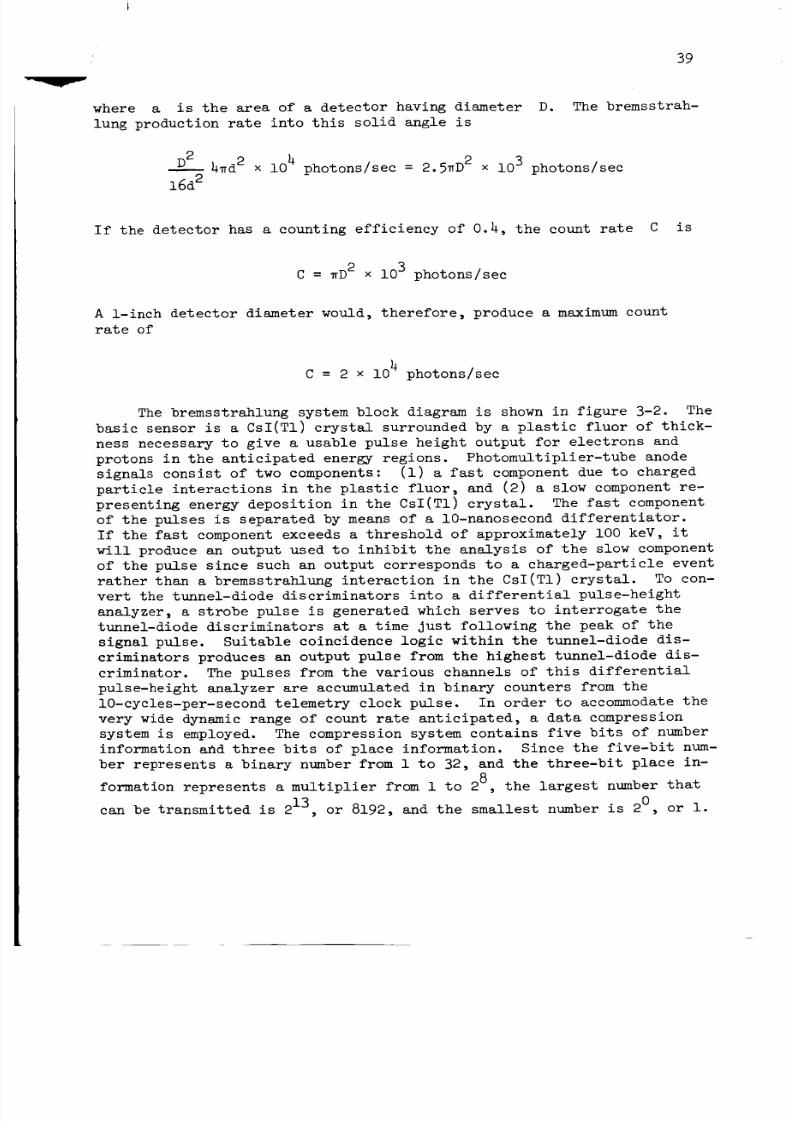
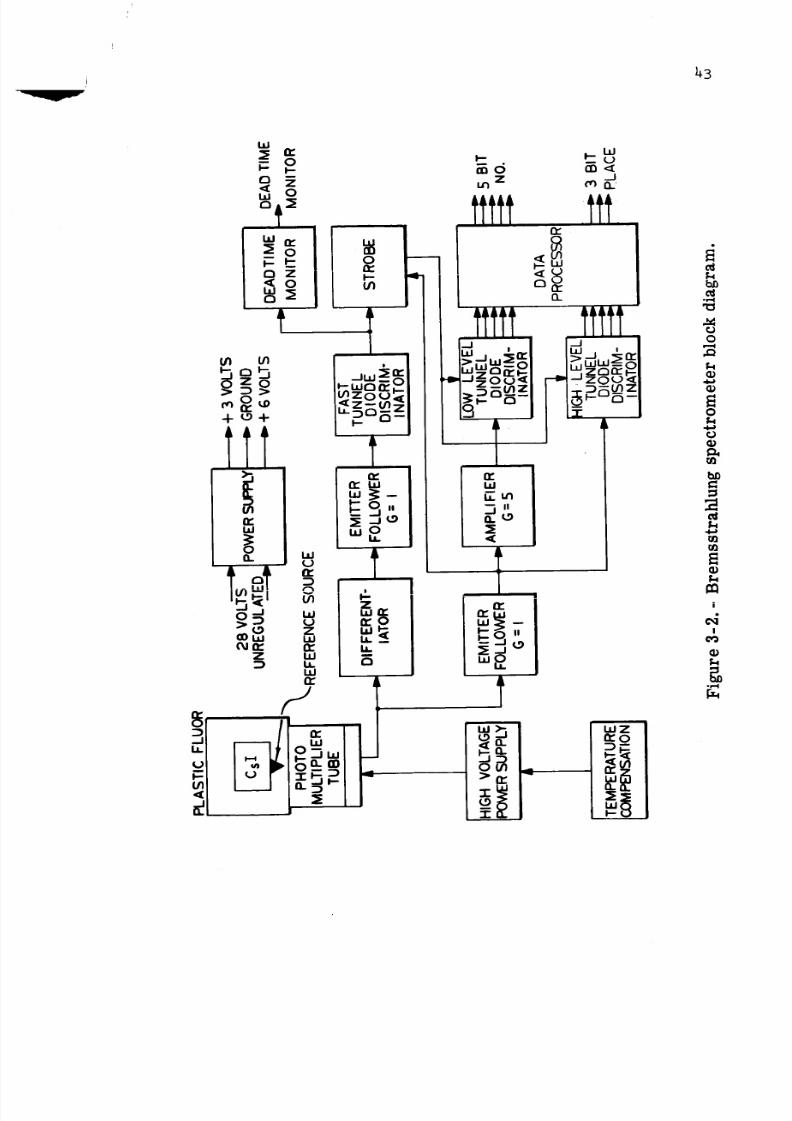
The bremsstrahlung system block diagram is shown in figure 3-2. The
basic sensor is a CsI(TI) crystal surrounded by a plastic fluor of thick-
ness necessary to give a usable pulse height output for electrons and
protons in the anticipated energy regions. Photomultiplier-tube anode
signals consist of two components: (i) a fast component due to charged
particle interactions in the plastic fluor, and (2) a slow component re-
presenting energy deposition in the CsI(TI) crystal. The fast component
of the pulses is separated by means of a 10-nanosecond differentiator.If the fast component exceeds a threshold of approximately i00 keV, it
will produce an output used to inhibit the analysis of the slow component
of the pulse since such an output corresponds to a charged-particle event
rather than a bremsstrahlung interaction in the CsI(TI) crystal. To con-
vert the tunnel-diode discriminators into a differential pulse-height
analyzer, a strobe pulse is generated which serves to interrogate the
tunnel-diode discriminators at a time just following the peak of the
signal pulse. Suitable coincidence logic within the tunnel-diode dis-
criminators produces an output pulse from the highest tunnel-diode dis-
criminator. The pulses from the various channels of this differential
pulse-height analyzer are accumulated in binary counters from the
10-cycles-per-second telemetry clock pulse. In order to accommodate the
very wide dynamic range of count rate anticipated, a data compression
system is employed. The compression system contains five bits of number
information and three bits of place information. Since the five-bit num-
ber represents a binary number from 1 to 32, and the three-bit place in-
formation represents a multiplier from 1 to 28, the largest number that
can be transmitted is 213, or 8192, and the smallest number is 20 , or 1.
8/7/2019 Manned Spaceflight Experiments Gemini 10 Mission Interim Report
http://slidepdf.com/reader/full/manned-spaceflight-experiments-gemini-10-mission-interim-report 45/146
38
behind the command pilot's seat, about shoulder height. The telemetry
complement consists of eight bilevel 10-per-second telemetry channelssampled in parallel, two 1.25-per-second analog channels, and one 10-
per-second telemetry pulse synchronized with the bilevel word.
The bremsstrahlung spectrometer is designed to determine gamma flux
and energy spectra with ±5-percent accuracy between lO0 and 4000 keV.
The data will be time-correlated with exterior electron measurements.
Determination of bremsstrahlung fluxes with this accuracy is a consid-
erable improvement over existing bremsstrahlung calculations. The flux
of electrons with energies above 250 keV should be between i0 _ and
2106 electrons/cm /sec in the South Atlantic Magnetic Anomaly at an alti-
tude of 300 kilometers.
The calculation of the anticipated bremsstrahlung count rate is, of
course, crude due to lack of information concerning spacecraft shielding
and orientation in the directional electron field. For purposes of ob-
taining a maximum count rate, the following assumptions are made:
(a) The spacecraft is a uniform sphere of radius d.
(b) The spacecraft is oriented such that approximately lO0 percent
of its area is producing bremsstrahlung photons.
(c) The efficiency of the number of bremsstrahlung photons produced
per electron per unit time is one percent.
The bremsstrahlung production rate R radiating into hn steradians
of solid angle will be the electron flux F times the spacecraft surface
area A times the efficiency E, as follows:
R = F A E = 10 6 × rwd 2 × 10 -2 = 4wd 2 × 10 4 photons/sec
The solid angle subtended by a point on the spacecraft surface to the de-
tector is
= _D2/4 D 2
A 4_d 2 16d 2
8/7/2019 Manned Spaceflight Experiments Gemini 10 Mission Interim Report
http://slidepdf.com/reader/full/manned-spaceflight-experiments-gemini-10-mission-interim-report 46/146
3. EXPERIMENT M409 (MSC-7), BREMSSTRAHLUNG SPECTROMETER
37
By Reed S. Lindsey
NASA Manned Spacecraft Center
SUMMARY
N6 -14 53
Preliminary analysis of data from the Gemini X mission indicates
that the bremsstrahlung spectrometer functioned as planned. Bremsstrah-
lung relative countrate-time spectra are presented for revolutions 6, 20,
32, and 34. It will be possible to construct flux-energy spectra for
comparison to theoretically predicted spectra to determine the validity
of calculational techniques.
OBJECTIVE
The objective of the Bremsstrahlung Spectrometer (M409) experiment
is to determine the bremsstrahlung flux-energy spectra inside the Gemini
spacecraft while passing through the South Atlantic Magnetic Anomaly
region. The spectra will be compared with computer-predicted brems-
strahlung spectra using data from the Beta Spectrometer (M408) experi-
ment.
Secondary gamma rays produced in the Gemini spacecraft material by
trapped electrons are not expectedto reach biologically significant
levels. On long-duration missions which may be flown in high trapped-
electron flux environments, the problem attains considerably more impor-
tance. The calculations of bremsstrahlung radiation involve uncertain-
ties due to the small amount of information available on cross-section
interaction and the complex, heterogeneous makeup of the spacecraft.
The bremsstrahlung detector was designed to give a time-differentiated
measurement of the electron-induced gamma rays over a large section of
the vehicle.
EQUIPMENT
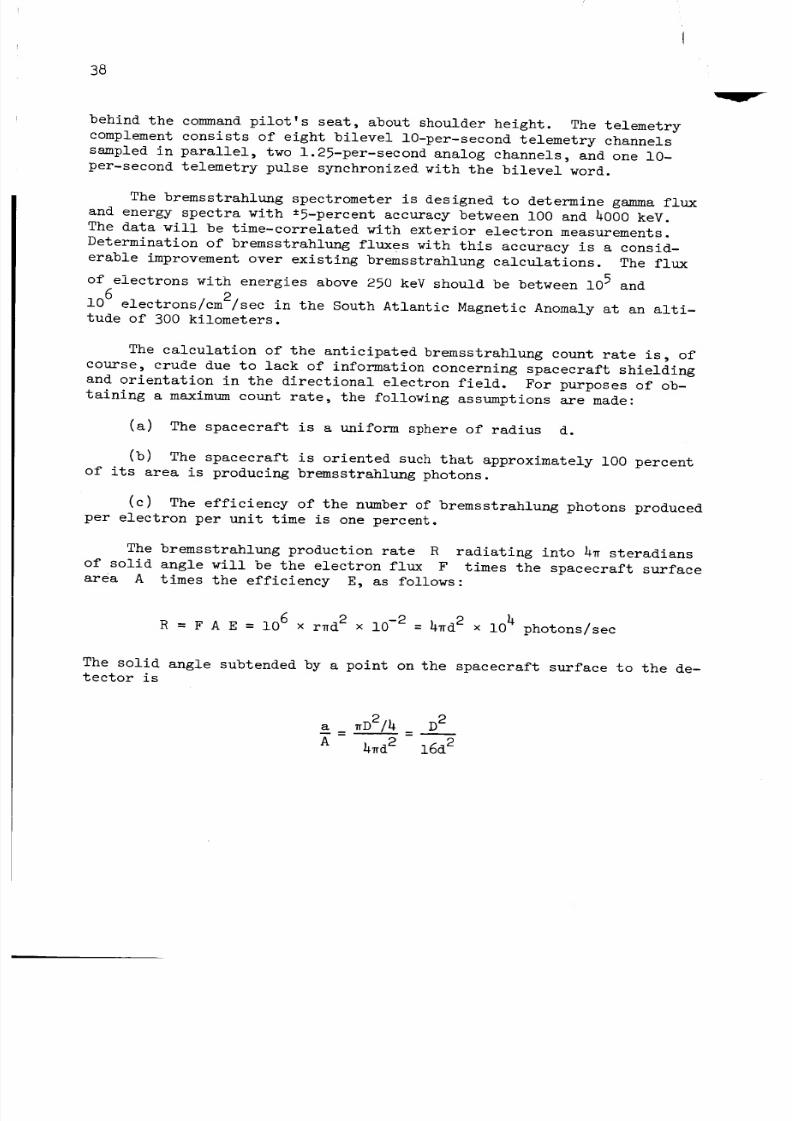
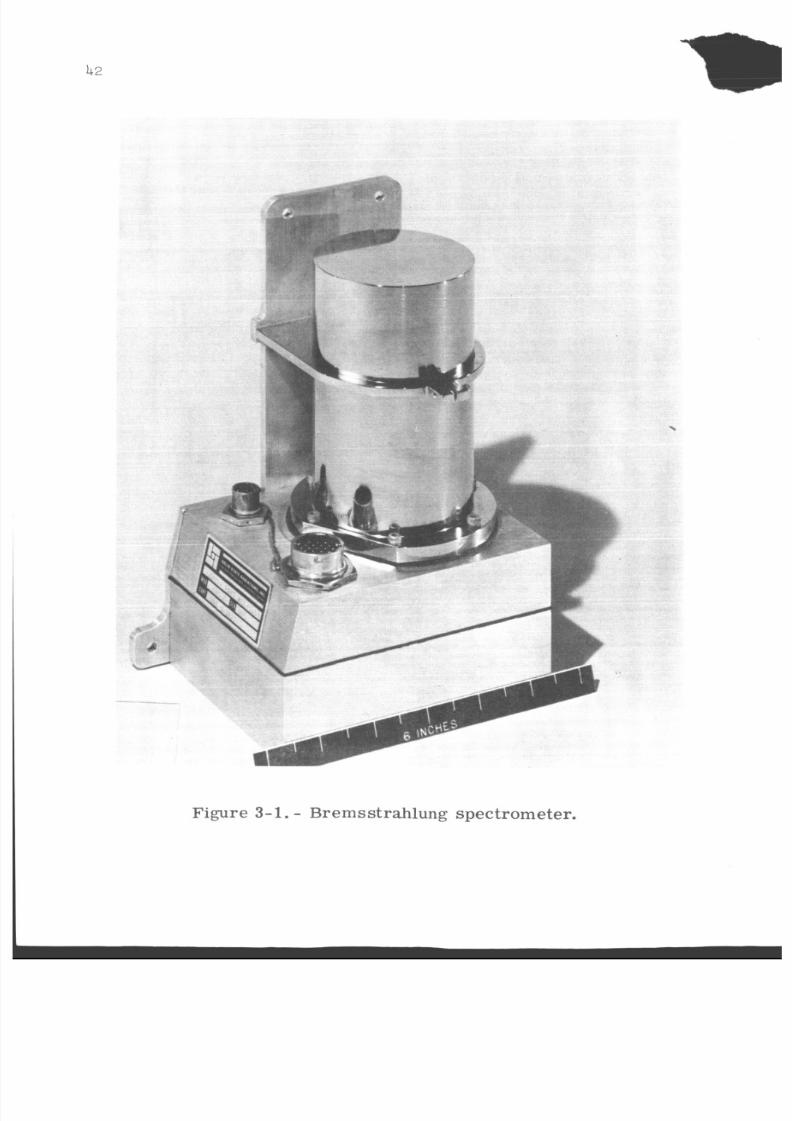
The spectrometer (fig. 3-1) is of the standard phosphor-plastic de-
sign. It is a 10-channel spectrometer covering the energy range 0.1 MeV
to 2.0 MeV. The spectrometer occupies less than 148 cubic inches, weighs
less than 7.5 pounds and requires 2 watts at 28 volts dc. Location is
8/7/2019 Manned Spaceflight Experiments Gemini 10 Mission Interim Report
http://slidepdf.com/reader/full/manned-spaceflight-experiments-gemini-10-mission-interim-report 47/146
41
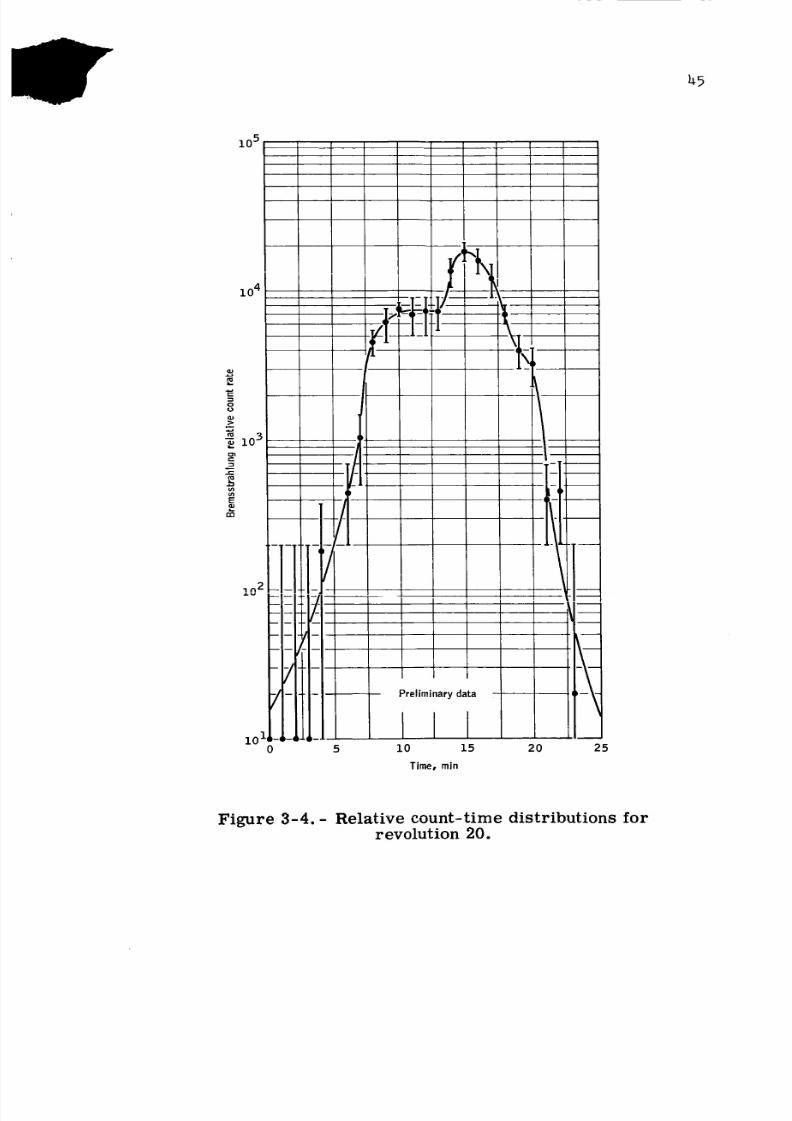
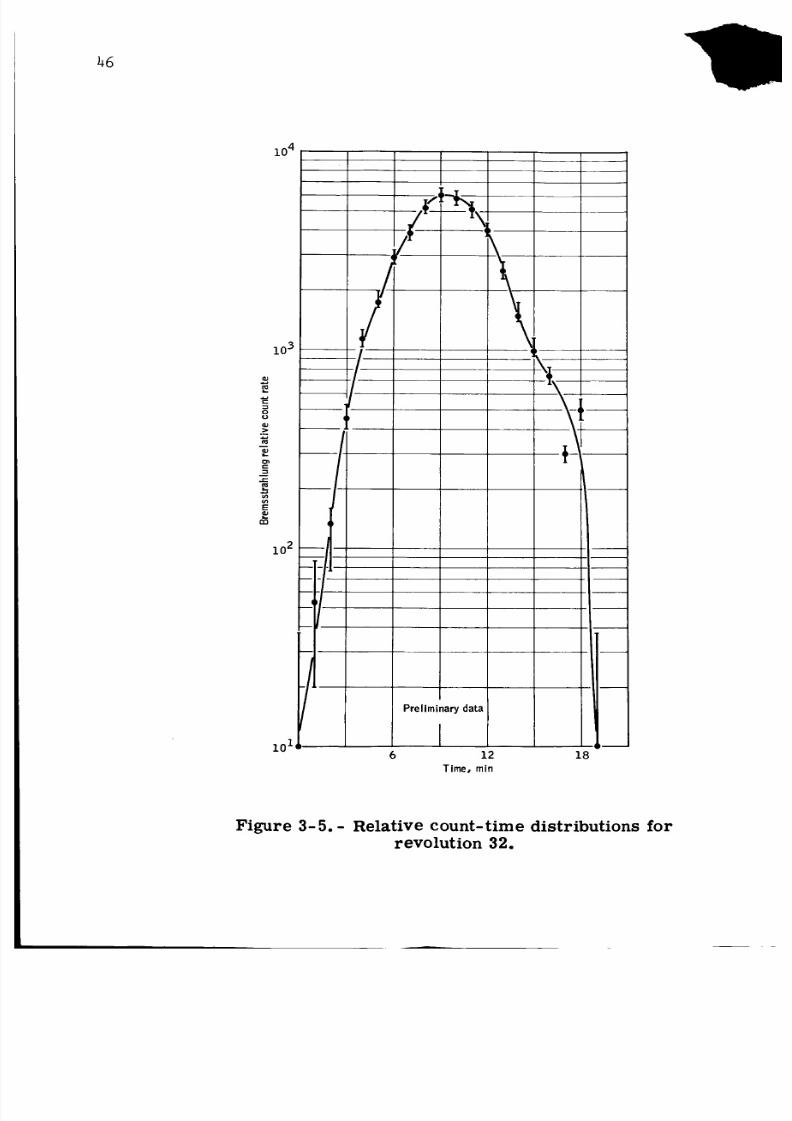
Although absolute bremsstrahlung flux-energy spectra resulting fromthe Gemini X mission have not as yet been deduced, somepreliminary rela-tive countrate-time spectra are available. Figures 3-4 and 3-5 are rela-
tive count-time distributions for passagesthrough the magnetic anomalyregion on revolutions 20 and 32, respectively. The curve shape in fig-ure 3-4 indicates that the spacecraft was changing altitude thereby mod-ifying the bremsstrahlung flux at the location of the spectrometer.During the time figure 3-5 data were taken, no change in spacecraft alti-tude occurred resulting in a spectrum similar in shape to an electronflux-time spectrum for a similar traversal of the anomaly. Figures 3-6
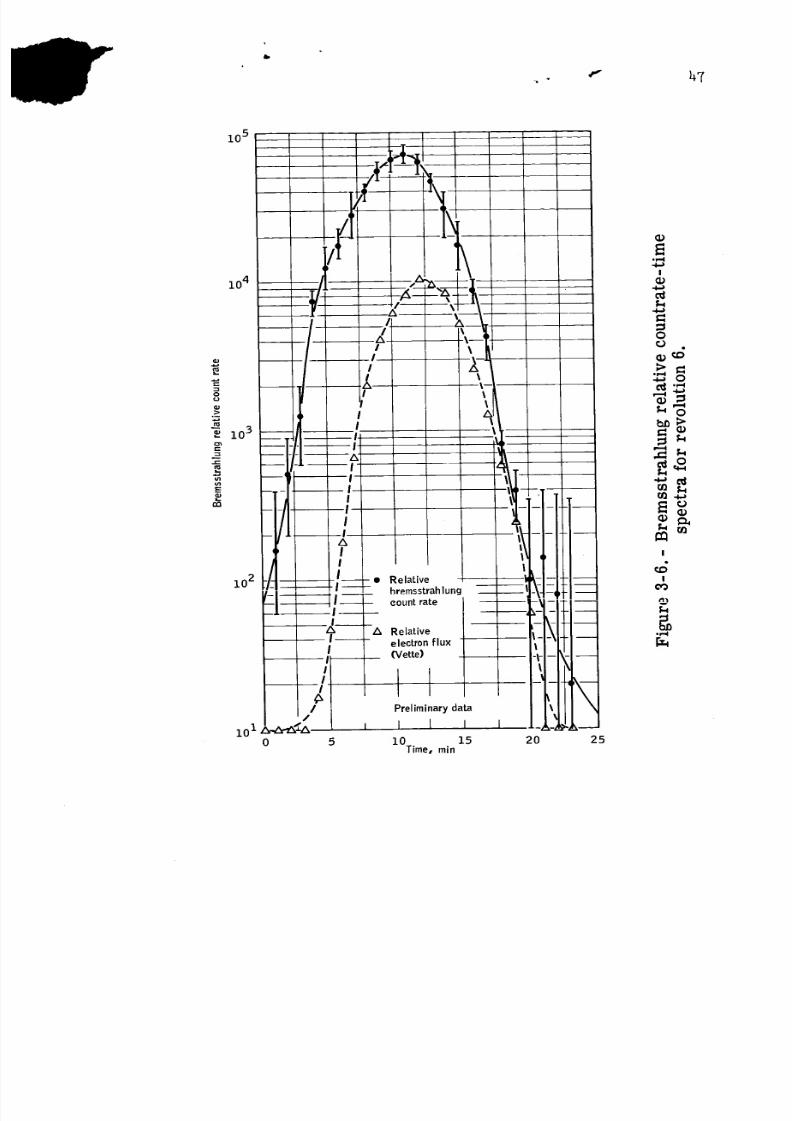
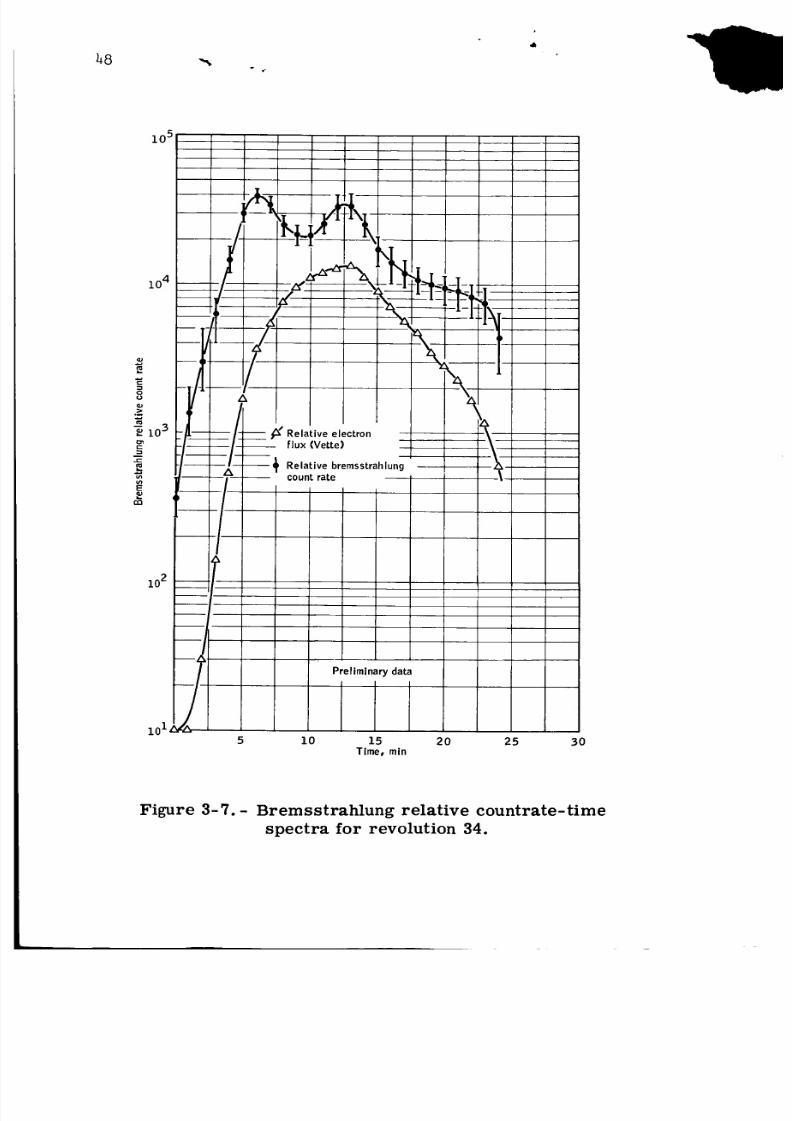
z-e_.veand 3-7 are bremsstrahlung -- _+_ countrate-time spectra for revolu-
tions 6 and 34, and electron relative flux-time spectra for the same
points as taken from the following publication: Models of the Trapped
Radiation Environment, Volume I entitled "Inner Zone Proton and Elec-
trons," by James I. Vette (NASA SP-3024, 1966). Unfortunately, no datawere available from the Beta-Spectrometer Experiment M408 (MSC-6) for
these passes. The figures show that it should be possible to draw a
strong correlation between electron and bremsstrahlung fluxes to provide
a means of monitoring bremsstrahlung calculational techniques. The rath-
er strange behavior of the bremsstrahlung curve of figure 3-7 is not yet
explained; however, one interesting fact is that the bremsstrahlung
energy-flux spectral shape changed during the depressed portion of the
curve. Detector efficiency corrections may result in a more regular
shape.
It will be possible to construct bremsstrahlung flux-energy distri-
butions for each traversal of the magnetic anomaly region and to complete
the bremsstrahlung dose at the location of the detector for comparison
to dose calculations resulting from theoretically produced bremsstrahlung
spectra.
8/7/2019 Manned Spaceflight Experiments Gemini 10 Mission Interim Report
http://slidepdf.com/reader/full/manned-spaceflight-experiments-gemini-10-mission-interim-report 48/146
42
W ’ I
Figure 3-1. - Bremsstrahlung spectrometer.
8/7/2019 Manned Spaceflight Experiments Gemini 10 Mission Interim Report
http://slidepdf.com/reader/full/manned-spaceflight-experiments-gemini-10-mission-interim-report 49/146
i43
W
_6 c0,_Z __1c'_ £L.
A_kAAlk _ _k4 ¸
| | | | | f - . .
I,,LI
I'--
_oW
0 z
0ocI,,,- ll.-
0c
w
Onro_ ._
AAAIA AAAAA "_
,-I .... ," _ ..... 0
- Wzo_N
n¢ i _w _
,,I( m
, _
t_n" i i
_. _,
_ go_-,I
_-,,,o_2
_ I_Z_,5__z_-
+ I _- o
11-
z
!o'" lv
I/1
i.)zLI.IO: U.W --
W
!
S
0._ -5 w
"-rk_ i.i./
8/7/2019 Manned Spaceflight Experiments Gemini 10 Mission Interim Report
http://slidepdf.com/reader/full/manned-spaceflight-experiments-gemini-10-mission-interim-report 50/146
44I
>-{/1
_LIJZ_-
_z --.O0
_J
a.r_Z_
o:_--0
D:LL
.d
°_,,I
e_
0
_J0
!
_4!
I])
8/7/2019 Manned Spaceflight Experiments Gemini 10 Mission Interim Report
http://slidepdf.com/reader/full/manned-spaceflight-experiments-gemini-10-mission-interim-report 51/146
45
10 5
10 4
°_
-_1o3
10 2
/
-!I_/
_s
Preliminary data
I m
ilolu_:
0 5 i0 15 20 25
Time, min
Figure 3-4.- Relative count-time distributions for
revolution 20.
8/7/2019 Manned Spaceflight Experiments Gemini 10 Mission Interim Report
http://slidepdf.com/reader/full/manned-spaceflight-experiments-gemini-10-mission-interim-report 52/146
46
104
°-
=_
m
on_
/'°3S
10 2
rrt_
/
/ Preliminary data
i0I,6 12 18
Time, min
Figure 3-5.- Relative count-time distributions for
revolution 32.
8/7/2019 Manned Spaceflight Experiments Gemini 10 Mission Interim Report
http://slidepdf.com/reader/full/manned-spaceflight-experiments-gemini-10-mission-interim-report 53/146
r a- 47
ca
nn
10 5
10 4
i
/\
Relative
hremsstrahlungcount rate
L_ Relative
electron flux
(Vette)
Preliminary data
__.
i0 15 20Time, min
q_
,I--I
4-a
I
q,).4--,I,
oJ
.4-a
0¢.)
6=o
0l:tO I>
0
r,0 .._.J
q_
I
I
¢o
0.)
*el
101 ,
0 5 25
8/7/2019 Manned Spaceflight Experiments Gemini 10 Mission Interim Report
http://slidepdf.com/reader/full/manned-spaceflight-experiments-gemini-10-mission-interim-report 54/146
48
10 5
oo
_o3
_I I_I
104 -- / "
i C coun_rate
10 2
i01 _i Prelimlniry data
5 10 15 20 25Time, min
30
Figure 3-7. - Bremsstrahlung relative countrate-time
spectra for revolution 34.
8/7/2019 Manned Spaceflight Experiments Gemini 10 Mission Interim Report
http://slidepdf.com/reader/full/manned-spaceflight-experiments-gemini-10-mission-interim-report 55/146
49
4. EXPERIMENT M410 (MSC-8), COLOR PATCH PHOTOGRAPHY
By John R. Brinkmann and Robert_L. JonesNASA Manned Spacecraft Cen_r
! v
SUMMARY /
//
A slate supporting four calibrated co!or targets was photographed
during Gemini X extravehicular activity (EVA) to determine if existing
outdoor-type color fiLras can accurately reproduce colored objects in the
environment of space. The results indicate that color film can be used
to obtain photographs in space with a high degree of color fidelity.
14154
OBJECTIVE
In the Mercury and Gemini programs, the crew's interpretation of
color rendition often did not agree with that shown in their flight
films. Prior to the performance of the color patch experiment the rea-
sons for the apparent color shifts were not understood. If Apollo pho-
tography, particularly that exposed on the lunar surface, is to be of
scientific value, every effort must be made to insure true color fidel-
ity in the resulting photography. Most geoscientific disciplines, such
as photogeology, oceanography, the various agricultural sciences, hy-
drology, air and water pollution, meteorology, and many other possible
applications, require a precise knowledge of the true color for inter-
pretation of the results.
A preliminary analysis of the various factors which could cause the
apparent false color rendition in space photography was conducted by
personnel of the MSC Photographic Laboratory and Space Science Division.
The results of the analysis indicated that the change could be due to
the unattenuated solar spectrum for which the film may not be balanced.
Normal outdoor color film is spectrally balanced for a combination ofsunlight and blue skylight, which is not present in space. To determine
if color film can accurately reproduce color when photographed in space-
environment conditions, the color patch experiment was proposed for the
Gemini Program.
8/7/2019 Manned Spaceflight Experiments Gemini 10 Mission Interim Report
http://slidepdf.com/reader/full/manned-spaceflight-experiments-gemini-10-mission-interim-report 56/146
5O
EQUIPMENT
The experimental equipment shownin figure 4-1 consisted of a color
patch slate, a 3-ft extension rod, and a 70-mmcamera. The color patchslate, manufactured by the Erie Ceramic Company,was an 8 by 8 by1/16-inch titanium plate, supporting four-color targets composedof aceramic material in a matte finish. The four colors were National Bu-reau of Standards primary colors (red, blue, and yellow) and neutralgray.
To simplify the experiment, a 3-ft rod of four sections ofi/2-inch-diameter aluminum, 9-inches long, was provided to hold thecolor patch at a predesignated distance of 36 inches from the camera.The cameraand color patch were attached to the rod by a dovetail fit-ting.
A 70-mmMaurer space camera, fitted with an f/2.8, 80-mmXenotarlens was used. The camerawas selected for its superior optical quali-ties suitable for a photographic experiment of this type. To reducethe effect of ultraviolet energy on the film, a 0-52 Corning glass fil-ter with a cutoff at 3500 A was used.
The cameraused 70-mmfilm with a 2.5-mii base. This film had ex-cellent color-reproducing qualities and had been used on previousMercury and Gemini flights. Except for 2.5-mii base, the film is iden-tical to EktachromeMScommercial Kodak film.
PROCEDURE
Prior to the Gemini X mission, the flight color patch was photo-graphed under controlled lighting conditions at Kennedy Space Center,utilizing the flight camera and film. A series of six exposures weremadeat 1/250 sec at f/8, 1/250 sec at f/ll, and 1/250 sec at f/16.The purpose was to obtain photographs which could be comparedto simi-lar postflight photographs taken under the samecontrolled setup. This
would determine if the film had undergone any changes during the mis-sion.
During the flight the crew were to assemble the experiment and thepilot was to photograph the color patch nine times while standing inthe spacecraft seat (fig. 4-2) and return the color patch slate to thespacecraft for postflight calibration and analysis. The exposures wereto be madein groups of three, beginning with 1/250 sec at f/8, followed
8/7/2019 Manned Spaceflight Experiments Gemini 10 Mission Interim Report
http://slidepdf.com/reader/full/manned-spaceflight-experiments-gemini-10-mission-interim-report 57/146
51
by 1/250 sec at f/16, and ending with 1/250 sec at f/ll. The solarillumination angle was to be within 30° of the patch nominal.
RESULTS
Due to unexpected trouble in the spacecraft environmental controlsystem (ECS), the standup EVAwas terminated prior to completion of theexperiment. To facilitate spacecraft ingress, the color patch and rodwere discarded. Before the ECStrouble, the crew obtained four colorpatch photographs at an exposure of 1/250 sec at f/8. The remainingfilm in the magazinewas used to photograph the earth weather and ter-rain patterns.
Although the experiment was not fully completed, the pictures pro-vided enough data from which certain conclusions can be drawn.
The results of a subjective comparison of the flight film and thebackup color patch, which was identical to the flight hardware, confirmthe suitability of existing film to record true colors in space.
Density measurementsthat were madefrom the gray section of theflight film exposures showeda difference of i0 percent between thefirst and third exposures, and a difference of 17 percent between thelightest of the two and the second exposure which is most dense. Thedensity difference can either be attributed to variances in the shuttermechanism, slight changes in the incident illumination angle, or a com-bination of both.
Saturation of the four colors on the first and third exposures arealmost identical, while the colors on thc second exposure are _icherbecause they more nearly approach the nominal exposures of 1/250 secat f/ll.
CONCLUSION
The experiment provided sufficient information to confirm thatobjects can be photographed in spacewith a high degree of color fidel-ity using existing materials. It can be generally stated that availablecolor film is balanced to the solar spectrum in space, and the effect ofultraviolet energy appears to be negligible to film degradation.
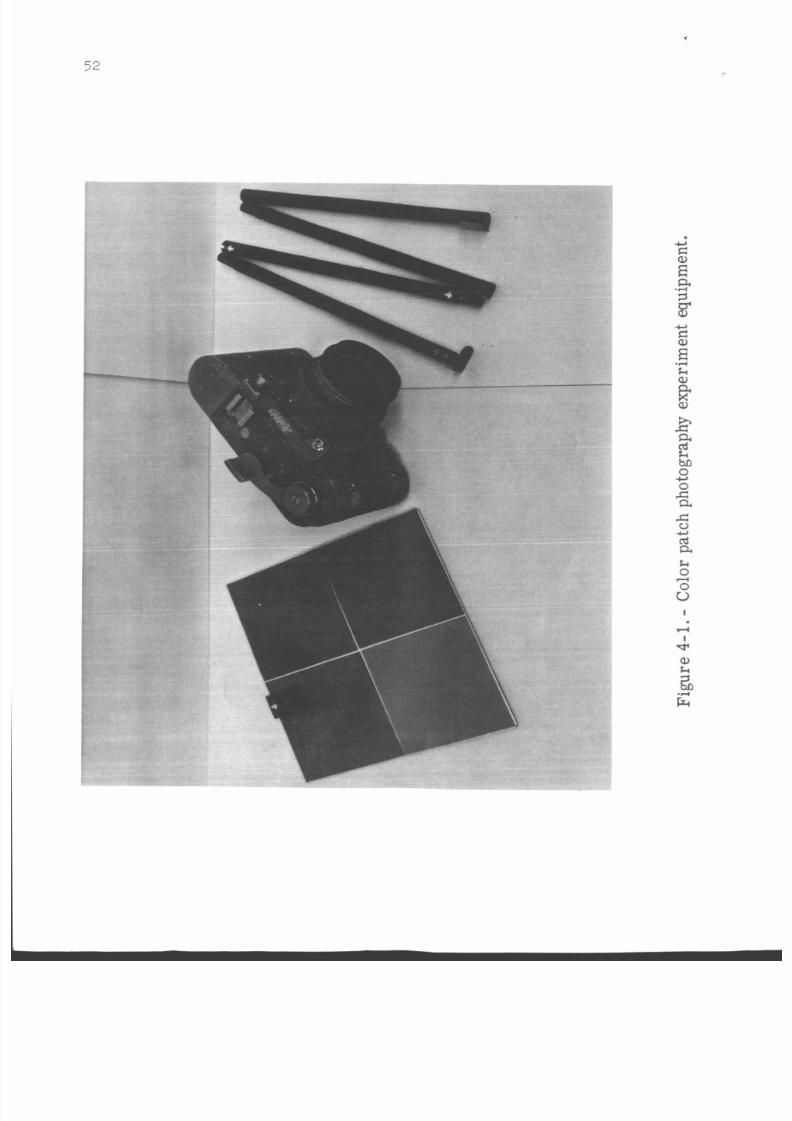
8/7/2019 Manned Spaceflight Experiments Gemini 10 Mission Interim Report
http://slidepdf.com/reader/full/manned-spaceflight-experiments-gemini-10-mission-interim-report 58/146
52
k0
0
4u
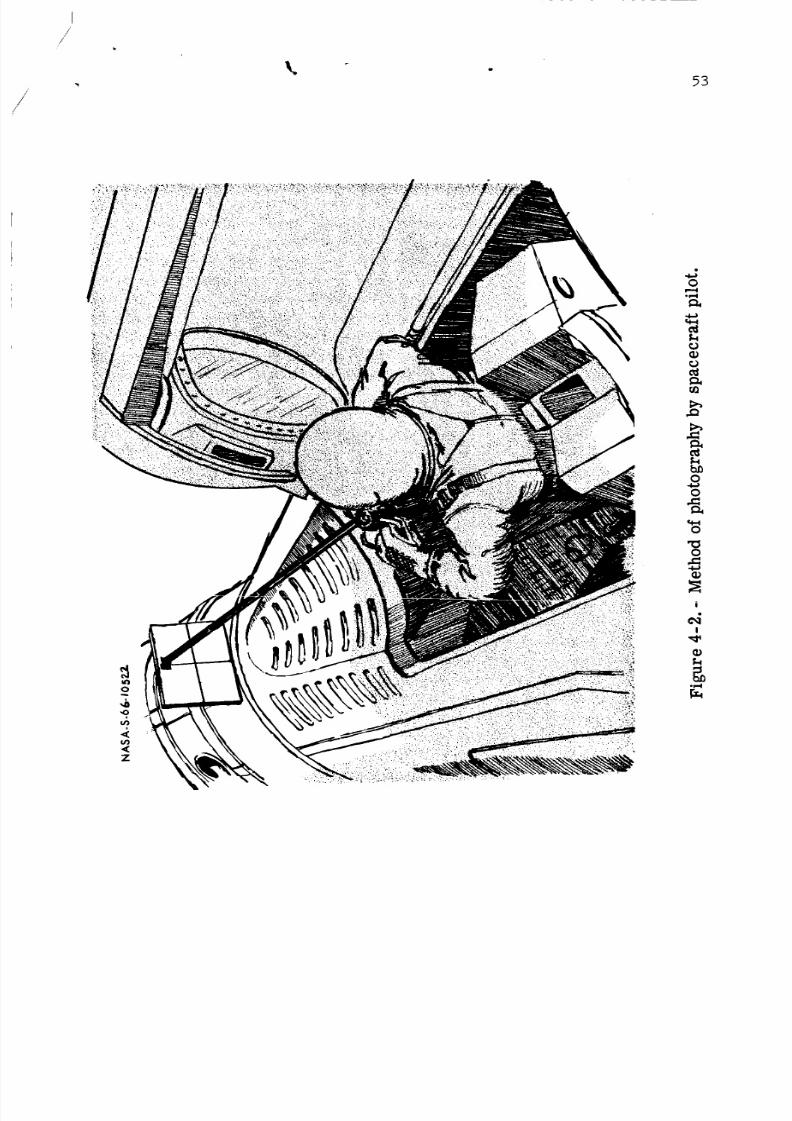
8/7/2019 Manned Spaceflight Experiments Gemini 10 Mission Interim Report
http://slidepdf.com/reader/full/manned-spaceflight-experiments-gemini-10-mission-interim-report 59/146
I/
J
53
J0
w===ltl-I
b_0
0
0
0
i
!
Q)r_
.r-I
8/7/2019 Manned Spaceflight Experiments Gemini 10 Mission Interim Report
http://slidepdf.com/reader/full/manned-spaceflight-experiments-gemini-10-mission-interim-report 60/146
8/7/2019 Manned Spaceflight Experiments Gemini 10 Mission Interim Report
http://slidepdf.com/reader/full/manned-spaceflight-experiments-gemini-10-mission-interim-report 61/146
56
EQUIPMENT
This experiment required the use of the photometer provided for
Experiment D005 (D-5), with the addition of two optical filters which
fit over the photometer lens. The instrument consisted of an objective
lens which received landmark-reflected sunlight radiation and optically
transferred it to a field stop and them to a photomultiplier sensor.
The amplified output from the photomultiplier was sampled l0 times per
second, and the resulting signal was recorded onboard the spacecraft by
means of the standard Gemini telemetry system.
The linearity of the photomultiplier and its associated circuitry
was typically better than 1 percent of full scale. The dynamic range of
the instrument was designed to cover the expected luminance range of sun-
lit terrain as follows:
Maximum landmark
luminance ................ 2.h candles/cm 2
(7000 foot-lamberts)
Minimum landmark
luminance ................ 0.02 candles/cm 2
(58 foot-lamberts)
The signal-to-noise ratio of the photometer was estimated to be in
excess of 800:1 for the minimum landmark luminance using the sample rate
of l0 per second.
The probable error of measurement was expected to be near 3 percent
after adjustment for near-maximum signal level. Error due to scattered
light in the photometer during an observation could not be assessed
accurately, except that it would tend to reduce measured contrast.
Landmark contrast data for use in guidance and navigation design
in Project Apollo have been calculated by extrapolation of airborne
spectro-photometric measurements of photographs taken during Gemini and
other orbital missions. A comparison of these data with direct meas-
urements obtained in this experiment was expected to verify correctness
of calculated contrasts as well as reduce the present uncertainty of
landmark contrast variance with change-of-sun-aspect angle.
8/7/2019 Manned Spaceflight Experiments Gemini 10 Mission Interim Report
http://slidepdf.com/reader/full/manned-spaceflight-experiments-gemini-10-mission-interim-report 62/146
57
PROCEDURES
The photometer was to be handheld, and aimed through the right-hand
window as it was for the Star Occultation Navigation D005 (D-5) experi-
ment. Several minutes before the appearance of the target landmark, the
observer was to turn on the photometer power source. The spacecraft was
to be turned so that the photometer could be pointed at the landmark.
The spacecraft was to be positioned so that the sun was behind the ob-
server, thus shading the spacecraft window from direct sunlight.
It was anticipated that the landmark would be recognizable at about
60 ° from the nadir. This would have allowed the observer time to aim
the photometer and adjust the instrument gain so that target area lumi-
nance would provide a strong signal level to the telemetry system. As
the command pilot tracked the landmark, the pilot alternately directed
the photometer at the land and water sides of the landmark. About 8 to
12 samples of each side were expected during each pass over a landmark.
The pilot was to have verbally described the landmark, cloud cover,
weather, sun aspect, and filter used. If available, operational camera
film was to be used to photograph a few landmarks to assist data valida-
tion.
RESULTS
This experiment was not performed by the flight crew because of
fuel-usage constraints and time limitations. The experiment was attempt-
ed on a previous Gemini mission; but, because of equipment failure, no
results were obtained. This experiment is not scheduled for eiflh_r re-
maining Gemini mission. Consequently, there are no results or conclu-
sions obtainable form the two attempts to perform this experiment.
8/7/2019 Manned Spaceflight Experiments Gemini 10 Mission Interim Report
http://slidepdf.com/reader/full/manned-spaceflight-experiments-gemini-10-mission-interim-report 63/146
PP_ECEDII_G PAGE BLAN_I_OT• FILMED. 59
6. EXPERIMENT S001 (S-l), ZODIACAL LIGHT PHOTOGRAPHY
By E. P. Ney, Ph.D. and W. F. Huch, Ph.D.
University of Minnesota
OBJECTIVE N88-141 56
The purpose of the zodiacal light photography SO01 (S-I) experiment
was to obtain exposures of several subjects of astronomical interest
using a lens setting of f/l and a speed of 30 seconds. These subjects
included the airglow (viewed in profile from above), the zodiacal light,
and the Milky Way.
EQUIPMENT
The camera was designed to view a wide-angle field of approximately
50 ° by 130 ° . Mechanically, it was the same kind of camera as that flown
on the Gemini V, Gemini VIII, and Gemini IX-A missions. The exposure
sequence was automatic and alternated 30-second exposures with lO-second
off periods. During these off periods, thrusters could be fired for
attitude-hold without exposing the film. The film used was 35-mm, high-speed, black and white.
PROCEDURES
The flight plan required that the camera be handheld on night
passes, with the pilot taking photographs through his window. The pilot
held the camera against the window during the exposure periods, sight-
ing past the camera and directing the command pilot to maneuver to appro-
priate positions. Astronomical objects were not in the command pilot's
field of view, and his role was to null the spacecraft rates. The planned
procedure required that photographs be taken with the following camera
orientations:
(I) Horizontal toward the west
(2) Alined along the Milky Way to include the southwest horizon
(3) Alined along the Milky Way in the zenith
8/7/2019 Manned Spaceflight Experiments Gemini 10 Mission Interim Report
http://slidepdf.com/reader/full/manned-spaceflight-experiments-gemini-10-mission-interim-report 64/146
6o
(4) Alined along the Milky Wayto include the northeast horizon
(5) Horizontal toward the northeast
(6) Horizontal toward the east
(7) Horizontal toward the south
RESULTS
I
The 20 photographs obtained are listed in table 6-I. The spacecraft
attitude held by the crew during the exposures was very adequate; however,
a combination of the following three factors make the pictures obtained
difficult to use quantitatively:
(i) The film was only one-half as sensitive as the film used dur-
ing the Gemini IX-A mission.
(2) Observations of the same star field in various exposures show
that light transmission through the dirty spacecraft window varied by
a factor of at least six.
(3) The earth horizon was not seen in all the pictures.
CONCLUSIONS
The results obtained from these pictures will be of qualitative or
geometrical value only. For example, the airglow heights are measura-
ble in two pictures showing the earth horizon. One picture confirms
the existence of a higher airglow layer at 200 to 300 kilometers. This
layer was also seen in the Gemini IX-A photography. One picture shows
the presence of wisps extending upward from the lower airglow layer.
These wisps had been seen for the first time in the Gemini IX-A S001
(S-l) experiment photographs. Complete analysis and interpretation willcontinue for several more months.
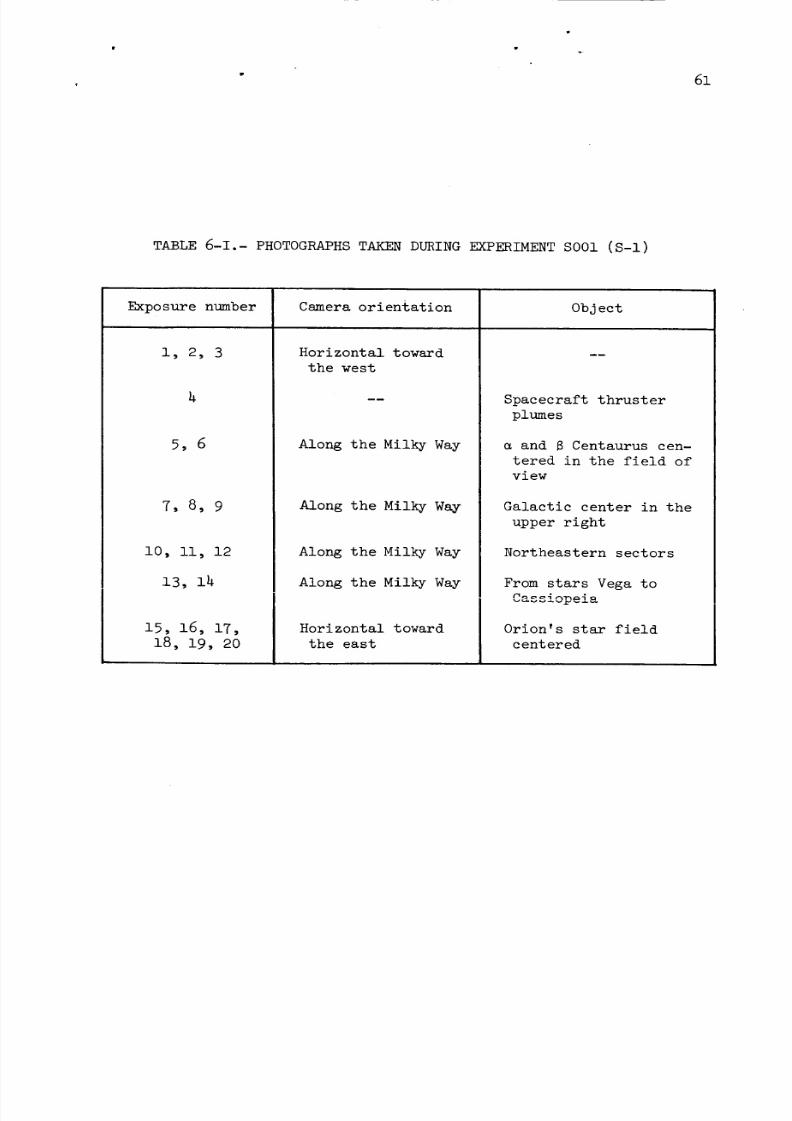
8/7/2019 Manned Spaceflight Experiments Gemini 10 Mission Interim Report
http://slidepdf.com/reader/full/manned-spaceflight-experiments-gemini-10-mission-interim-report 65/146
61
TABLE6-1.- PHOTOGRAPHSTAKENDURINGEXPERIMENTS001 (S-l)
Exposure number Cameraorientation Object
l, 2, 3 --
5,6
7, 8, 9
Horizontal toward
the west
Along the Milky Way
Along the Milky Way
Spacecraft thruster
plumes
and 6 Centaurus cen-
tered in the field of
view
Galactic center in the
upper right
i0, ii, 12
13, 14
15, 16, 17,
18, 19, 20
Along the Milky Way
Along the Milky Way
Horizontal toward
the east
Northeastern sectors
From stars Vega to
Cassiopeia
Orion's star field
centered
8/7/2019 Manned Spaceflight Experiments Gemini 10 Mission Interim Report
http://slidepdf.com/reader/full/manned-spaceflight-experiments-gemini-10-mission-interim-report 66/146
PF, ECEDING PAGE BLANK tq01" FILMED. .
,. T _
7. EXPERIMENT S005 (S-5), SYNOPTIC TERRAIN PHOTOGRAPHY
63
By Paul D. Lowman, Jr., Ph.D., and Herbert A. Tiedemann
NASA Goddard Space Flight Center
SUMMARY
p
I Approximately 75 pictures useful for the purposes of the synoptic
terrain photography experiment S005 (S-5) were taken on the Gemini X
flight. Areas covered include North Africa, parts of South America,
China, Formosa, and various oceanic areas. Despite various operational
difficulties, the experiment can be considered successful. Specific ap-
plications of the pictures obtained are apparent in geology, geography,
and oceanography.__[
OBJECTIVE
The objective of experiment S005 (S-5) on the Gemini X mission was
essentially the same as on previous missions: to obtain high-quality
color photographs of selected areas for geologic, geographic, and ocean-
ographic study. The last two categories represent the expansion of scopeof experiment S005 (S-5) to nongeological areas which began with the
Gemini VII flight. Strip photography, with overlapping coverage, was re-
quested for the following areas (in order of priority): Red Sea-Arabian
Peninsula, central and southern Mexico, West Pakistan, North Africa
_nu_-_u±_, Hoggar, _,,_ mt_m_+__ ...........Mm11_ngl,, and.... northwestern South
America and adjacent coastal waters. Individual photographs or pairs of
photographs were requested for the following areas: Mississippi River
mouth, Ganges River mouth, Bahama Islands and adjacent shelf, Philippine
Islands, and the Mekong delta.
EQUIPMENT
Two cameras were used: the 70-mmMaurer space camera, with Xenotar
f/2.8 lens (80-mm focal length), and the 70-mm Hasselblad super side-
angle camera, with Zeiss Biogon f/45 lens (38-mm focal length). Haze
filters were used. Film used in both cameras was Eastman Ektachrome MS
(SO 217), with a 55- by 55-mm format. The medium-speed color-reversal
film is on a 2.5-mil polyester base.
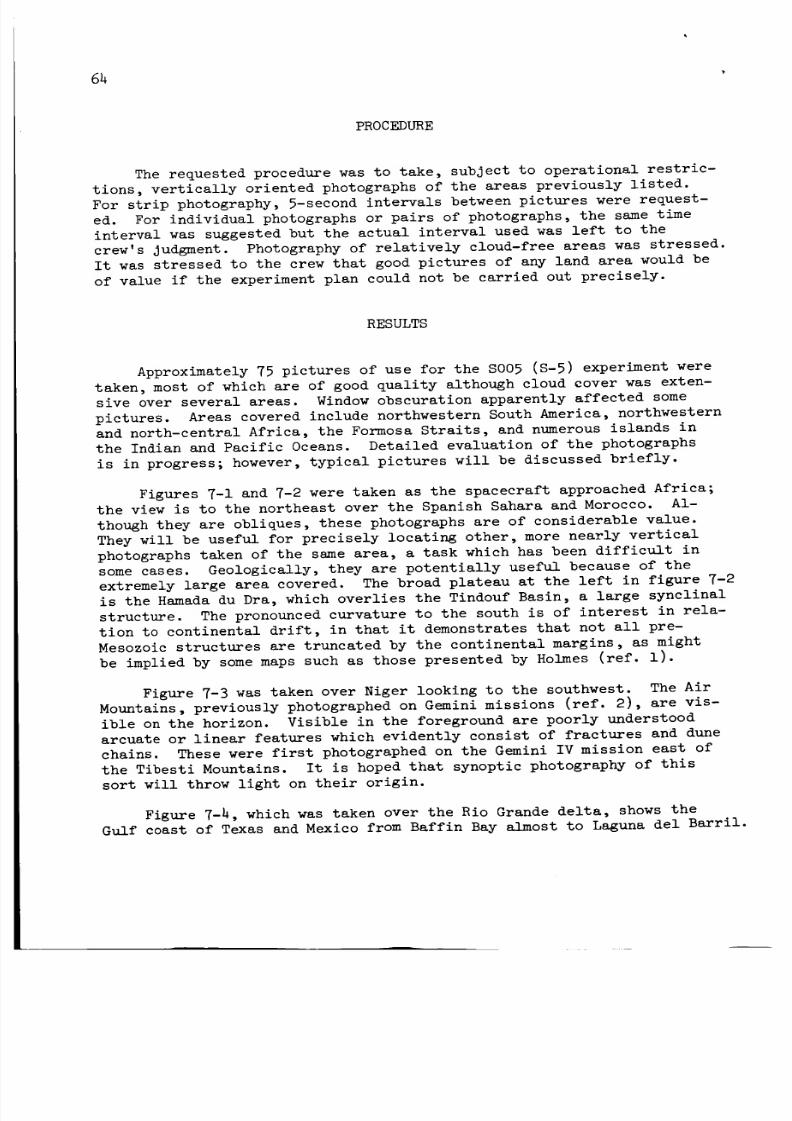
8/7/2019 Manned Spaceflight Experiments Gemini 10 Mission Interim Report
http://slidepdf.com/reader/full/manned-spaceflight-experiments-gemini-10-mission-interim-report 67/146
64
PROCEDURE
The requested procedure was to take, subject to operational restric-
tions, vertically oriented photographs of the areas previously listed.
For strip photography, 5-second intervals between pictures were request-
ed. For individual photographs or pairs of photographs, the same time
interval was suggested but the actual interval used was left to the
crew's Judgment. Photography of relatively cloud-free areas was stressed.
It was stressed to the crew that good pictures of any land area would be
of value if the experiment plan could not be carried out precisely.
RESULTS
Approximately 75 pictures of use for the S005 (S-5) experiment were
taken, most of which are of good quality although cloud cover was exten-
sive over several areas. Window obscuration apparently affected some
pictures. Areas covered include northwestern South America, northwestern
and north-central Africa, the Formosa Straits, and numerous islands in
the Indian and Pacific Oceans. Detailed evaluation of the photographs
is in progress; however, typical pictures will be discussed briefly.
Figures 7-1 and 7-2 were taken as the spacecraft approached Africa;
the view is to the northeast over the Spanish Sahara and Morocco. Al-though they are obliques, these photographs are of considerable value.
They will be useful for precisely locating other, more nearly vertical
photographs taken of the same area, a task which has been difficult in
some cases. Geologically, they are potentially useful because of the
extremely large area covered. The broad plateau at the left in figure 7-2
is the Hamada du Dra, which overlies the Tindouf Basin, a large synclinal
structure. The pronounced curvature to the south is of interest in rela-
tion to continental drift, in that it demonstrates that not all pre-
Mesozoic structures are truncated by the continental margins, as might
be implied by some maps such as those presented by Holmes (ref. 1).
Figure 7-3 was taken over Niger looking to the southwest. The Air
Mountains, previously photographed on Gemini missions (ref. 2), are vis-
ible on the horizon. Visible in the foreground are poorly understood
arcuate or linear features which evidently consist of fractures and dune
chains. These were first photographed on the Gemini IV mission east of
the Tibesti Mountains. It is hoped that synoptic photography of this
sort will throw light on their origin.
Figure 7-4, which was taken over the Rio Grande delta, shows the
Gulf coast of Texas and Mexico from Baffin Bay almost to Laguna del Barril.
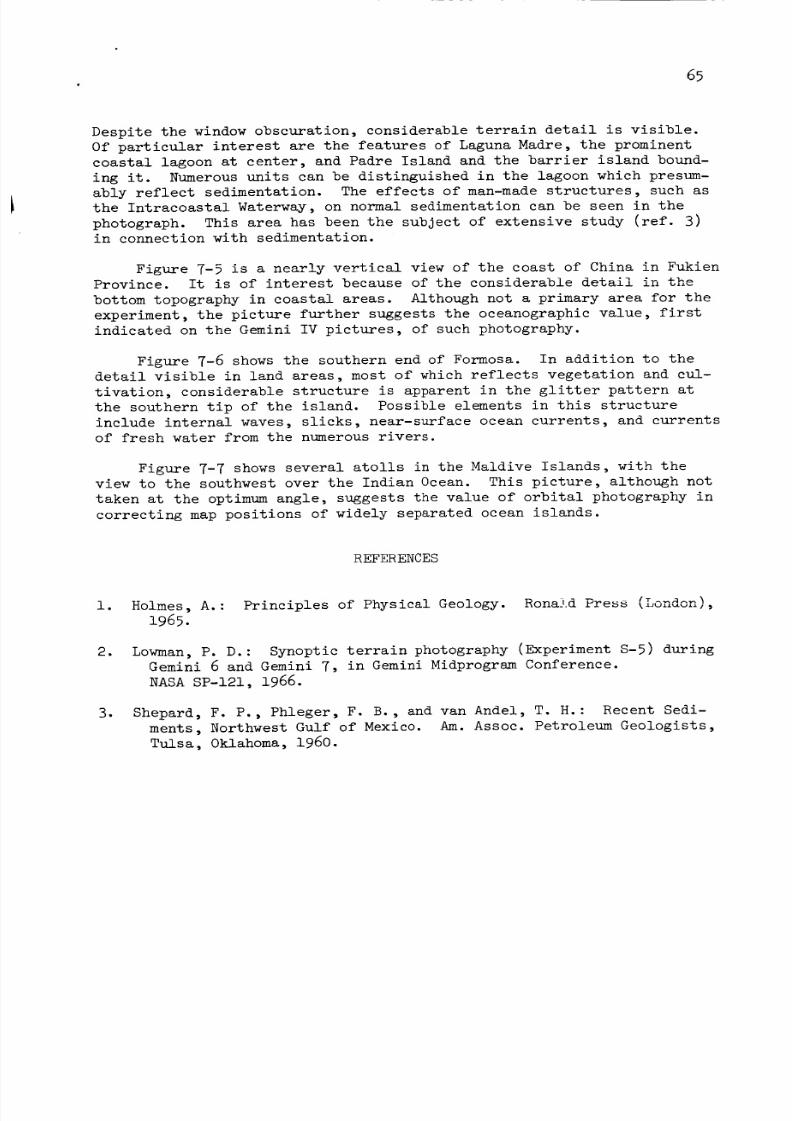
8/7/2019 Manned Spaceflight Experiments Gemini 10 Mission Interim Report
http://slidepdf.com/reader/full/manned-spaceflight-experiments-gemini-10-mission-interim-report 68/146
65
Despite the window obscuration, considerable terrain detail is visible.Of particular interest are the features of LagunaMadre, the prominentcoastal lagoon at center, and Padre Island and the barrier island bound-ing it. Numerousunits can be distinguished in the lagoon which presum-ably reflect sedimentation. The effects of man-madestructures, such asthe Intracoastal Waterway, on normal sedimentation can be seen in thephotograph. This area has been the subject of extensive study (ref. 3)in connection with sedimentation.
Figure 7-5 is a nearly vertical view of the coast of China in FukienProvince. It is of interest because of the considerable detail in thebottom topography in coastal areas. Although not a primary area for theexperiment, the picture further suggests the oceanographic value, firstindicated on the Gemini IV pictures, of such photography.
Figure 7-6 shows the southern end of Formosa. In addition to thedetail visible in land areas, most of which reflects vegetation and cul-tivation, considerable structure is apparent in the glitter pattern atthe southern tip of the island. Possible elements in this structureinclude internal waves, slicks, near-surface ocean currents, and currentsof fresh water from the numerousrivers.
Figure 7-7 showsseveral atolls in the Maldive Islands, with theview to the southwest over the Indian Ocean. This picture, although nottaken at the optimum angle, suggests the value of orbital photography in
correcting mappositions of widely separated ocean islands.
REFERENCES
l.
.
.
Holmes, A.: Principles of Physical Geology. RonaAd Press (London),
1965.
Lowman, P. D.: Synoptic terrain photography (Experiment S-5) during
Gemini 6 and Gemini 7, in Gemini Midprogram Conference.
NASA SP-121, 1966.
Shepard, F. P., Phleger, F. B., and van Andel, T. H.: Recent Sedi-
ments, Northwest Gulf of Mexico. Am. Assoc. Petroleum Geologists,
Tulsa, Oklahoma, 1960.
8/7/2019 Manned Spaceflight Experiments Gemini 10 Mission Interim Report
http://slidepdf.com/reader/full/manned-spaceflight-experiments-gemini-10-mission-interim-report 69/146
66
8/7/2019 Manned Spaceflight Experiments Gemini 10 Mission Interim Report
http://slidepdf.com/reader/full/manned-spaceflight-experiments-gemini-10-mission-interim-report 70/146
v
67
74 a
cdi
L
acdE
4
ka,30
a,
3
3.d
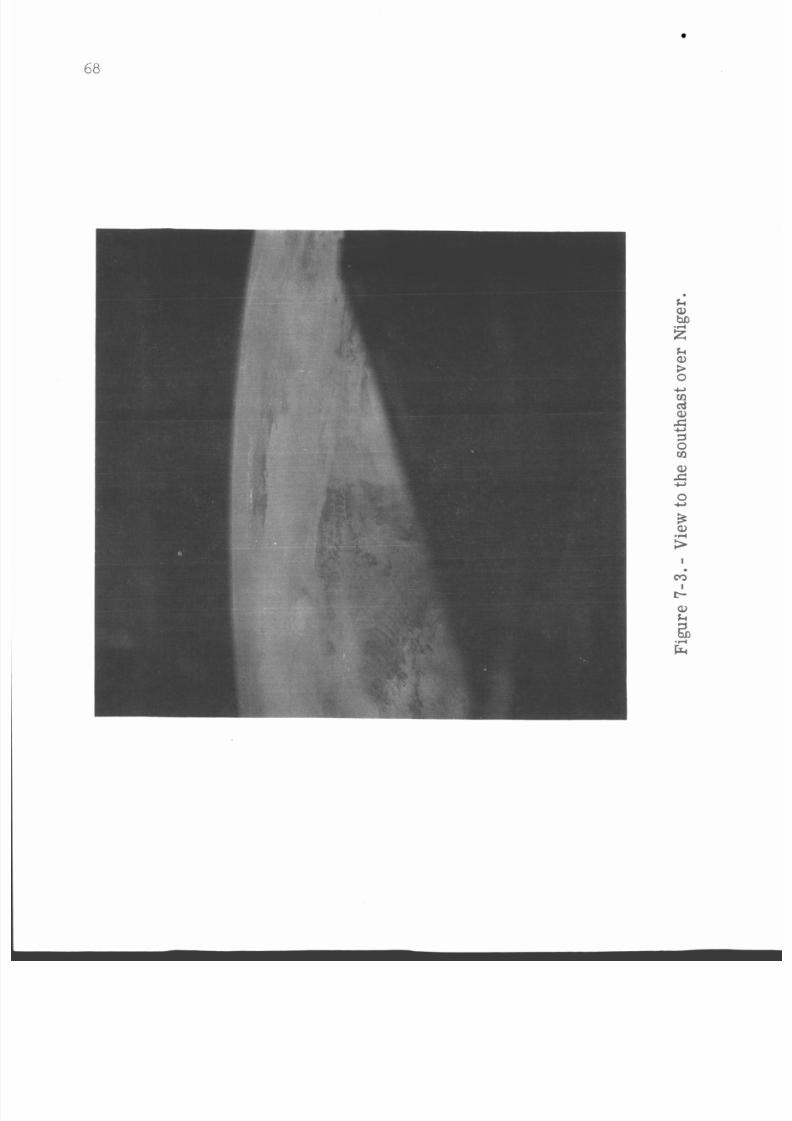
8/7/2019 Manned Spaceflight Experiments Gemini 10 Mission Interim Report
http://slidepdf.com/reader/full/manned-spaceflight-experiments-gemini-10-mission-interim-report 71/146
68
ia,ba
Eka,
30
mda,
10m
a,
0
u
3
5
3
u
a,
sI
mI
I?
a,
k
iz
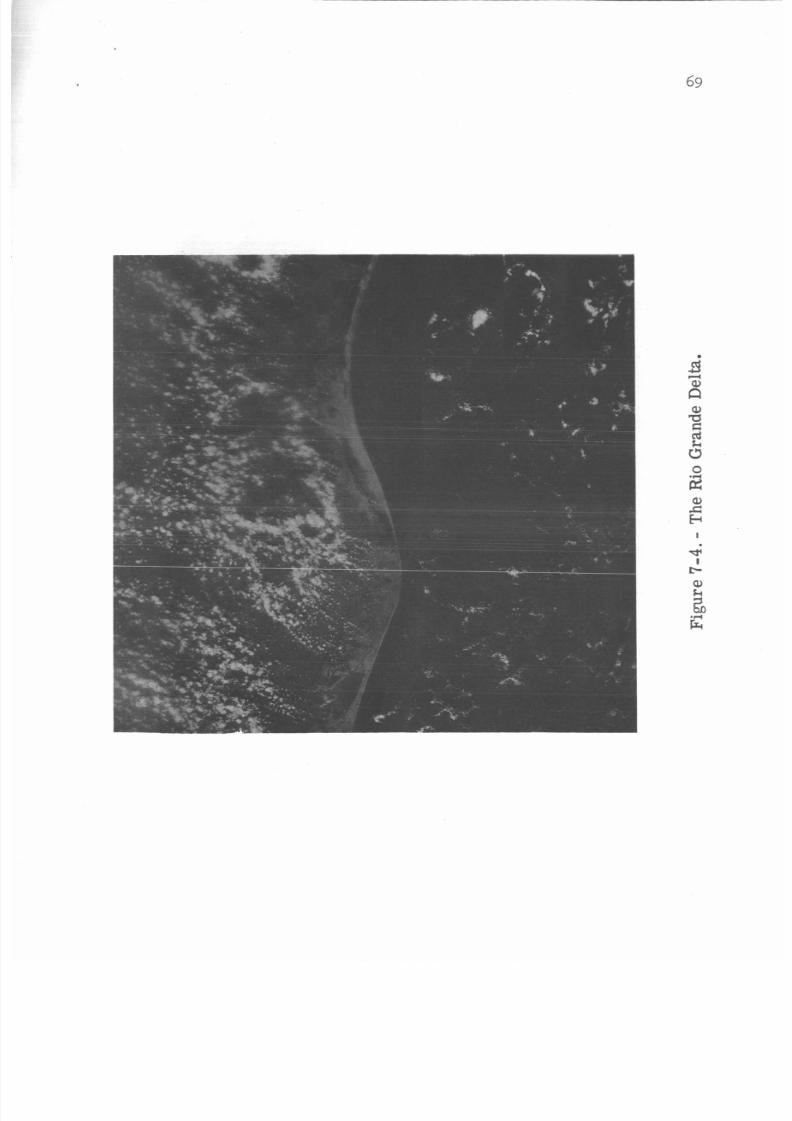
8/7/2019 Manned Spaceflight Experiments Gemini 10 Mission Interim Report
http://slidepdf.com/reader/full/manned-spaceflight-experiments-gemini-10-mission-interim-report 72/146
I
a,k
G
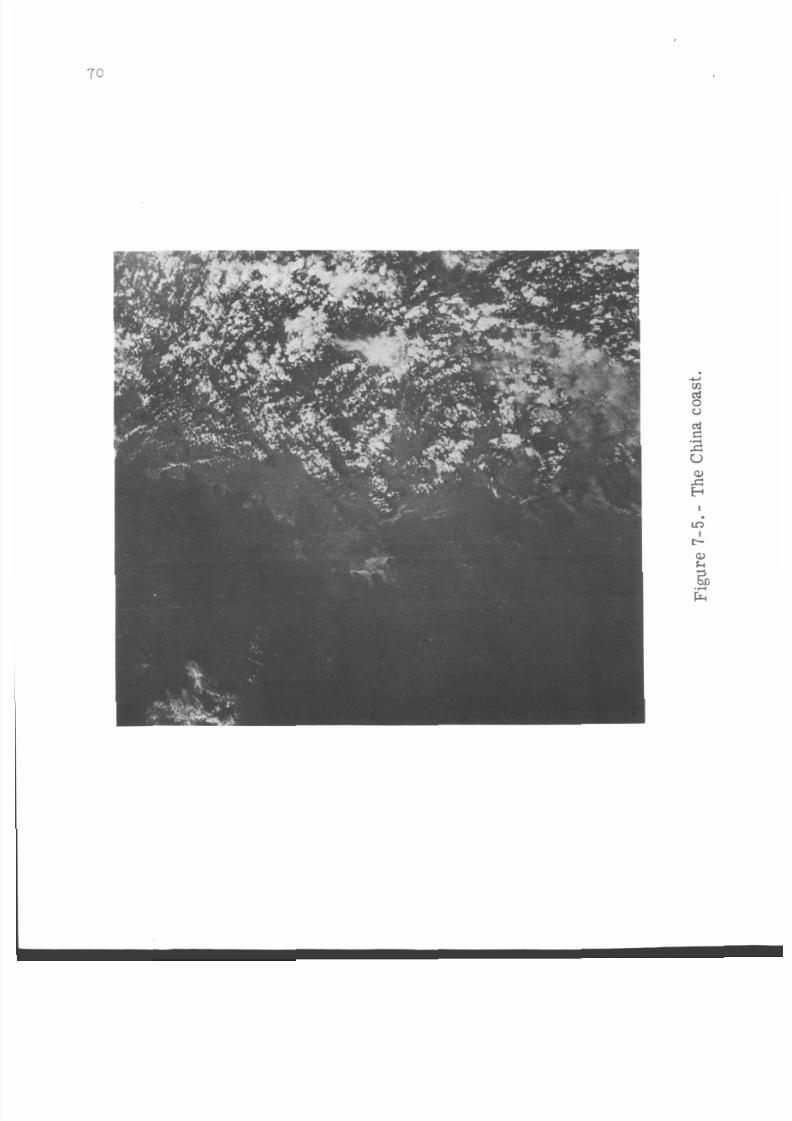
8/7/2019 Manned Spaceflight Experiments Gemini 10 Mission Interim Report
http://slidepdf.com/reader/full/manned-spaceflight-experiments-gemini-10-mission-interim-report 73/146
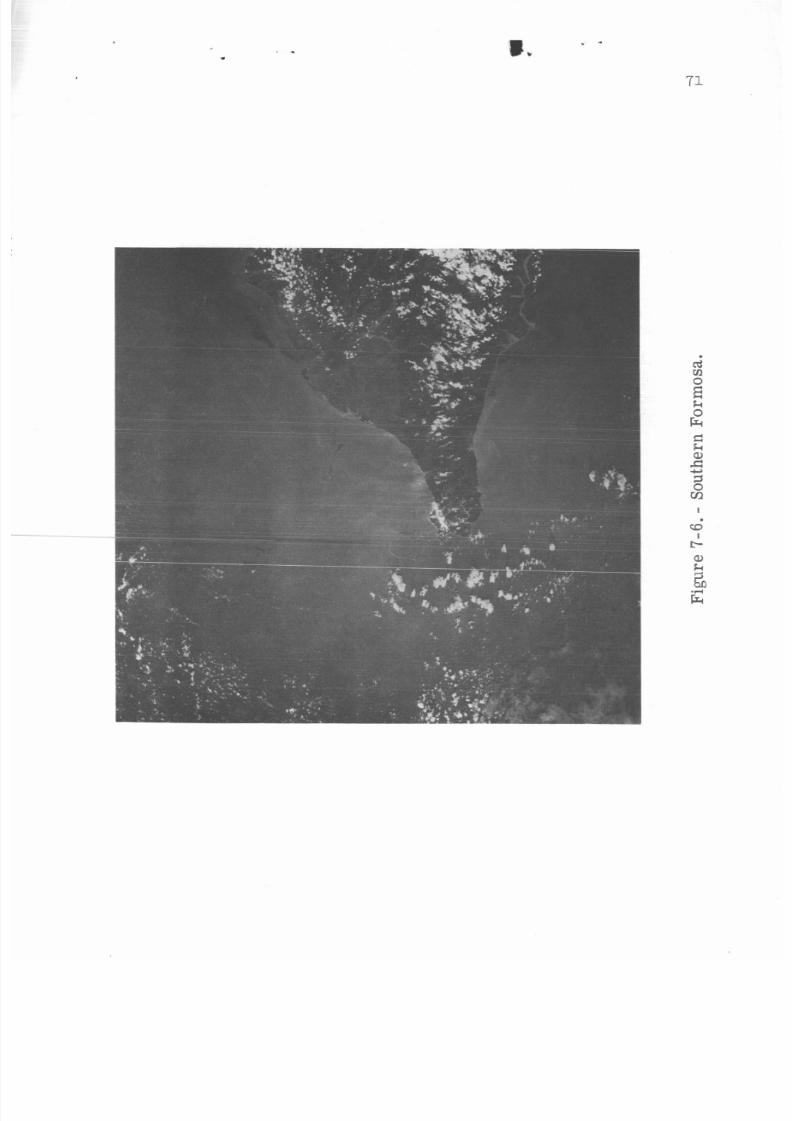
8/7/2019 Manned Spaceflight Experiments Gemini 10 Mission Interim Report
http://slidepdf.com/reader/full/manned-spaceflight-experiments-gemini-10-mission-interim-report 74/146
a .
71
i
i2
5
0
kE
EkQ,
70mI
EDI
a,
$)
G
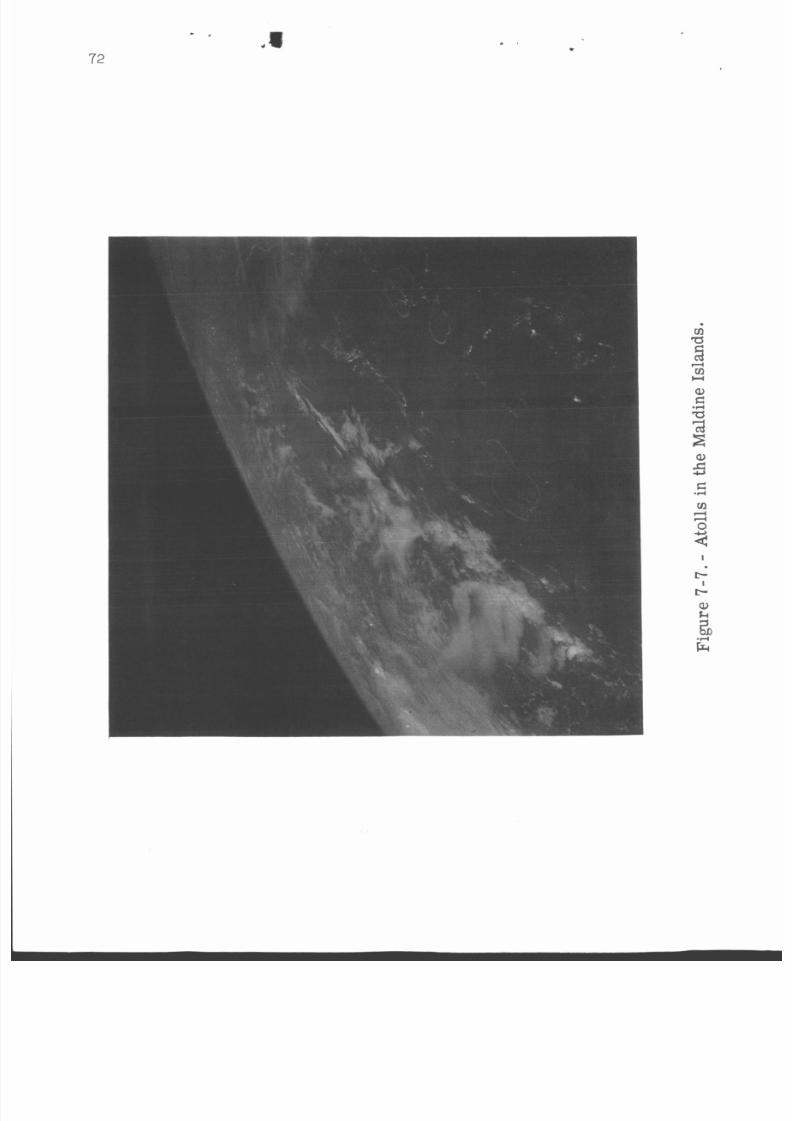
8/7/2019 Manned Spaceflight Experiments Gemini 10 Mission Interim Report
http://slidepdf.com/reader/full/manned-spaceflight-experiments-gemini-10-mission-interim-report 75/146
4 1
- .
72
8/7/2019 Manned Spaceflight Experiments Gemini 10 Mission Interim Report
http://slidepdf.com/reader/full/manned-spaceflight-experiments-gemini-10-mission-interim-report 76/146
73
8. EXPERIMENT S006 (S-6), SYNOPTIC WEATHER PHOTOGRAPHY
By Kenneth M. Nagler, Weather Bureau _ 8 _ -Environmental Science Services Administration,
and
Stanley D. Soules, National Environmental Satellite Center
Enviror, mentalo -^_ _ ...._=_ Aa_+_t_o_
141 8
SUMMARY
The weather photography experiment conducted in the Gemini X mis-
sion resulted in over 200 color pictures showing clouds. Southeast Asia
was photographed twice during successive revolutions. Convective cloud
patterns appear over South America, the Indian Ocean, the Gulf of Mexico,
and the Pacific Ocean. Cloud eddies are pictured near the northwest
African coast and Guadeloupe Island. Considerable cirrus cloudiness was
found near Sumatra and southwest of India. A number of overlapping pic-
ture frames have permitted stereoscopic viewing of several cloud levels.
OBJECTIVE
The objective of the Synoptic Weather Photography (S006) experiment
was to obtain detailed selective color photographs of the earth's cloud
cover in order to amplify- --_ ...._ +_o _m_nn nbta_ned from
weather satellite pictures and to provide new evidence for studies of
atmospheric behavior.
EQUIPMENT
The experimental equipment consisted of a 70-mm film magazine and
a Maurer 70-mm space camera. It contained sufficient Kodak Ektachrome
MS (S0-217) film for approximately 50 exposures. The camera had an
f/2.8 lens with an 80-mm focal length. An ultraviolet haze filter was
used. Five film magazines were onboard for all experiments.
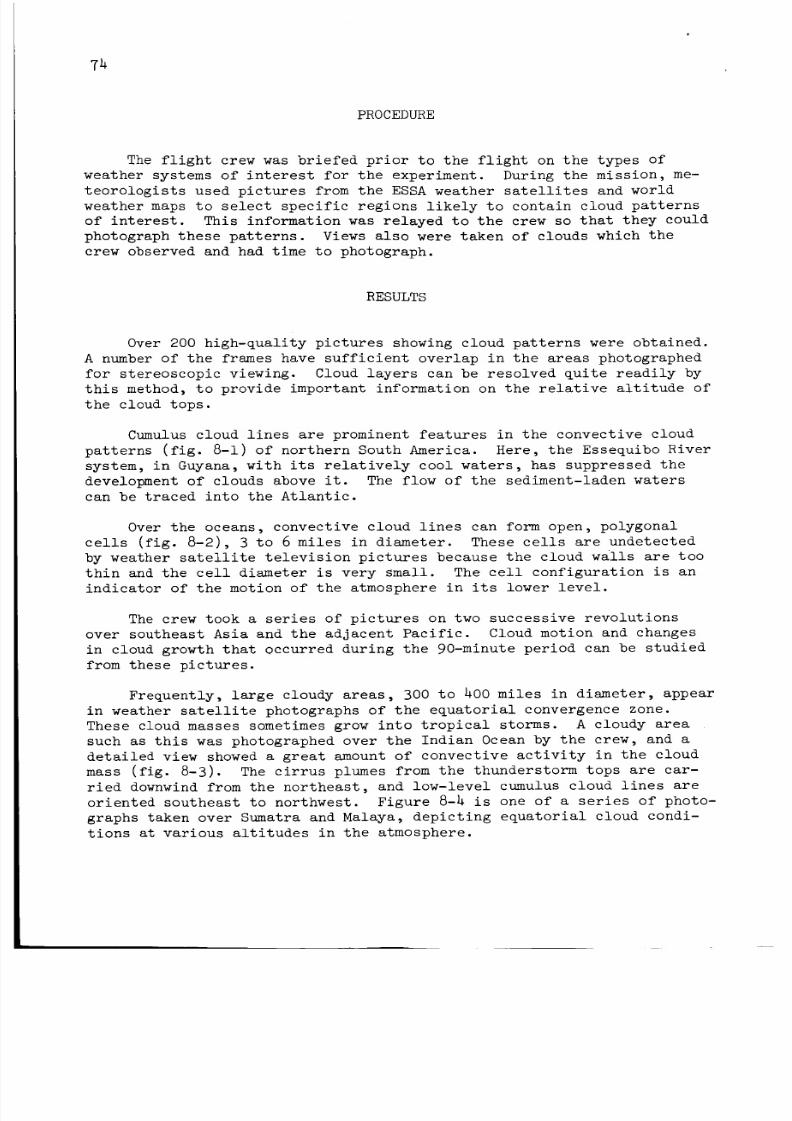
8/7/2019 Manned Spaceflight Experiments Gemini 10 Mission Interim Report
http://slidepdf.com/reader/full/manned-spaceflight-experiments-gemini-10-mission-interim-report 77/146
74
PROCEDURE
The flight crew was briefed prior to the flight on the types of
weather systems of interest for the experiment. During the mission, me-
teorologists used pictures from the ESSA weather satellites and world
weather maps to select specific regions likely to contain cloud patterns
of interest. This information was relayed to the crew so that they could
photograph these patterns. Views also were taken of clouds which the
crew observed and had time to photograph.
RESULTS
Over 200 high-quality pictures showing cloud patterns were obtained.
A number of the frames have sufficient overlap in the areas photographed
for stereoscopic viewing. Cloud layers can be resolved quite readily by
this method, to provide important information on the relative altitude of
the cloud tops.
Cumulus cloud lines are prominent features in the convective cloud
patterns (fig. 8-1) of northern South America. Here, the Essequibo River
system, in Guyana, with its relatively cool waters, has suppressed the
development of clouds above it. The flow of the sediment-laden waters
can be traced into the Atlantic.
Over the oceans, convective cloud lines can form open, polygonal
cells (fig. 8-2), 3 to 6 miles in diameter. These cells are undetected
by weather satellite television pictures because the cloud walls are too
thin and the cell diameter is very small. The cell configuration is an
indicator of the motion of the atmosphere in its lower level.
The crew took a series of pictures on two successive revolutions
over southeast Asia and the adjacent Pacific. Cloud motion and changes
in cloud growth that occurred during the 90-minute period can be studied
from these pictures.
Frequently, large cloudy areas, 300 to 400 miles in diameter, appear
in weather satellite photographs of the equatorial convergence zone.
These cloud masses sometimes grow into tropical storms. A cloudy area
such as this was photographed over the Indian Ocean by the crew, and a
detailed view showed a great amount of convective activity in the cloud
mass (fig. 8-3). The cirrus plumes from the thunderstorm tops are car-
ried downwind from the northeast, and low-level cumulus cloud lines are
oriented southeast to northwest. Figure 8-4 is one of a series of photo-
graphs taken over Sumatra and Malaya, depicting equatorial cloud condi-
tions at various altitudes in the atmosphere.

8/7/2019 Manned Spaceflight Experiments Gemini 10 Mission Interim Report
http://slidepdf.com/reader/full/manned-spaceflight-experiments-gemini-10-mission-interim-report 78/146
75
Another series of photographs depicted the cloud cover over the
Gulf of Mexico and the Caribbean. Part of tropical storm Celia, which
was then southeast of Florida, appeared in several frames, permittingstereoscopic viewing. Among other subjects photographed were cirrus
cloud bands over northern Africa, and cloud eddies off the northwest
coast of Africa, the Canary Islands, and Guadeloupe Island. A sun-
glitter pattern formed by reflected sunlight from the ocean surface was
photographed several times. An analysis of the brightness of the pat-
tern may provide information concerning the surface roughness. Consid-
erable cirrus cloudiness, forming lengthy bands_ was found near Sumatra
and southwest of India.
CONCLUSIONS
Experiment S006 (S-6) was successful, and the many photographs ob-
tained are being analyzed and evaluated for new information that may be
useful in understanding the behavior of the atmosphere.
8/7/2019 Manned Spaceflight Experiments Gemini 10 Mission Interim Report
http://slidepdf.com/reader/full/manned-spaceflight-experiments-gemini-10-mission-interim-report 79/146
.As
ik510
tncka,
k0
rcc0
v1ck
a,
5
u
c,
8 4
aH0
Q,
3
0
a,
0
.Ac,
LuI
4
I03
a,k
%iz
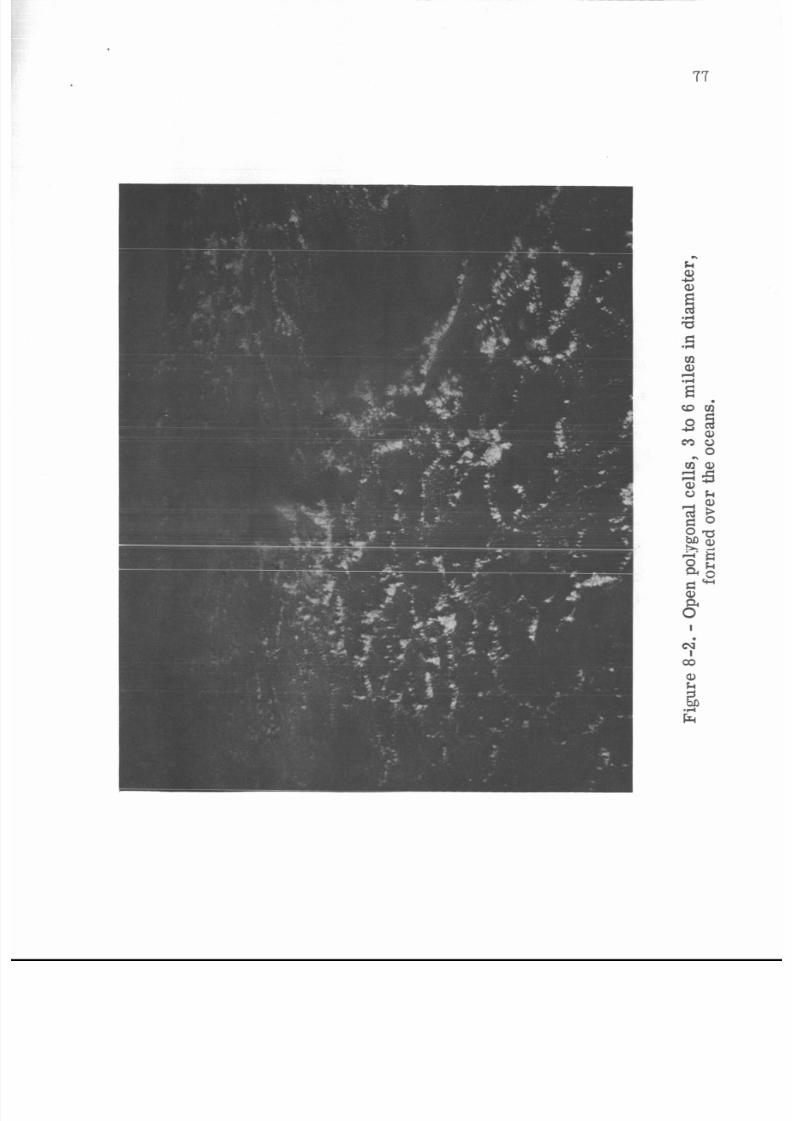
8/7/2019 Manned Spaceflight Experiments Gemini 10 Mission Interim Report
http://slidepdf.com/reader/full/manned-spaceflight-experiments-gemini-10-mission-interim-report 80/146
77
E:.r(
IeuI
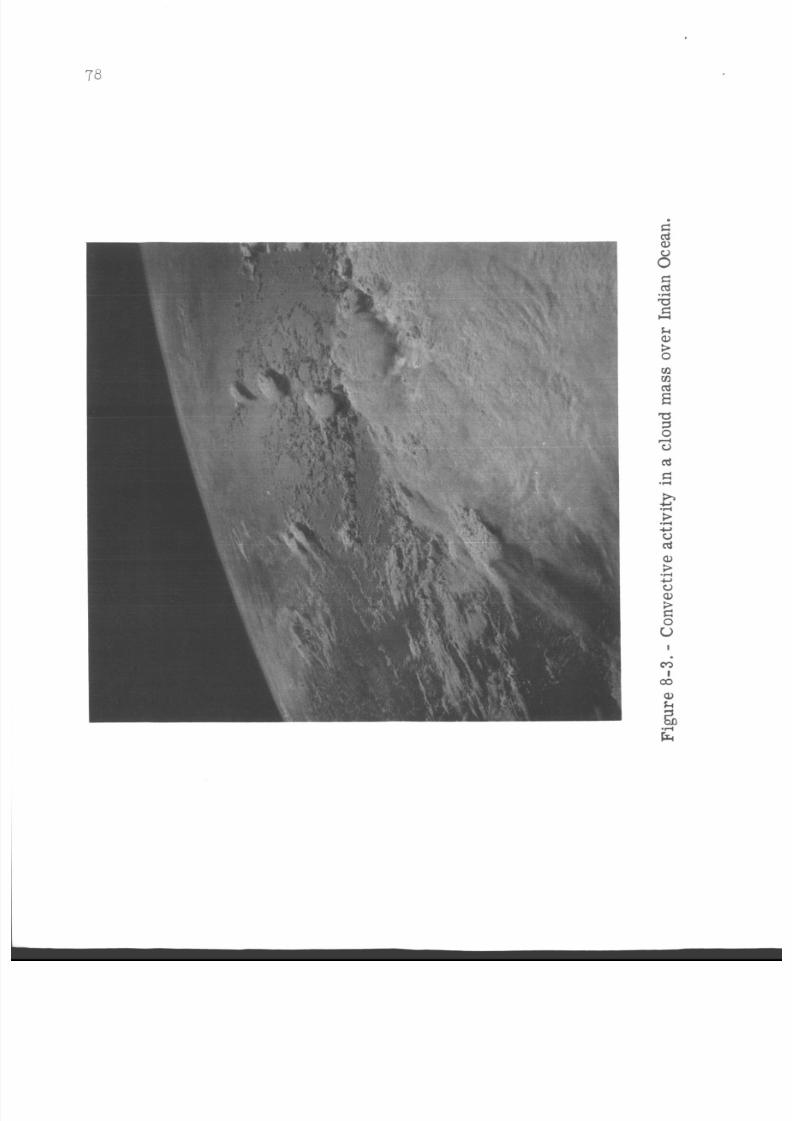
8/7/2019 Manned Spaceflight Experiments Gemini 10 Mission Interim Report
http://slidepdf.com/reader/full/manned-spaceflight-experiments-gemini-10-mission-interim-report 81/146
78
I
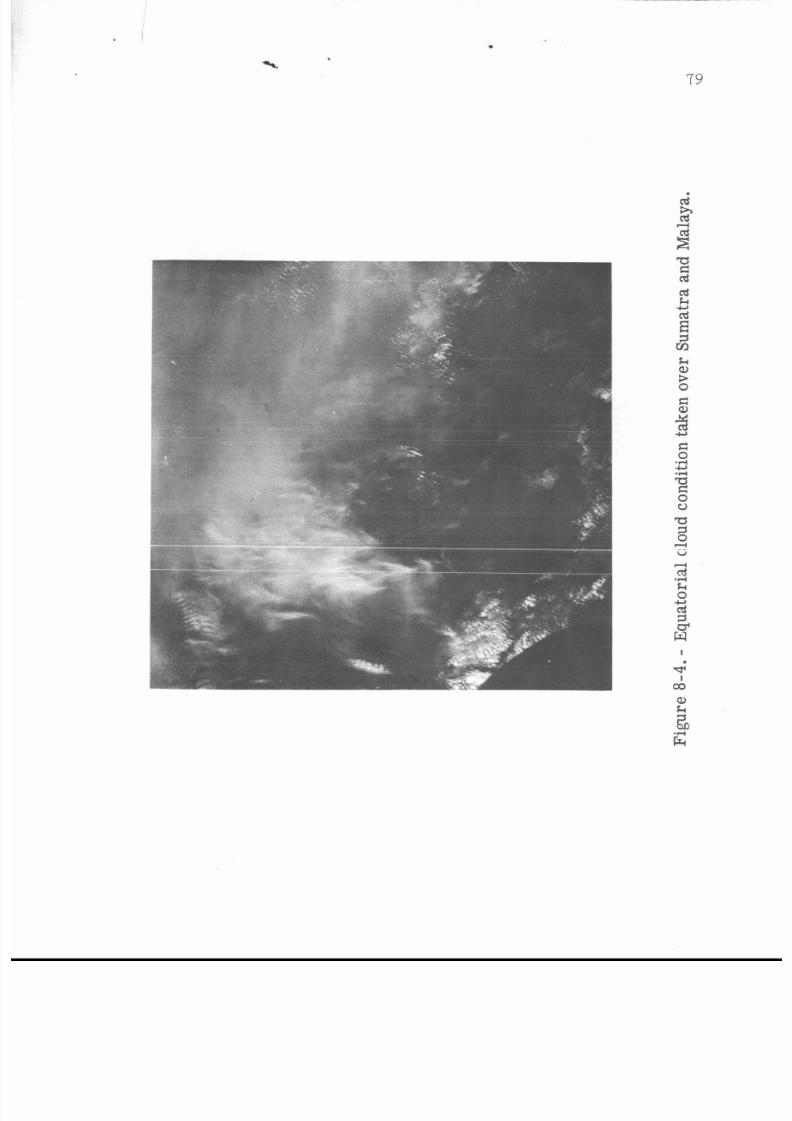
8/7/2019 Manned Spaceflight Experiments Gemini 10 Mission Interim Report
http://slidepdf.com/reader/full/manned-spaceflight-experiments-gemini-10-mission-interim-report 82/146
.7 9
8/7/2019 Manned Spaceflight Experiments Gemini 10 Mission Interim Report
http://slidepdf.com/reader/full/manned-spaceflight-experiments-gemini-10-mission-interim-report 83/146
PP, ECEDING PAGE BLANK NOT FILkI_L
81
9. EXPERIMENT S010 (S-10), AGENA MICROMETEORITE COLLECTION
By Curtis L. Hemenway, Ph.D.The Dudley Observatory
SUMMARYTf{ R - 14 I 159
Micrometeoroid impacts have been recorded during the 4-month expo-
sure of experiment S010 (S-10) equipment. A partial examination revealed
two macroscopic craters; two microscopic craters were found as a result
of scanning one-quarter of the total area. Further work has been delayed
to make use of a recently installed scanning electron microscope.
With the number of impacts located, the flux values found from the
satellite microphone experiments are approximately confirmed.
OBJECTIVE
The object of this experiment was to obtain a large area-time prod-
uct exposure of mierometeoroid detection plates to confirm the flux val-
ues obtained with shorter exposures from sounding rockets, balloons, and
experiment S010 (S-10) equipment flown aboard the GT-9 spacecraft. Ac-
complishment of the objective was attempted by (i) exposing polished met-
al and plastic surfaces to the particle flux for later study of the
resulting impact craters, (2) exposing highly polished sections of mete-
orite material to the particle flux to obtain direct measurement of me-
teor erosion rates, (3) _._4_ _p+_S]vv...... v _Olished_ _lass_ surfaces to the
particle flux for determining the deterioration of optical surface prop-
erties, (4) exposing thin films to the particle flux to observe thin-film
penetration, (5) exposing extremely clean surfaces to the particle envi-
ronment in an attempt to collect ultrasmali particles, and (6) exposing
biological specimens to the space environment. Experiment data include
the particulate material collected, holes and craters in the specially
prepared surfaces, and numbers of viable micro-organisms remaining on the
biological exposure plates. The micro-organisms used were ubiquitous
agents which are absolutely harmless to man. Two of the organisms used
were:
(i) T-bacteriophage (an E. coliphage).
(2) Penicillium roquefort mode spores.
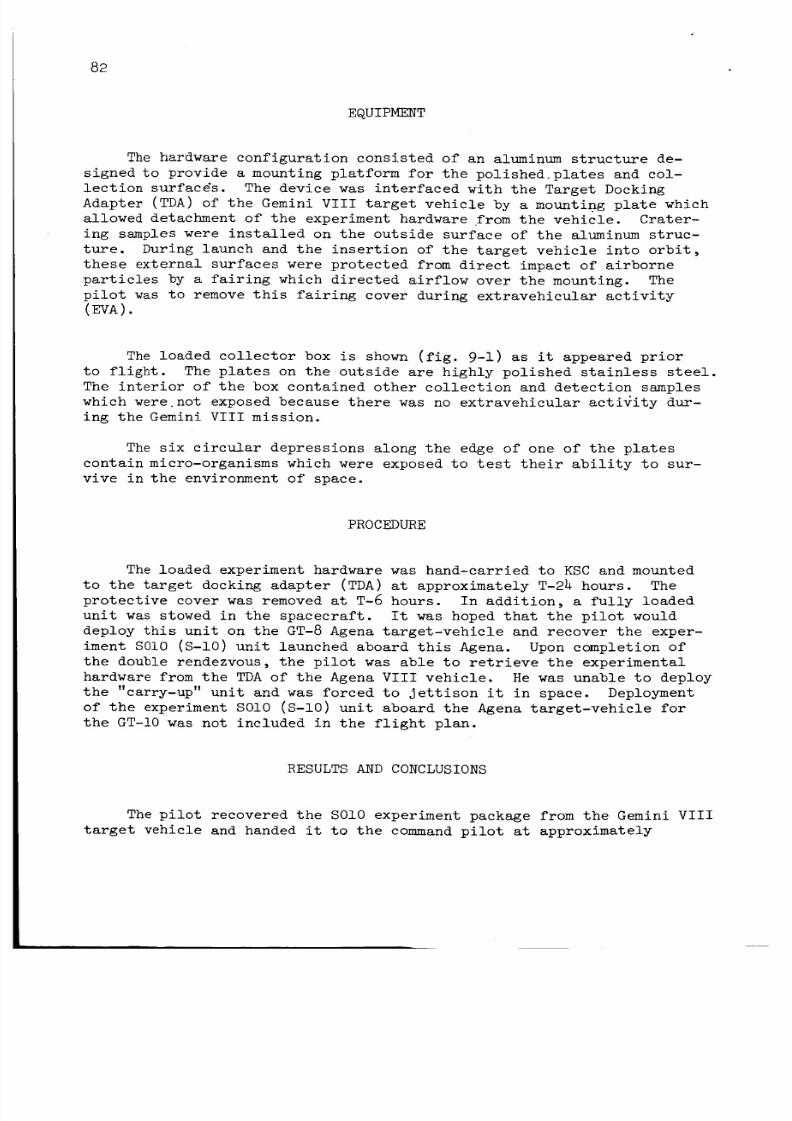
8/7/2019 Manned Spaceflight Experiments Gemini 10 Mission Interim Report
http://slidepdf.com/reader/full/manned-spaceflight-experiments-gemini-10-mission-interim-report 84/146
82
EQUIPMENT
Thehardware configuration consisted of an aluminum structure de-
signed to provide a mounting platform for the polished,plates and col-lection surfac@s. The device was interfaced with the Target DockingAdapter (TDA) of the Gemini VIII target vehicle by a mounting plate whichallowed detachment of the experiment hardware from the vehicle. Crater-ing sampleswere installed on the outside surface of the aluminum struc-ture. During launch and the insertion of the target vehicle into orbit,these external surfaces were protected from direct impact of airborneparticles by a fairing which directed airflow over the mounting. Thepilot wasto removethis fairing cover during extravehicular activity(EVA).
The loaded collector box is shown (fig. 9-1) as it appeared priorto flight. The plates on the outside are highly polished stainless steel.The interior of the box contained other collection and detection sampleswhich were not exposed because there was no extravehicular activity dur-ing the Gemini VIII mission.
The six circular depressions along the edge of one of the platescontain micro-organisms which were exposed to test their ability to sur-vive in the environment of space.
PROCEDURE
The loaded experiment hardware was hand-carried to KSC and mounted
to the target docking adapter (TDA) at approximately T-24 hours. The
protective cover was removed at T-6 hours. In addition, a fully loaded
unit was stowed in the spacecraft. It was hoped that the pilot would
deploy this unit on the GT-8 Agena target-vehicle and recover the exper-
iment S010 (S-10) unit launched aboard this Agena. Upon completion of
the double rendezvous, the pilot was able to retrieve the experimental
hardware from the TDA of the Agena VIII vehicle. He was unable to deploy
the "carry-up" unit and was forced to jettison it in space. Deployment
of the experiment S010 (S-10) unit aboard the Agena target-vehicle for
the GT-10 was not included in the flight plan.
RESULTS AND CONCLUSIONS
The pilot recovered the SO10 experiment package from the Gemini VIII
target vehicle and handed it to the command pilot at approximately
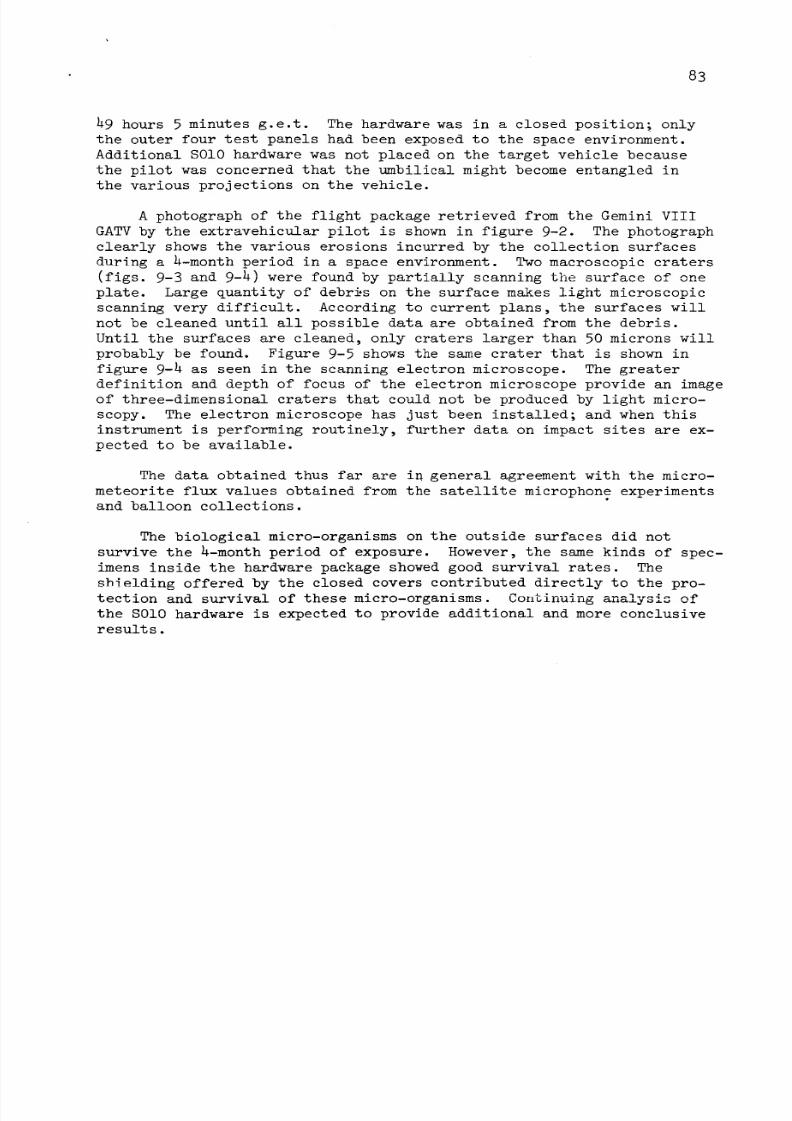
8/7/2019 Manned Spaceflight Experiments Gemini 10 Mission Interim Report
http://slidepdf.com/reader/full/manned-spaceflight-experiments-gemini-10-mission-interim-report 85/146
83
49 hours 5 minutes g.e.t. The hardware was in a closed position_ onlythe outer four test panels had been exposedto the space environment.Additional S010 hardware was not placed on the target vehicle because
the pilot was concerned that the umbilical might becomeentangled inthe various projections on the vehicle.
A photograph of the flight package retrieved from the Gemini VIIIGATVby the extravehicular pilot is shown in figure 9-2. The photographclearly shows the various erosions incurred by the collection surfacesduring a 4-month period in a space environment. Twomacroscopic craters(figs• 9-3 and 9-4) were found by partially scanning the surface of oneplate. Large quantity of debris on the surface makes light microscopicscanning very difficult• According to current plans, the surfaces willnot be cleaned until all possible data are obtained from the debris.
Until the surfaces are cleaned, only craters larger than 50 microns willprobably be found. Figure 9-5 shows the samecrater that is shown infigure 9-4 as seen in the scanning electron microscope. The greaterdefinition and depth of focus of the electron microscope provide an imageof three-dimensional craters that could not be produced by light micro-scopy. The electron microscope has just been installed; and whenthisinstrument is performing routinely, further data on impact sites are ex-pected to be available.
The data obtained thus far are in general agreement with the micro-meteorite flux values obtained from the satellite microphone experimentsand balloon collections.
The biological micro-organisms on the outside surfaces did notsurvive the 4-month period of exposure. However, the samekinds of spec-imens inside the hardware package showedgood survival rates. Theshielding offered by the closed covers contributed directly to the pro-tection and survival of these micro-organisms _on_±_u_L16 _r_ _the SO10hardware is expected to provide additional and more conclusiveresults.
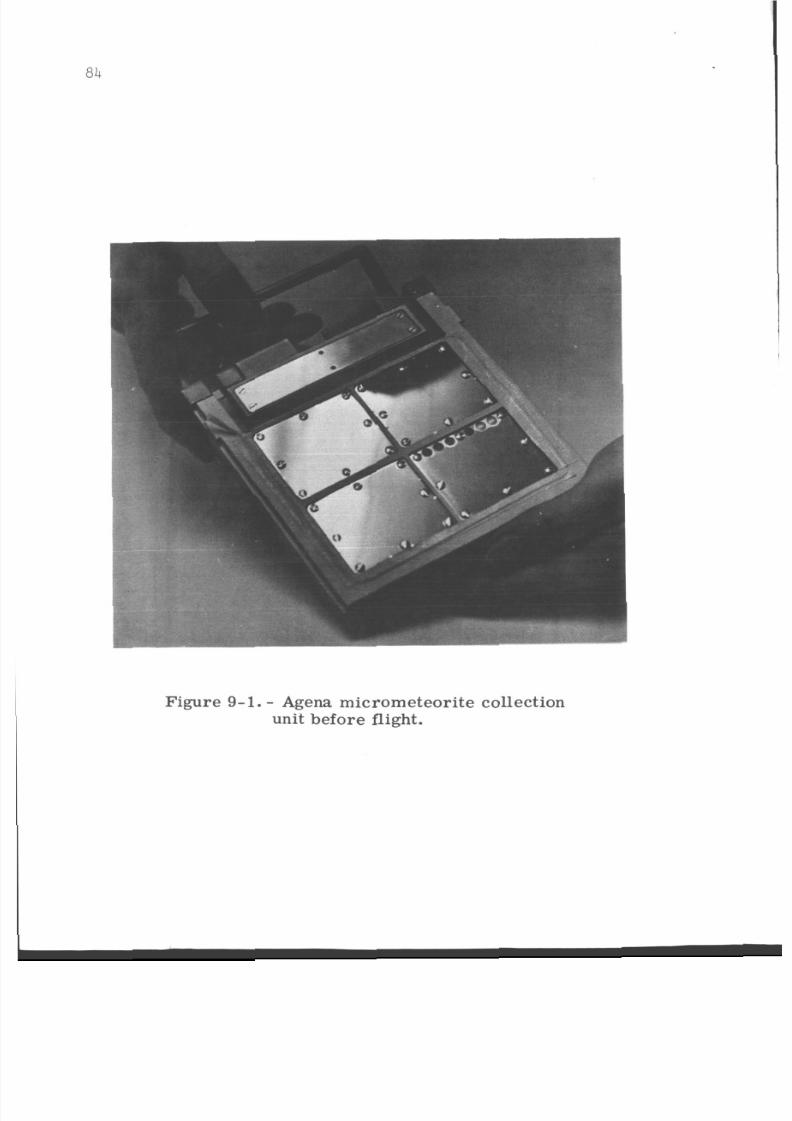
8/7/2019 Manned Spaceflight Experiments Gemini 10 Mission Interim Report
http://slidepdf.com/reader/full/manned-spaceflight-experiments-gemini-10-mission-interim-report 86/146
84
!
Figure 9- 1. - Agena micrometeorite collection
unit before flight.
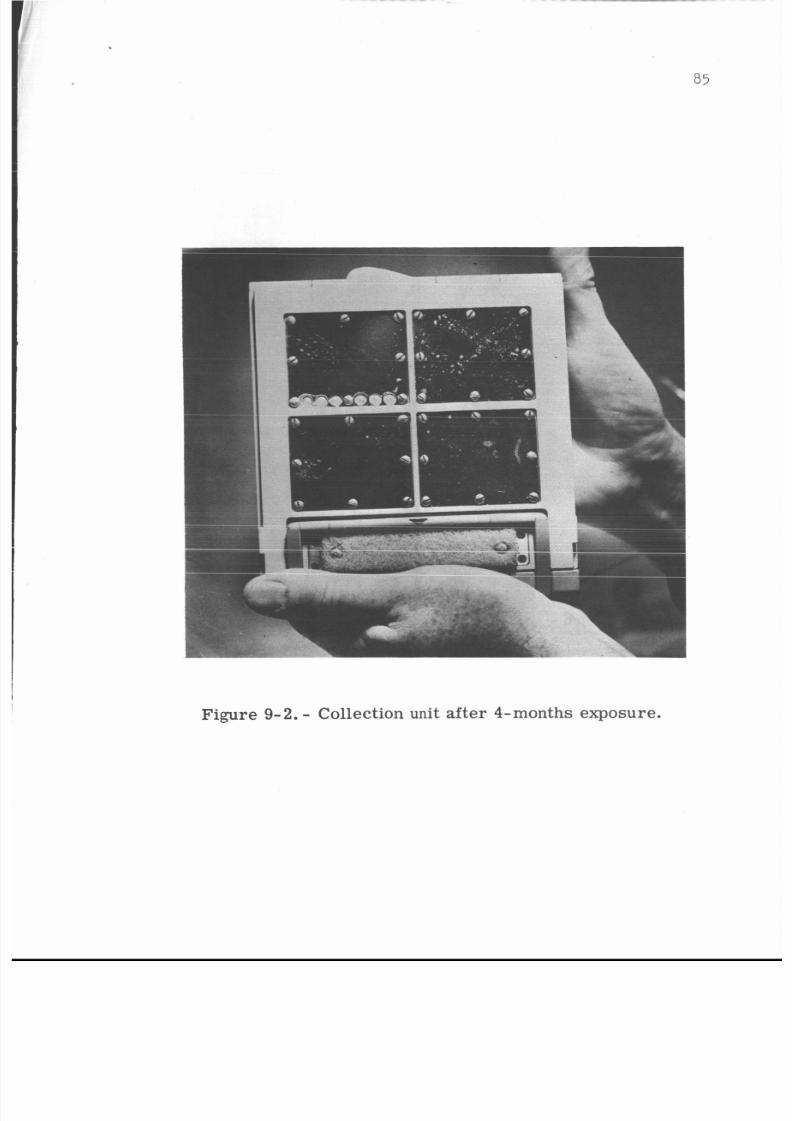
8/7/2019 Manned Spaceflight Experiments Gemini 10 Mission Interim Report
http://slidepdf.com/reader/full/manned-spaceflight-experiments-gemini-10-mission-interim-report 87/146
Figure 9-2. - Collection uni t after 4-months exposure.
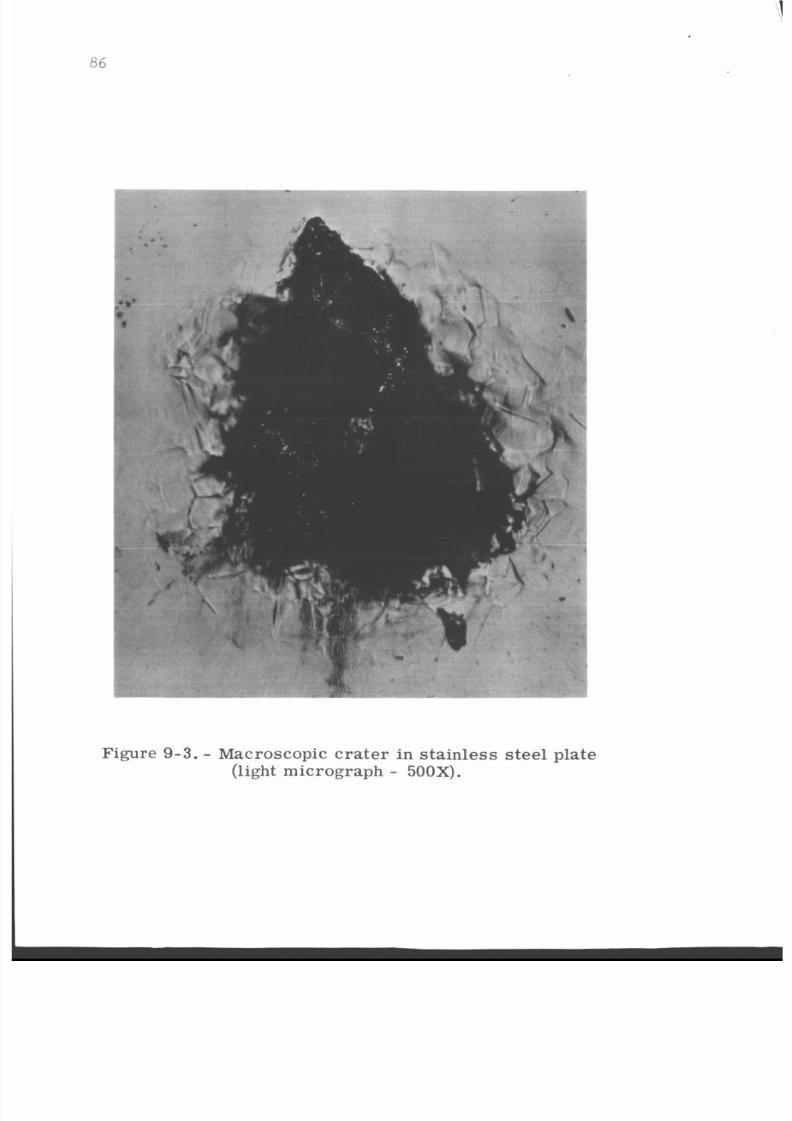
8/7/2019 Manned Spaceflight Experiments Gemini 10 Mission Interim Report
http://slidepdf.com/reader/full/manned-spaceflight-experiments-gemini-10-mission-interim-report 88/146
1
86
Figure 9-3. - Macroscopic crater in stainless steel plate
(light micrograph - 500X).
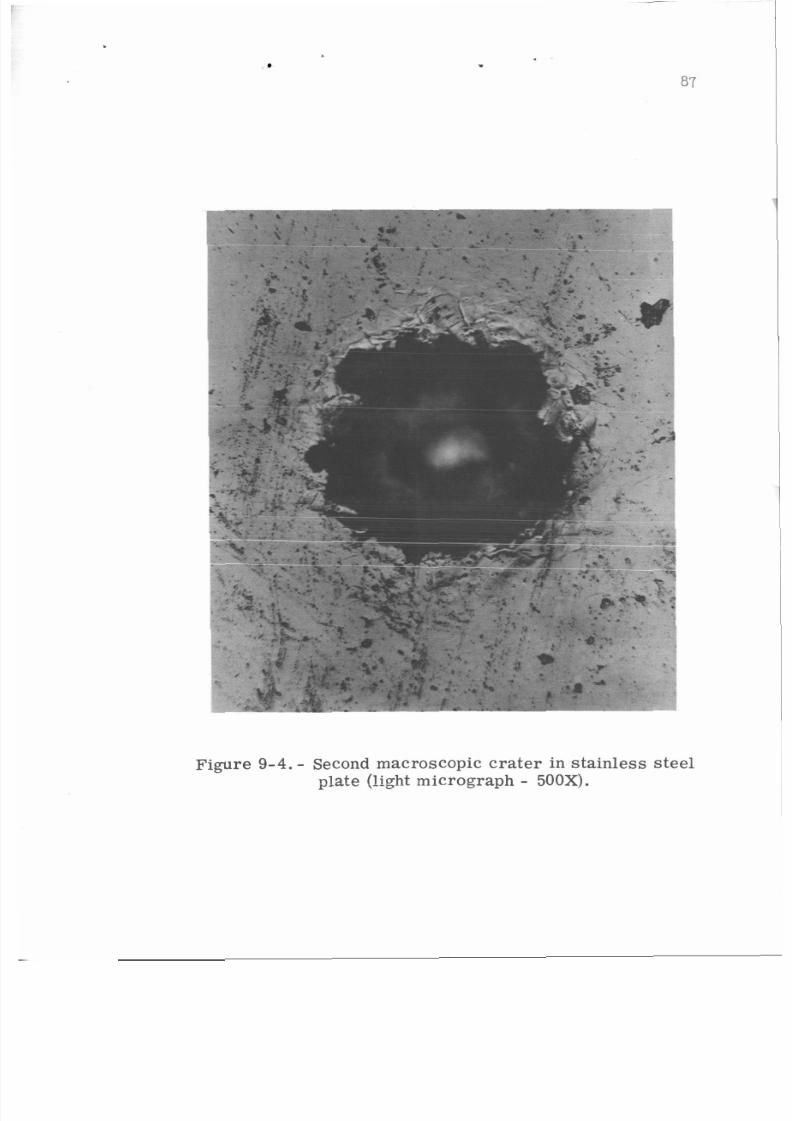
8/7/2019 Manned Spaceflight Experiments Gemini 10 Mission Interim Report
http://slidepdf.com/reader/full/manned-spaceflight-experiments-gemini-10-mission-interim-report 89/146
.
Figure 9-4. - Second macroscopic crater in stainless steelplate (light micrograph - 500X).
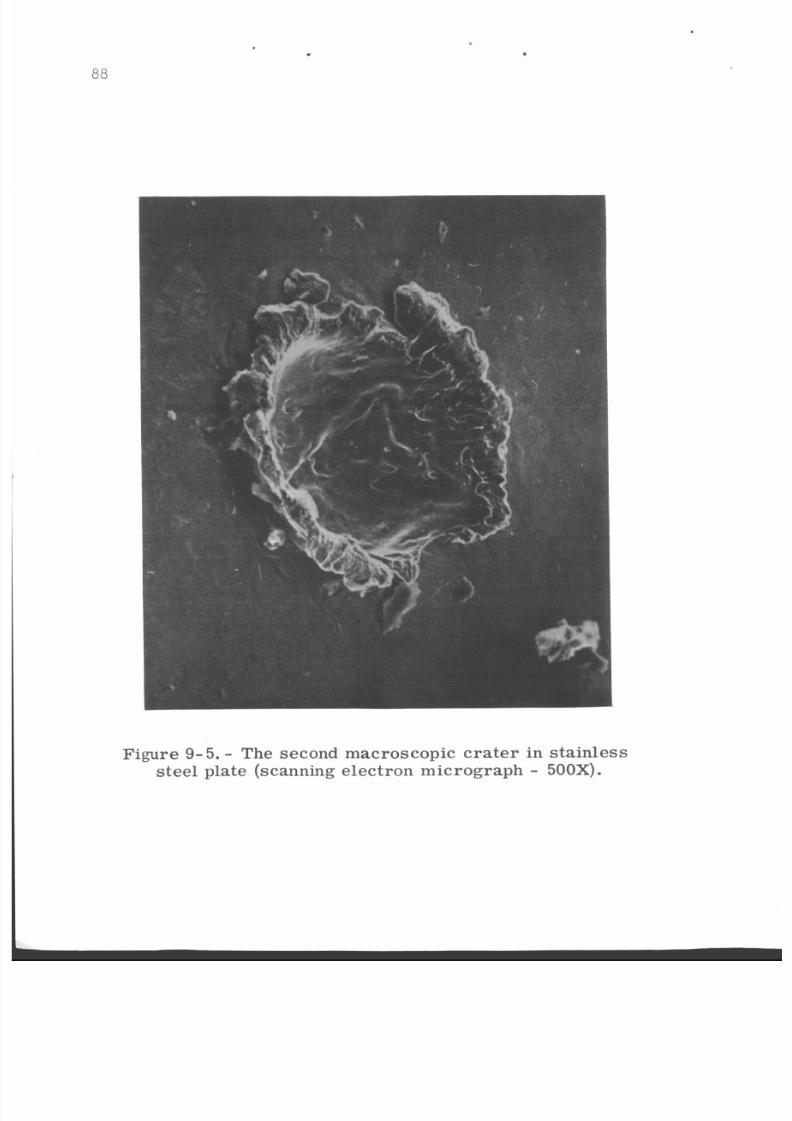
8/7/2019 Manned Spaceflight Experiments Gemini 10 Mission Interim Report
http://slidepdf.com/reader/full/manned-spaceflight-experiments-gemini-10-mission-interim-report 90/146
.I
88
*
Figure 9-5. - The second macroscopic crater in stainless
ste el plate (scanning electron mic rograph - 500X).
8/7/2019 Manned Spaceflight Experiments Gemini 10 Mission Interim Report
http://slidepdf.com/reader/full/manned-spaceflight-experiments-gemini-10-mission-interim-report 91/146
89
10. EXPERIMENT S012 (S-12), MICROMETEORITE COLLECTION
By Curtis L. Hemenway, Ph.D.
Dudley Observatory
OBJECTIVES SS- 14 I 60,
The micrometeorite collection S012 (S-i2) experiment was to deter-
mine the micrometeorite activity in a near-earth environment and to
study the effect of the environment on biological micro-organisms. The
basic objectives were to be accomplished by exposing polished metal and
plastic surfaces to the environment outside the Gemini spacecraft. The
environmental data to be acquired included the particulate material col-
lected, holes and craters in the specially prepared surfaces, the pene-
tration characteristics of micrometeorites on thin films, the surviving
fractions of viable micro-organisms remaining on the biological exposure
plates, and a search for viable micro-organisms in the particle flux in
the spacecraft vicinity. The micro-organisms used were ubiquitous agents
which are absolutely harmless to man. Laboratory tests have shown these
organisms to be resistant to adverse conditions, hence their selection
for space studies. All material specimens were to be returned to earth
by stowage in the Gemini reentry assembly for postflight examination and
analysis at special laboratories.
In addition, through a guest experimenter program, scientists from
various institutions were invited to provide samples within the context
of the above areas. Guest experimenters for Gemini X were Robert
Skrivanek, Air Force Cambridge Research Laboratory; Hugo Fetchig, Max
Planck Institute; Nell Farlow, NASA Ames Research Center; Uri Shafrir,
University of Tel-Aviv; John Kerridge, Birkbeck College; H. Ferandez-
Moran, University of Chicago; Paige Burbank, NASA-MSC; Michael Carr,
U. S. Geological Survey; Otto Berg, Goddard Spaceflight Center; Francis
Wright, Smithsonian Observatory; and Paul Hodge, University of Wash-
ington.
EQUIPMENT
The S012 (S-12) micrometeorite collection hardware consisted of an
aluminum structure mounted on the spacecraft adapter retrograde section
(fig. lO-1). The equipment measure_ 5-1/2 by ll by l-l/4 inches and
weighs approximately 6-1/2 pounds flight-loaded. It utilizes a dual in-
ternal battery package, cover drive motor and gear train, cover limit
switches, and squib-actuated unlatching and locking devices. Mounting
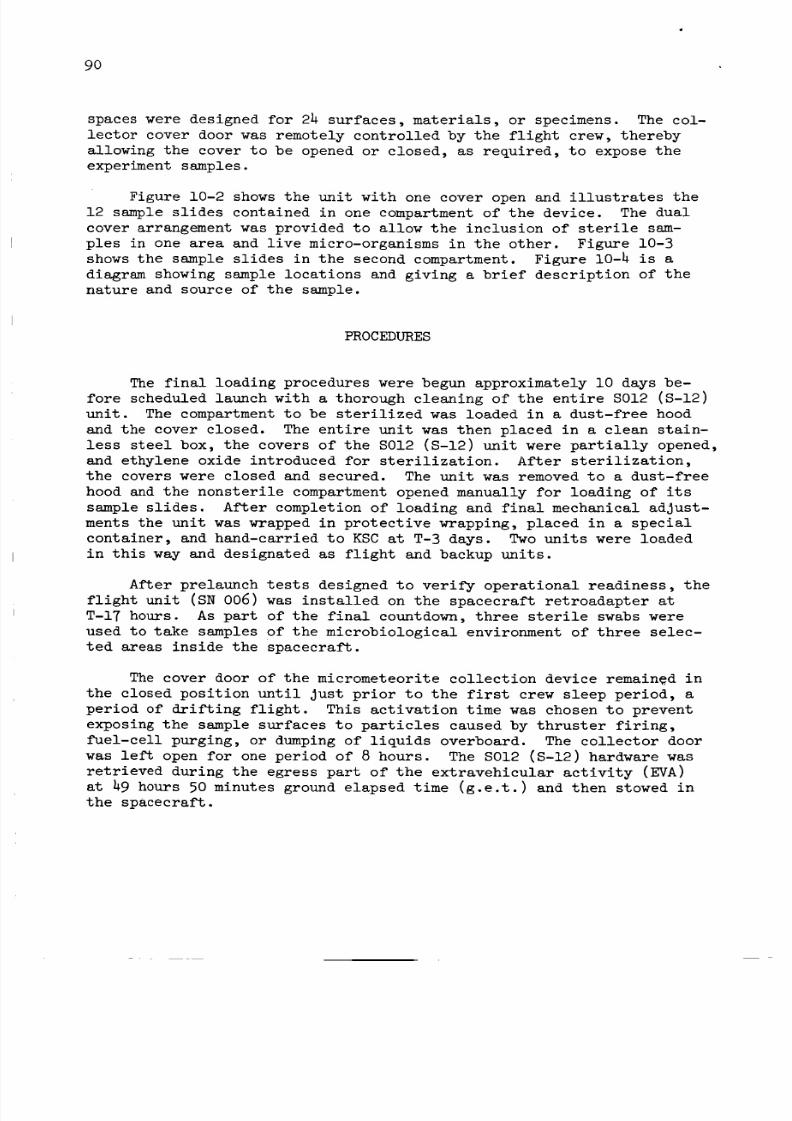
8/7/2019 Manned Spaceflight Experiments Gemini 10 Mission Interim Report
http://slidepdf.com/reader/full/manned-spaceflight-experiments-gemini-10-mission-interim-report 92/146
9o
spaceswere designed for 2_ surfaces, materials, or specimens. The col-
lector cover door was remotely controlled by the flight crew, thereby
allowing the cover to be opened or closed, as required, to expose the
experiment samples.
Figure 10-2 shows the unit with one cover open and illustrates the
12 sample slides contained in one compartment of the device. The dual
cover arrangement was provided to allow the inclusion of sterile sam-
ples in one area and live micro-organisms in the other. Figure 10-3
shows the sample slides in the second compartment. Figure 10-4 is a
diagram showing sample locations and giving a brief description of the
nature and source of the sample.
PROCEDURES
The final loading procedures were begun approximately i0 days be-
fore scheduled launch with a thorough cleaning of the entire S012 (S-12)
unit. The compartment to be sterilized was loaded in a dust-free hood
and the cover closed. The entire unit was then placed in a clean stain-
less steel box, the covers of the S012 (S-12) unit were partially opened,
and ethylene oxide introduced for sterilization. After sterilization,
the covers were closed and secured. The unit was removed to a dust-free
hood and the nonsterile compartment opened manually for loading of its
sample slides. After completion of loading and final mechanical adjust-
ments the unit was wrapped in protective wrapping, placed in a special
container, and hand-carried to KSC at T-3 days. Two units were loaded
in this way and designated as flight and backup units.
After prelaunch tests designed to verify operational readiness, the
flight unit (SN 006) was installed on the spacecraft retroadapter at
T-17 hours. As part of the final countdown, three sterile swabs were
used to take samples of the microbiological environment of three selec-
ted areas inside the spacecraft.
The cover door of the micrometeorite collection device remained in
the closed position until Just prior to the first crew sleep period, a
period of drifting flight. This activation time was chosen to prevent
exposing the sample surfaces to particles caused by thruster firing,
fuel-cell purging, or dumping of liquids overboard. The collector door
was left open for one period of 8 hours. The SO12 (S-12) hardware was
retrieved during the egress part of the extravehicular activity (EVA)
at h9 hours 50 minutes ground elapsed time (g.e.t.) and then stowed in
the spacecraft.

8/7/2019 Manned Spaceflight Experiments Gemini 10 Mission Interim Report
http://slidepdf.com/reader/full/manned-spaceflight-experiments-gemini-10-mission-interim-report 93/146
91
RESULTS
The flight crew reported at 64 hours 15 minutes g.e.t, that theS012 (S-12) hardware could not be located in the spacecraft. Theybelieved that the experiment hardware floated through the open hatchduring EVA. A subsequent crew compartmentcheck, after spacecraft re-trieval, verified that the collection device had been lost. Since nodata samples were recovered for analysis, no results can be reported.
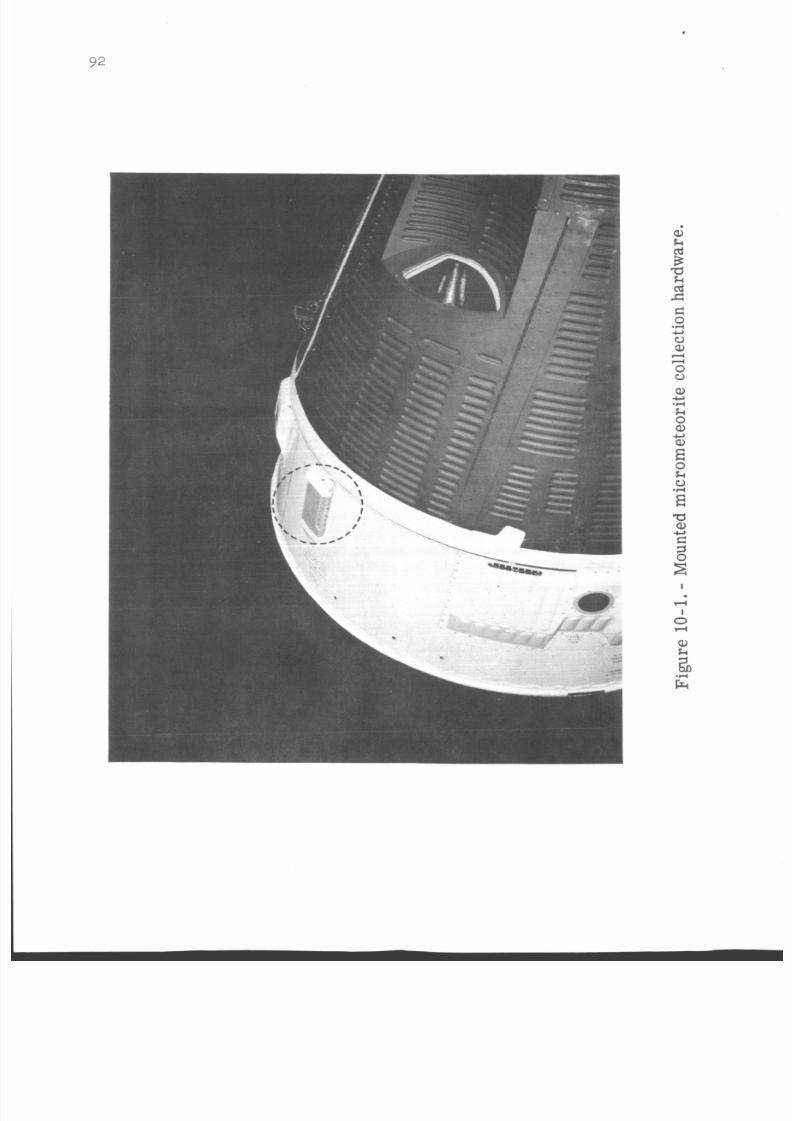
8/7/2019 Manned Spaceflight Experiments Gemini 10 Mission Interim Report
http://slidepdf.com/reader/full/manned-spaceflight-experiments-gemini-10-mission-interim-report 94/146
92
4
3
kcd
akdc
.r(
k0a,
a,
0k0
4
E
E.r(
aa,
3
4
5I4
I
4
0
Q)
k
.2l
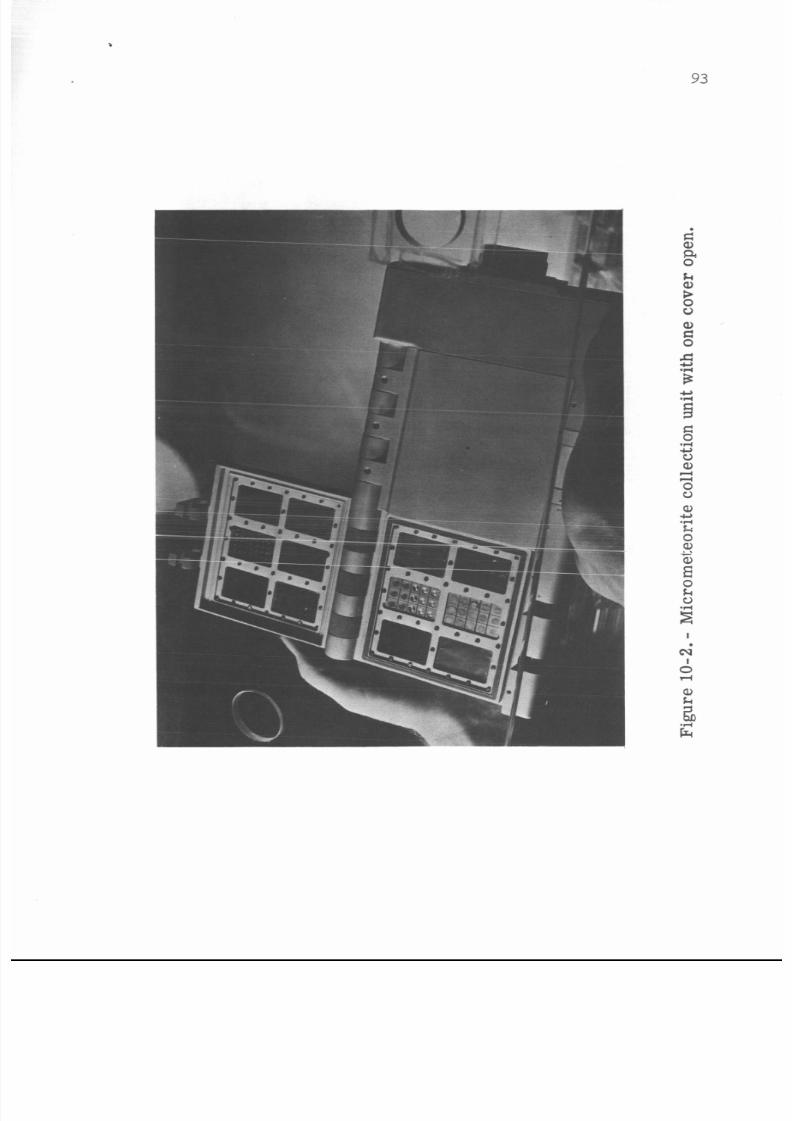
8/7/2019 Manned Spaceflight Experiments Gemini 10 Mission Interim Report
http://slidepdf.com/reader/full/manned-spaceflight-experiments-gemini-10-mission-interim-report 95/146
8/7/2019 Manned Spaceflight Experiments Gemini 10 Mission Interim Report
http://slidepdf.com/reader/full/manned-spaceflight-experiments-gemini-10-mission-interim-report 96/146
94
--
a,
k
0
a,
a,
0k0
c,-4
c,
E
E.4
.Ac,
ca,Ec,k
da
O d0 5
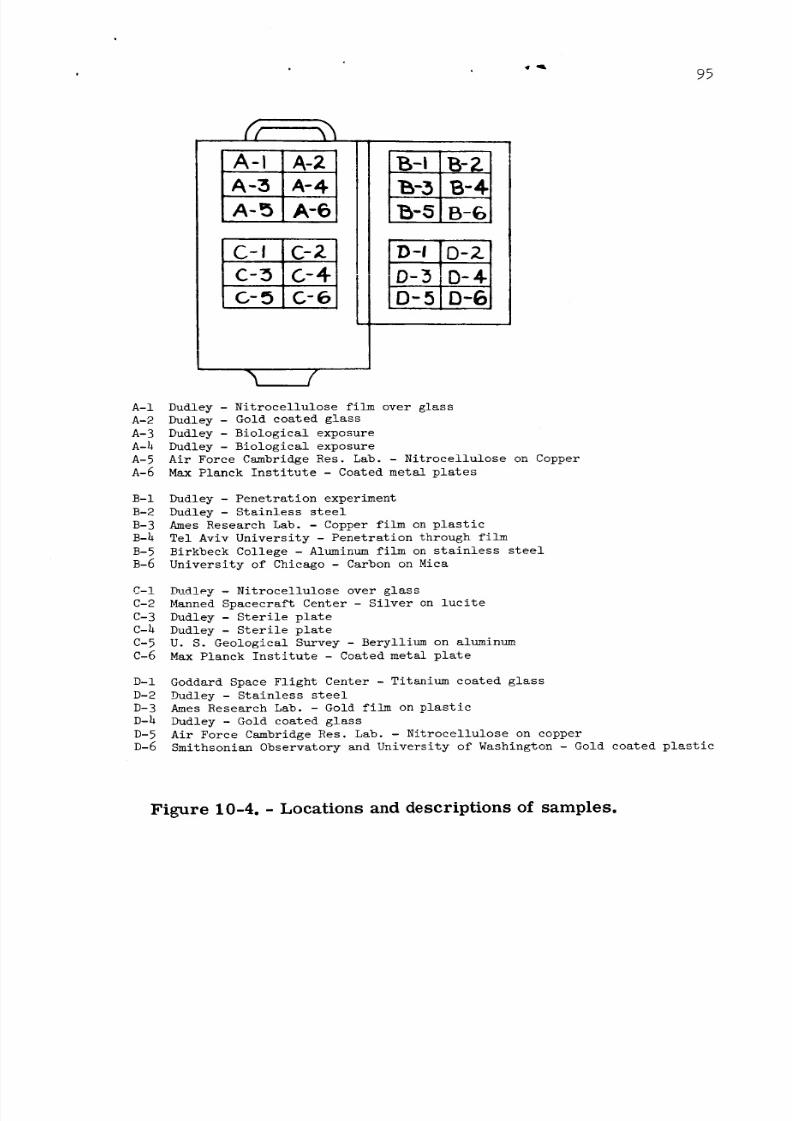
8/7/2019 Manned Spaceflight Experiments Gemini 10 Mission Interim Report
http://slidepdf.com/reader/full/manned-spaceflight-experiments-gemini-10-mission-interim-report 97/146
95
A-I A-2
A-3 A-4
A-5 A-6
-I iC-2
c-_ i C-4c-_ i c-6
5-1 B-ZB-3 B-¢
1_-8 B-6
A-I Dudley - Nitrocellulose film over glass
A-2 Dudley - Gold coated glass
A-3 Dudley - Biological exposure
A-h Dudley - Biological exposure
A-5 Air Force Cambridge Res. Lab. - Nitrocellulose on Copper
A-6 Max Planck Institute - Coated metal plates
B-I Dudley - Penetration experiment
B-2 Dudley - Stainless steel
B-3 Ames Research Lab. - Copper film on plastic
B-4 Tel Aviv University - Penetration through film
B-5 Birkbeck College - Aluminum film on stainless steel
B-6 University of Chicago - Carbon on Mica
C-! _d!ey - Nitrocellulose over glass
C-2 Manned Spacecraft Center - Silver on lucite
C-3 Dudley - Sterile plate
C-4 Dudley - Sterile plate
C-5 U. S. Geological Survey - Beryllium on aluminum
C-6 Max Planck Institute - Coated metal plate
D-I Goddard Space Flight Center - Titanium coated glass
D-2 Dudley - Stainless steel
D-3 Ames Research Lab. - Gold film on plastic
D-4 Dudley - Gold coated glass
D-5 Air Force Cambridge Res. Lab. - Nitrocellulose on copper
D-6 Smithsonian Observatory and University of Washington - Gold coated plastic
Figure 10-4. - Locations and descriptions of samples.
8/7/2019 Manned Spaceflight Experiments Gemini 10 Mission Interim Report
http://slidepdf.com/reader/full/manned-spaceflight-experiments-gemini-10-mission-interim-report 98/146
PF,ECEDING PAGE BLANK NOT FILM_.
11. EXPERIMENT S013 (S-13), ULTRAVIOLET ASTRONOMICAL CAMERA
97
By Karl G. Henize, Ph.D., and Lloyd R. Wakerling
Dearborn Observatory, Northwestern University
OBJECTIVE
The purpose of this photography was to obtain data on the ultra-
violet radiation (2200 to 3000 A) of hot stars and to develop and evalu-
ate basic techniques for the photography of celestial objects from manned
spacecraft. Twenty-two frames were exposed on the southern Milky Way as
the spacecraft's orbital motion caused the camera to scan from Crux to
Vela.
EQUIPMENT
The Maurer 70-mm camera, designed and manufactured under the super-
vision of scientists at the NASA Manned Spacecraft Center, was used to
obtain these spectra. The ultraviolet lens has a 22-mm aperture, 73-mm
focal length, and a field of 30° diameter. A 10-degree objective prism
in a cell provides attachment to the ultraviolet lens. The film magazinecarries 50 frames of Kodak spectroscopic I-0 emulsion on an Estar base.
Combined with a 600-1ine/mm objective grating, it produces spectra with
a dispersion of 180 angstroms per millimeter. Figure ll-1 shows the
camera and prism assembly mounted to the spacecraft in the position used
during flight.
PROCEDURE
Since the Gemini windows do not transmit ultraviolet light, theobservations were made through the opened hatch. The camera was fastened
on a bracket pointing 5° above the roll axis of the spacecraft.
The original operating plan called for the command pilot to point
the undocked Gemini at the desired star field, and to nullify the angular
motions of the spacecraft by using the pulse control system. With the
craft stabilized, the pilot was to make l0 exposures on each field,
ranging in length from l0 to 60 seconds, for three separate fields.
During the Gemini X mission, this plan was altered due to shortage
of fuel for maneuvering. The observations were made while Gemini was
8/7/2019 Manned Spaceflight Experiments Gemini 10 Mission Interim Report
http://slidepdf.com/reader/full/manned-spaceflight-experiments-gemini-10-mission-interim-report 99/146
98
dockedwith the Agena, in order that the Agenastabilization system couldbe used. Since the Agena could not be reoriented once the hatch wasopened, it was decided to point at the Southern Cross, which lay near thepole of the orbit and would remain in the camera field all night. How-ever, by mischance, during assembly of the equipment, the grating wasturned 17° counterclockwise, causing the orbital motion of the horizon-stabilized spacecraft to produce a migration of the field center fromnear _ Crucis to near y Velorum. After the basic pointing had been ac-complished and the Agena stabilization had been activated, the pilotopenedthe hatch, mounted the camera on its bracket, and took 22 expo-sures. All exposures were about 20 seconds in length.
RESULTS
Oneof the most interesting regions of the entire Milky Waywasscanned, and spectra were obtained for manymore stars than was expected.However, the displacement of the grating caused trailing in the directionof dispersion for most stars, thus degrading wavelength resolution. Thisprevented the possible resolution of line spectra but did not interferewith the measurementof ultraviolet energy curves.
In preliminary examinations of the film, the spectra of 57 starshave been identified. These are listed in table ii-I. About one-halfare bright enoughto permit quantitative analysis of the ultraviolet
energy curves. The only absorption feature visible in the spectra isthe Balmer continuum. The limiting ultraviolet magnitude (effectivewavelength 2200A) for unwidened spectra is about +3.5 or a littlefainter. An illustration of one of the better frames is given infigure 11-2. Figure 11-3 is a key chart for figure 11-2.
Four separate equipment problems occurred during the mission.
(a) Twelve of the frames were marred by a vertical streak whichdoes not appear to be caused by ordinary light leaks. Static electricityrising from camera operation under vacuumconditions could cause this
effect.
(b) Preflight and postflight calibration exposures with the flightcamerashowedimages of good quality at the center of the field. Theinflight exposures showedpoor image quality at the center of the fieldand good image quality away from the center. The shape of the imagesindicates the film was too close to the lens, apparently causedby filmbowing towards the lens in vacuumconditions.
8/7/2019 Manned Spaceflight Experiments Gemini 10 Mission Interim Report
http://slidepdf.com/reader/full/manned-spaceflight-experiments-gemini-10-mission-interim-report 100/146
99
(c) The cable release was broken during assembly of the camera.A more suitable cable release has been provided for the Gemini XI mission.
(d) Oneof the screws in the bracket assembly backed out preventingproper insertion in the ways. According to the pilot, difficulty wasencountered during bracket insertion.
About i0 percent of the field of first-order star spectra was ob-scured by the GATVwhen in the docked configuration. About 40 percentof _e fi _7_ of zero-order star images wasobscured. The masking ofzero-order images prevented interference with most of the first-orderspectra.
Extraneous light was not observed either originating in or reflected
from the GATV. GATVstabilization which was achieved during the secondhalf of the night exposure period appears to have been adequate for thepurpose of this experiment. The experiment operation while in a dockedconfiguration is nowrecommendedin order to use the greater inertia ofthe combined massesof the two vehicles. This provides increased sensi-tivity of the pulse control mode in attitude-hold.
CONCLUSIONS
In addition to gathering basic astrophysical data about hot, youngstars, the Gemini experiment aims at clarifying the problems and tech-niques of ultraviolet photography of stars from mannedspacecraft. It isvital that such problems and techniques be explored in order to lay thetechnical foundation for the large mannedorbiting telescopes, currentlyunder __.._...... _ _y.... NASAand the National Academyof Sciences. Theamountof data gathered by the crew of Gemini X with ver_ simple equip-ment and in the face of unexpected difficulties clearly indicates thevalue of manin such research programs.
This experiment can be considered successful in that it achieved
useful scientific data and established needs for better equipment andprocedures on additional flights.
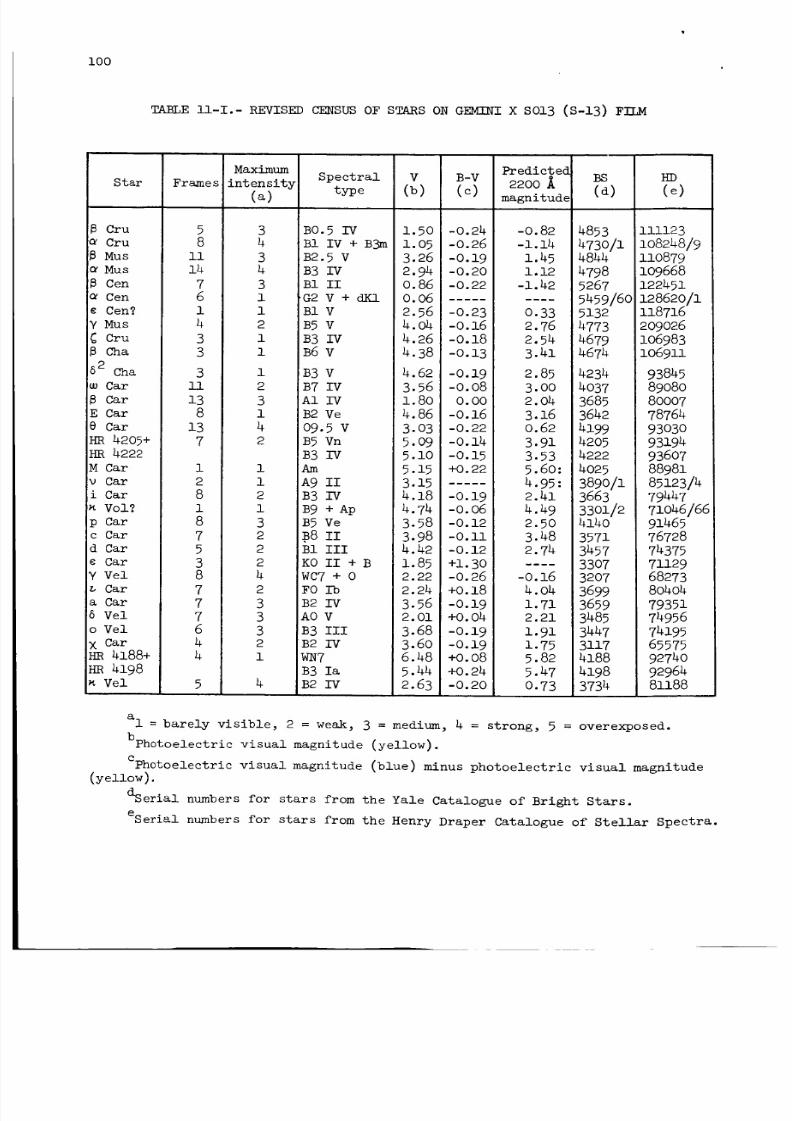
8/7/2019 Manned Spaceflight Experiments Gemini 10 Mission Interim Report
http://slidepdf.com/reader/full/manned-spaceflight-experiments-gemini-10-mission-interim-report 101/146
IOO
TABLEll-I.- REVISEDCENSUSOFSTARSONGEMINIX SO13(S-13) FILM
Star
Cru
Cru
8 Mus
Mus
Cen
Cen
¢ Cen?
y Mus
CruS Cha
62 Cha
_w Car
Car
E Car
e Car
HR 4205+
_q 4222
M Car
v Car
i Car
Vol?p Car
c Car
d Car
¢ Car
y Vel
Car
a Car
6 Vel
o Vel
X CarHR 4188+
HR 4198
Vel
Frames
5
8
ii
14
7
6
1
4
33
3
ii
13
8
13
7
i
2
8
18
7
5
3
8
7
7
7
6
4
4
Maximumintensity
(a)
3
4
3
4
3
i
i
2
ii
i
2
3
i
4
2
PredictedSpectral V B-V
type (b) (c) 2200magnitude
B0.5 IV 1.50 -0.24 -0.82
BI IV + B3m 1.05 -0.26 -1.14
B2.5 V 3.26 -0.19 1.45
B3 IV 2.94 -0.20 1.12
BI II 0.86 -0.22 -1.42
G2 V + d/£1 0.06 .........
BI V 2.56 -0.23 0.33
B5 V 4.04 -0.16 2.76
B3 IV 4.26 -0.18 2.54B6 V 4.38 -0.13 3.41
B3 V 4.62 -0.19 2.85
B7 IV 3.56 -0.08 3.00
AI IV 1.80 0.00 2.04
32 Ve 4.86 -0.16 3.16
09.5 V 3.03 -0.22 0.62
B5 Vn 5.09 -0.14 3.91
B3 IV 5.10 -0.15 3.53
Am 5.15 +0.22 5.60:
A9 II 3.15 ..... 4.95:
B3 IV 4.18 -0.19 2.41
B9 +Ap 4.74 -0.06 4.49B5 Ve 3.58 -0.12 2.50
B8 II 3.98 -0.ii 3.48
BI IIl 4.42 -0.12 2.74
KO II + B 1.85 +1.30 ....
WC7 + 0 2.22 -0.26 -0.16
FO Ib 2.24 +0.18 4.04
B2 IV 3.56 -0.19 1.71
AO V 2.01 +0.04 2.21
!B3 III 3.68 -o.19 1.91
B2 IV 3.60 -0.19 1.75
WN7 6.48 +0.08 5.82
B3 la 5.44 +0.24 5.47
B2 IV 2.63 -0.20 0.73
BS
(d)
4853
473o/1
4844
4798
5267
5459/60
5132
4773
46794674
4234
4037
3685
3642
4199
4205
4222
4025
3890/1
3663
3301/24140
3571
3457
3307
3207
3699
3659
3485
3447
3117
4i88
4198
3734
HD
(e)
ilii123
108248/9
110879
109668
122451
128620/1118716
209026
lO6983106911
93845
89o8o
8ooo7
78764
93030
93194
93607
88981
85123/4
79447
71046/6691465
76728
74375
71129
68273
80404
79351
74956
74195
65575
92740
92964
81188
al = barely visible, 2 = weak, 3 = medium, 4 = strong, 5 = overexposed.
bphotoelectric visual magnitude (yellow).
ephotoelectric visual magnitude (blue) minus photoelectric visual magnitude
(yellow).
dserial numbers for stars from the Yale Catalogue of Bright Stars.
eserial numbers for stars from the Henry Draper Catalogue of Stellar Spectra.
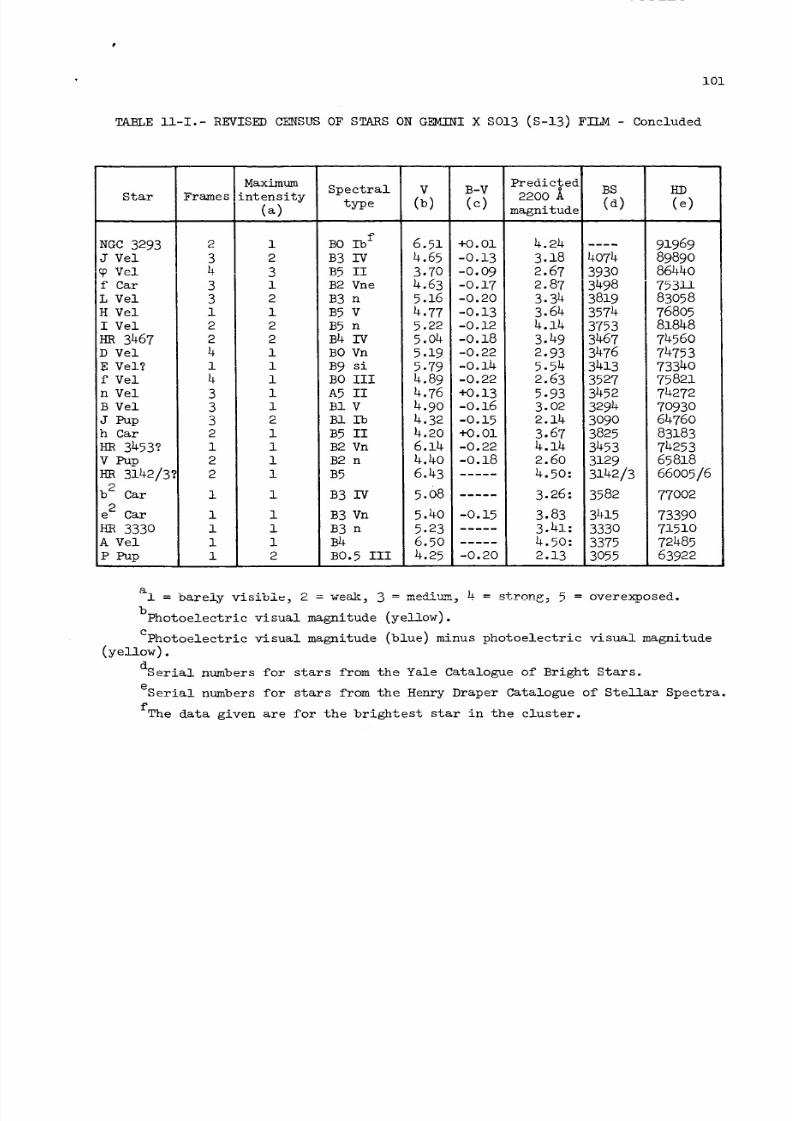
8/7/2019 Manned Spaceflight Experiments Gemini 10 Mission Interim Report
http://slidepdf.com/reader/full/manned-spaceflight-experiments-gemini-10-mission-interim-report 102/146
i01
TABLE ll-I.- REVISED CENSUS OF STARS ON GEMINI X SO13 (S-13) FILM - Concluded
Star
NGC 3293
J Vel
Vel
f Car
L Vel
H Vel
I Vel
HR 3467D Vel
E Vel?
f Vel
n Vel
B Vel
J Pup
h Car
H_ 3453?
V Pup
HR 3142/37
b 2 Car
e 2 Car
I-_ 333oA Vel
P Pup
Frames
2
3
4
3
3
i
2
24
i
4
3
3
3
2
i
2
2
i
i
i
i
i
Maximum
intensity
(a)
i
2
3
i
2
i
2
2i
i
i
i
i
2
i
i
i
i
i
i
i
i
2
Predicted
Spectral V B-V 2200
type (b) (c) magnitude
BO Ib f 6.51 +0.01 4.24
B3 IV 4.65 -0.13 3.18
B5 II 3.70 -0.09 2.67
B2 Vne 4.63 -0.17 2.87
B3 n 5.16 -0.20 3.34
B5 V 4.77 -0.13 3.64
B5 n 5.22 -0.12 4.14
B4 IV 5.04 -0.18 3.49
BO Vn 5.19 -0.22 2.93
B9 si 5.79 -0.14 5.54
BO III 4.89 -0.22 2.63
A5 II 4.76 +0.13 5.93
BI V 4.90 -0.16 3.02
BI Ib 4.32 -0.15 2.14
B5 II 4.20 +0.01 3.67
B2 Vn 6.14 -0.22 4.14
B2 n 4.40 -0.18 2.60
B5 6.43 ..... 4.50:
B3 IV 5.08 ..... 3.26:
B3 Vn 5.40 -0.15 3.83
B3 n 5.23 ..... 3.41:
B4 6.50 ..... 4.50:
BO.5 III 4.25 -0.20 2.13
BS
(d)
4074
3930
3498
3819
3574
3753
34673476
3413
3527
3452
3294
3090
3825
3453
3129
3142/3
3582
3415
3330
3375
3o55
HD
(e)
91969
89890
86440
75311
83058
76805
81848
7456074753
73340
75821
74272
70930
64760
83183
74253
65818
66005/6
77002
73390
71510
72485
63922
a_
± = barely visible, 2 -.....w_,1" 3 = ,,_I_-- h.......= _i_on=._• ._ = overexposed.
bphotoelectrie visual magnitude (yellow).
Cphotoelectric visual magnitude (blue) minus photoelectric visual magnitude
(yellow).
dserial numbers for stars from the Yale Catalogue of Bright Stars.
eserial numbers for stars from the Henry Draper Catalogue of Stellar Spectra.
fThe data given are for the brightest star in the cluster.
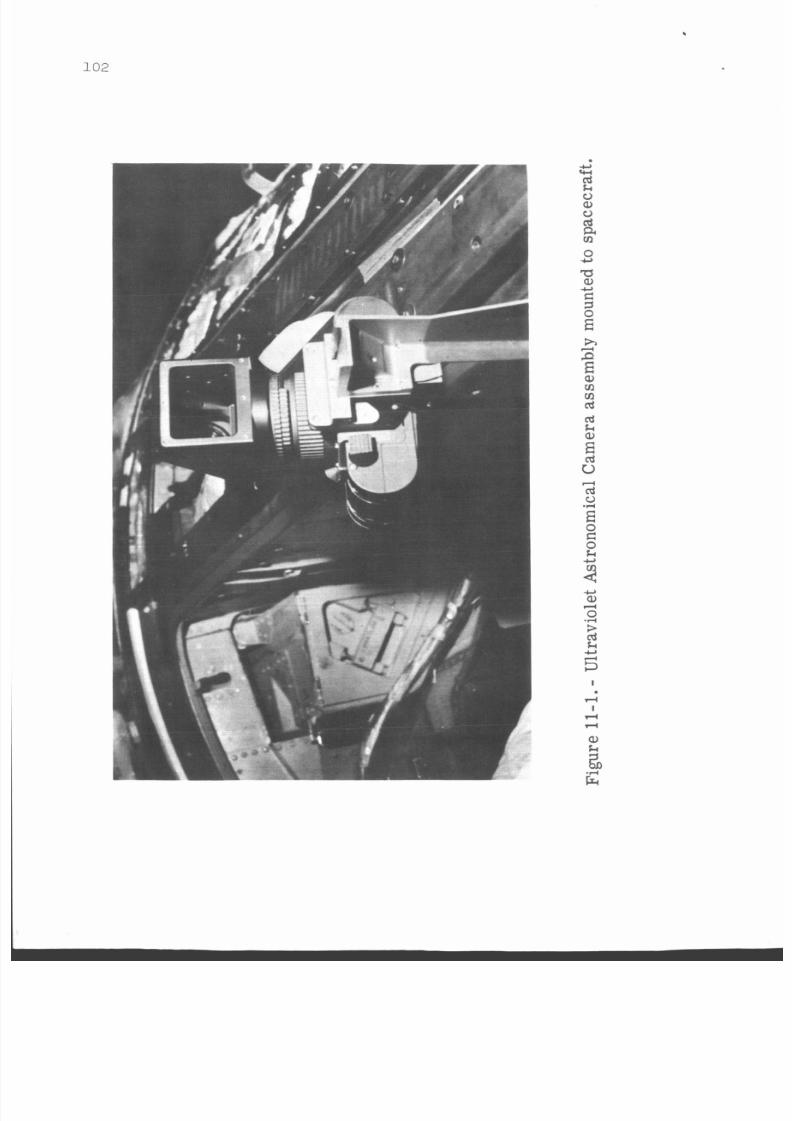
8/7/2019 Manned Spaceflight Experiments Gemini 10 Mission Interim Report
http://slidepdf.com/reader/full/manned-spaceflight-experiments-gemini-10-mission-interim-report 103/146
102
c20
a,0
cd
arn
0c,
2c,
E:I0
E
hzEa,
rnulcd
2a,
cd
u
cd
0
E
d
.d
E0E:0kc,
2c,
d
.d
a,
0
3cdkc,d
3
I4I4
4
0k
i2lG
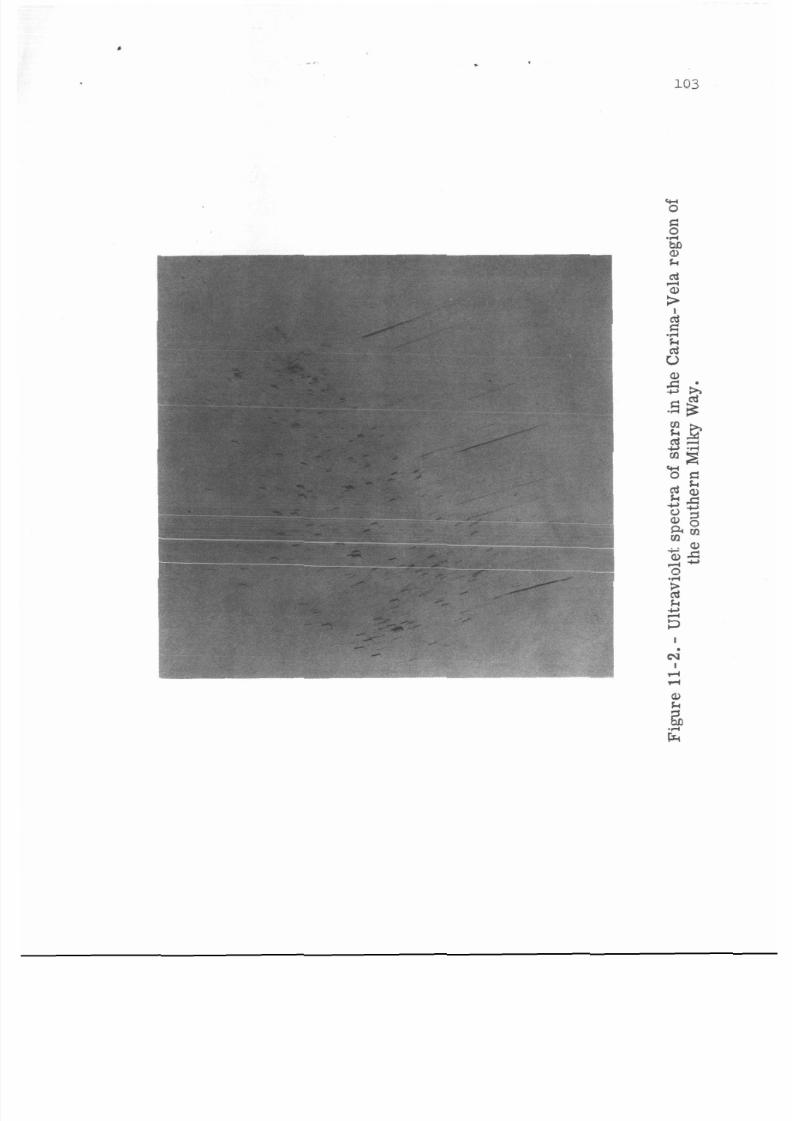
8/7/2019 Manned Spaceflight Experiments Gemini 10 Mission Interim Report
http://slidepdf.com/reader/full/manned-spaceflight-experiments-gemini-10-mission-interim-report 104/146
c
_ ,
103
W0
NI
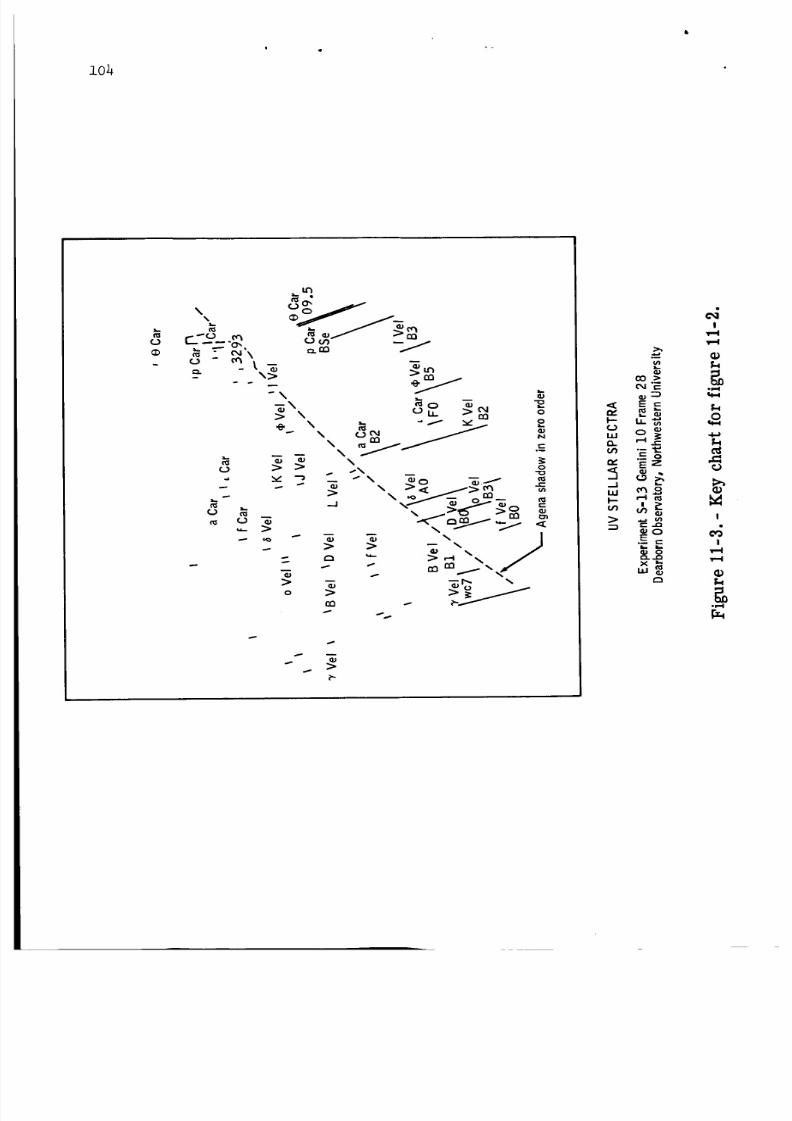
8/7/2019 Manned Spaceflight Experiments Gemini 10 Mission Interim Report
http://slidepdf.com/reader/full/manned-spaceflight-experiments-gemini-10-mission-interim-report 105/146
i04
(.)
u_
__-_o ._
C_) - _-I --
- >u'_
3-. f\ L.
_ \\ t..1_ .__
-- N N _,y
> _ \>
>o >
-" >
c_'F-
o _
> _
!
o_-_
_C
!
!
v-4
8/7/2019 Manned Spaceflight Experiments Gemini 10 Mission Interim Report
http://slidepdf.com/reader/full/manned-spaceflight-experiments-gemini-10-mission-interim-report 106/146
105
12. EXPERIMENT S026 (S-26), ION-WAKE MEASUREMENT
By David B. Medved, Ph.D.
Electro-Optical Systems, Inc.
OBJECTIVES
r_nq_ experiment ix toThe objective of the Ion-Wake Measurement _v_vj __
measure and confirm the ion and electron wake structure and perturbation
of the ambient medium produced by the orbiting Gemini spacecraft. The
experiment is designed to obtain the following:
(a) A mapping of the spacecraft ion density wake as a function of
position coordinates relative to the reference frame of the spacecraft
(b) A contour mapping of the spacecraft electron density wake as
a function of the same position coordinates
(c) Determination of electron temperature as a function of the
position coordinates
(d) Detailed information on ambient ion and electron densities and
electron temperature as a function of altitude and diurnal variationsfrom the Gemini Agena Target Vehicle (GATV)
(e) lonization transients caused by spacecraft thruster firings
INTHODUCTiON
The Gemini spacecraft moves through the ionospheric medium with a
velocity that is high compared with the random thermal velocities of the
ions but small compared with the random thermal motions of the electrons.The vehicle motion is supersonic with respect to the ions and subsonic
with respect to the electrons. Electrons, therefore, approach the vehi-
cle from all directions as if it were standing still, whereas the ions
are swept up by the vehicle motion.
To an observer on the spacecraft, there is a ram ion flux to the
vehicle along the direction of the vehicle velocity vector. The motion
of the vehicle results in a sweeping out of the ions and neutral parti-
cles in its path. If the constituents of the ionosphere were completely
8/7/2019 Manned Spaceflight Experiments Gemini 10 Mission Interim Report
http://slidepdf.com/reader/full/manned-spaceflight-experiments-gemini-10-mission-interim-report 107/146
106
at rest, a shadowzone would extend an indefinite distance behind thespacecraft.
As a result of the randomthermal motions, the shadowor hole regionis filled in by a sequenceof interacting mechanisms,with the regionbehind the orbiting vehicle actually being a plasma rather than an ionwake. Becausethe electrons approach the spacecraft from all directions,it would be expected that these would rapidly fill the shadowregion.The electrostatic forces between these charged particles prevent sub-stantial imbalances in the local space charge from occurring. The elec-trons are thus constrained by electric fields from moving too far awayfrom their positive-ion counterparts.
EQUIPMENT
The electron detector (fig. 12-1) is located on the GATVTargetDocking Adapter (TDA) and operates continuously during the experiment.Operation of the inboard and outboard ion detectors dependsupon the an-gular relationship of the GATVwith respect to the orbital velocity vec-tor. The inboard ion detector provides useful data whenever the GATVmovesTDA-forward with its axis parallel to the orbital path; the out-board detector is operative whenever the GATVyawsat right angles tothe orbital path. The placement of the equipment on the GATVis shownin figure 12-1, and figure 12-2 shows a general ion-wake profile.
The sensors, shownin figures 12-3 and 12-4, are five-elevent re-tarding potential analyzers with ac modulation for low-threshold opera-tion. They are designed to measure ion and electron densities over a
range from 5 × 10⁶ per cm3 to 50 per cm3, with electron temperaturemeasurementsin a range from 3 electron volts downto zero. For contourmapping, position resolution to approximately i foot in accuracy is ob-tained from a 16-mmgeneral-purpose sequencecamera.
The sensor-electrometer systems each collect and modulate plasmacurrent in a faraday cup containing four grids followed by a collectorplate. The voltage bias placed on the front grid limits the minimumenergy plasma particle which can enter the sensor. The second grid ac-celerates the properly charged particles which passed the first grid.
A third grid is driven by a 3840-hertz square wavewhich modulatesthe plasma current by alternately blocking and accelerating the particlespassing through the second grid. A fourth grid actually consists ofthree screens connected together to act as a capacitive shield betweenthe modulation grid (grid three) and the final collector. The third
8/7/2019 Manned Spaceflight Experiments Gemini 10 Mission Interim Report
http://slidepdf.com/reader/full/manned-spaceflight-experiments-gemini-10-mission-interim-report 108/146
107
screen in the final grid also serves as a collector for secondary photoelectrons produced in the sensor.
The sensor output current is designed to swing from zero to the dcvalue of the input plasma current and back within 1 microsecond, with a50-percent duty cycle at a frequency of 3840 hertzes. This square-wavecurrent is amplified by an ac electrometer located behind the sensor.Electrometer signals are synchronously demodulated and averaged by ananalog signal processor carried aboard the GATV. A resulting voltageproportional to the logarithmic average is generated and buffered, the_input to the analog-to-digital converter in the GATVtelemetry systemfor transmission to the network tracking stations.
PROCEDURES
Two distinct modes are used during flight. These modes have been
designed to obtain a maximum amount of information on the wake structure
with minimal consumption of spacecraft fuel. Mode-A constitutes a direct
axial mapping of the wake, which is accomplished by linear separation of
the spacecraft from the GATV. This type of maneuver is accomplished dur-
ing final departure of the spacecraft from the GATV. In this mode, ion
data are obtained by the inboard ion sensor.
The primary data mode of the S026 experiment is mode-B, illustrated
in figure 12-5. The maneuvers are intended to map the spacecraft wake
using in-plane maneuvers. Mapping commences with docked spacecraft/GATV
configuration in a TDA-south orientation. The spacecraft separates from
the target vehicle and performs a maneuver to a specific position. This
position is on an _xis along the orbital velocity vector of both the
spacecraft and target vehicle and passing through the outboard sensors,
with the spacecraft nose approximately 1 to 3 feet away from the target
vehicle. The spacecraft then translates downward, maintaining the axial
separation as constant as possible for a distance of approximately
15 feet. The spacecraft stops and then proceeds to carry out the por-
tions of the trajectory described in figure 12-5. The distances off-axis
corresponding to the transverse motion of the spacecraft were purposely
chosen in excess of the anticipated wake dimensions in order that all
thruster firings required to change direction in the manner shown will
occur in regions where plasma-wake data are not of critical interest.
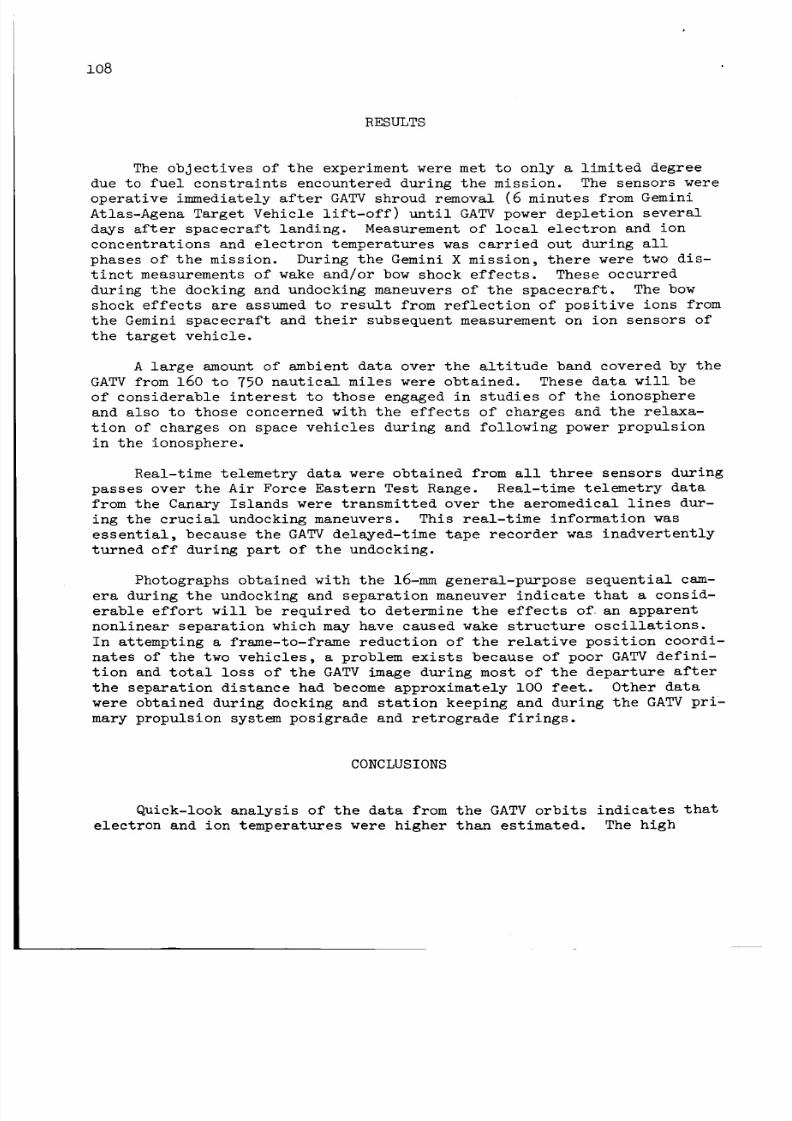
8/7/2019 Manned Spaceflight Experiments Gemini 10 Mission Interim Report
http://slidepdf.com/reader/full/manned-spaceflight-experiments-gemini-10-mission-interim-report 109/146
io8
RESULTS
The objectives of the experiment were met to only a limited degreedue to fuel constraints encountered during the mission. The sensors were
operative immediately after GATV shroud removal (6 minutes from Gemini
Atlas-Agena Target Vehicle lift-off) until GATV power depletion several
days after spacecraft landing. Measurement of local electron and ion
concentrations and electron temperatures was carried out during all
phases of the mission. During the Gemini X mission, there were two dis-
tinct measurements of wake and/or bow shock effects. These occurred
during the docking and undocking maneuvers of the spacecraft. The bow
shock effects are assumed to result from reflection of positive ions from
the Gemini spacecraft and their subsequent measurement on ion sensors of
the target vehicle.
A large amount of ambient data over the altitude band covered by the
GATV from 160 to 750 nautical miles were obtained. These data will be
of considerable interest to those engaged in studies of the ionosphere
and also to those concerned with the effects of charges and the relaxa-
tion of charges on space vehicles during and following power propulsion
in the ionosphere.
Real-time telemetry data were obtained from all three sensors during
passes over the Air Force Eastern Test Range. Real-time telemetry data
from the Canary Islands were transmitted over the aeromedical lines dur-
ing the crucial undocking maneuvers. This real-time information was
essential, because the GATV delayed-time tape recorder was inadvertently
turned off during part of the undocking.
Photographs obtained with the 16-mm general-purpose sequential cam-
era during the undocking and separation maneuver indicate that a consid-
erable effort will be required to determine the effects of an apparent
nonlinear separation which may have caused wake structure oscillations.
In attempting a frame-to-frame reduction of the relative position coordi-
nates of the two vehicles, a problem exists because of poor GATV defini-
tion and total loss of the GATV image during most of the departure after
the separation distance had become approximately 100 feet. Other data
were obtained during docking and station keeping and during the GATV pri L
mary propulsion system posigrade and retrograde firings.
CONCLUSIONS
Quick-look analysis of the data from the GATV orbits indicates that
electron and ion temperatures were higher than estimated. The high
8/7/2019 Manned Spaceflight Experiments Gemini 10 Mission Interim Report
http://slidepdf.com/reader/full/manned-spaceflight-experiments-gemini-10-mission-interim-report 110/146
109
electron temperature accounts for the sensor saturation observed duringthe mission. This temperature measurementwas 0.3 of an electron-voltat a 200-nautical-mile altitude during daytime conditions.
Spacecraft wake structure has been observed out to a distance ofi00 feet from the vehicle. Someoscillatory behavior in the wake struc-ture was observed. Wakedata over a period of i0 minutes may be avail-able from this mission. The theory of Gurevich and other Sovietscientists (ref. i) predicted an oscillatory wake structure. It is notclear at this point whether these S026observations are the result ofspacecraft motion in and out of the wakeor represent a confirmation ofthe Gurevich theory.
REFERENCE
i. Gurevich, A. V.; Al'pert, Ya. L.; and Pitaevskii, L. P.:
(H. H. Nickle, trans.): Space Physics With Artificial Satellites.
1965.
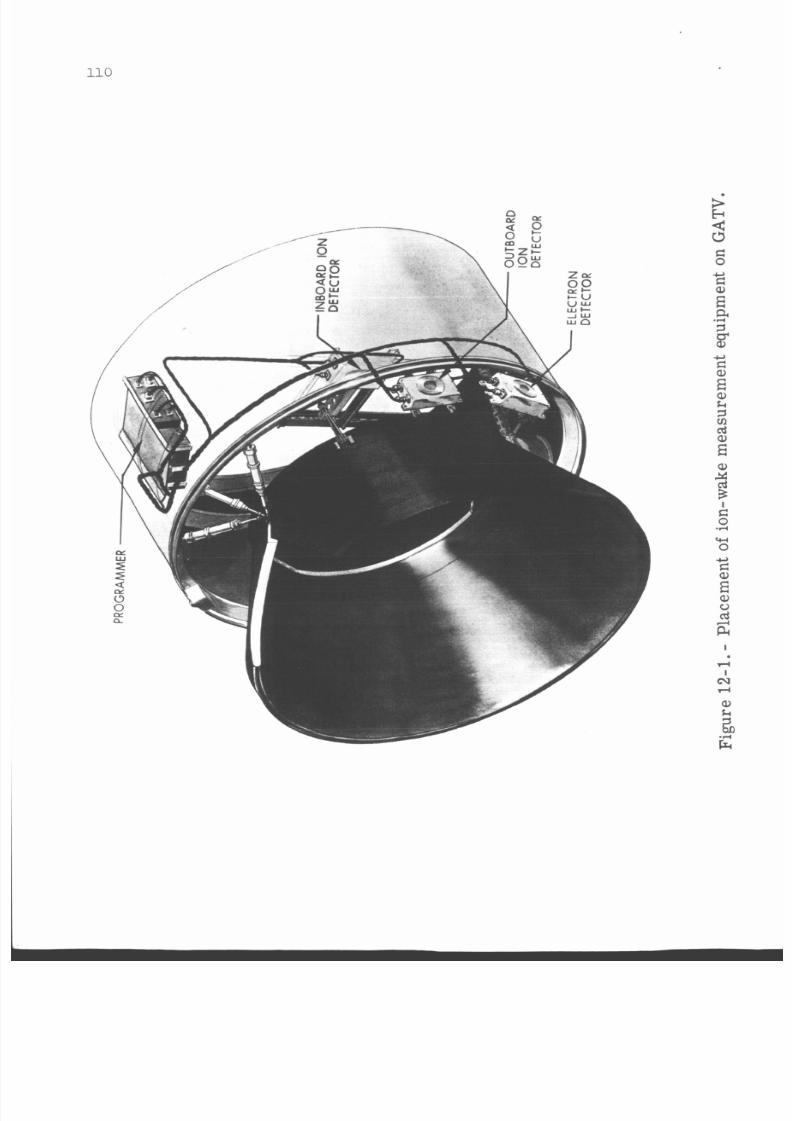
8/7/2019 Manned Spaceflight Experiments Gemini 10 Mission Interim Report
http://slidepdf.com/reader/full/manned-spaceflight-experiments-gemini-10-mission-interim-report 111/146
110
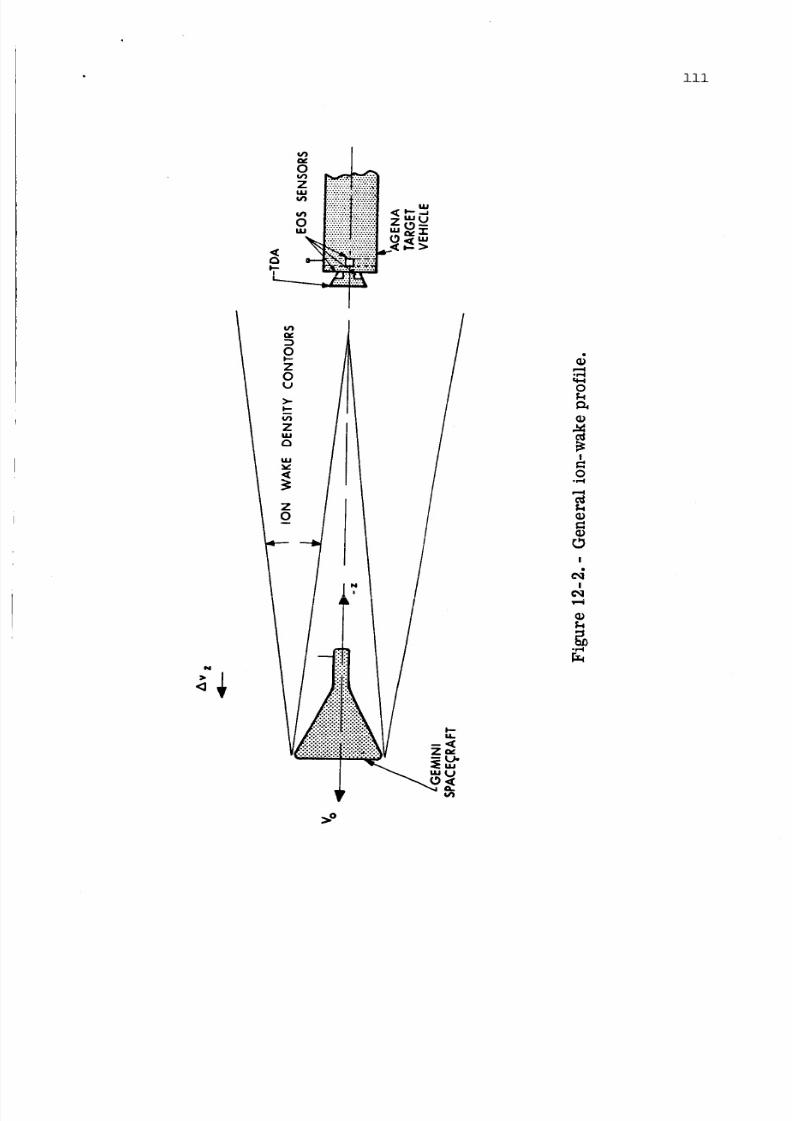
8/7/2019 Manned Spaceflight Experiments Gemini 10 Mission Interim Report
http://slidepdf.com/reader/full/manned-spaceflight-experiments-gemini-10-mission-interim-report 112/146
iii
0
liiiii!iiiii:!i!i"' !ii!i!i!ii!!!!!!!
_ i!!i_!:j
.....,...
.'::.[.X.'.,.-........:.
"X'_'X"::
i:!:i:i:i:i:i:_-__-_,i!i.::!!.!!!:-;_ .T:
N
Qg
0
Z0
ZU,I
o
U,I
v
Z
0
...i.iiii!iiiiiiiii-- "_/..-_ii_i_ii'.-".:!@i_iiiiii,_
V _
° r,,,I
0
!
°r,,_
!
e4!
*P,,I
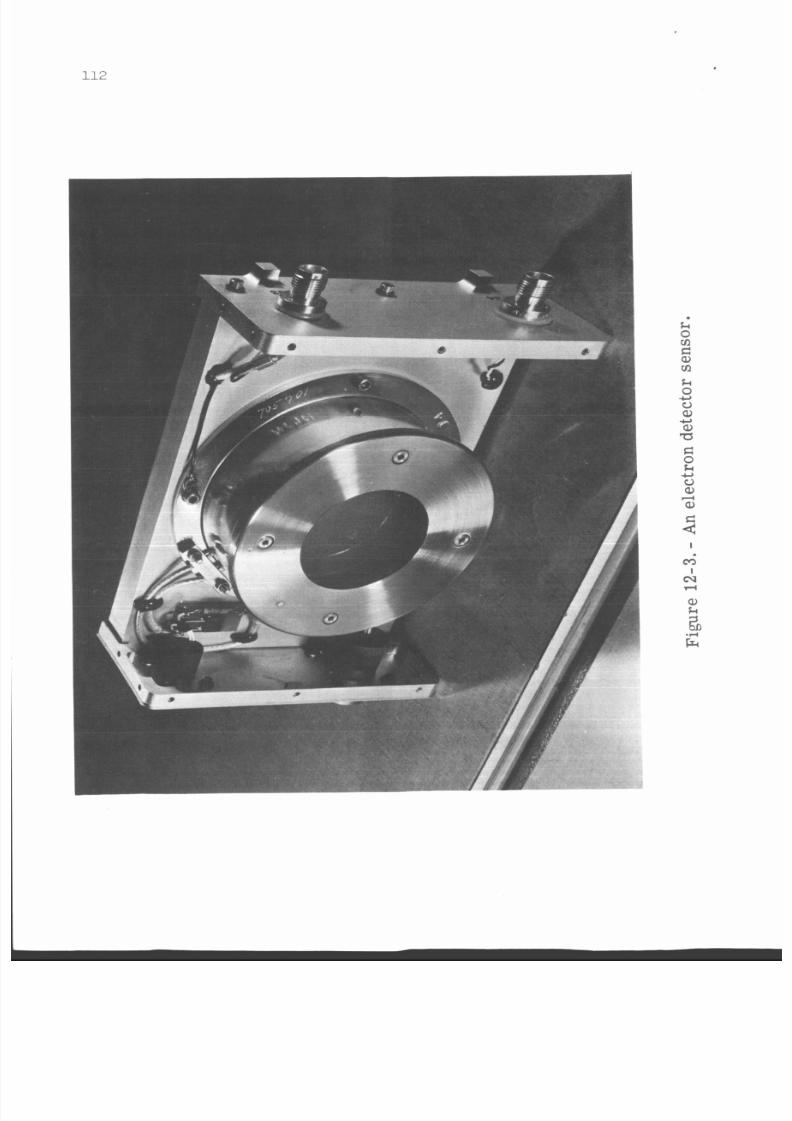
8/7/2019 Manned Spaceflight Experiments Gemini 10 Mission Interim Report
http://slidepdf.com/reader/full/manned-spaceflight-experiments-gemini-10-mission-interim-report 113/146
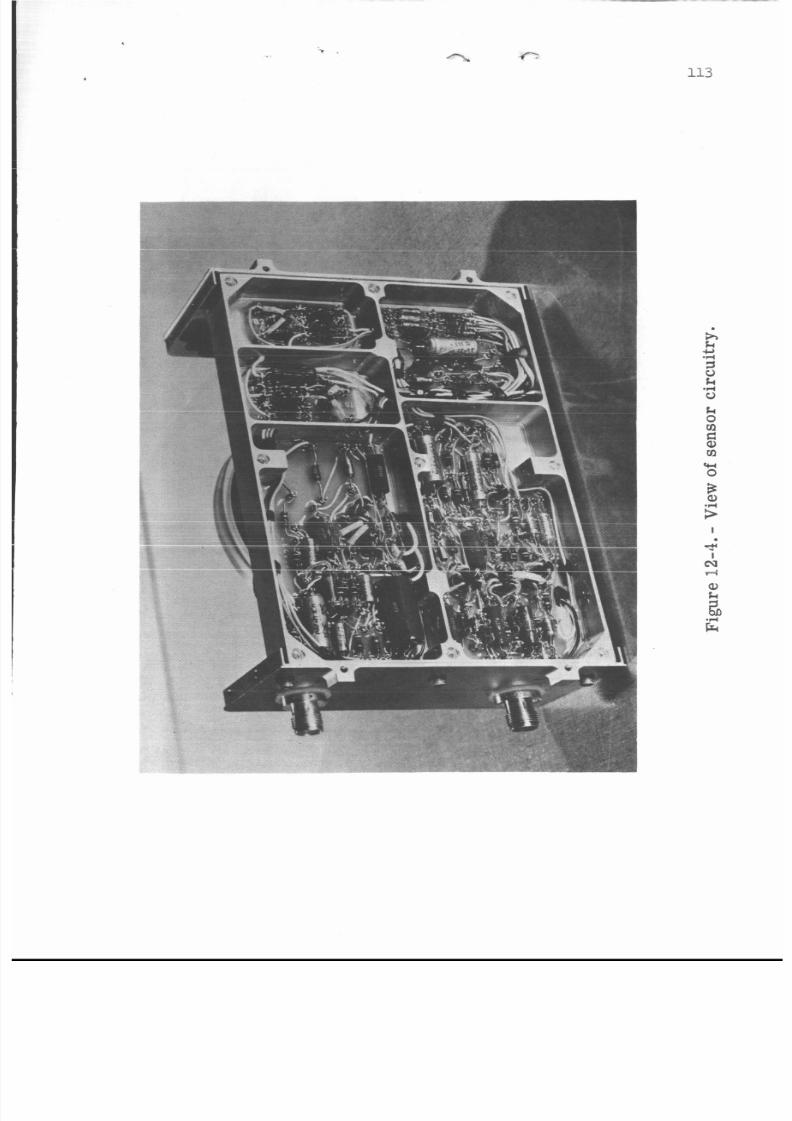
8/7/2019 Manned Spaceflight Experiments Gemini 10 Mission Interim Report
http://slidepdf.com/reader/full/manned-spaceflight-experiments-gemini-10-mission-interim-report 114/146
- /z- . .
113
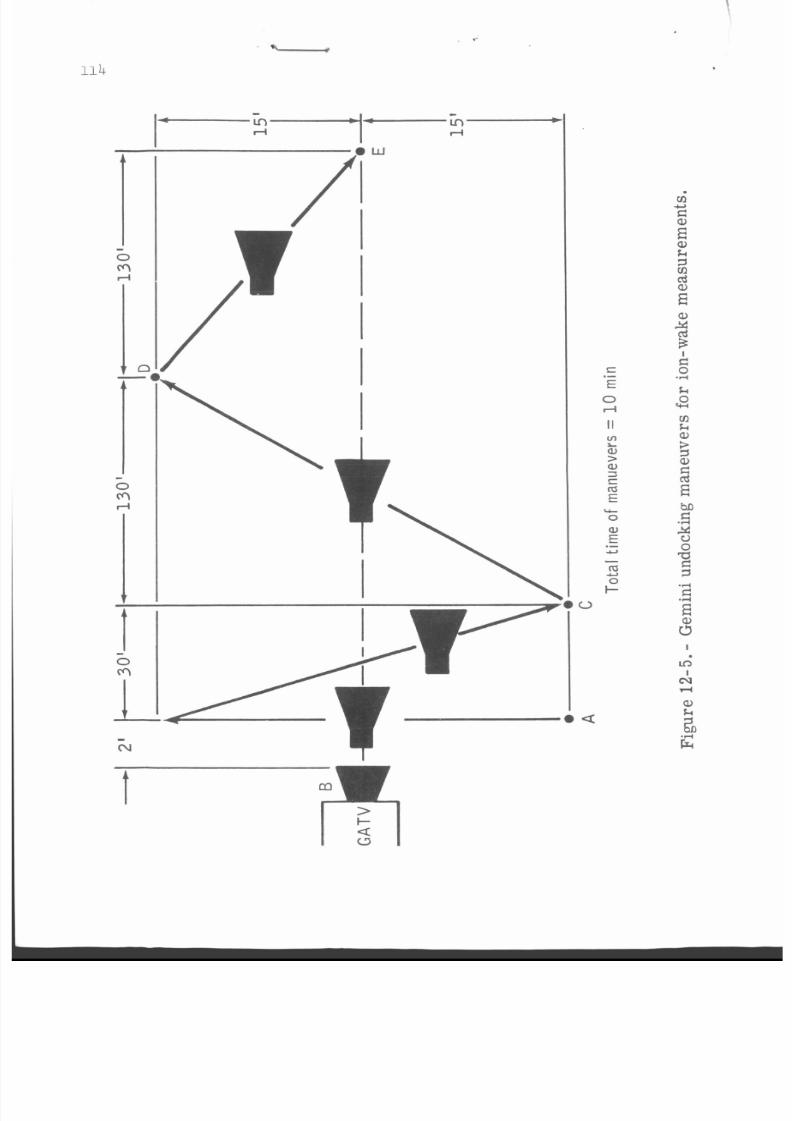
8/7/2019 Manned Spaceflight Experiments Gemini 10 Mission Interim Report
http://slidepdf.com/reader/full/manned-spaceflight-experiments-gemini-10-mission-interim-report 115/146
. . -
U I
rl- 1 -U I
rl
I
..
t-
\
-t0
L e a
-cv
t
m
GQ,
a,
k
1m
c,
E
$E
3
a,2cd
c0
k
0+I
mk
a,
I
.r(
8/7/2019 Manned Spaceflight Experiments Gemini 10 Mission Interim Report
http://slidepdf.com/reader/full/manned-spaceflight-experiments-gemini-10-mission-interim-report 116/146
14163 ll5
13. EXPERIMENT D005 (D-5), STAR OCCULTATION NAVIGATION
By Robert M. Silva and Terry R. Jorris
Air Force Avionics Laboratory
Wright Patterson AFB
And
Eugene M. Vallerie, III
NASA Manned Spacecraft .....
OBJECTIVES
The purpose of experiment D005 (D-5), Star Occultation Navigation
was to provide information on equipment and procedures to determine the
usefulness of star occultation measurements for space navigation and to
determine a horizon density profile.
This experiment was designed to make maximum use of man's capabili-
ties in orbit in order to provide the simplest and most reliable systems.
In this experiment, the astronauts had to accomplish the task of star ac-
quisition, identification, calibration, and tracking. Instrumentation
was required only to measure the relative intensity of the star as it setinto the atmosphere.
The instrumentation designed for this experiment was designed to
gather experimental data on star occultations over the entire attenuation
phenomena.
EQUIPMENT
The star occultation photometer is a single-unit, dual-mode, hand-
held externally powered instrument for electronically determining the
extent to which the sight line to a selected star penetrates a planetary
atmosphere. It also measures the contrast of a sun-illuminated ground
target. Data from the instrument, when calibrated and plotted against
time, provide the attenuation curve of a star passing through the earth's
atmosphere relative to an unattenuated intensity. General characteris-
tics of the instrument are as presented in the following table.
8/7/2019 Manned Spaceflight Experiments Gemini 10 Mission Interim Report
http://slidepdf.com/reader/full/manned-spaceflight-experiments-gemini-10-mission-interim-report 117/146
i16
Size, in ............... 5 by 5 by 3
Weight, ib .............. 2.5
Volume, cu in ............. 3O
The star occultation photometer optical system is a dual-path type,
separated on a wavelength basis by a dichroic reflector. One path car-
ries the short-wavelength star spectrum (0.4 to 0.5 micron) to the pho-
to multiplier cathode; the remainder of the star light continues along a
second path into the operator's eye. The instrument's optical character-
istics are summarized as follows:
Lens system Aperature Focal length, Wavelength,
in. A
Magnification
Objective 32 mm 4.6 3500-7000
Eyepiece 0.788 in. 0.73 5000-7000 6X
Path no. I 0.2 in. 0.33 3500-5000 1/16
Path no. 2 0.4 in. 0.277
The electronic system consists of a photomultiplier detector, pre-
amplifier, active bandpass-filter amplifier, and postfilter amplifier-
demodulator in the carrier signal section. The dc-signal sectioncontains an active low-pass filter, calibration level detector, and in-
dicator lights. A uniJunction oscillator and three flip-flops are used
to generate two-phase, lO0-cps power for the size-5 hysteresis-synchronous
modulator motor. Input power to the motor is regulated. Additional
voltage regulators supply isolated low voltage to the signal circuitry
and high voltage to the photomultiplier. The output of the low-pass fil-
ter is conducted to the input of the Schmitt trigger level detector
biased at approximately one volt. Depressing the calibrate pushbutton
inserts a nominal 5-to-1 attenuator in both day and night signal paths,
lowering the full signal amplitude from 5 volts to 1 volt for calibration.
The photometer is readied for use by plugging in one cable for power andone for high-level telemetry and by placing the mode switch to NIGHT.
The photometer is shown in figure 13-1.
The Gemini X photometer was a instrument which had been refurbished
and recalibrated after its inflight failure during the Gemini VII mission.
The failure was caused by loose particles in the photomultiplier tube.
A strigent quality control program designed to identify and count all
loose particles was instituted in preparation for the Gemini X flight.
Each photomultiplier tube considered for use was examined under a micro-
scope, and all particles were sized to assure that the aggregate was not
8/7/2019 Manned Spaceflight Experiments Gemini 10 Mission Interim Report
http://slidepdf.com/reader/full/manned-spaceflight-experiments-gemini-10-mission-interim-report 118/146
117
larger than the smallest element spacing in the photomultiplier tube.
Since the equipment worked as designed on the Gemini X mission, thesequality control measures apparently had the desired effect.
PROCEDURES
Knowledgeof the time of occultation of a known star by a celestialbody, as seen by an orbiting observer, determines a cylinder of positionwhose axis is the line through the star and the body center and whoseradius is equal to the occulting body radius. The times of six occulta-
tions provide information to uniquely determine all orbital parametersof the body. Determination of these times of occultation from the earthis difficult due to atmospheric attenuation of the star light. The stardoes not arbitrarily disappear but dims gradually into the horizon.Measurementof the percentage of dimmingwith respect to the altitude ofthis grazing ray from the star to the observer provides a percentage al-titude for occultation. In other words, a star can be assumedto be oc-culted when it reaches a predetermined percentage of its unattenuatedvalue.
The D005 experiment procedures provide the meansof measuring this
attenuation with respect to time to determine the usefulness of the meas-urements for autonomousspace navigation. In addition, the measurementsprovide a density profile of the atmosphereto update the atmosphericmodel for use in star occultation navigation as well as other forms ofhorizon-based navigation and orbit prediction.
Star occultation measurementsare madeby identify_ng_ acquiring,and tracking a selected star in the i/2-degree reticle of the 10-degreefield of view of the photometer. The light intensity of the star is nor-malized to the 5-volt telemetry output by depressing a calibrate buttonand adjusting the gain to drive the reticle light to an alternating red-green condition. Thus normalized, the button is released and the staris tracked as it disappears into the horizon. The star intensity ismeasured, recorded, and time-correlated on'the onboard telemetry tape forpostflight analysis. On any night pass, four to six stars are acquired,calibrated, and tracked to occultation, and the star and approximate timeof occultation are recorded in the flight log for postflight correlationwith tape-recorded data and ground-track information. Timing marks arerecorded on the telemetry (using the calibrate button) on someruns toidentify special selected observations such as time of star passagethrough the top of the airglow. Postflight data reduction and analysisinclude the following operations.
8/7/2019 Manned Spaceflight Experiments Gemini 10 Mission Interim Report
http://slidepdf.com/reader/full/manned-spaceflight-experiments-gemini-10-mission-interim-report 119/146
i18
(a) Occultation measurements are inserted into the navigation equa-
tions to determine orbital parameters. Results are then compared with
ephemeris data to determine the accuracy of the calculations.
(b) Ground track position data are used to determine the altitude
of the grazing rays with respect to atmospheric attenuation to provide
an atmospheric density profile.
(c) The newly determined atmospheric model is used to recompute nav-
igation parameters from star occultation measurements. These are com-
pared with ephemeris data and the previous navigation measurements to
evaluate the degree of improvement.
A mode-D procedure was established shortly before printing of the
Gemini X final flight plan. This mode required the use of the spacecraft
computer and photometer data for real-time orbit navigation determination.
Ground analysis will compare this solution with ground-track data to de-
termine how well the orbit was established by the onboard technique.
RESULTS
The photometer was used twice during the mission. It was used the
first time at 26 hours 30 minutes ground elapsed time (g.e.t.), while the
spacecraft was docked with the Gemini Agena Target Vehicle (GATV), and
the second time at 64 hours 46 minutes g.e.t, after the spacecraft and
GATV had separated.
During the first attempt to perform the experiment in mode-A (cali-
bration), difficulty was encountered in vehicle-attitude control because
of the docked configuration. Due to the control problems, only five stars
were tracked to total occultation. Since a minimum of six stars are re-
quired for complete computation, a total solution was not obtained.
A problem was encountered in tracking stars through the airglow. As
the stars passed through the green glow layer, they disappeared momentar-
ily. When acquisition was lost, the pilot discontinued sighting through
the photometer until the stars reappeared below the green glow, and then
he resumed tracking the stars through the photometer until they disap-
peared into the lower, dark horizon. Excessive attitude control gas ex-
penditure during this procedure led to cancellation of further runs until
after undocking.
The second experiment run was a mode-D sequence using the undocked
configuration. No difficulties were encountered on this run with regard
to the acquisition and tracking of seven stars to occultation; however,
8/7/2019 Manned Spaceflight Experiments Gemini 10 Mission Interim Report
http://slidepdf.com/reader/full/manned-spaceflight-experiments-gemini-10-mission-interim-report 120/146
119
procedural difficulties were encountered in entering the visual occulta-tion data into the computer. Computation of an orbit solution was pre-cluded because of improper entry of the right ascension and declination
of the last star, and computer workload problems encountered after themeasurementtaken on the fourth star.
A calibration check on three stars in Cyguswas not properly accom-plished on either run. An attempt was madeto calibrate on each star in-dependently rather than to retain one gain setting. This does not affectthe use of the occultation technique for navigation but was included toaid in data analysis and reduction.
Visual occultations through the photometer reported by the pilotwere somewhatdifferent from those reported by the commandpilot. The
commandpilot could still observe somestars visually after the pilot hadreported their disappearance. The phenomenonwas probably caused by theselective reflection within the instrument which is designed to allowmaximumblue light to fall on the photomultiplier tube.
Representative telemetry plots of normalized star light intensityfrom Gemini X, with time in seconds horizontally and normalized star in-tensity in volts vertically, are given in figures 13-2 to 13-4. A con-siderable amount of information can be derived from a visual analysis.In figure 13-2, the constant output portion of the Vega star curve can beclearly seen; this flat portion of the curve corresponds to the time the
star remains well above the earth's atmosphere. As the line of sight tothe star begins to pass through the upper portion of the atmosphere, theapparent intensity of the star begins to diminish (point A). In thelower portions of the atmosphere the downwardslope approaches a straightline (point B to C) until the star seemsto disappear into the back-ground. In the straight-line portion, a time of percentage attenuation,with accuracy to within approximately one-half second, can be packed offby eye. The visual method of occultation time-determination would thenlimit the accuracy of the navigation solution to 2-1/2 nautical miles;however, if computer smoothing were used, as is anticipated for opera-tional use, greater accuracies areachievable. Initial results of en-
tering the occultation voltages into a computer for smoothing prior tocalculation indicate time determination accurate to 0.i to 0.2 secondsof time.
Orbit solutions based on these Gemini X timing accuracies and starocculation sequences as outlined in Gemini X flight plan would have pro-vided navigation accuracies of approximately 1 nautical mile rms.
Procedures for occultation measurementsare visible in traces fromArcturus shown in figure 13-3. At point 1 the photometer was turned on;calibration began at point 2 by depressing the calibration button; be-
tween 2 and 3 calibration is being accomplished; when complete at point 3,
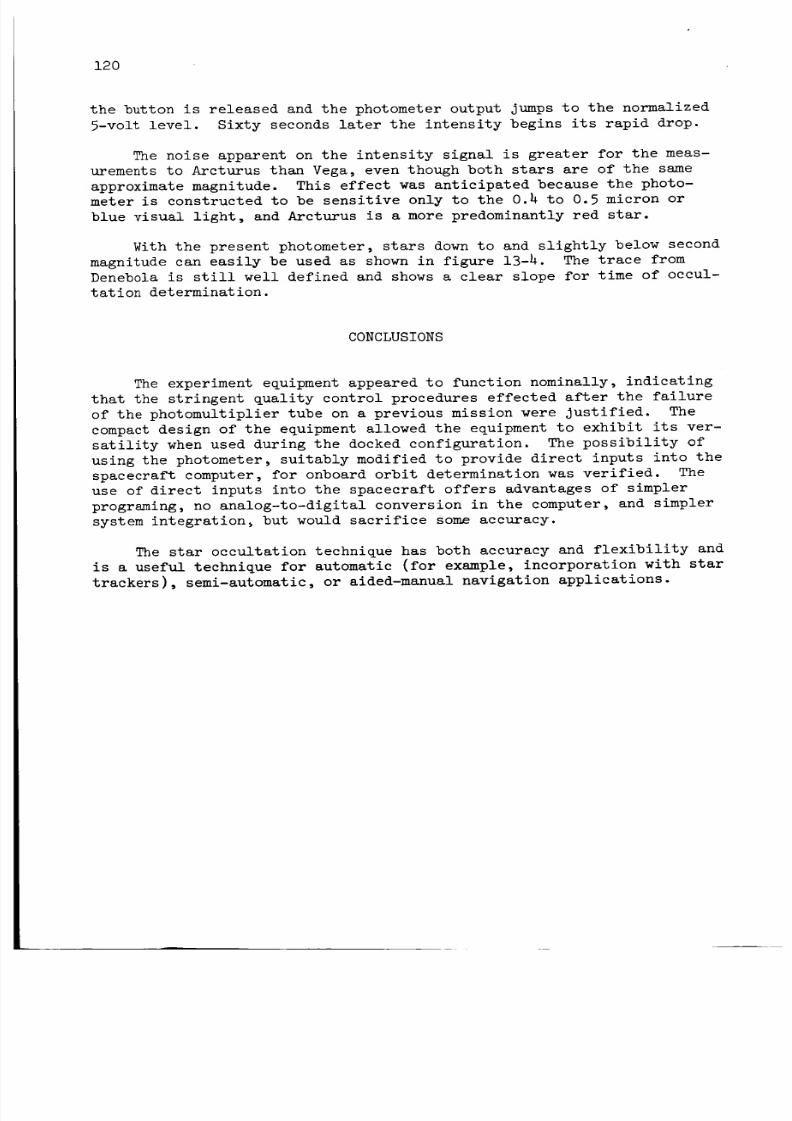
8/7/2019 Manned Spaceflight Experiments Gemini 10 Mission Interim Report
http://slidepdf.com/reader/full/manned-spaceflight-experiments-gemini-10-mission-interim-report 121/146
120
the button is released and the photometer output jumps to the normalized5-volt level. Sixty seconds later the intensity begins its rapid drop.
The noise apparent on the intensity signal is greater for the meas-
urements to Arcturus than Vega, even though both stars are of the sameapproximate magnitude. This effect was anticipated because the photo-meter is constructed to be sensitive only to the 0.4 to 0.5 micron orblue visual light, and Arcturus is a more predominantly red star.
With the present photometer, stars downto and slightly below secondmagnitude can easily be used as shown in figure 13-4. The trace fromDenebola is still well defined and showsa clear slope for time of occul-tation determination.
CONCLUSIONS
The experiment equipment appeared to function nominally, indicatingthat the stringent quality control procedures effected after the failureof the photomultiplier tube on a previous mission were Justified. Thecompactdesign of the equipment allowed the equipment to exhibit its ver-satility whenused during the docked configuration. The possibility ofusing the photometer, suitably modified to provide direct inputs into thespacecraft computer, for onboard orbit determination was verified. Theuse of direct inputs into the spacecraft offers advantages of simpler
programing, no analog-to-digital conversion in the computer, and simplersystem integration_ but would sacrifice som2accuracy.
The star occultation technique has both accuracy and flexibility andis a useful technique for automatic (for example, incorporation with startrackers), semi-automatic, or aided-manual navigation applications.
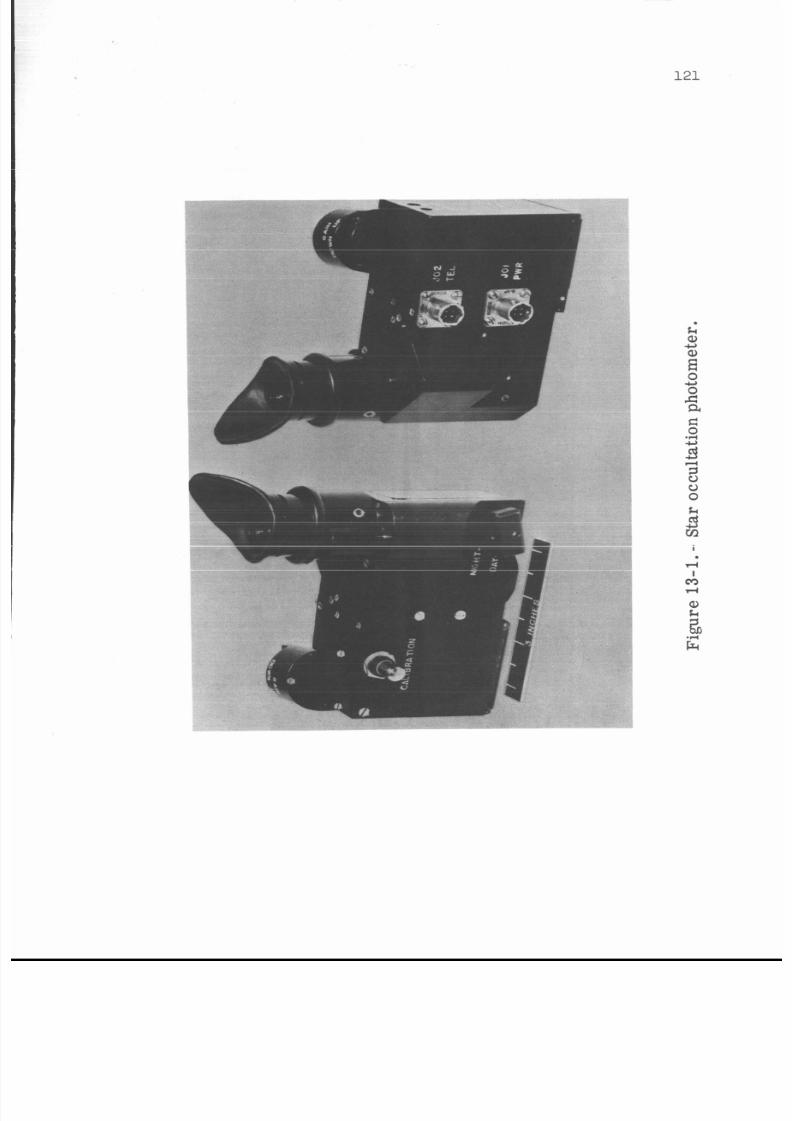
8/7/2019 Manned Spaceflight Experiments Gemini 10 Mission Interim Report
http://slidepdf.com/reader/full/manned-spaceflight-experiments-gemini-10-mission-interim-report 122/146
121
k’
E
a,a,
0
0Gad0
u
u
.I+
3410
0
0
kcdffI
rlImrla,2G
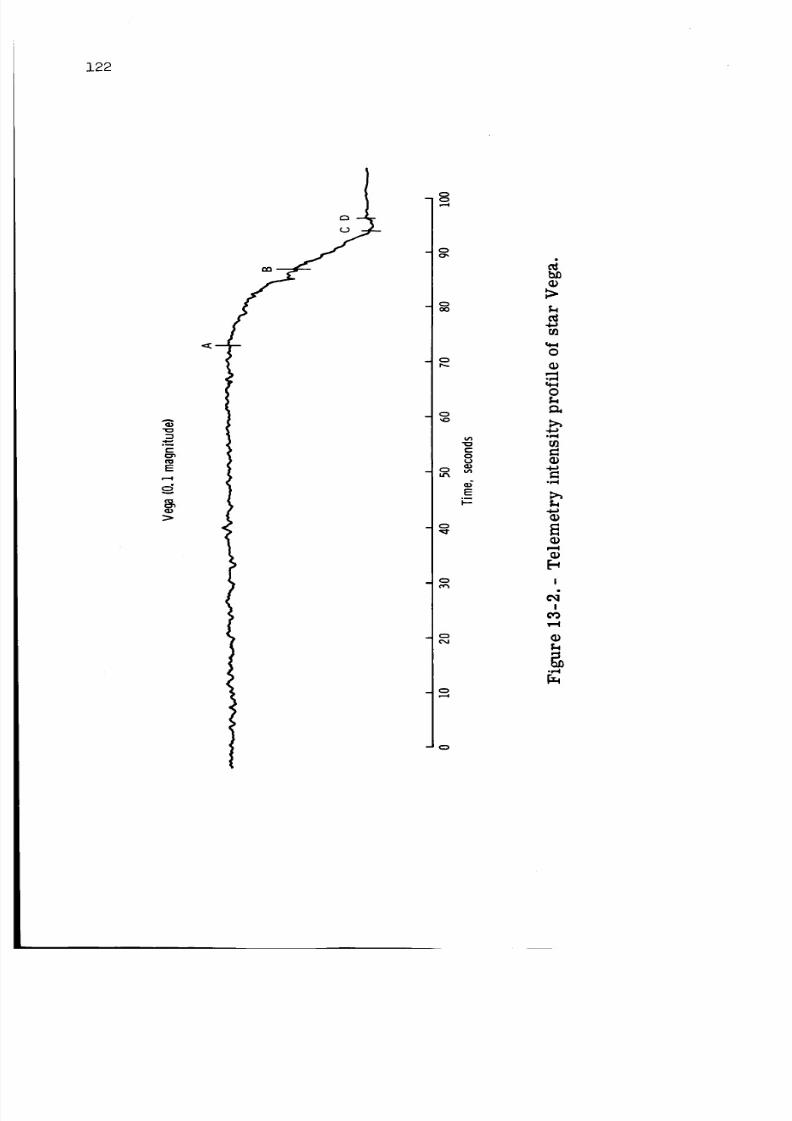
8/7/2019 Manned Spaceflight Experiments Gemini 10 Mission Interim Report
http://slidepdf.com/reader/full/manned-spaceflight-experiments-gemini-10-mission-interim-report 123/146
122
t-
o
o
o
0
00
0
0
E°_
0
0
0
o4
0,-4
0
0
0
.r,,l
I
d!
8/7/2019 Manned Spaceflight Experiments Gemini 10 Mission Interim Report
http://slidepdf.com/reader/full/manned-spaceflight-experiments-gemini-10-mission-interim-report 124/146
j •
123
o_
r-
E
N
d
i
N
O
r-_
m
O
r-O
Eo_
N
O
O
I
I
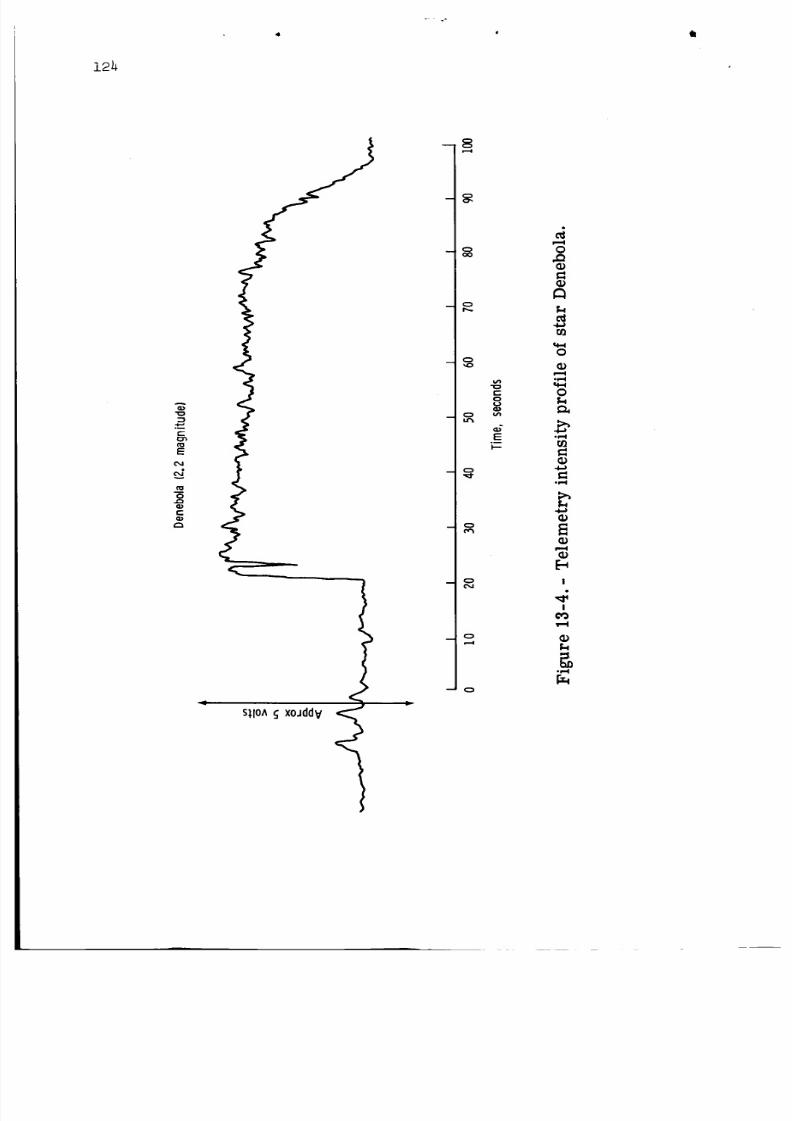
8/7/2019 Manned Spaceflight Experiments Gemini 10 Mission Interim Report
http://slidepdf.com/reader/full/manned-spaceflight-experiments-gemini-10-mission-interim-report 125/146
124
N
r-
S_,lO _̂ xoJddv
_ 0aO
_ 0
_ 0
f-0U
_ o _
dEi.--
-- Q
0
4.o
0
0
* r...I
tJl
!
4!
g*p..I
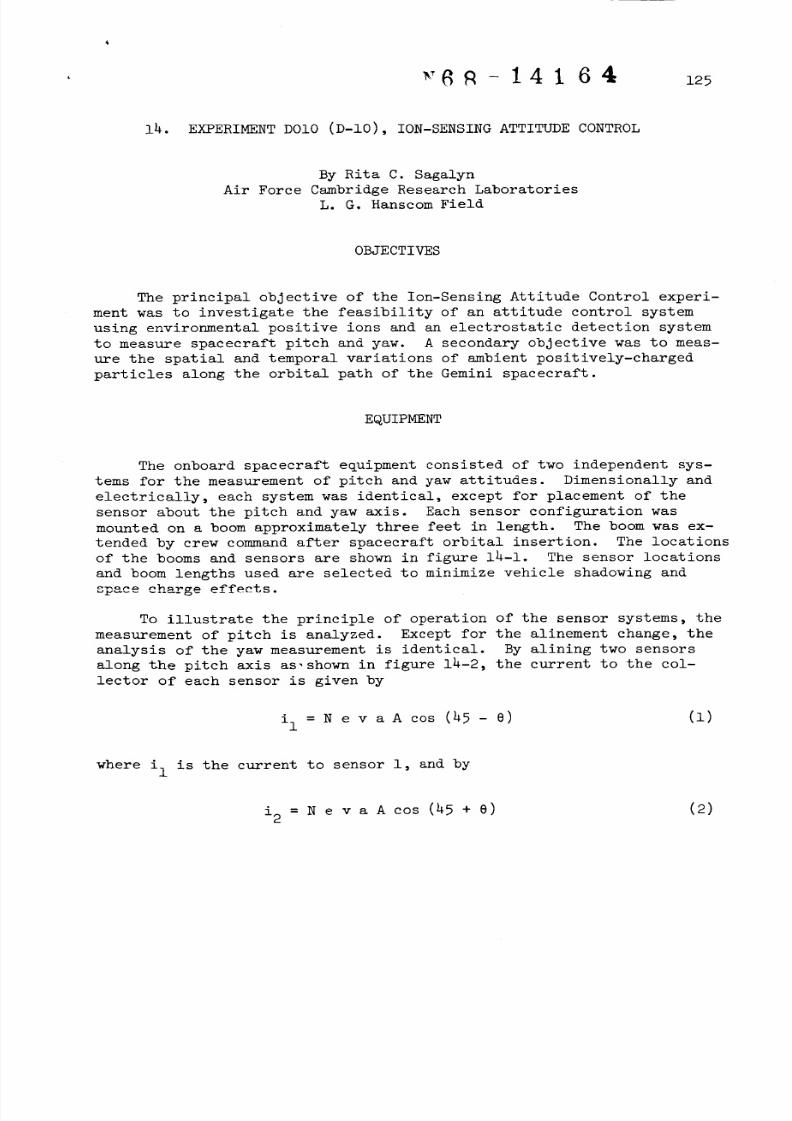
8/7/2019 Manned Spaceflight Experiments Gemini 10 Mission Interim Report
http://slidepdf.com/reader/full/manned-spaceflight-experiments-gemini-10-mission-interim-report 126/146
125
14. EXPERIMENT DOIO (D-10), ION-SENSING ATTITUDE CONTROL
By Rita C. Sagalyn
Air Force Cambridge Research Laboratories
L. G. Hanscom Field
OBJECTIVES
The principal objective of the Ion-Sensing Attitude Control experi-
ment was to investigate the feasibility of an attitude control system
using environmental positive ions and an electrostatic detection system
to measure spacecraft pitch and yaw. A secondary objective was to meas-
ure the spatial and temporal variations of ambient positively-charged
particles along the orbital path of the Gemini spacecraft.
EQUIPMENT
The onboard spacecraft equipment consisted of two independent sys-
tems for the measurement of pitch and yaw attitudes. Dimensionally and
electrically, each system was identical, except for placement of the
sensor about the pitch and yaw axis. Each sensor configuration was
mounted on a boom approximately three feet in length. The boom was ex-
tended by crew command after spacecraft orbital insertion. The locations
of the booms and sensors are shown in figure 14-1. The sensor locations
and boom lengths used are selected to minimize vehicle shadowing and
space charge effects.
To illustrate the principle of operation of the sensor systems, the
measurement of pitch is analyzed. Except for the alinement change, the
analysis of the yaw measurement is identical. By alining two sensors
along the pitch axis as,shown in figure 14-2, the current to the col-
lector of each sensor is given by
iI = N e v a A cos (45 - e)(i)
where iI is the current to sensor i, and by
= N e v a A cos (45 + e)-2
(2)
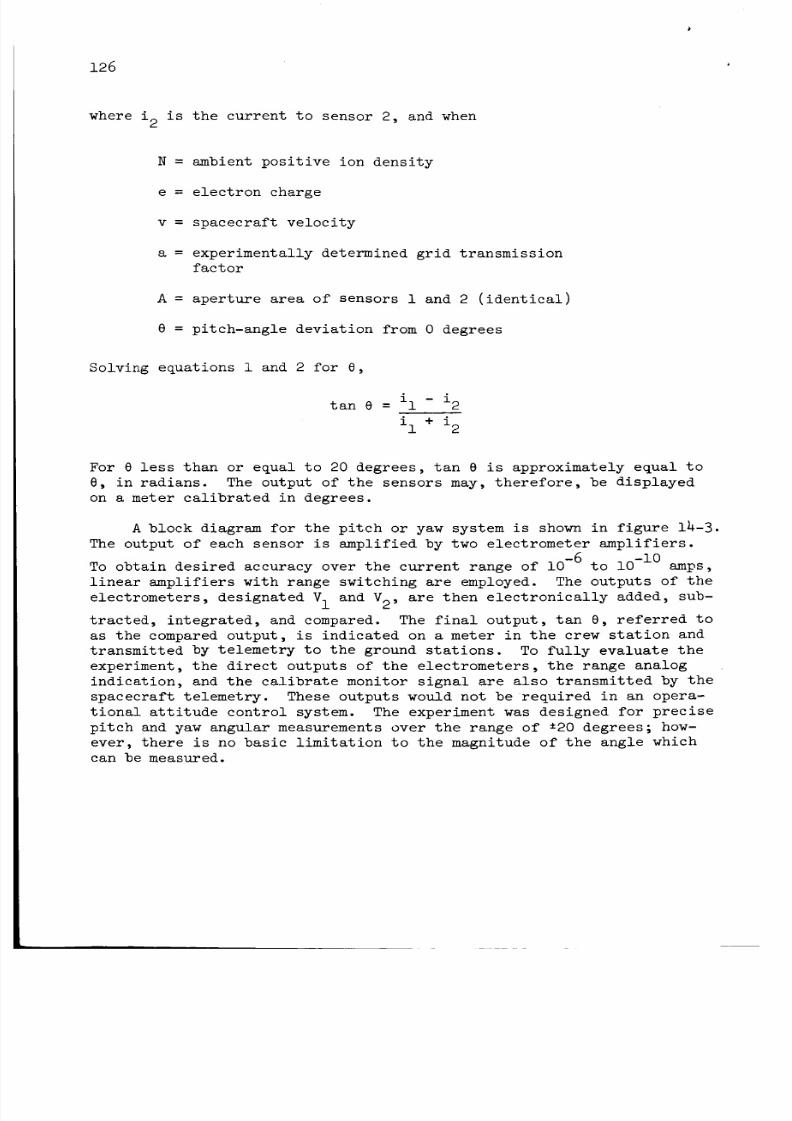
8/7/2019 Manned Spaceflight Experiments Gemini 10 Mission Interim Report
http://slidepdf.com/reader/full/manned-spaceflight-experiments-gemini-10-mission-interim-report 127/146
126
where i2 is the current to sensor 2, and when
N = ambient positive ion density
e = electron charge
v = spacecraft velocity
a = experimentally determined grid transmission
factor
A = aperture area of sensors i and 2 (identical)
e = pitch-angle deviation from 0 degrees
Solving equations i and 2 for e,
tan e = il - i2
iI + i2
For 0 less than or equal to 20 degrees, tan e is approximately equal to
e, in radians. The output of the sensors may, therefore, be displayed
on a meter calibrated in degrees.
A block diagram for the pitch or yaw system is shown in figure 14-3.
The output of each sensor is amplified by two electrometer amplifiers.
To obtain desired accuracy over the current range of 10 -6 to i0 -I0 amps,
linear amplifiers with range switching are employed. The outputs of the
electrometers, designated VI and V2, are then electronically added, sub-
tracted, integrated, and compared. The final output, tan e, referred to
as the compared output, is indicated on a meter in the crew station and
transmitted by telemetry to the ground stations. To fully evaluate the
experiment, the direct outputs of the electrometers, the range analog
indication, and the calibrate monitor signal are also transmitted by the
spacecraft telemetry. These outputs would not berequired in an opera-
tional attitude control system. The experiment was designed for precise
pitch and yaw angular measurements over the range of ±20 degrees; how-
ever, there is no basic limitation to the magnitude of the angle which
can be measured.
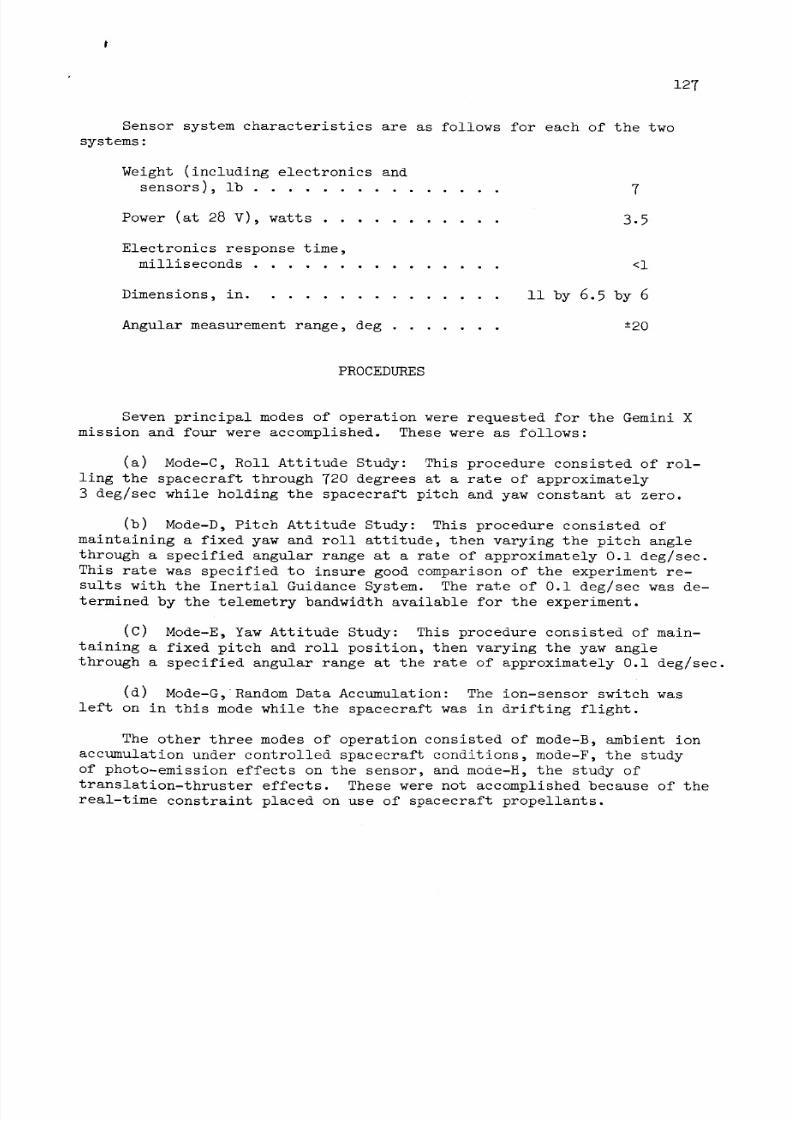
8/7/2019 Manned Spaceflight Experiments Gemini 10 Mission Interim Report
http://slidepdf.com/reader/full/manned-spaceflight-experiments-gemini-10-mission-interim-report 128/146
127
Sensor system characteristics are as follows for each of the twosystems:
Weight (including electronics andsensors), ib ............... 7
Power (at 28 V), watts ........... 3.5
Electronics response time,milliseconds ............... <i
Dimensions, in ............... Ii by 6.5 by 6
Angular measurementrange, deg ....... ±20
PROCEDURES
Seven principal modesof operation were requested for the Gemini Xmission and four were accomplished. Thesewere as follows:
(a) Mode-C, Roll Attitude Study: This procedure consisted of rol-ling the spacecraft through 720 degrees at a rate of approximately3 deg/sec while holding the spacecraft pitch and yaw constant at zero.
(b) Mode-D,Pitch Attitude Study: This procedure consisted ofmaintaining a fixed yaw and roll attitude, then varying the pitch anglethrough a specified angular range at a rate of approximately 0.i deg/sec.This rate was specified to insure good comparison of the experiment re-sults with the Inertial Guidance System. The rate of 0.i deg/sec was de-termined by the telemetry bandwidth available for the experiment.
(C) Mode-E, YawAttitude Study: This procedure consisted of main-taining a fixed pitch and roll position, then varying the yaw anglethrough a specified angular range at the rate of approximately 0.i deg/sec.
(d) Mode-G,RandomData Accumulation: The ion-sensor switch wasleft on in this modewhile the spacecraft was in drifting flight.
The other three modesof operation consisted of mode-B, ambient ionaccumulation under controlled spacecraft conditions, mode-F, the studyof photo-emission effects on the sensor, and mode-H, the study oftranslation-thruster effects. These were not accomplished because of thereal-time constraint placed on use of spacecraft propellants.
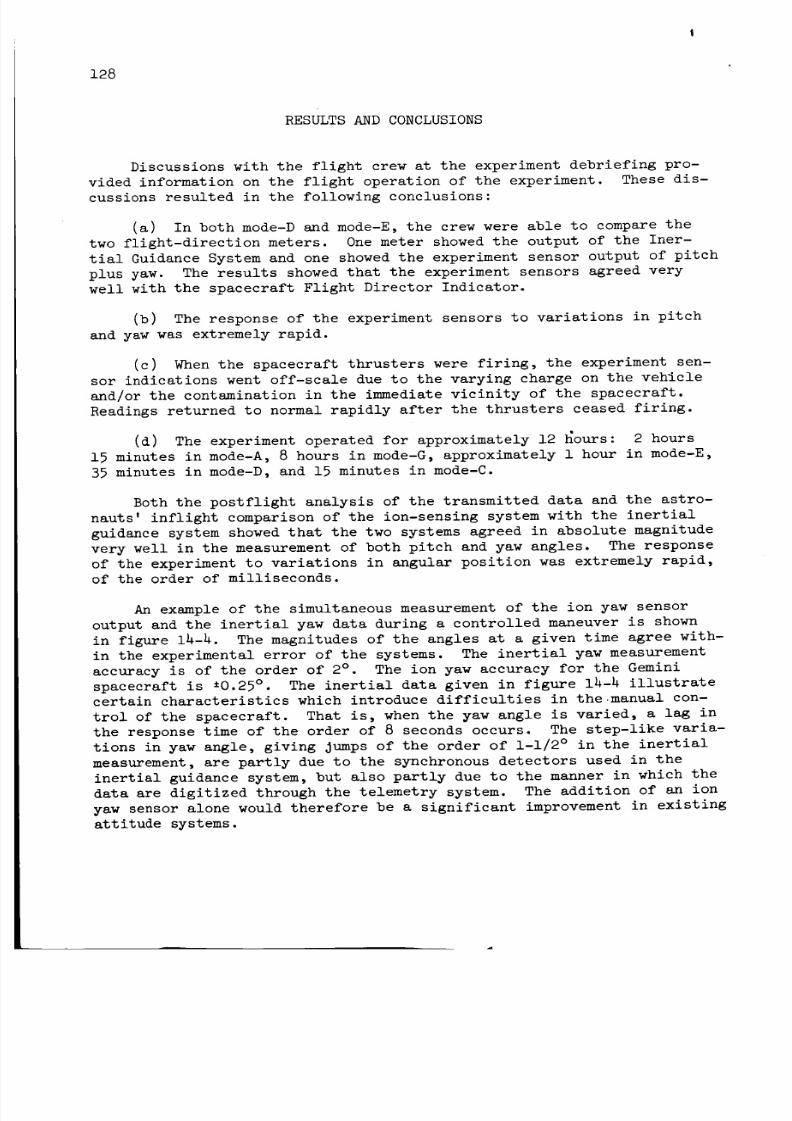
8/7/2019 Manned Spaceflight Experiments Gemini 10 Mission Interim Report
http://slidepdf.com/reader/full/manned-spaceflight-experiments-gemini-10-mission-interim-report 129/146
128
RESULTSANDCONCLUSIONS
Discussions with the flight crew at the experiment debriefing pro-vided information on the flight operation of the experiment. Thesedis-cussions resulted in the following conclusions:
(a) In both mode-Dand mode-E, the crew were able to comparethetwo flight-direction meters. Onemeter showedthe output of the Iner-tial Guidance System and one showedthe experiment sensor output of pitchplus yaw. The results showedthat the experiment sensors agreed verywell with the spacecraft Flight Director Indicator.
(b) The response of the experiment sensors to variations in pitch
and yaw was extremely rapid.(c) Whenthe spacecraft thrusters were firing, the experiment sen-
sor indications went off-scale due to the varying charge on the vehicleand/or the contamination in the immediate vicinity of the spacecraft.Readings returned to normal rapidly after the thrusters ceased firing.
(d) The experiment operated for approximately 12 hours: 2 hours15 minutes in mode-A, 8 hours in mode-G, approximately 1 hour in mode-E,35 minutes in mode-D, and 15 minutes in mode-C.
Both the postflight analysis of the transmitted data and the astro-nauts' inflight comparison of the ion-sensing system with the inertialguidance system showedthat the two systems agreed in absolute magnitudevery well in the measurementof both pitch and yaw angles. The responseof the experiment to variations in angular position was extremely rapid,of the order of milliseconds.
An example of the simultaneous measurementof the ion yaw sensoroutput and the inertial yaw data during a controlled maneuver is shownin figure 14-4. The magnitudes of the angles at a given time agree with-in the experimental error of the systems. The inertial yaw measurementaccuracy is of the order of 2°. The ion yaw accuracy for the Gemini
spacecraft is ±0.25°. The inertial data given in figure 14-4 illustratecertain characteristics which introduce difficulties in themanual con-trol of the spacecraft. That is, when the yaw angle is varied, a lag inthe response time of the order of 8 seconds occurs. The step-like varia-tions in yaw angle, giving Jumpsof the order of l-l/2 ° in the inertialmeasurement,are partly due to the synchronous detectors used in theinertial guidance system, but also partly due to the manner in which thedata are digitized through the telemetry system. The addition of an ionyaw sensor alone would therefore be a significant improvement in existingattitude systems.

8/7/2019 Manned Spaceflight Experiments Gemini 10 Mission Interim Report
http://slidepdf.com/reader/full/manned-spaceflight-experiments-gemini-10-mission-interim-report 130/146
129
The existing inertial system requires about 40 minutes to stabilize
and warm up after power turnon. This is partly due to the electronic
circuits used and the adjustment of the gyroscopes on the unit; however,
the astronauts have found that the use of the ion yaw angular measure-
ments significantly decreases the time for platform alinement.
An example of the simultaneous measurement of pitch angles with the
ion sensor and inertial systems is given in figure 14-5. It is seen that
the absolute values of the angles agree within a fraction of a degree
over the angular range of ±20 °. A good illustration of the response
time of the two systems is seen in figure 14-5 between 66 hours, 0 min-
utes and 66 hours, 5 minutes. While individual maxima and minima in
pitch agree very well, the faster response of the ion sensor makes it
easier to detect angular changes. Operationally, this should be of par-
ticular importance in conserving thruster fuel and under conditions where
very precise angular positioning is desired.
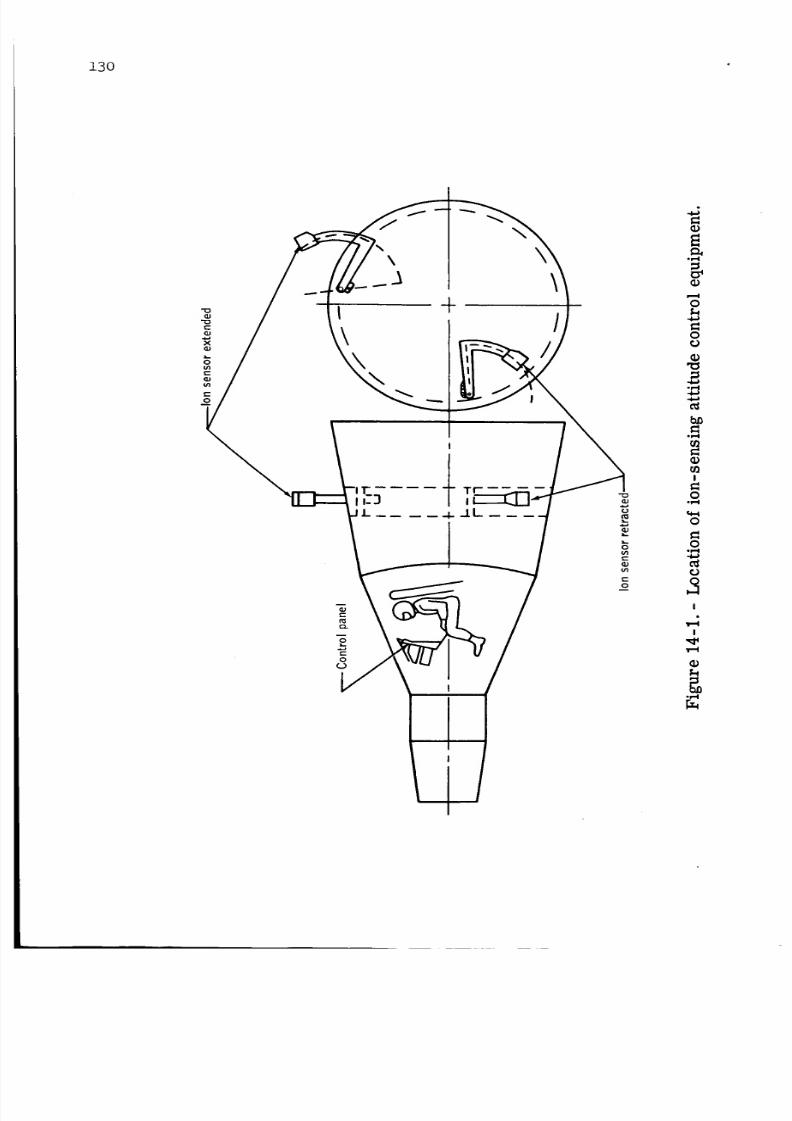
8/7/2019 Manned Spaceflight Experiments Gemini 10 Mission Interim Report
http://slidepdf.com/reader/full/manned-spaceflight-experiments-gemini-10-mission-interim-report 131/146
130
\
\
or-4
0
0
"0
or.._
op-a
!
0o_
0
0o_
!
!
or.4
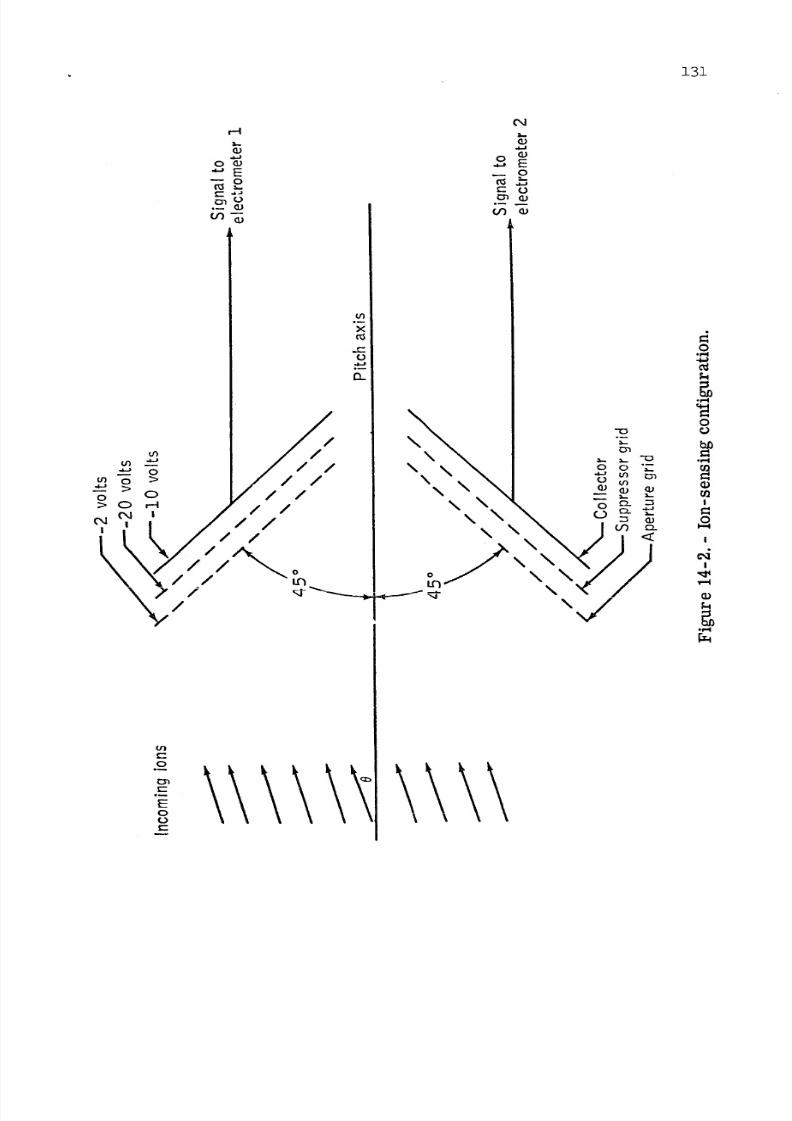
8/7/2019 Manned Spaceflight Experiments Gemini 10 Mission Interim Report
http://slidepdf.com/reader/full/manned-spaceflight-experiments-gemini-10-mission-interim-report 132/146
131
_E
___ o
o o
o_
X
o_
i i I
t_iili I
,,p.',...._"_ i _ _-.....__._.
/
0o_
t_
E0
_ E
e- ¢j
l_ ll)
o "r-
/'L:XJ",,/
ttttttl X,tt
o
ell
°_
o
°_
!
I
!
(l)
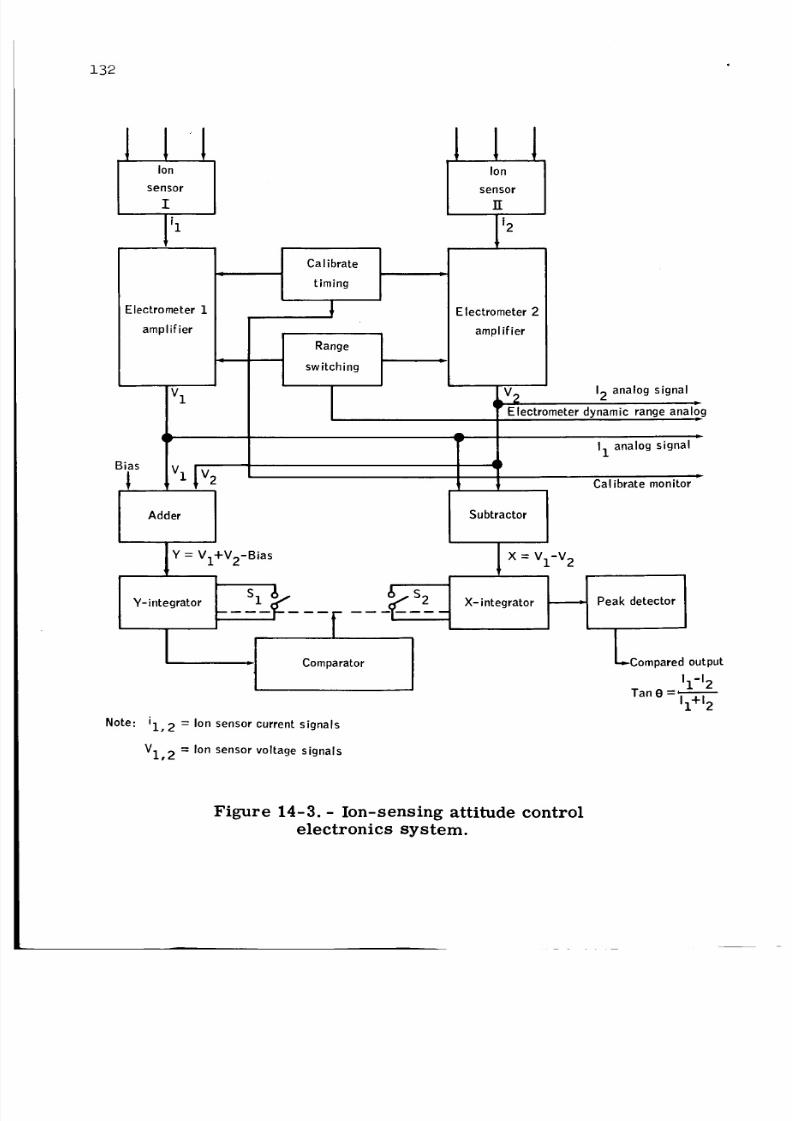
8/7/2019 Manned Spaceflight Experiments Gemini 10 Mission Interim Report
http://slidepdf.com/reader/full/manned-spaceflight-experiments-gemini-10-mission-interim-report 133/146
132
Bias
1
Note:
IIIon
sensor
I
i I
Electrometer 1
amplifier
V 1
Calibrate
timing
Range
switching
1 11
i,o 1sensor
lI
__1'2
Electrometer 2
amplifier
12 analog signal
Electrometer dynamic range analog
D
I 1 analog signal
P
Calibrate monitor
Adder Subtractor
Y-integrator
Y = Vl+V2-Bias
Comparator
I1, 2 = Ion sensor current signals
Vl, 2 = Ion sensor voltage signals
X = Vl-V 2
X-integrator -_
Peak detector
Lcompared output
I1-12Tan e ="-
I1+12
Figure 14-3.- Ion-sensing attitude control
electronics system.
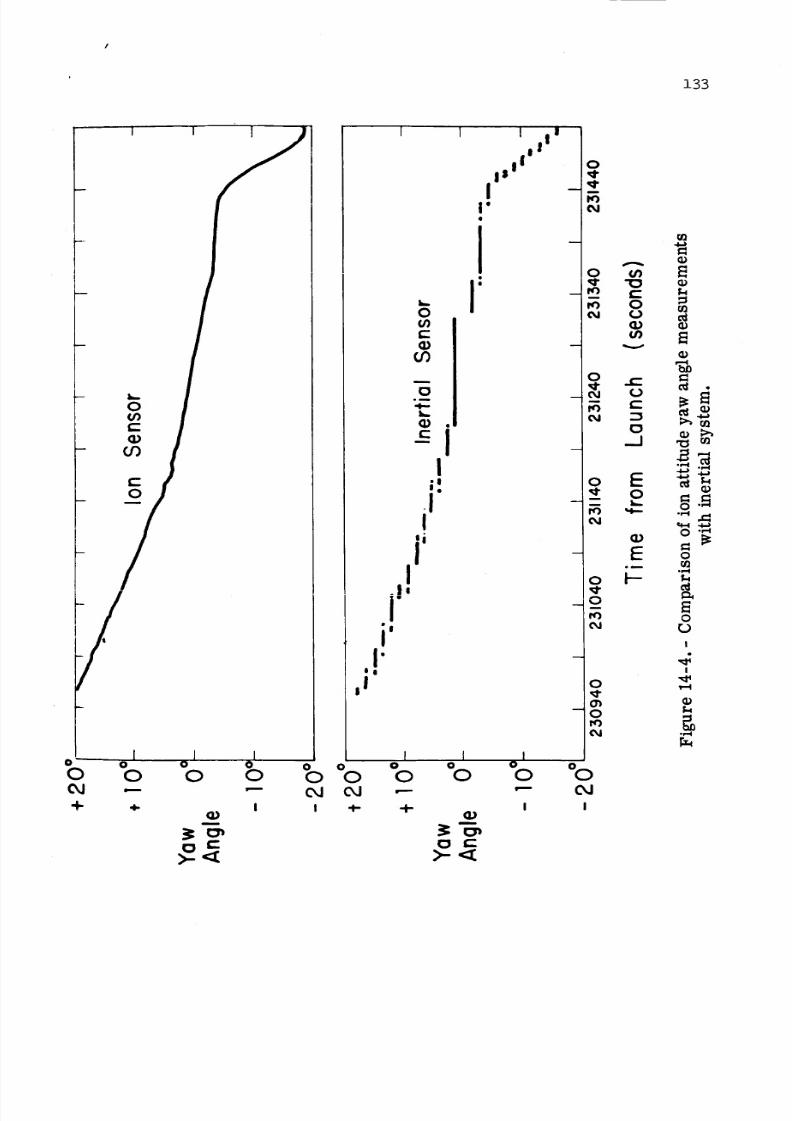
8/7/2019 Manned Spaceflight Experiments Gemini 10 Mission Interim Report
http://slidepdf.com/reader/full/manned-spaceflight-experiments-gemini-10-mission-interim-report 134/146
133
o
0
÷
/
Io
0
4-
I
o I 01
0 0
!
m
>-_
0 o
0 0
! 4-
I.|e
Ii'I"
Ii
sl
I I I Iii
i la
Is
II °
I_. ]I _0(1)
l-
_ --
if)
I;!
.J -
II
I'
I Io o
0 0
0
mm
m_ e- __ 0 _
v
_._
o E __ o =._i
_- 0
•,-4 ,._
(13 O"
o_
o I-- "_
I
4!
0 _
Ioo _o'-- 04
! !
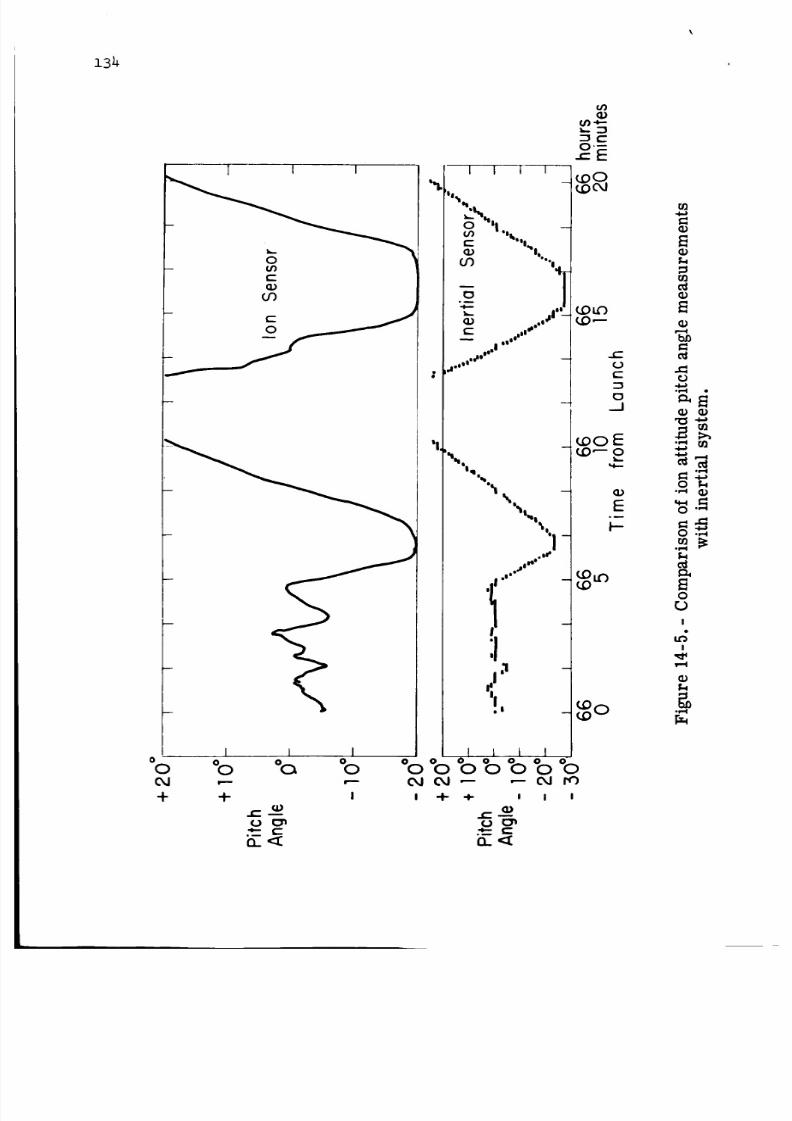
8/7/2019 Manned Spaceflight Experiments Gemini 10 Mission Interim Report
http://slidepdf.com/reader/full/manned-spaceflight-experiments-gemini-10-mission-interim-report 135/146
134
I I I
I0
o °o
+ +
i I
oo
_E
=o._
(3,,)
=l
,.4-)•I-'4 •
.4-,,}
o'_
0 .,...4
0 .,'-_
80
I
I
.i.....I
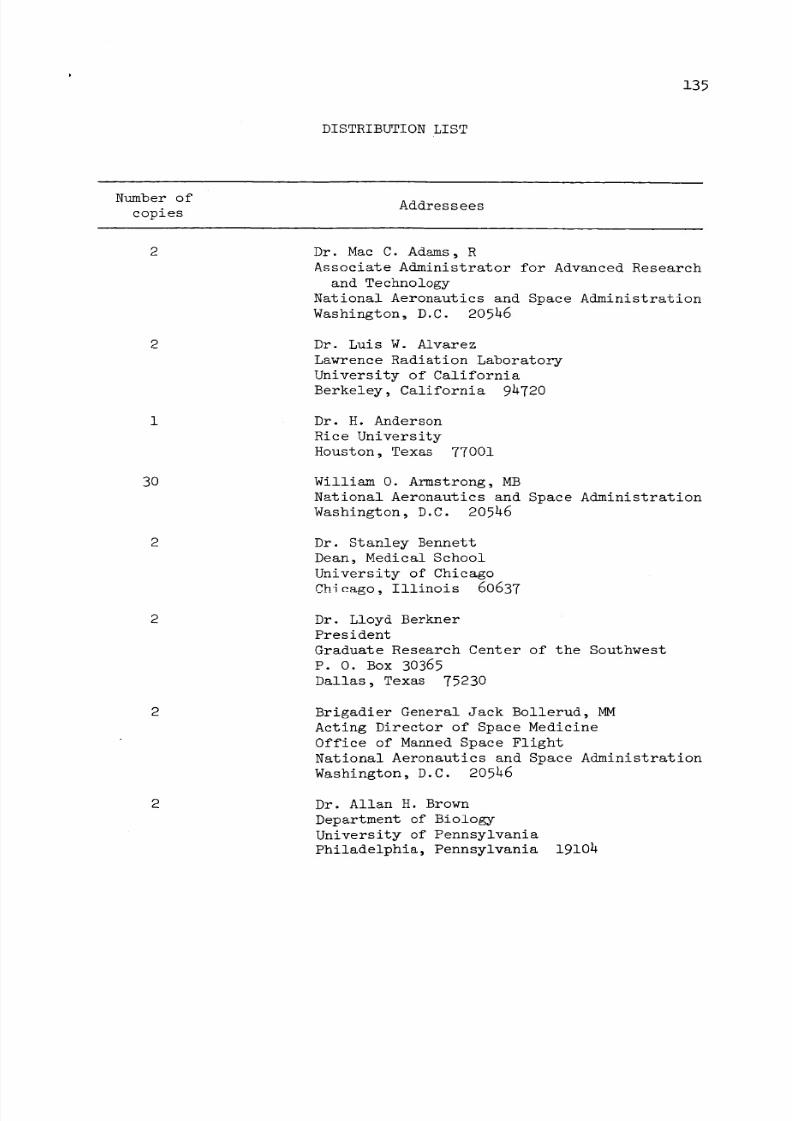
8/7/2019 Manned Spaceflight Experiments Gemini 10 Mission Interim Report
http://slidepdf.com/reader/full/manned-spaceflight-experiments-gemini-10-mission-interim-report 136/146
P
135
DISTRIBUTION LIST
Number of
copiesAddres sees
2
2
i
3O
2
Dr. Mac C. Adams, R
Associate Administrator for Advanced Research
and Technology
National Aeronautics and Space Administration
Washington, D.C. 20546
Dr. Luis W. Alvarez
Lawrence Radiation Laboratory
University of California
Berkeley, California 94720
Dr. H. Anderson
Rice University
Houston, Texas 77001
William 0. Armstrong, MB
National Aeronautics and Space Administration
Washington, D.C. 20546
Dr. Stanley Bennett
Dean, Medical School
University of Chicago
Chicago, lllinois 60637
Dr. Lloyd Berkner
President
Graduate Research Center of the Southwest
P. O. Box 30365
Dallas, Texas 75230
Brigadier General Jack Bollerud, MM
Acting Director of Space Medicine
Office of Manned Space Flight
National Aeronautics and Space Administration
Washington, D.C. 20546
Dr. Allan H. Brown
Department of Biology
University of Pennsylvania
Philadelphia, Pennsylvania 19104
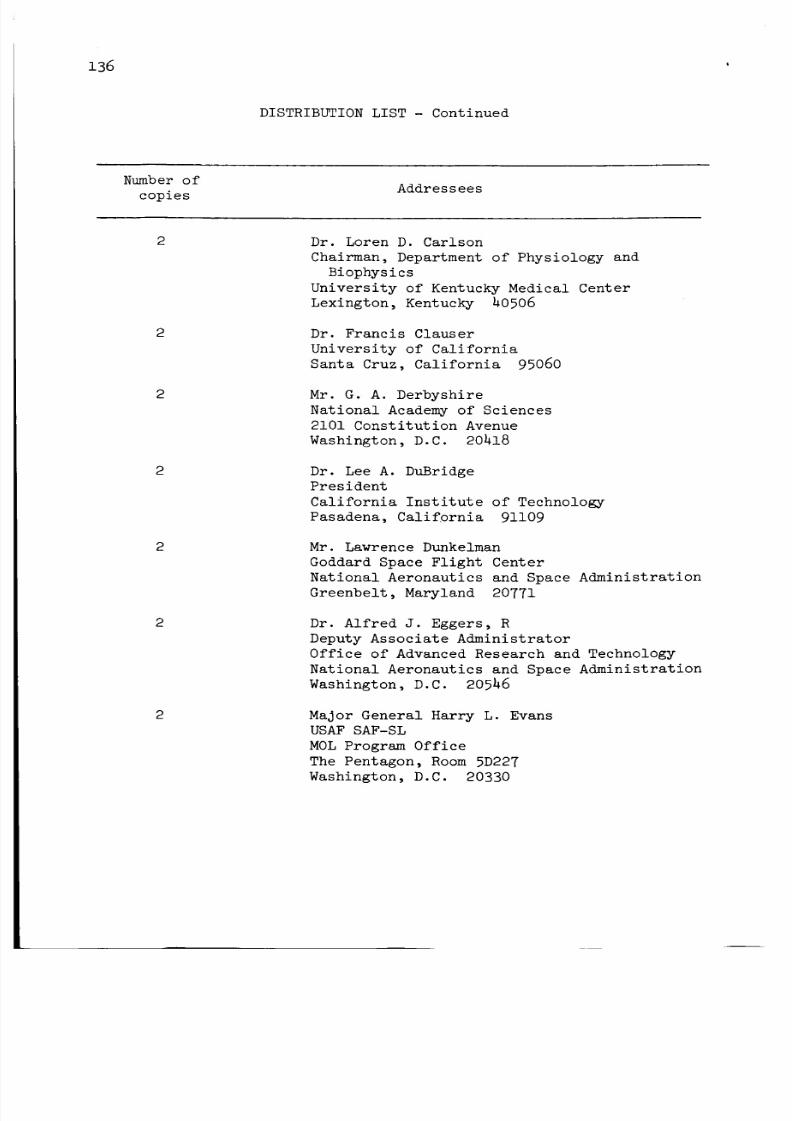
8/7/2019 Manned Spaceflight Experiments Gemini 10 Mission Interim Report
http://slidepdf.com/reader/full/manned-spaceflight-experiments-gemini-10-mission-interim-report 137/146
136
DISTRIBUTIONLIST - Continued
Numberofcopies
Addressees
2
2
2
2
Dr. Loren D. CarlsonChairman, Department of Physiology and
BiophysicsUniversity of Kentucky Medical CenterLexington, Kentucky 40506
Dr. Francis ClauserUniversity of CaliforniaSanta Cruz, California 95060
Mr. G. A. DerbyshireNational Academyof Sciences2101 Constitution AvenueWashington, D.C. 20418
Dr. Lee A. DuBridgePresidentCalifornia Institute of TechnologyPasadena, California 91109
Mr. LawrenceDunkelmanGoddardSpace Flight CenterNational Aeronautics and Space AdministrationGreenbelt, Maryland 20771
Dr. Alfred J. Eggers, RDeputy Associate AdministratorOffice of AdvancedResearch and TechnologyNational Aeronautics and Space Administration
Washington, D.C. 20546
Major General Harry L. EvansUSAFSAF-SLMOLProgram OfficeThe Pentagon, Room5D227Washington, D.C. 20330
8/7/2019 Manned Spaceflight Experiments Gemini 10 Mission Interim Report
http://slidepdf.com/reader/full/manned-spaceflight-experiments-gemini-10-mission-interim-report 138/146
137
DISTRIBUTIONLIST - Continued
Numberofcopies
Addressees
2
2
i0
I0
General JamesFergusonSCG,HqAFSCAndrewsAir Force Base, Maryland 20331
Dr. John W. FindlayDeputy DirectorNational Radio Astronomy ObservatoryP. O. Box 2Green Bank, West Virginia 24944
Mr. Daniel J. FinkOSDDDR&EThe PentagonWashington, D.C. 20301
Mr. Willis B. Foster, SMDirector of MannedFlight ExperimentsOffice of SpaceScience and ApplicationsNational Aeronautics and SpaceAdministrationWashington, D.C. 20546
Dr. John F_ench
University of California Medical School
Los Angeles, California 90024
Dr. Herbert Friedman
Superintendent, Atmosphere and Astrophysics
Division
Code 7100
U.S. Naval Research Laboratory
Washington, D.C. 20390
Dr. Jocelyn R. Gill, SM
National Aeronautics and Space Administration
Washington, D.C. 20546
8/7/2019 Manned Spaceflight Experiments Gemini 10 Mission Interim Report
http://slidepdf.com/reader/full/manned-spaceflight-experiments-gemini-10-mission-interim-report 139/146
138
DISTRIBUTIONLIST - Continued
Numberofcopies
Addressees
l0
Dr. T. GualtierottiAmesResearch CenterNational Aeronautics and SpaceAdministrationMoffett Field, California 94035
Dr. Leo GoldbergHarvard College ObservatoryDepartment of AstronomyCambridge, Massachusetts 02138
Mr. George Trimble, MTAdvancedMannedMissions ProgramOffice of MannedSpace FlightNational Aeronautics and SpaceAdministrationWashington, D.C. 20546
Dr. Curtis L. HemenwayDudley Observatory
140 South Lake AvenueAlbany, NewYork 12200
Dr. Karl G. HenizeDearborn ObservatoryNorthwestern UniversityEvanston, Illinois 60201
Mr. Robert G. HertzDept. 650 Building 523LockheedMissiles and Space Company
P. O. Box 504Sunnyvale, California 94088
Dr. Harry H. HessDepartment of GeologyPrinceton UniversityPrinceton, NewJersey 08540
8/7/2019 Manned Spaceflight Experiments Gemini 10 Mission Interim Report
http://slidepdf.com/reader/full/manned-spaceflight-experiments-gemini-10-mission-interim-report 140/146
139
DISTRIBUTION LIST - Continued
Number of
copies
Addressees
1
2
l0
2
2
lO
2
Dr. Francis Johnson
Graduate Research Center of the Southwest
P. O. Box 30365
Dallas, Texas 75221
Dr. William W. Kellogg
Associate Director
National Center for Atmospheric Research
Boulder, Colorado 80301
Mr. John E. Kirk
OSD DDR&E
Room 3E153, The Pentagon
Washington, D.C. 20301
Mr. Martin J. Koomen
U.S. Naval Research Laboratory
Code 7141-K
Washington, D.C. 20390
Dr. T. William Lambe
Massachusetts Institute of Technology
C__mbr_ dge; Massachusetts 02139
Dr. John H. Lawrence
Donner Laboratory
University of California
Berkeley, California 94720
Mr. Douglas R. Lord, MTS
National Aeronautics and Space Administration
Washington, D.C. 20546
Dr. Paul Lowman
Theoretical Division, Code MSSD
Goddard Space Flight Center
National Aeronautics and Space Administration
Greenbelt, Maryland 20771
8/7/2019 Manned Spaceflight Experiments Gemini 10 Mission Interim Report
http://slidepdf.com/reader/full/manned-spaceflight-experiments-gemini-10-mission-interim-report 141/146
140
DISTRIBUTION LIST - Continued
Number of
copiesAddressees
2
2
2
2
2
2
2
2
Dr. Gordon J. F. MacDonald
University of California
Los Angeles, California 90024
Dr. Nicholas U. Mayall
Director, Kitt Peak National Observatory
950 North Cherry Avenue
Tucson, Arizona 85717
Dr. David Medved
Electro-Optical Systems, Inc.
300 North Halstead
Pasadena, California 91107
Dr. George E. Mueller, M
Associate Administrator for Manned Space
Flight
National Aeronautics and Space Administration
Washington, D.C. 20546
Mr. Kenneth M. Nagler
Chief, Space Operations Support Division
U.S. Weather Bureau
Gramax Building, Room 1415
Washington, D.C. 20689
Dr. John E. Naugle, SS
Deputy Associate Administrator (Sciences)
Office of Space Science and Applications
National Aeronautics and Space Administration
Washington, D.C. 20546
Dr. William Neuman
University of Rochester
Rochester, New York 14627
Dr. Homer E. Newell, S
Associate Administrator for Space Science and
Applications
National Aeronautics and Space Administration
Washington, D.C. 20546
8/7/2019 Manned Spaceflight Experiments Gemini 10 Mission Interim Report
http://slidepdf.com/reader/full/manned-spaceflight-experiments-gemini-10-mission-interim-report 142/146
141
DISTRIBUTIONLIST - Continued
Numberofcopies Addressees
2
lO
2
2
2
2
Dr. Edward P. Ney
School of Pb_rsics and Astronomy
Institute of Minnesota
Minneapolis, Minnesota 55499
Mr. David Novick, RNVNational Aeronautics and Space Administration
Washington, D.C. 20546
Dr. Hugh 0dishaw
National Academy of Sciences
2101 Constitution Avenue
Washington, D.C. 20418
Mr. J. P. T. Pearman
National Academy of Sciences
2101 Constitution Avenue
Washington, D.C. 20418
Dr. Max Peterson
Department of Aeronautics and Astronautics
Instrumentation Laboratory
68 Alb_m_r Street
Cambridge, Massachusetts 02139
Professor Courtland D. Perkins
Chairman, Department of Aerospace and
Mechanical Sciences
Princeton University
Princeton, New Jersey 08540
Dr. Martin A. Pomerantz
Director, Bartol Research Foundation
Swarthmore, Pennsylvania 19081
Dr. Richard W. Porter
Engineering Services
General Electric Company
570 Lexington Avenue
New York, New York 10022
8/7/2019 Manned Spaceflight Experiments Gemini 10 Mission Interim Report
http://slidepdf.com/reader/full/manned-spaceflight-experiments-gemini-10-mission-interim-report 143/146
142
DISTRIBUTION LIST - Continued
Number of
copiesAddressees
l0
2
2
2
Dr. Leonard Reiffel, MA-6
National Aeronautics and Space Administration
Washington, D.C. 20546
Dr. Bruno B. Rossi
Laboratory for Nuclear Science
Massachusetts Institute of TechnologyCambridge, Massachusetts 02139
Miss Rita C. Sagalyn
Hqs Air Force Cambridge Research Laboratories
Laurence G. Hanscom Field
Bedford, Massachusetts 07130
Dr. F. Saiedy
Meteorological Office
Damascus, Syria
Professor Leonard I. Schiff
Executive Head, Department of Physics
Stanford University
Stanford, California 94305
Mr. Lyle C. Schroeder
Instrument Research Division
Langley Research Center
National Aeronautics and Space Administration
Hampton, Virginia 23365
Dr. William G. Shepherd
Vice President, Academic Department
200 Morrill Hall
University of Minnesota
Minneapolis, Minnesota 55455
Dr. H. G. Shepler
National Academy of Sciences
2101 Constitution Avenue
Washington, D.C. 20418
8/7/2019 Manned Spaceflight Experiments Gemini 10 Mission Interim Report
http://slidepdf.com/reader/full/manned-spaceflight-experiments-gemini-10-mission-interim-report 144/146

8/7/2019 Manned Spaceflight Experiments Gemini 10 Mission Interim Report
http://slidepdf.com/reader/full/manned-spaceflight-experiments-gemini-10-mission-interim-report 145/146
144
DISTRIBUTION LIST - Continued
Number of
copiesAddressees
Dr. George P. Woolard
Director, Hawaii Institute of Geophysics
University of Hawaii
Honolulu, Hawaii 96822
MANNED SPACECRAFT CENTER:
2
i
i
5
i0
i
i0
2
2
i
i
i
2
i
i
2
2
AA/Dr. Robert R. Gilruth
BL/Mr. J. R. Brinkmann
BL/Mr. Richard Underwood
BM5/Mr. E. F. Meade
BM6/MSC Library
CA/Mr. Donald K. Slayton
CB2/Mr. John Peterson
CF/Mr. Helmut Kuehnel
EA/Mr. Warren Gillespie
EC7/Mr. W. J. Young
EC/Mr. R. S. Johnston
EG26/Mr. C. Manry
FA3/Mr. R. G Rose
FC/Mr. Christopher Kraft
FC/John D. Hodge
GM/Mr. W. Nesbitt
KA/Mr. R. F. Thompson

8/7/2019 Manned Spaceflight Experiments Gemini 10 Mission Interim Report
http://slidepdf.com/reader/full/manned-spaceflight-experiments-gemini-10-mission-interim-report 146/146
145
DISTRIBUTIONLIST - Concluded
Numberofcopies
Addressees
1
1
5
i0
i
i
i
i
i
i
PA/Mr. George M. Low
PC/Mr. R. Cox
PK/Mr. Victor Neshyba
RL/Mr. W. E. Davidson
TA/Wilmot N. Hess
TA/Robert O. Piland
TA/Paul R. Penrod
TG53/Mr. J. Marback
TG53/Mr. R. Lindsey
TG/Mr. J. Modisette