Embed Size (px)
Citation preview
1
preliminary
Manual for Physical Energy
Flow Accounts (PEFA-Manual)
Draft version: 9 January 2011

2
3
Table of Content: 1 Introduction to Eurostat's Physical Energy Flow Accounts...................................5
1.1 Overview........................................................................................................5 1.2 Structure of the Manual .................................................................................5 1.3 Mandate, objective, and roadmap ..................................................................6 1.4 Relations to other statistical frameworks.......................................................7 1.5 Conceptual foundations of National and Environmental Accounts...............7
National Accounts..................................................................................................7 Environmental Accounts........................................................................................9
2 The General SEEA Framework for Physical Flow Accounting ..........................10 2.1 The concept of Physical Supply and Use Tables (PSUT)............................10 2.2 Types of flows .............................................................................................12 2.3 Origins and destinations respectively ..........................................................13 2.4 General SEEA accounting framework for physical flows...........................15
Accounting and balancing identities....................................................................17 Main aggregates (indicators) derivable from Physical Supply and Use Tables ..19
3 Definitions and Accounting Principles ................................................................20 3.1 Synopsis of terminology employed in energy statistics/balances versus National Accounts....................................................................................................20 3.2 Definition of the national economy and resident principle..........................22 3.3 Industries......................................................................................................23 3.4 Balancing principle and double-entry accounting.......................................24 3.5 Units of measurement ..................................................................................24 3.6 International transport..................................................................................24 3.7 Tourist activity .............................................................................................25 3.8 Treatment of goods for processing ..............................................................26
4 Overview on the set of tables in the electronic questionnaire .............................27 4.1 Table A: Physical Supply Table for Energy Flows.....................................29 4.2 Table B: Physical Use Table for Energy Flows...........................................29 4.3 Table B.o: Physical Use Table for Energy Flows - of which: own use.......29 4.4 Table C: Physical Use Table of Emission-relevant Use of Energy Flows ..30 4.5 Table D: Vector(s) of key energy indicators................................................31 4.6 Table E: Bridge Table..................................................................................32 4.7 Description and classification of PSUT rows ..............................................32
Natural energy inputs...........................................................................................33 Energy products ...................................................................................................33 Energy residuals...................................................................................................35
4.8 Description and classification of PSUT columns ........................................36 5 A General Compilation Approach .......................................................................39
5.1 Introduction and overview ...........................................................................39 5.2 The format of Eurostat's energy balances in brief .......................................41 5.3 A possible sequence for compiling Tables A and B....................................43
Step A.1: Energy product flows – Disentangling energy balance (rows) into 'Supply' and 'Use' .................................................................................................44 Step A.2: Energy products – Identifying and assignment to the right column(s) in the PSUT for each item of an energy balance row ..............................................45
4
Step A.3: Energy products – Summing up the PSUT layers obtained from steps A.1 and A.2. .........................................................................................................46 Step A.4: Energy products – Change over from one product classification to another..................................................................................................................47 Step B.1: Natural energy inputs – Compiling the natural inputs flows in the Physical Use Table...............................................................................................48 Step B.2: Natural energy inputs – Compiling the natural inputs flows in the Physical Supply Table..........................................................................................50 Step C.1: Energy residuals – Compiling the residual flows in the Physical Supply Table ....................................................................................................................51 Step C.2: Energy residuals – Compiling the residual flows in the Physical Use Table ....................................................................................................................51
6 Treatment of selected energy flows .....................................................................52 6.1 Energy produced by autoproducers .............................................................52 6.2 Biomass as an energy carrier flow...............................................................53 6.3 Electricity based on wind, hydro, and solar.................................................56 6.4 Coke oven gas and blast furnace gas ...........................................................57 6.5 Energy flows in form of waste flows...........................................................58 6.6 Energy flows for non-energy purposes........................................................59 6.7 Natural gas ...................................................................................................60 6.8 Nuclear energy.............................................................................................61
7 References............................................................................................................62 Annex 1: 'Energy industries' as delineated in energy statistics and corresponding NACE rev.1.1 positions ...............................................................................................63 Annex 2: Hierarchical classification of energy products as employed in Eurostat's energy statistics and balances.....................................................................................64 Annex 3: Classification of hierarchical positions in Eurostat's energy balances........66 Annex 4: Correspondence between energy product classifications – energy statistics/balances versus Physical Energy Flow Accounts.........................................69
5
1 Introduction to Eurostat's Physical Energy Flow Accounts
1.1 Overview
1 This is the preliminary first draft of a manual for Eurostat's Physical Energy Flow Accounts. It presents the theoretical concepts and accounting principles underpinning Eurostat's Physical Energy Flow Accounts (chapters 1, 2, 3) and provides practical compilation guidelines (chapters 4, 5, 6).
2 Eurostat's Physical Energy Flow Accounts (PEFA) aim to record the flows of energy from the environment to the economy, within the economy, and from the economy back to the environment in a way consistent with Nationals Accounts. Eurostat's PEFA is comprised of a set of six tables which has been developed by a Eurostat Task Force since 2010.
3 The six tables are included in an electronic questionnaire which is to be tested between January and March 2012 by a selected number of European countries, mainly those represented in the above mentioned Eurostat Task Force. Countries are asked to fill out the set of tables with data for the year 2007 and report their experiences to Eurostat. Experiences from this first testing will be presented to the Working Group on Environmental Accounts at its meeting end March 2012. The main purpose of this draft manual is to accompany and facilitate the testing of the electronic questionnaire.
4 Eurostat's Physical Energy Flow Accounts have been developed on the basis of the revised System of Environmental-Economic Accounts (SEEA)1. In its chapter 3 (and parts of chapter 2) the revised SEEA lays out a general physical flow accounting framework and a set of accounting principles and boundaries within which a consistent recording of all types of physical flows relating to economic activities can be made.
5 Most of the data needed to fill the six tables come from energy statistics. The latter constitute an established source of energy information (based on a statistical regulation) serving European energy policies. Physical Energy Flow Accounts are supposed to complement energy statistics. The idea is to align energy information closer to National Accounts enabling the integration of energy concerns into macro-economic monitoring, analyses, modelling, and theory building.
1.2 Structure of the Manual
6 The manual comprises two parts. A more theoretical part comprising of chapters 2 and 3 presents the theoretical concepts and accounting principles underpinning Eurostat's Physical Energy Flow Accounts. A more practical part comprising chapters 4, 5, and 6 provides compilation guidelines. 1 see draft chapters 2 and 3 of the revised SEEA, as provided for global consultation in October 2011
6
7 The general SEEA framework for Physical Flow Accounts is based on the concept of Physical Supply and Use Tables (PSUT) which is further explained in chapter 2 of this manual. Important accounting principles for Eurostat's Physical Energy Flow Accounts derived from SEEA and SNA are presented in chapter 3 of this manual.
8 Chapter 4 provides a brief overview on the six questionnaire tables. Chapter 5 presents a compilation sequence recommended by Eurostat which departs from the standardised format of Eurostat's energy balances. Chapter 6 introduces the treatment of selected energy flows such as e.g. renewable energy flows, natural and derived gases, nuclear energy etc.
1.3 Mandate, objective, and roadmap
9 The overall mandate, given by the revised European Strategy on Environmental Accounts (ESEA 2008), is to develop Energy Accounts (also sometimes referred to as NAMEA Energy) in the medium term (i.e. until 2011). Energy Accounts are oriented towards integrated macro-economic and environmental analyses. They complement the information provided by energy statistics and balances which remain the primary information source for energy policy.
10 Following the revised SEEA structure Energy Accounts can be divided into:
� Monetary Energy Flow Accounts;
� Physical Energy Flow Accounts (PEFA);
� Energy Asset Accounts (monetary and physical).
11 The Working Group on Environmental Accounts decided to set priorities and to start with the development of Physical Energy Flow Accounts (PEFA) and to address the other accounts later. The specific target is to develop Physical Supply and Use Tables of energy flows (energy PSUTs) in order to derive vectors of 'key energy indicators' which can be added e.g. to Input-Output models. IO-models extended like this can be used e.g. to conduct productivity analyses and calculate energy embodied in products imported to the EU.
12 The development of Physical Energy Flow Accounts (PEFA) is a joint effort of the European Statistical System (ESS). Broadly, the roadmap for this development process comprises 3 phases:
(1) Development of methodological standards in close relation to international developments, most notably the revised SEEA.
(2) Data collections from NSIs on a voluntary basis (testing phase).
(3) Adding a module on Physical Energy Flow Accounts to the legal base for Environmental Accounts.
The process started in 2009 and is still in phase 1.
7
1.4 Relations to other statistical frameworks
13 Energy statistics/balances constitute an important data source to populate the set of PEFA tables. Definitions, methodology, and concepts for energy statistics/balances are documented in the Energy Statistics Manual (OECD/IEA/Eurostat 2004). The European Energy Statistics Regulation contains important definitions as well2.
14 The definitions and classification of energy products is a major common element of energy statistics/balances and Physical Energy Flow Accounts (PEFA). The set of PEFA tables employs a classification for energy products which is derived from the product classification of Eurostat's energy statistics/balances.
15 The second important dimension of energy balances are the various balance positions (termed INDIC_NRP in Eurostat's database). These are to a certain extent comparable with the columns in the energy PSUTs (Tables A, B, B.o, C, and D of the PEFA set of tables). E.g. the energy balance items 'imports' and 'exports' relate to the column 'rest of the world' in the energy PSUTs.
1.5 Conceptual foundations of National and Environme ntal Accounts
16 Physical Energy Flow Accounts (PEFA) are part of Environmental Accounts. Conceptually, both are closely linked to National Accounts. Environmental Accounts constitute satellite accounts to National Accounts for the analysis of the interaction between the environment and the economy (ESA95, paragraph 1.18.). An important feature of satellite accounts is that in principle all basic concepts and classifications of the standard National Accounts framework are retained (ESA95, paragraph 1.20.).
17 This section provides a brief overview on the conceptual foundations of National Accounts and Environmental Accounts and places Eurostat’s Physical Energy Flow Accounts into these overall frameworks.
National Accounts
18 National Accounts is a comprehensive mainly monetary bookkeeping framework portraying national economies. It follows internationally harmonised and well-established methods for measuring macro-economic phenomena such as consumption and production of products so as to portray all economic activities and monetary transactions of a national economy. Several economic indicators can be derived from the accounting framework: Gross Domestic Product (GDP) is the most prominent indicator to monitor macro-economic performance. Further prominent indicators from National Accounts are national income, gross value added of industry branches, trade balance, net savings etc.
2 Regulation (EC) No 1099/2008 of the European Parliament and of the Council on Energy Statistics. (published 14.11.2008).
8
19 International statistical standards for National Accounts3 are the UN System of National Accounts – referred to as SNA2008 (United Nations et al. 2009) – and its European version European System of National and Regional Accounts in the Community – referred to as ESA954. These international systems provide accounting principles and a consistent accounting framework for the analysis and presentation of economic data describing national economies. The SNA2008 and the ESA95 are established statistical standards enabling international comparisons of macro-economic statistics.
20 The ESA95 and the SNA2008 constitute the main references for Eurostat’s Physical Energy Flow Accounts (PEFA) as far as accounting principles are concerned5. The ESA95 framework consists of two generic ways of presentations. It distinguishes two sets of tables (ESA95 paragraph 1.02):
(a) the sector accounts;
(b) the input-output framework and the accounts by industries.
21 The sector accounts (for institutional sectors) are a sequence of T-accounts systematically describing the different stages of the economic process: production, generation of income, distribution of income, redistribution of income, use of income and financial and non-financial accumulation. Although some of these are important in Environmental Accounts (monetary flow accounts) they are of less relevance for Physical Energy Flow Accounts.
22 The input-output framework is the most relevant representation of the national economy with regards to Physical Energy Flow Accounts. The input-output framework portrays in detail the production, consumption, and accumulation of products by showing the monetary values of the flows of goods and services (output, imports, exports, final consumption, intermediate consumption, and capital formation by product group). Within the input-output framework, two forms of representations are distinguished (ESA95 paragraphs 9.01 ff, see also Eurostat 2008):
(a) Supply and Use Tables (SUT);
(b) Symmetric Input-Output Tables (IOT).
23 The concept of Supply and Use Tables (SUT) is the most relevant for Physical Energy Flow Accounts (PEFA).
3 See also: http://epp.eurostat.ec.europa.eu/portal/page/portal/national_accounts/methodology 4 Council Regulation (EC) No 2223/96 of 25 June 1996 on the European system of national and regional accounts in the Community (OJ L 310, 30.11.1996, p. 1). NOTE: the ESA is currently revised and the revised version is expected to enter into force in 2012. 5 Note that ESA95 is being revised but the revisions will not change the conceptual foundations of Energy Accounts..
9
Environmental Accounts 6
24 Environmental Accounts have been developed in connection to National Accounts and aim most notably at providing information on the links between the environment and the economy. Environmental Accounts constitute a satellite accounting framework representing environmental data in a format compatible with National Accounts data, thus enabling integrated analyses.
25 Conventions, accounting methodologies, and classifications as laid down in National Accounts (SNA2008, ESA95) form the point of departure for defining Environmental Accounts principles. Two accounting principles should be already emphasised here: the resident principle and the balancing principle.
26 The resident principle is an important accounting convention in National Accounts which also needs to be retained in Environmental Accounts. The national economic system is defined by its residents’ economic activities (see section 3.2) independent of where those activities take place geographically. This has particular implications for Physical Energy Flow Accounts (see section 3.6) in relation to resident's bunkering of fuel abroad the national territory.
27 Another elementary accounting principle in both, National Accounts and Environmental Accounts (particularly Physical Flow Accounts), is the balancing principle: each flow is recorded twice – first at its origin, and secondly at its destination. The total of flows from all origins must equal the total of flows to all destinations. In the context of Physical Flow Accounts this is referred to as the material-balance and/or mass-balance principle (SEEA2004, paragraphs 3.6 – 3.10). Evolving from the balancing principle, each flow item is recorded twice, at its origin and at its destination. This is also referred to as double-entry principle (ESA95; paragraph 1.50) which is another common feature to National Accounts.
28 Several methodological documents have been published laying down conceptual accounting principles for Environmental Accounts – most importantly the UN System of Environmental-Economic Accounts (SEEA):
� In 1993, the UN published first conceptual and methodological guidelines for a System of Integrated Environmental and Economic Accounts – referred to as SEEA93 (United Nations et al. 1993).
� In 2000, the UN Statistical Division and the UN Environment Programme published the Handbook of National Accounting: Integrated Environmental and Economic Accounting -- An Operational Manual. This handbook provides guidance on the implementation of the more practical modules of the SEEA93 based on country experiences but focuses mostly on asset accounts for natural resources and not on physical flow accounts.
� In 2003, a revised draft version of the SEEA was issued: "Handbook of National Accounting – Integrated Environmental and Economic
6 The European Statistical System (ESS) employs the term Environmental Accounts; on the international UN level the term System of Environmental-Economic Accounts (SEEA) is used.
10
Accounting 2003" commonly referred to as SEEA2003 (United Nations et al. 2003).
� Meanwhile, a further revision of the System of Environmental-Economic Accounts (SEEA) has been launched and is expected to be completed in 2012. It will obtain the status of an international statistical standard. The almost final draft of the revised SEEA20127 serves as the main reference for the conceptual foundations of Environmental Accounts as outlined and applied in this manual.
29 The SEEA2012 will comprise three main types of accounts:
� Physical Flow Accounts;
� Monetary Flow Accounts;
� Asset Accounts (in physical and monetary terms);
30 Physical Energy Flow Accounts belong to the type of Physical Flow Accounts.
31 Physical Flow Accounts record the flows of materials and energy. These physical flows are assembled as far as possible according to the input-output-framework (i.e. Physical Supply and Use Tables) (see more details in chapter 2).
2 The General SEEA Framework for Physical Flow Accounting
32 Eurostat's Physical Energy Flow Accounts (PEFA) have been developed in line with the revised SEEA8. The revised SEEA (in draft chapter 3) lays out a general physical flow accounting framework for all physical flows (materials, water, and energy) employing the concept of Physical Supply and Use Tables (PSUT).
33 This chapter introduces into SEEA's general physical flow accounting framework. The objective is to make the reader familiar with the theoretical framework. The following explanations in this chapter are of a rather general nature applying for all types of physical flows (energy and materials). More detailed explanations on how the framework is aligned towards Eurostat's specific set of tables on Physical Energy Flow Accounts (PEFA) are given in chapter 4 of this manual.
2.1 The concept of Physical Supply and Use Tables (P SUT)
34 The PSUT-concept provides an accounting framework enabling the complete and consistent recording of physical flows (i) from the environment into the economy, (ii) within the economy, and
7 Out for global consultation between October and December 2011 (see http://unstats.un.org/unsd/envaccounting/seea.asp) 8 see draft chapters 2 and 3 of the revised SEEA, as provided for global consultation in October 2011
11
(iii) from the economy to the environment. Flows within the environment, i.e. natural flows of materials and energy, are out of scope.
35 The accounting framework of Supply and Use Tables (SUT) originates from National Accounts. There, the framework is used for the recording of monetary transaction related to production, consumption, and accumulation activities.
36 For the recording of physical flows the SUT framework has been extended by additional rows and columns in order to consider in addition environmental aspects. Whereas the monetary SUTs consider transaction flows only within the economy, the physical SUT comprises also physical flows between economy and environment.
37 Physical Supply and Use Tables (PSUT) are a pair of tables having the same rows and columns format. Row-wise, the two matrices show the various physical flow types. Column-wise they show the various origins and destinations supplying and using the flow items, namely industries, households, accumulation (stock of produced assets, product inventories), rest of the world, and environment.
38 The Physical Supply Table shows which flow items are provided by which supplier (industries, households, accumulation, rest of the world and environment); in other words it shows the flows by origin. The Physical Use Table shows who (i.e. production, consumption, accumulation activity etc.) is using or receiving the respective flow. In other words, it shows the flows by its destination. Like this, each flow is recorded twice: first at its origin, secondly at its destination. This way of recording is also referred to as "double-entry-bookkeeping" (see also section 3.4).
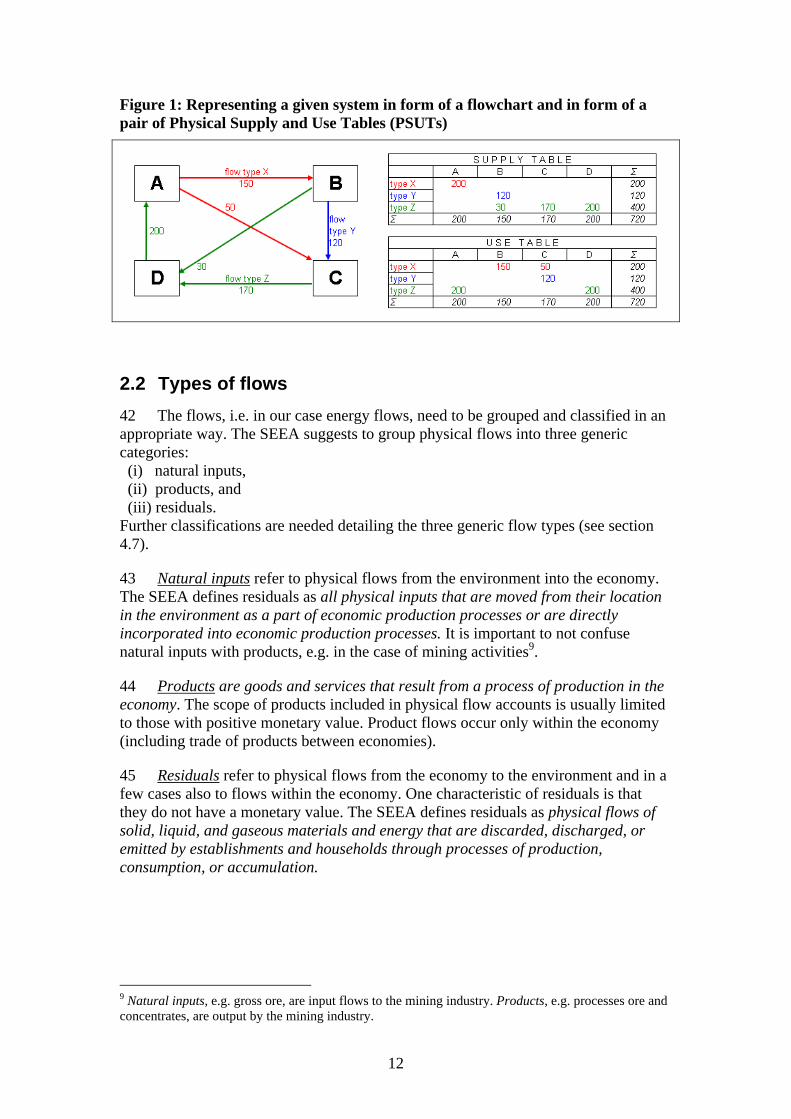
39 The left-hand flowchart in Figure 1 represents a system by arrows and boxes. The arrows constitute flows; three types of flows (X, Y, Z) are distinguished. The rectangular boxes constitute the origins and destinations respectively; four boxes are distinguished (A, B, C, D).
40 The very same system can be represented in the form of a pair of Supply and Use Tables. The Supply Table records the flow types by origin. The boxes, here the origins, are represented in the column headings. The Use Table records the flow types by destination. Here, the boxes constitute the origins.
41 One important feature is that the row sums in both tables have to be balanced. This is due to the 'double-entry-bookkeeping' principle: the total supply of a given flow type needs equal the total use of the very same flow type.
12
Figure 1: Representing a given system in form of a flowchart and in form of a pair of Physical Supply and Use Tables (PSUTs)
2.2 Types of flows
42 The flows, i.e. in our case energy flows, need to be grouped and classified in an appropriate way. The SEEA suggests to group physical flows into three generic categories: (i) natural inputs, (ii) products, and (iii) residuals. Further classifications are needed detailing the three generic flow types (see section 4.7).
43 Natural inputs refer to physical flows from the environment into the economy. The SEEA defines residuals as all physical inputs that are moved from their location in the environment as a part of economic production processes or are directly incorporated into economic production processes. It is important to not confuse natural inputs with products, e.g. in the case of mining activities9.
44 Products are goods and services that result from a process of production in the economy. The scope of products included in physical flow accounts is usually limited to those with positive monetary value. Product flows occur only within the economy (including trade of products between economies).
45 Residuals refer to physical flows from the economy to the environment and in a few cases also to flows within the economy. One characteristic of residuals is that they do not have a monetary value. The SEEA defines residuals as physical flows of solid, liquid, and gaseous materials and energy that are discarded, discharged, or emitted by establishments and households through processes of production, consumption, or accumulation.
9 Natural inputs, e.g. gross ore, are input flows to the mining industry. Products, e.g. processes ore and concentrates, are output by the mining industry.
13
2.3 Origins and destinations respectively
46 The columns of the PSUT tables denote the origins (Supply) and destinations (Use) of the physical flows. The columns are identical in both tables and are broadly grouped into five groups. The first three relate to economic activities and actors respectively, namely production (industries), consumption (households), and accumulation. In addition one has columns for the rest of the world economy and the environment.
47 Production relates to the production of output of products (= goods + services)10. In the Europe11an Statistical System (ESS) production activities, i.e. industries are classified employing the NACE classification.
48 With regards to consumption activities, the PSUT does not further disaggregate and presents only one column for private household's consumption (see also paragraph 55).
49 The column for accumulation refers to the possibility that products are stocked within the economy, e.g. in form of produced assets and inventories of products. According to national accounts conventions, changes in inventories are recorded net in the Use Table (i.e. the Supply Tables remains empty in the accumulation column).
50 The column 'rest of the world' records the flows of imported and exported products. In Eurostat's Physical Energy Flow Accounts the rest of the world is further disaggregated with regards to certain transactions connected to international transport activities.
51 The column 'environment' records the origin of natural input flows and the destination of residual flows.
10 On the production boundary, see also ESA95 (paragraphs 1.13; 3.07 ff.) and SNA2008 (paragraphs 6.26 ff.). 11 Note that for the testing of the PEFA questionnaire, still NACE rev.1.1. is used.
- 14 -
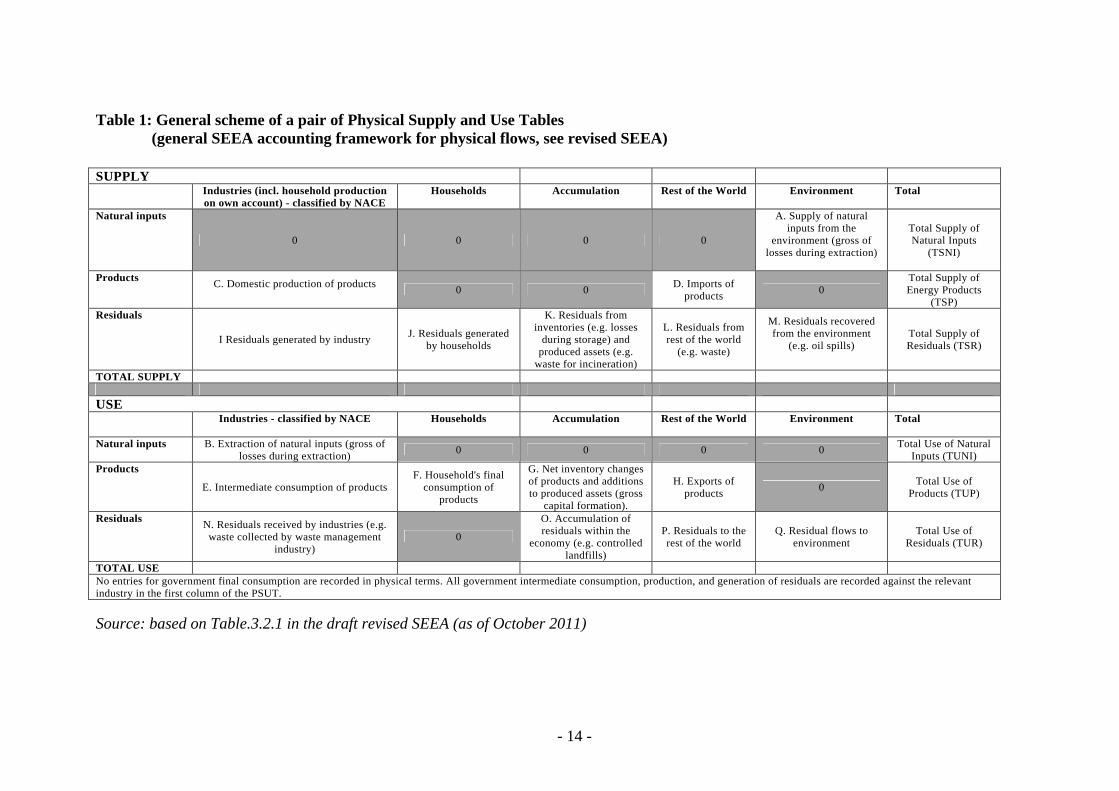
Table 1: General scheme of a pair of Physical Supply and Use Tables (general SEEA accounting framework for physical flows, see revised SEEA)
Source: based on Table.3.2.1 in the draft revised SEEA (as of October 2011)
SUPPLY
Industries (incl. household production on own account) - classified by NACE
Households Accumulation Rest of the World Environment Total
Natural inputs
0 0 0 0
A. Supply of natural inputs from the
environment (gross of losses during extraction)
Total Supply of Natural Inputs
(TSNI)
Products C. Domestic production of products
0 0
D. Imports of products
0 Total Supply of Energy Products
(TSP) Residuals
I Residuals generated by industry J. Residuals generated
by households
K. Residuals from inventories (e.g. losses
during storage) and produced assets (e.g.
waste for incineration)
L. Residuals from rest of the world
(e.g. waste)
M. Residuals recovered from the environment
(e.g. oil spills)
Total Supply of Residuals (TSR)
TOTAL SUPPLY
USE
Industries - classified by NACE
Households Accumulation Rest of the World Environment Total
Natural inputs B. Extraction of natural inputs (gross of losses during extraction)
0 0 0 0 Total Use of Natural
Inputs (TUNI) Products
E. Intermediate consumption of products F. Household's final
consumption of products
G. Net inventory changes of products and additions to produced assets (gross
capital formation).
H. Exports of products
0 Total Use of
Products (TUP)
Residuals N. Residuals received by industries (e.g. waste collected by waste management
industry) 0
O. Accumulation of residuals within the
economy (e.g. controlled landfills)
P. Residuals to the rest of the world
Q. Residual flows to environment
Total Use of Residuals (TUR)
TOTAL USE No entries for government final consumption are recorded in physical terms. All government intermediate consumption, production, and generation of residuals are recorded against the relevant industry in the first column of the PSUT.
15
2.4 General SEEA accounting framework for physical f lows
52 Table 1 shows the general scheme of a pair of Physical Supply and Use Tables. The top half of Table 1, the Supply Table, records the physical flows by their origin. The bottom half of Table 1, the Use Table, records the very same physical flows by their destination.
53 The first column in the Supply Table presents the production of products (C.) and the generation of residuals (I.) by industries. In the Use Table it covers the use of natural inputs (B.), the intermediate consumption of products (E.), and the receipt of residuals by industries (N.). The first column is further broken down using NACE classification12.
54 The second column covers the consumption of products by households (cell F. in the Use Table) and the generation of residuals from this consumption (cell J. in the Supply Table). The activity of households in extracting natural inputs from the environment for their own consumption (e.g. solar thermal or geothermal energy to generate warm water for own use) is considered a productive activity and hence this activity should be recorded in the first column of the Use Table against the relevant industry class.
55 Unlike the monetary supply and use table, no entries are made for government final consumption. In monetary accounts, government final consumption represents the purchase and consumption by governments of their own output which is services; it does not have an associated physical flow. All of the physical flows related to the intermediate consumption of governments, e.g. paper, electricity etc., are recorded in the first column under the relevant industry class, commonly public administration. In addition, the generation of residuals, e.g. emissions, dissipative heat, by governments in the production of their output is recorded in the first column (i.e. industries).
56 The third column, labelled accumulation, concerns changes in the stock of materials and energy within the economy. From a supply perspective, this column records reductions in the physical stock of produced assets through, for example, demolition, or scrapping (K.). From a use perspective, the accumulation column records additions to the physical stock of produced assets (gross capital formation) and the net changes of inventories of products (G.). It also includes accumulation of residuals stocked within the economy, e.g. in landfills (O.).
57 The fourth column 'rest of the world' recognises the exchanges between national economies in terms of imports (D.) and exports (H.) of products and flows of residuals. Residuals received from the rest of the world (L.) and sent to the rest of the world (P.) primarily concern the movement of solid waste between different economies13.
58 The fifth column 'environment' is the significant addition to the monetary supply and use table structure. In this column natural input flows from the environment (A.) and residual flows to the environment (Q.) are recorded. The 12 Note that for the testing of the PEFA questionnaire, still NACE rev. 1.1. is used. 13 Not relevant for Physical Energy Flow Accounts (PEFA)
16
incorporation of the environmental column allows a full balancing for all physical flows that would otherwise not be possible.
59 The intersections or segments of the PSUT columns and rows in Table 1 denote sub-matrices. These have been labelled with capital letters from A. to Q in the same way as in the draft of the revised SEEA (see draft SEEA chapter 3, Table 3.2.1). Each sub-matrix (cell labelled with capital letters) is explained in the following:
� A. records the supply of natural inputs from the environment.
� B. records the very same natural inputs, however by the receiving, i.e. extracting, industries.
� C. shows the supply of products by the producing industries.
� D. shows the imports of products; i.e. the supply of products by the rest of the world.
60 Sub-matrices E, F, G, and H show how the products supplied (i.e. C and D) are used.
� E. records the intermediate use of products by industries. Industries' intermediate use of products is for the production of other products (e.g. coal to generate electricity).
� F. records the use of products, usually finished products, by private households.
� G. records the net change of product inventories and the additions to produced assets (gross capital formation).
� H. represents the export of products.
61 Sub-matrices I, J, K, L, and M show the generation, i.e. supply, of residuals from different origins (columns).
� I. records the residuals generated by industries.
� J. records the residuals generated by private households.
� K. records residuals provided from inventories (e.g. losses) or from produced assets.
� L. records the inflow of residual provided by rest of the world economies (e.g. non-value waste) – not relevant for energy flows.
� M. records the supply of residuals from the environment (e.g. collection of oil spills) – not much relevant.
62 Sub-matrices N, O, P, and Q record how residuals (provided by I, J, K, L, and M) are used.
17
� N. records the use of residuals by industries, e.g. the non-value waste collected by waste management industries.
� O. records the accumulation of residuals in the economy (e.g. landfills).
� P. record the use of residuals by the rest of the world economy – not relevant for energy flows.
� Q. records the use, i.e. reception, of residuals by the environment.
63 The general framework shown in Table 1 may be articulated only partly14. For the case of energy flow accounts, the SEEA recommends the full articulation of the framework. Chapter 4 of this manual presents the PSUT scheme specifically adjusted to energy flows.
Accounting and balancing identities
64 The general PSUT framework as presented in Table 1 contains a range of important accounting and balancing identities. The starting point for the balancing of the PSUT is the supply-use identity, which recognises that within the economy the amount of products supplied must be used within the economy or exported. Thus (using references to the cells in Table 3.2.1)
Total Supply of Products (TSP) = Domestic production (C) + Imports (D)
is identical to
Total Use of Products (TUP) = Intermediate consumption (E) + Household Final Consumption (F) + Net inventory changes of products and additions to produced assets (gross capital formation) (G) + Exports (H)
65 This supply-use identity for products also applies in the monetary supply and use table. In the PSUT the supply-use identity is extended to the other types of physical flows, namely natural inputs and residuals.
66 Total supply of natural inputs must equal the total use of natural inputs (TSNI = TUNI):
Total Supply of Natural Inputs (TSNI) = Flows from environment (A)
is identical to
Total Use of Natural Inputs (TUNI) = Extraction of natural inputs (B)
67 The total supply of residuals must equal the total use of residuals (TSR = TUR):
Total Supply of Residuals (TSR) = Residuals generated by industry (I) + Residuals generated by households (J) + Residuals from inventories and
14 E.g. Eurostat's Air Emissions Accounts only cover sub-matrices I and J; Eurostat's economy-wide Material Flow Accounts cover only sub-matrices A and D for the input-side and O, H, and Q for the output-side.
18
produced assets (K) + Residuals from rest of the world (L) + Residuals recovered from environment (M)
is identical to
Total Use of Residuals (TUR) = Residuals received by industries (N) + Accumulation of residuals within economy (O) + Residuals to the rest of the world (P) + Residual flows to the environment
68 When applied to all three types of physical flows these equalities also relate to the fundamental physical identities underpinning the PSUT concerning the conservation of mass and the conservation of energy. These physical identities imply the existence of material and energy balances for all individual physical flows within the system.
69 Over an accounting period, flows of materials into an economy must equal the flows of materials out of an economy plus any net additions to stock in the economy.
70 Thus the input-output identity describing the physical flows between an economy and the environment is as follows (using references to the cells in Table 1):
Physical flows into the economy = Natural inputs (A) + Imports of products (D) + Residuals from the rest of the world (L) + Residuals recovered from the environment (M)
is equal to
Physical flows out of the economy = Residuals flows to the environment (Q) + Exports of products (H) + Residuals to the rest of the world (P)
plus
Net additions to stock in the economy = Net inventory changes and gross capital formation (G) + Accumulation of residuals within economy (O) – Residuals from inventories and produced assets (K)
71 This input-output-identity is applied both at the level of the entire economy (as described) and also for the industry column.
72 For industries the input-output identity is:
Physical input into industries = Extraction of natural inputs (B) + Intermediate consumption of products (E) + Residuals received (e.g. waste) (N)
is equal to
Physical output out of industries = Domestic production of products (C) + Residuals generated by industry (I)
73 Particular note is made regarding the flows of residuals. For these flows a number of stages need to be recognised. In the first stage residuals are generated or
19
enter the economy as reflected in cells (I), (J), (K), (L), and (M) in Table 1. These residuals are received by other units in the economy (N and O), sent to other countries (P), or returned to the environment (Q). The residuals received by other units (N) may be treated or processed and then either sold as recycled or reused products (for example reused water) or returned to the environment. If sold as recycled or reused products the production is recorded in (C) and the purchase in (E), (F), or (H).
Main aggregates (indicators) derivable from Physica l Supply and Use Tables
74 The revised SEEA in its draft chapter 3 describes various aggregates derivable from the general PSUT framework. In this section, we only mention two main energy aggregates (indicators) that can be derived from a pair of Physical Supply and Use Tables for energy (energy PSUT):
75 The draft revised SEEA terms the first aggregate Gross Energy Input. It reflects the total energy available for use in the economy, namely energy captured from the environment, energy from residuals within the economy (e.g. from incinerated solid waste), and energy products that are imported. It can therefore provide an indicator of the pressures placed on the environment (or other countries' environments) in the supply of energy to the economy. In terms of entries contained in the energy PSUT, Gross Energy Input is equal to (reference is made to sub-matrices in Table 1):
+ Supply of natural inputs from the environment (sub-matrix A) alternatively: Extraction of natural inputs by industries (B)
+ Imports of products (D)
+ Non-value waste residuals from produced assets (respective row in K) alternatively: non-value waste received by industries (respective row of N)
76 Obviously, the import-element of the Gross Energy Input indicator cannot be presented in a breakdown by industries.
77 The second main energy aggregate is Net Domestic Energy Use. It reflects the amount of energy that is no longer available for use in the economy for energy purposes as a consequence of production and consumption activity. It is regarded as a 'net' measure since it does not include the use of energy products to produce other energy products. It is defined as the sum of all energy residuals (losses during extraction, losses during transformation, losses during storage, losses during distribution, and other energy residuals) except non-value waste residuals supplied from the stock within the economy. In terms of entries in the energy PSUT, Net Domestic Energy Use is equal to (reference is made to sub-matrices in Table 1):
+ Residuals, except non-value waste residuals, generated by industries (I);
+ Residuals, except non-value waste residuals, generated by households (J);
+ Residuals, except non-value waste residuals, from inventories and produced assets (K).
20
78 The two former elements provide a breakdown of the Net Domestic Energy Use by industries and households. The latter element, i.e. losses during storage, cannot be assigned directly to industries.
3 Definitions and Accounting Principles 79 The application of the broad framework for physical flow accounting outlined in chapter 2 requires clear definitions and the adoption of a range of accounting principles and definitions from SNA/ESA and SEEA. This chapter presents the most relevant national accounts definitions and principles for Physical Energy Flow Accounts; addressing in particular compilers not familiar with National Accounts, e.g. energy statisticians. (glossary to be added later)
80 It starts with a section introducing important terminology trying to clarify how various terms are used differently in energy statistics/balances as compared to National Accounts.
81 It follows a section on the National Accounts' definition of the economy and introduces the resident principle which is important to understand the differences between the boundaries of energy statistics on the one hand and Physical Energy Flow Accounts on the other.
82 The chapter further explains the concept of industries. This is an important element as a detailed industry breakdown is one of the main characteristics of Physical Energy Flow Accounts.
83 The physical law of conservation of energy lays the basis for the balancing principle as well as the double-entry accounting. Also the issue of measurement unit is addressed.
84 The chapter ends with detailed explanations of accounting in various specific areas namely international transport, tourist activities, and goods send for processing.
3.1 Synopsis of terminology employed in energy statistics/balances versus National Accounts
85 Energy statistics/balances employ their specific terminology which has developed over the past decades. The same applies for National and Environmental Accounts. Unfortunately, the two 'languages' are not consistent and may cause confusion15. This section looks at the two terminologies and tries to clarify most important differences in order to avoid misunderstandings.
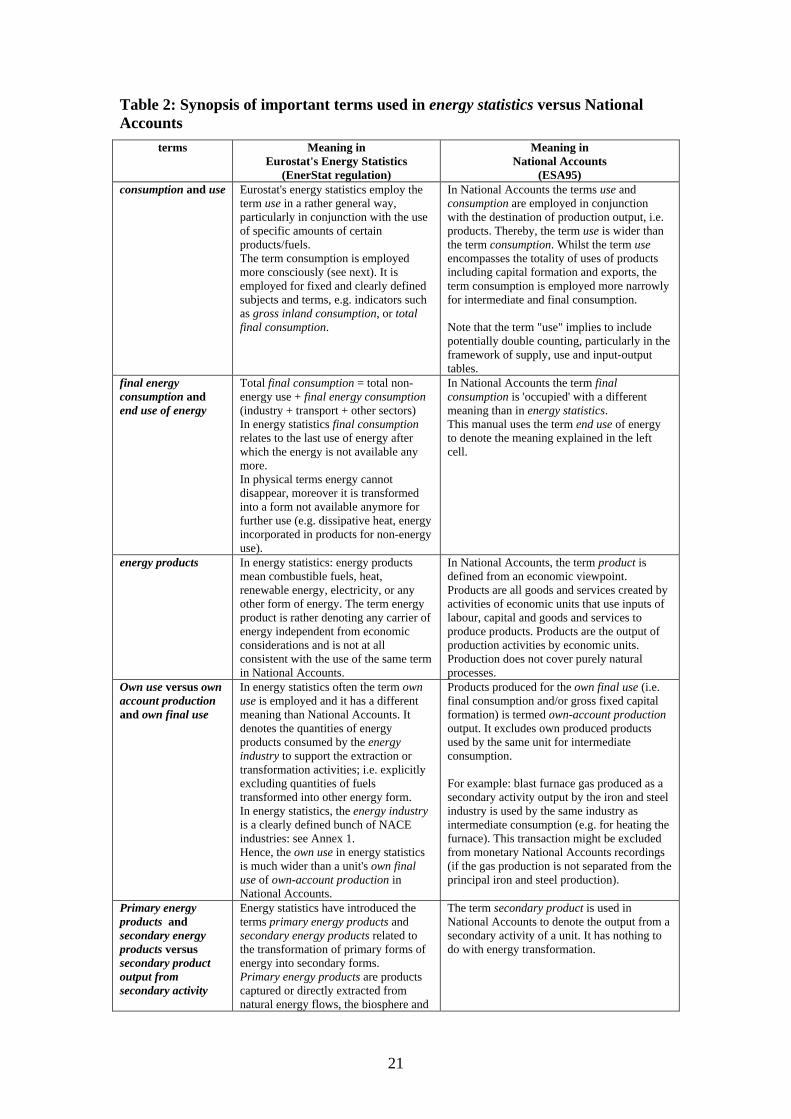
86 The following Table 2 provides a synopsis of important terms and how they are employed in energy statistics (more precisely: Eurostat's energy statistics) in comparison to National Accounts (ESA).
15 In addition: the IEA and Eurostat use a slightly different terminology for their energy statistics/balances. Also, the international SNA2008 uses slightly different terms than its European version ESA95.
21
Table 2: Synopsis of important terms used in energy statistics versus National Accounts
terms Meaning in Eurostat's Energy Statistics
(EnerStat regulation)
Meaning in National Accounts
(ESA95) consumption and use Eurostat's energy statistics employ the
term use in a rather general way, particularly in conjunction with the use of specific amounts of certain products/fuels. The term consumption is employed more consciously (see next). It is employed for fixed and clearly defined subjects and terms, e.g. indicators such as gross inland consumption, or total final consumption.
In National Accounts the terms use and consumption are employed in conjunction with the destination of production output, i.e. products. Thereby, the term use is wider than the term consumption. Whilst the term use encompasses the totality of uses of products including capital formation and exports, the term consumption is employed more narrowly for intermediate and final consumption. Note that the term "use" implies to include potentially double counting, particularly in the framework of supply, use and input-output tables.
final energy consumption and end use of energy
Total final consumption = total non-energy use + final energy consumption (industry + transport + other sectors) In energy statistics final consumption relates to the last use of energy after which the energy is not available any more. In physical terms energy cannot disappear, moreover it is transformed into a form not available anymore for further use (e.g. dissipative heat, energy incorporated in products for non-energy use).
In National Accounts the term final consumption is 'occupied' with a different meaning than in energy statistics. This manual uses the term end use of energy to denote the meaning explained in the left cell.
energy products In energy statistics: energy products mean combustible fuels, heat, renewable energy, electricity, or any other form of energy. The term energy product is rather denoting any carrier of energy independent from economic considerations and is not at all consistent with the use of the same term in National Accounts.
In National Accounts, the term product is defined from an economic viewpoint. Products are all goods and services created by activities of economic units that use inputs of labour, capital and goods and services to produce products. Products are the output of production activities by economic units. Production does not cover purely natural processes.
Own use versus own account production and own final use
In energy statistics often the term own use is employed and it has a different meaning than National Accounts. It denotes the quantities of energy products consumed by the energy industry to support the extraction or transformation activities; i.e. explicitly excluding quantities of fuels transformed into other energy form. In energy statistics, the energy industry is a clearly defined bunch of NACE industries: see Annex 1. Hence, the own use in energy statistics is much wider than a unit's own final use of own-account production in National Accounts.
Products produced for the own final use (i.e. final consumption and/or gross fixed capital formation) is termed own-account production output. It excludes own produced products used by the same unit for intermediate consumption. For example: blast furnace gas produced as a secondary activity output by the iron and steel industry is used by the same industry as intermediate consumption (e.g. for heating the furnace). This transaction might be excluded from monetary National Accounts recordings (if the gas production is not separated from the principal iron and steel production).
Primary energy products and secondary energy products versus secondary product output from secondary activity
Energy statistics have introduced the terms primary energy products and secondary energy products related to the transformation of primary forms of energy into secondary forms. Primary energy products are products captured or directly extracted from natural energy flows, the biosphere and
The term secondary product is used in National Accounts to denote the output from a secondary activity of a unit. It has nothing to do with energy transformation.
22
natural reserves, and for which no transformation has been made. Primary energy products are from both renewable sources and non-renewable resources. Secondary energy products are those products which have been transformed from a primary and/or secondary energy product. For example, energy products such as motor gasoline and diesel have been transformed at an oil refinery from crude oil, the primary energy product.
net versus gross In energy statistics the term ne" denotes energy use net of transformation losses, i.e. the amount of energy which is finally used. Vice versa, the term gross denotes the total amount of energy entering the system gross of transformation losses.
In National Accounts the terms gross and net are mainly used in conjunction with value added. The term gross is used to denote value added gross of consumption of fixed capital. Respectively, the term net is used to express net of consumption of fixed capital. In addition, the term net is used at some other places in the System of National Accounts.
inland versus national (domestic)
In energy statistics these terms are not employed by purpose of making specific difference. The key energy indicator of Eurostat's energy statistics is termed Gross Inland Consumption. Assumingly the term inland was chosen to express net of exports? Luckily it correctly relates to the territory principle.
In National Accounts these terms are employed to make a distinction between the concepts of resident units and units on the territory. The term inland relates to the economic units acting on the economic territory. The term national (also sometimes domestic) is employed to relate to all resident units whether they act on the economic territory or abroad.
3.2 Definition of the national economy and resident principle
87 In National Accounts the economy of a country is the outcome of the activity of a very large number of units carrying out economic activities such comprising a variety of transactions of various kinds for purposes of production, consumption, accumulation, redistribution, finance etc. (ESA95 paragraph 2.01).
88 The units constitute the economy of a country. The units have to be resident; i.e. their centre of economic interest16 has to be on the economic territory17 of that country. These units are termed resident units (ESA95, paragraph 2.04). Thus, the national economy is defined as the total of all resident units' activities. The National Accounts system records all flows and stocks related to the resident units of a national economy.
89 Resident units engage in transactions with non-resident units (i.e. units which are resident in other economies). These transactions are referred to as transactions between national economy and the economy of the rest of the world.
90 It is important to note that Physical Energy Flow Accounts (PEFA) – as in general National and Environmental Accounts – follow the resident principle. Energy statistics and the underpinning basic energy data follow rather a territory principle. Where energy statistics are used to build up Physical Energy Flow Accounts,
16 See for definition: ESA95 paragraph 2.07. 17 See for definition: ESA95 paragraph 2.05.
23
adjustments are needed to account for differences between territory and resident principle18.
91 Energy flows accounted for in Eurostat's Physical Energy Flow Accounts (PEFA) have to be associated with resident unit's activities and not with activities of units acting on the territory. This implies that energy flows associated with resident unit's activities abroad have to be taken into account (e.g. resident unit's fuel bunkering). Conversely, energy flows associated with non-resident's activities on the territory (e.g. foreign trucks, bunkering of foreign vessels) have to be excluded.
92 In short, Physical Energy Flow Accounts record all energy flows associated with activities of resident units – regardless where these activities actually take place geographically.
93 Also, since Physical Energy Flow Accounts encompass only energy flows associated to economic units' activities, energy flows within the environment are not recorded.
94 Natural inputs denote flows from the environment to the economy, i.e. to resident units. The natural resources from which the natural inputs derive are considered to be owned by residents of the country in which the resources are located. By convention, natural resources that are legally owned by non-residents are considered to be owned by a notional resident unit and the non-resident legal owner is shown as the financial owner of the notional resident unit. Consequently, in general, the extraction of natural resource inputs must take place within a country’s economic territory by economic units that are resident in the country
3.3 Industries
95 Economic units the activities of which constituting the economy may be classified in various ways depending on the type of analysis being undertaken (ESA95 paragraphs 2.02 and 2.03).
96 Industries are the most appropriate concept of grouping and classifying economic unit's activities in the case of physical flow accounts.
97 In the SEEA, as in the ESA/SNA, the groupings of units that undertake similar types of productive activity are referred to as industries. Industries cover, in broad categories, agriculture, mining, manufacturing, construction, and services. Ideally, an industry is composed of elementary units that undertake the same activity and only that activity – i.e. the grouping would be homogenous.
98 The ESA95 uses the term local kind-of-activity units (local KAU) to denote the elementary units undertaking the same activities. Local KAU's are grouped to industries. I.e. industries should consist of a group of local KAUs engaged in the same, or similar, kind-of-activity19.
18 Most notably, the use of energy for transport is recorded differently in energy statistics/balances. The production of energy products is recorded widely in the same way in both systems. 19 For more details see ESA95 paragraphs 2.102 to 2.110.
24
99 In Europe, the classification used for groupings of local KAUs to industries is the Statistical Classification of Economic Activities in the European Community (NACE)20.
3.4 Balancing principle and double-entry accounting
100 A basic accounting principle in both, National Accounts and Environmental Accounts (particularly Physical Flow Accounts), is the balancing principle.
101 In the case of Physical Flow Accounts this is also referred to as the energy-balance and/or mass-balance principle. Due to the physical law on conservation of energy and matter the latter cannot disappear. Hence, any supply of energy/material requires a counterpart from the use side.
102 In Physical Energy Flow Accounts both perspectives are recorded. Each energy flow item has to be recorded twice, at its origin and at its destination. This is also referred to as double-entry principle (ESA95; paragraph 1.50). The sum of flows from all origins must equal the sum of flows to all destinations.
3.5 Units of measurement
103 Physical flows are recorded in physical measurement units. The energy flows recorded in Eurostat's Physical Energy Flow Accounts (PEFA) are measured by their energy content (calorific value in joule) and not their mass or volume. This is to ensure the possibility of aggregation and reconciliation across all accounting entries.
104 For energy content the international physical measurement unit is Joule.
105 The conventions of energy statistics (see e.g. Energy Statistics Manual) are applied with regards to the use of gross calorific value (GCV) versus net calorific value (NCV):
� Energy content of solid fuels and renewable and waste-related flows are reported in net calorific value basis.
� Energy content of gases, except biogas, is reported on a gross calorific value basis.
3.6 International transport
106 International transport refers to the movement of people, animals, and goods from one location to another thereby crossing country borders.
107 The appropriate recording of international transport activity is important particularly for information concerning the use of fuels and the associated release of
20 Note that for the testing of the PEFA questionnaire, still NACE rev. 1.1. is used.
25
emissions; the appropriate and consistent attribution of physical flows relating to cross-border transports to individual countries is an important component.
108 The treatment is centred on the residence of the operator of the transport equipment. Usually this will be the location of the headquarters of the transport operator. Therefore, the output from producing these transport services, together with the associated intermediate consumption - including costs for fuels wherever purchased, are attributed to the country of residence of the operator.
109 Once the residence of the operator of international transport equipment has been determined, the appropriate accounting is illustrated in the following examples:
i. A ship, whose operator is a resident unit in Country A, transports goods from Country B to Country C, and refuels in Country C before returning home. In this case purchases of fuels are attributed to Country A (being exports of fuel from Country C and imports of fuel of Country A). Payments for transport services by Country C are exports of services by Country A
ii. A passenger aircraft, whose operator is a resident unit in Country X, transports people from Country X to Country Y and returns to Country X. The passengers are from various countries, X, Y and Z. In this case any purchases of fuels are attributed to Country X and are recorded as imports if purchased in Country Y. Payments by the passengers are recorded as exports of services by Country X if the passengers are resident in Country Y or Z.
110 Special note is required in relation to the bunkering of fuel, primarily for vessels and aircraft. Special arrangements may be entered into such that a unit resident in a country stores fuel in another country while still retaining ownership of the fuel itself. Following the principles of the National Accounts, the location of the fuel is not the primary consideration. Rather focus must be on the ownership of the fuel. Thus if a unit resident in Country A established a storage in Country B and transports fuel to the storage located in Country B in order to refuel a ship that this unit operates then the fuel it considered to have remained in the ownership of country A and no export of fuel to Country B is recorded. Thus the fuel stored in Country B is not necessarily all attributable to Country B. This treatment is likely to differ from the recording in international trade statistics and adjustments may be needed to source data to align to this treatment.
3.7 Tourist activity
111 The recording of tourist activity is consistent with the recording of international transport activity in that the concept of residence is central. Tourist activities include travelling outside their country of residence including the stay of short term students (i.e. less than 12 months), people travelling for medical reasons and those travelling for business or pleasure. The consumption activity of a tourist travelling abroad is attributed to the tourist’s country of residence and not to the location the tourist visited. Thus purchases by the tourist in other countries are recorded as an export of the country visited and as an import of the country of residence of the tourist.
26
112 Fuel use by public transport used by tourists in a foreign country are attributed to the local transport company.
113 Fuel used for cars are attributed to the country of residence of the operator (in this case the driver of the car), independent of the car is owned by the driver or is being leased from a rental car company. So, if a tourist rents a car in a foreign country the refilling has to be attributed to the country the tourist comes from. Fuel use by taxis, local minibuses and the like are also attributed to the driver or company which is the operator of the means of transport.
3.8 Treatment of goods for processing
114 It is increasingly common that goods from one country are sent to another country for further processing before being returned to the original country, sold in the processing country or sent to other countries. In situations where the un-processed goods are sold to a processor in a second country there are no particular recording issues. However, in situations where the processing is undertaken on a fee for service basis and there is no change of ownership of the goods (i.e. the ownership remains with the original country) the financial flows are unlikely to relate directly to the physical flows of goods being traded.
115 From a monetary accounts perspective, the firm processing the goods assumes no risk associated with the eventual marketing of the products and the value of the output of the processor is the fee agreed for the processing which is recorded as an export of a service to the first country. A consequence of this treatment is that the recorded pattern of inputs for the establishment that is processing goods on behalf of another unit is quite different from the pattern of inputs when the establishment is manufacturing similar goods on their own account.
116 A simple illustration may be given by referring to the production of petroleum products. A firm that refines crude oil on own account has intermediate consumption of crude oil and output of refined petroleum products. A firm that is processing crude oil on behalf of another unit has all the other similar inputs and uses the same produced assets but, in their accounts, shows neither the intermediate consumption of crude oil nor the output of refined petroleum products. Instead only an output equal to the processing fee is recorded.
117 For similar amounts of crude oil processed, the estimates of value added and other inputs (i.e. labour and produced assets) are likely to be comparable. However, the result of recording only the processing fee rather than the full value of the goods processed does change the measured supply and use relationship.
118 Although this treatment accords with the SNA2008 and provides the most appropriate recording of the monetary flows, it does not correspond to the physical flows of goods. Consequently, a different treatment of goods for processing is recommended for physical supply and use tables. The treatment is to record the physical flows of goods, both as they enter into the country of the processing unit and as they leave that country. Tracking the physical flows in this way enables a clearer reconciliation of all physical flows in the economy and also provides a physical link
27
to the recording of the environmental impact of the processing activity in the country in which the processing is being undertaken, including for example, emissions to air.
119 Generally, information on the physical flow of goods between countries is available in international trade statistics. However, it is necessary to identify those flows of goods where the ownership has not changed and to apply a different treatment in monetary terms compared to the international trade data.
120 Depending on the products and industries that are of interest reconciliation entries may be required if accounts combining physical and monetary data are to be compiled.
4 Overview on the set of tables in the electronic questionnaire
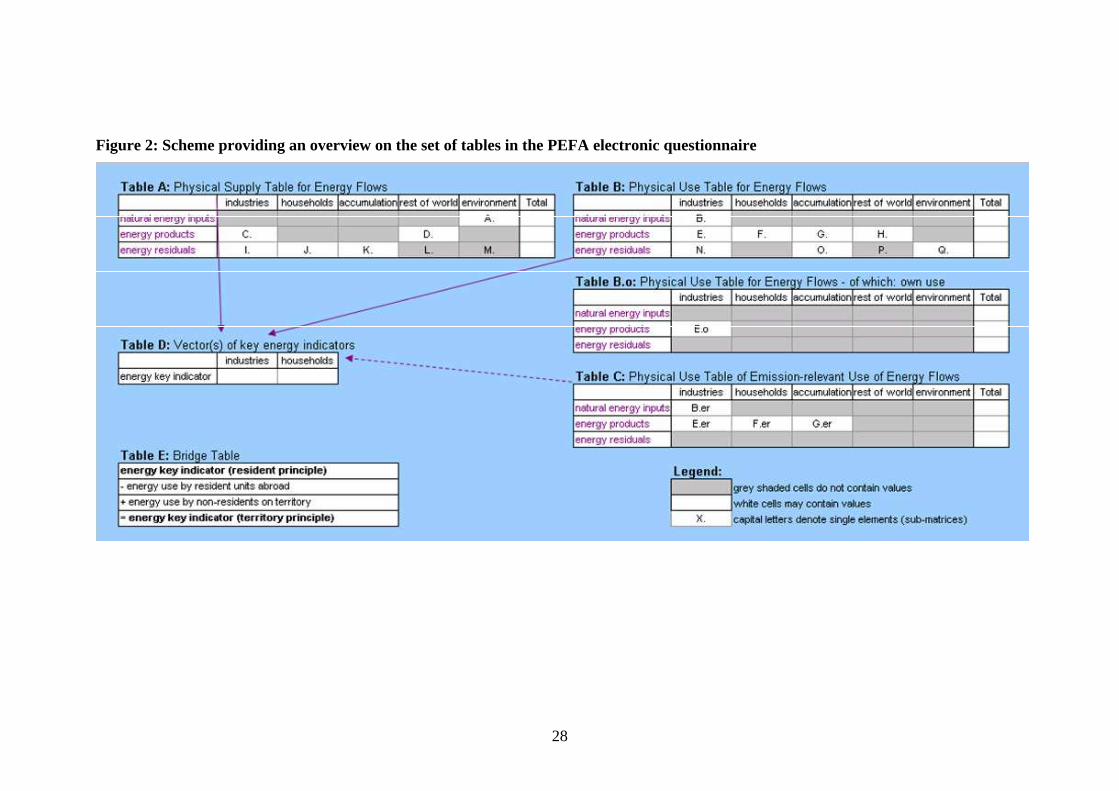
121 Eurostat's electronic questionnaire for Physical Energy Flow Accounts (PEFA) contains six tables. Figure 2 provides an overview. This chapter explains briefly the six tables.
122 Tables A, B, B.o, and C are tables of the same columns and rows format. They constitute full-fledged Physical Supply and Use Tables (PSUT) as introduced in chapter 2 (see Table 1). Row-wise, these energy PSUTs distinguish three broad types of flows, namely natural energy inputs, energy products, and energy residuals. Column-wise the energy PSUTs show the origin and the destination respectively of the various flow types. The classifications used for the three physical flow types are described and further explained in section 4.7. Section 4.8 describes the columns of the energy PSUTs and their classification.
123 The energy PSUTs can be decomposed into various sub-matrices in order to explain better their meanings. Capital letters in the scheme provided in Figure 2 denote these sub-matrices (or cells). These capital letters are the same as in Table 1 in chapter 2 and also correspond to Table 3.2.1 in the draft chapter 3 of the revised SEEA.
124 Table D presents vector(s) of certain key energy indicator(s). The key energy indicator can be derived from Tables A and B.
125 Table E – the so-called Bridge Table – shows the various elements making up the difference between the key energy indicator contained in Table D and the common key energy indicator as presented by energy statistics (in Europe called Gross Inland Energy Consumption21). The difference between both key indicators is mainly due to differences in treatment of international transport.
21 termed Total Primary Energy Supply (TPES) by International Energy Agency (IEA)
28
Figure 2: Scheme providing an overview on the set of tables in the PEFA electronic questionnaire
29
4.1 Table A: Physical Supply Table for Energy Flows
126 This table records the supply of natural energy inputs, energy products, and energy residuals (row-wise) by origin (column-wise).
127 By definition, natural energy inputs are provided (supplied) by the environment (cell A in Table A). Energy products are provided (i.e. produced) by domestic industries (cell C), and provided by the rest of the world, i.e. in form of imported products (cell D). Energy residuals originate from industries (cell I) and households (cell J). Accumulation supplies energy residuals in form of waste without monetary value (cell K).
4.2 Table B: Physical Use Table for Energy Flows
128 This table records the use of natural energy inputs, energy products, and energy residuals (row-wise) by destination, i.e. 'user' (column-wise).
129 Natural energy inputs are used, e.g. harvested, extracted, etc., by industries (cell B) in order to produce energy products (see also paragraph 215). If households should extract natural energy inputs for own use and/or for sale, these flows have to be recorded under the respective industry column typically extracting this type of natural energy input [the case of 'household's production for own use' needs to be checked and confirmed again].
130 Energy products are used by industries (cell E) and households (cell F). Energy products go on and off product inventories (e.g. petroleum products produced in one period and sold in the following period). These inventory changes in energy products are recorded net in the accumulation column (cell G) of the Physical Use Table B whereby negative signs imply a net supply from inventories. The rest of the world also 'uses' energy products in form of exports (cell H).
131 Energy residuals, the majority of which are transformation losses and dissipative heat, are absorbed, i.e. 'used', by the environment (cell Q). In the accumulation column (cell O) the 'storage' of energy is recorded which is incorporated in products for non-energy purposes (e.g. plastic products). The waste management industry (cell N) receives energy residuals in the form of waste without monetary value (supplied from K. in Table A).
4.3 Table B.o: Physical Use Table for Energy Flows - of which: own use
132 This table records the own use of energy products (row-wise) by users (column-wise). It is a sub-layer of Table B and hence has the same format as Table B, however only one sub-matrix (cell E.o) is actually concerned and populated (see below).
133 Own use of energy products denotes the use of energy products produced by the user itself (e.g. own use of refinery gas by the refinery industry or own use of
30
electricity by the electricity supplying industry). It is not sold on markets and therefore most likely not recorded in monetary accounts (e.g. monetary Supply and Use Tables).
134 Own use of energy products occurs only in the sub-matrix E.o (use of energy products by industries). It neither relates to the use of natural inputs nor to the use of residuals. It also cannot be related to households [to be clarified whether household production for own use (e.g. firewood gathering, heat production for own use with heat pumps and/or solar thermal panels) is really to be recorded in the respective industry column in the Supply table and where to record the corresponding use of natural inputs – in the industry column or in the household column?]
135 Note: Energy statistics/balances contain a position termed ‘energy industry own use’ which is defined much broader22 than the ‘own use’ in Table B.o.
4.4 Table C: Physical Use Table of Emission-relevant Use of Energy Flows
136 This table records the emission-relevant use of natural energy inputs and energy products (row-wise) by the using and emitting unit (column-wise). Emission-relevant use of energy denotes the use of energy carriers resulting in physical flows of the following list of gaseous or particulate materials to the atmosphere23:
� carbon dioxide CO2 � nitrous oxide N2O � methane CH4 � hydrofluorocarbons HFC � perfluorocarbons PFC � sulphur hexafluorids SF6 � nitrogen oxides NOx � sulphur dioxide SO2 � ammonia NH3 � non-methane volatile organic compounds NMVOC � carbon monoxide CO � particulate matter PM10
137 The majority of emission-relevant energy use relates to the combustion (i.e. oxidation) of energy carriers resulting in emissions of CO2, N2O, NOx, SOx, NMVOC, and CO. Emission relevant energy use may also relate to venting, e.g. of methane in the mining industry. Emission relevant energy use is also related to certain industrial production processes for instance in the refinery and chemical industry such as, e.g. (see also Eurostat 2009, Manual for Air Emissions Accounts):
22 In energy statistics/balances, the term ‘energy industry own use’ denotes the use of fuels, electricity and heat for the direct support of the production in energy industries (energy industries are defined as economic units whose principal activity is the primary energy production, transformation of energy and distribution of energy; see Annex 1). 23 This list of gaseous and particulate materials is subject to Eurostat's Air Emissions Accounts
31
� Refinery industry: feed stock handling and storage; separation processes; petroleum conversion processes; petroleum treating processes; product storage and handling; auxiliary facilities.
� Iron and steel industry: coke ovens; blast furnace charging; pig iron tapping, oxygen furnace; electric furnace; rolling; sinter and pelletizing, etc.
� Inorganic chemical industries: production of acid, ammonia, chlorine, fertilizers etc.
� Organic chemical industries: production of ethylene, propylene, PVCs, formaldehyde, ethylbenzene etc.
� Production of halocarbons and sulphur hexafluoride using feedstocks
138 Emission-relevant energy use occurs in industries (cell E.er) and in private households (cell F.er). Inventories of energy products (cell G.er) may also constitute a source of emissions (evaporation, leaching). There are a few cases where the use of natural energy inputs may be emission-relevant (cell B.er), namely the loss of gaseous energy carriers during extraction (B.er), e.g. flaring and venting of natural gas by extracting industries.
139 The seldom case that the use of energy residuals is emission-relevant is limited to the case where industry uses residuals recovered from the environment (e.g. incineration of oil spilled material). This case has been neglected in Table C.
4.5 Table D: Vector(s) of key energy indicators
140 This table does not have the matrix format as the previous tables. This table contains vector(s) of key energy indicator(s) in a breakdown by industries and households which in principle should be derivable from Tables A, B, and C.
141 So far, only one key indicator vector has been identified by the Task Force, namely 'total energy consumption by resident units'24, a kind of energy use without double-counting. It looks at how the (primary) energy provided through natural energy inputs, imported energy products, and energy recovered from residuals25 is 'used off' or made unavailable by end users, i.e. resident industries and households.
142 It corresponds partly to the energy statistics' key indicator 'Gross Inland Consumption'26 and assigns it to the using industries and private households. The difference relate to the resident principle.
143 Note that the row-wise sum of this indicator 'total energy consumption by resident units' vector constitutes the key energy indicator according to the resident principle which is presented also in the 'bridge' Table D.
144 The most simple way is to derive the 'total energy consumption by resident units' vector from the energy residual block in the Supply Table (Table A), more
24 In a written consultation the Eurostat Task Force decided on this indicator name. Note that the revised SEEA terms this indicator 'Net Domestic Energy Use' ; see paragraph 77. 25 originating from the stock within the economy, such as e.g. waste 26 The international (IEA) term for this key energy indicator is 'primary energy supply'.
32
precisely sub-matrix I. minus sub-matrix N. for industries and sub-matrix J. for private households. The supply of energy residuals comprise all kind of energy losses (extraction, distribution, transformation, and end use) as well as the energy incorporated in products for non-energy use. Hence, it presents exactly the place (industry or household) where the energy is end used, i.e. transformed into a form which is not available for further economic use.
145 Note that for various reasons this indicator vector cannot have a breakdown by energy carriers (natural energy inputs and/or energy products). Tables B, B.o, and C can be used for analyses requiring an energy carrier breakdown.
146 Further vectors of key energy indicators, e.g. renewable share etc., may be defined and added to Table D at a later stage.
4.6 Table E: Bridge Table
147 This table shows the changeover or 'bridge' from the key energy indicator presented in Table D (resident principle) towards the energy statistics' key indicator (territory approach). Note: this table reports for the entire national economy (no breakdown by industries).
148 The following broad positions constitute the 'bridge' from the resident principle indicator to the territory based indicator:
total energy use by resident units (row-wise sum of vector in Table D)
– energy use by resident units abroad
+ energy use be non-residents on the territory
= Gross Inland Energy Consumption27 (territory based)
4.7 Description and classification of PSUT rows
149 As already explained in chapter 2, the SEEA broadly distinguishes three types of physical flows which are also applied for Physical Energy Flow Accounts:
a) natural energy inputs (A),
b) energy products (B),
c) energy residuals (C).
150 Natural energy inputs refer to physical flows from the environment into the economy. The SEEA defines natural inputs as all physical inputs that are moved from their location in the environment as a part of economic production processes or are directly incorporated into economic production processes.
27 Termed 'Primary Energy Supply' in IEA statistics.
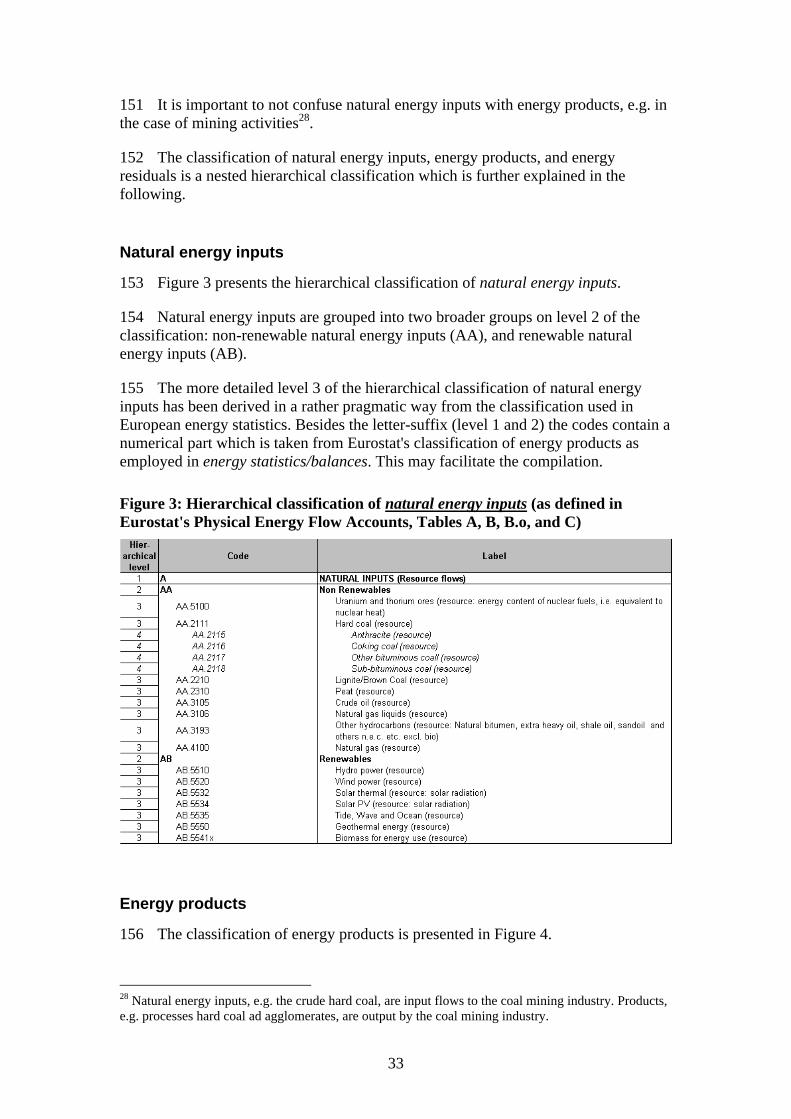
33
151 It is important to not confuse natural energy inputs with energy products, e.g. in the case of mining activities28.
152 The classification of natural energy inputs, energy products, and energy residuals is a nested hierarchical classification which is further explained in the following.
Natural energy inputs
153 Figure 3 presents the hierarchical classification of natural energy inputs.
154 Natural energy inputs are grouped into two broader groups on level 2 of the classification: non-renewable natural energy inputs (AA), and renewable natural energy inputs (AB).
155 The more detailed level 3 of the hierarchical classification of natural energy inputs has been derived in a rather pragmatic way from the classification used in European energy statistics. Besides the letter-suffix (level 1 and 2) the codes contain a numerical part which is taken from Eurostat's classification of energy products as employed in energy statistics/balances. This may facilitate the compilation.
Figure 3: Hierarchical classification of natural energy inputs (as defined in Eurostat's Physical Energy Flow Accounts, Tables A, B, B.o, and C)
Energy products
156 The classification of energy products is presented in Figure 4.
28 Natural energy inputs, e.g. the crude hard coal, are input flows to the coal mining industry. Products, e.g. processes hard coal ad agglomerates, are output by the coal mining industry.
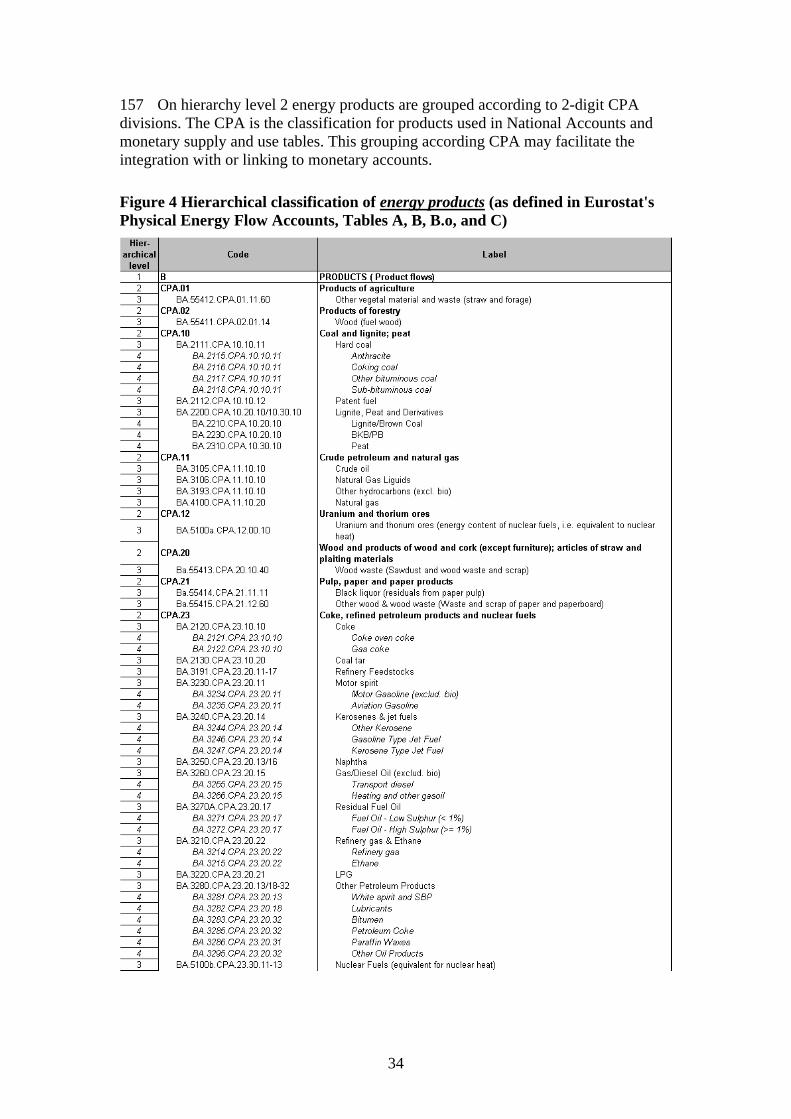
34
157 On hierarchy level 2 energy products are grouped according to 2-digit CPA divisions. The CPA is the classification for products used in National Accounts and monetary supply and use tables. This grouping according CPA may facilitate the integration with or linking to monetary accounts.
Figure 4 Hierarchical classification of energy products (as defined in Eurostat's Physical Energy Flow Accounts, Tables A, B, B.o, and C)
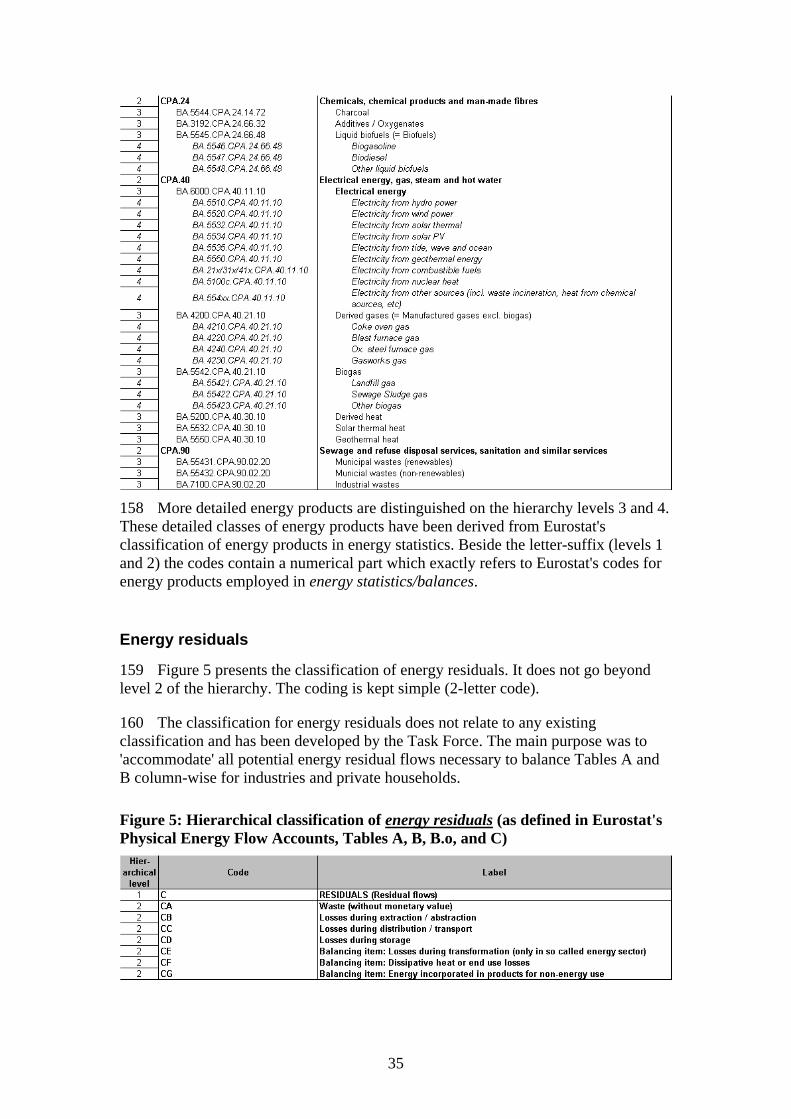
35
158 More detailed energy products are distinguished on the hierarchy levels 3 and 4. These detailed classes of energy products have been derived from Eurostat's classification of energy products in energy statistics. Beside the letter-suffix (levels 1 and 2) the codes contain a numerical part which exactly refers to Eurostat's codes for energy products employed in energy statistics/balances.
Energy residuals
159 Figure 5 presents the classification of energy residuals. It does not go beyond level 2 of the hierarchy. The coding is kept simple (2-letter code).
160 The classification for energy residuals does not relate to any existing classification and has been developed by the Task Force. The main purpose was to 'accommodate' all potential energy residual flows necessary to balance Tables A and B column-wise for industries and private households.
Figure 5: Hierarchical classification of energy residuals (as defined in Eurostat's Physical Energy Flow Accounts, Tables A, B, B.o, and C)
36
4.8 Description and classification of PSUT columns
161 The column headings of the PSUTs denote the origins of energy flows (Supply Table A) and respectively the destinations of energy flows (Use Tables B, B.o, and C).
162 In accordance with the revised SEEA29 (see also Table 1 in chapter 2 of this manual), the origins and destinations of energy flows are broadly grouped into five groups:
• Producing industries (classified using NACE rev.1.1);
• Private households (as consumers);
• Accumulation (stock of produced assets, products inventories);
• Rest of the world economies (imports respectively exports);
• Natural environment (providing natural inputs respectively absorbing residuals).
163 The hierarchically nested classification of columns encompasses six levels. The full classification is shown in Figure 6.
164 Industries, the first broad group, are classified using NACE rev.1.1. The nested hierarchical levels are as following:
• Level 1 relates to seven very broad groupings of industries (A7).
• Level 2 relates to 17 sections (A17, 1-letter).
• Level 3 relates to 31 sub-sections (A31, 2-letters).
• Level 4, relating to 60 divisions (A60, 2-digits), is the most important level as it is employed too in Eurostat's monetary supply, use and input-output tables.
• On levels 5 and 6 some selected divisions which are of particular relevance for energy flows are further detailed based on NACE 3-digit codes.
165 Private households are only represented by one single column.
29 Draft chapter 3: Figure 3.2.1
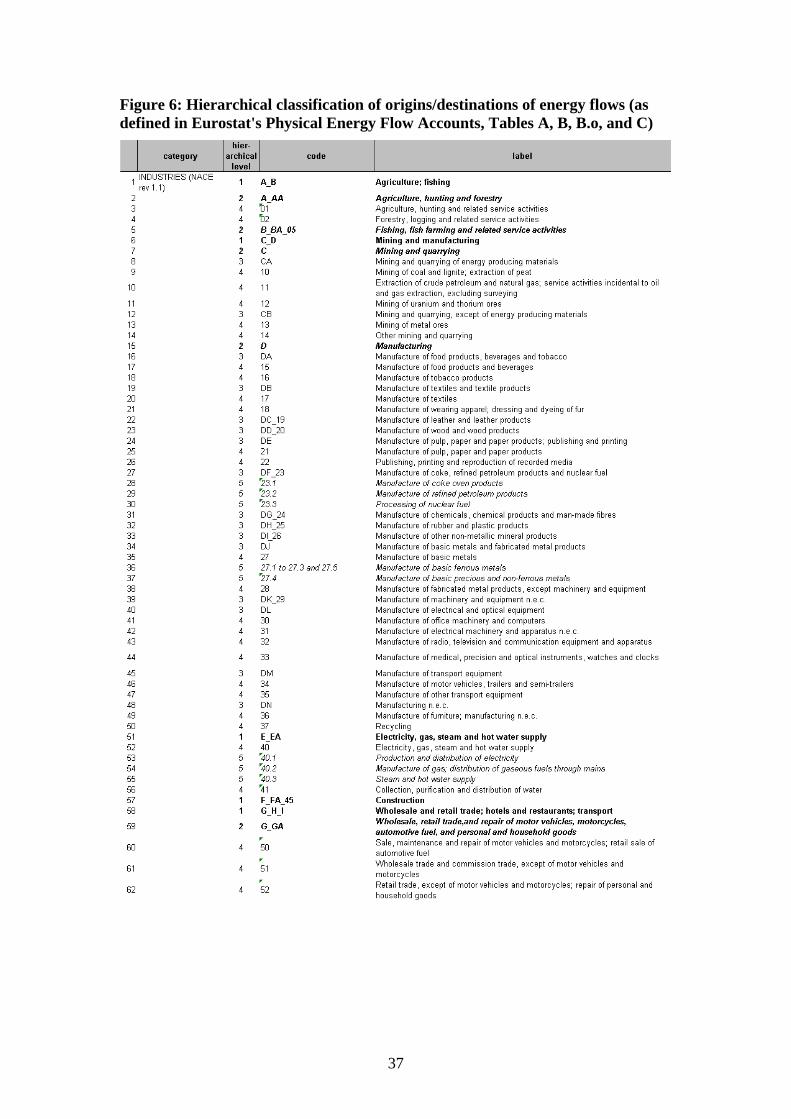
37
Figure 6: Hierarchical classification of origins/destinations of energy flows (as defined in Eurostat's Physical Energy Flow Accounts, Tables A, B, B.o, and C)
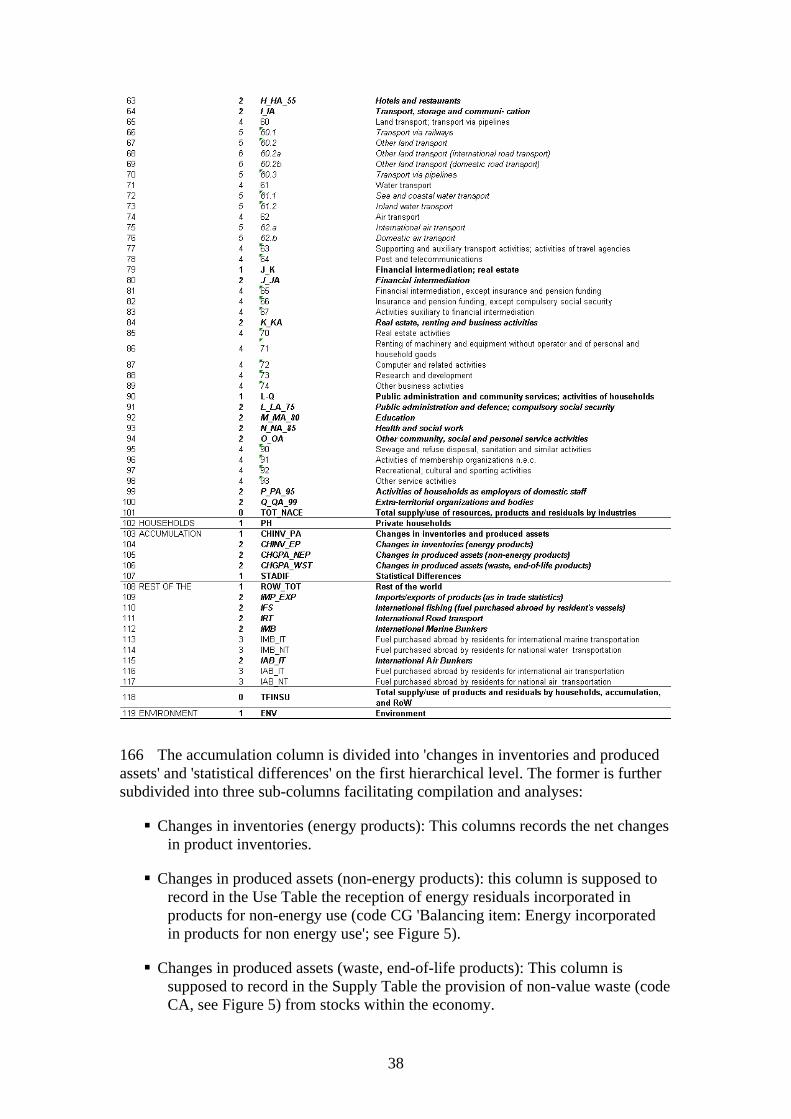
38
166 The accumulation column is divided into 'changes in inventories and produced assets' and 'statistical differences' on the first hierarchical level. The former is further subdivided into three sub-columns facilitating compilation and analyses:
� Changes in inventories (energy products): This columns records the net changes in product inventories.
� Changes in produced assets (non-energy products): this column is supposed to record in the Use Table the reception of energy residuals incorporated in products for non-energy use (code CG 'Balancing item: Energy incorporated in products for non energy use'; see Figure 5).
� Changes in produced assets (waste, end-of-life products): This column is supposed to record in the Supply Table the provision of non-value waste (code CA, see Figure 5) from stocks within the economy.
39
167 The rest of the world column is further detailed for analytical and compilation reasons. It distinguishes three hierarchical levels:
� Rest of the world
� Imports/exports of products (as in trade statistics)
� International fishing (fuel purchased abroad by resident's vessels)30
� International Road transport
� International Marine Bunkers
o Fuel purchased abroad by residents for international marine transportation
o Fuel purchased abroad by residents for national water transportation
� International Air Bunkers
o Fuel purchased abroad by residents for international air transportation
o Fuel purchased abroad by residents for national air transportation
168 The natural environment is represented by one single column.
5 A General Compilation Approach
5.1 Introduction and overview
169 This chapter presents a general approach to compile Eurostat's Physical Energy Flow Accounts (PEFA). It is a step-wise compilation sequence starting from the standardised format of Eurostat's energy balances and arriving at Table A and B of the PEFA questionnaire. The other 4 tables in the PEFA questionnaire can be derived from Tables A and B.
170 The compilation sequence presented in this chapter has been worked out by Eurostat with the help of contractors. The descriptions in this chapter remain rather theoretical for compilers. After the testing of the PEFA questionnaire, it is planned to expand this manual by more practical compilation guidelines and examples based on the experiences gathered during the testing phase in early 2012.
171 Countries collect primary data on energy in the one or the other way, e.g. through surveys based on specific national law. These primary data may be organised in data bases and presented in tables which are specific to the circumstances of 30 excluded from trade statistics
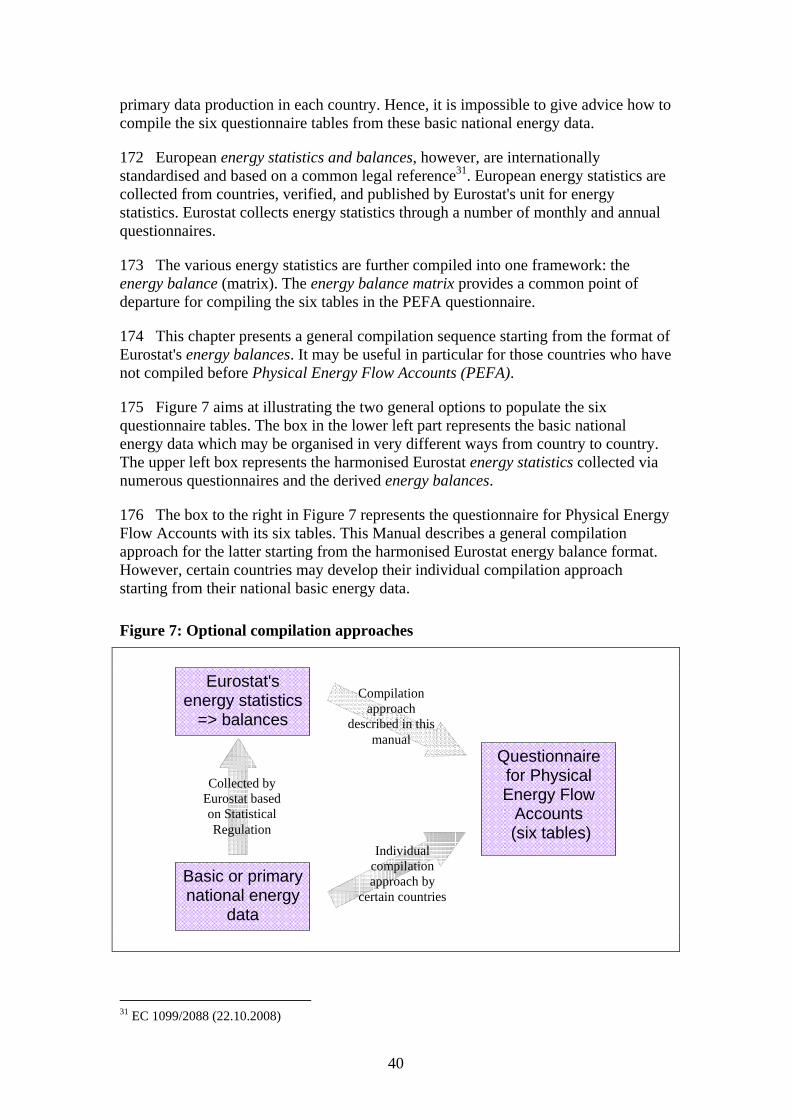
40
primary data production in each country. Hence, it is impossible to give advice how to compile the six questionnaire tables from these basic national energy data.
172 European energy statistics and balances, however, are internationally standardised and based on a common legal reference31. European energy statistics are collected from countries, verified, and published by Eurostat's unit for energy statistics. Eurostat collects energy statistics through a number of monthly and annual questionnaires.
173 The various energy statistics are further compiled into one framework: the energy balance (matrix). The energy balance matrix provides a common point of departure for compiling the six tables in the PEFA questionnaire.
174 This chapter presents a general compilation sequence starting from the format of Eurostat's energy balances. It may be useful in particular for those countries who have not compiled before Physical Energy Flow Accounts (PEFA).
175 Figure 7 aims at illustrating the two general options to populate the six questionnaire tables. The box in the lower left part represents the basic national energy data which may be organised in very different ways from country to country. The upper left box represents the harmonised Eurostat energy statistics collected via numerous questionnaires and the derived energy balances.
176 The box to the right in Figure 7 represents the questionnaire for Physical Energy Flow Accounts with its six tables. This Manual describes a general compilation approach for the latter starting from the harmonised Eurostat energy balance format. However, certain countries may develop their individual compilation approach starting from their national basic energy data.
Figure 7: Optional compilation approaches
Basic or primary national energy
data
Eurostat's energy statistics
=> balances
Questionnaire for Physical Energy Flow
Accounts (six tables)
Compilation approach
described in this manual
Collected by Eurostat based on Statistical Regulation
Individual compilation approach by
certain countries
31 EC 1099/2088 (22.10.2008)
41
5.2 The format of Eurostat's energy balances in bri ef
177 Eurostat's energy balance is a specific format of showing energy statistics for a country or country grouping. It presents the supply, transformation, and consumption of energy products in one matrix and uses a common measurement unit (Terajoules or kilo tonnes oil equivalents).
178 Note, that the energy balance matrix is rotated by 90° in comparison to the energy PSUTs. Along the horizontal dimension (column headings) the energy balance matrix presents a wide range of energy products. The classification of energy products (dimension code: PRODUCT in Eurostat's database) is hierarchical and is presented in detail in Annex 2. The following broad groups of energy products are distinguished on the 1st level of the hierarchy:
� Solid fuels (2000)
� Total petroleum products (3000)
� Gas (4000)
� Total renewables (5500)
� Other products (7100)
� Municipal wastes (non renewable) (55432)
� Nuclear heat (5100)
� Derived heat (5200)
� Electricity (6000)
179 The scope of Eurostat's energy balances is by and large limited to product flows in the meaning of National and Environmental Accounts. I.e. it covers output from production activities (see also section Error! Reference source not found. for definition of production boundary in SNA and SEEA). Natural energy inputs and energy residuals, the two additional physical flow types according to SEEA (see also chapter 2), are not immediately subject to energy balances. They can be derived from the energy balances in a subsequent step.
180 Along the vertical dimension (row headings) the energy balance matrix presents the various supplies, transformation, and consumption items of the balance (dimension code: INDIC_NRG in Eurostat's database). It is also classified using a hierarchical order. Broadly, 3 blocks can be distinguished (a full fledged listing of all energy balance positions is given in Annex 3):
1. Supply: comprising primary production, imports, exports, stock changes etc. This block shows how much of each of the various energy products is available for use in a country. This block sums up with the key indicator of energy balances, namely Gross Inland Consumption;
2. Transformation: comprising
• Transformation input, showing the input of the various energy products into the so-called transformation industries;
• Transformation output, showing the products produced by the so-called transformation industries;
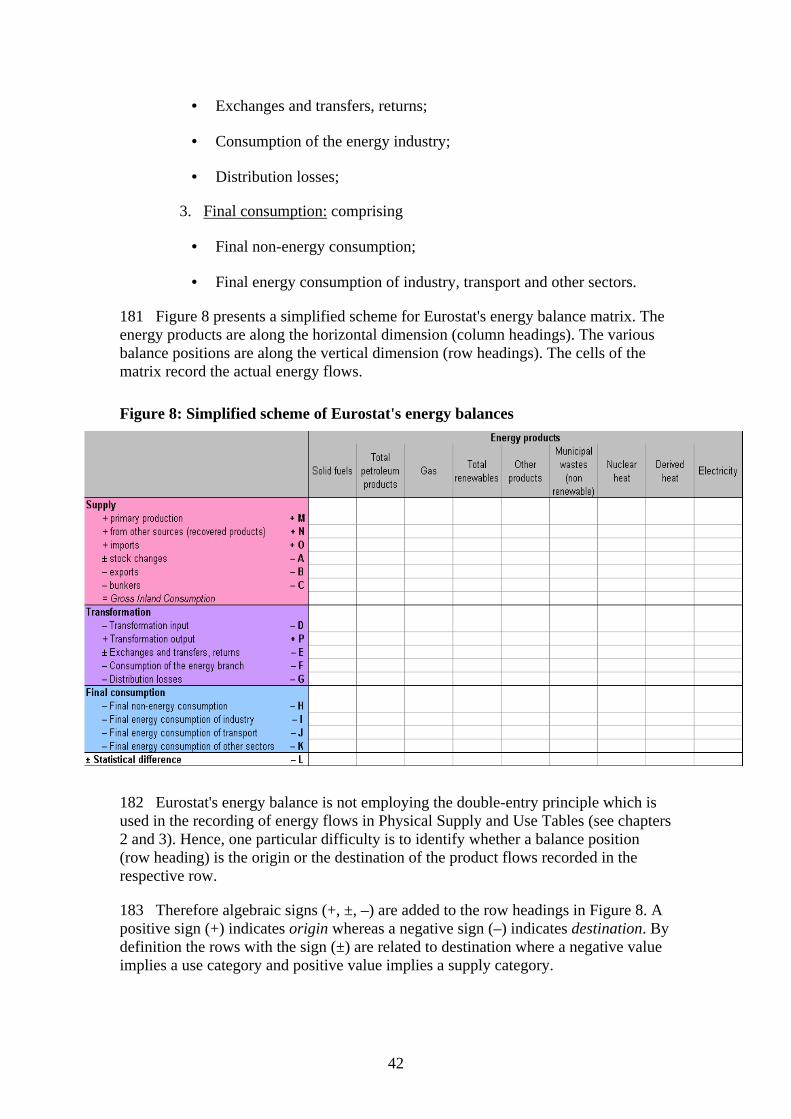
42
• Exchanges and transfers, returns;
• Consumption of the energy industry;
• Distribution losses;
3. Final consumption: comprising
• Final non-energy consumption;
• Final energy consumption of industry, transport and other sectors.
181 Figure 8 presents a simplified scheme for Eurostat's energy balance matrix. The energy products are along the horizontal dimension (column headings). The various balance positions are along the vertical dimension (row headings). The cells of the matrix record the actual energy flows.
Figure 8: Simplified scheme of Eurostat's energy balances
182 Eurostat's energy balance is not employing the double-entry principle which is used in the recording of energy flows in Physical Supply and Use Tables (see chapters 2 and 3). Hence, one particular difficulty is to identify whether a balance position (row heading) is the origin or the destination of the product flows recorded in the respective row.
183 Therefore algebraic signs (+, ±, –) are added to the row headings in Figure 8. A positive sign (+) indicates origin whereas a negative sign (–) indicates destination. By definition the rows with the sign (±) are related to destination where a negative value implies a use category and positive value implies a supply category.
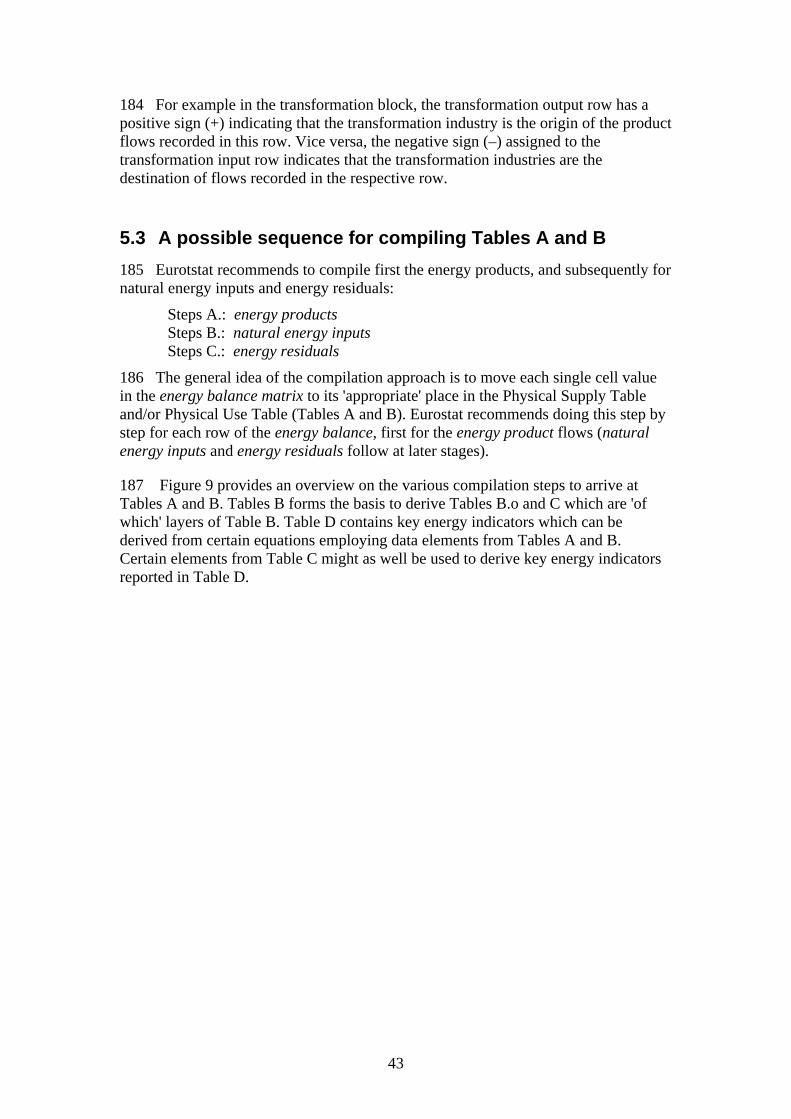
43
184 For example in the transformation block, the transformation output row has a positive sign (+) indicating that the transformation industry is the origin of the product flows recorded in this row. Vice versa, the negative sign (–) assigned to the transformation input row indicates that the transformation industries are the destination of flows recorded in the respective row.
5.3 A possible sequence for compiling Tables A and B
185 Eurotstat recommends to compile first the energy products, and subsequently for natural energy inputs and energy residuals:
Steps A.: energy products Steps B.: natural energy inputs Steps C.: energy residuals
186 The general idea of the compilation approach is to move each single cell value in the energy balance matrix to its 'appropriate' place in the Physical Supply Table and/or Physical Use Table (Tables A and B). Eurostat recommends doing this step by step for each row of the energy balance, first for the energy product flows (natural energy inputs and energy residuals follow at later stages).
187 Figure 9 provides an overview on the various compilation steps to arrive at Tables A and B. Tables B forms the basis to derive Tables B.o and C which are 'of which' layers of Table B. Table D contains key energy indicators which can be derived from certain equations employing data elements from Tables A and B. Certain elements from Table C might as well be used to derive key energy indicators reported in Table D.
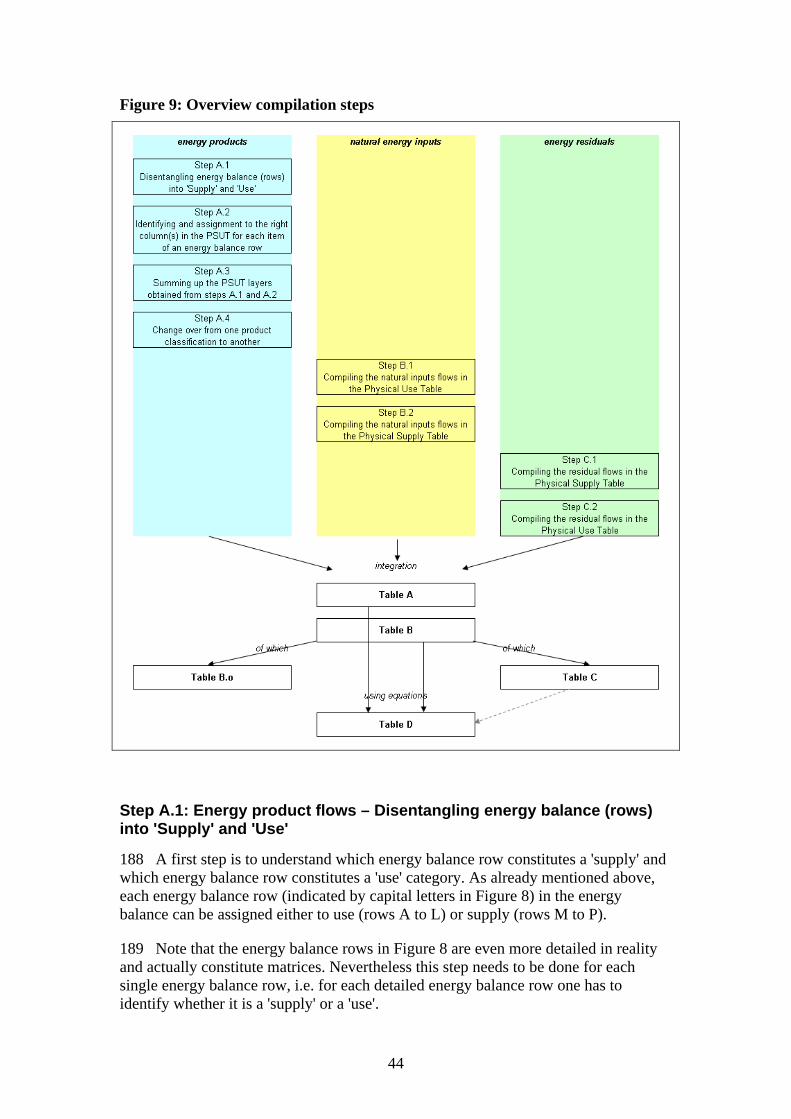
44
Figure 9: Overview compilation steps
Step A.1: Energy product flows – Disentangling ener gy balance (rows) into 'Supply' and 'Use'
188 A first step is to understand which energy balance row constitutes a 'supply' and which energy balance row constitutes a 'use' category. As already mentioned above, each energy balance row (indicated by capital letters in Figure 8) in the energy balance can be assigned either to use (rows A to L) or supply (rows M to P).
189 Note that the energy balance rows in Figure 8 are even more detailed in reality and actually constitute matrices. Nevertheless this step needs to be done for each single energy balance row, i.e. for each detailed energy balance row one has to identify whether it is a 'supply' or a 'use'.
45
At a later stage, an annex will have be added to the manual showing how the various positions, i.e. rows, of the energy balance correspond to the columns (i.e. destinations and origins of energy flows) in the energy PSUTs.
Step A.2: Energy products – Identifying and assignm ent to the right column(s) in the PSUT for each item of an energy ba lance row
190 Second step is to identify the correct column(s) in the Physical Supply/Use Table (i.e. NACE industries, households, accumulation, rest of the world, environment) where to move the respective energy product flows contained in energy balance row.
191 In many cases the row heading of the energy balance gives already some orientation which PSUT column(s) (e.g. NACE industry) might be concerned. E.g. the row headings in the energy balance for final energy consumption by industries indicate which NACE industries constitute the respective destination.
192 This second step of assigning each energy balance row to PSUT columns can be illustrated with the help of matrix algebra (see Figure 10). In a first step the energy balance row vector has to be diagonalised resulting in a matrix with the dimension product by product. The diagonalised energy balance row is multiplied with a so-called 'allocation matrix'.
193 The allocation matrix has the dimension products by PSUT-column-headings (i.e. NACE industries and others). It is a kind of 'bridge' transferring the energy balance row into the format of a product by PSUT column matrix.
Figure 10: Energy product flows - Transforming single energy balance rows into the format of Supply/Use tables employing correspondence matrix
194 The correspondence matrix contains values between '0' and '1'. A correspondence matrix value of '1' assigns the respective cell value of the energy balance row to exactly one PSUT column. This is the 'easy' case, where a cell value of the energy balance row corresponds to one and only one PSUT column.
195 The more difficult case is if one cell value of the energy balance row needs to be attributed and distributed over various PSUT columns. In this case the correspondence matrix will contain various values between '0' and '1' (e.g. 0.5, 0.3, and 0.2) the sum of which must be exactly '1'. Like this the initial value of the energy balance row is distributed proportionally to these values (e.g. '0.5' in the correspondence matrix
46
implies that 50% of the initial value in the energy balance row is moved to the respective PSUT column).
196 To derive the correspondence matrix values one needs auxiliary information going beyond the information contained in energy statistics. Typical socio-economic auxiliary information can be employment by NACE industries or other economic statistics.
197 Step A.2 is repeated for each single energy balance row. At the end, one will obtain matrices in the PSUT format for each energy balance row. Depending on the character of the respective energy balance row, these matrices constitute either Physical Supply Tables or Physical Use Tables. These matrices are called PSUT layers.
198 Note that so far we have 'populated' these PSUT layers only with energy product flows (flows of natural energy inputs and energy residuals will follow at later stages).
Step A.3: Energy products – Summing up the PSUT lay ers obtained from steps A.1 and A.2.
199 In step A.3 the PSUT layers obtained from the previous steps are summed up. This is illustrated in Figure 5. The summing is done separately for both: the Supply and the Use.
200 As a result of step A.3 one obtains two totals:
� Physical Supply Table of energy products � Physical Use table of energy products
201 Note that at this stage the energy products are still classified in the classification for Eurostat's energy statistics/balances.
202 Figure 11 illustrates the compilation steps A.1 to A.3.
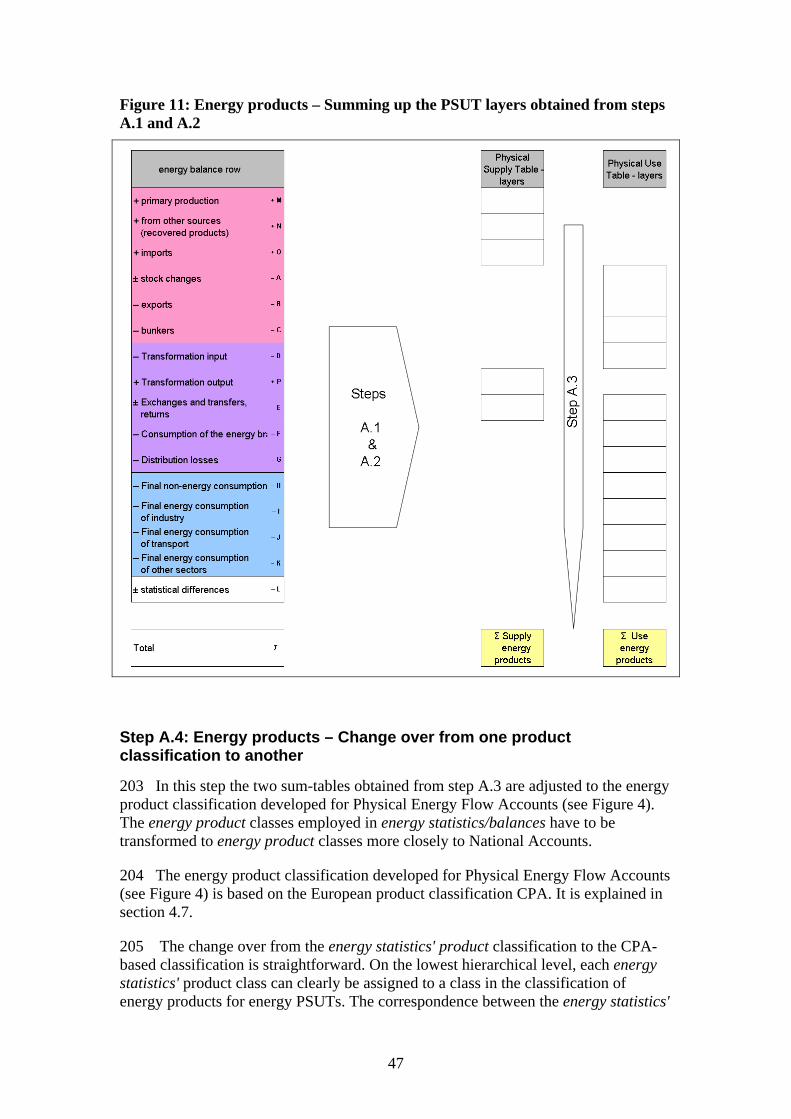
47
Figure 11: Energy products – Summing up the PSUT layers obtained from steps A.1 and A.2
Step A.4: Energy products – Change over from one pr oduct classification to another
203 In this step the two sum-tables obtained from step A.3 are adjusted to the energy product classification developed for Physical Energy Flow Accounts (see Figure 4). The energy product classes employed in energy statistics/balances have to be transformed to energy product classes more closely to National Accounts.
204 The energy product classification developed for Physical Energy Flow Accounts (see Figure 4) is based on the European product classification CPA. It is explained in section 4.7.
205 The change over from the energy statistics' product classification to the CPA-based classification is straightforward. On the lowest hierarchical level, each energy statistics' product class can clearly be assigned to a class in the classification of energy products for energy PSUTs. The correspondence between the energy statistics'
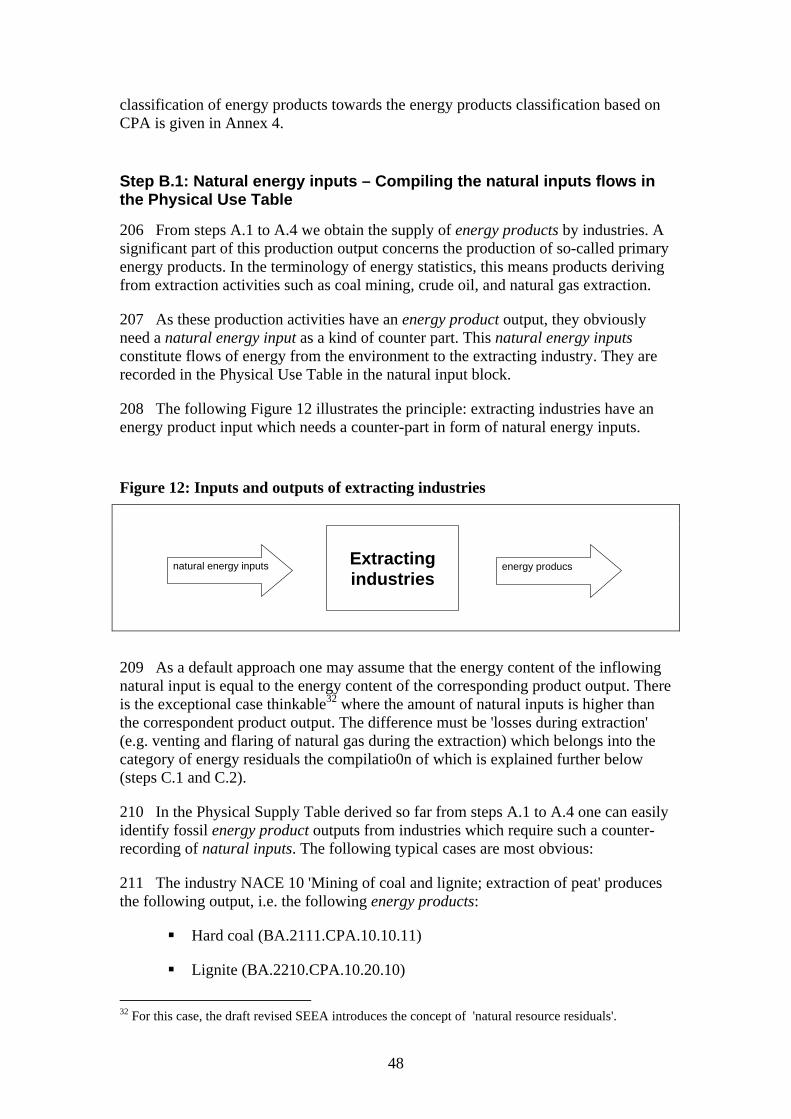
48
classification of energy products towards the energy products classification based on CPA is given in Annex 4.
Step B.1: Natural energy inputs – Compiling the nat ural inputs flows in the Physical Use Table
206 From steps A.1 to A.4 we obtain the supply of energy products by industries. A significant part of this production output concerns the production of so-called primary energy products. In the terminology of energy statistics, this means products deriving from extraction activities such as coal mining, crude oil, and natural gas extraction.
207 As these production activities have an energy product output, they obviously need a natural energy input as a kind of counter part. This natural energy inputs constitute flows of energy from the environment to the extracting industry. They are recorded in the Physical Use Table in the natural input block.
208 The following Figure 12 illustrates the principle: extracting industries have an energy product input which needs a counter-part in form of natural energy inputs.
Figure 12: Inputs and outputs of extracting industries
Extracting industries
natural energy inputs energy producs
209 As a default approach one may assume that the energy content of the inflowing natural input is equal to the energy content of the corresponding product output. There is the exceptional case thinkable32 where the amount of natural inputs is higher than the correspondent product output. The difference must be 'losses during extraction' (e.g. venting and flaring of natural gas during the extraction) which belongs into the category of energy residuals the compilatio0n of which is explained further below (steps C.1 and C.2).
210 In the Physical Supply Table derived so far from steps A.1 to A.4 one can easily identify fossil energy product outputs from industries which require such a counter-recording of natural inputs. The following typical cases are most obvious:
211 The industry NACE 10 'Mining of coal and lignite; extraction of peat' produces the following output, i.e. the following energy products:
� Hard coal (BA.2111.CPA.10.10.11)
� Lignite (BA.2210.CPA.10.20.10)
32 For this case, the draft revised SEEA introduces the concept of 'natural resource residuals'.
49
� Peat (BA.2310.CPA.10.30.10)
The corresponding natural energy inputs into industry NACE 10 are the following:
� Hard coal (resource) (AA.2111)
� Lignite (resource) (AA.2210)
� Peat (resource) (AA.2310)
212 Outputs from industry NACE 11 'Extraction of crude petroleum and natural gas' are the following energy products:
� Crude oil (BA.3105.CPA.11.10.10)
� Natural gas liquids (BA.3106.CPA.11.10.10)
� Other hydrocarbons (excl. bio) (BA.3193.CPA.11.10.10)
� Natural gas (BA.4100.CPA.11.10.20)
The corresponding natural energy inputs into industry NACE 11 are the following:
� Crude oil (resource) (AA.3105)
� Natural gas liquids (resource) (AA. 3106)
� Other hydrocarbons (resource: Natural bitumen, extra heavy oil, shale oil, sandoil and others n.e.c. etc. excl. bio) (AA.3193)
� Natural gas (resource) (AA.4100)
213 Industry NACE 12 'Mining of uranium and thorium ores' produces the energy product:
� Uranium and thorium ores (BA.5100a.CPA.12.00.10)
The corresponding natural energy inputs into industry NACE 12 is:
� Uranium and thorium ores (resource: energy content of nuclear fuels, i.e. equivalent to nuclear heat) (AA.5100)
214 The above sections introduced the classical mining industries having non-renewable natural inputs which need to be recorded in the natural input block of Table B ('use of natural energy inputs by industries'). The inputs and outputs to these industries are summarised in Figure 13.
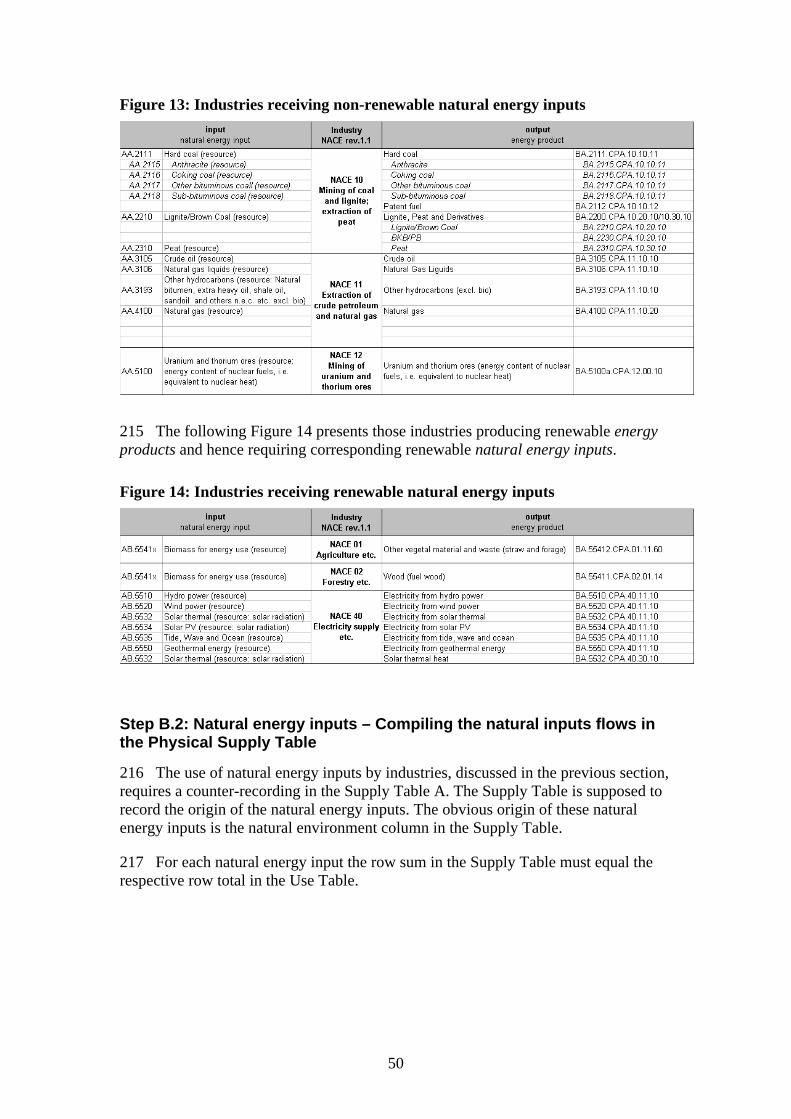
50
Figure 13: Industries receiving non-renewable natural energy inputs
215 The following Figure 14 presents those industries producing renewable energy products and hence requiring corresponding renewable natural energy inputs.
Figure 14: Industries receiving renewable natural energy inputs
Step B.2: Natural energy inputs – Compiling the nat ural inputs flows in the Physical Supply Table
216 The use of natural energy inputs by industries, discussed in the previous section, requires a counter-recording in the Supply Table A. The Supply Table is supposed to record the origin of the natural energy inputs. The obvious origin of these natural energy inputs is the natural environment column in the Supply Table.
217 For each natural energy input the row sum in the Supply Table must equal the respective row total in the Use Table.
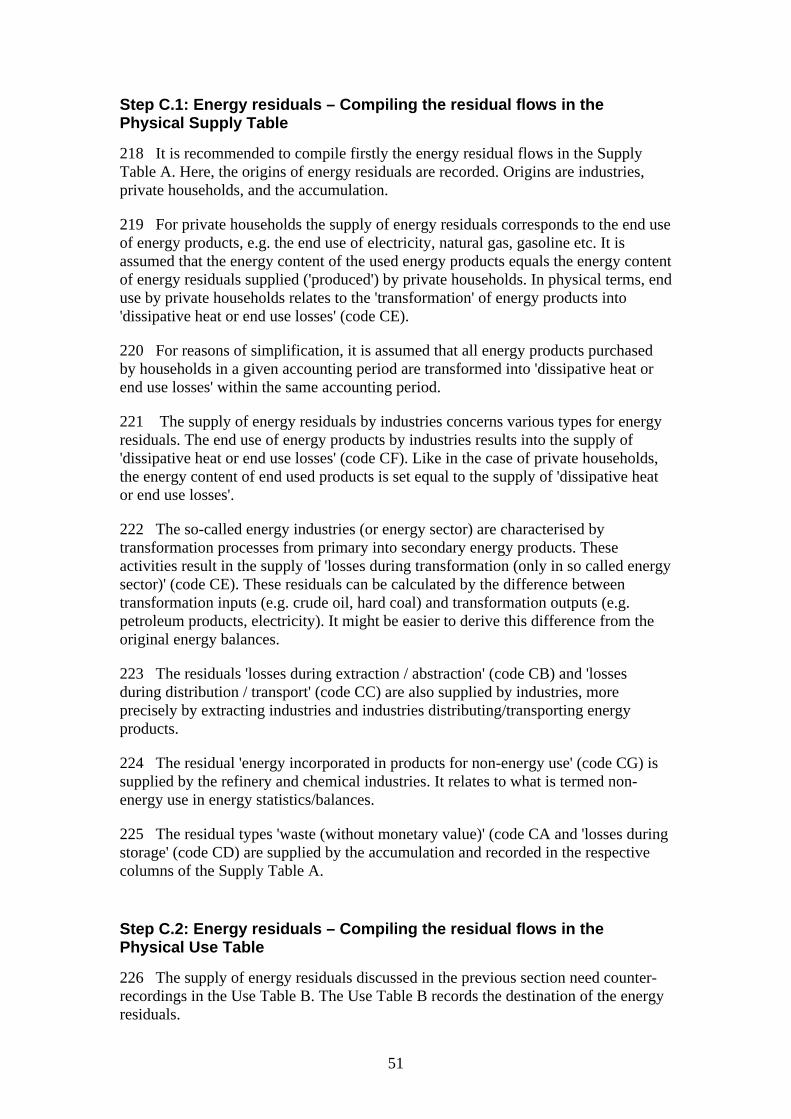
51
Step C.1: Energy residuals – Compiling the residual flows in the Physical Supply Table
218 It is recommended to compile firstly the energy residual flows in the Supply Table A. Here, the origins of energy residuals are recorded. Origins are industries, private households, and the accumulation.
219 For private households the supply of energy residuals corresponds to the end use of energy products, e.g. the end use of electricity, natural gas, gasoline etc. It is assumed that the energy content of the used energy products equals the energy content of energy residuals supplied ('produced') by private households. In physical terms, end use by private households relates to the 'transformation' of energy products into 'dissipative heat or end use losses' (code CE).
220 For reasons of simplification, it is assumed that all energy products purchased by households in a given accounting period are transformed into 'dissipative heat or end use losses' within the same accounting period.
221 The supply of energy residuals by industries concerns various types for energy residuals. The end use of energy products by industries results into the supply of 'dissipative heat or end use losses' (code CF). Like in the case of private households, the energy content of end used products is set equal to the supply of 'dissipative heat or end use losses'.
222 The so-called energy industries (or energy sector) are characterised by transformation processes from primary into secondary energy products. These activities result in the supply of 'losses during transformation (only in so called energy sector)' (code CE). These residuals can be calculated by the difference between transformation inputs (e.g. crude oil, hard coal) and transformation outputs (e.g. petroleum products, electricity). It might be easier to derive this difference from the original energy balances.
223 The residuals 'losses during extraction / abstraction' (code CB) and 'losses during distribution / transport' (code CC) are also supplied by industries, more precisely by extracting industries and industries distributing/transporting energy products.
224 The residual 'energy incorporated in products for non-energy use' (code CG) is supplied by the refinery and chemical industries. It relates to what is termed non-energy use in energy statistics/balances.
225 The residual types 'waste (without monetary value)' (code CA and 'losses during storage' (code CD) are supplied by the accumulation and recorded in the respective columns of the Supply Table A.
Step C.2: Energy residuals – Compiling the residual flows in the Physical Use Table
226 The supply of energy residuals discussed in the previous section need counter-recordings in the Use Table B. The Use Table B records the destination of the energy residuals.
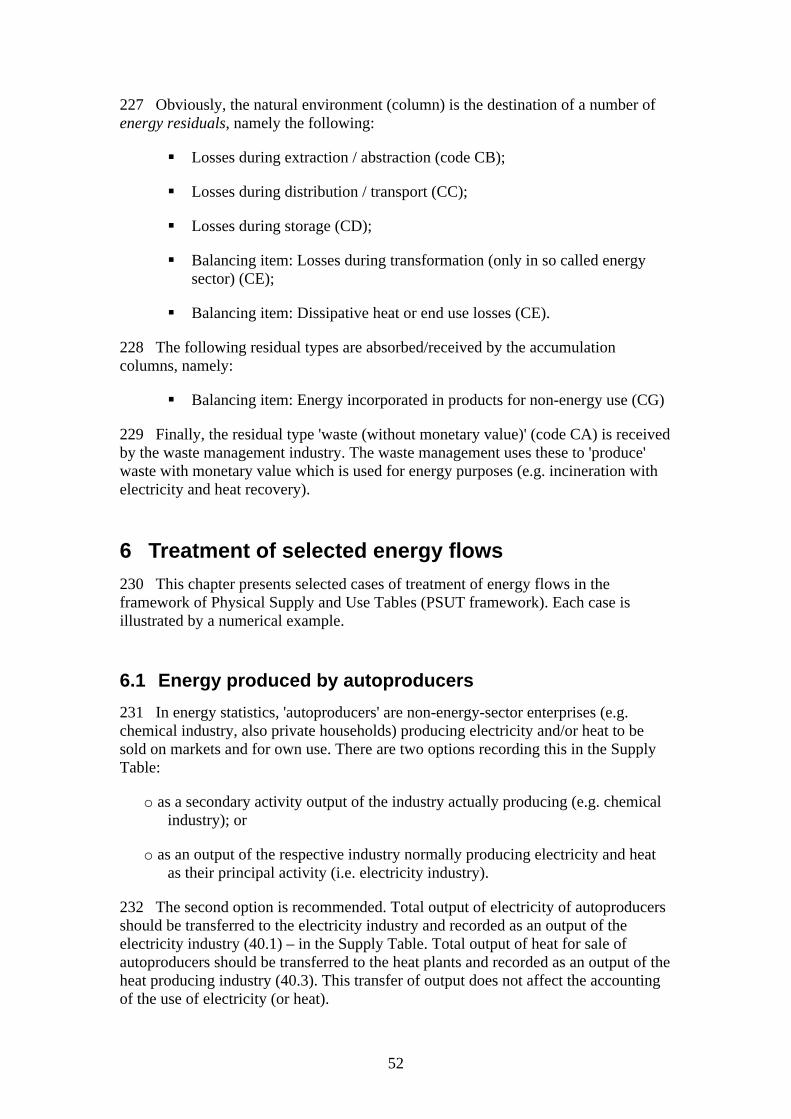
52
227 Obviously, the natural environment (column) is the destination of a number of energy residuals, namely the following:
� Losses during extraction / abstraction (code CB);
� Losses during distribution / transport (CC);
� Losses during storage (CD);
� Balancing item: Losses during transformation (only in so called energy sector) (CE);
� Balancing item: Dissipative heat or end use losses (CE).
228 The following residual types are absorbed/received by the accumulation columns, namely:
� Balancing item: Energy incorporated in products for non-energy use (CG)
229 Finally, the residual type 'waste (without monetary value)' (code CA) is received by the waste management industry. The waste management uses these to 'produce' waste with monetary value which is used for energy purposes (e.g. incineration with electricity and heat recovery).
6 Treatment of selected energy flows 230 This chapter presents selected cases of treatment of energy flows in the framework of Physical Supply and Use Tables (PSUT framework). Each case is illustrated by a numerical example.
6.1 Energy produced by autoproducers
231 In energy statistics, 'autoproducers' are non-energy-sector enterprises (e.g. chemical industry, also private households) producing electricity and/or heat to be sold on markets and for own use. There are two options recording this in the Supply Table:
o as a secondary activity output of the industry actually producing (e.g. chemical industry); or
o as an output of the respective industry normally producing electricity and heat as their principal activity (i.e. electricity industry).
232 The second option is recommended. Total output of electricity of autoproducers should be transferred to the electricity industry and recorded as an output of the electricity industry (40.1) – in the Supply Table. Total output of heat for sale of autoproducers should be transferred to the heat plants and recorded as an output of the heat producing industry (40.3). This transfer of output does not affect the accounting of the use of electricity (or heat).
53
233 With the transfer of the output also a transfer of the inputs is required. The fuels used for the generation of electricity and/or heat sold by the autoproducers have to be moved to the inputs to the main producer industry (40.1 or 40.3). Fuels used to produce heat for own uses do not have to be transferred – they have to be recorded at the industry which is using this heat by itself.
234 The output of autoproducers and the corresponding fuel input are derivable from the energy balance. The energy balance offers various autoproducer-positions in the transformation input and output blocks33. For each type of plants (electricity, heat, combined heat and electricity) transformation input is given next to transformation output. In addition, own use in electricity, heat, and CHP plants is provided. The difference between transformation input and output is made up by own used output and transformation losses.
Figure 15: Numerical example for treatment of electricity produced by autoproducer (NACE 24)
235 Figure 15 presents a numerical example for the recording of autoproducer electricity. In this example, the chemical industry, NACE 24, is assumed to be autoproducer of 50 units34 electricity. To do so, the chemical industry has a transformation input of 140 units hard coal. This makes a transformation loss of 90 units (140 – 50 = 90). These three figures have to be moved to the column of NACE 40.1 (electricity supply), he industry which usually produces electricity.
236 The major part of the autoproducer output is used by households (45 out of 50). The autoproducer (i.e. chemical industry, NACE 24) has an own use of 5 units. This own use is recorded in the column of the original autoproducer (i.e. NACE 24) and not moved to the column of the electricity industry.
6.2 Biomass as an energy carrier flow
237 Energy statistics/balances record the energy flow of biomass only in so far as it is used for energy purposes. So do also Physical Energy Flow Accounts. Biomass flows are presented in Joule, i.e. it is the energy content of biomass that is recorded.
238 The following table shows the list of energy products which are made of biomass, next to the NACE rev1.1 industries producing these as principal activity:
33 Cf Energy Regulation 1099/2008, annex B, 1.2.5 and 3.2.1. Inputs have to be recorded according §3.2.6. 34 Common measurement unit is Joule (see also section 3.5)
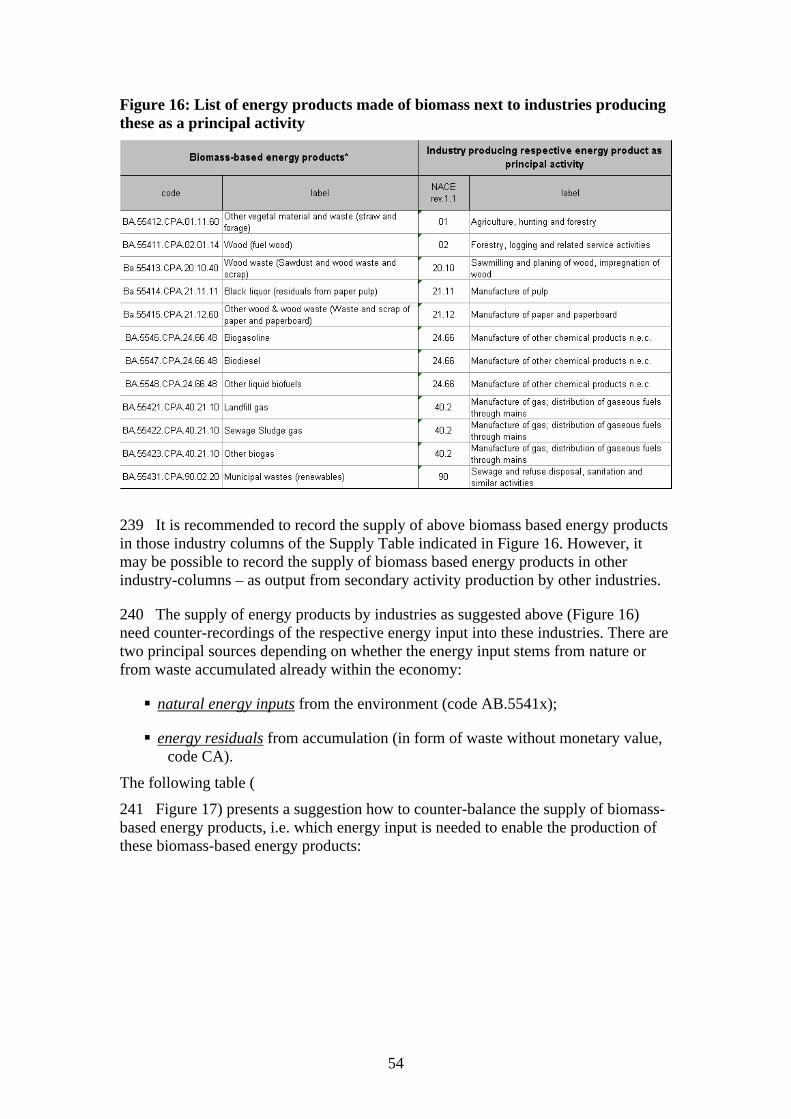
54
Figure 16: List of energy products made of biomass next to industries producing these as a principal activity
239 It is recommended to record the supply of above biomass based energy products in those industry columns of the Supply Table indicated in Figure 16. However, it may be possible to record the supply of biomass based energy products in other industry-columns – as output from secondary activity production by other industries.
240 The supply of energy products by industries as suggested above (Figure 16) need counter-recordings of the respective energy input into these industries. There are two principal sources depending on whether the energy input stems from nature or from waste accumulated already within the economy:
� natural energy inputs from the environment (code AB.5541x);
� energy residuals from accumulation (in form of waste without monetary value, code CA).
The following table (
241 Figure 17) presents a suggestion how to counter-balance the supply of biomass-based energy products, i.e. which energy input is needed to enable the production of these biomass-based energy products:
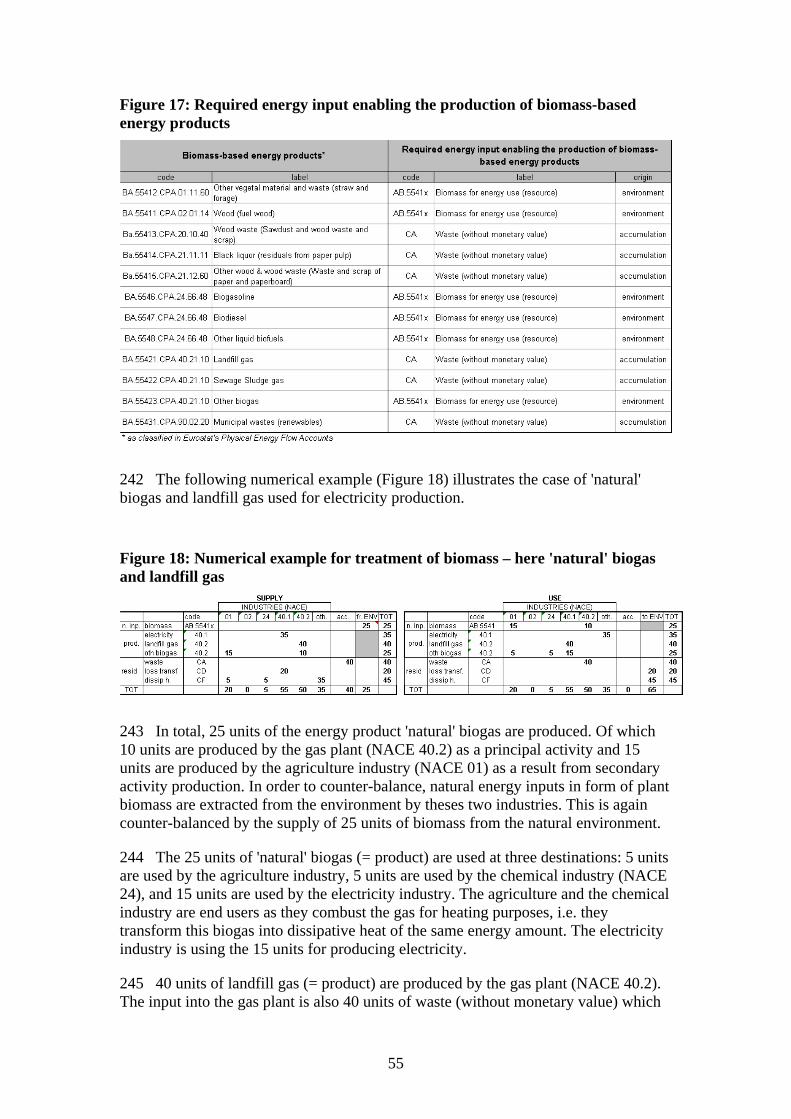
55
Figure 17: Required energy input enabling the production of biomass-based energy products
242 The following numerical example (Figure 18) illustrates the case of 'natural' biogas and landfill gas used for electricity production.
Figure 18: Numerical example for treatment of biomass – here 'natural' biogas and landfill gas
243 In total, 25 units of the energy product 'natural' biogas are produced. Of which 10 units are produced by the gas plant (NACE 40.2) as a principal activity and 15 units are produced by the agriculture industry (NACE 01) as a result from secondary activity production. In order to counter-balance, natural energy inputs in form of plant biomass are extracted from the environment by theses two industries. This is again counter-balanced by the supply of 25 units of biomass from the natural environment.
244 The 25 units of 'natural' biogas (= product) are used at three destinations: 5 units are used by the agriculture industry, 5 units are used by the chemical industry (NACE 24), and 15 units are used by the electricity industry. The agriculture and the chemical industry are end users as they combust the gas for heating purposes, i.e. they transform this biogas into dissipative heat of the same energy amount. The electricity industry is using the 15 units for producing electricity.
245 40 units of landfill gas (= product) are produced by the gas plant (NACE 40.2). The input into the gas plant is also 40 units of waste (without monetary value) which
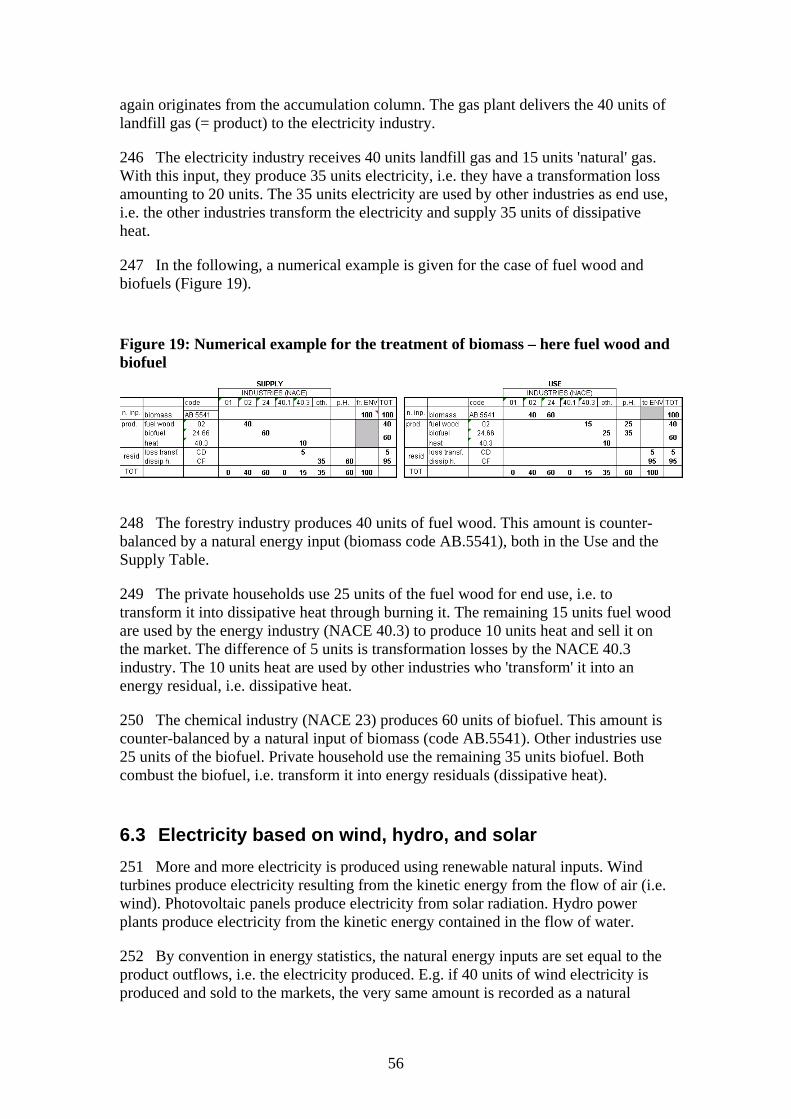
56
again originates from the accumulation column. The gas plant delivers the 40 units of landfill gas (= product) to the electricity industry.
246 The electricity industry receives 40 units landfill gas and 15 units 'natural' gas. With this input, they produce 35 units electricity, i.e. they have a transformation loss amounting to 20 units. The 35 units electricity are used by other industries as end use, i.e. the other industries transform the electricity and supply 35 units of dissipative heat.
247 In the following, a numerical example is given for the case of fuel wood and biofuels (Figure 19).
Figure 19: Numerical example for the treatment of biomass – here fuel wood and biofuel
248 The forestry industry produces 40 units of fuel wood. This amount is counter-balanced by a natural energy input (biomass code AB.5541), both in the Use and the Supply Table.
249 The private households use 25 units of the fuel wood for end use, i.e. to transform it into dissipative heat through burning it. The remaining 15 units fuel wood are used by the energy industry (NACE 40.3) to produce 10 units heat and sell it on the market. The difference of 5 units is transformation losses by the NACE 40.3 industry. The 10 units heat are used by other industries who 'transform' it into an energy residual, i.e. dissipative heat.
250 The chemical industry (NACE 23) produces 60 units of biofuel. This amount is counter-balanced by a natural input of biomass (code AB.5541). Other industries use 25 units of the biofuel. Private household use the remaining 35 units biofuel. Both combust the biofuel, i.e. transform it into energy residuals (dissipative heat).
6.3 Electricity based on wind, hydro, and solar
251 More and more electricity is produced using renewable natural inputs. Wind turbines produce electricity resulting from the kinetic energy from the flow of air (i.e. wind). Photovoltaic panels produce electricity from solar radiation. Hydro power plants produce electricity from the kinetic energy contained in the flow of water.
252 By convention in energy statistics, the natural energy inputs are set equal to the product outflows, i.e. the electricity produced. E.g. if 40 units of wind electricity is produced and sold to the markets, the very same amount is recorded as a natural
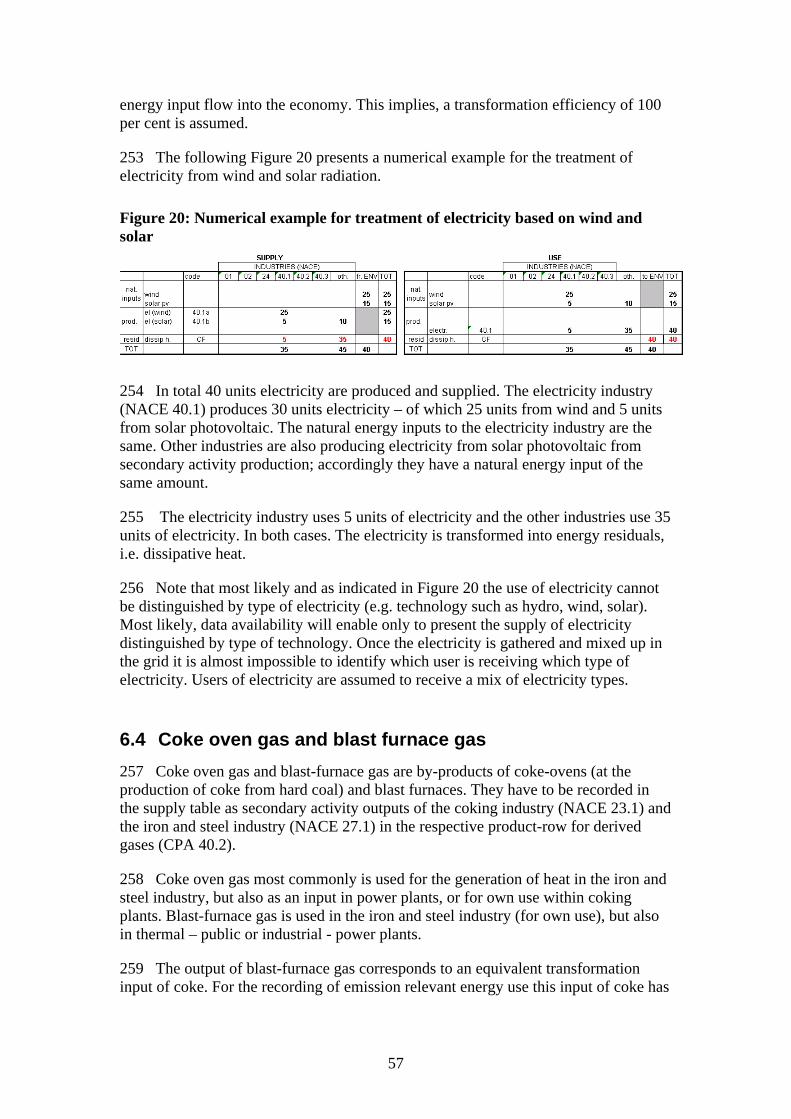
57
energy input flow into the economy. This implies, a transformation efficiency of 100 per cent is assumed.
253 The following Figure 20 presents a numerical example for the treatment of electricity from wind and solar radiation.
Figure 20: Numerical example for treatment of electricity based on wind and solar
254 In total 40 units electricity are produced and supplied. The electricity industry (NACE 40.1) produces 30 units electricity – of which 25 units from wind and 5 units from solar photovoltaic. The natural energy inputs to the electricity industry are the same. Other industries are also producing electricity from solar photovoltaic from secondary activity production; accordingly they have a natural energy input of the same amount.
255 The electricity industry uses 5 units of electricity and the other industries use 35 units of electricity. In both cases. The electricity is transformed into energy residuals, i.e. dissipative heat.
256 Note that most likely and as indicated in Figure 20 the use of electricity cannot be distinguished by type of electricity (e.g. technology such as hydro, wind, solar). Most likely, data availability will enable only to present the supply of electricity distinguished by type of technology. Once the electricity is gathered and mixed up in the grid it is almost impossible to identify which user is receiving which type of electricity. Users of electricity are assumed to receive a mix of electricity types.
6.4 Coke oven gas and blast furnace gas
257 Coke oven gas and blast-furnace gas are by-products of coke-ovens (at the production of coke from hard coal) and blast furnaces. They have to be recorded in the supply table as secondary activity outputs of the coking industry (NACE 23.1) and the iron and steel industry (NACE 27.1) in the respective product-row for derived gases (CPA 40.2).
258 Coke oven gas most commonly is used for the generation of heat in the iron and steel industry, but also as an input in power plants, or for own use within coking plants. Blast-furnace gas is used in the iron and steel industry (for own use), but also in thermal – public or industrial - power plants.
259 The output of blast-furnace gas corresponds to an equivalent transformation input of coke. For the recording of emission relevant energy use this input of coke has
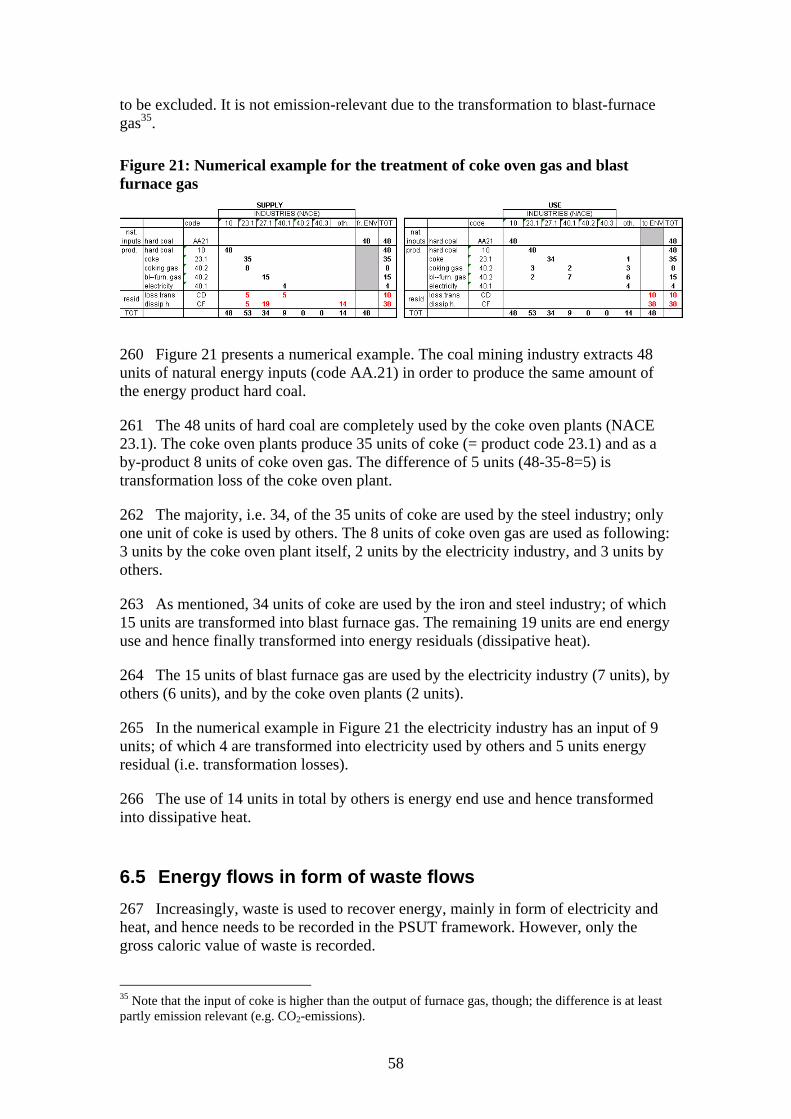
58
to be excluded. It is not emission-relevant due to the transformation to blast-furnace gas35.
Figure 21: Numerical example for the treatment of coke oven gas and blast furnace gas
260 Figure 21 presents a numerical example. The coal mining industry extracts 48 units of natural energy inputs (code AA.21) in order to produce the same amount of the energy product hard coal.
261 The 48 units of hard coal are completely used by the coke oven plants (NACE 23.1). The coke oven plants produce 35 units of coke (= product code 23.1) and as a by-product 8 units of coke oven gas. The difference of 5 units (48-35-8=5) is transformation loss of the coke oven plant.
262 The majority, i.e. 34, of the 35 units of coke are used by the steel industry; only one unit of coke is used by others. The 8 units of coke oven gas are used as following: 3 units by the coke oven plant itself, 2 units by the electricity industry, and 3 units by others.
263 As mentioned, 34 units of coke are used by the iron and steel industry; of which 15 units are transformed into blast furnace gas. The remaining 19 units are end energy use and hence finally transformed into energy residuals (dissipative heat).
264 The 15 units of blast furnace gas are used by the electricity industry (7 units), by others (6 units), and by the coke oven plants (2 units).
265 In the numerical example in Figure 21 the electricity industry has an input of 9 units; of which 4 are transformed into electricity used by others and 5 units energy residual (i.e. transformation losses).
266 The use of 14 units in total by others is energy end use and hence transformed into dissipative heat.
6.5 Energy flows in form of waste flows
267 Increasingly, waste is used to recover energy, mainly in form of electricity and heat, and hence needs to be recorded in the PSUT framework. However, only the gross caloric value of waste is recorded.
35 Note that the input of coke is higher than the output of furnace gas, though; the difference is at least partly emission relevant (e.g. CO2-emissions).
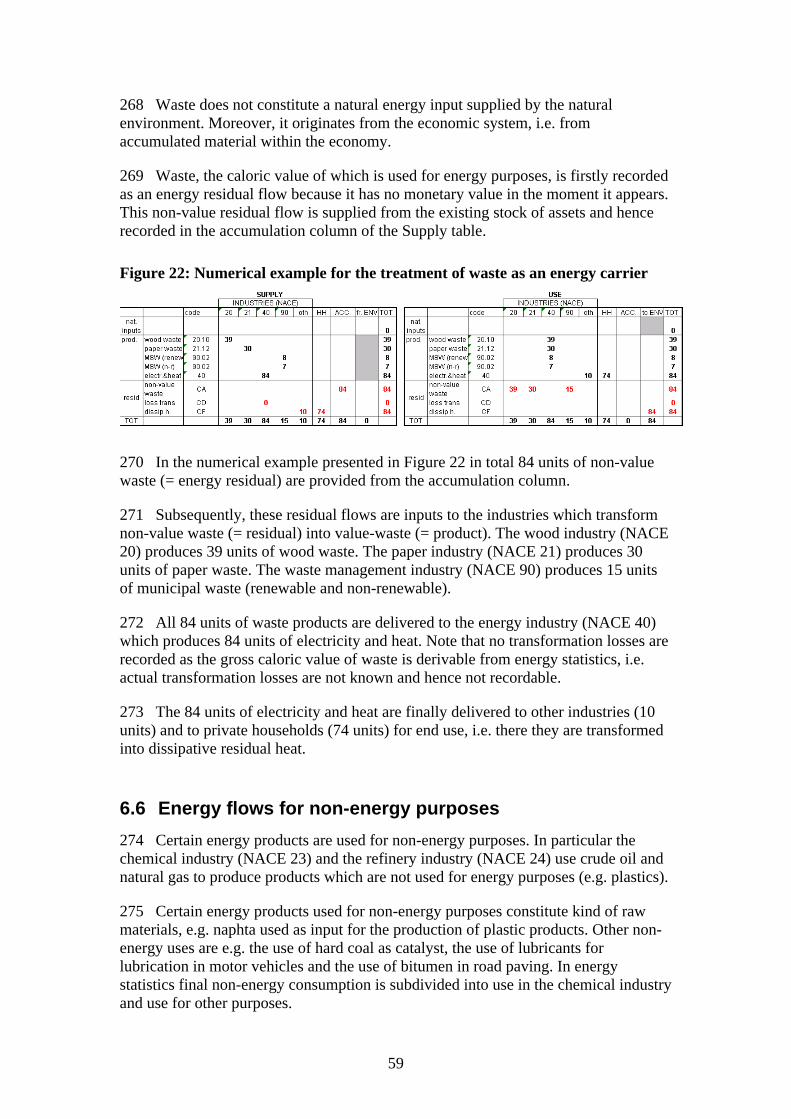
59
268 Waste does not constitute a natural energy input supplied by the natural environment. Moreover, it originates from the economic system, i.e. from accumulated material within the economy.
269 Waste, the caloric value of which is used for energy purposes, is firstly recorded as an energy residual flow because it has no monetary value in the moment it appears. This non-value residual flow is supplied from the existing stock of assets and hence recorded in the accumulation column of the Supply table.
Figure 22: Numerical example for the treatment of waste as an energy carrier
270 In the numerical example presented in Figure 22 in total 84 units of non-value waste (= energy residual) are provided from the accumulation column.
271 Subsequently, these residual flows are inputs to the industries which transform non-value waste (= residual) into value-waste (= product). The wood industry (NACE 20) produces 39 units of wood waste. The paper industry (NACE 21) produces 30 units of paper waste. The waste management industry (NACE 90) produces 15 units of municipal waste (renewable and non-renewable).
272 All 84 units of waste products are delivered to the energy industry (NACE 40) which produces 84 units of electricity and heat. Note that no transformation losses are recorded as the gross caloric value of waste is derivable from energy statistics, i.e. actual transformation losses are not known and hence not recordable.
273 The 84 units of electricity and heat are finally delivered to other industries (10 units) and to private households (74 units) for end use, i.e. there they are transformed into dissipative residual heat.
6.6 Energy flows for non-energy purposes
274 Certain energy products are used for non-energy purposes. In particular the chemical industry (NACE 23) and the refinery industry (NACE 24) use crude oil and natural gas to produce products which are not used for energy purposes (e.g. plastics).
275 Certain energy products used for non-energy purposes constitute kind of raw materials, e.g. naphta used as input for the production of plastic products. Other non-energy uses are e.g. the use of hard coal as catalyst, the use of lubricants for lubrication in motor vehicles and the use of bitumen in road paving. In energy statistics final non-energy consumption is subdivided into use in the chemical industry and use for other purposes.
60
276 The use of energy products for non energy purposes (e.g. naphta, lubricants) by industries and private households is recorded in the Physical Use Table at the interception of the respective user-column (industry or households) and the respective product row (e.g. naphta, lubricants).
277 The use of a non-energy product needs to be counterbalanced in the Physical Supply Table. This is done in form of the supply of a fictive energy residual or balancing item termed "Energy incorporated in products for non-energy use" (code CG). I.e. the industry/household using the energy product for non-energy purposes is supplying the same amount of energy in form of the aforementioned energy residual/balancing item.
278 The supply of the energy residual needs to be counterbalanced in order to balance the system row-wise. I.e. the energy residual "Energy incorporated in products for non-energy use" (code CG) needs to be recorded in the Physical Use Table as well. This is done in the accumulation column of the Physical Use Table. The energy incorporated in products for non-energy use is indeed stocked in the economy and may be used for energy purposes at later stages. E.g. oil is used several years to lubricate an engine and afterwards it becomes waste oil which may be incinerated with energy recovery.
6.7 Natural gas
279 The product 'natural gas' (CPA 11.10.2) is produced by the industry 'Extraction of crude petroleum and natural gas' (NACE 11.10). The supply of the product natural gas is shown in the Physical Supply Table in the respective interception of the gas mining industry column and the product row for natural gas.
280 The product output from the gas and oil mining industry needs to be counterbalanced by a natural energy input of gas (code AA.4100 'natural gas (resource)') into this very same industry.
281 In energy statistics production includes gas originating from the extraction of crude oil and gas used by the extraction industry itself for the processing of the extracted gas (to get marketable production)36. This applies also to Physical Energy Flow Accounts, i.e. the product output of natural gas is recorded gross; including potential own use by the extracting industry.
282 In energy statistics gas vented, flared, or re-injected should not be included in the recording of production37. This applies also to Physical Energy Flow Accounts. Here, the production output of natural gas is net of losses during extraction.
283 However, the natural energy input of natural gas (resource) into the extracting industry is recorded gross of later losses through venting, flaring, or re-injections.
284 A numerical example for the flow of natural gas in the Physical Supply and Use Table framework is given in Figure 23.
36 Cf. Energy Statistics Manual, IEA/OECD 2005, chapter “Natural gas supply”, p. 60-61. 37 Cf. IEA/OECD 2005, p. 61, the volume of gas vented and flared has to be reported separately.
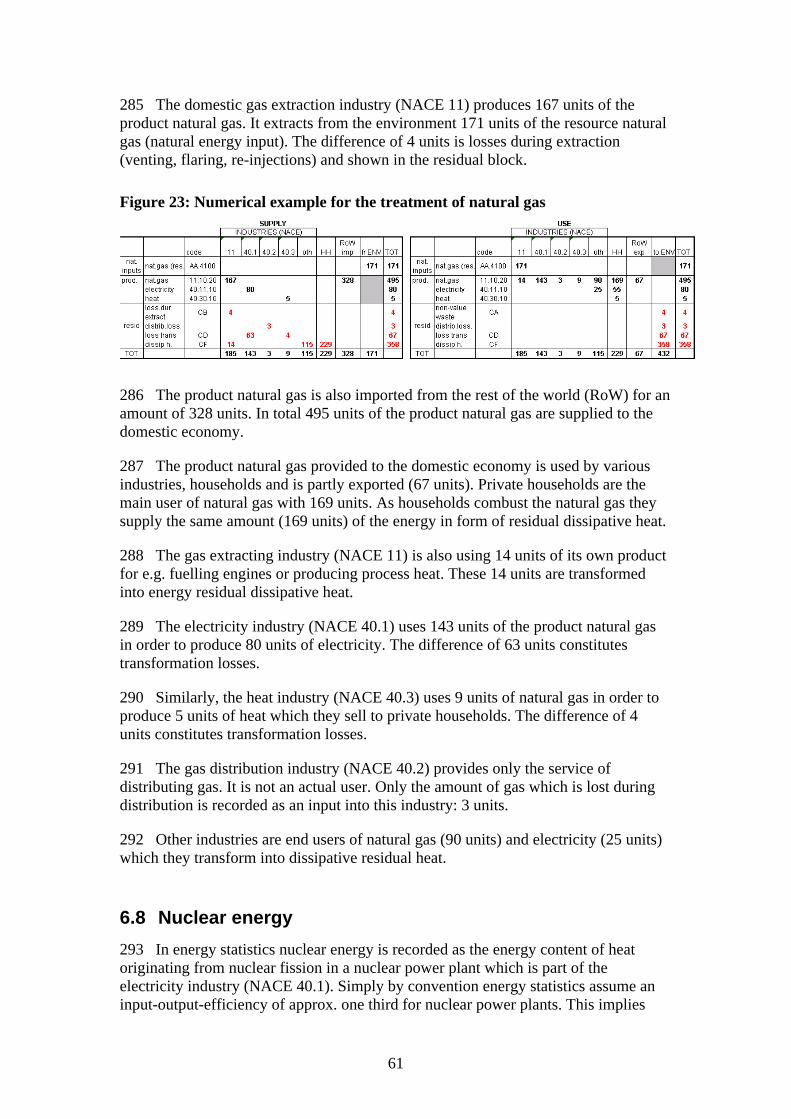
61
285 The domestic gas extraction industry (NACE 11) produces 167 units of the product natural gas. It extracts from the environment 171 units of the resource natural gas (natural energy input). The difference of 4 units is losses during extraction (venting, flaring, re-injections) and shown in the residual block.
Figure 23: Numerical example for the treatment of natural gas
286 The product natural gas is also imported from the rest of the world (RoW) for an amount of 328 units. In total 495 units of the product natural gas are supplied to the domestic economy.
287 The product natural gas provided to the domestic economy is used by various industries, households and is partly exported (67 units). Private households are the main user of natural gas with 169 units. As households combust the natural gas they supply the same amount (169 units) of the energy in form of residual dissipative heat.
288 The gas extracting industry (NACE 11) is also using 14 units of its own product for e.g. fuelling engines or producing process heat. These 14 units are transformed into energy residual dissipative heat.
289 The electricity industry (NACE 40.1) uses 143 units of the product natural gas in order to produce 80 units of electricity. The difference of 63 units constitutes transformation losses.
290 Similarly, the heat industry (NACE 40.3) uses 9 units of natural gas in order to produce 5 units of heat which they sell to private households. The difference of 4 units constitutes transformation losses.
291 The gas distribution industry (NACE 40.2) provides only the service of distributing gas. It is not an actual user. Only the amount of gas which is lost during distribution is recorded as an input into this industry: 3 units.
292 Other industries are end users of natural gas (90 units) and electricity (25 units) which they transform into dissipative residual heat.
6.8 Nuclear energy
293 In energy statistics nuclear energy is recorded as the energy content of heat originating from nuclear fission in a nuclear power plant which is part of the electricity industry (NACE 40.1). Simply by convention energy statistics assume an input-output-efficiency of approx. one third for nuclear power plants. This implies
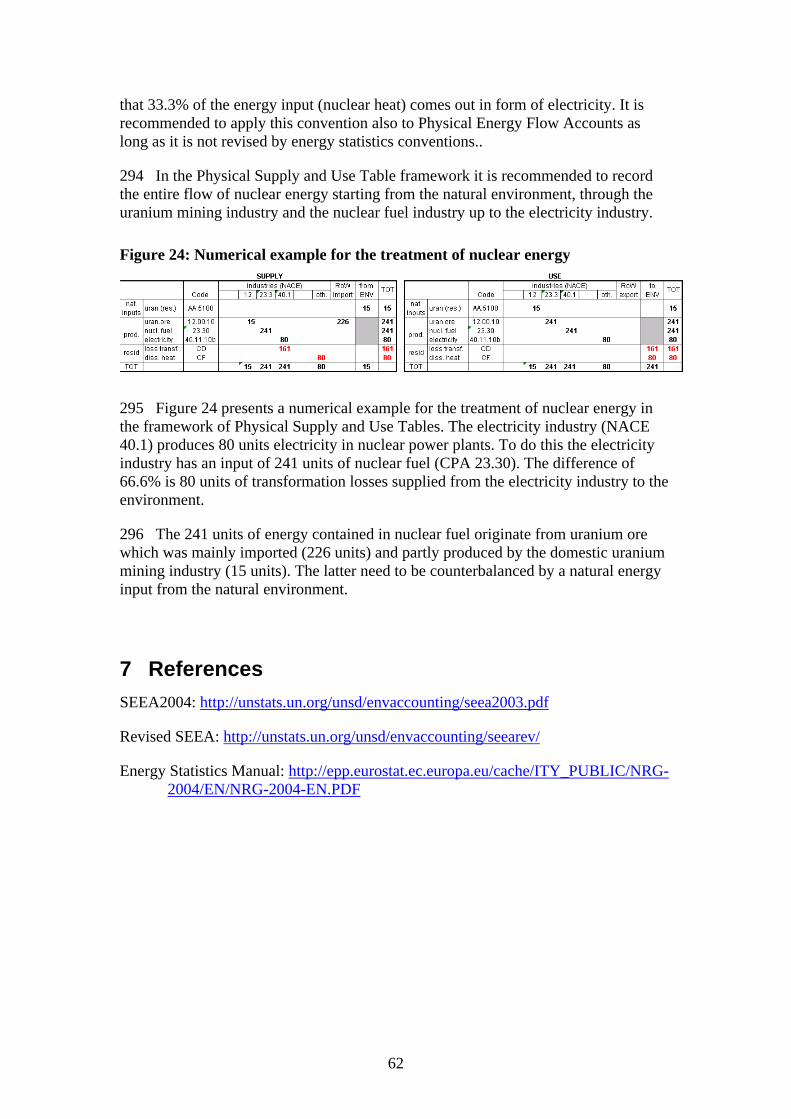
62
that 33.3% of the energy input (nuclear heat) comes out in form of electricity. It is recommended to apply this convention also to Physical Energy Flow Accounts as long as it is not revised by energy statistics conventions..
294 In the Physical Supply and Use Table framework it is recommended to record the entire flow of nuclear energy starting from the natural environment, through the uranium mining industry and the nuclear fuel industry up to the electricity industry.
Figure 24: Numerical example for the treatment of nuclear energy
295 Figure 24 presents a numerical example for the treatment of nuclear energy in the framework of Physical Supply and Use Tables. The electricity industry (NACE 40.1) produces 80 units electricity in nuclear power plants. To do this the electricity industry has an input of 241 units of nuclear fuel (CPA 23.30). The difference of 66.6% is 80 units of transformation losses supplied from the electricity industry to the environment.
296 The 241 units of energy contained in nuclear fuel originate from uranium ore which was mainly imported (226 units) and partly produced by the domestic uranium mining industry (15 units). The latter need to be counterbalanced by a natural energy input from the natural environment.
7 References SEEA2004: http://unstats.un.org/unsd/envaccounting/seea2003.pdf
Revised SEEA: http://unstats.un.org/unsd/envaccounting/seearev/
Energy Statistics Manual: http://epp.eurostat.ec.europa.eu/cache/ITY_PUBLIC/NRG-2004/EN/NRG-2004-EN.PDF
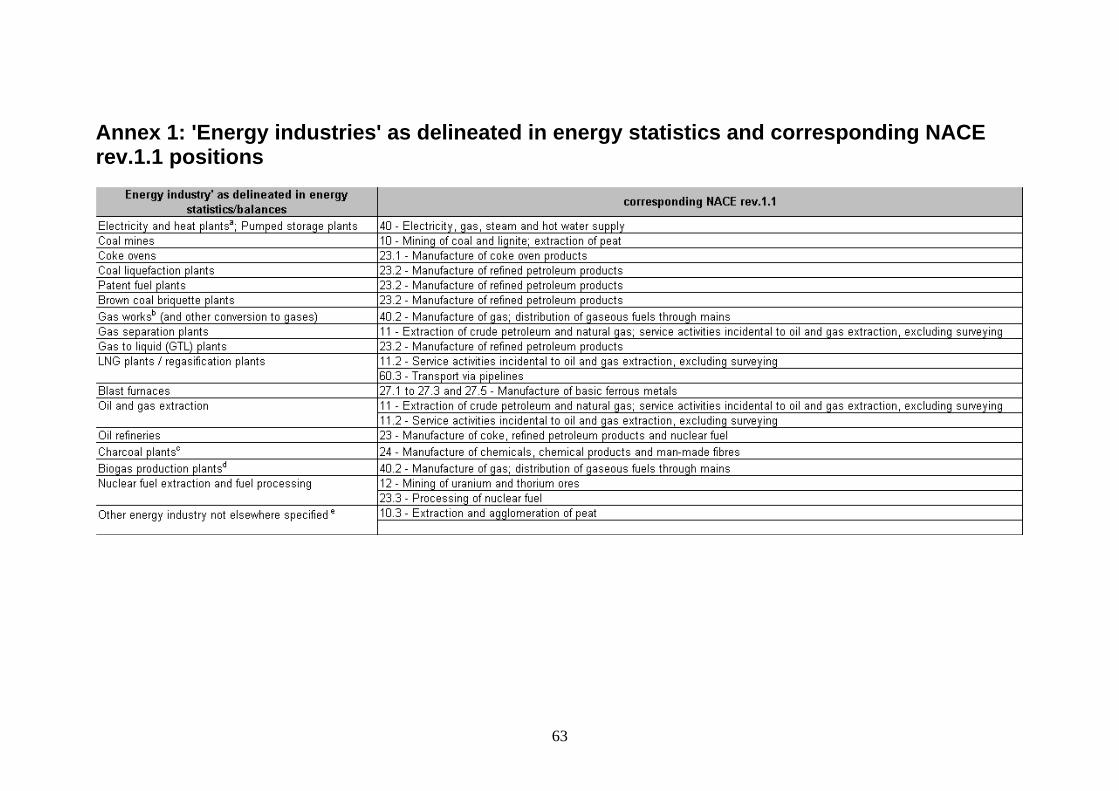
63
Annex 1: 'Energy industries' as delineated in energy statistics and corresponding NACE rev.1.1 positions
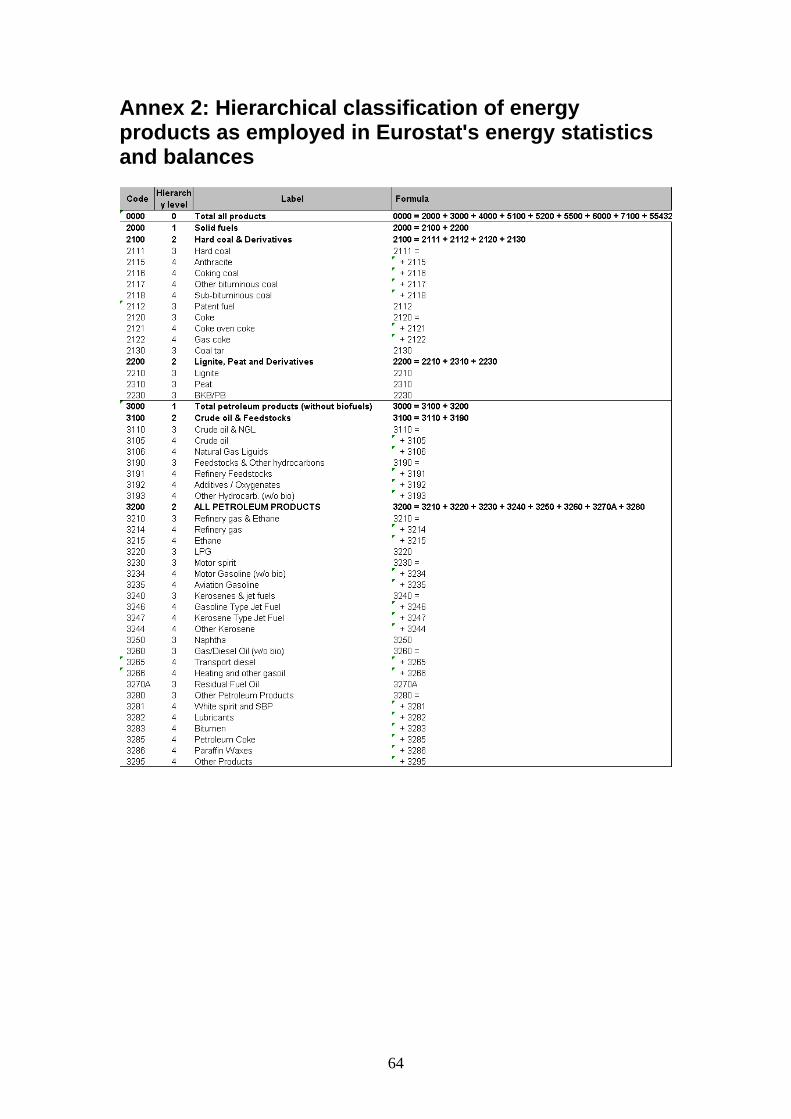
64
Annex 2: Hierarchical classification of energy products as employed in Eurostat's energy statistics and balances
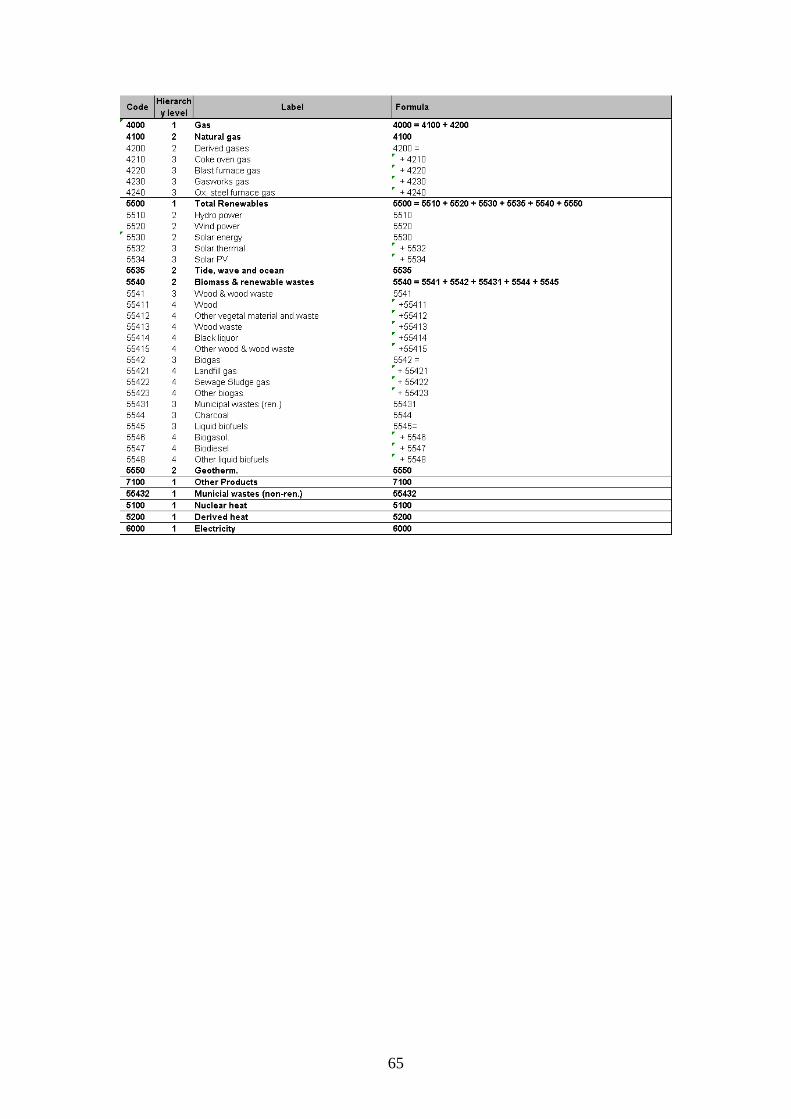
65
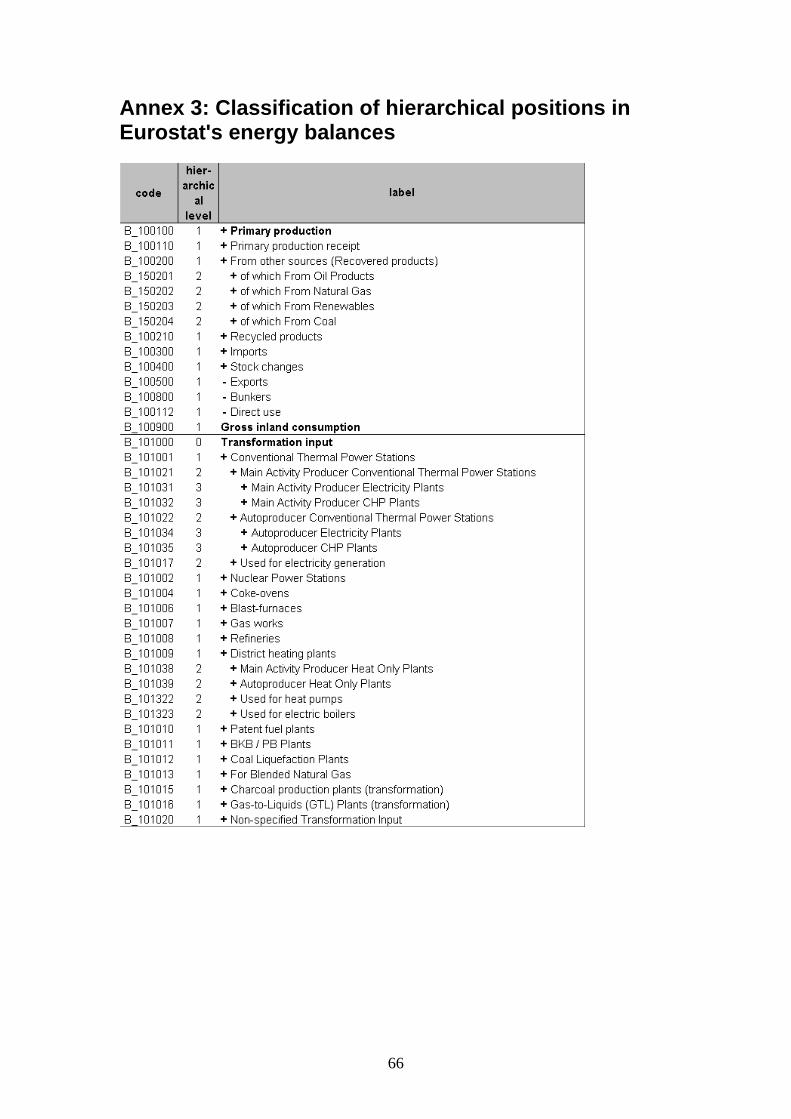
66
Annex 3: Classification of hierarchical positions i n Eurostat's energy balances
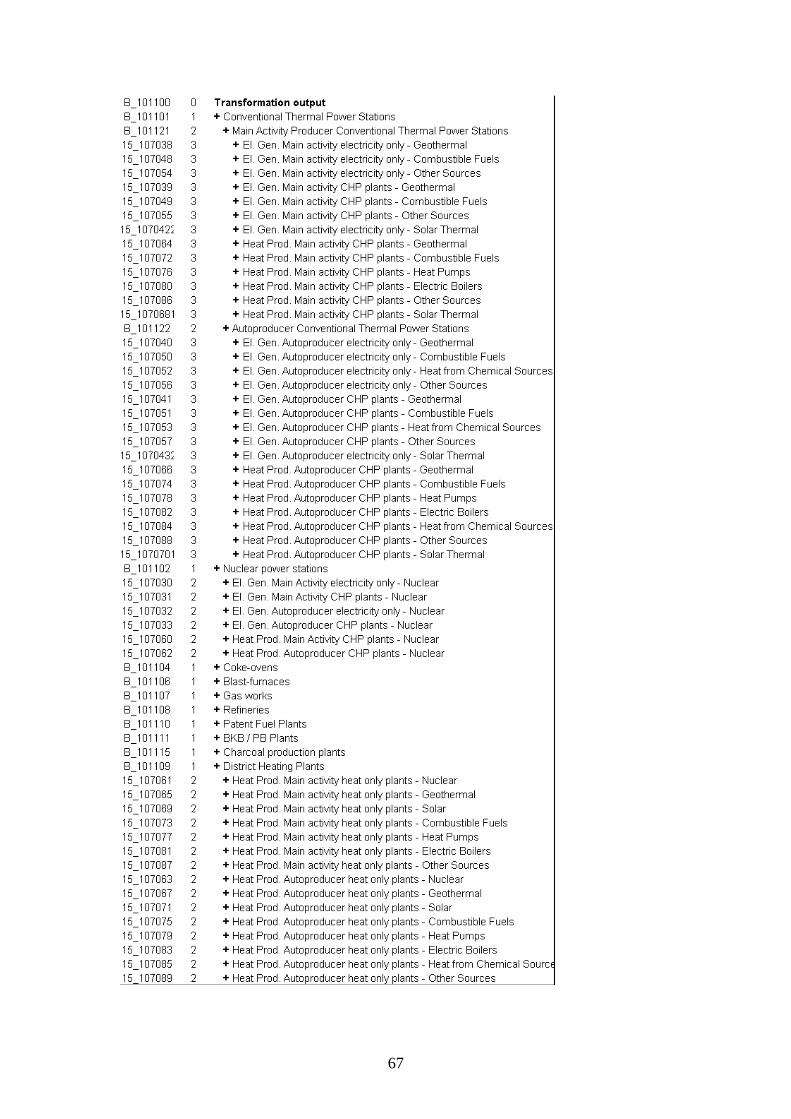
67
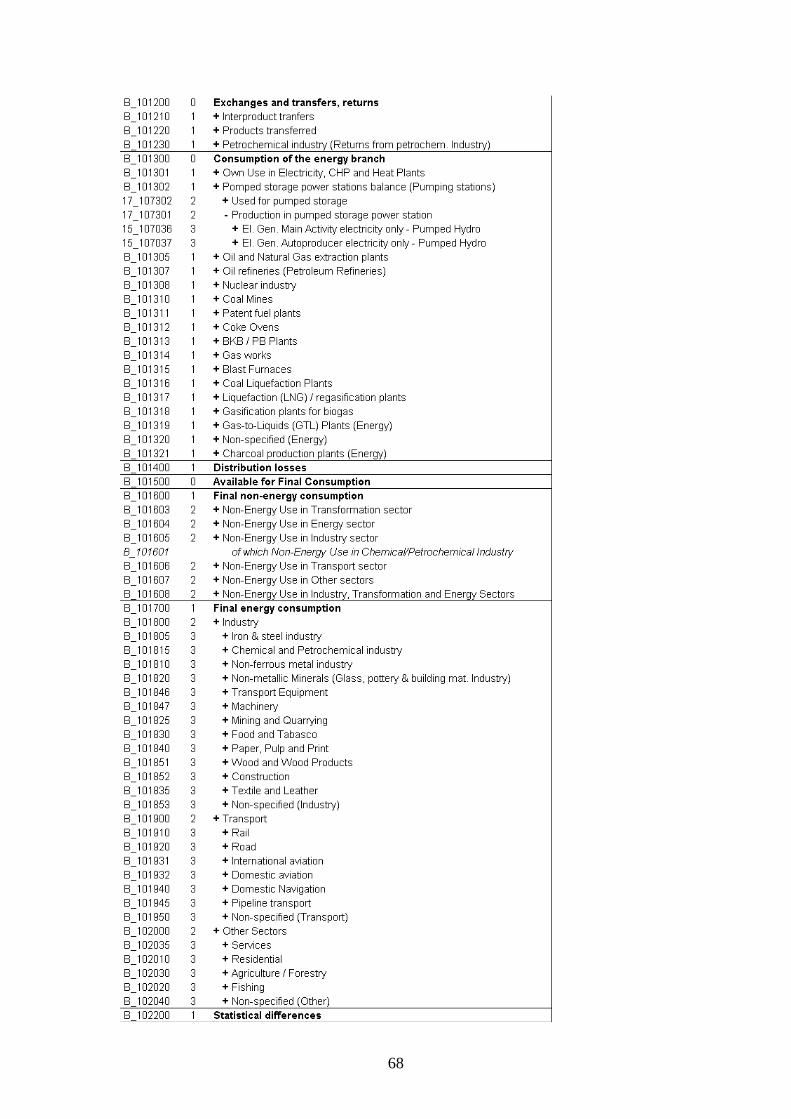
68
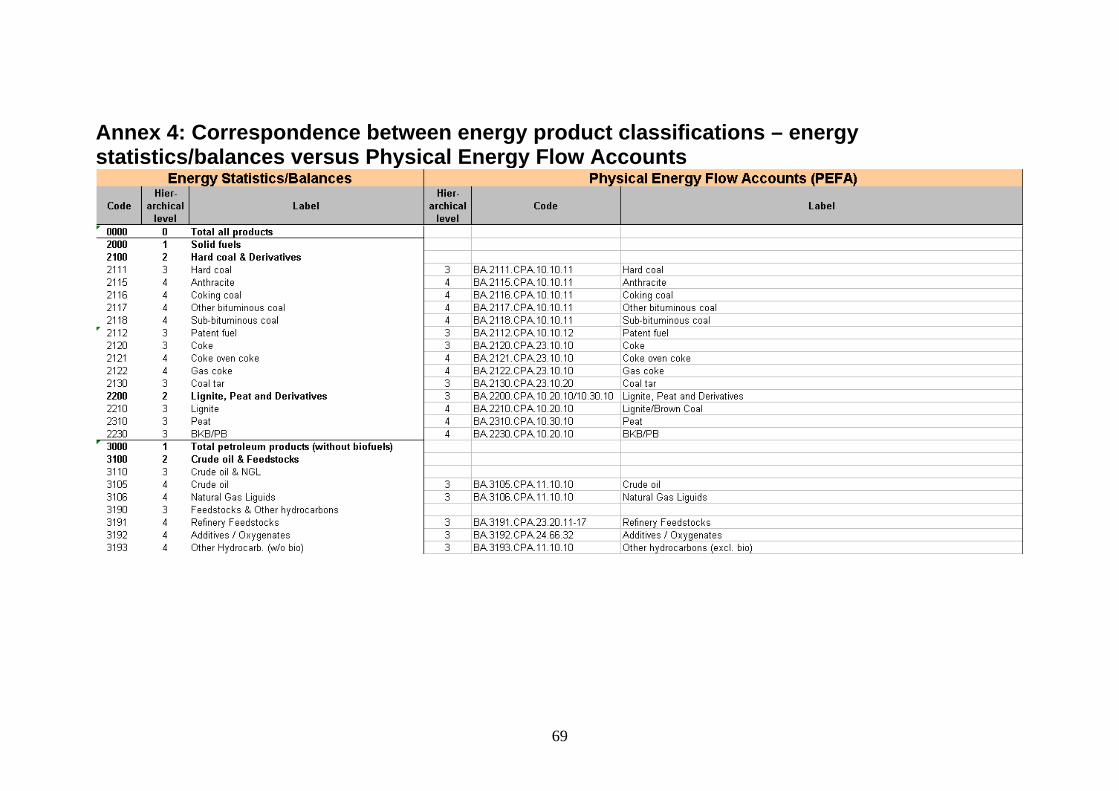
69
Annex 4: Correspondence between energy product classi fications – energy statistics/balances versus Physical Energy Flow Accounts
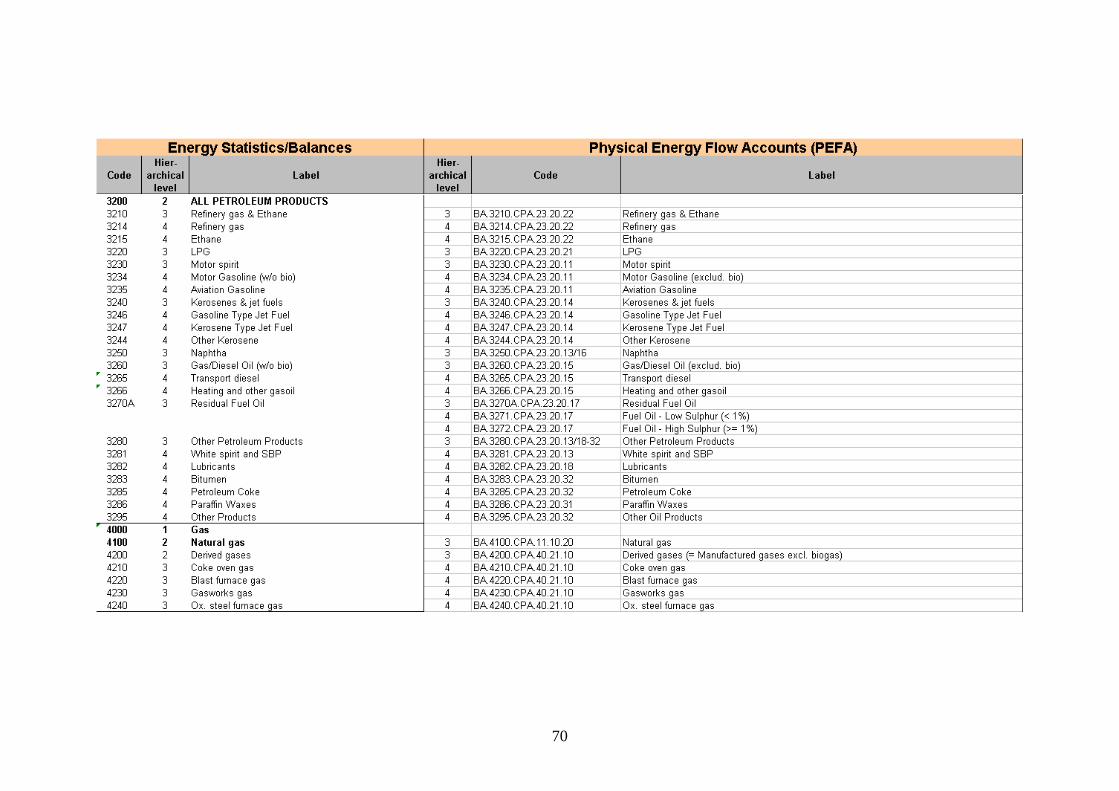
70
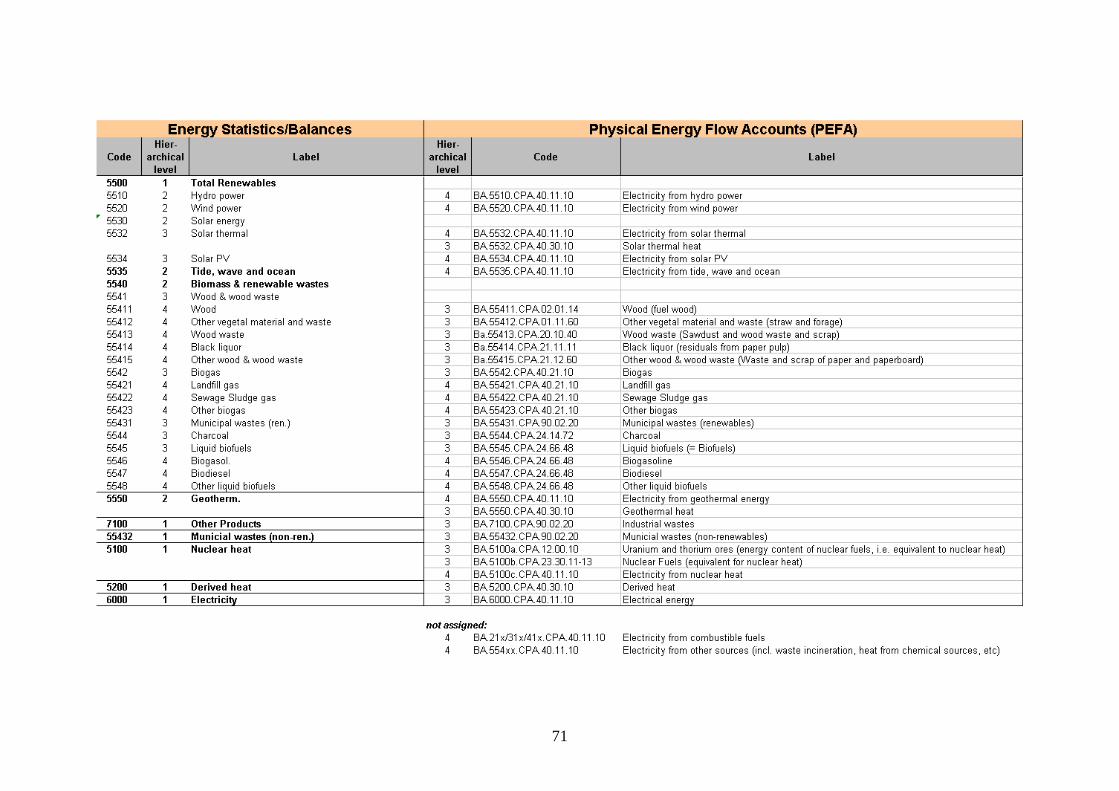
71

72