Embed Size (px)
Citation preview
Mapping dynamical properties of cortical microcircuits
using robotized TMS and EEG: Towards functional
cytoarchitectonics
Sylvain Harquel, Thibault Bacle, Lysianne Beynel, Christian Marendaz, Alan
Chauvin, Olivier David
To cite this version:
Sylvain Harquel, Thibault Bacle, Lysianne Beynel, Christian Marendaz, Alan Chau-vin, et al.. Mapping dynamical properties of cortical microcircuits using robotizedTMS and EEG: Towards functional cytoarchitectonics. NeuroImage, Elsevier, 2016,<10.1016/j.neuroimage.2016.05.009>. <hal-01318810>
HAL Id: hal-01318810
https://hal.archives-ouvertes.fr/hal-01318810
Submitted on 14 Jun 2016
HAL is a multi-disciplinary open accessarchive for the deposit and dissemination of sci-entific research documents, whether they are pub-lished or not. The documents may come fromteaching and research institutions in France orabroad, or from public or private research centers.
L’archive ouverte pluridisciplinaire HAL, estdestinee au depot et a la diffusion de documentsscientifiques de niveau recherche, publies ou non,emanant des etablissements d’enseignement et derecherche francais ou etrangers, des laboratoirespublics ou prives.

1
Mapping dynamical properties of cortical microcircuits using
robotized TMS and EEG: Towards functional cytoarchitectonics
Sylvain Harquel a,b,c,d, Thibault Bacle a,b, Lysianne Beynel a,b, Christian Marendaz a,b ,
Alan Chauvin a,b, Olivier David a,c,*
a Univ. Grenoble Alpes, F-38000 Grenoble, France
b. CNRS, UMR5105, Laboratoire Psychologie et NeuroCognition, LPNC, F-38000 Grenoble,
France
c. Inserm, U1216, Grenoble Institut des Neurosciences, F-38000 Grenoble, France
d. CNRS, INSERM, Univ. Grenoble Alpes, CHU Grenoble, IRMaGe, F-38000 Grenoble, France
* Corresponding author:
Olivier David
Grenoble Institut des Neurosciences
Chemin Fortuné Ferrini – Bât EJ Safra – CHU
38700 La Tronche, France
Email: [email protected]
Tel: +33 4 56 52 05 86
Fax: +33 4 56 52 05 98
2
Abstract
Brain dynamics at rest depend on the large-scale interactions between oscillating cortical
microcircuits arranged into macrocolumns. Cytoarchitectonic studies have shown that the structure
of those microcircuits differs between cortical regions, but very little is known about interregional
differences of their intrinsic dynamics at a macro-scale in human. We developed here a new method
aiming at mapping the dynamical properties of cortical microcircuits non-invasively using the
coupling between robotized transcranial magnetic stimulation and electroencephalography. We
recorded the responses evoked by the stimulation of 18 cortical targets largely covering the
accessible neocortex in 22 healthy volunteers. Specific data processing methods were developed to
map the local source activity of each cortical target, which showed inter-regional differences with
very good interhemispheric reproducibility. Functional signatures of cortical microcircuits were
further studied using spatio-temporal decomposition of local source activities in order to highlight
principal brain modes. The identified brain modes revealed that cortical areas with similar intrinsic
dynamical properties could be distributed either locally or not, with a spatial signature that was
somewhat reminiscent of resting state networks. Our results provide the proof of concept of
“functional cytoarchitectonics”, that would guide the parcellation of the human cortex using not
only its cytoarchitecture but also its intrinsic responses to local perturbations. This opens new
avenues for brain modelling and physiopathology readouts.
Keywords
Transcranial magnetic stimulation; electroencephalography; cytoarchitectonics; functional
neuroanatomy; cortical mapping
3
1 Introduction
Brain dynamics at rest depend on the large scale interactions between local oscillators that
correspond to cortical microcircuits arranged into macrocolumns (Jones, 2000). Cytoarchitectonic
studies have shown that the structure of those microcircuits differs between cortical regions
(Brodmann, 1909; Economo and Koskinas, 1925), but very little is known experimentally about
interregional differences of their intrinsic dynamics at a macro-scale. In animal studies, there are
some data relating specific cell types or processes to specific brain oscillations, e.g. giant pyramidal
cells to beta oscillations in the motor cortex of the cat (Bouyer et al., 1987) or synaptic synchrony
between excitatory pyramidal neurons and inhibitory interneurons to gamma oscillations in mouse
entorhinal cortical slices (Salkoff et al., 2015). In humans, indirect evidence between brain
dynamics and cytoarchitectonics from post-hoc correlation analysis of cortical maps has been
suggested from analysis of resting state functional MRI spectral properties (Song et al., 2014). A
significant association between cytoarchitectonic features of human cortical organization, in
particular the size of layer 3 neurons, and whole-brain cortico-cortical connectivity has been
recently identified, and suggests existing relationships between microscale cytoarchitectonics and
macroscale connectomics (van den Heuvel et al., 2015). Because knowing how cytoarchitectonics
influence brain dynamics is of outmost importance to increase our understanding of brain
functioning, for example by developing more biologically grounded neuronal models in silico (Roy
et al., 2014), we develop here a new experimental method using transcranial magnetic stimulation
(TMS) to map the dynamical properties of human local cortical microcircuits non invasively. We
mainly assume that the dynamical properties of neuronal responses to direct local perturbations
depend on the way neurons are interconnected within cortical macrocolumns, i.e. local
cytoarchitecture, and beyond, i.e. interregional laminar pattern of connections (Crick and Koch,
4
1998). Operationally, we propose that spatio-temporal decoding of local responses to distributed
focal brain stimulations may give rise to the possibility of studying functional cytoarchitectonics,
that is the study of intrinsic dynamics of cortical microcircuits in vivo.
TMS consists of the generation of a transient magnetic field by a coil placed over the scalp, which
induces electrical currents on the cortical surface (Wassermann et al., 2012) that activate responsive
neurons (Mueller et al., 2014). Originally designed in order to better understand the actual effect of
TMS and repetitive TMS on the ongoing neural activity, the coupling between TMS and
electroencephalography (EEG) has recently given new insights regarding the nature and the
properties of both the local neuronal microcircuits as well as their long-range connectivity
(Bortoletto et al., 2015; Gosseries et al., 2015; Miniussi and Thut, 2010). These features can be
assessed by the study of TMS evoked potentials (TEPs) (Casarotto et al., 2010; Ilmoniemi et al.,
1997; Lioumis et al., 2009). TMS-EEG coupling also allows to study local and distributed brain
oscillations at rest (Rosanova et al., 2009) or during sensorimotor (Fuggetta et al., 2005; Löfberg et
al., 2013; Picazio et al., 2014) or cognitive tasks (Mattavelli et al., 2013; Rogasch and Fitzgerald,
2013; Vernet et al., 2015). TEPs were recorded over a large diversity of cortical areas including M1,
frontal, parietal, and occipital lobes. As expected from the heterogeneity of cortical microcircuits
and long range connectivity, TEPs showed distributed spatio-temporal patterns specific to each
stimulated area, in terms of both spectral and spatial signatures (Cona et al., 2011; Rosanova et al.,
2009; Thut et al., 2011). However, existing literature suffers from the diversity of the TMS
parameters and of the EEG signal processing methods employed, which prevents any accurate
understanding of the spatial organization of local cortical microcircuits’ properties amongst cortical
regions.
5
In this study, we fully revisited the methods required to obtain an accurate mapping of dynamical
properties of local microcircuits. Our methodology was based on the coupling of EEG recordings
with neuronavigated and robotized TMS. Robotized TMS was critical because it allowed the
automatic and precise positioning of the coil over a series of cortical targets (Ginhoux et al., 2013),
thereby making possible the stimulation of a large number of cortical targets within a unique
recording session. EEG processing methods were developed to estimate the early components of
cortical current densities generating TEPs, locally for each cortical target, leading to a local source
activity (LSA) map. Further spatial clustering on time-frequency properties of such local source
activity was finally used to estimate the main cortical modes supposedly generated by the regional
differences in cytoarchitecture and local microcircuitry.
2 Materials and methods
2.1 Subjects
This study was approved by the ethical committee of Grenoble University Hospital (ID RCB: 2013-
A01734-41), and registered on ClinicalTrials.gov (number NCT02168413). Twenty-two French
native-speaker healthy volunteers (14 males, aged 29.6±10.1 years old) gave their written consent
prior to the experiment and received payment for their participation. None of them had either
history of psychiatric or neurological disorders, or history of alcohol or substance abuse. They were
free of any medicinal treatment likely to modulate their cortical excitability levels.
6
2.2 Acquisition parameters
Protocol design
MRI and TMS acquisitions were performed at IRMaGe MRI and Neurophysiology facilities
(Grenoble, France). First, cerebral anatomical T1-weighted MRIs were acquired at 3T (Achieva
3.0T TX, Philips, Netherlands). The subjects were then prepared for the TMS-EEG experiment
(EEG cap hanging), while their MRI were being processed in order to define the cortical targets. A
co-registration step, necessary for the neuronavigation system, was performed. The resting motor
threshold (rMT) was assessed during a classical motor CE session (see below). Finally, one TMS-
EEG mapping session per hemisphere was performed (30 min each), separated by a 15 min break.
The order of the stimulated hemispheres was counterbalanced between subjects.
TMS parameters
Biphasic TMS pulses were delivered on a posterior to anterior direction using a Magpro Cool B65-
RO butterfly coil (MagVenture A/S, Denmark) plugged in a MagPro x100 TMS stimulator
(MagVenture A/S, Denmark), and guided by a Localite neuronavigation system (Localite GmbH,
Germany). The coil was handled automatically using a TMS-robot (Axilum Robotics, France). The
rMT was assessed on the position eliciting the greatest motor evoked potential (MEP) on the
contralateral first dorsal inter-osseous muscle. The MEPs were recorded using a Dantec Keypoint
portable EMG recording system (Natus Medical Inc., USA). Using the threshold hunting method
(Awiszus, 2003), the rMT was defined as the stimulation intensity that evoked a 50 µV MEP with a
50% probability.
7
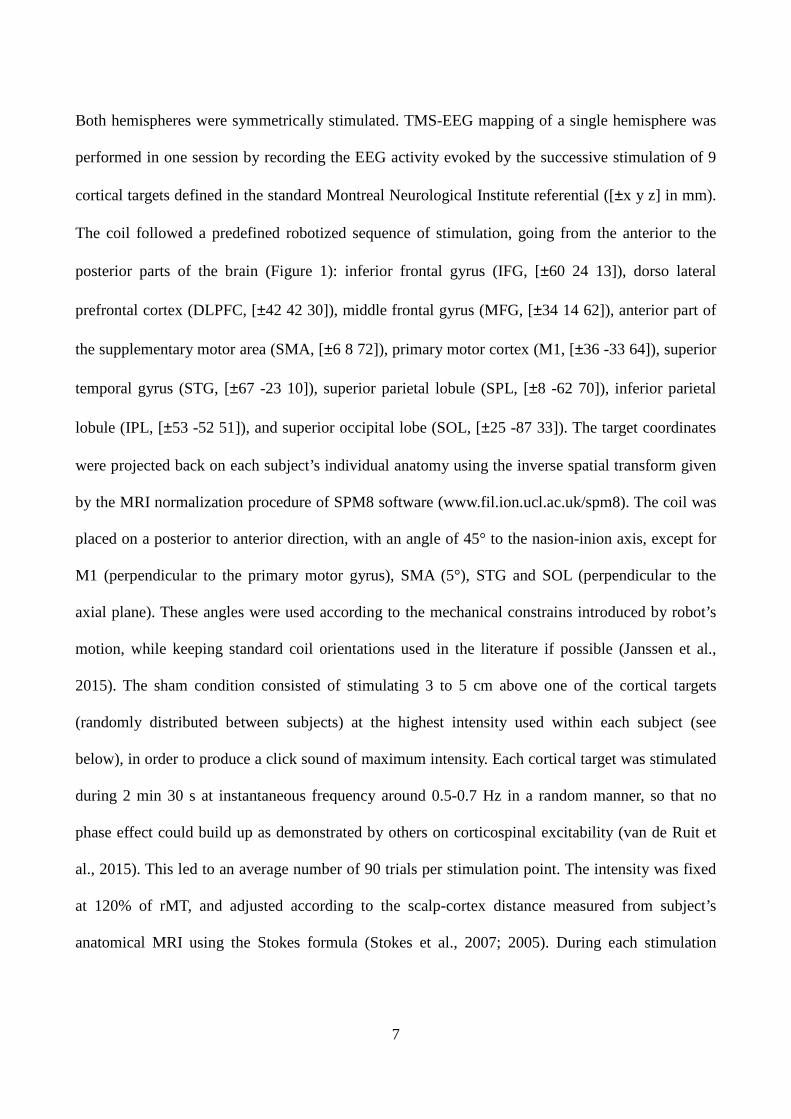
Both hemispheres were symmetrically stimulated. TMS-EEG mapping of a single hemisphere was
performed in one session by recording the EEG activity evoked by the successive stimulation of 9
cortical targets defined in the standard Montreal Neurological Institute referential ([±x y z] in mm).
The coil followed a predefined robotized sequence of stimulation, going from the anterior to the
posterior parts of the brain (Figure 1): inferior frontal gyrus (IFG, [±60 24 13]), dorso lateral
prefrontal cortex (DLPFC, [±42 42 30]), middle frontal gyrus (MFG, [±34 14 62]), anterior part of
the supplementary motor area (SMA, [±6 8 72]), primary motor cortex (M1, [±36 -33 64]), superior
temporal gyrus (STG, [±67 -23 10]), superior parietal lobule (SPL, [±8 -62 70]), inferior parietal
lobule (IPL, [±53 -52 51]), and superior occipital lobe (SOL, [±25 -87 33]). The target coordinates
were projected back on each subject’s individual anatomy using the inverse spatial transform given
by the MRI normalization procedure of SPM8 software (www.fil.ion.ucl.ac.uk/spm8). The coil was
placed on a posterior to anterior direction, with an angle of 45° to the nasion-inion axis, except for
M1 (perpendicular to the primary motor gyrus), SMA (5°), STG and SOL (perpendicular to the
axial plane). These angles were used according to the mechanical constrains introduced by robot’s
motion, while keeping standard coil orientations used in the literature if possible (Janssen et al.,
2015). The sham condition consisted of stimulating 3 to 5 cm above one of the cortical targets
(randomly distributed between subjects) at the highest intensity used within each subject (see
below), in order to produce a click sound of maximum intensity. Each cortical target was stimulated
during 2 min 30 s at instantaneous frequency around 0.5-0.7 Hz in a random manner, so that no
phase effect could build up as demonstrated by others on corticospinal excitability (van de Ruit et
al., 2015). This led to an average number of 90 trials per stimulation point. The intensity was fixed
at 120% of rMT, and adjusted according to the scalp-cortex distance measured from subject’s
anatomical MRI using the Stokes formula (Stokes et al., 2007; 2005). During each stimulation
8
sequence, the subject was told to relax (resting state) and to stare at a black cross located on the
opposite wall. Subjects were also listening to white noise through active noise cancellation intra-
auricular earphones (Bose QC 20, USA) in order to limit the influence of the auditory processing of
the TMS click on the ongoing EEG activity. The sound level was adjusted individually to each
subject, until the TMS click delivered at 95% of the stimulator output became barely audible. A thin
layer of soft plastic was placed on the coil surface in order to limit both sensory and auditory
feedbacks to the subject.
EEG acquisition
EEG was recorded using a 64 channels TMS compatible system (BrainAmp DC amplifiers and
BrainCap EEG cap, Brain Products GmbH, Germany). The EEG cap was placed at the beginning of
the experiment following the 10-20 standard system. Electrooculogram of the right eye was
recorded using one of the 64 electrodes. The electrode impedances were adjusted and kept under 5
kOhms using conduction gel. The impedance levels were checked and corrected if needed before
the two TMS-EEG sessions. The signal was recorded using the amplifier in DC mode, filtered using
a 500 Hz anti-aliasing low-pass filter, and finally digitized at 1 kHz sampling frequency. Electrode
Fz was used as reference during the recording. The channel coordinates relative to the subject’s
scalp were measured at the end of the experiment using the neuronavigation system.
9
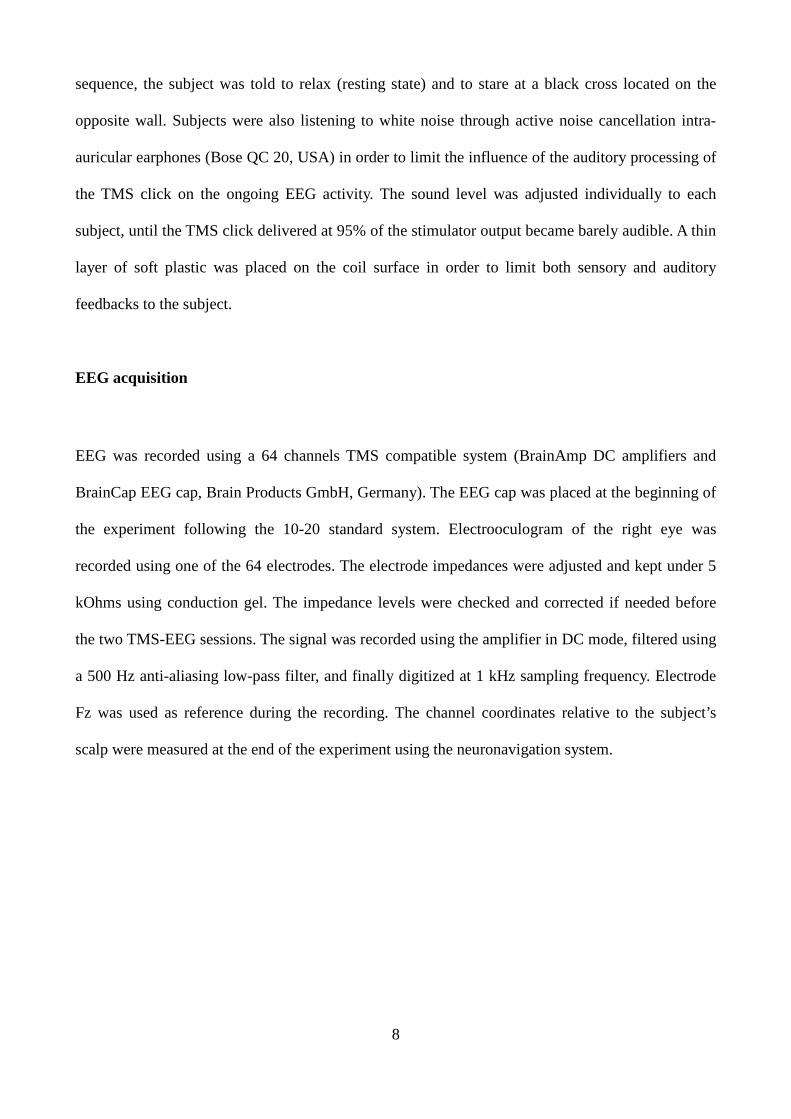
Figure 1: Cortical mapping procedure. A: Cortical targets used for the mapping procedure. Entry points and coil
orientations are shown in green; cortical targets are in blue. Targets are symmetrically distributed on both hemispheres.
B: Robotized sequence of stimulations. The snapshots show the position of the robotized arm throughout the mapping
procedure of the left hemisphere, from the anterior to the posterior sites. Snapshots are sorted into time order from top
left to bottom right, except for Sham condition performed above M1 in this example (see main text).
2.3 EEG processing
EEG signals were processed using Fieldtrip (Oostenveld et al., 2011) and Brainstorm 3 (Tadel et
al., 2011) softwares, and other custom scripts written in Matlab (The MathWorks Inc., USA).
10
Preprocessing
EEG signals were pre-processed semi-automatically based on the methodology described in
(Rogasch et al., 2014), for each condition (18 targets and 1 sham) and each subject. First, the
channels showing electrical noise (flat signal or peak-to-peak amplitude superior to 100 µV)
spanning more than 15% of the trials were discarded from the analysis (on average, 1.53±2.08
channels per condition). EEG signals were then epoched around the TMS pulse, using a -200 to
+1000 ms time window of interest. TMS artifacts were discarded by cutting out the -5 to +15 ms
period surrounding the TMS pulses. Two rounds of independent component analysis (ICA) were
then applied in order to remove noise remaining in the signal. The first ICA suppressed the muscle
artifacts, while the second aimed at removing the decay artifact, ocular activity, auditory-evoked
potentials and other noise-related artifacts (Rogasch et al., 2014). Before the second ICA, the signal
was spline interpolated over the -5 to +15ms period, band-pass filtered (1-80 Hz), re-referenced
using the average reference, and cleaned from bad trials (leading to a mean of 77.7±7.2 trials left
per condition). The ocular components were automatically identified using a threshold of 0.7 on the
correlation product ρ between the spatial topographies of the components and a template of typical
horizontal eye movements and blinks build from our own database by averaging over subjects.
Other artifact components (decay, auditory-evoked potentials and other noises) were detected by
thresholding the z-score (above 4) of their mean activity against the pre-stimulus period, and by
visual inspection. On average, 19.2 (+/- 7.7) components were removed from the signal. Cleaned
EEG time series were reconstructed using the remaining components and any isolated channel still
showing remaining noise was discarded from further analysis. Time series of rejected channels were
finally inferred using the activity averaged over their neighboring channels.
11
TMS evoked potentials (TEPs)
TEPs were computed for each condition and subject by averaging over trials, using a baseline
normalization (z-scoring) over the -200 to -5 ms period. The grand average TEP was obtained for
each TMS target by averaging across subjects.
TEP source reconstruction
TEP source reconstruction was performed following the default procedure proposed in Brainstorm 3
software (Tadel et al., 2011). First, the cortex and head meshes (15000 and 10000 vertices
respectively) of each individual were generated using the automated MRI segmentation routine of
FreeSurfer (Reuter et al., 2012). The locations of EEG electrodes were co-registered on each
subject’s anatomical MRI. The forward model was then computed using the symmetric Boundary
Element Method developed in the openMEEG freeware, using default values for conductivity and
layer thickness (Gramfort et al., 2010). The full noise covariance matrix was then computed for
each subject using the temporal concatenation of the baseline periods of all conditions. Sources
were distributed orthogonally to the cortical surface and their amplitudes were estimated using the
default values of the Brainstorm implementation of the whitened and depth-weighted linear L2-
minimum norm solution. The source amplitudes were finally normalized (z-score against pre-
stimulation baseline).
12
Local source activity map
The LSA map was constructed in order to represent the cortical response to TMS within the region
of interest (ROI) centred on each target, for all the 18 stimulated sites simultaneously (Figure 2).
ROIs were created on each individual anatomy using a mean spatial extent of 10 cm2, covering
about 50-60 vertices of cortical mesh. The LSA time series of ROI i and subject k, Sik, was obtained
by extracting the first mode of the principal component analysis decomposition of the source time
series evoked by the stimulation of the corresponding stimulation target over all the vertices within
ROI i. This corresponds to a single LSA time series per ROI. For display purposes, the LSA map
was created by projecting back the group average (grand average of absolute values) of LSA time
series of each ROI on a canonical brain (using Colin27 template). LSA values were interpolated in
between ROIs using the Shepard’s weighting of 3D nearest-neighbor interpolation in order to assign
a LSA value to every node of the cortical mesh.
13
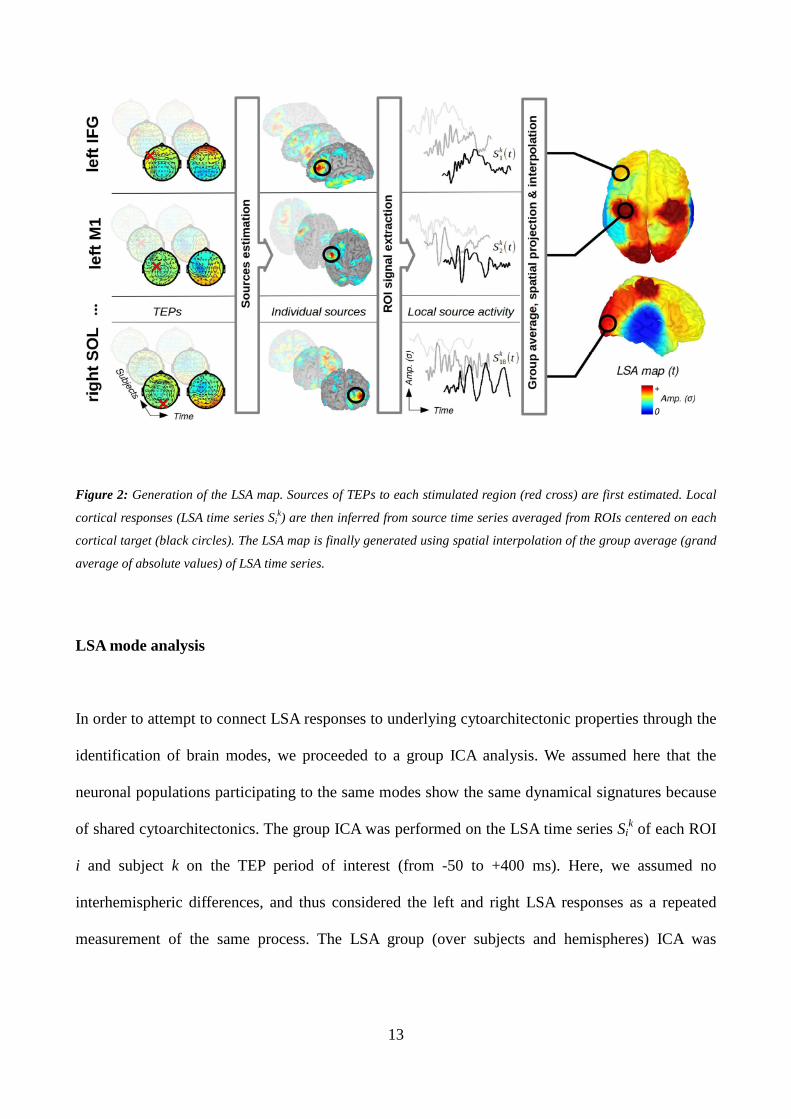
Figure 2: Generation of the LSA map. Sources of TEPs to each stimulated region (red cross) are first estimated. Local
cortical responses (LSA time series Sik) are then inferred from source time series averaged from ROIs centered on each
cortical target (black circles). The LSA map is finally generated using spatial interpolation of the group average (grand
average of absolute values) of LSA time series.
LSA mode analysis
In order to attempt to connect LSA responses to underlying cytoarchitectonic properties through the
identification of brain modes, we proceeded to a group ICA analysis. We assumed here that the
neuronal populations participating to the same modes show the same dynamical signatures because
of shared cytoarchitectonics. The group ICA was performed on the LSA time series Sik of each ROI
i and subject k on the TEP period of interest (from -50 to +400 ms). Here, we assumed no
interhemispheric differences, and thus considered the left and right LSA responses as a repeated
measurement of the same process. The LSA group (over subjects and hemispheres) ICA was
14
performed after the concatenation of LSA matrices along the temporal dimension (Calhoun et al.,
2009), leading to a group LSA matrix Mi= [Si1… Si
k … SiK] of size [L/2 2NK], where L is the number
of targets (18), N the number of time bins and K the number of subjects (22). The matrix Mi was
thus decomposed into L/2 (9) independent components (data dimension) using the logistic infomax
ICA algorithm (Bell and Sejnowski, 1995) with the natural gradient feature from Amari, Cichocki &
Yang (Makeig et al., 1996). The dynamical signature of each component in each individual was
finally assessed by means of its time/frequency (TF) decomposition obtained using Morlet wavelet
transform between 9 and 50 Hz (window width of 7 cycles, 0.5 Hz bandwidth). Individual TF maps
were normalized (z-score against baseline) and averaged across subjects. The output of the LSA
mode analysis results are maps showing ROIs sharing common neuronal signatures, as exemplified
by their time frequency decomposition.
Statistics
Significant spatial differences in the LSA map across stimulated areas were assessed over time
using the Skillings-Mack test (Chatfield and Mander, 2009). This test is derived from the Friedman
test (non-parametric equivalent of the repeated measures ANOVA test) and can handle missing data.
Because the same test was run at every time sample, p-values were temporally corrected:
Differences were considered as significant at p<0.05 for at least 20 consecutive time bins (Blair and
Karniski, 1993; Carota et al., 2010). The between subjects variability and the reproducibility of the
LSA map was estimated over time by computing Spearman correlations between the LSA map
obtained with all the 22 subjects, and LSA maps obtained with random subsets of subjects. 100
maps were computed for each time sample and each random subsets containing from 5 to 20
subjects. Statistical dependences between LSA and other experimental values were computed using
Spearman correlations. Statistical significance of TF maps of ICA components was obtained using
15
paired comparisons against baseline. A non-parametric Wilcoxon test was performed per time-
frequency bin, and the resulting p-values were spatio-temporally corrected. Differences were
considered as significant at p<0.05 for at least 20 consecutive time bins and 3 adjacent frequencies
(tiles of 20 ms x 1.5 Hz).
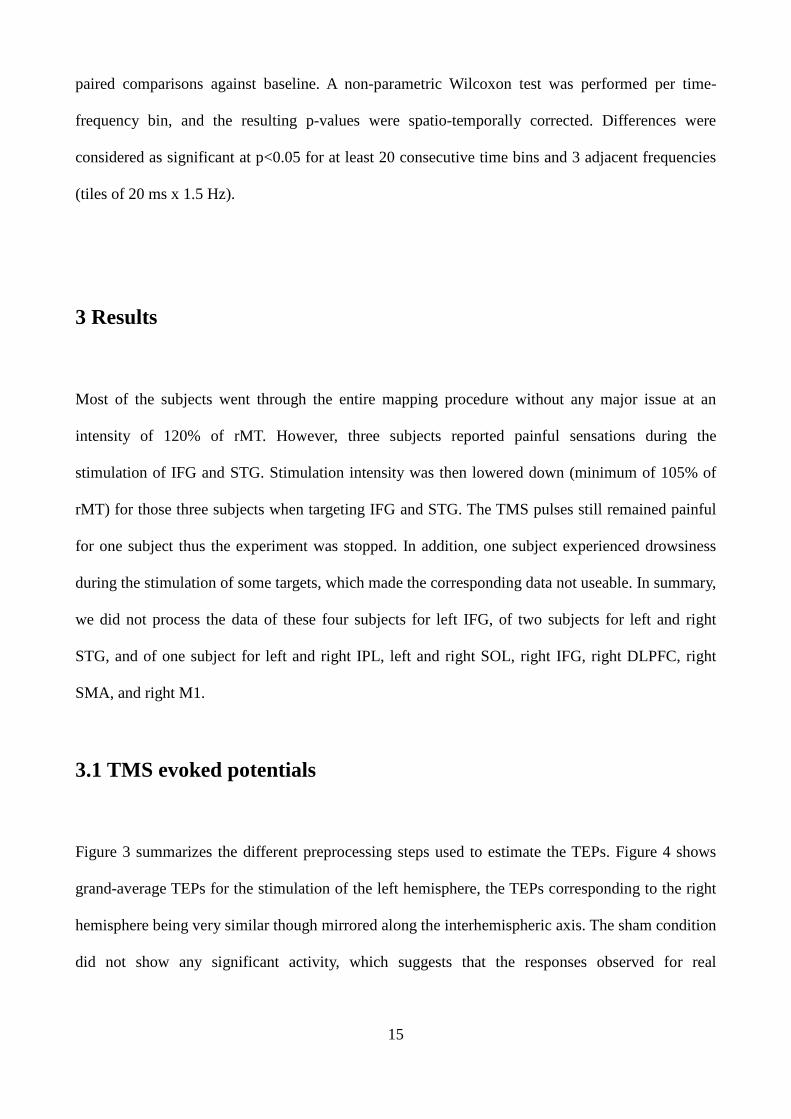
3 Results
Most of the subjects went through the entire mapping procedure without any major issue at an
intensity of 120% of rMT. However, three subjects reported painful sensations during the
stimulation of IFG and STG. Stimulation intensity was then lowered down (minimum of 105% of
rMT) for those three subjects when targeting IFG and STG. The TMS pulses still remained painful
for one subject thus the experiment was stopped. In addition, one subject experienced drowsiness
during the stimulation of some targets, which made the corresponding data not useable. In summary,
we did not process the data of these four subjects for left IFG, of two subjects for left and right
STG, and of one subject for left and right IPL, left and right SOL, right IFG, right DLPFC, right
SMA, and right M1.
3.1 TMS evoked potentials
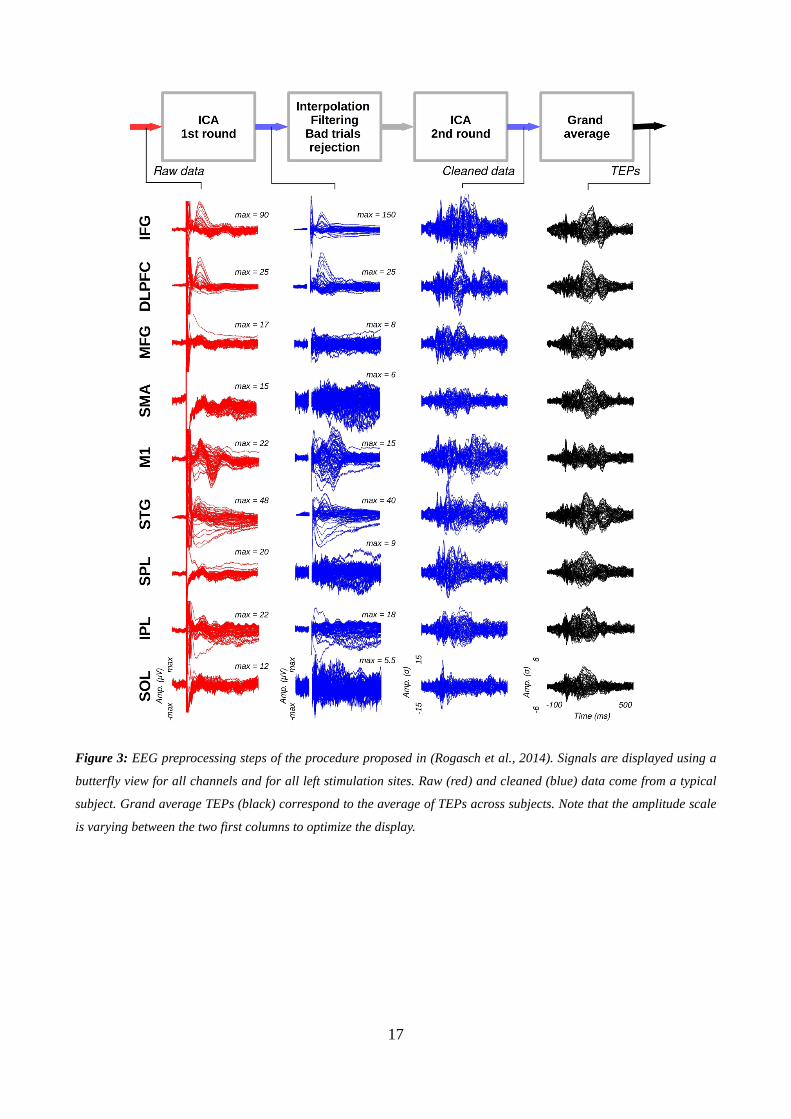
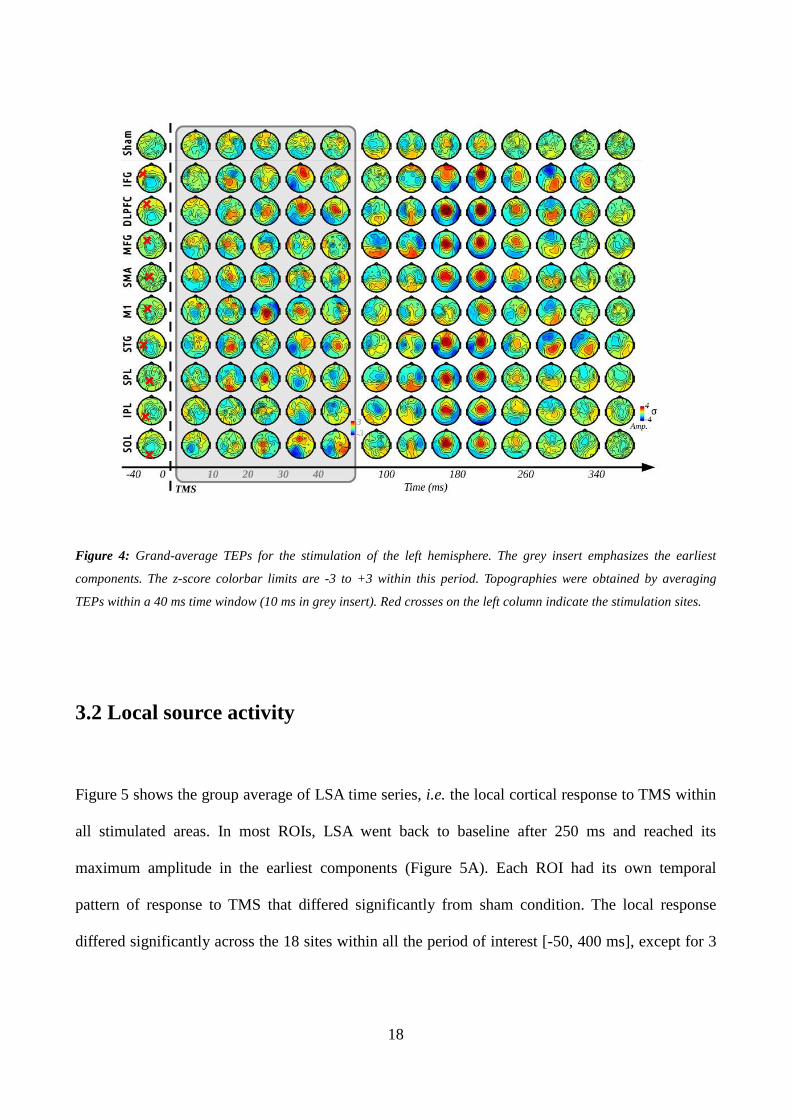
Figure 3 summarizes the different preprocessing steps used to estimate the TEPs. Figure 4 shows
grand-average TEPs for the stimulation of the left hemisphere, the TEPs corresponding to the right
hemisphere being very similar though mirrored along the interhemispheric axis. The sham condition
did not show any significant activity, which suggests that the responses observed for real
16
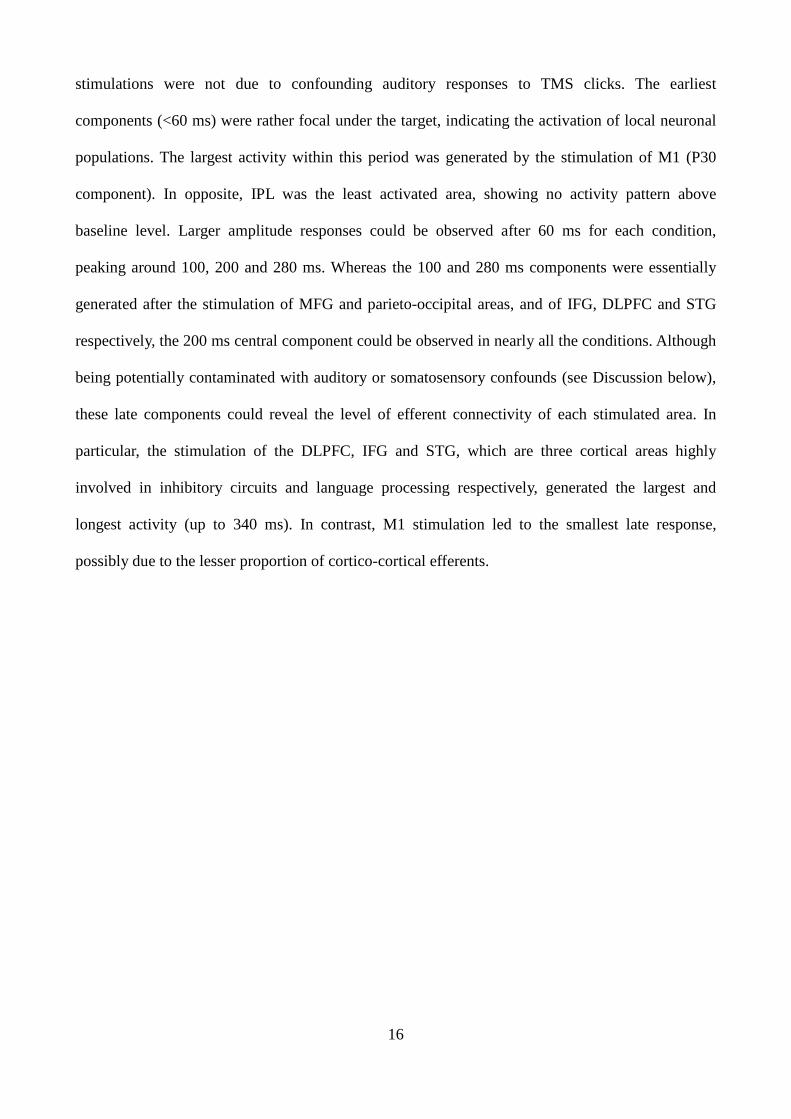
stimulations were not due to confounding auditory responses to TMS clicks. The earliest
components (<60 ms) were rather focal under the target, indicating the activation of local neuronal
populations. The largest activity within this period was generated by the stimulation of M1 (P30
component). In opposite, IPL was the least activated area, showing no activity pattern above
baseline level. Larger amplitude responses could be observed after 60 ms for each condition,
peaking around 100, 200 and 280 ms. Whereas the 100 and 280 ms components were essentially
generated after the stimulation of MFG and parieto-occipital areas, and of IFG, DLPFC and STG
respectively, the 200 ms central component could be observed in nearly all the conditions. Although
being potentially contaminated with auditory or somatosensory confounds (see Discussion below),
these late components could reveal the level of efferent connectivity of each stimulated area. In
particular, the stimulation of the DLPFC, IFG and STG, which are three cortical areas highly
involved in inhibitory circuits and language processing respectively, generated the largest and
longest activity (up to 340 ms). In contrast, M1 stimulation led to the smallest late response,
possibly due to the lesser proportion of cortico-cortical efferents.
17
Figure 3: EEG preprocessing steps of the procedure proposed in (Rogasch et al., 2014). Signals are displayed using a
butterfly view for all channels and for all left stimulation sites. Raw (red) and cleaned (blue) data come from a typical
subject. Grand average TEPs (black) correspond to the average of TEPs across subjects. Note that the amplitude scale
is varying between the two first columns to optimize the display.
18
Figure 4: Grand-average TEPs for the stimulation of the left hemisphere. The grey insert emphasizes the earliest
components. The z-score colorbar limits are -3 to +3 within this period. Topographies were obtained by averaging
TEPs within a 40 ms time window (10 ms in grey insert). Red crosses on the left column indicate the stimulation sites.
3.2 Local source activity
Figure 5 shows the group average of LSA time series, i.e. the local cortical response to TMS within
all stimulated areas. In most ROIs, LSA went back to baseline after 250 ms and reached its
maximum amplitude in the earliest components (Figure 5A). Each ROI had its own temporal
pattern of response to TMS that differed significantly from sham condition. The local response
differed significantly across the 18 sites within all the period of interest [-50, 400 ms], except for 3
19
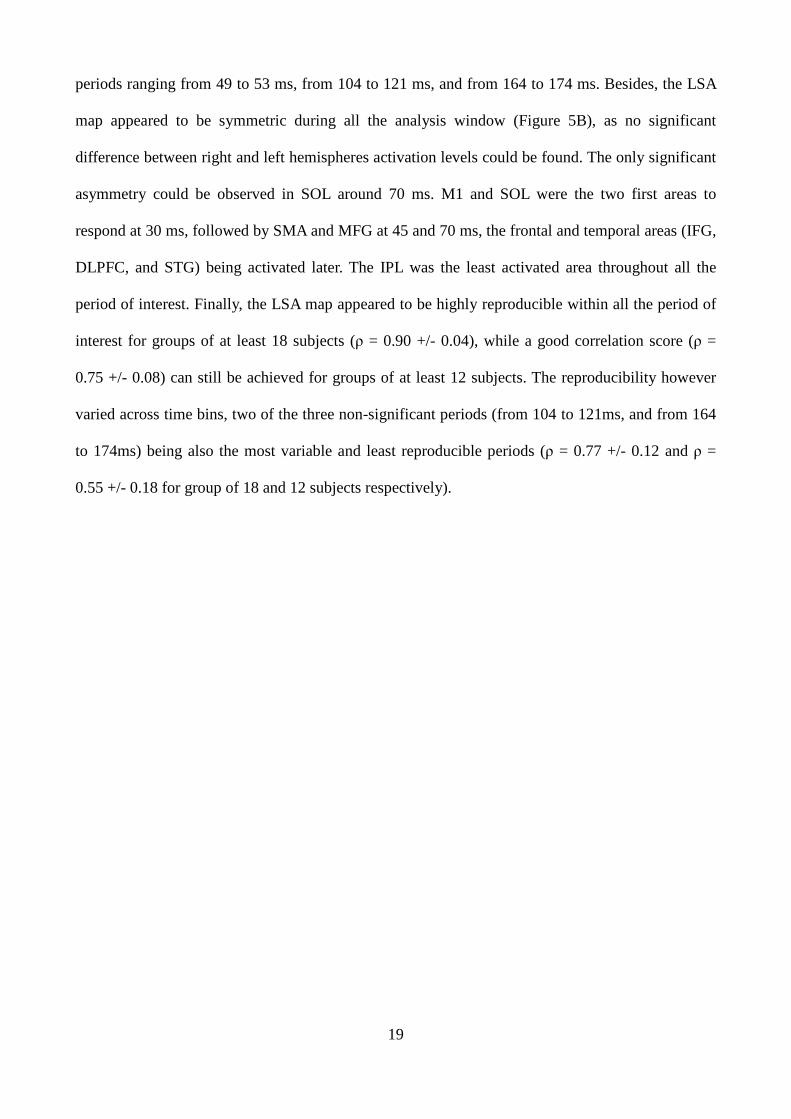
periods ranging from 49 to 53 ms, from 104 to 121 ms, and from 164 to 174 ms. Besides, the LSA
map appeared to be symmetric during all the analysis window (Figure 5B), as no significant
difference between right and left hemispheres activation levels could be found. The only significant
asymmetry could be observed in SOL around 70 ms. M1 and SOL were the two first areas to
respond at 30 ms, followed by SMA and MFG at 45 and 70 ms, the frontal and temporal areas (IFG,
DLPFC, and STG) being activated later. The IPL was the least activated area throughout all the
period of interest. Finally, the LSA map appeared to be highly reproducible within all the period of
interest for groups of at least 18 subjects (ρ = 0.90 +/- 0.04), while a good correlation score (ρ =
0.75 +/- 0.08) can still be achieved for groups of at least 12 subjects. The reproducibility however
varied across time bins, two of the three non-significant periods (from 104 to 121ms, and from 164
to 174ms) being also the most variable and least reproducible periods (ρ = 0.77 +/- 0.12 and ρ =
0.55 +/- 0.18 for group of 18 and 12 subjects respectively).
20
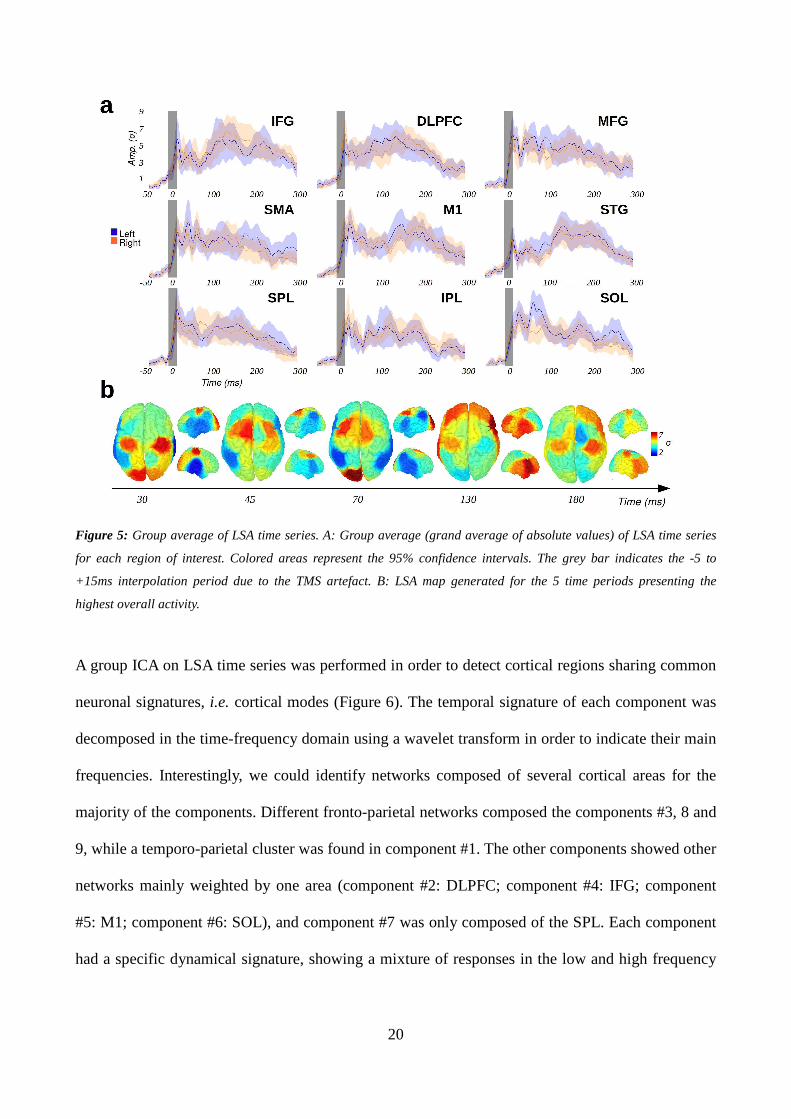
Figure 5: Group average of LSA time series. A: Group average (grand average of absolute values) of LSA time series
for each region of interest. Colored areas represent the 95% confidence intervals. The grey bar indicates the -5 to
+15ms interpolation period due to the TMS artefact. B: LSA map generated for the 5 time periods presenting the
highest overall activity.
A group ICA on LSA time series was performed in order to detect cortical regions sharing common
neuronal signatures, i.e. cortical modes (Figure 6). The temporal signature of each component was
decomposed in the time-frequency domain using a wavelet transform in order to indicate their main
frequencies. Interestingly, we could identify networks composed of several cortical areas for the
majority of the components. Different fronto-parietal networks composed the components #3, 8 and
9, while a temporo-parietal cluster was found in component #1. The other components showed other
networks mainly weighted by one area (component #2: DLPFC; component #4: IFG; component
#5: M1; component #6: SOL), and component #7 was only composed of the SPL. Each component
had a specific dynamical signature, showing a mixture of responses in the low and high frequency
21
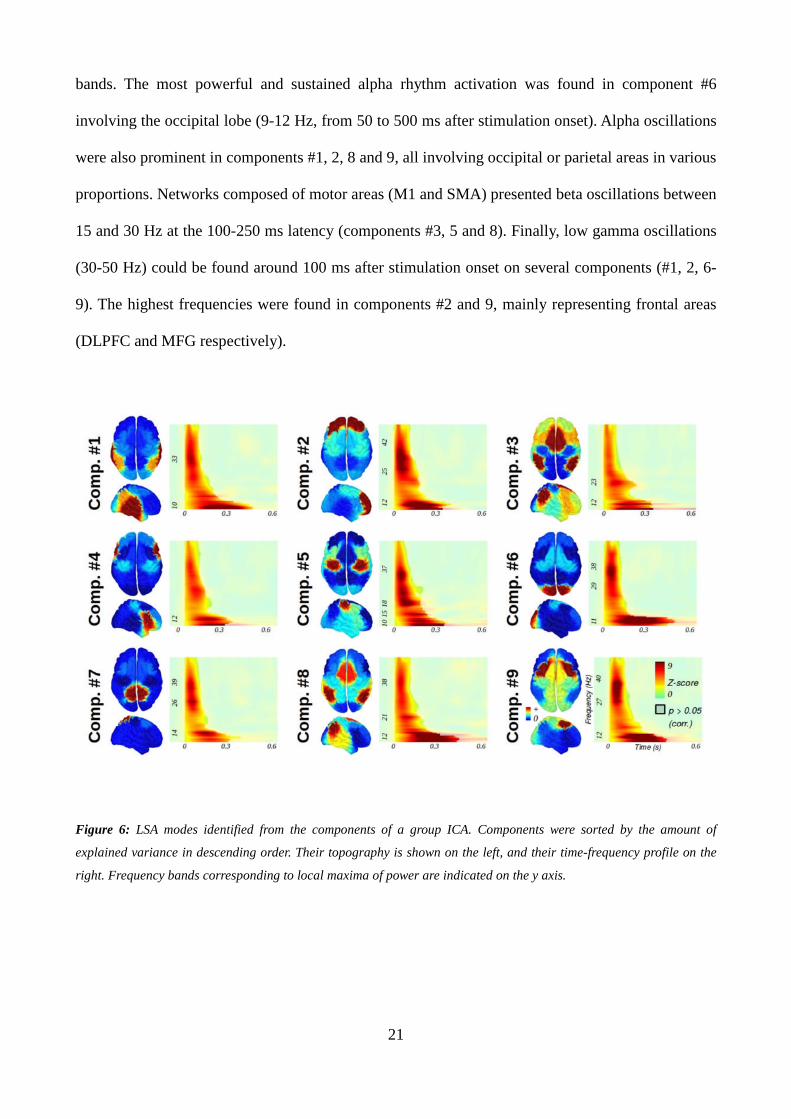
bands. The most powerful and sustained alpha rhythm activation was found in component #6
involving the occipital lobe (9-12 Hz, from 50 to 500 ms after stimulation onset). Alpha oscillations
were also prominent in components #1, 2, 8 and 9, all involving occipital or parietal areas in various
proportions. Networks composed of motor areas (M1 and SMA) presented beta oscillations between
15 and 30 Hz at the 100-250 ms latency (components #3, 5 and 8). Finally, low gamma oscillations
(30-50 Hz) could be found around 100 ms after stimulation onset on several components (#1, 2, 6-
9). The highest frequencies were found in components #2 and 9, mainly representing frontal areas
(DLPFC and MFG respectively).
Figure 6: LSA modes identified from the components of a group ICA. Components were sorted by the amount of
explained variance in descending order. Their topography is shown on the left, and their time-frequency profile on the
right. Frequency bands corresponding to local maxima of power are indicated on the y axis.
22
4 Discussion
We developed here the first attempt to broadly map the intrinsic dynamical properties of human
cortical microcircuits. Our results are promising because homologous regions shared common
properties and distinct neurodynamical responses were obtained in different regions, in particular
along the anterior-posterior axis regarding high EEG frequencies. Under the assumption that
impulse responses of local microcircuits are a proxy of their underlying cytoarchitecture, we
suggest that our study paves the way to functional cytoarchitectonics, where one could envisage to
proceed to the functional parcellation of the human brain using active probing of intrinsic cortical
dynamics. Though our approach still suffers from technical limitations discussed below, and will
remain limited in healthy subjects to the superficial cerebral cortex, it complements current
approaches based on structural and resting state functional MRI because of its different
neurodynamical content.
4.1 Limitations of the study
Nowadays, there is still a lack of fully data-driven and automatic pipelines for processing EEG data
recorded during TMS. In this study, we used one of the latest methodology described in the
literature. Rogasch et al. (2014) recommended the use of two rounds of ICA in order to filter out
artifactual signals. Even if we developed some functions for automatically choosing the components
to be rejected, there is still a need for a visual inspection of each of the remaining components. This
step has to be eliminated in the future because it is time-consuming and introduces expert-
dependent variability.
23
Auditory and somatosensory evoked potentials due to the sensory feedback of the scalp muscle
contractions might also have partly influenced the recorded EEG activity. In principle, the TEP
component at 200 ms could reflect the presence of such unwanted responses, regarding its overall
latency and topography (Rogasch et al., 2014). However, several strong arguments are in favor of
their minimized influence. First, from results not shown in this report, we did not find any
correlation between the intensity of stimulation, which is directly linked to the power of both the
click sound and the induced muscle twitch, and the amplitude of this component, which should be
large in case of purely auditory or sensorimotor artifacts (Hegerl and Juckel, 1993). Second, this
component has already been found and discussed in numerous studies in TMS-EEG (Braack et al.,
2015; Chung et al., 2015). It has been shown to reflect a consistent aftereffect of the stimulation
rather than a pure auditory or somatosensory artifact. Finally, such components have also been
found in intracranial cortico-cortical evoked potentials after direct electrical stimulation of various
areas (Keller et al., 2014). They could thus mainly reflect the activation of remote cortical and sub-
cortical areas connected to the stimulation site.
A final limitation of our work lies in the way we defined the ROIs, i.e. simply by considering the
regions around the targets used by the neuronavigation system. New optimized methods for
modelling the electrical field induced by TMS (Thielscher et al., 2011) could be used in the future
to define ROIs in a more accurate way according to excitation threshold. Furthermore, accurate
biophysical modelling could also improve the tuning of stimulation intensity across sites that would
then be based not only on scalp-cortex distances (Stokes et al., 2007; 2005) but also on the actual
individual anatomy.
24
4.2 Functional cytoarchitectonics
The mode analysis of LSA time series identified networks sharing intrinsic dynamical signatures in
response to TMS single pulses: parietal-temporal, parietal-occipital, frontal, or motor. Parietal-
occipital networks showed a resonant frequency in the alpha band, whereas the motor cortex mainly
oscillated in the beta band. In healthy conditions, our methodology could be further developed as a
functional cytoarchitectonic approach, that is a new non-invasive way to parcel the human
superficial cerebral cortex on the basis of the dynamics of its local neuronal circuits’ response.
Parcellation of the cortex has a long history in neuroscience (Zilles and Amunts, 2010). The search
for precise anatomical boundaries from local cytoarchitectural, myeloarchitectural, or
receptoarchitectural features, is motivated by the assumption that structure determines function,
which is essentially verified for primary areas (Cloutman and Lambon Ralph, 2012). For higher
cognitive functions, computational neuroanatomy also relies upon the definition of hierarchies
based on interlaminar patterns of long range connections to define distributed cortical hierarchies
(Cloutman and Lambon Ralph, 2012; Crick and Koch, 1998; Hilgetag and Grant, 2010). Using
neural mass models, it can be shown evoked EEG responses within cortical hierarchies directly
depend upon the laminar pattern of connectivity (David et al., 2005). Inferences on intrinsic
neuronal dynamics can thus be used to go beyond pure structural parcellation towards an anatomo-
functional one, the main assumption being that neural communication is facilitated between
neuronal populations showing similar resonant frequencies, or modes (Fries, 2005). Nowadays,
non-invasive functional parcellation methods essentially rely on MRI techniques, such as resting-
state functional MRI (Song et al., 2014; Yeo et al., 2011) and diffusion MRI tractography
(Cloutman and Lambon Ralph, 2012; Tang et al., 2014). These methods are able to parcel a defined
brain area in respect to a connectivity score, using both functional and/or anatomical connectivity.
25
However, there is only few similar approaches based on electrophysiological recordings, although it
has been proved that some of its characteristics are strongly modulated by topological and
cytoarchitectural features, including the density of pyramidal cells (Fernández-Ruiz et al., 2013;
Kajikawa and Schroeder, 2011; Murakami and Okada, 2006). Several studies using direct cortical
electrical stimulation also showed that the properties of the neuronal responses depend a lot on the
intrinsic cytoarchitecture or connectivity patterns of the stimulated area, in both animals (Luppino et
al., 1991) and humans (Keller et al., 2014).
We propose that combining TMS and EEG can be used to develop functional cytoarchitectonics
with the ultimate goal to parcel the human brain on the basis of distributed neuronal populations
sharing common dynamical properties of their impulse response. TEP may indeed contain sufficient
information to make inferences on local anatomical differences, because different interconnections
and proportions of pyramidal cells, inhibitory and excitatory interneurons, automatically lead to
differences in the macroscopic electrophysiogical responses to local electrical currents. For
example, our results support the fact that the primary motor cortex has a very specific anatomical
organization, which reacts in a unique manner to the stimulation, potentially due to the absence of
cortical layer IV and to the presence of the large cortico-spinal pyramidal neurons. Furthermore, the
pyramidal neurons of layer V are particularly large in the motor/premotor areas and in the median
part of the occipital lobe (van den Heuvel et al., 2015), where we also observed the greatest early
LSA (from 15 to 45ms, see Fig. 4b). Another interesting example is to note that dynamical
properties of LSA were shared between the superior occipital lobe and the parietal lobe, or between
the parietal lobe and the frontal lobe. It suggests the presence of distributed and overlapping
functional networks resonating in different modes. However, the spatial resolution of our data is
rather coarse because of the limited number of cortical targets and of EEG electrodes. Further
26
studies are needed to go beyond our results, and in particular to challenge the spatial precision of
the segregation that could achieve such a method based on a noninvasive neurophysiological
approach. Moreover, the direct relation between our parcellation results and human
cytoarchitectonics features is yet to be established, by correlating our data with extensive
cytoarchitectonic databases.
Despite the limited spatial precision, the networks emerging from our study highly correlate with
the resting state network (RSN) already described from low frequency signal fluctuations in fMRI
(Song et al., 2014; Yeo et al., 2011) and more recently from phase-amplitude coupling
synchronization between low (theta - alpha) and high (gamma) frequencies in
magnetoencephalography (Florin and Baillet, 2015). Both techniques revealed that the spontaneous
brain activity can be segregated into different RSN, ranging from local sensory-motor networks to
large scale ones involving associated areas. These findings correlate with our results, regarding the
spatial clusterization of LSA. Here using an active probing approach, we further showed that those
networks share some common intrinsic frequency signatures, mainly composed of alpha and low
gamma bands. Since RSN segregation in magnetoencephalography is based on phase-amplitude
coupling between alpha and high gamma bands (Florin and Baillet, 2015), our new approach has
the potential to map precisely the spectral properties of cortical areas supporting cross-frequency
communication for large-scale neural communication.
4.3 Potential applications
The analysis of LSA modes and their related oscillatory contents can be turned into the
identification of biomarkers of the integrity of cortical networks. A recent study supports this idea,
27
by showing that the resonant frequency of the premotor area could be modified in several
psychiatric diseases, like major depressive disorders or schizophrenia (Canali et al., 2015; Ferrarelli
et al., 2012). EEG responses to TMS are also mental state dependent, as recently reported by a
study showing that the resonant frequency of the occipital area was modulated by visual attention
(Herring et al., 2015). Investigating mental state influence on LSA modes could give new insights
regarding the variance of TMS (and repetitive TMS) aftereffects across subjects (Beynel et al.,
2014). Other applications are the monitoring of stroke patient rehabilitation, since LSA directly
reflects the integrity of cortical networks, or the differential diagnosis between vegetative and
minimally conscious states. It has been shown that some of the characteristics of TEPs over the
primary motor cortex, the superior frontal and parietal gyrus contain crucial information for the
diagnosis of disorders of consciousness (Casali et al., 2013; Ragazzoni et al., 2013; Rosanova et al.,
2012). Extending these findings towards the whole cortex could be valuable. Finally, the potential
ability of this methodology in studying resting state networks could give new insights regarding its
modulation by neurodegenerative diseases (Baggio et al., 2015; Spetsieris et al., 2015).
Overall, identifying intrinsic dynamical properties of cortical microcircuits opens many avenues for
modelling both segregation and integration of neural information, with many potential applications
in brain physiology and pathophysiology.
5 Authors contribution
S.H., C.M., A.C. and O.D. designed research. S.H., T.B. and L.B. performed research. S.H., T.B.
and O.D. analysed data. SH, C.M., A.C. and O.D. wrote the paper.

28
6 Acknowledgements
This work was funded by the Pôle Grenoble Cognition and the Agence Nationale pour la Recherche
grant “ANR-15-CE37-0015-01”. Data were acquired on a platform of France Life Imaging network
partly funded by the grant “ANR-11-INBS-0006”. The authors declare no conflict of interest.
29
7 References
Awiszus, F., 2003. TMS and threshold hunting. Supplements to Clinical Neurophysiology 56, 13–
23.
Baggio, H.C., Segura, B., Junque, C., 2015. Resting-state functional brain networks in Parkinson's
disease. CNS Neurosci Ther 21, 793–801. doi:10.1111/cns.12417
Bell, A.J., Sejnowski, T.J., 1995. An information-maximization approach to blind separation and
blind deconvolution. Neural Comput 7, 1129–1159.
Beynel, L., Chauvin, A., Guyader, N., Harquel, S., Marendaz, C., 2014. Age-related changes in
intracortical inhibition are mental-cognitive state-dependent. Biol Psychol 101, 9–12.
doi:10.1016/j.biopsycho.2014.05.011
Blair, R.C., Karniski, W., 1993. An alternative method for significance testing of waveform
difference potentials. Psychophysiology 30, 518–524.
Bortoletto, M., Veniero, D., Thut, G., Miniussi, C., 2015. The contribution of TMS-EEG
coregistration in the exploration of the human cortical connectome. Neurosci Biobehav Rev 49,
114–124. doi:10.1016/j.neubiorev.2014.12.014
Bouyer, J.J., Montaron, M.F., Vahnée, J.M., Albert, M.P., Rougeul, A., 1987. Anatomical
localization of cortical beta rhythms in cat. Neuroscience 22, 863–869.
Braack, ter, E.M., de Vos, C.C., van Putten, M.J.A.M., 2015. Masking the Auditory Evoked
Potential in TMS-EEG: A Comparison of Various Methods. Brain Topogr 28, 520–528.
doi:10.1007/s10548-013-0312-z
Brodmann, K., 1909. Vergleichende Lokalisationslehre der Grosshirnrinde. Johann Ambrosius
Barth, Leipzig.
Calhoun, V.D., Liu, J., Adali, T., 2009. A review of group ICA for fMRI data and ICA for joint
inference of imaging, genetic, and ERP data. NeuroImage 45, S163–72.
doi:10.1016/j.neuroimage.2008.10.057
Canali, P., Sarasso, S., Rosanova, M., Casarotto, S., Sferrazza-Papa, G., Gosseries, O., Fecchio, M.,
Massimini, M., Mariotti, M., Cavallaro, R., Smeraldi, E., Colombo, C., Benedetti, F., 2015.
Shared reduction of oscillatory natural frequencies in bipolar disorder, major depressive
disorder and schizophrenia. J Affect Disord 184, 111–115. doi:10.1016/j.jad.2015.05.043
Carota, F., Posada, A., Harquel, S., Delpuech, C., Bertrand, O., Sirigu, A., 2010. Neural dynamics
of the intention to speak. Cerebral Cortex 20, 1891–1897. doi:10.1093/cercor/bhp255
30
Casali, A.G., Gosseries, O., Rosanova, M., Boly, M., Sarasso, S., Casali, K.R., Casarotto, S., Bruno,
M.-A., Laureys, S., Tononi, G., Massimini, M., 2013. A theoretically based index of
consciousness independent of sensory processing and behavior. Sci Transl Med 5, 198ra105.
doi:10.1126/scitranslmed.3006294
Casarotto, S., Romero Lauro, L.J., Bellina, V., Casali, A.G., Rosanova, M., Pigorini, A., Defendi,
S., Mariotti, M., Massimini, M., 2010. EEG responses to TMS are sensitive to changes in the
perturbation parameters and repeatable over time. PLoS ONE 5, e10281.
doi:10.1371/journal.pone.0010281
Chatfield, M., Mander, A., 2009. The Skillings-Mack test (Friedman test when there are missing
data). Stata J 9, 299–305. doi:10.1002/hbm.20781
Chung, S.W., Rogasch, N.C., Hoy, K.E., Fitzgerald, P.B., 2015. Measuring Brain Stimulation
Induced Changes in Cortical Properties Using TMS-EEG. Brain Stimulation.
doi:10.1016/j.brs.2015.07.029
Cloutman, L.L., Lambon Ralph, M.A., 2012. Connectivity-based structural and functional
parcellation of the human cortex using diffusion imaging and tractography. Front. Neuroanat. 6.
doi:10.3389/fnana.2012.00034
Cona, F., Zavaglia, M., Massimini, M., Rosanova, M., Ursino, M., 2011. A neural mass model of
interconnected regions simulates rhythm propagation observed via TMS-EEG. NeuroImage 57,
1045–1058. doi:10.1016/j.neuroimage.2011.05.007
Crick, F., Koch, C., 1998. Constraints on cortical and thalamic projections: the no-strong-loops
hypothesis. Nature 391, 245–250. doi:10.1038/34584
David, O., Harrison, L., Friston, K.J., 2005. Modelling event-related responses in the brain.
NeuroImage 25, 756–770. doi:10.1016/j.neuroimage.2004.12.030
Economo, Von, C.F., Koskinas, G.N., 1925. Die Cytoarchitektonik der Hirnrinde des erwachsenen
Menschen. Springer, Berlin.
Fernández-Ruiz, A., Muñoz, S., Sancho, M., Makarova, J., Makarov, V.A., Herreras, O., 2013.
Cytoarchitectonic and dynamic origins of giant positive local field potentials in the dentate
gyrus. Journal of Neuroscience 33, 15518–15532. doi:10.1523/JNEUROSCI.0338-13.2013
Ferrarelli, F., Sarasso, S., Guller, Y., Riedner, B.A., Peterson, M.J., Bellesi, M., Massimini, M.,
Postle, B.R., Tononi, G., 2012. Reduced natural oscillatory frequency of frontal thalamocortical
circuits in schizophrenia. Archives of general psychiatry 69, 766–774.
doi:10.1001/archgenpsychiatry.2012.147
Florin, E., Baillet, S., 2015. The brain's resting-state activity is shaped by synchronized cross-
31
frequency coupling of neural oscillations. NeuroImage 111, 26–35.
doi:10.1016/j.neuroimage.2015.01.054
Fries, P., 2005. A mechanism for cognitive dynamics: neuronal communication through neuronal
coherence. Trends Cogn Sci (Regul Ed) 9, 474–480. doi:10.1016/j.tics.2005.08.011
Fuggetta, G., Fiaschi, A., Manganotti, P., 2005. Modulation of cortical oscillatory activities induced
by varying single-pulse transcranial magnetic stimulation intensity over the left primary motor
area: a combined EEG and TMS study. NeuroImage 27, 896–908.
doi:10.1016/j.neuroimage.2005.05.013
Ginhoux, R., Renaud, P., Zorn, L., Goffin, L., Bayle, B., Foucher, J., Lamy, J., Armspach, J.P., de
Mathelin, M., 2013. A custom robot for Transcranial Magnetic Stimulation: first assessment on
healthy subjects. Conf Proc IEEE Eng Med Biol Soc 2013, 5352–5355.
doi:10.1109/EMBC.2013.6610758
Gosseries, O., Sarasso, S., Casarotto, S., Boly, M., Schnakers, C., Napolitani, M., Bruno, M.-A.,
Ledoux, D., Tshibanda, J.-F., Massimini, M., Laureys, S., Rosanova, M., 2015. On the cerebral
origin of EEG responses to TMS: insights from severe cortical lesions. Brain Stimulation 8,
142–149. doi:10.1016/j.brs.2014.10.008
Gramfort, A., Papadopoulo, T., Olivi, E., Clerc, M., 2010. OpenMEEG: opensource software for
quasistatic bioelectromagnetics. Biomed Eng Online 9, 45. doi:10.1186/1475-925X-9-45
Hegerl, U., Juckel, G., 1993. Intensity dependence of auditory evoked potentials as an indicator of
central serotonergic neurotransmission: a new hypothesis. Biol Psychiatry 33, 173–187.
Herring, J.D., Thut, G., Jensen, O., Bergmann, T.O., 2015. Attention Modulates TMS-Locked
Alpha Oscillations in the Visual Cortex. Journal of Neuroscience 35, 14435–14447.
doi:10.1523/JNEUROSCI.1833-15.2015
Hilgetag, C.C., Grant, S., 2010. Cytoarchitectural differences are a key determinant of laminar
projection origins in the visual cortex. NeuroImage 51, 1006–1017.
doi:10.1016/j.neuroimage.2010.03.006
Ilmoniemi, R.J., Virtanen, J., Ruohonen, J., Karhu, J., Aronen, H.J., Näätänen, R., Katila, T., 1997.
Neuronal responses to magnetic stimulation reveal cortical reactivity and connectivity.
Neuroreport 8, 3537–3540.
Janssen, A.M., Oostendorp, T.F., Stegeman, D.F., 2015. The coil orientation dependency of the
electric field induced by TMS for M1 and other brain areas. J NeuroEngineering Rehabil 12,
47. doi:10.1186/s12984-015-0036-2
Jones, E.G., 2000. Microcolumns in the cerebral cortex. Proc Natl Acad Sci USA 97, 5019–5021.
32
Kajikawa, Y., Schroeder, C.E., 2011. How local is the local field potential? Neuron 72, 847–858.
doi:10.1016/j.neuron.2011.09.029
Keller, C.J., Honey, C.J., Mégevand, P., Entz, L., Ulbert, I., Mehta, A.D., 2014. Mapping human
brain networks with cortico-cortical evoked potentials. Philos Trans R Soc Lond, B, Biol Sci
369. doi:10.1098/rstb.2013.0528
Lioumis, P., Kičić, D., Savolainen, P., Mäkelä, J.P., Kahkonen, S., 2009. Reproducibility of TMS-
Evoked EEG responses. Hum Brain Mapp 30, 1387–1396. doi:10.1002/hbm.20608
Löfberg, O., Julkunen, P., Tiihonen, P., Pääkkönen, A., Karhu, J., 2013. Repetition suppression in
the cortical motor and auditory systems resemble each other--a combined TMS and evoked
potential study. Neuroscience 243, 40–45. doi:10.1016/j.neuroscience.2013.03.060
Luppino, G., Matelli, M., Camarda, R.M., Gallese, V., Rizzolatti, G., 1991. Multiple representations
of body movements in mesial area 6 and the adjacent cingulate cortex: an intracortical
microstimulation study in the macaque monkey. J Comp Neurol 311, 463–482.
doi:10.1002/cne.903110403
Makeig, S., Bell, A.J., Jung, T.P., Sejnowski, T.J., 1996. Independent component analysis of
electroencephalographic data, in: Touretzky, D., Mozer, M., Hasselmo, M. (Eds.), Advances in
Neural Information Processing Systems. Advances in Neural Information Processing Systems,
MIT Press Cambridge MA, p. 145:151.
Mattavelli, G., Rosanova, M., Casali, A.G., Papagno, C., Romero Lauro, L.J., 2013. Top-down
interference and cortical responsiveness in face processing: a TMS-EEG study. NeuroImage 76,
24–32. doi:10.1016/j.neuroimage.2013.03.020
Miniussi, C., Thut, G., 2010. Combining TMS and EEG offers new prospects in cognitive
neuroscience. Brain Topogr 22, 249–256. doi:10.1007/s10548-009-0083-8
Mueller, J.K., Grigsby, E.M., Prevosto, V., Petraglia, F.W., Rao, H., Deng, Z.-D., Peterchev, A.V.,
Sommer, M.A., Egner, T., Platt, M.L., Grill, W.M., 2014. Simultaneous transcranial magnetic
stimulation and single-neuron recording in alert non-human primates. Nat Neurosci 17, 1130–
1136. doi:10.1038/nn.3751
Murakami, S., Okada, Y., 2006. Contributions of principal neocortical neurons to
magnetoencephalography and electroencephalography signals. J Physiol (Lond) 575, 925–936.
doi:10.1113/jphysiol.2006.105379
Oostenveld, R., Fries, P., Maris, E., Schoffelen, J.-M., 2011. FieldTrip: Open source software for
advanced analysis of MEG, EEG, and invasive electrophysiological data. Computational
Intelligence and Neuroscience 2011, 156869. doi:10.1155/2011/156869
33
Picazio, S., Veniero, D., Ponzo, V., Caltagirone, C., Gross, J., Thut, G., Koch, G., 2014. Prefrontal
control over motor cortex cycles at beta frequency during movement inhibition. Curr Biol 24,
2940–2945. doi:10.1016/j.cub.2014.10.043
Ragazzoni, A., Pirulli, C., Veniero, D., Feurra, M., Cincotta, M., Giovannelli, F., Chiaramonti, R.,
Lino, M., Rossi, S., Miniussi, C., 2013. Vegetative versus minimally conscious states: a study
using TMS-EEG, sensory and event-related potentials. PLoS ONE 8, e57069.
doi:10.1371/journal.pone.0057069
Reuter, M., Schmansky, N.J., Rosas, H.D., Fischl, B., 2012. Within-subject template estimation for
unbiased longitudinal image analysis. NeuroImage 61, 1402–1418.
doi:10.1016/j.neuroimage.2012.02.084
Rogasch, N.C., Fitzgerald, P.B., 2013. Assessing cortical network properties using TMS-EEG. Hum
Brain Mapp 34, 1652–1669. doi:10.1002/hbm.22016
Rogasch, N.C., Thomson, R.H., Farzan, F., Fitzgibbon, B.M., Bailey, N.W., Hernandez-Pavon,
J.C., Daskalakis, Z.J., Fitzgerald, P.B., 2014. Removing artefacts from TMS-EEG recordings
using independent component analysis: Importance for assessing prefrontal and motor cortex
network properties. NeuroImage 101, 425–439. doi:10.1016/j.neuroimage.2014.07.037
Rosanova, M., Casali, A., Bellina, V., Resta, F., Mariotti, M., Massimini, M., 2009. Natural
frequencies of human corticothalamic circuits. Journal of Neuroscience 29, 7679–7685.
doi:10.1523/JNEUROSCI.0445-09.2009
Rosanova, M., Gosseries, O., Casarotto, S., Boly, M., Casali, A.G., Bruno, M.-A., Mariotti, M.,
Boveroux, P., Tononi, G., Laureys, S., Massimini, M., 2012. Recovery of cortical effective
connectivity and recovery of consciousness in vegetative patients. Brain 135, 1308–1320.
doi:10.1093/brain/awr340
Roy, D., Sigala, R., Breakspear, M., McIntosh, A.R., Jirsa, V.K., Deco, G., Ritter, P., 2014. Using
the virtual brain to reveal the role of oscillations and plasticity in shaping brain's dynamical
landscape. Brain Connect 4, 791–811. doi:10.1089/brain.2014.0252
Salkoff, D.B., Zagha, E., Yüzgeç, Ö., McCormick, D.A., 2015. Synaptic Mechanisms of Tight
Spike Synchrony at Gamma Frequency in Cerebral Cortex. Journal of Neuroscience 35, 10236–
10251. doi:10.1523/JNEUROSCI.0828-15.2015
Song, X., Zhang, Y., Liu, Y., 2014. Frequency specificity of regional homogeneity in the resting-
state human brain. PLoS ONE 9, e86818. doi:10.1371/journal.pone.0086818
Spetsieris, P.G., Ko, J.H., Tang, C.C., Nazem, A., Sako, W., Peng, S., Ma, Y., Dhawan, V.,
Eidelberg, D., 2015. Metabolic resting-state brain networks in health and disease. Proc Natl
34
Acad Sci USA 112, 2563–2568. doi:10.1073/pnas.1411011112
Stokes, M.G., Chambers, C.D., Gould, I.C., English, T., Mcnaught, E., McDonald, O., Mattingley,
J.B., 2007. Distance-adjusted motor threshold for transcranial magnetic stimulation. Clin
Neurophysiol 118, 1617–1625. doi:10.1016/j.clinph.2007.04.004
Stokes, M.G., Chambers, C.D., Gould, I.C., Henderson, T.R., Janko, N.E., Allen, N.B., Mattingley,
J.B., 2005. Simple metric for scaling motor threshold based on scalp-cortex distance:
application to studies using transcranial magnetic stimulation. J Neurophysiol 94, 4520–4527.
doi:10.1152/jn.00067.2005
Tadel, F., Baillet, S., Mosher, J.C., Pantazis, D., Leahy, R.M., 2011. Brainstorm: a user-friendly
application for MEG/EEG analysis. Computational Intelligence and Neuroscience 2011,
879716. doi:10.1155/2011/879716
Tang, X., Yoshida, S., Hsu, J., Huisman, T.A.G.M., Faria, A.V., Oishi, K., Kutten, K., Poretti, A.,
Li, Y., Miller, M.I., Mori, S., 2014. Multi-contrast multi-atlas parcellation of diffusion tensor
imaging of the human brain. PLoS ONE 9, e96985. doi:10.1371/journal.pone.0096985
Thielscher, A., Opitz, A., Windhoff, M., 2011. Impact of the gyral geometry on the electric field
induced by transcranial magnetic stimulation. NeuroImage 54, 234–243.
doi:10.1016/j.neuroimage.2010.07.061
Thut, G., Veniero, D., Romei, V., Miniussi, C., Schyns, P., Gross, J., 2011. Rhythmic TMS causes
local entrainment of natural oscillatory signatures. Curr Biol 21, 1176–1185.
doi:10.1016/j.cub.2011.05.049
van de Ruit, M., Perenboom, M.J.L., Grey, M.J., 2015. TMS brain mapping in less than two
minutes. Brain Stimulation 8, 231–239. doi:10.1016/j.brs.2014.10.020
van den Heuvel, M.P., Scholtens, L.H., Feldman Barrett, L., Hilgetag, C.C., de Reus, M.A., 2015.
Bridging Cytoarchitectonics and Connectomics in Human Cerebral Cortex. Journal of
Neuroscience 35, 13943–13948. doi:10.1523/JNEUROSCI.2630-15.2015
Vernet, M., Brem, A.-K., Farzan, F., Pascual-Leone, A., 2015. Synchronous and opposite roles of
the parietal and prefrontal cortices in bistable perception: a double-coil TMS-EEG study.
Cortex; a journal devoted to the study of the nervous system and behavior 64, 78–88.
doi:10.1016/j.cortex.2014.09.021
Wassermann, E., Epstein, C., Ziemann, U., 2012. The Oxford handbook of transcranial stimulation,
oxfordhandbooks.com. Oxford University Press.
doi:10.1093/oxfordhb/9780198568926.001.0001
Yeo, B.T.T., Krienen, F.M., Sepulcre, J., Sabuncu, M.R., Lashkari, D., Hollinshead, M., Roffman,

35
J.L., Smoller, J.W., Zöllei, L., Polimeni, J.R., Fischl, B., Liu, H., Buckner, R.L., 2011. The
organization of the human cerebral cortex estimated by intrinsic functional connectivity. J
Neurophysiol 106, 1125–1165. doi:10.1152/jn.00338.2011
Zilles, K., Amunts, K., 2010. Centenary of Brodmann's map — conception and fate. Nat Rev
Neurosci 11, 139–145. doi:10.1038/nrn2776