Embed Size (px)
Citation preview

Mapping Forest Data WorkflowsHessen-Forst Enterprise Updates Its GIS Data Management SystemBy Wolfgang Fischer, Hessen-Forst, Germany, and Martin Stöcker, con terra GmbH, Germany
Creating maps about the volume and condi-
tion of forest stands begins with good data. A
data management workflow that includes col-
lecting, managing, handling, and provisioning
forest data is integral for ensuring quality and
accuracy within forestry management plans.
Hessen-Forst Enterprise is one of the
largest forest organizations in western
Europe. Its managers wanted to implement
a workflow management system for GIS data
collection and editing processes. This would
save time, reduce costs, and improve data
quality. So Hessen-Forst asked Esri partner
con terra GmbH to build a GIS data manage-
ment workflow application specifically for
its inventory processes. To do this, the GIS
service company used Esri’s ArcGIS Workflow
Manager, an ArcGIS for Desktop extension,
for Forestry Fall 2012
Esri News
Foresters use a GIS job tracking program to access data, tools, and symbols for each step in building a forest inventory report.
to customize an automated job tracking
system to help users successfully complete
the organization’s forest inventory processes.
The workflow tools were combined with the
forestry business’s basic GIS tools package,
FoBIS, and a data model.
Once Hessen-Forst implemented the solu-
tion, foresters began using the GIS to guide
them through processes such as updating

2 Esri News for Forestry Fall 2012
Contents1 Mapping Forest Data Workflows
4 Esri Meeting Gives GIS Users New Ideas and Networking Opportunities
4 Forest Cover Evaluation Tool
5 Esri Career Opportunities
5 Tropical Forest Dataset Available on ArcGIS Online
5 Save the Date
6 Cable Harvest Planning System Improves Accuracy
The information contained in this work is the exclusive property of Esri or its licensors. This work is protected under United States copyright law and other international copyright treaties and conventions. No part of this work may be reproduced or transmitted in any form or by any means, electronic or mechanical, including photocopying and recording, or by any information storage or retrieval system, except as expressly permitted in writing by Esri. All requests should be sent to Attention: Contracts and Legal Services Manager, Esri, 380 New York Street, Redlands, CA 92373-8100 usa.
The information contained in this work is subject to change without notice.
The Geographic Advantage, Esri, the Esri globe logo, 3D Analyst, ArcAtlas, ArcCatalog, ArcData, ArcDoc, ArcEditor, ArcExplorer, ArcGIS, the ArcGIS logo, ArcGlobe, ArcIMS, ARC/INFO, ArcInfo, ArcLogistics, ArcMap, ArcNetwork, ArcNews, ArcObjects, ArcPad, ArcPress, ArcReader, ArcSDE, ArcSurvey, ArcToolbox, ArcTools, ArcUser, ArcView, ArcVoyager, ArcWatch, ArcWeb, ArcWorld, ArcXML, Business Analyst Online, BusinessMAP, CommunityInfo, EDN, Geography Network, GIS Day, MapData, MapObjects, Maplex, MapStudio, ModelBuilder, MOLE, NetEngine, RouteMAP, SDE, Sourcebook•America, StreetMap, Tapestry, @esri.com, esri.com, arcgis.com, geographynetwork.com, gis.com, and gisday.com are trademarks, service marks, or registered marks of Esri in the United States, the European Community, or certain other jurisdictions.
Other companies and products or services mentioned herein may be trademarks, service marks, or registered marks of their respective mark owners.
Copyright © 2012 Esri.All rights reserved. Printed in the United States of America.
Fall 2012
Esri News for Forestry is a publication of the Forestry Group of Esri.
To contact the Esri Desktop Order Center, call 1-800-447-9778 within the United States or 909-793-2853, ext. 1-1235, outside the United States.
Visit the Esri website at esri.com.
View Esri News for Forestry online at esri.com/forestry or scan the code below with your smartphone.
Advertise with Us
E-mail [email protected].
Submit Content
To submit articles for publication in Esri News for Forestry, contact Barbara Shields at [email protected].
Manage Your Subscription
To update your mailing address or subscribe or unsubscribe to Esri publications, visit esri.com/manageyoursubscription.
International customers should contact an Esri distributor to manage their subscriptions.
For a directory of distributors, visit esri.com/distributors.
Circulation Services
For back issues, missed issues, and other circulation services, e-mail [email protected]; call 909-793-2853, extension 2778; or fax 909-798-0560.

3Fall 2012 esri.com/forestry
Mapping Forest Data Workflows continued from page 1
For example, following the steps in a
process, the user comes to a step and clicks a
button to execute a smart launch of ArcMap.
ArcGIS Workflow Manager sets up an environ-
ment in which the user will complete the
relevant GIS and non-GIS tasks and shows an
accompanying workflow diagram. When the
user clicks a step on the diagram, it launches
the tools and automated processes the user
needs to finish the step. When done, the user
clicks the Complete button and is ready to
move to the next step in the workflow.
Hessen-Forst has used Esri technologies
since it first began digitally managing geo-
data. Today, all the enterprise’s sectors have
access to necessary geoinformation using Esri
the inventory database after a heavy storm.
ArcGIS Workflow Manager tracks the status
and progress of the job and generates a
detailed history of work activity. Its functions
include job tracking, version management,
multiple data warehouse support, history
tracking, change detection, spatial notifica-
tions, and reporting.
To start a job, the user selects from a list
of job types and job templates that outline
the steps that need to be completed. The
set of each job’s operational parts is its
workflow, which contains the steps required
to complete the job. The user navigates the
workflow using tools to complete the steps in
the process.
technology. The addition of the ArcGIS exten-
sion was easy for users to adopt.
“Because employees are already familiar
with core ArcGIS technology, the solution
is extremely easy for them to use,” said
Wolfgang Fischer, head of GIS development
at Hessen-Forst. “ArcGIS Workflow Manager
enables us to map all inventory processes.
It also makes us aware of work processes
we need to add as well as those that are
no longer necessary. The entire process is
documented and transparent.”
Hessen-Forst recently launched its next-
generation GIS, ForstGIS_NG. Because it too
has been built on ArcGIS, staff can continue
to use ArcGIS Workflow Manager. Hessen-
Forst has expanded its applica-
tions of GIS work processes to
perform additional inventories,
map storm damage, study forest
conditions and surrounding
infrastructure, identify suit-
able areas for industrial timber
production, and more. GIS helps
the enterprise’s forest managers
make informed decisions and
meet goals for sustainable forest
management.
Esri Deutschland GmbH and
con terra developed FoBIS. Learn
more by visiting the ArcGIS
Workflow Manager page at
esri.com or contacting Martin
Stöcker at m.stoecker@conterra.
de, or visit esri.com and search on
ArcGIS Workflow Manager.
ArcGIS Workflow Manager shows the necessary steps to manage the forest inventory including data management and update.

4 Esri News for Forestry Fall 2012
Approximately 150 forestry professionals from
around the world descended on Redlands,
California, to attend the second annual Esri
Forestry GIS Conference. The gathering, which
took place May 1–3, 2012, offered presenta-
tions by Ray Risco, president of Weyerhaeuser
Solutions Inc., and Joseph K. Berry, principal
of Berry & Associates Spatial Information
Esri Meeting Gives GIS Users New Ideas and Networking OpportunitiesBy Steve Wilent, Editor, The Forestry Source
Systems and a leading educator in the applica-
tion of GIS technology. Foresters presented
forestry applications that showed how they
have used GIS to address fire risk in Texas,
cable logging in New Zealand, and more.
Among the presenters at this year’s confer-
ence was Society of American Foresters
(SAF) executive vice president and chief
Forest Cover Evaluation ToolThe InFOREST application is used to evaluate how forest cover impacts water and air qual-
ity and show the effects of changing land use on particular tracts of forest or farmland in
Virginia. Users can do basic mapping and view various layers. These layers include aerial im-
agery, topography, streets and roads, watershed boundaries, and forest conservation value.
Users can estimate various ecosystem services, such as carbon sequestration from
forests and nutrient and sediment runoff from various land covers. InFOREST was devel-
oped for the Virginia Department of Forestry in partnership with Virginia Tech and the
Department of Game and Inland Fisheries with funding from Dominion Virginia Power and
a US Forest Service grant.
Learn more about InFOREST and use the program at inforest.frec.vt.edu.
executive officer Michael Goergen, who spoke
to attendees about the natural resources
professionals the society represents, SAF’s
efforts to promote forestry and its benefits
in the twenty-first century, and the role GIS
technology can play in helping SAF achieve
that objective.
“At its core, SAF is about providing excel-
lence in forest management, and as the field
evolves, we’re continually working to be as
professional and responsive as possible,”
said Goergen. He explained that the world is
changing rapidly, and SAF needs to be nimble
enough to keep pace with it and perform at
the highest levels. Combining that clarity of
vision with the latest technologies will enable
organizations to advance the practice of
forestry for years to come.
Goergen closed his remarks with an invita-
tion to members of the user group to join
SAF and lend their technological skills and
expertise to the society’s efforts. According
to Mark Books, GIS forester at Fort A. P. Hill
and president of the Esri Forestry Group, the
aim of the conference was to get forestry GIS
professionals in the same room to connect
with one another and share ideas.
“The idea of the user group is to develop
a one-stop shop for all things forestry and
GIS. So this conference is different from Esri
user conferences in that it is organized by this
community, for this community,” said Books.
“It provides us with an opportunity to get
together with peers to exchange stories and
hash out solutions.”
Although similar in intent and style to last
year’s gathering, Books explained that the
2012 conference was more focused on user
Everyone participated in hands-on learning at the Esri Forestry GIS Conference.
Forestry inventory skills are taught in the woods using ArcGIS on a tablet.

5Fall 2012 esri.com/forestry
Esri Career Opportunities• Account Executive–Forestry—Leverage
your industry experience to help deliver
geospatial solutions that meet business
objectives. Use your understanding of the
forestry market to sell strategic enterprise
solutions to forest and land management
organizations. • Agriculture Industry Solutions
Manager—Provide coordination and
management for marketing and solutions
development efforts for GIS products
and services for agriculture. Assess and
identify practical applications of GIS for
agriculture.• Consultant/Project Manager—Natural
Resources/Environmental—Use your
consulting and project management
experience to help clients transform
real-world needs into state-of-the-art,
GIS technology-driven solutions. Lead
project teams and manage the entire GIS
implementation process.
To learn more and apply,go to esri.com/careers anduse the Job Search tool.
National Association of State Foresters
September 17–21, 2012 Cheyenne, Wyoming, USAstateforesters.org
Forest Technology User Conference 2012
October 16–18,2012Greenville, Florida, USAhttp://thinkf4.com/articles/events/for-est-technology-users-conference-2012
Society of American Foresters National Convention
October 24–28, 2012Spokane, Washington, USAwww.safnet.org/natcon12
Conference of the Parties (COP) 18
November 26–December 7, 2012Doha, Qatarforestsclimatechange.org
5th International Fire Ecology and Management Congress
December 3–7, 2012Portland, Oregon, USAhttp://afefirecongress.org
Esri Forestry GIS Conference
May 14–16, 2013Redlands, California, USAesri.com/events/forestry
Esri International User Conference
July 8–12, 2013San Diego, California, USAesri.com/uc
Save the Date
Tropical Forest Dataset Available on ArcGIS OnlineWoods Hole Research Center (WHRC) is
using Esri’s ArcGIS Online to make its new
carbon stock datasets available. Scientists
and decision makers from around the world
can now access this data and use GIS to
study tropical forest carbon density and
change, which impacts the atmosphere and
affects climate change. Data consumers can
access the dataset at arcgis.com.
needs—a direct result of users’ participation
in the planning committee.
Based on the feedback he receives, Books
noted that other members of the user group
are just as appreciative, both for those new
insights and ideas and for the general sense
of camaraderie the conference provides.
“From what I hear, people are glad that they
came. Again, people are coming at this from
[different] perspectives, and some people
need to know nuts and bolts and some
people need to see the bigger picture.
They all came away with what they needed,”
Books concluded. “There is no substitute for
having three days to talk shop with natural
resources professionals, who work with GIS.”
For more information, contact Mark Books, CF, Esri Forestry Grouppresident, at [email protected].
This article was published in The Forestry Source magazine, June 2012.
A conference workshop trainer teaches how to measure a tree using a laser measurement.
6 Esri News for Forestry Fall 2012
Cable Harvest Planning SystemImproves AccuracyBy Barbara Shields, Esri Writer
To create a cable timber harvest plan, the
planner needs to determine the timber
payload that can be pulled to the hauler at
different harvest locations. This requires
analyzing a location’s topography and creat-
ing hauling profiles that radiate out from the
intended hauler’s location. By including in the
calculation both the terrain and the hauler’s
attributes, such as rigging capacity and
harvesting method, one can determine where
haulers need to be positioned to harvest with
the greatest efficiency.
The New Zealand Research Institute
(Scion) and Geographic Business Solutions
(GBS) worked together to develop the Cable
Harvest Planning System (CHPS). CHPS is an
extension for ArcGIS software from Esri for
payload analysis. It creates multiple profiles
for potential hauler locations and reveals likely
problem areas for the planner to consider
when designing cable configurations.
CHPS supports cost analysis and decision
making. By using high-resolution terrain data
queries the data, and the software generates
a view and may perform additional calcula-
tions. The person can also employ GIS to see
relationships, and model the data for rich
analysis such as determining an optimal cable
harvest configuration.
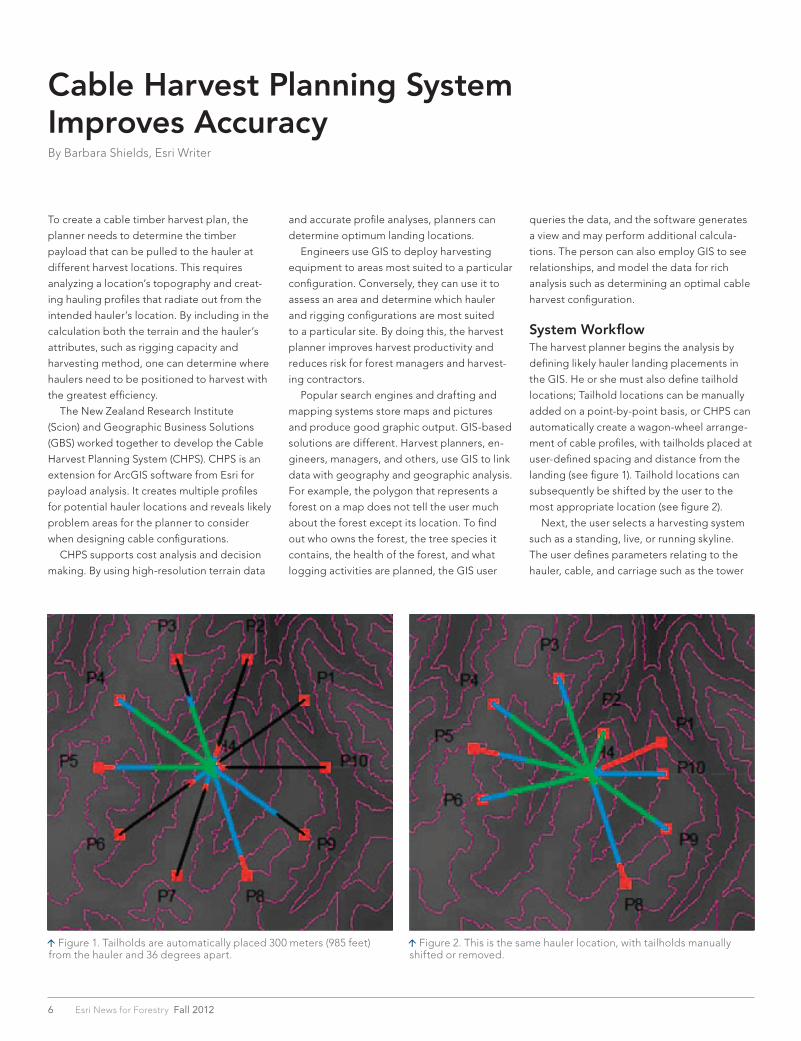
System WorkflowThe harvest planner begins the analysis by
defining likely hauler landing placements in
the GIS. He or she must also define tailhold
locations; Tailhold locations can be manually
added on a point-by-point basis, or CHPS can
automatically create a wagon-wheel arrange-
ment of cable profiles, with tailholds placed at
user-defined spacing and distance from the
landing (see figure 1). Tailhold locations can
subsequently be shifted by the user to the
most appropriate location (see figure 2).
Next, the user selects a harvesting system
such as a standing, live, or running skyline.
The user defines parameters relating to the
hauler, cable, and carriage such as the tower
and accurate profile analyses, planners can
determine optimum landing locations.
Engineers use GIS to deploy harvesting
equipment to areas most suited to a particular
configuration. Conversely, they can use it to
assess an area and determine which hauler
and rigging configurations are most suited
to a particular site. By doing this, the harvest
planner improves harvest productivity and
reduces risk for forest managers and harvest-
ing contractors.
Popular search engines and drafting and
mapping systems store maps and pictures
and produce good graphic output. GIS-based
solutions are different. Harvest planners, en-
gineers, managers, and others, use GIS to link
data with geography and geographic analysis.
For example, the polygon that represents a
forest on a map does not tell the user much
about the forest except its location. To find
out who owns the forest, the tree species it
contains, the health of the forest, and what
logging activities are planned, the GIS user
Figure 1. Tailholds are automatically placed 300 meters (985 feet) from the hauler and 36 degrees apart.
Figure 2. This is the same hauler location, with tailholds manually shifted or removed.
7Fall 2012 esri.com/forestry
height, cable weight, and drum diameter.
Information on equipment specifications is
provided in default libraries.
For every tailhold location, CHPS then deter-
mines the terrain points from the contours or
a digital elevation model (DEM) and calculates
the deflection and maximum payload possible
at each point. Based on the user’s selection of
system and profile parameters, CHPS calcu-
lates the rigging length that will be needed.
The harvest planner can look at environ-
mental constraints by accessing the company’s
geodatabase for sensitive land features such
as waterways or riparian buffer zones. These
constraints are used to create simulations of a
full suspension of hauler payloads over these
areas.
Specific outputs from the system include
harvest maps, profile charts and tables, haul
distance computations, and rigging length
requirement reports.
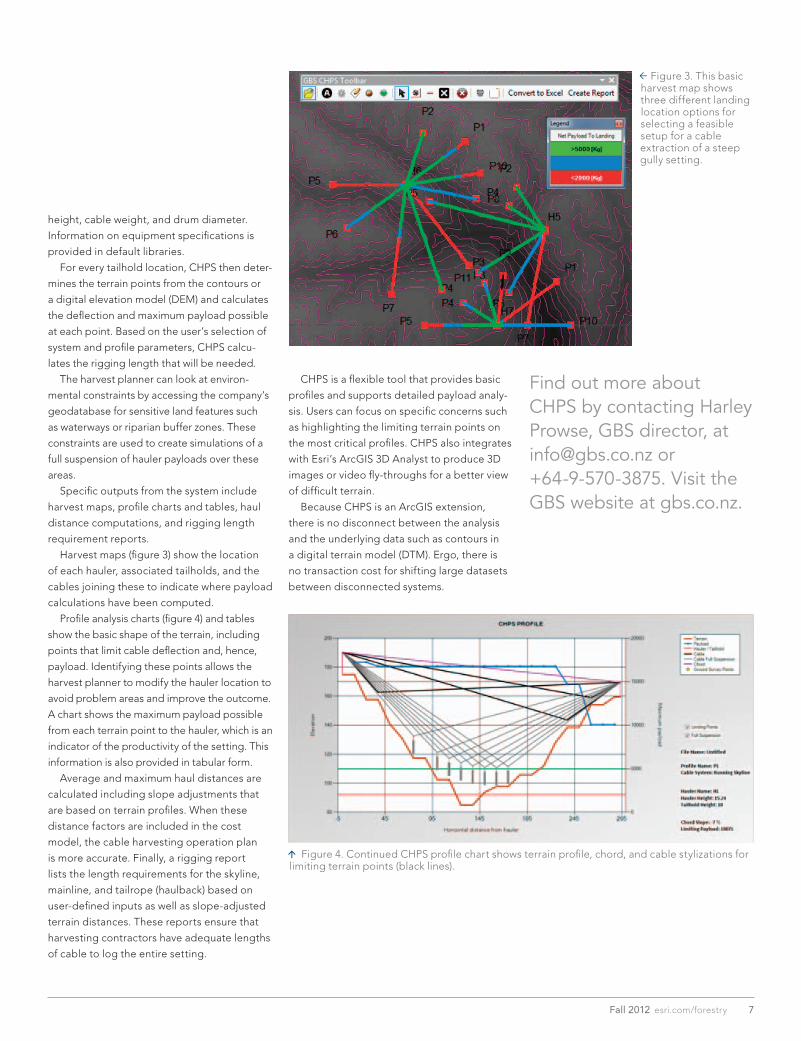
Harvest maps (figure 3) show the location
of each hauler, associated tailholds, and the
cables joining these to indicate where payload
calculations have been computed.
Profile analysis charts (figure 4) and tables
show the basic shape of the terrain, including
points that limit cable deflection and, hence,
payload. Identifying these points allows the
harvest planner to modify the hauler location to
avoid problem areas and improve the outcome.
A chart shows the maximum payload possible
from each terrain point to the hauler, which is an
indicator of the productivity of the setting. This
information is also provided in tabular form.
Average and maximum haul distances are
calculated including slope adjustments that
are based on terrain profiles. When these
distance factors are included in the cost
model, the cable harvesting operation plan
is more accurate. Finally, a rigging report
lists the length requirements for the skyline,
mainline, and tailrope (haulback) based on
user-defined inputs as well as slope-adjusted
terrain distances. These reports ensure that
harvesting contractors have adequate lengths
of cable to log the entire setting.
CHPS is a flexible tool that provides basic
profiles and supports detailed payload analy-
sis. Users can focus on specific concerns such
as highlighting the limiting terrain points on
the most critical profiles. CHPS also integrates
with Esri’s ArcGIS 3D Analyst to produce 3D
images or video fly-throughs for a better view
of difficult terrain.
Because CHPS is an ArcGIS extension,
there is no disconnect between the analysis
and the underlying data such as contours in
a digital terrain model (DTM). Ergo, there is
no transaction cost for shifting large datasets
between disconnected systems.
Find out more about CHPS by contacting Harley Prowse, GBS director, at [email protected] or +64-9-570-3875. Visit the GBS website at gbs.co.nz.
Figure 4. Continued CHPS profile chart shows terrain profile, chord, and cable stylizations for limiting terrain points (black lines).
Ñ Figure 3. This basic harvest map shows three different landing location options for selecting a feasible setup for a cable extraction of a steep gully setting.

30-day free trial: esri.com/agol
Creating your own map from maps published by other users is just one of many ways to take
advantage of the rich collection of data and resources ArcGISSM
Online makes available to you.
Welcome to the new frontier in geographic information systems.
ArcGIS Online
Copyright © 2012 Esri. All rights reserved.
30-day free trial: esri.com/agol
Creating your own map from maps published by other users is just one of many ways to take
advantage of the rich collection of data and resources ArcGISSM
Online makes available to you.
Welcome to the new frontier in geographic information systems.
ArcGIS Online
Maps made better.(Some assembly required.)
Copyright © 2012 Esri. All rights reserved.
Presorted Standard
US Postage Paid Esri
380 New York Street Redlands, California 92373-8100 usa
131416 QUAD14.2M10/12tk