Embed Size (px)
DESCRIPTION
Portfolio from the University of Kentucky College of Design
Citation preview
marc matthew gannon | design portfoliouniversity of kentucky

project index
houseboat to energy efficient residences [HBEER] | spring 2012with eric stephens
professors: david biagi + michael jacobs + bruce swetnam
henderson municipal power and lighting [HMPL 1] | spring 2011with bart gillespie + brian richter + caroline wahl
professor martin summers
between city and univer [city] | fall 2012with lauren gilliland
professor martin summers
paducah gaseous diffusion plant [PGDP] | fall 2011with margaret clines + anne schwab + caroline wahl
professor gary rohrbacher
bereavement center at st. elizabeth’s | spring 2010with taisa sehić
professor kyle miller
granary to riverfront aquarium | fall 2010with sara copic
professor martin summers
translations series | spring 2012
material lavawith patrick davis + kendall latham + madelynn ringo + caroline wahl
cube moduleswith caroline wahl
modes of makingwith brad ostendorf + mark thomas
professor kyle miller with adam fure + brennan buck + clark thenhaus
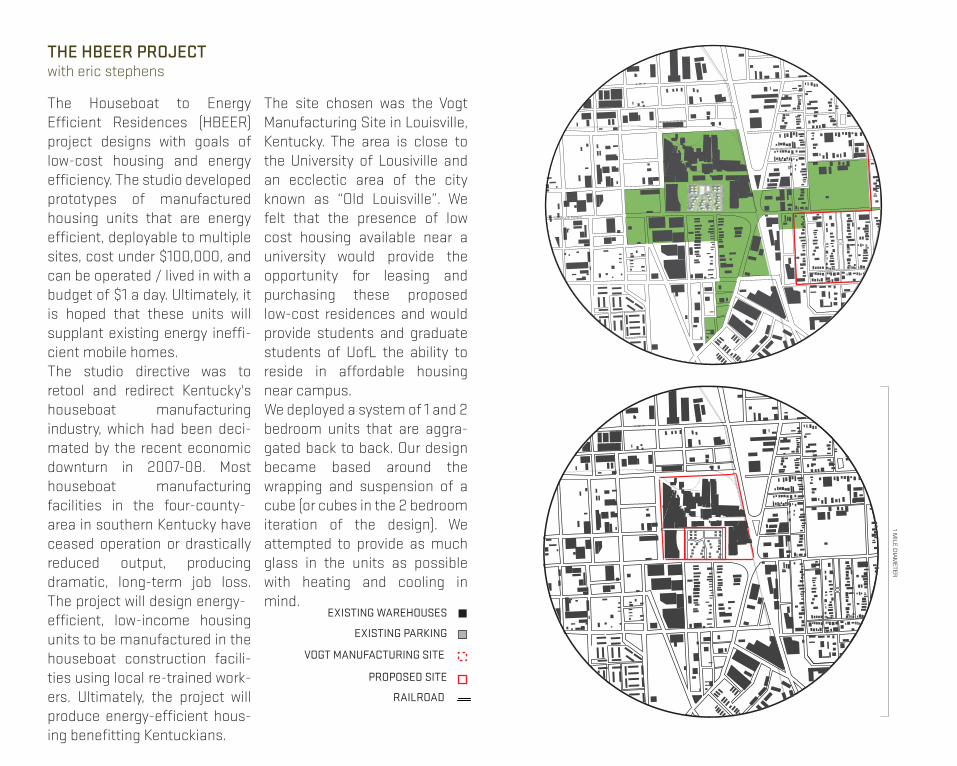
EXISTING WAREHOUSES
EXISTING PARKING
VOGT MANUFACTURING SITE
PROPOSED SITE
RAILROAD
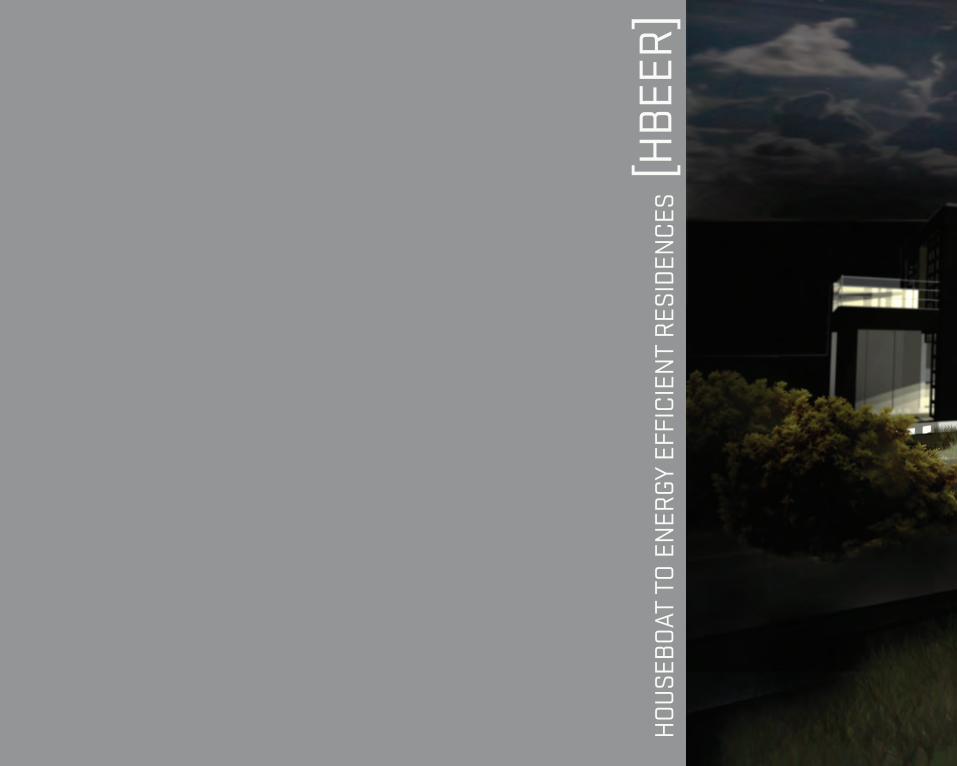
The Houseboat to Energy Efficient Residences (HBEER) project designs with goals of low-cost housing and energy efficiency. The studio developed prototypes of manufactured housing units that are energy efficient, deployable to multiple sites, cost under $100,000, and can be operated / lived in with a budget of $1 a day. Ultimately, it is hoped that these units will supplant existing energy ineffi-cient mobile homes. The studio directive was to retool and redirect Kentucky's houseboat manufacturing industry, which had been deci-mated by the recent economic downturn in 2007-08. Most houseboat manufacturing facilities in the four-county-area in southern Kentucky have ceased operation or drastically reduced output, producing dramatic, long-term job loss. The project will design energy-efficient, low-income housing units to be manufactured in the houseboat construction facili-ties using local re-trained work-ers. Ultimately, the project will produce energy-efficient hous-ing benefitting Kentuckians.
THE HBEER PROJECT1 M
ILE DIAM
ETER
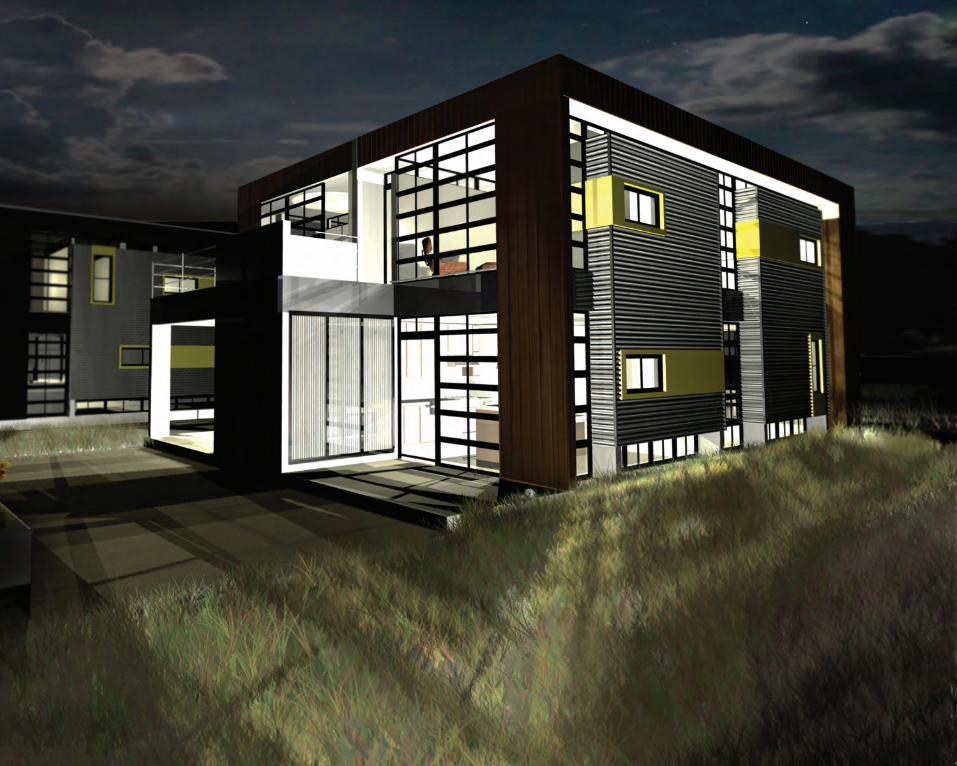
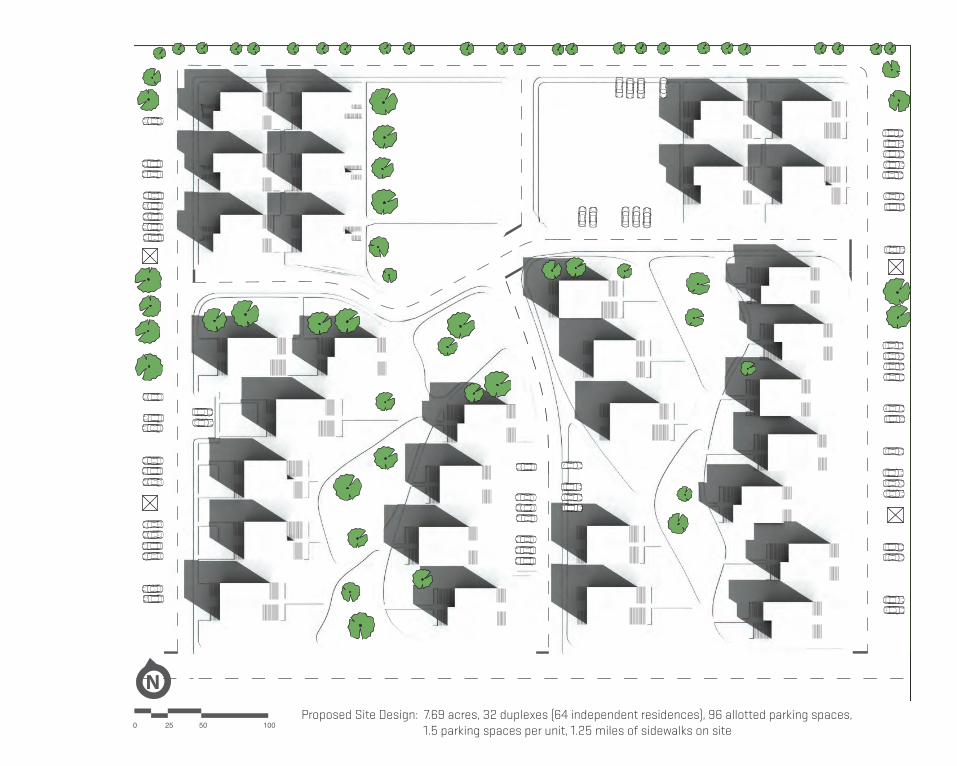
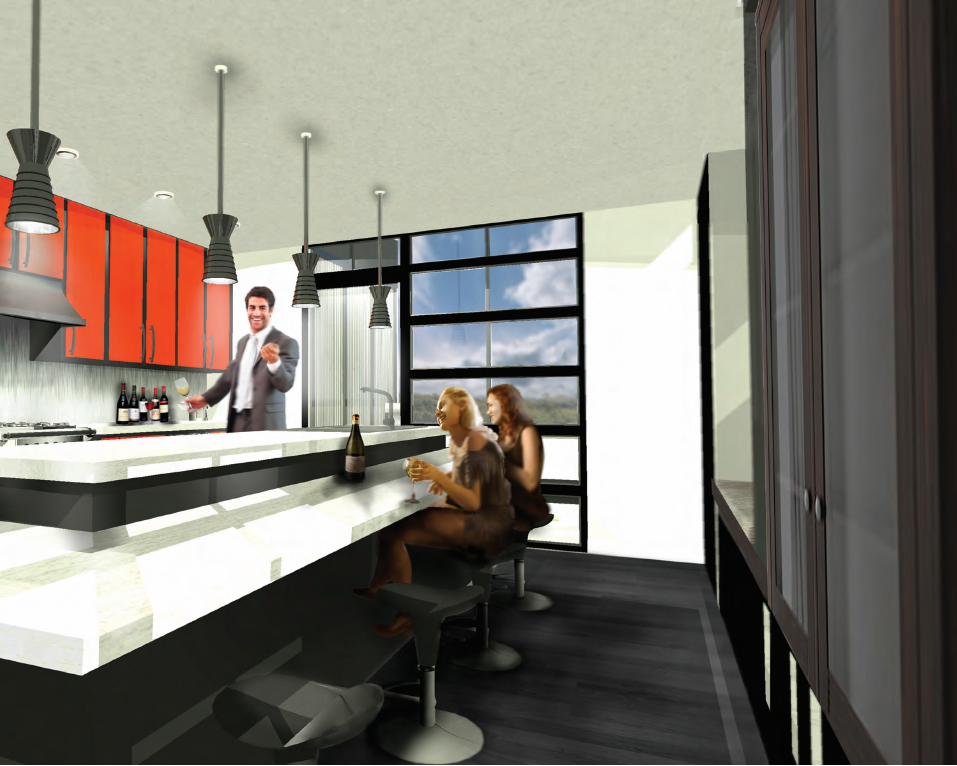
The site chosen was the Vogt Manufacturing Site in Louisville, Kentucky. The area is close to the University of Lousiville and an ecclectic area of the city known as “Old Louisville”. We felt that the presence of low cost housing available near a university would provide the opportunity for leasing and purchasing these proposed low-cost residences and would provide students and graduate students of UofL the ability to reside in affordable housing near campus. We deployed a system of 1 and 2 bedroom units that are aggra-gated back to back. Our design became based around the wrapping and suspension of a cube (or cubes in the 2 bedroom iteration of the design). We attempted to provide as much glass in the units as possible with heating and cooling in mind.
MAGNOLIA AVENUE
with eric stephens
N
0 25 50 100Proposed Site Design: 7.69 acres, 32 duplexes (64 independent residences), 96 allotted parking spaces, 1.5 parking spaces per unit, 1.25 miles of sidewalks on site
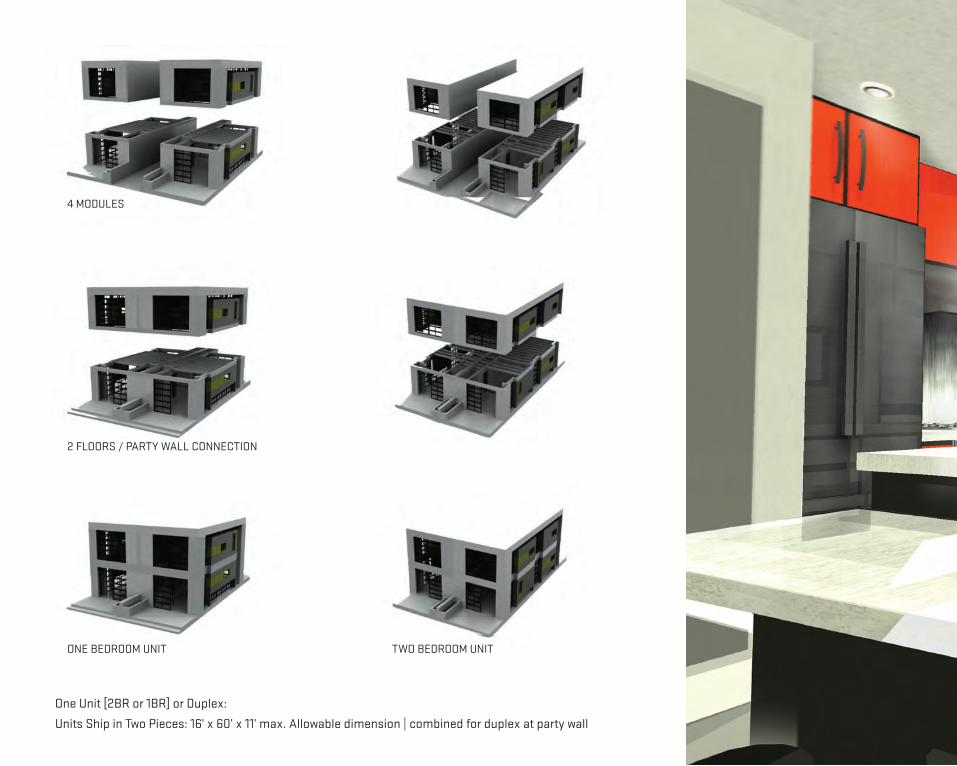
One Unit [2BR or 1BR] or Duplex:
4 MODULES
2 FLOORS / PARTY WALL CONNECTION
ONE BEDROOM UNIT TWO BEDROOM UNIT
Units Ship in Two Pieces: 16’ x 60’ x 11’ max. Allowable dimension | combined for duplex at party wall
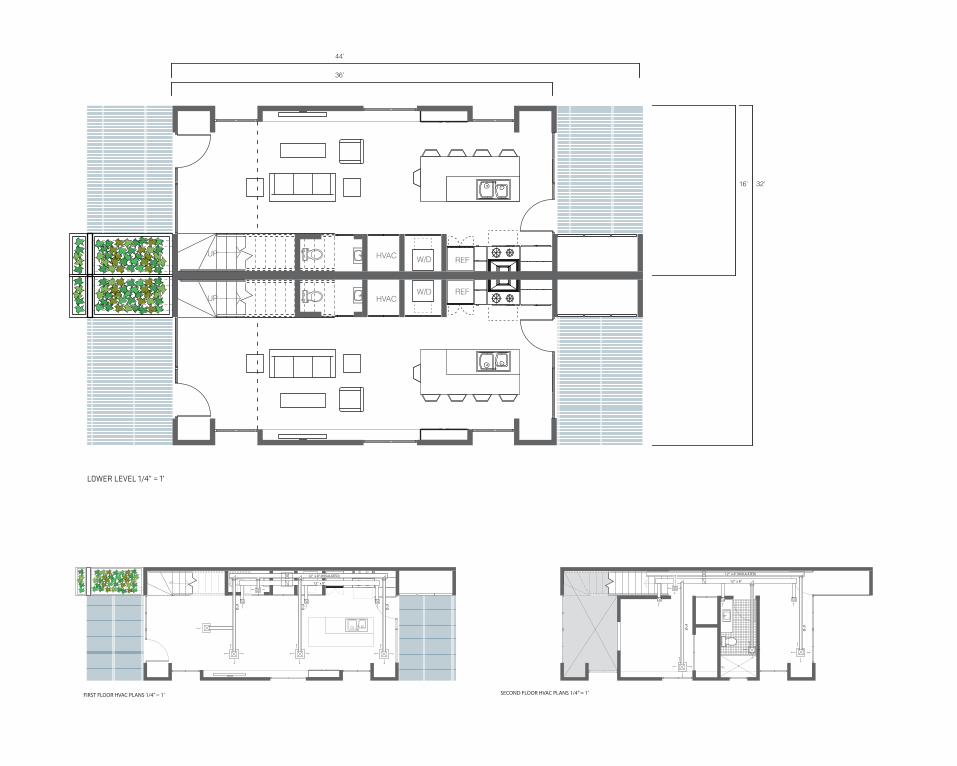
REFW/DHVACUP
REFW/DHVACUP
LOWER LEVEL 1/4” = 1’
36’
44’
16’ 32’
UP
6” O
6” O
6” O
12” x 8” (INSULATED)
12” x 8”
FIRST FLOOR HVAC PLANS 1/4” = 1’
12” x 8” (INSULATED)
12” x 8”
SECOND FLOOR HVAC PLANS 1/4” = 1’
6” O
6” O
REFW/DHVACUP
SRRRSSS
S
WP
4
** *
WP
S
S
CB
SB
FIRST FLOOR ELECTRICAL 1/4” = 1’
DOWN RR
R
S
RRR
SS
RRR
S
R
SECOND FLOOR ELECTRICAL 1/4” = 1’
DOWN
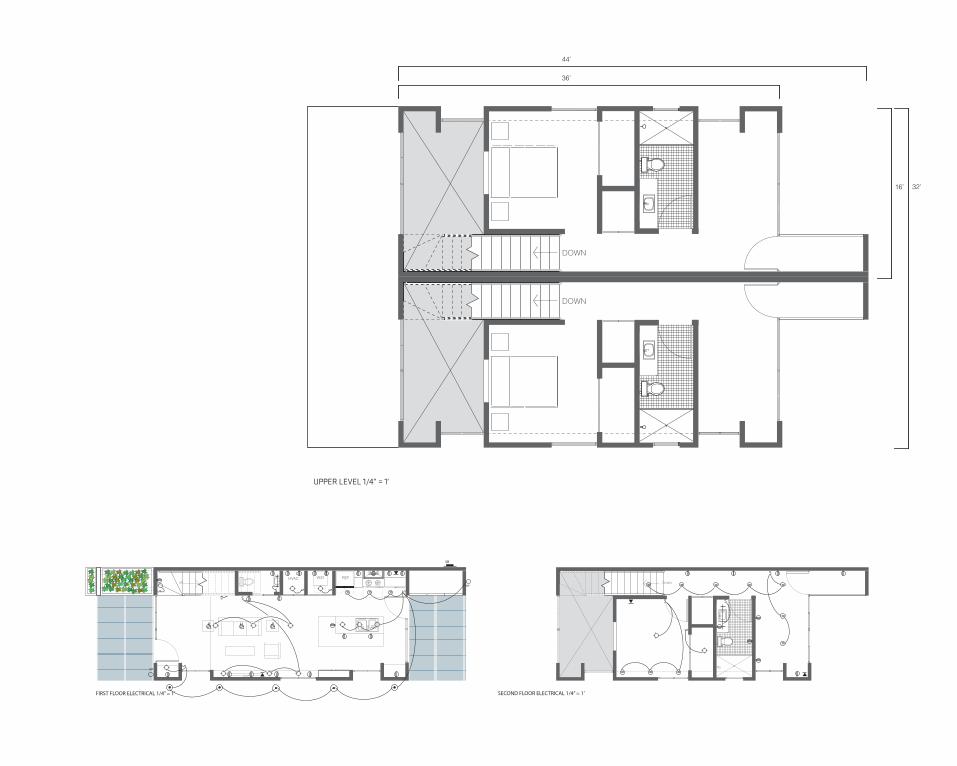
UPPER LEVEL 1/4” = 1’
DOWN
36’
44’
16’ 32’
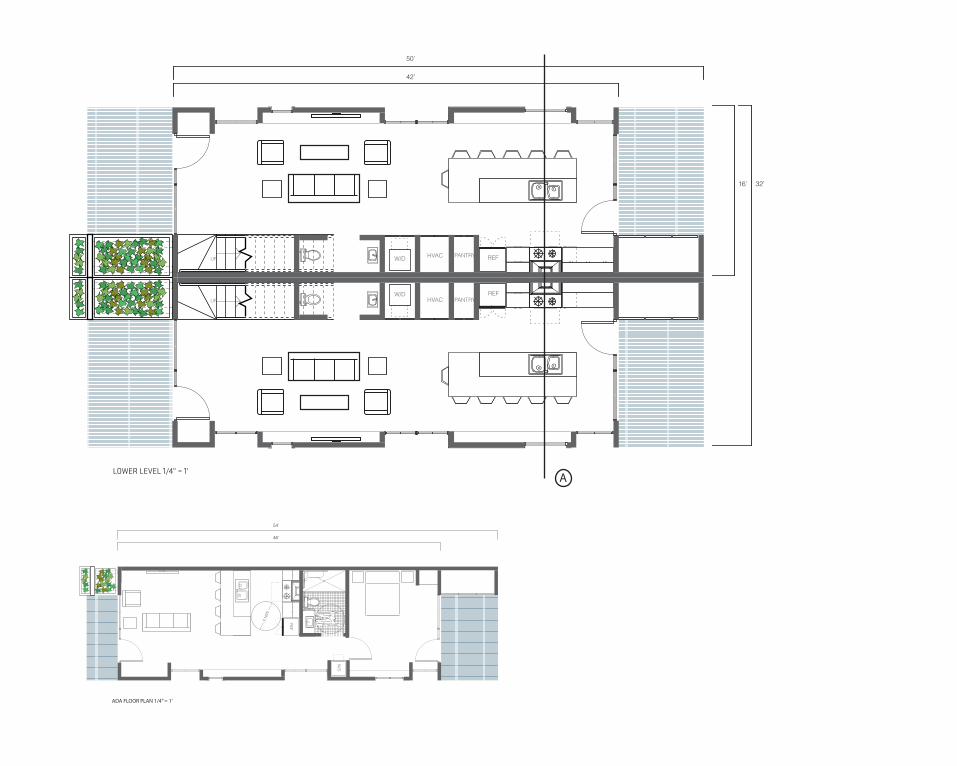
REFW/DHVAC PANTRYUP
REFW/D HVAC PANTRYUP
LOWER LEVEL 1/4” = 1’
42’
50’
A
REF
MIN 5’
W/D
ADA FLOOR PLAN 1/4” = 1’
46’
54’
16’ 32’
DOWN
DOWN
42
50’
16’32’
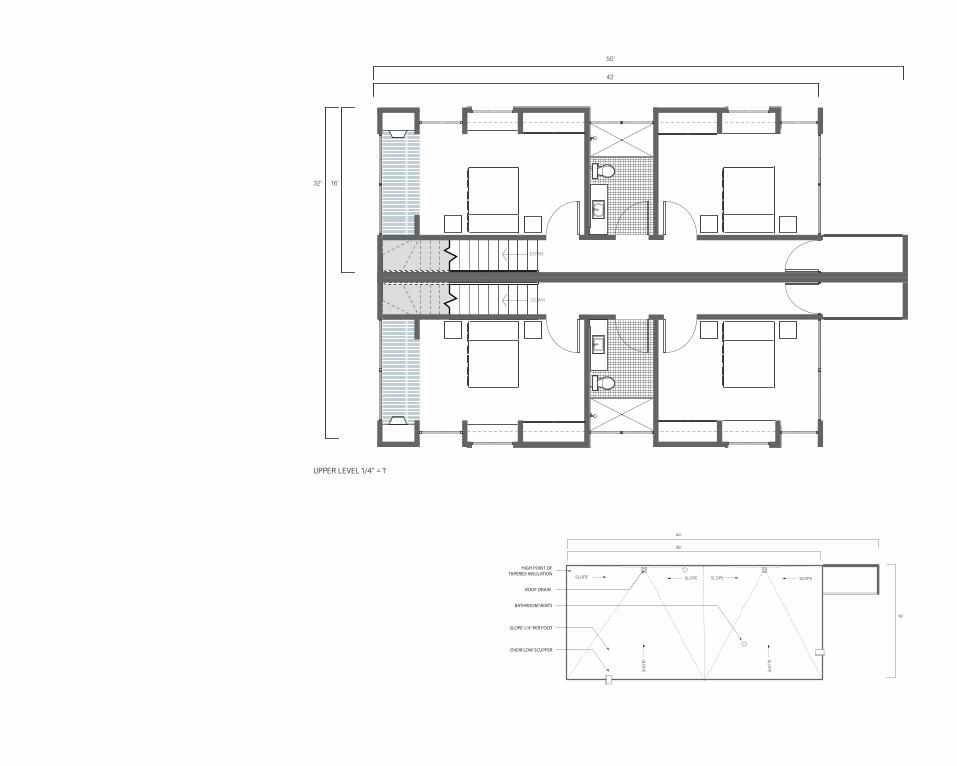
UPPER LEVEL 1/4” = 1’
ROOF DRAIN
SLOPE
SLOPE
OVERFLOW SCUPPER
BATHROOM VENTS
HIGH POINT OFTAPERED INSULATION
SLOPE 1/4” PER FOOT
SLOPESLOPE SLOPE
SLOPE
36’
44’
16’
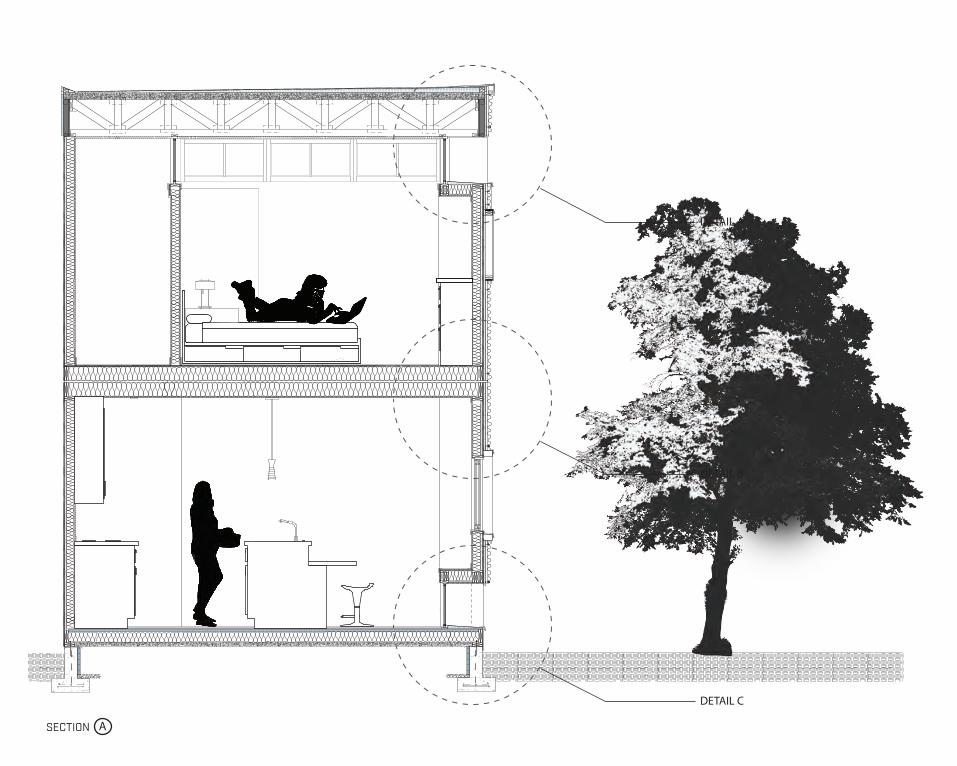
DETAIL A
DETAIL B
DETAIL C
SECTION A
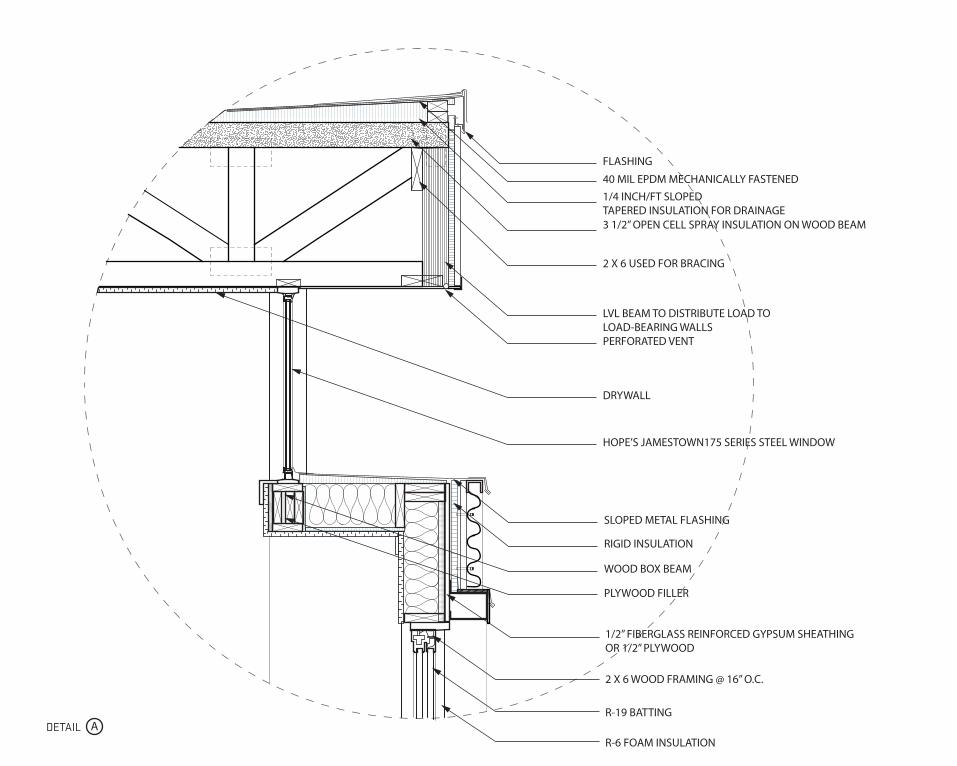
FLASHING
1/4 INCH/FT SLOPEDTAPERED INSULATION FOR DRAINAGE
2 X 6 USED FOR BRACING
LVL BEAM TO DISTRIBUTE LOAD TO LOAD-BEARING WALLS
RIGID INSULATION
1/2” FIBERGLASS REINFORCED GYPSUM SHEATHINGOR 1/2” PLYWOOD
40 MIL EPDM MECHANICALLY FASTENED
3 1/2” OPEN CELL SPRAY INSULATION ON WOOD BEAM
PERFORATED VENT
DRYWALL
HOPE’S JAMESTOWN175 SERIES STEEL WINDOW
2 X 6 WOOD FRAMING @ 16” O.C.
PLYWOOD FILLER
WOOD BOX BEAM
SLOPED METAL FLASHING
R-19 BATTING
R-6 FOAM INSULATIONDETAIL A
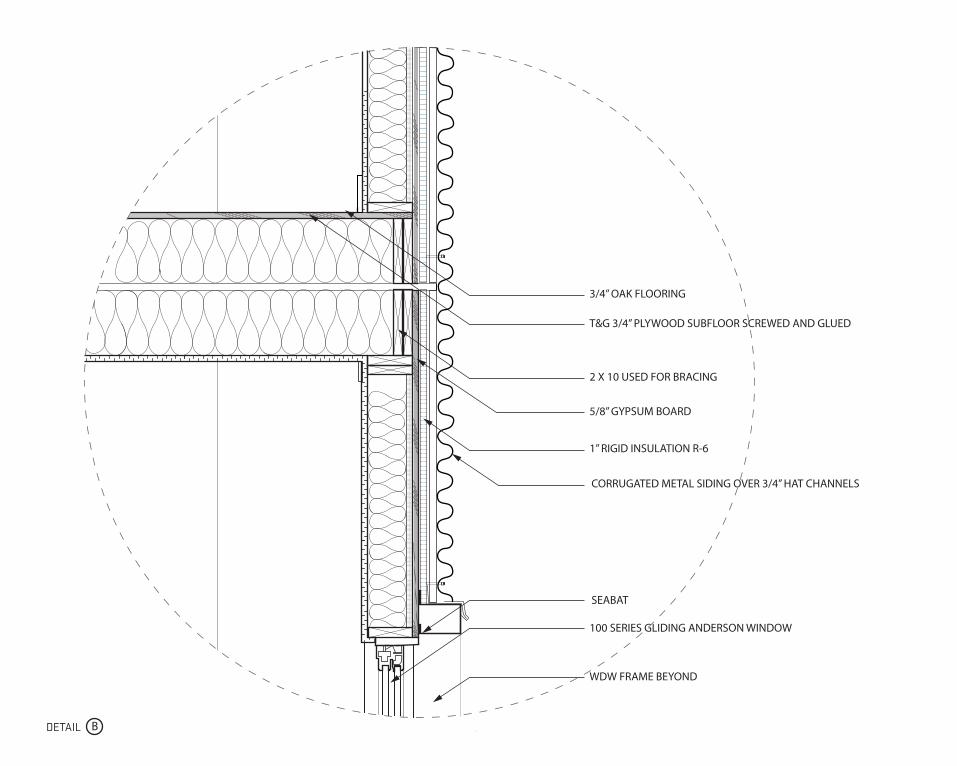
3/4” OAK FLOORING
T&G 3/4” PLYWOOD SUBFLOOR SCREWED AND GLUED
2 X 10 USED FOR BRACING
5/8” GYPSUM BOARD
100 SERIES GLIDING ANDERSON WINDOW
1” RIGID INSULATION R-6
SEABAT
WDW FRAME BEYOND
CORRUGATED METAL SIDING OVER 3/4” HAT CHANNELS
DETAIL B
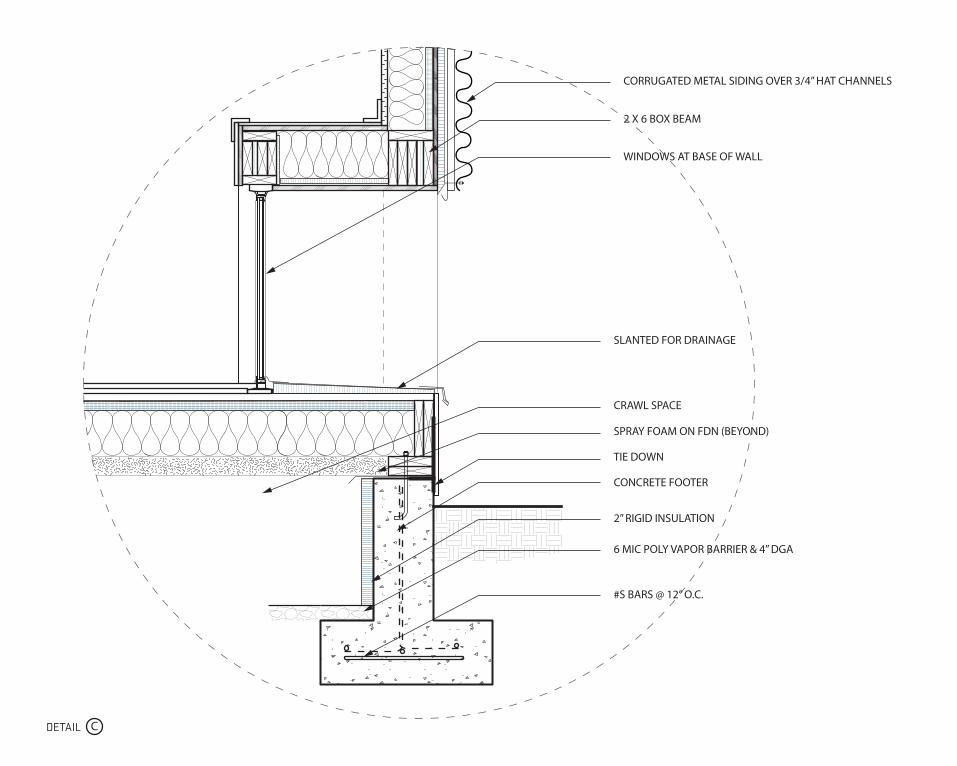
2 X 6 BOX BEAM
WINDOWS AT BASE OF WALL
CONCRETE FOOTER
CRAWL SPACE
SLANTED FOR DRAINAGE
CORRUGATED METAL SIDING OVER 3/4” HAT CHANNELS
SPRAY FOAM ON FDN (BEYOND)
TIE DOWN
2” RIGID INSULATION
6 MIC POLY VAPOR BARRIER & 4” DGA
#S BARS @ 12” O.C.
DETAIL C
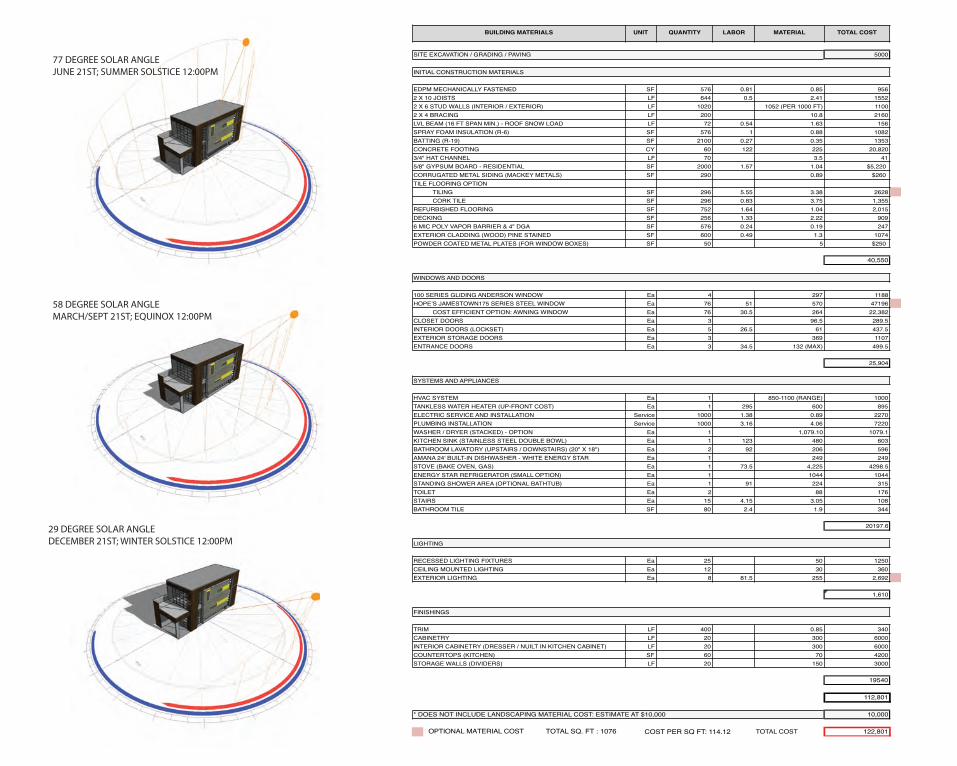
29 DEGREE SOLAR ANGLEDECEMBER 21ST; WINTER SOLSTICE 12:00PM
BUILDING MATERIALS UNIT QUANTITY LABOR MATERIAL TOTAL COST
SITE EXCAVATION / GRADING / PAVING 5000
INITIAL CONSTRUCTION MATERIALS
EDPM MECHANICALLY FASTENED SF 576 0.81 0.85 9562 X 10 JOISTS LF 644 0.5 2.41 15522 X 6 STUD WALLS (INTERIOR / EXTERIOR) LF 1020 1052 (PER 1000 FT) 11002 X 4 BRACING LF 200 10.8 2160LVL BEAM (16 FT SPAN MIN.) - ROOF SNOW LOAD LF 72 0.54 1.63 156SPRAY FOAM INSULATION (R-6) SF 576 1 0.88 1082BATTING (R-19) SF 2100 0.27 0.35 1353CONCRETE FOOTING CY 60 122 225 20,8203/4" HAT CHANNEL LF 70 3.5 415/8" GYPSUM BOARD - RESIDENTIAL SF 2000 1.57 1.04 $5,220CORRUGATED METAL SIDING (MACKEY METALS) SF 290 0.89 $260TILE FLOORING OPTION TILING SF 296 5.55 3.38 2628 CORK TILE SF 296 0.83 3.75 1,355REFURBISHED FLOORING SF 752 1.64 1.04 2,015DECKING SF 256 1.33 2.22 9096 MIC POLY VAPOR BARRIER & 4" DGA SF 576 0.24 0.19 247EXTERIOR CLADDING (WOOD) PINE STAINED SF 600 0.49 1.3 1074POWDER COATED METAL PLATES (FOR WINDOW BOXES) SF 50 5 $250
40,550
WINDOWS AND DOORS
100 SERIES GLIDING ANDERSON WINDOW Ea 4 297 1188HOPE S JAMESTOWN175 SERIES STEEL WINDOW Ea 76 51 570 47196 COST EFFICIENT OPTION: AWNING WINDOW Ea 76 30.5 264 22,382CLOSET DOORS Ea 3 96.5 289.5INTERIOR DOORS (LOCKSET) Ea 5 26.5 61 437.5EXTERIOR STORAGE DOORS Ea 3 369 1107ENTRANCE DOORS Ea 3 34.5 132 (MAX) 499.5
25,904
SYSTEMS AND APPLIANCES
HVAC SYSTEM Ea 1 850-1100 (RANGE) 1000TANKLESS WATER HEATER (UP-FRONT COST) Ea 1 295 600 895ELECTRIC SERVICE AND INSTALLATION Service 1000 1.38 0.89 2270PLUMBING INSTALLATION Service 1000 3.16 4.06 7220WASHER / DRYER (STACKED) - OPTION Ea 1 1,079.10 1079.1KITCHEN SINK (STAINLESS STEEL DOUBLE BOWL) Ea 1 123 480 603BATHROOM LAVATORY (UPSTAIRS / DOWNSTAIRS) (20" X 18") Ea 2 92 206 596AMANA 24' BUILT-IN DISHWASHER - WHITE ENERGY STAR Ea 1 249 249STOVE (BAKE OVEN, GAS) Ea 1 73.5 4,225 4298.5ENERGY STAR REFRIGERATOR (SMALL OPTION) Ea 1 1044 1044STANDING SHOWER AREA (OPTIONAL BATHTUB) Ea 1 91 224 315TOILET Ea 2 88 176STAIRS Ea 15 4.15 3.05 108BATHROOM TILE SF 80 2.4 1.9 344
20197.6
LIGHTING
RECESSED LIGHTING FIXTURES Ea 25 50 1250CEILING MOUNTED LIGHTING Ea 12 30 360EXTERIOR LIGHTING Ea 8 81.5 255 2,692
1,610
FINISHINGS
TRIM LF 400 0.85 340CABINETRY LF 20 300 6000INTERIOR CABINETRY (DRESSER / NUILT IN KITCHEN CABINET) LF 20 300 6000COUNTERTOPS (KITCHEN) SF 60 70 4200STORAGE WALLS (DIVIDERS) LF 20 150 3000
19540
112,801
* DOES NOT INCLUDE LANDSCAPING MATERIAL COST: ESTIMATE AT $10,000 10,000
TOTAL COST 122,801TOTAL SQ. FT : 1076 COST PER SQ FT: 114.12OPTIONAL MATERIAL COST
58 DEGREE SOLAR ANGLEMARCH/SEPT 21ST; EQUINOX 12:00PM
77 DEGREE SOLAR ANGLEJUNE 21ST; SUMMER SOLSTICE 12:00PM

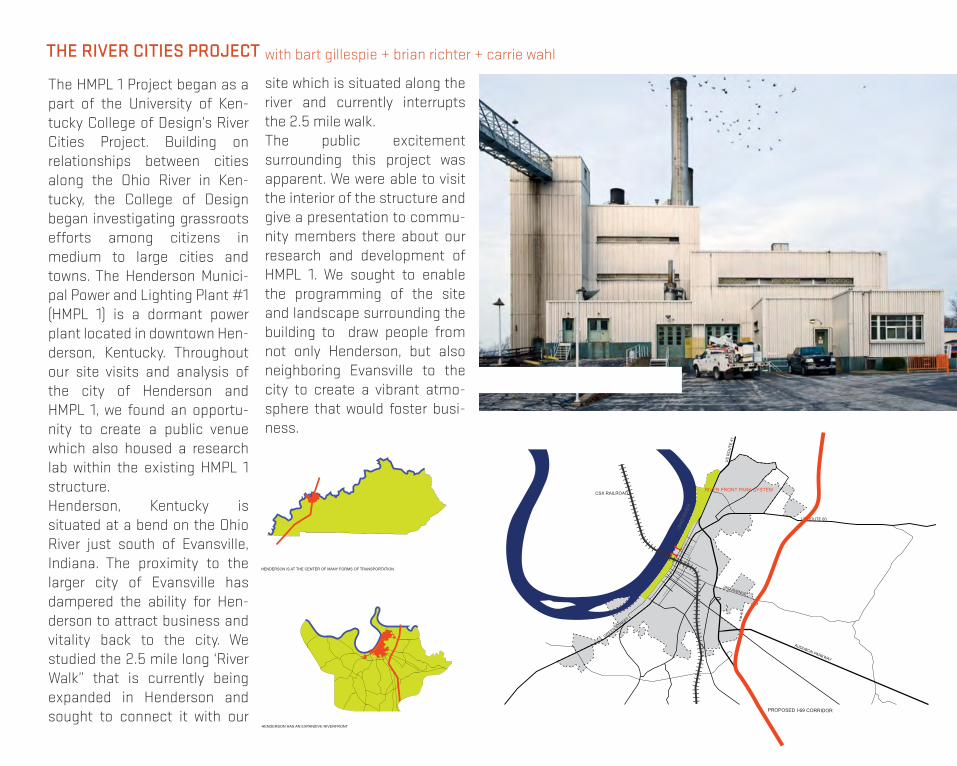
HENDERSON IS AT THE CENTER OF MANY FORMS OF TRANSPORTATION
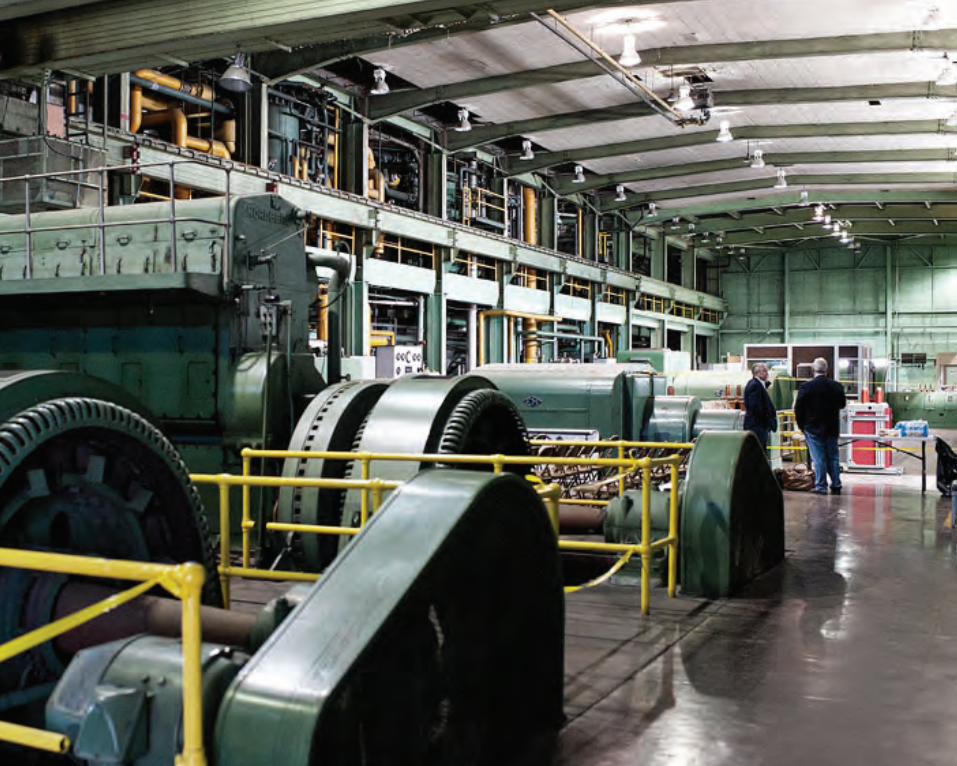
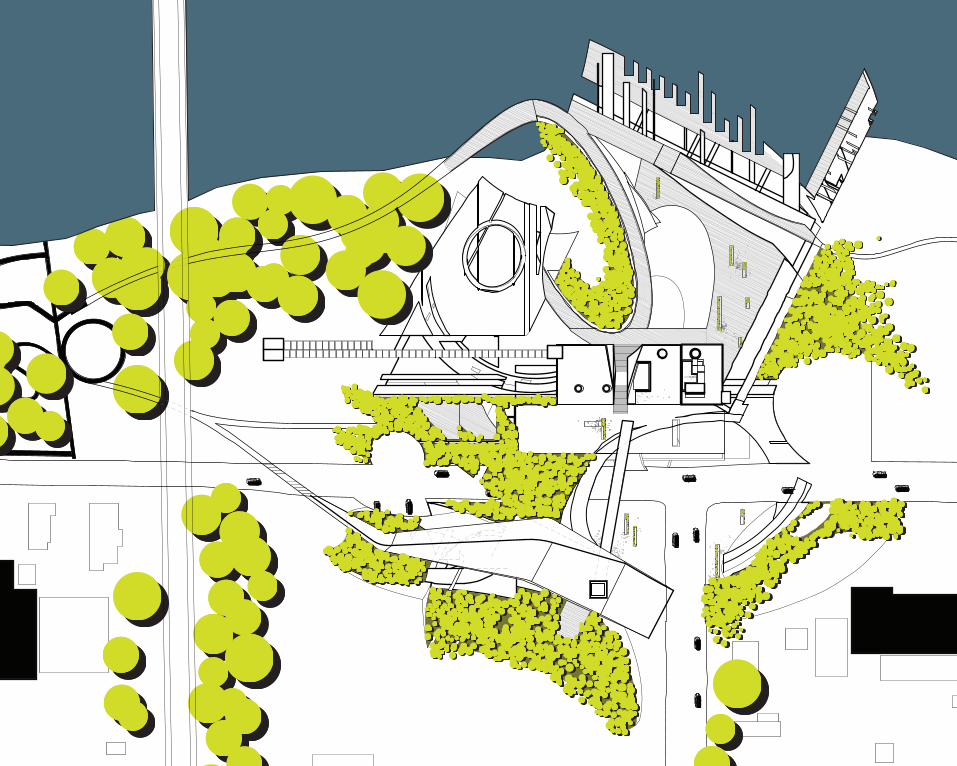
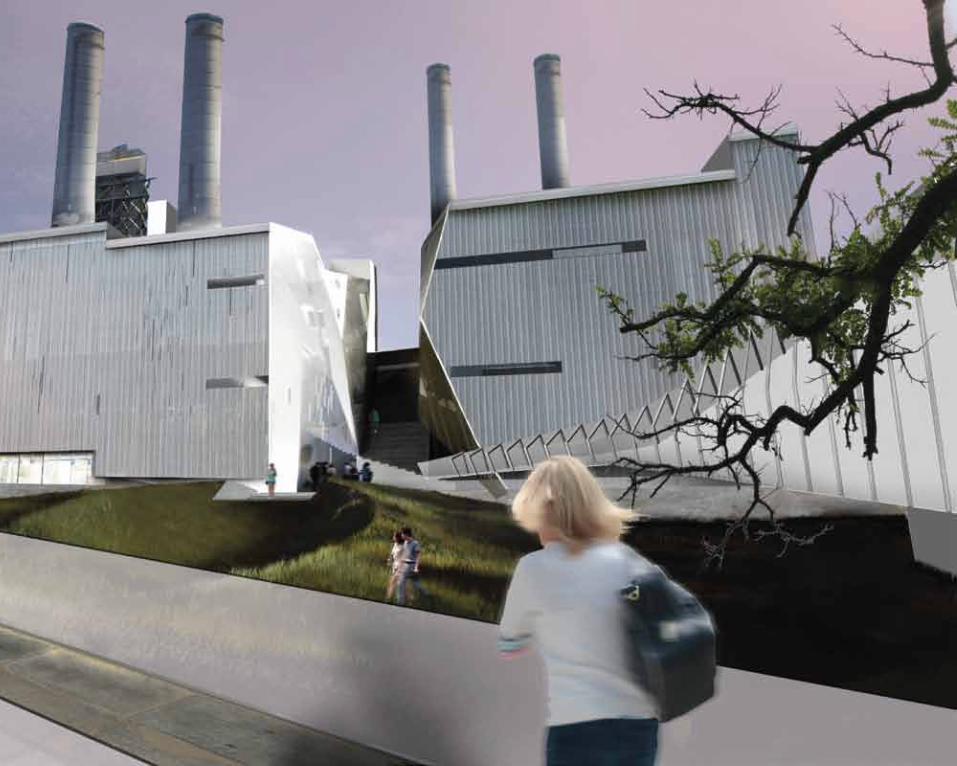
The HMPL 1 Project began as a part of the University of Ken-tucky College of Design’s River Cities Project. Building on relationships between cities along the Ohio River in Ken-tucky, the College of Design began investigating grassroots efforts among citizens in medium to large cities and towns. The Henderson Munici-pal Power and Lighting Plant #1 (HMPL 1) is a dormant power plant located in downtown Hen-derson, Kentucky. Throughout our site visits and analysis of the city of Henderson and HMPL 1, we found an opportu-nity to create a public venue which also housed a research lab within the existing HMPL 1 structure. Henderson, Kentucky is situated at a bend on the Ohio River just south of Evansville, Indiana. The proximity to the larger city of Evansville has dampered the ability for Hen-derson to attract business and vitality back to the city. We studied the 2.5 mile long ‘River Walk” that is currently being expanded in Henderson and sought to connect it with our
site which is situated along the river and currently interrupts the 2.5 mile walk. The public excitement surrounding this project was apparent. We were able to visit the interior of the structure and give a presentation to commu-nity members there about our research and development of HMPL 1. We sought to enable the programming of the site and landscape surrounding the building to draw people from not only Henderson, but also neighboring Evansville to the city to create a vibrant atmo-sphere that would foster busi-ness.
THE RIVER CITIES PROJECT
HENDERSON HAS AN EXPANSIVE RIVERFRONT
HENDERSON HAS AN EXPANSIVE RIVERFRONT
RIVER FRONT PARK SYSTEM
with bart gillespie + brian richter + carrie wahl
B
A
B
C
D
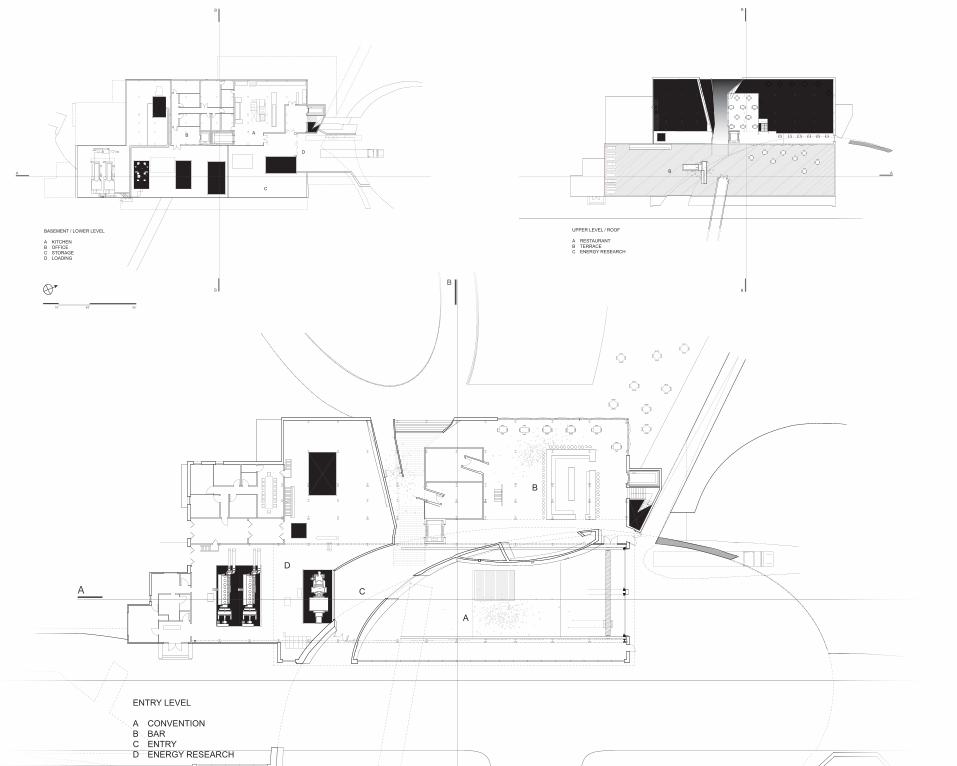
ENTRY LEVEL
A CONVENTIONB BARC ENTRYD ENERGY RESEARCH
A
16’ 48’ 96’
B
B
A
BASEMENT / LOWER LEVEL
A KITCHENB OFFICEC STORAGED LOADING
AB
C
D
96’
B
B
A
UPPER LEVEL / ROOF
A RESTAURANTB TERRACEC ENERGY RESEARCH
A
B
C
B
B
A
B
C
D
ENTRY LEVEL
A CONVENTIONB BARC ENTRYD ENERGY RESEARCH
1
2
3 4
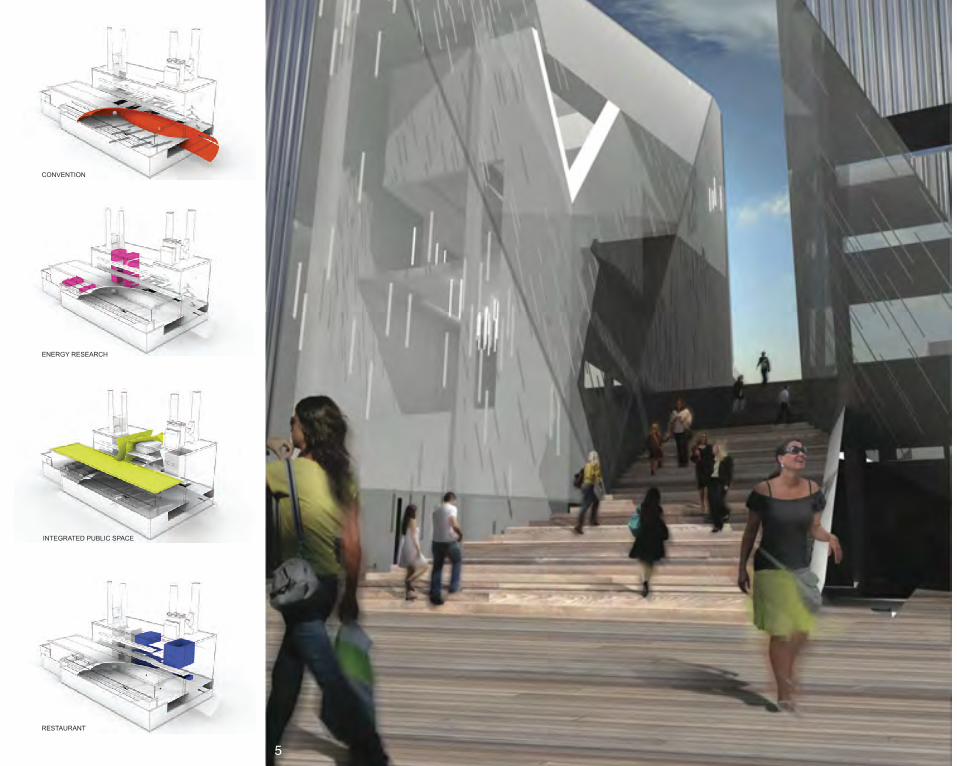
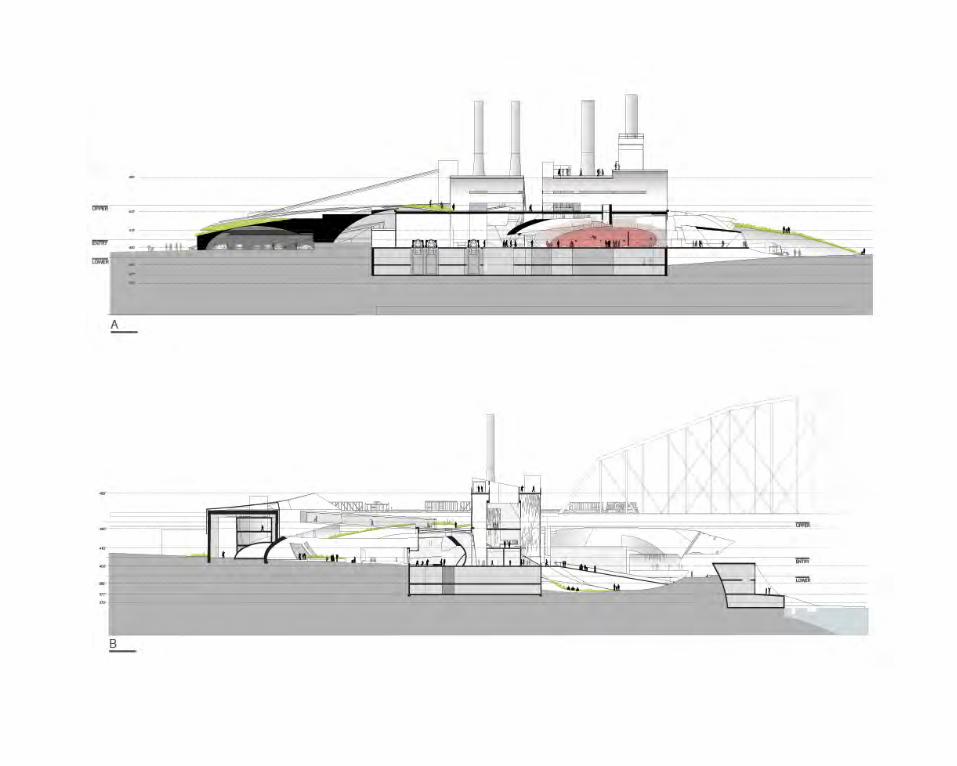
ENERGY RESEARCH
CONVENTION
RESTAURANT
INTEGRATED PUBLIC SPACE
5
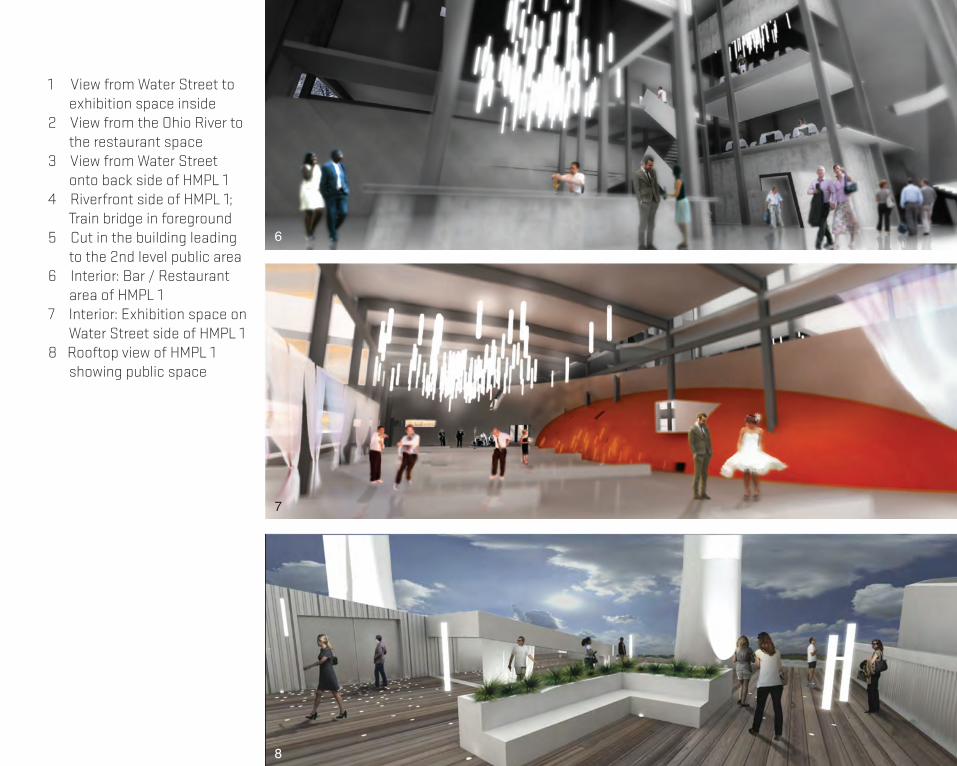
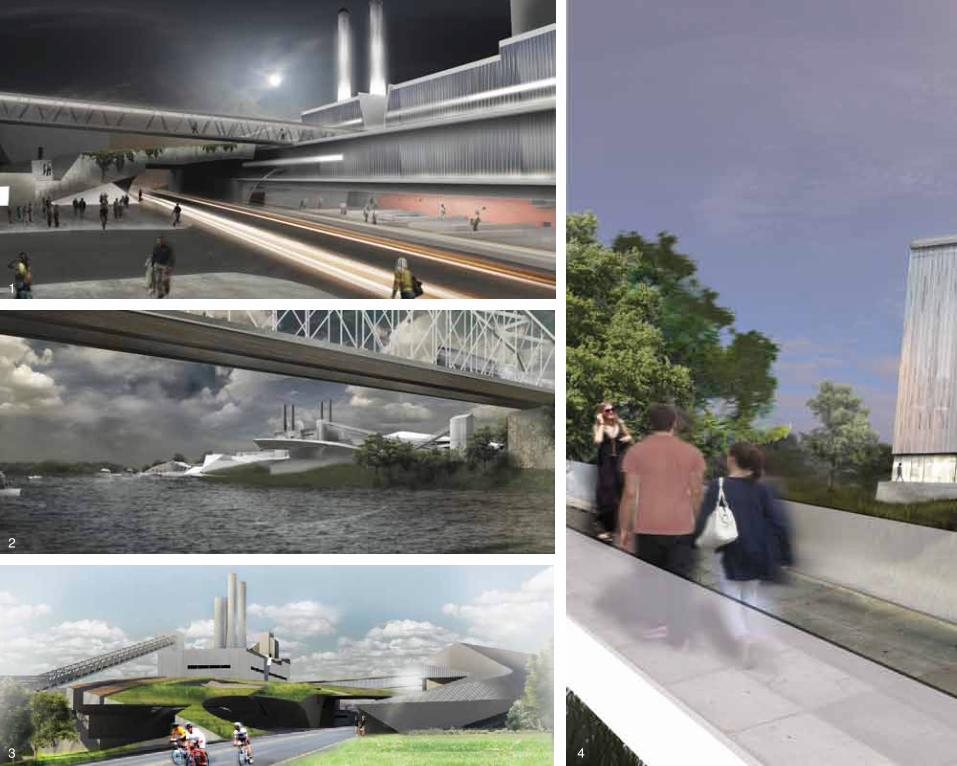
1 View from Water Street to exhibition space inside 2 View from the Ohio River to the restaurant space3 View from Water Street onto back side of HMPL 14 Riverfront side of HMPL 1; Train bridge in foreground5 Cut in the building leading to the 2nd level public area 6 Interior: Bar / Restaurant area of HMPL 1 7 Interior: Exhibition space on Water Street side of HMPL 18 Rooftop view of HMPL 1 showing public space
6
7
8
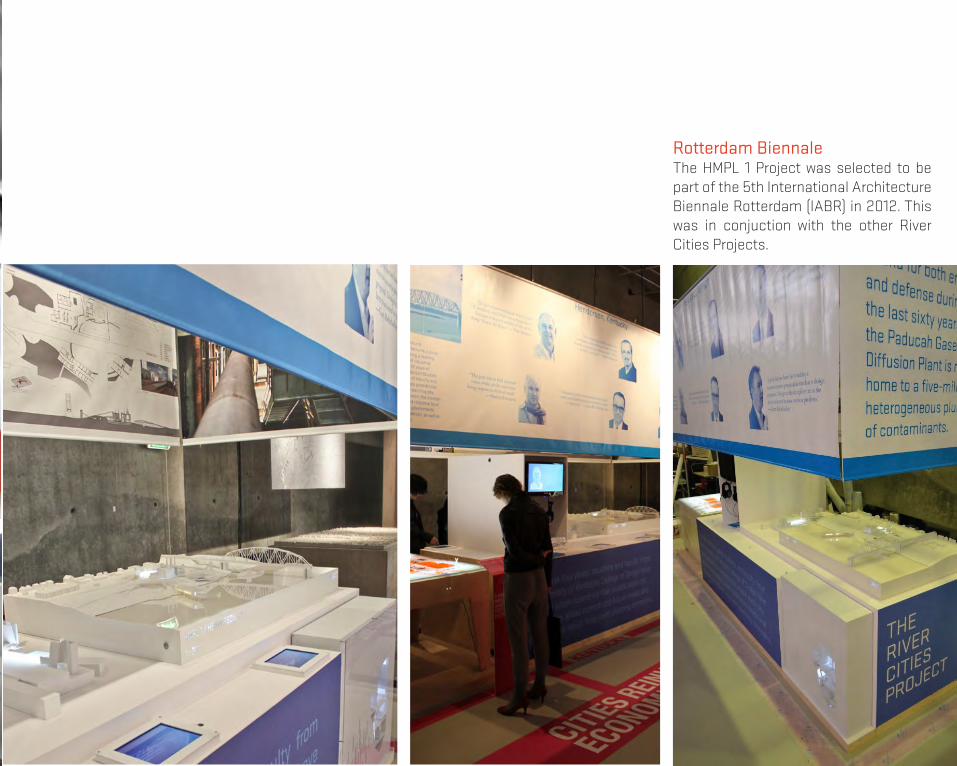
Rotterdam BiennaleThe HMPL 1 Project was selected to be part of the 5th International Architecture Biennale Rotterdam (IABR) in 2012. This was in conjuction with the other River Cities Projects.
YMCA / CAMPUS GYMNASIUM
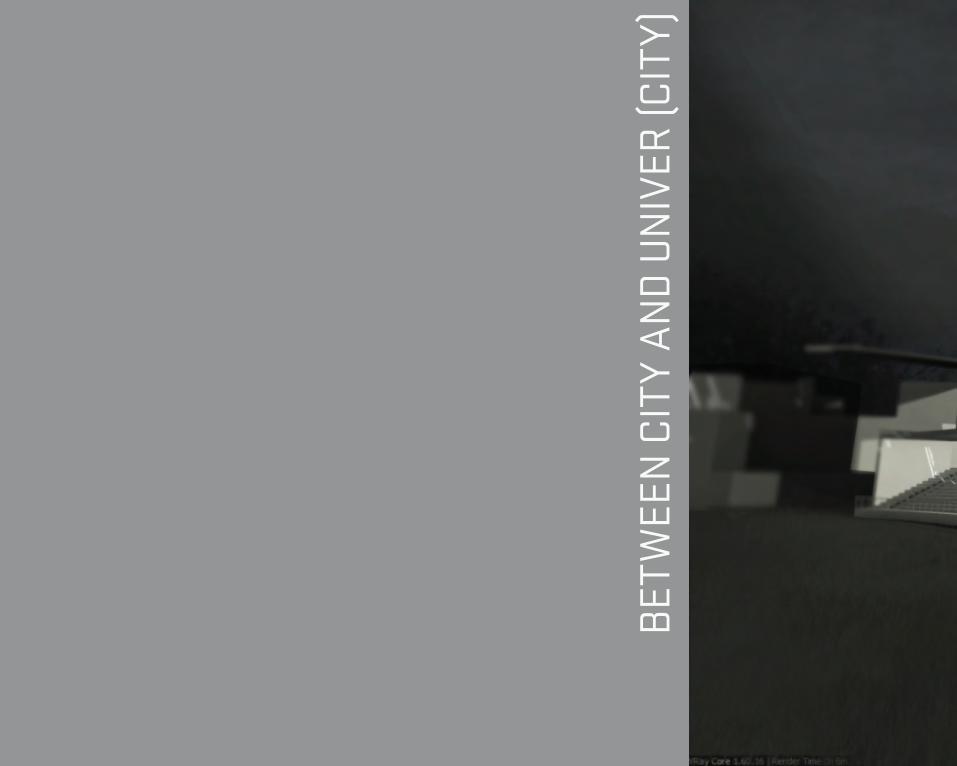
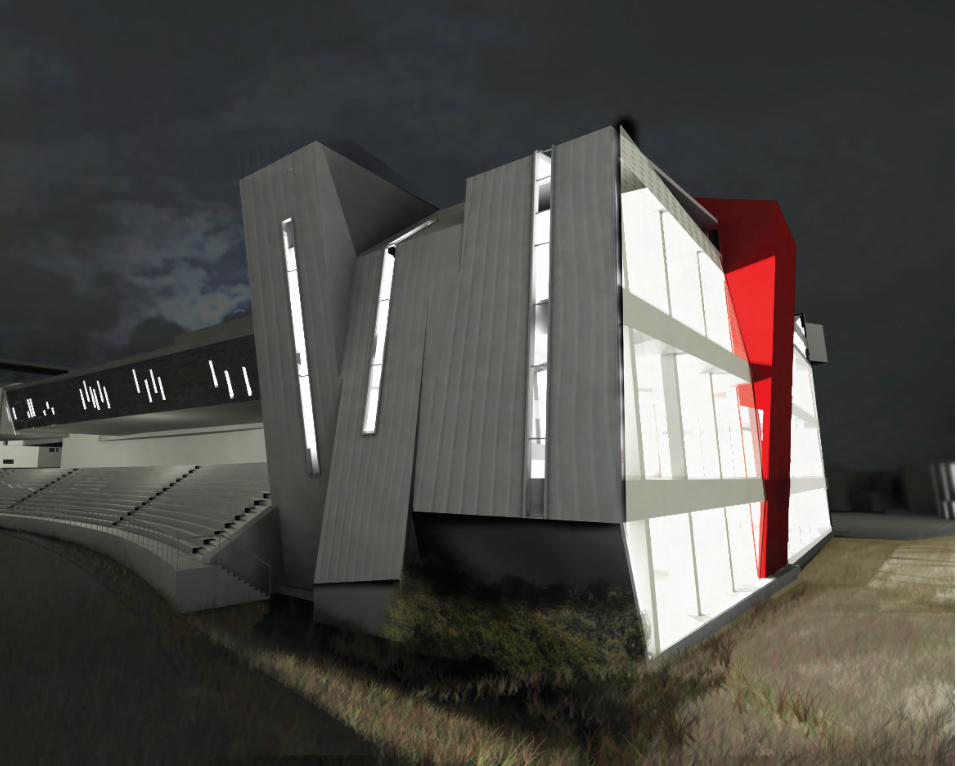
BETWEEN CITY AND UNIVER (CITY)
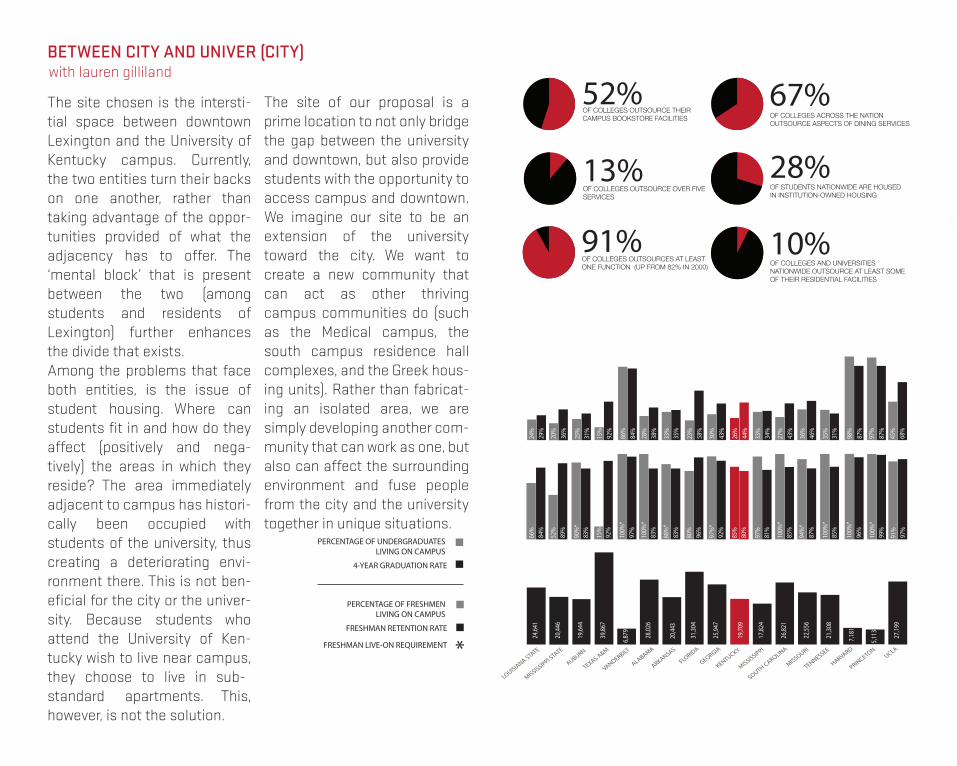
PERCENTAGE OF UNDERGRADUATES LIVING ON CAMPUS
4-YEAR GRADUATION RATE
PERCENTAGE OF FRESHMEN LIVING ON CAMPUS
FRESHMAN RETENTION RATE
FRESHMAN LIVE-ON REQUIREMENT *
The site chosen is the intersti-tial space between downtown Lexington and the University of Kentucky campus. Currently, the two entities turn their backs on one another, rather than taking advantage of the oppor-tunities provided of what the adjacency has to offer. The ‘mental block’ that is present between the two (among students and residents of Lexington) further enhances the divide that exists.Among the problems that face both entities, is the issue of student housing. Where can students fit in and how do they affect (positively and nega-tively) the areas in which they reside? The area immediately adjacent to campus has histori-cally been occupied with students of the university, thus creating a deteriorating envi-ronment there. This is not ben-eficial for the city or the univer-sity. Because students who attend the University of Ken-tucky wish to live near campus, they choose to live in sub-standard apartments. This, however, is not the solution.
OF COLLEGES AND UNIVERSITIES NATIONWIDE OUTSOURCE AT LEAST SOME OF THEIR RESIDENTIAL FACILITIES
OF STUDENTS NATIONWIDE ARE HOUSEDIN INSTITUTION-OWNED HOUSING
OF COLLEGES ACROSS THE NATION OUTSOURCE ASPECTS OF DINING SERVICES
10%
28%
67%
OF COLLEGES OUTSOURCES AT LEAST ONE FUNCTION (UP FROM 82% IN 2000)
OF COLLEGES OUTSOURCE OVER FIVE SERVICES
91%
13%
OF COLLEGES OUTSOURCE THEIR CAMPUS BOOKSTORE FACILITIES
52%
29%
24%
36%
20%
31%
25%
92%
15%
84%
86%
38%
28%
35%
33%
58%
23%
43%
30%
44%
26%
34%
33%
43%
27%
46%
36%
31%
35%
87%
98%
87%
97%
68%
45%
84%
66%
89%
52%
83%
90%
*
92%
15%
97%
100%
*
83%
100%
*
83%
88%
*
96%
80%
92%
97%
*
80%
85%
81%
97%
85%
100%
*
87%
94%
*
85%
100%
*
96%
100%
*
99%
100%
*
97%
91%
20,44
6
24,64
1
19,64
4
39,86
7
6,879 28
,026
20,44
3
31,30
4
25,94
7
19,70
9
17,82
4
26,82
1
22,55
6
21,30
8
7,181
5,113 27
,199
The site of our proposal is a prime location to not only bridge the gap between the university and downtown, but also provide students with the opportunity to access campus and downtown. We imagine our site to be an extension of the university toward the city. We want to create a new community that can act as other thriving campus communities do (such as the Medical campus, the south campus residence hall complexes, and the Greek hous-ing units). Rather than fabricat-ing an isolated area, we are simply developing another com-munity that can work as one, but also can affect the surrounding environment and fuse people from the city and the university together in unique situations.
with lauren gilliland
29%24%
36%20%
31%25%
92%15%
84%86%
38%28%
35%33%
58%23%
43%30%
44%26%
34%33%
43%27%
46%36%
31%35%
87%98%
87%97%
68%45%
CAM
PUS
HO
USI
NG
- U
ND
ERG
RAD
UAT
ES84%66%
89%52%
83%90%*
92%15%
97%100%*
83%100%*
83%88%*
96%80%
92%97%*
80%85%
81%97%
85%100%*
87%94%*
85%100%*
96%100%*
99%100%*
97%91%
CAM
PUS
HO
USI
NG
- FR
ESH
MEN
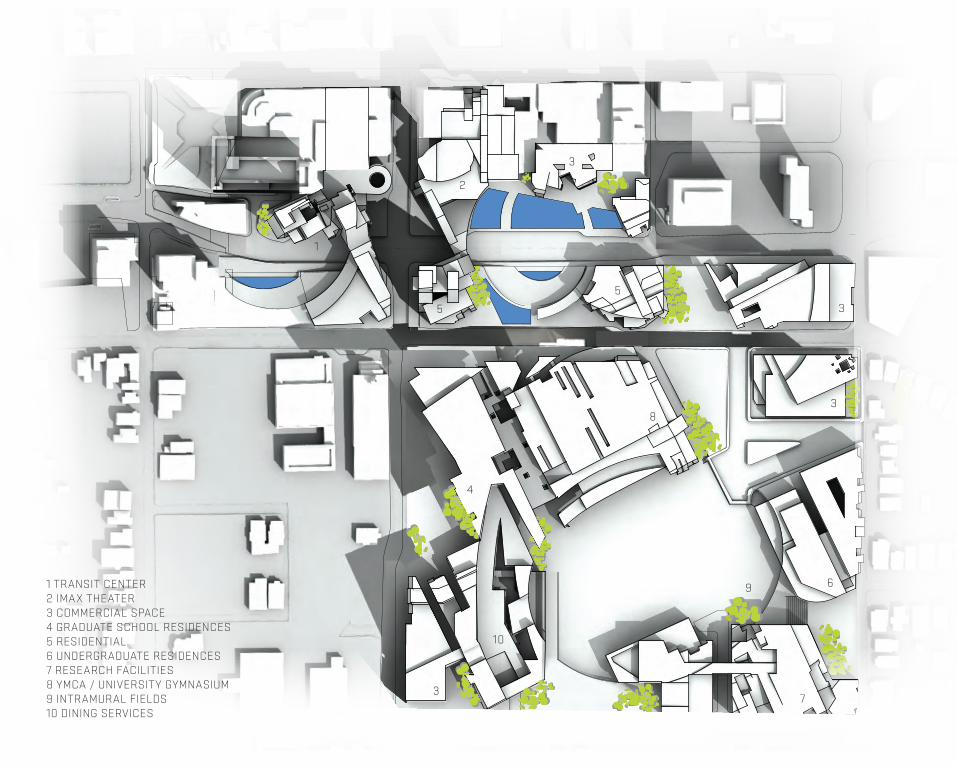
1 TRANSIT CENTER2 IMAX THEATER3 COMMERCIAL SPACE4 GRADUATE SCHOOL RESIDENCES5 RESIDENTIAL6 UNDERGRADUATE RESIDENCES7 RESEARCH FACILITIES8 YMCA / UNIVERSITY GYMNASIUM9 INTRAMURAL FIELDS10 DINING SERVICES
1
2
3
3
4
5
6
7
8
9
3
3
10
5
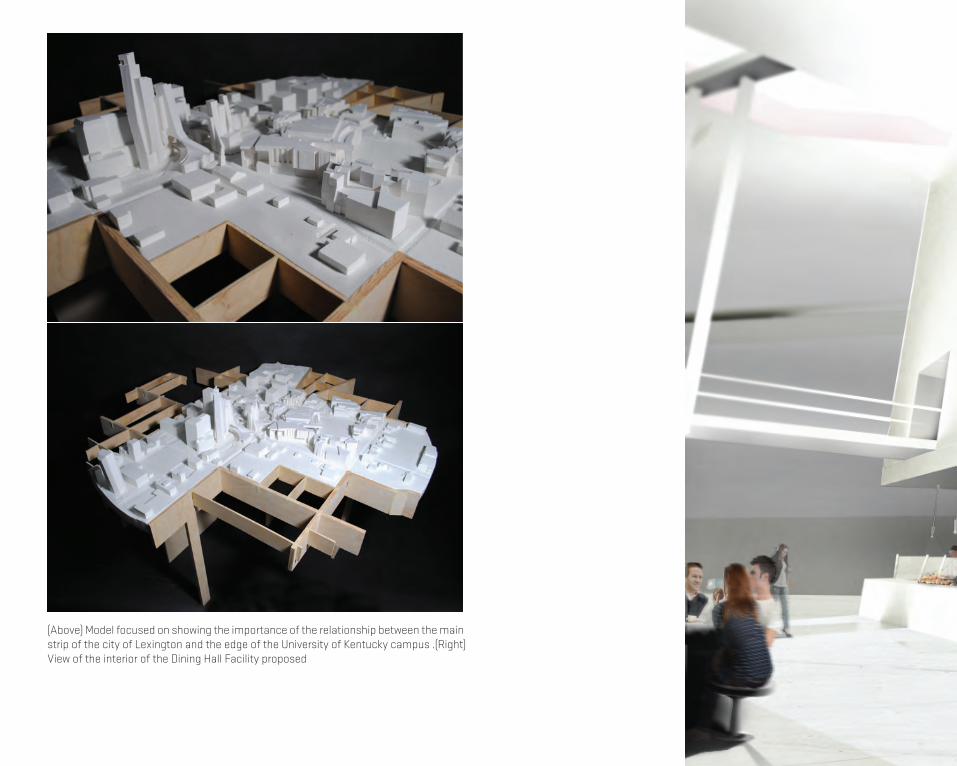
(Above) Model focused on showing the importance of the relationship between the main strip of the city of Lexington and the edge of the University of Kentucky campus .(Right)View of the interior of the Dining Hall Facility proposed
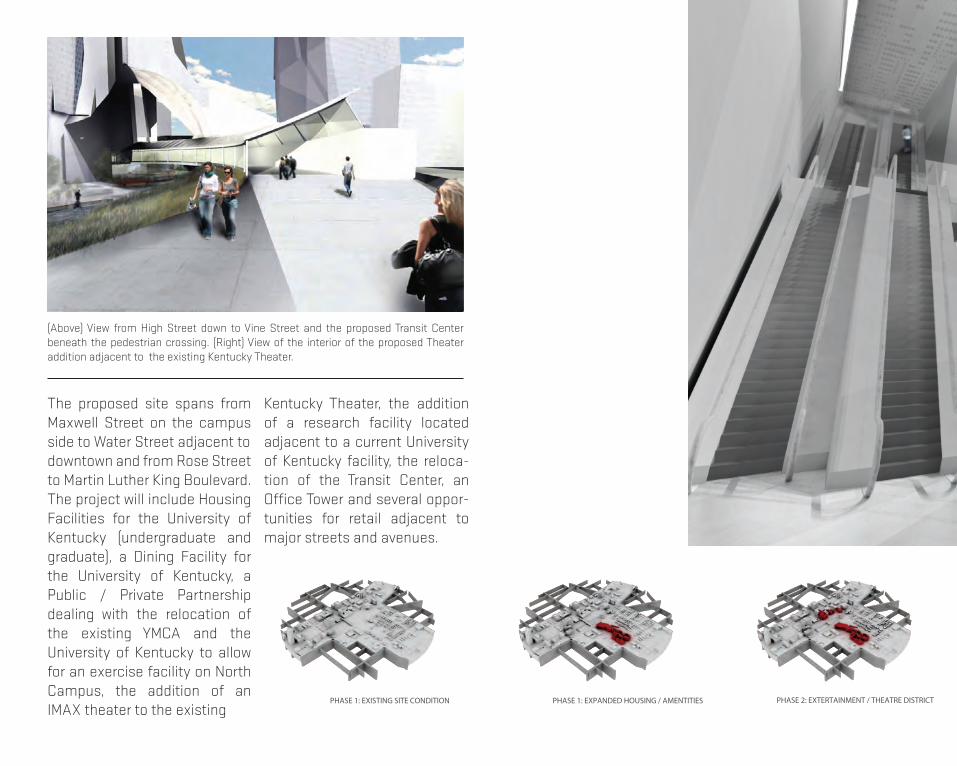
PHASE 1: EXPANDED HOUSING / AMENTITIES PHASE 2: EXTERTAINMENT / THEATRE DISTRICTPHASE 1: EXISTING SITE CONDITION
(Above) View from High Street down to Vine Street and the proposed Transit Center beneath the pedestrian crossing. (Right) View of the interior of the proposed Theater addition adjacent to the existing Kentucky Theater.
The proposed site spans from Maxwell Street on the campus side to Water Street adjacent todowntown and from Rose Street to Martin Luther King Boulevard. The project will include Housing Facilities for the University of Kentucky (undergraduate and graduate), a Dining Facility for the University of Kentucky, a Public / Private Partnership dealing with the relocation of the existing YMCA and the University of Kentucky to allow for an exercise facility on North Campus, the addition of an IMAX theater to the existing
Kentucky Theater, the addition of a research facility located adjacent to a current University of Kentucky facility, the reloca-tion of the Transit Center, an Office Tower and several oppor-tunities for retail adjacent to major streets and avenues.
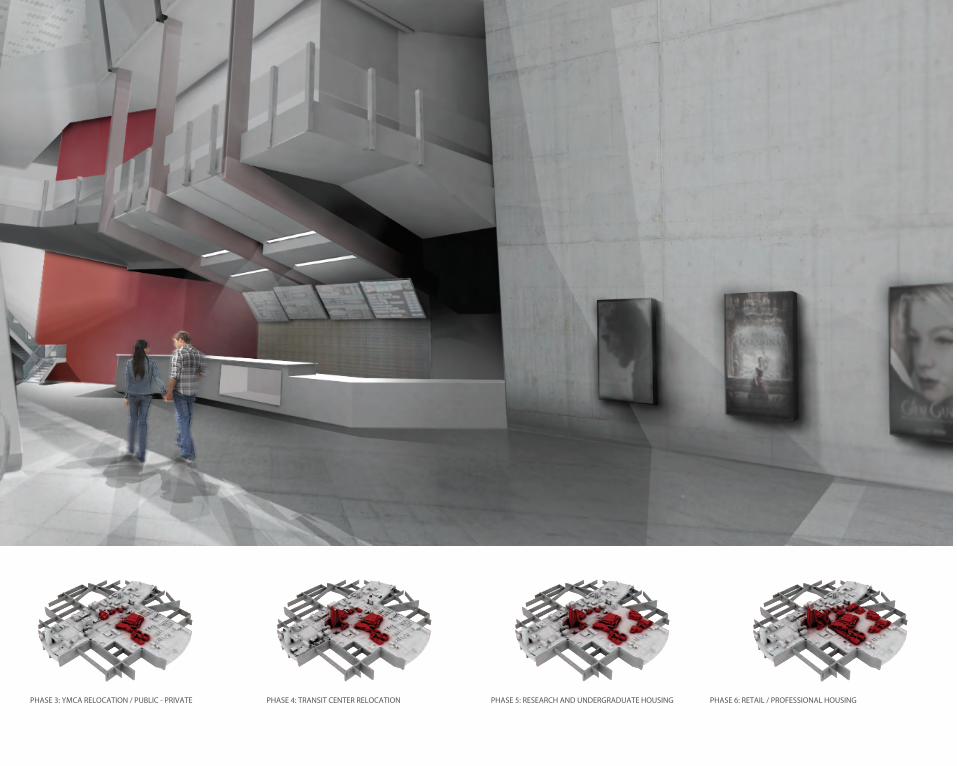
PHASE 3: YMCA RELOCATION / PUBLIC - PRIVATE PHASE 5: RESEARCH AND UNDERGRADUATE HOUSINGPHASE 4: TRANSIT CENTER RELOCATION PHASE 6: RETAIL / PROFESSIONAL HOUSING
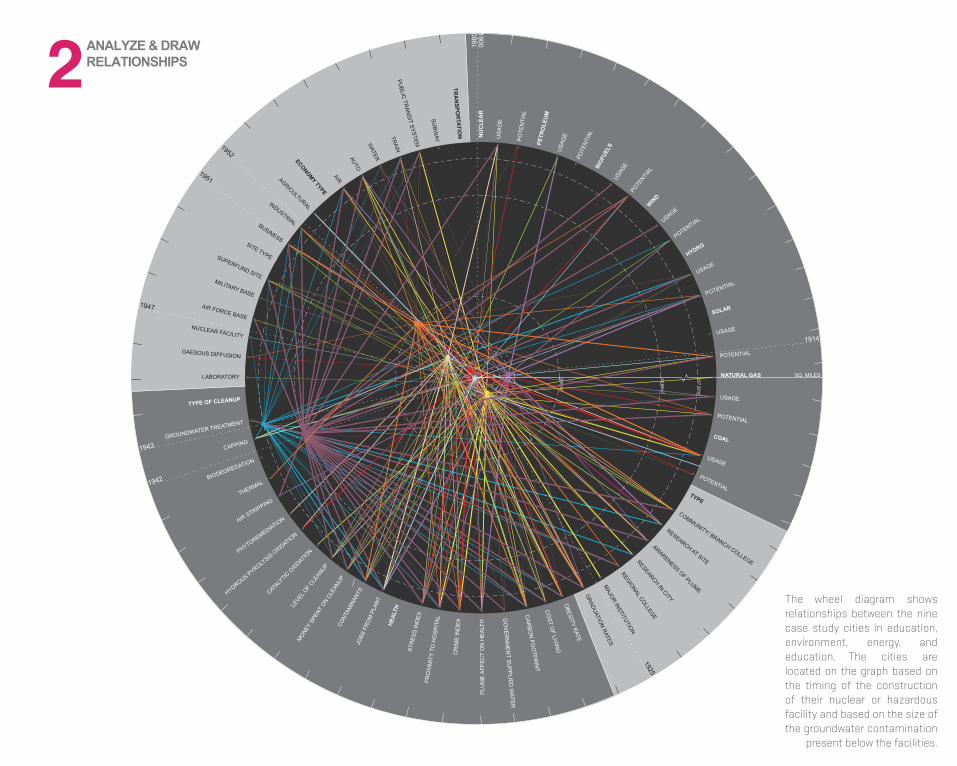
PADUCAH GASEOUS DIFFUSION PLANT (PGDP) COMPOSE A WELL- FORMED PROBLEM
PADUCAH
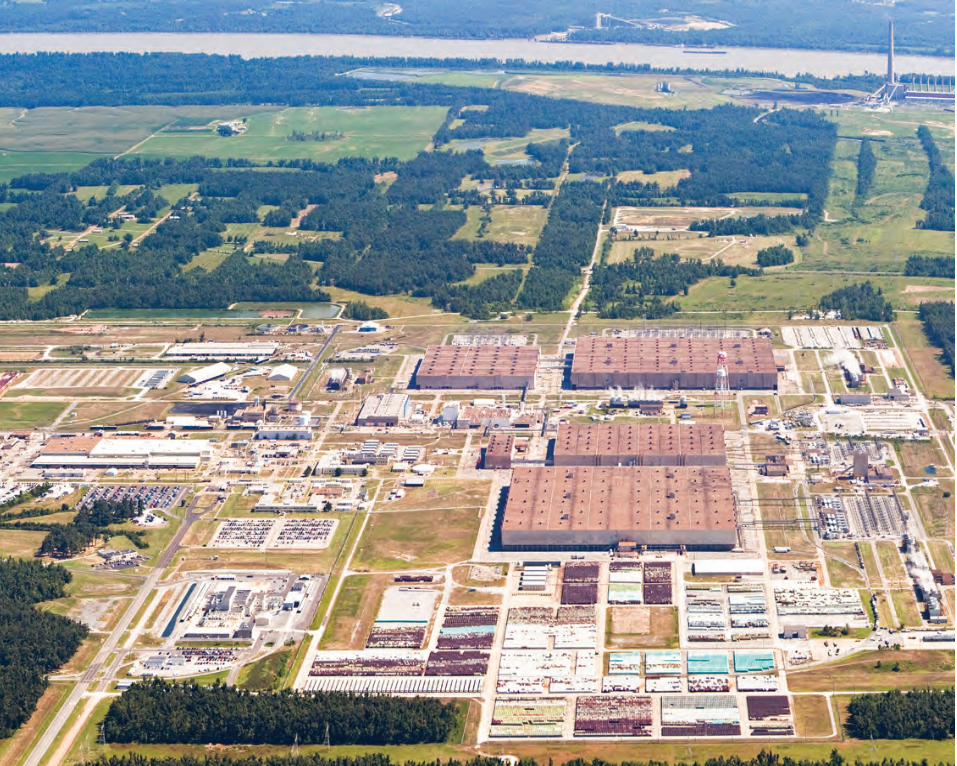
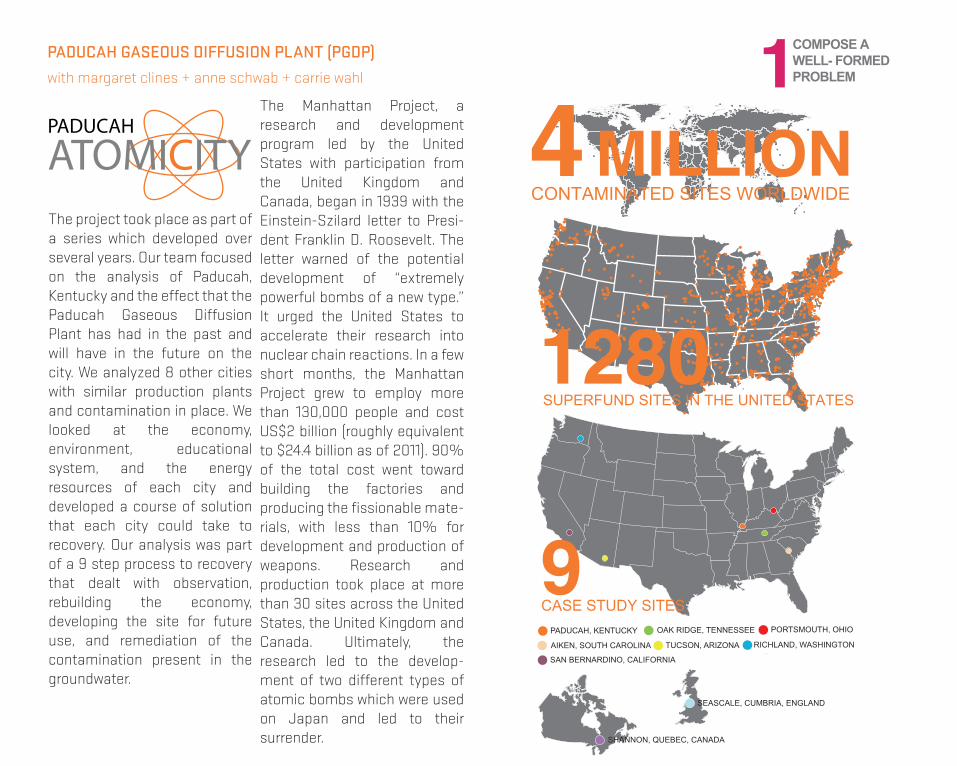
CATOMI ITYThe project took place as part of a series which developed over several years. Our team focused on the analysis of Paducah, Kentucky and the effect that the Paducah Gaseous Diffusion Plant has had in the past and will have in the future on the city. We analyzed 8 other cities with similar production plants and contamination in place. We looked at the economy, environment, educational system, and the energy resources of each city and developed a course of solution that each city could take to recovery. Our analysis was part of a 9 step process to recovery that dealt with observation, rebuilding the economy, developing the site for future use, and remediation of the contamination present in the groundwater.
The Manhattan Project, a research and development program led by the United States with participation from the United Kingdom and Canada, began in 1939 with the Einstein-Szilard letter to Presi-dent Franklin D. Roosevelt. The letter warned of the potential development of “extremely powerful bombs of a new type.” It urged the United States to accelerate their research into nuclear chain reactions. In a few short months, the Manhattan Project grew to employ more than 130,000 people and cost US$2 billion (roughly equivalent to $24.4 billion as of 2011). 90% of the total cost went toward building the factories and producing the fissionable mate-rials, with less than 10% for development and production of weapons. Research and production took place at more than 30 sites across the United States, the United Kingdom and Canada. Ultimately, the research led to the develop-ment of two different types of atomic bombs which were used on Japan and led to their surrender.
with margaret clines + anne schwab + carrie wahl
USA
GE
POTE
NTIA
LBI
OFUE
LSUS
AGE
POTENTI
ALWIN
D
USAGE
POTENTIAL
HYDRO
USAGE
POTENTIAL
SOLAR
USAGE
POTENTIAL
NATURAL GAS
PETR
OLE
UM
POTE
NTI
AL
USA
GE
MILITARY BASE
SUPERFUND SITE
SITE TYPE
BUSINESS
INDUSTRIAL
AGRICULTURAL
ECONOMY TYPE
AIR
AUTO
WATER
TRAIN
PUBLIC
TRAN
SIT SYSTEM
SUBW
AY
TRA
NSPO
RTATIO
N NU
CLE
AR
AIR FORCE BASE
NUCLEAR FACILITY
GAESOUS DIFFUSION
USAGE
POTENTIALTYPE
COMMUNITY/ BRANCH COLLEGE
RESEARCH AT SITE
AWARENESS OF PLUME
RESEARCH IN CITY
REGIONAL COLLEGE
MAJO
R INSTITUTION
GRADUATIO
N RATES
OBESITY R
ATE
CO
ST OF LIVIN
G
CAR
BON
FOO
TPRIN
T
GO
VERN
MEN
T SUPPLIED
WATER
PLU
ME
AFF
EC
T O
N H
EA
LTH
COAL
USAGEHE
ALTH
JOBS
FRO
M P
LANT
CONT
AMIN
ANTS
MONE
Y SP
ENT
ON CL
EANU
P
CATALY
TIC O
XIDATIO
N
HYDROUS PYROLYSIS O
XIDATION
PHYTOREMEDIATIONAIR STRIPPINGTHERMAL
BIODEGREDATION
GROUNDWATER TREATMENT
TYPE OF CLEANUP
STR
ESS
IND
EXPR
OXI
MIT
Y TO
HO
SPIT
AL
CR
IME
IND
EX
LEVEL O
F CLE
ANUP
POTENTIAL
CAPPING
LABORATORY SQ. MILES
ANALYZE & DRAWRELATIONSHIPS
The wheel diagram shows relationships between the nine case study cities in education, environment, energy, and education. The cities are located on the graph based on the timing of the construction of their nuclear or hazardous facility and based on the size of the groundwater contamination
present below the facilities.
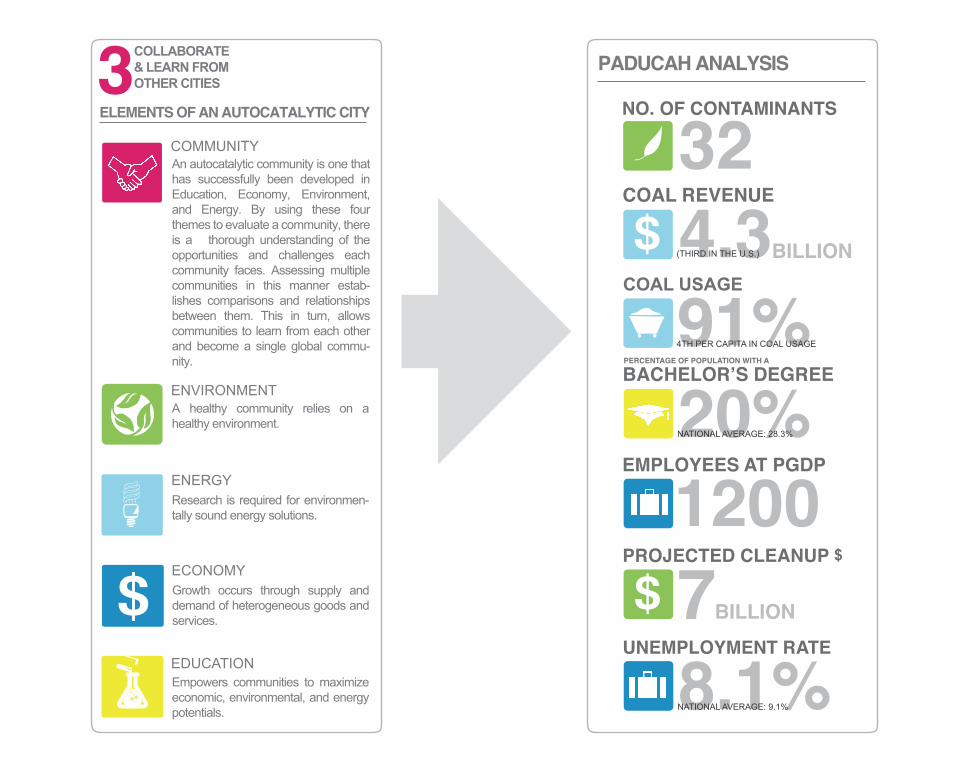
COLLABORATE & LEARN FROMOTHER CITIES
An autocatalytic community is one that
has successfully been developed in
Education, Economy, Environment,
and Energy. By using these four
themes to evaluate a community, there
is a thorough understanding of the
opportunities and challenges each
community faces. Assessing multiple
communities in this manner estab-
lishes comparisons and relationships
between them. This in turn, allows
communities to learn from each other
and become a single global commu-
nity.
ELEMENTS OF AN AUTOCATALYTIC CITY
EDUCATION
ENVIRONMENT
A healthy community relies on a
healthy environment.
ENERGY
Research is required for environmen-
tally sound energy solutions.
ECONOMY
Growth occurs through supply and
demand of heterogeneous goods and
services.
Empowers communities to maximize
economic, environmental, and energy
potentials.
COMMUNITY
PADUCAH ANALYSIS
F
F
F
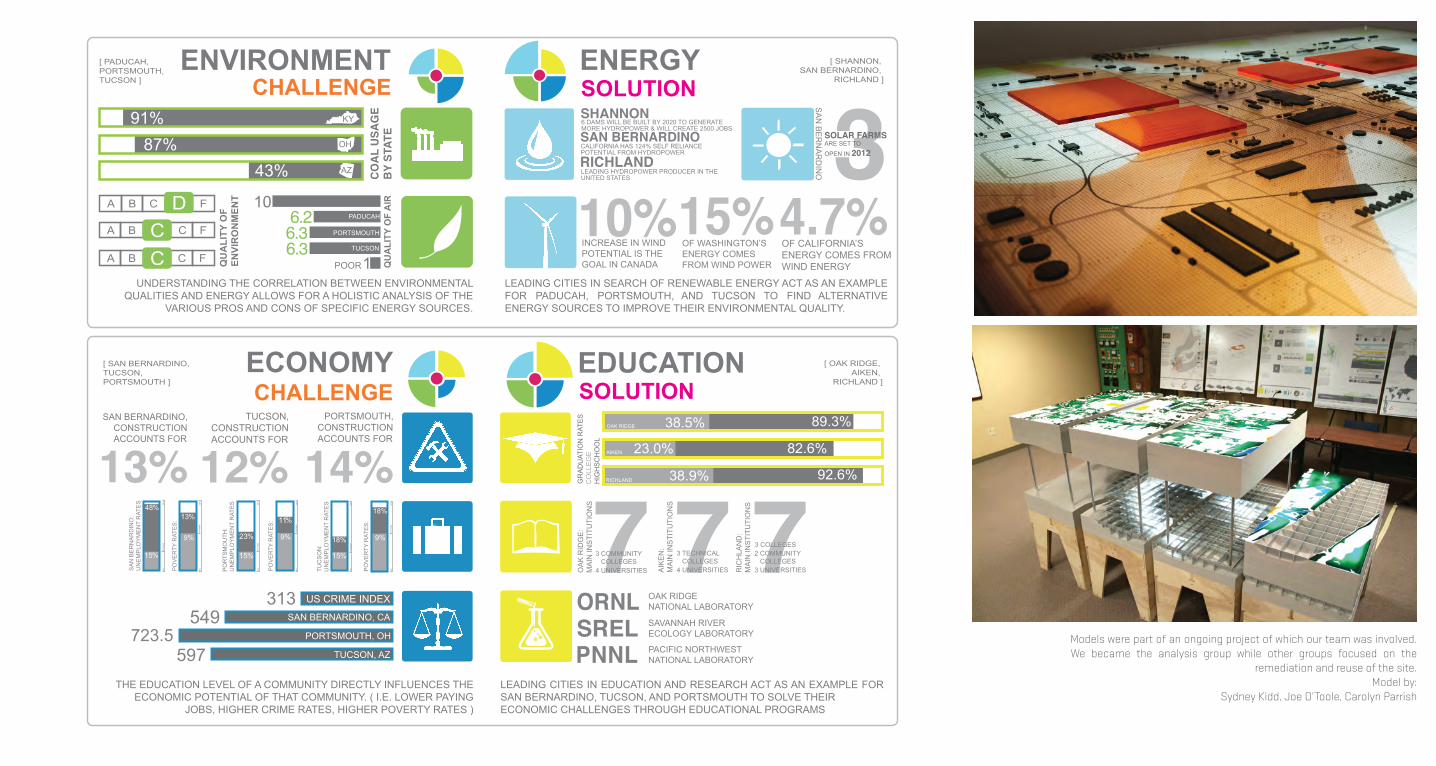
ENVIRONMENT ENERGY
A B C
A B C
A B C
UNDERSTANDING THE CORRELATION BETWEEN ENVIRONMENTAL QUALITIES AND ENERGY ALLOWS FOR A HOLISTIC ANALYSIS OF THE
VARIOUS PROS AND CONS OF SPECIFIC ENERGY SOURCES.
LEADING CITIES IN SEARCH OF RENEWABLE ENERGY ACT AS AN EXAMPLE FOR PADUCAH, PORTSMOUTH, AND TUCSON TO FIND ALTERNATIVE ENERGY SOURCES TO IMPROVE THEIR ENVIRONMENTAL QUALITY.
OF WASHINGTON’S ENERGY COMES FROM WIND POWER
OF CALIFORNIA’S ENERGY COMES FROM WIND ENERGY
INCREASE IN WIND POTENTIAL IS THE GOAL IN CANADA
SOLAR FARMS ARE SET TO OPEN IN 2012
LEADING HYDROPOWER PRODUCER IN THE UNITED STATES
CALIFORNIA HAS 124% SELF RELIANCE POTENTIAL FROM HYDROPOWER
6 DAMS WILL BE BUILT BY 2020 TO GENERATE MORE HYDROPOWER & WILL CREATE 2500 JOBS
SA
N B
ER
NA
RD
INO
[ PADUCAH, PORTSMOUTH, TUCSON ]
[ SHANNON, SAN BERNARDINO,
RICHLAND ]
ECONOMY EDUCATION
SAVANNAH RIVERECOLOGY LABORATORY
OAK RIDGE NATIONAL LABORATORY
PACIFIC NORTHWEST NATIONAL LABORATORY
3 COMMUNITY COLLEGES4 UNIVERSITIES 4 UNIVERSITIES
3 TECHNICAL COLLEGES
3 UNIVERSITIES
2 COMMUNITY COLLEGES
3 COLLEGES
89.3%
82.6%
92.6%
38.5%
23.0%
38.9%
THE EDUCATION LEVEL OF A COMMUNITY DIRECTLY INFLUENCES THE ECONOMIC POTENTIAL OF THAT COMMUNITY. ( I.E. LOWER PAYING
JOBS, HIGHER CRIME RATES, HIGHER POVERTY RATES )
[ OAK RIDGE, AIKEN,
RICHLAND ]
[ SAN BERNARDINO, TUCSON, PORTSMOUTH ]
LEADING CITIES IN EDUCATION AND RESEARCH ACT AS AN EXAMPLE FOR SAN BERNARDINO, TUCSON, AND PORTSMOUTH TO SOLVE THEIR ECONOMIC CHALLENGES THROUGH EDUCATIONAL PROGRAMS
SOLUTION
SOLUTION
CHALLENGE
CHALLENGE
DCC
Models were part of an ongoing project of which our team was involved. We became the analysis group while other groups focused on the
remediation and reuse of the site. Model by:
Sydney Kidd, Joe O’Toole, Carolyn Parrish
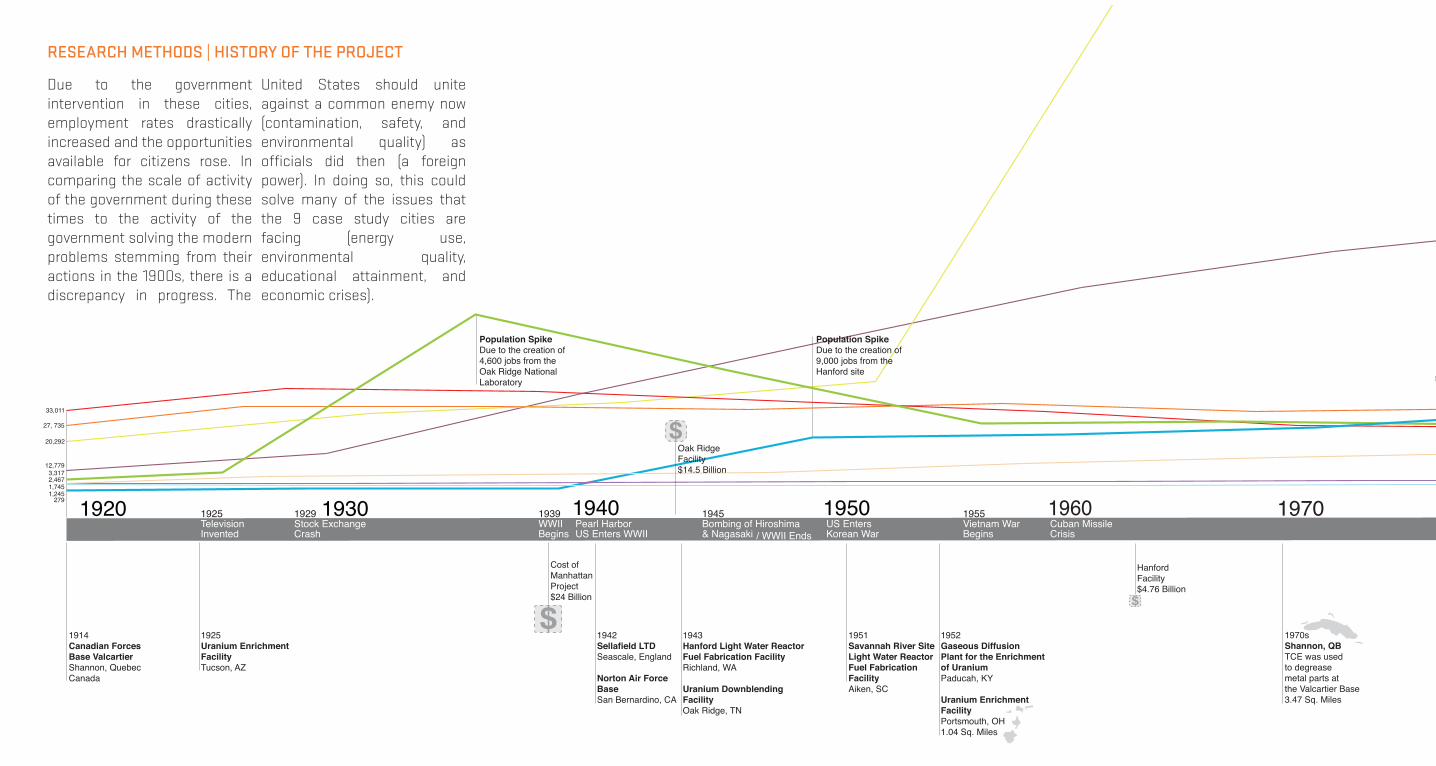
1930 1940 1950 1960 1970Pearl HarborUS Enters WWII
1945Bombing of Hiroshima& Nagasaki
US EntersKorean War
1955Vietnam WarBegins
Cuban MissileCrisis
1914Canadian ForcesBase ValcartierShannon, QuebecCanada
1925Uranium EnrichmentFacilityTucson, AZ
1942Sellafield LTDSeascale, England
Norton Air ForceBaseSan Bernardino, CA
1943Hanford Light Water ReactorFuel Fabrication FacilityRichland, WA
Uranium DownblendingFacilityOak Ridge, TN
1951Savannah River SiteLight Water Reactor Fuel Fabrication FacilityAiken, SC
1952Gaseous Diffusion Plant for the Enrichmentof UraniumPaducah, KY
Uranium EnrichmentFacilityPortsmouth, OH1.04 Sq. Miles
1925Television Invented
1929Stock ExchangeCrash
1939WWIIBegins / WWII Ends
1920
1970sShannon, QBTCE was used to degrease metal parts at the Valcartier Base3.47 Sq. Miles
Population SpikeDue to the creation of 4,600 jobs from the Oak Ridge NationalLaboratory
Population SpikeDue to the creation of 9,000 jobs from the Hanford site
Cost of ManhattanProject$24 Billion
Oak RidgeFacility$14.5 Billion
Hanford Facility$4.76 Billion
B2 Bomber$2.2 Billion
20,292
33,011
27, 735
12,779
279
3,3172,4671,7451,245
RESEARCH METHODS | HISTORY OF THE PROJECT
Due to the government intervention in these cities, employment rates drastically increased and the opportunities available for citizens rose. In comparing the scale of activity of the government during these times to the activity of the government solving the modern problems stemming from their actions in the 1900s, there is a discrepancy in progress. The
United States should unite against a common enemy now (contamination, safety, and environmental quality) as officials did then (a foreign power). In doing so, this could solve many of the issues that the 9 case study cities are facing (energy use, environmental quality, educational attainment, and economic crises).
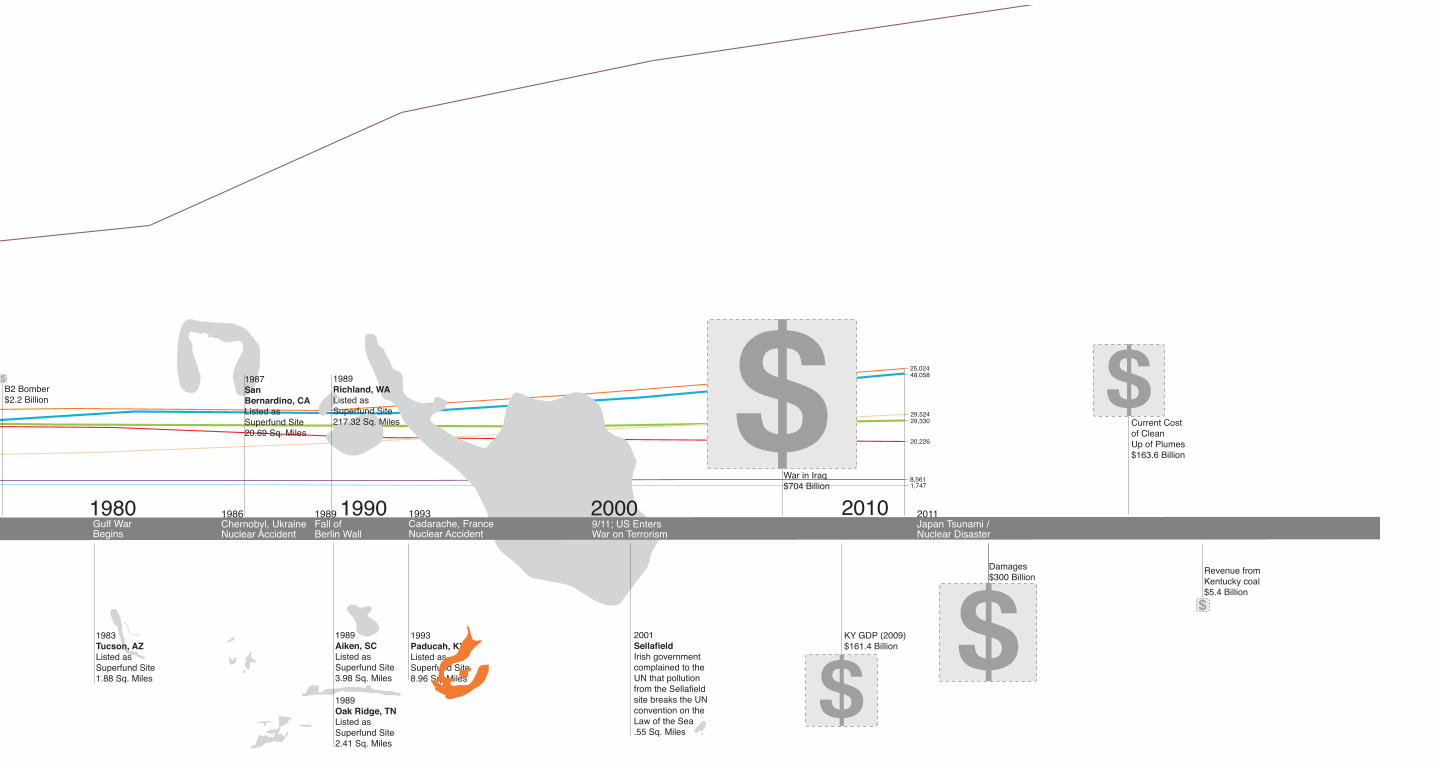
1980 1990 2000 2010Gulf War Begins
1986Chernobyl, UkraineNuclear Accident
1993Cadarache, FranceNuclear Accident
9/11; US Enters War on Terrorism
1993Paducah, KYListed as Superfund Site8.96 Sq. Miles
1989Richland, WAListed as Superfund Site217.32 Sq. Miles
1987San Bernardino, CAListed as Superfund Site20.69 Sq. Miles
1983Tucson, AZListed as Superfund Site1.88 Sq. Miles
1989Aiken, SCListed as Superfund Site3.98 Sq. Miles
1989Oak Ridge, TNListed as Superfund Site2.41 Sq. Miles
2011Japan Tsunami / Nuclear Disaster
2001SellafieldIrish governmentcomplained to the UN that pollutionfrom the Sellafieldsite breaks the UNconvention on theLaw of the Sea.55 Sq. Miles
Revenue fromKentucky coal$5.4 Billion
Current Cost of Clean Up of Plumes$163.6 Billion
Damages$300 Billion
War in Iraq$704 Billion
KY GDP (2009)$161.4 Billion
B2 Bomber$2.2 Billion
1989Fall of Berlin Wall
25,024
29,330
48,058
29,524
20,226
8,5611,747
Models were part of an ongoing project of which our team was involved. Exhibition took place in Paducah, Kentucky.Models by: Sydney Kidd, Joe O’Toole, Carolyn Parrish
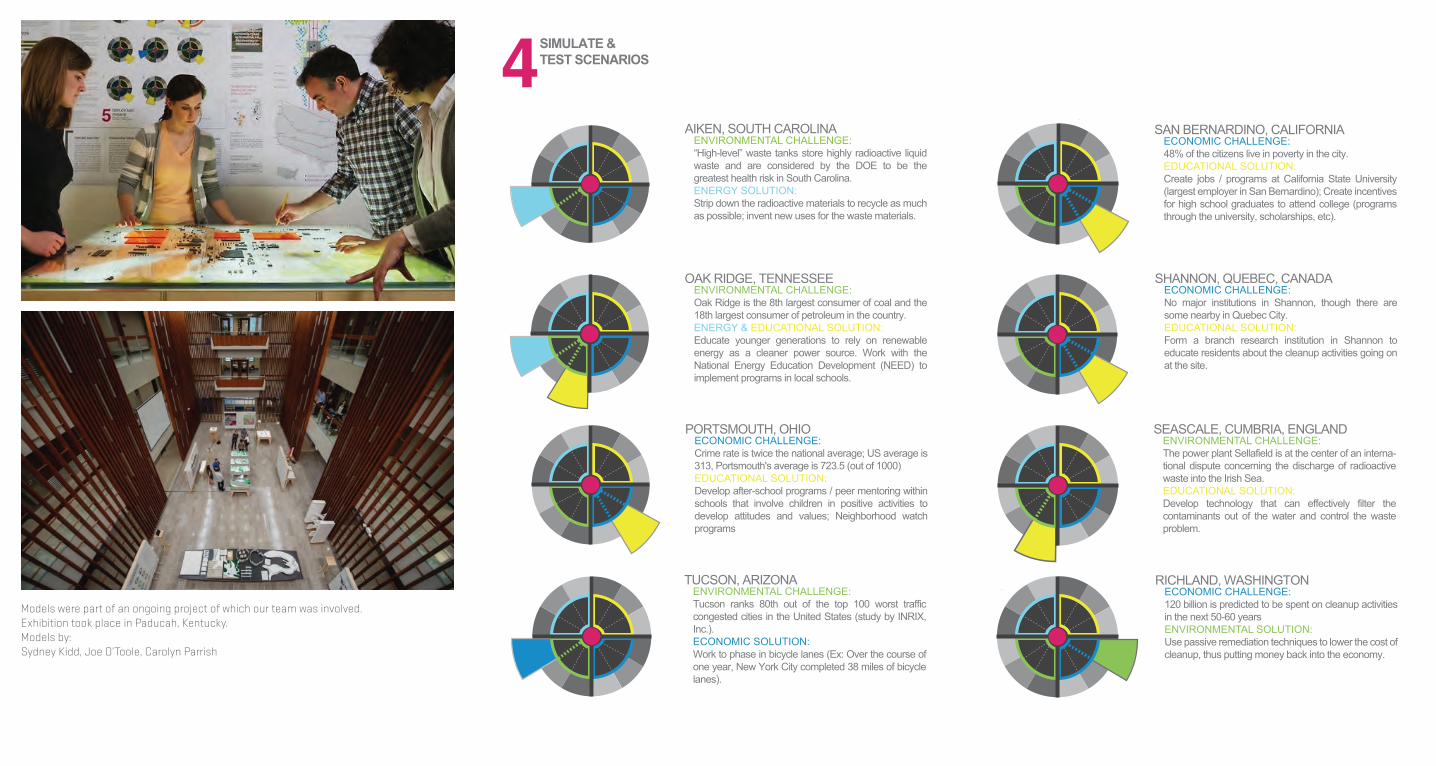
SIMULATE &TEST SCENARIOS
1. AIKEN, SOUTH CAROLINAENVIRONMENTAL CHALLENGE:“High-level” waste tanks store highly radioactive liquid waste and are considered by the DOE to be the greatest health risk in South Carolina.ENERGY SOLUTION:Strip down the radioactive materials to recycle as much as possible; invent new uses for the waste materials.
2. OAK RIDGE, TENNESSEEENVIRONMENTAL CHALLENGE:Oak Ridge is the 8th largest consumer of coal and the 18th largest consumer of petroleum in the country.ENERGY & EDUCATIONAL SOLUTION:Educate younger generations to rely on renewable energy as a cleaner power source. Work with the National Energy Education Development (NEED) to implement programs in local schools.
4. PORTSMOUTH, OHIOECONOMIC CHALLENGE:Crime rate is twice the national average; US average is 313, Portsmouth's average is 723.5 (out of 1000)EDUCATIONAL SOLUTION:Develop after-school programs / peer mentoring within schools that involve children in positive activities to develop attitudes and values; Neighborhood watch programs
5. TUCSON, ARIZONAENVIRONMENTAL CHALLENGE:Tucson ranks 80th out of the top 100 worst traffic congested cities in the United States (study by INRIX, Inc.).ECONOMIC SOLUTION: Work to phase in bicycle lanes (Ex: Over the course of one year, New York City completed 38 miles of bicycle lanes).
ENVIRONMENTAL CHALLENGE:
ENERGY & EDUCATIONAL SOLUTION:
Transformation of stored nuclear materials
turning waste into energy for the entire country for
twelve years. Education develops remediation
technologies and clean energy solutions.
and large land areas useless.
6. SAN BERNARDINO, CALIFORNIAECONOMIC CHALLENGE:48% of the citizens live in poverty in the city.EDUCATIONAL SOLUTION: Create jobs / programs at California State University (largest employer in San Bernardino); Create incentives for high school graduates to attend college (programs through the university, scholarships, etc).
8. SEASCALE, CUMBRIA, ENGLANDENVIRONMENTAL CHALLENGE:The power plant Sellafield is at the center of an interna-tional dispute concerning the discharge of radioactive waste into the Irish Sea.EDUCATIONAL SOLUTION: Develop technology that can effectively filter the contaminants out of the water and control the waste problem.
9. RICHLAND, WASHINGTONECONOMIC CHALLENGE:120 billion is predicted to be spent on cleanup activities in the next 50-60 yearsENVIRONMENTAL SOLUTION: Use passive remediation techniques to lower the cost of cleanup, thus putting money back into the economy.
7. SHANNON, QUEBEC, CANADAECONOMIC CHALLENGE:No major institutions in Shannon, though there are some nearby in Quebec City.EDUCATIONAL SOLUTION: Form a branch research institution in Shannon to educate residents about the cleanup activities going on at the site.
century.
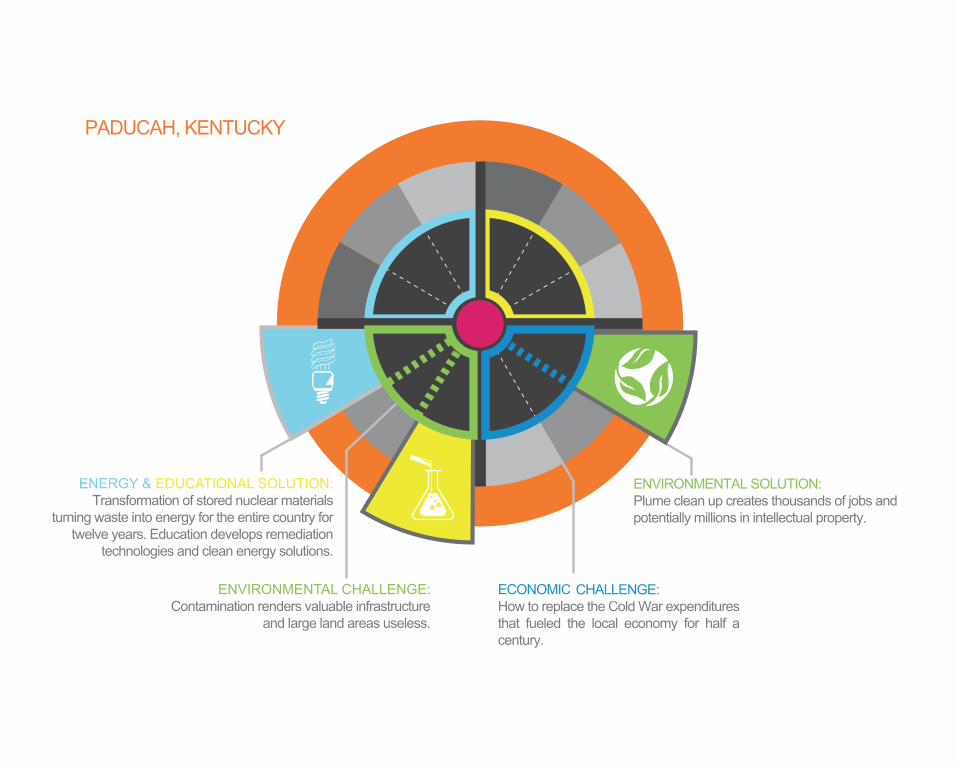
ENVIRONMENTAL CHALLENGE:Contamination renders valuable infrastructure
and large land areas useless.
ENERGY & EDUCATIONAL SOLUTION:Transformation of stored nuclear materials
turning waste into energy for the entire country for twelve years. Education develops remediation
technologies and clean energy solutions.
ECONOMic CHALLENGE:How to replace the Cold War expenditures that fueled the local economy for half a century.
ENVIRONMENTAL SOLUTION:Plume clean up creates thousands of jobs and potentially millions in intellectual property.
ECONOMic CHALLENGE:How to replace the Cold War expenditures
PADUCAH, KENTUCKY
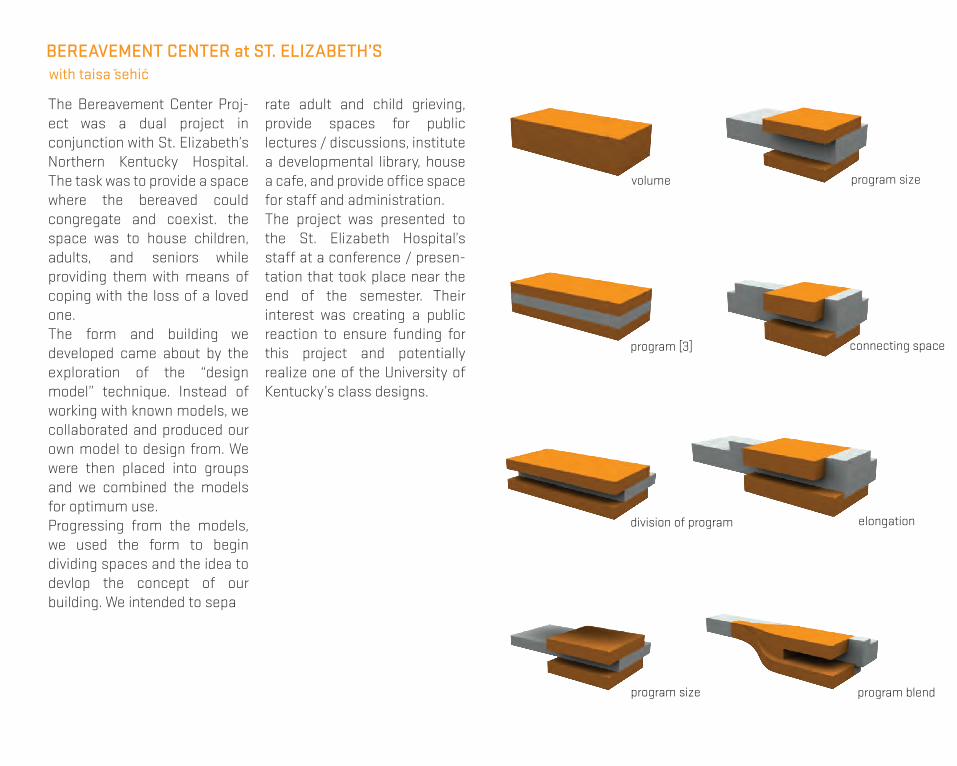
volume
program [3]
division of program
program size
program size
connecting space
elongation
program blend
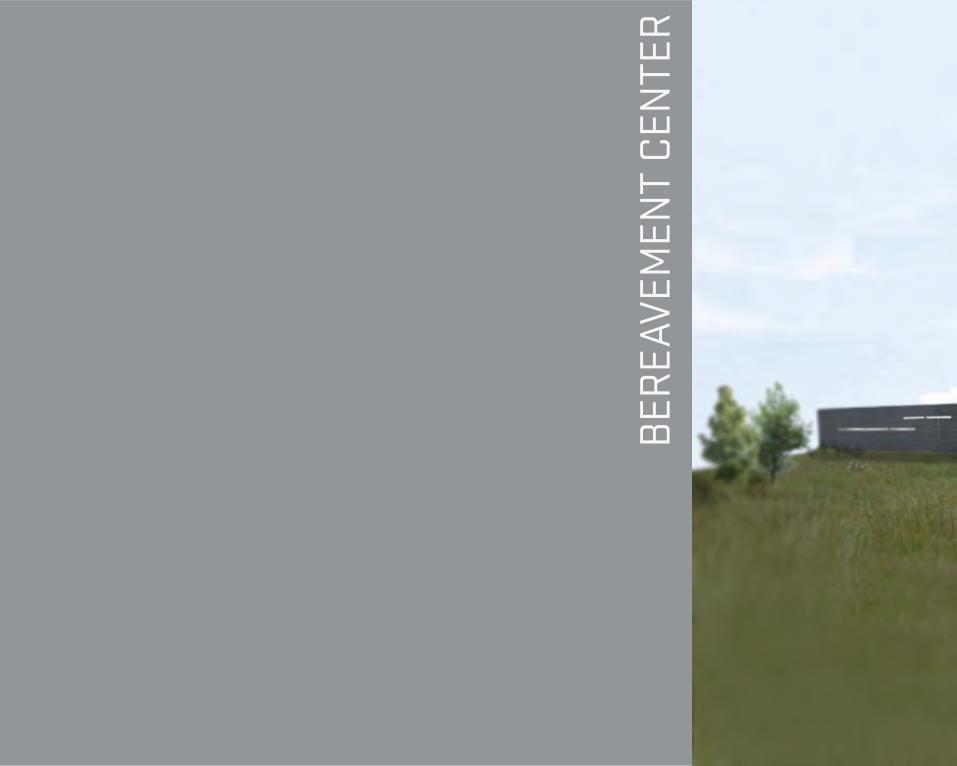
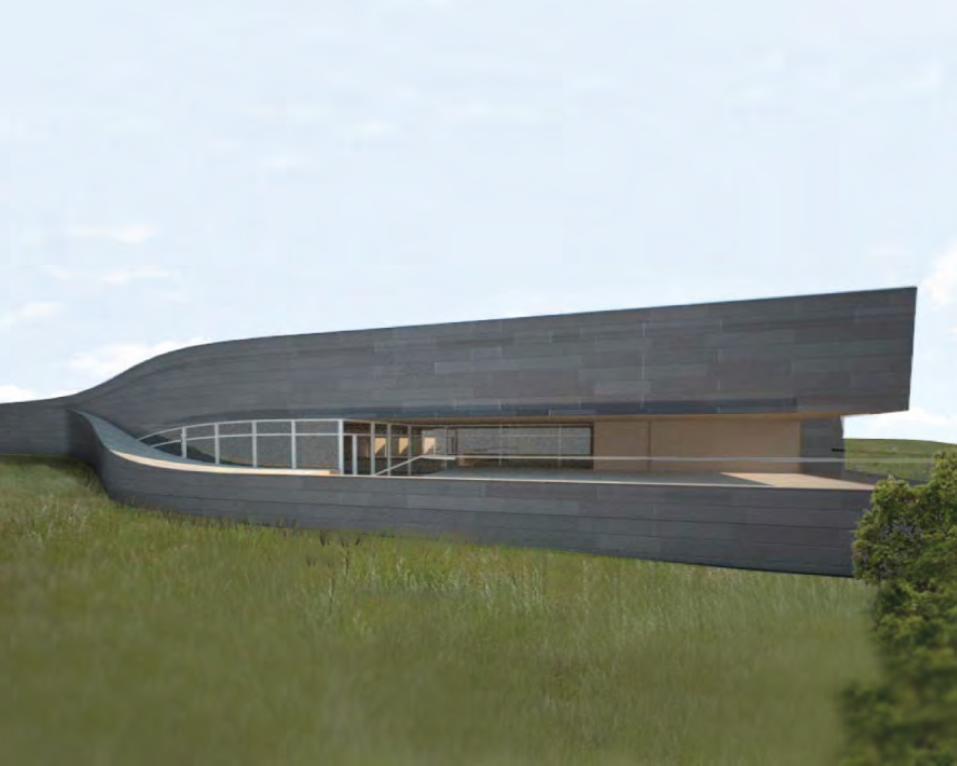
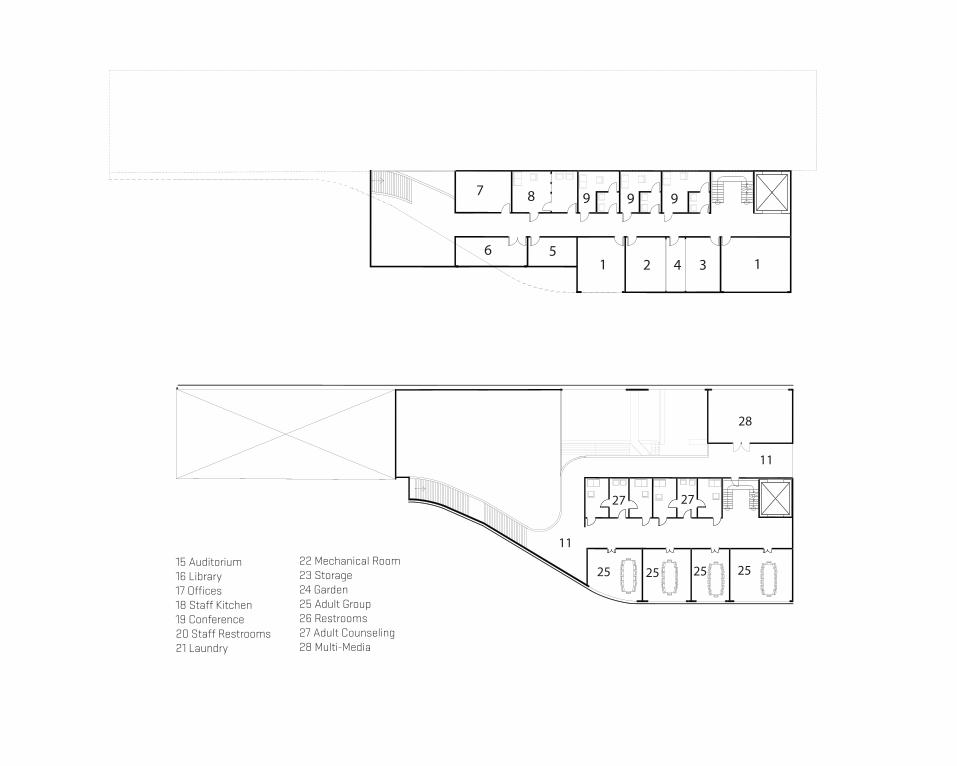
The Bereavement Center Proj-ect was a dual project in conjunction with St. Elizabeth’s Northern Kentucky Hospital. The task was to provide a space where the bereaved could congregate and coexist. the space was to house children, adults, and seniors while providing them with means of coping with the loss of a loved one. The form and building we developed came about by the exploration of the “design model” technique. Instead of working with known models, we collaborated and produced our own model to design from. We were then placed into groups and we combined the models for optimum use. Progressing from the models, we used the form to begin dividing spaces and the idea to devlop the concept of our building. We intended to sepa
rate adult and child grieving, provide spaces for public lectures / discussions, institute a developmental library, house a cafe, and provide office space for staff and administration. The project was presented to the St. Elizabeth Hospital’s staff at a conference / presen-tation that took place near the end of the semester. Their interest was creating a public reaction to ensure funding for this project and potentially realize one of the University of Kentucky’s class designs.
BEREAVEMENT CENTER at ST. ELIZABETH’Swith taisa sehi!
Crescent Springs
Villa Hills
Fort MitchellCincinnatti -
Northern Kentucky International Airport
Crestview Hills
To Lexington and Erlanger
Edgewood
Fort Wright Kenton Vale
Lakeside Park
Rouse
Southgate
Park Hills
Ludlow
Bromley
Covington
Newport
CincinnatiWalnut Hills
West Prince Hill
To Indianapolis, IN
To Dayton, OH
Ohio River
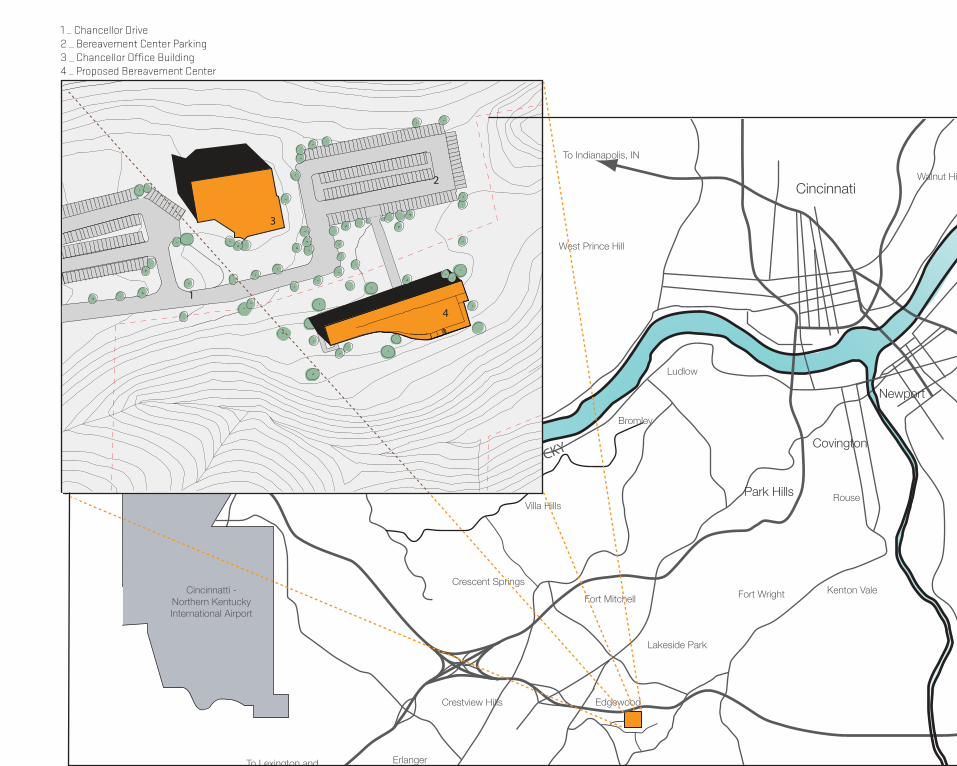
1
2
3
4
1 _ Chancellor Drive 2 _ Bereavement Center Parking3 _ Chancellor Office Building4 _ Proposed Bereavement Center
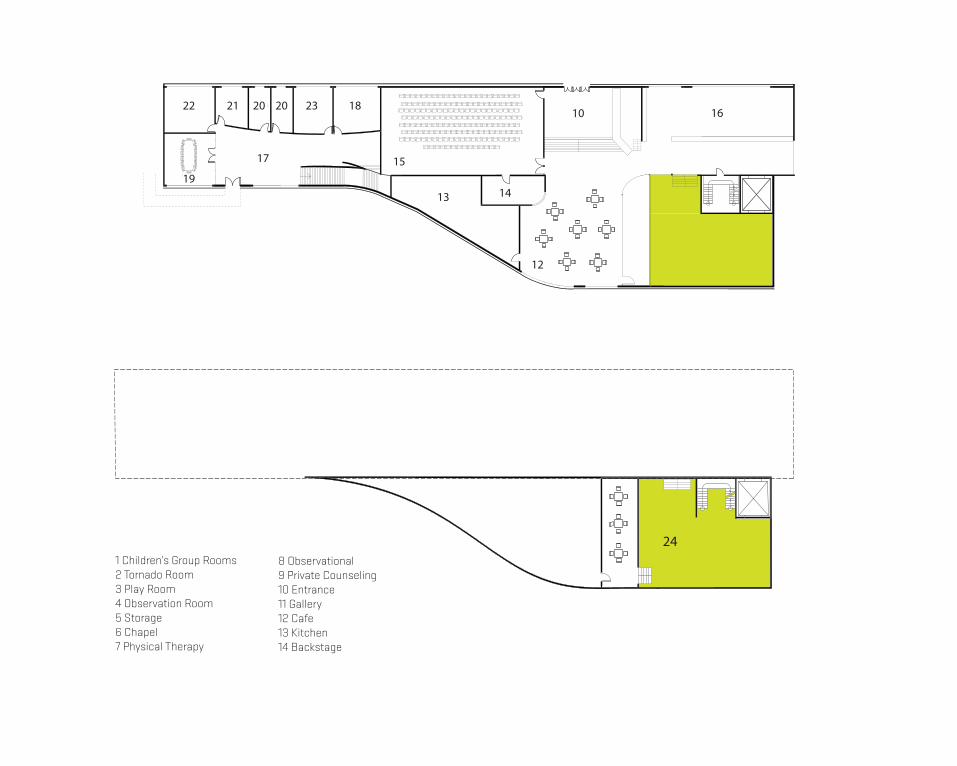
241 Children’s Group Rooms2 Tornado Room3 Play Room4 Observation Room5 Storage6 Chapel7 Physical Therapy
8 Observational 9 Private Counseling10 Entrance11 Gallery12 Cafe13 Kitchen14 Backstage
10
11
12
1314
15
16
19
2122 23
17
18202021 20 20 2322
19
17
18
15
13 14
12
10 16
11
25
27
28
11
25 25 25
27
11 2 3456
7 8 9 9 9
15 Auditorium16 Library17 Offices18 Staff Kitchen19 Conference20 Staff Restrooms21 Laundry
22 Mechanical Room23 Storage24 Garden25 Adult Group26 Restrooms27 Adult Counseling28 Multi-Media
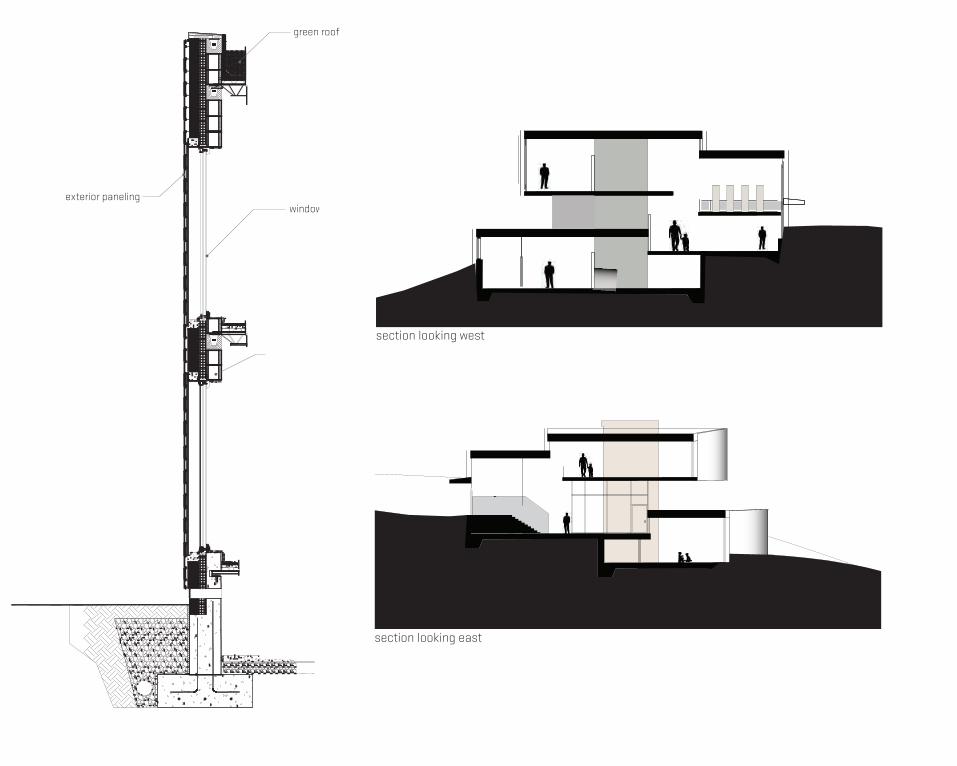
green roof
exterior panelingwindow
cmu
section looking east
section looking west
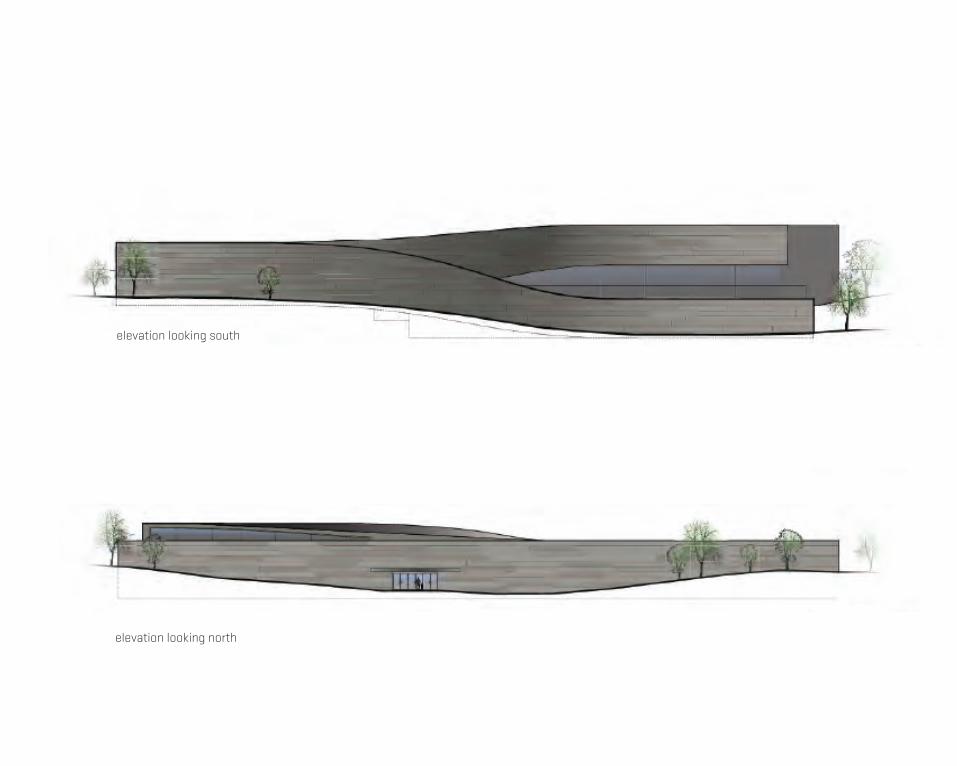
elevation looking north
elevation looking south
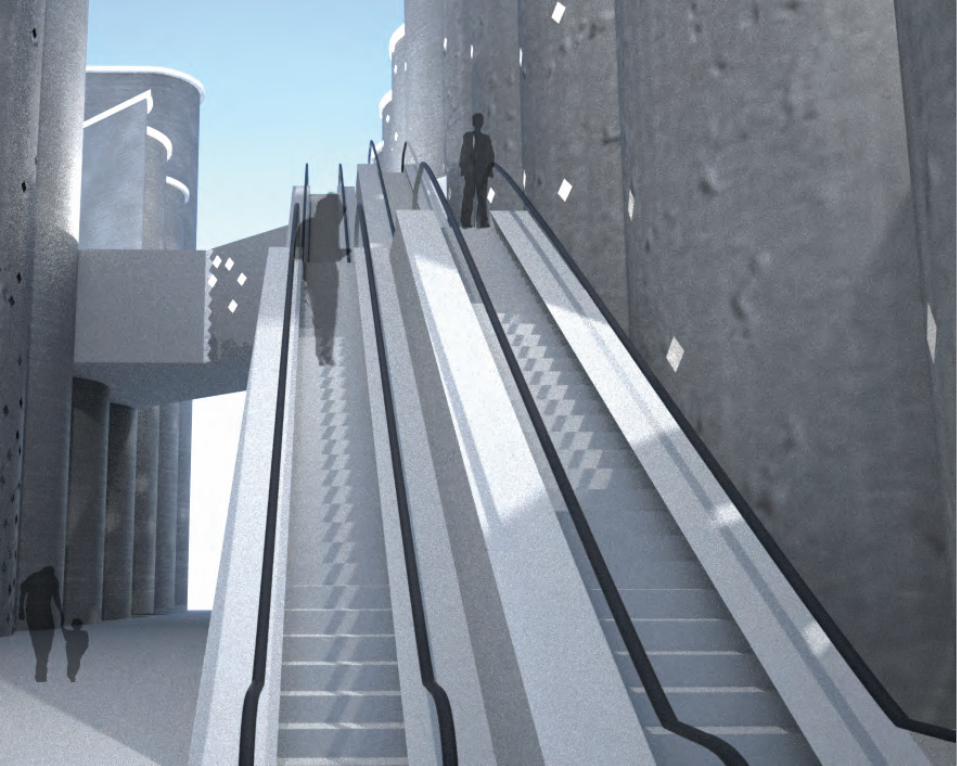
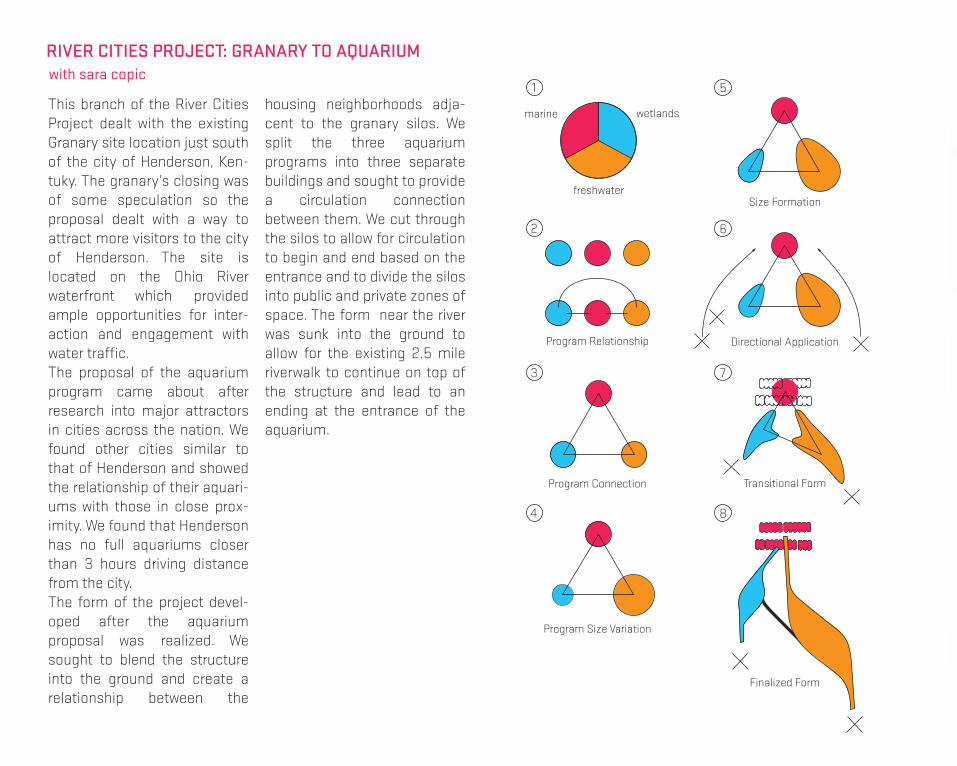
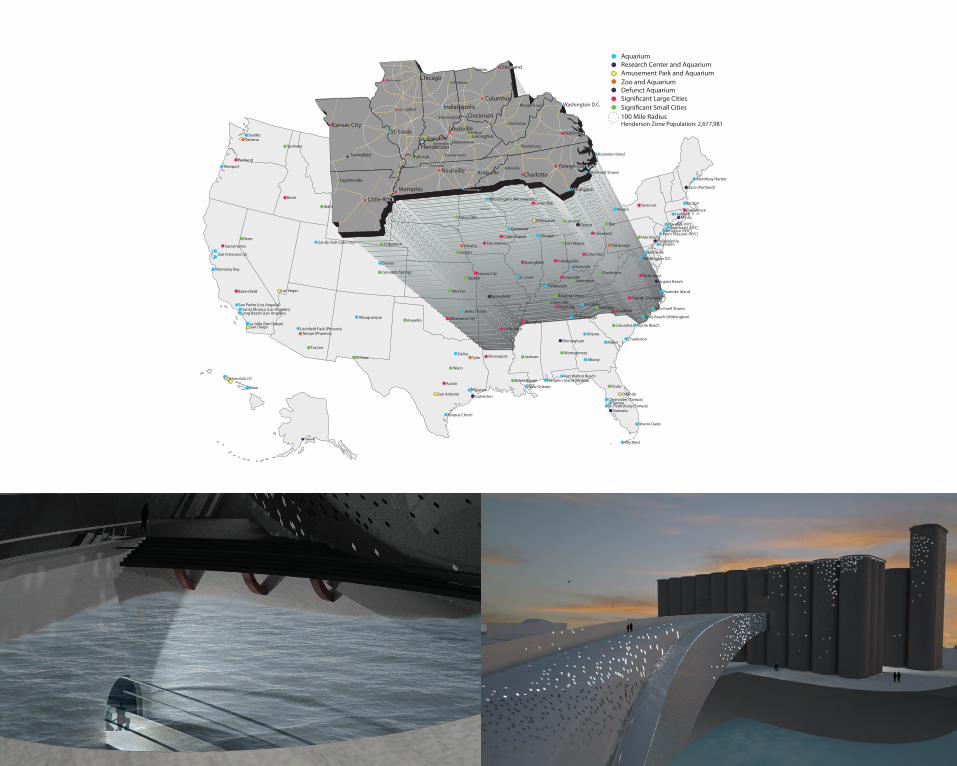
This branch of the River Cities Project dealt with the existing Granary site location just south of the city of Henderson, Ken-tuky. The granary’s closing was of some speculation so the proposal dealt with a way to attract more visitors to the city of Henderson. The site is located on the Ohio River waterfront which provided ample opportunities for inter-action and engagement with water traffic. The proposal of the aquarium program came about after research into major attractors in cities across the nation. We found other cities similar to that of Henderson and showed the relationship of their aquari-ums with those in close prox-imity. We found that Henderson has no full aquariums closer than 3 hours driving distance from the city. The form of the project devel-oped after the aquarium proposal was realized. We sought to blend the structure into the ground and create a relationship between the
housing neighborhoods adja-cent to the granary silos. We split the three aquarium programs into three separate buildings and sought to provide a circulation connection between them. We cut through the silos to allow for circulation to begin and end based on the entrance and to divide the silos into public and private zones of space. The form near the river was sunk into the ground to allow for the existing 2.5 mile riverwalk to continue on top of the structure and lead to an ending at the entrance of the aquarium.
RIVER CITIES PROJECT: GRANARY TO AQUARIUMwith sara copic
Program Relationship
1
marine
freshwater
wetlands
2
Program Connection
Program Size Variation
Finalized Form
Transitional Form
Directional Application
Size Formation
3
4
5
6
7
8
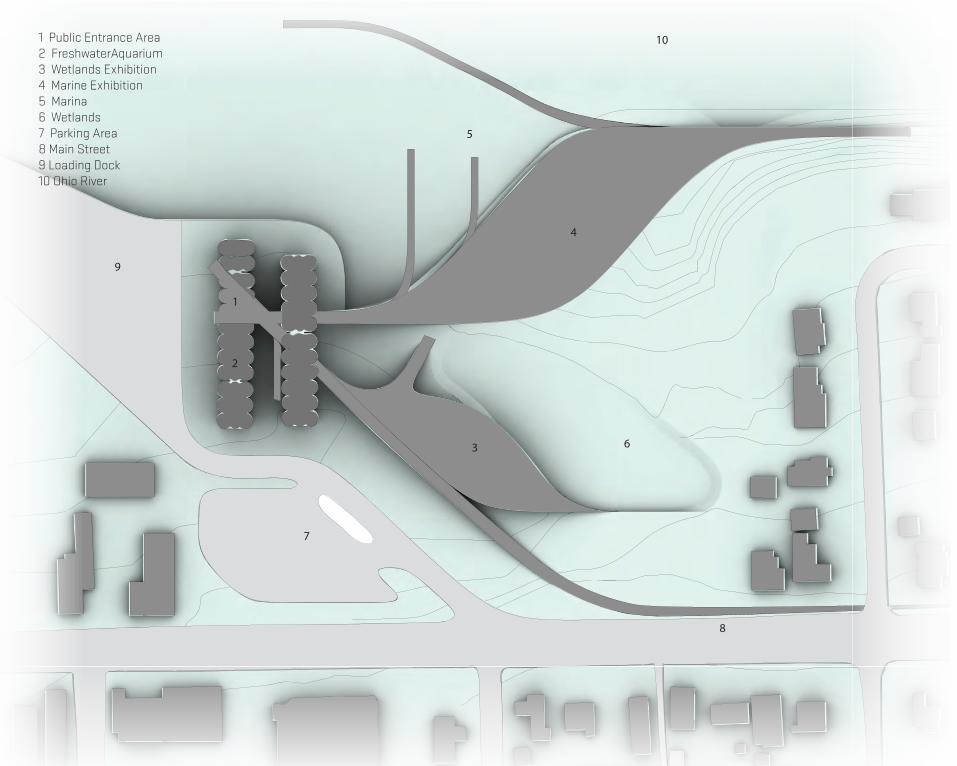
1 Public Entrance Area 2 FreshwaterAquarium 3 Wetlands Exhibition 4 Marine Exhibition5 Marina 6 Wetlands 7 Parking Area8 Main Street9 Loading Dock10 Ohio River
1
2
3
4
5
6
7
8
9
10
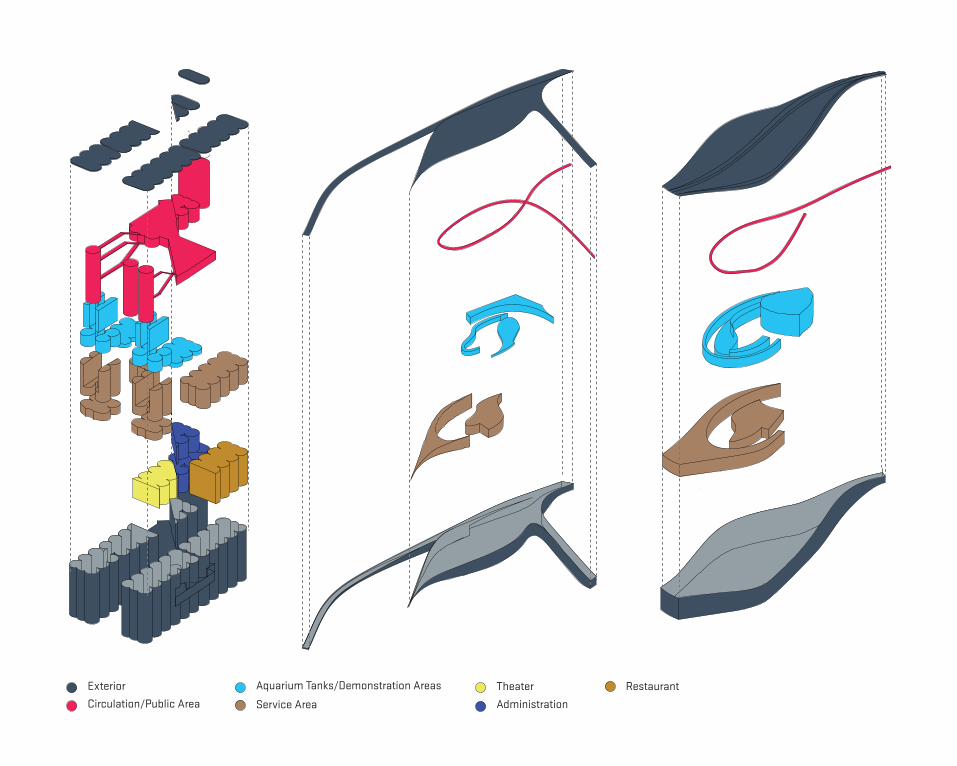
Exterior Circulation/Public Area
Aquarium Tanks/Demonstration AreasService Area
TheaterAdministration
Restaurant
Honolulu (3)
Maui
Louisville
Indianapolis
Henderson
Cincinnati
Columbus
Spring!eld
St. Louis
Memphis
Nashville KnoxvilleAsheville
Charlotte
Atlanta
Birmingham
Little Rock
Chicago
Charleston
Lexington
Bowling Green
Chattanooga
Clarksville
Boothbay Harbor
Saco (Portland)
Boston
MysticHartford
Norwalk (NYC)Riverhead (NYC)
Brooklyn (NYC)Point Pleasant (NYC)
CamdenPhiladelphia
BaltimoreWashington D.C.
Virginia Beach
Roanoke Island
Pine Knoll Shores
Kure Beach (Wilmington)
Myrtle Beach
CharlestonMillen
Albany
Orlando
Tampa St. Petersburg (Tampa)Clearwater (Tampa)
Miami-Dade
Key West
Niagra
Pittsburgh
DetroitMilwaukee
Duluth
Bloomington (Minneapolis)
Dubuque
Spring!eld
Sarasota
Fort Walton BeachDauphin Island (Mobile)
New Orleans
Dallas
HoustonGalveston
Corpus Christi
San Antonio
Omaha
Denver
Albuquerque
Tempe (Phoenix)Litch!eld Park (Phoenix)
Las Vegas
Sandy (Salt Lake City)
SeattleTacoma
Newport
San Francisco (2)
Monterey Bay
San Pedro (Los Angeles)Santa Monica (Los Angeles)Long Beach (Los Angeles)
La Jolla (San Diego)San Diego
Jenks (Tulsa)
Oklahoma City
Kansas City
Green Bay
Cleveland
Austin
Boise
Portland
Sacramento
Raleigh-Durham
Richmond
LansingErie
JacksonMontgomery
Baton Rouge
Waco
Amarillo
Wichita
Topeka
Lincoln
Sioux Falls
Bismarck
Colorado Springs
El Paso
Tucson
Reno
Bakers!eld
Spokane
Idaho Falls
Great Falls
Billings
Cheyenne Des Moines
Cedar Rapids
Shreveport
Syracuse
Columbia
Ocala
Fort WayneHarrisburg
Providence
Tyler
Seward
Atlanta
Roanoke Island
Chattanooga
Henderson Zone Population: 2,677,981
AquariumResearch Center and AquariumAmusement Park and AquariumZoo and AquariumDefunct AquariumSigni!cant Large CitiesSigni!cant Small Cities100 Mile Radius
Aquariums in the United States

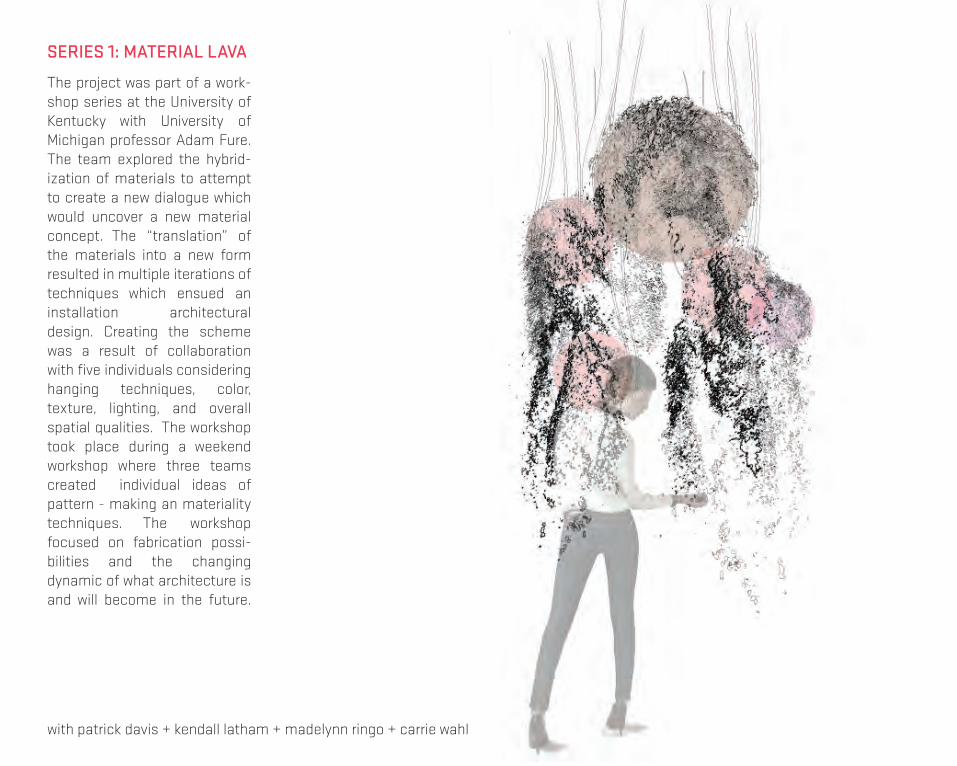
The project was part of a work-shop series at the University of Kentucky with University of Michigan professor Adam Fure. The team explored the hybrid-ization of materials to attempt to create a new dialogue which would uncover a new material concept. The “translation” of the materials into a new form resulted in multiple iterations of techniques which ensued an installation architectural design. Creating the scheme was a result of collaboration with five individuals considering hanging techniques, color, texture, lighting, and overall spatial qualities. The workshop took place during a weekend workshop where three teams created individual ideas of pattern - making an materiality techniques. The workshop focused on fabrication possi-bilities and the changing dynamic of what architecture is and will become in the future.
SERIES 1: MATERIAL LAVA
with patrick davis + kendall latham + madelynn ringo + carrie wahl
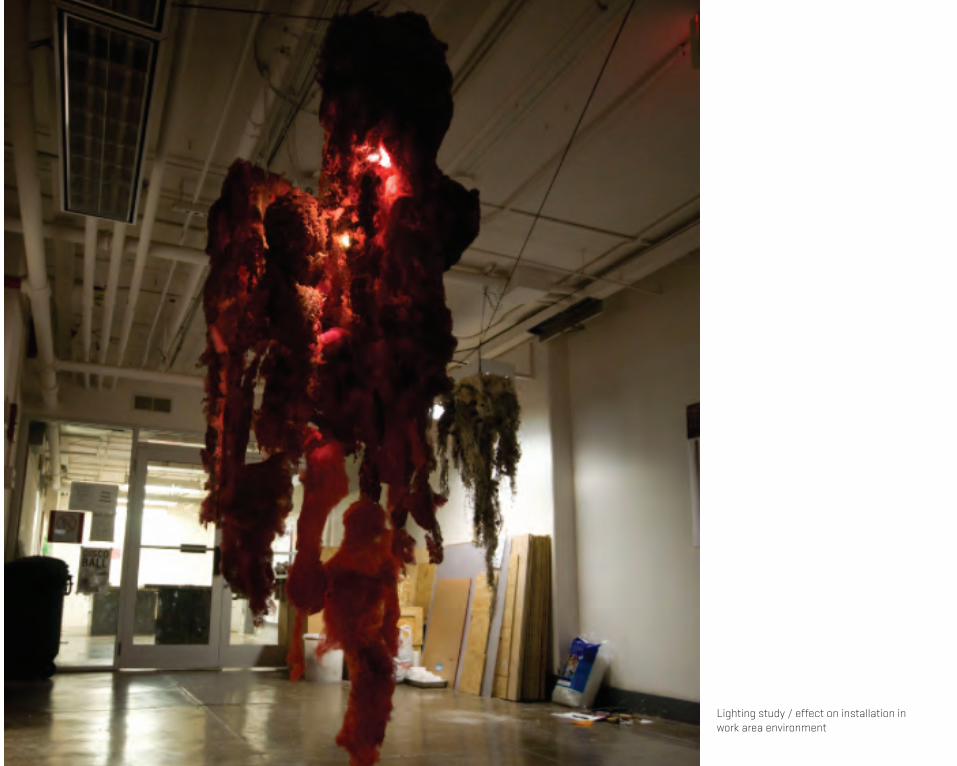
Lighting study / effect on installation in work area environment
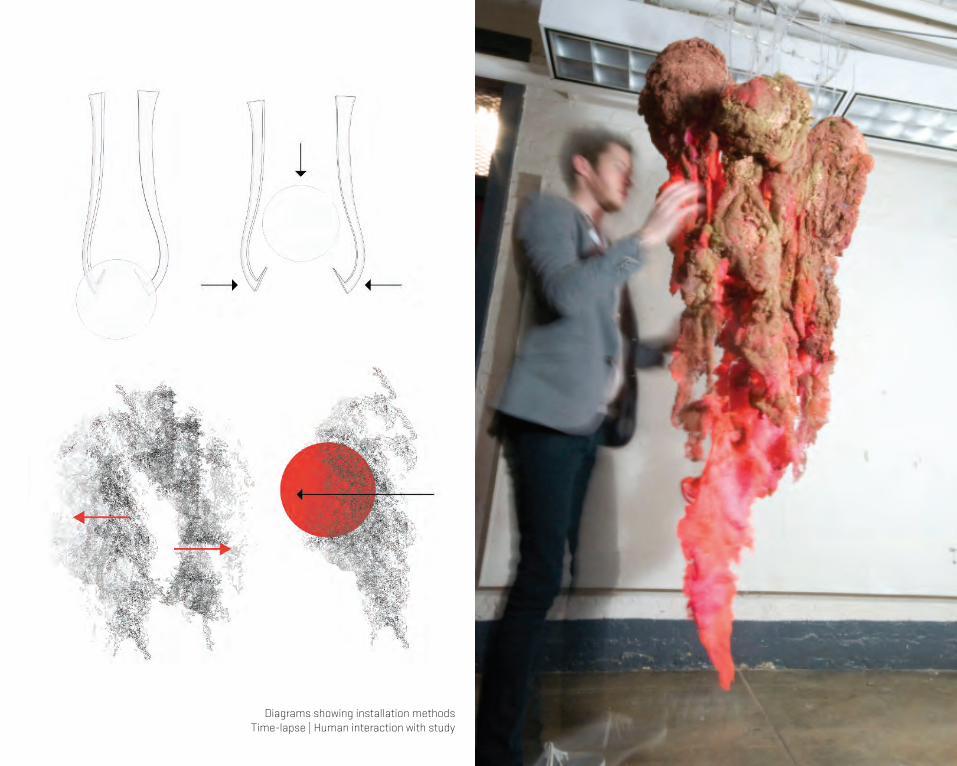
Diagrams showing installation methodsTime-lapse | Human interaction with study
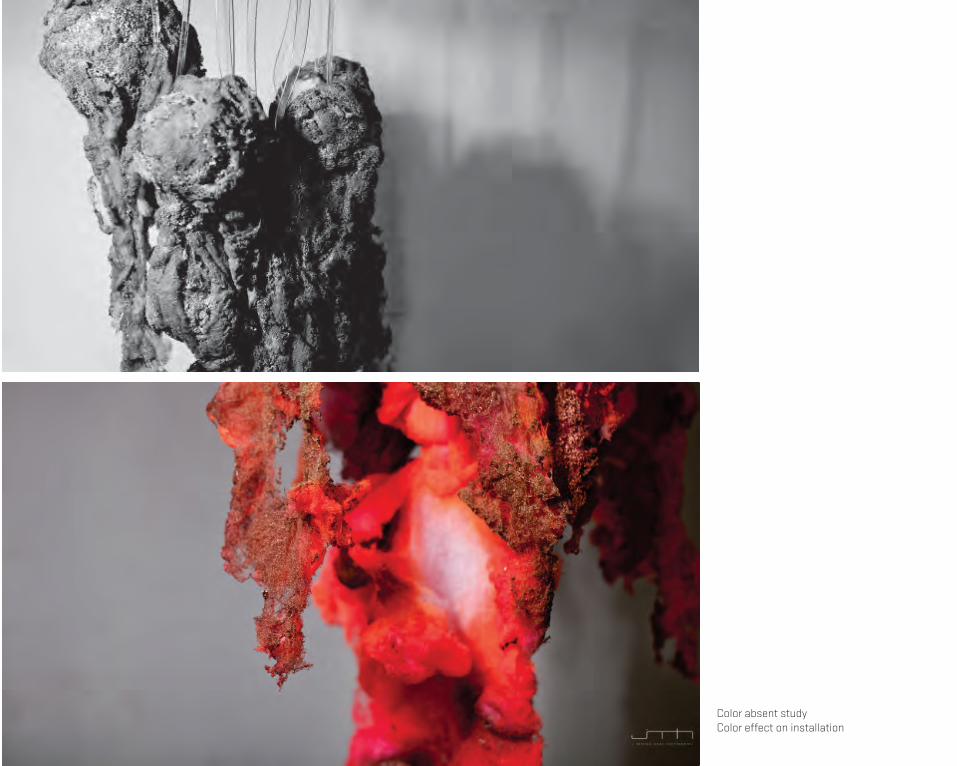
Color absent studyColor effect on installation
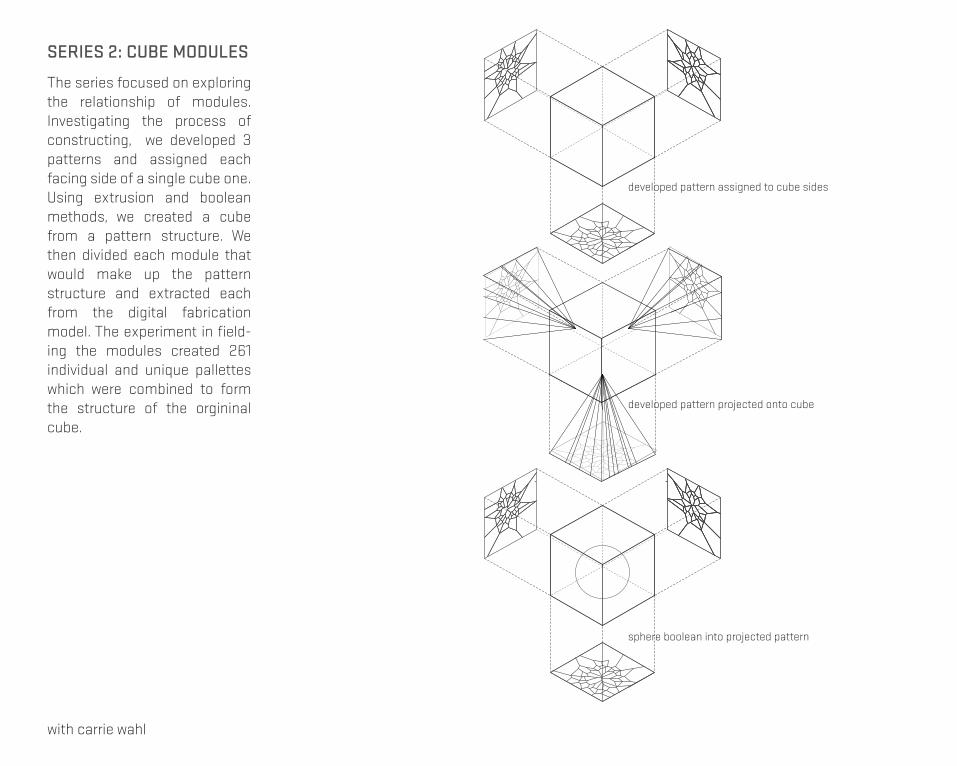
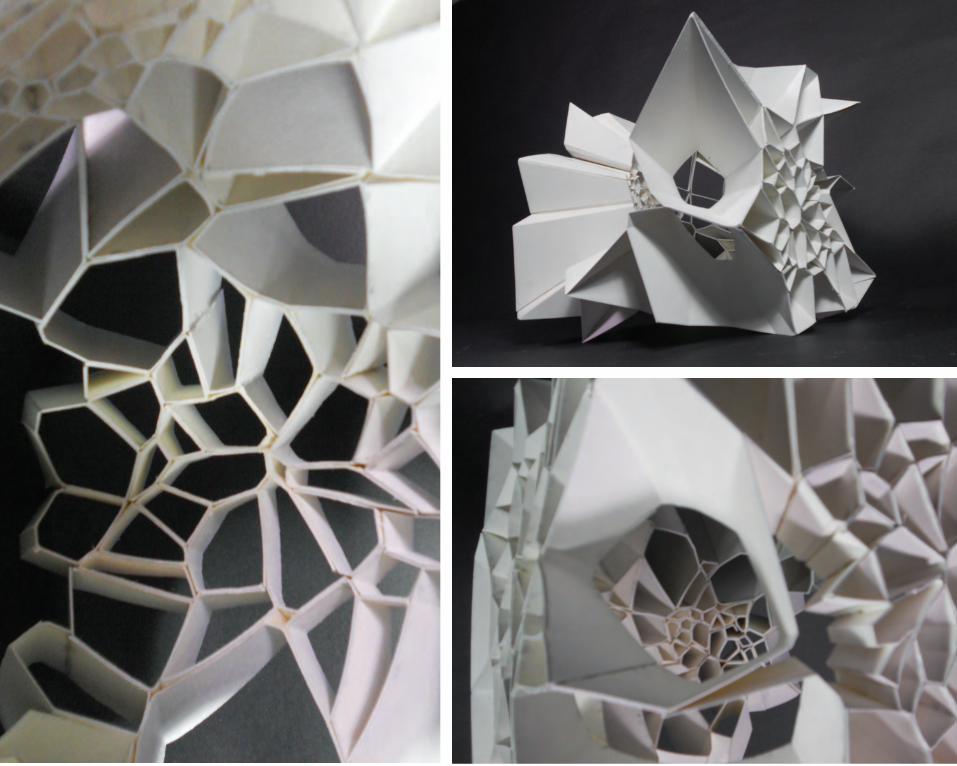
The series focused on exploring the relationship of modules. Investigating the process of constructing, we developed 3 patterns and assigned each facing side of a single cube one. Using extrusion and boolean methods, we created a cube from a pattern structure. We then divided each module that would make up the pattern structure and extracted each from the digital fabrication model. The experiment in field-ing the modules created 261 individual and unique pallettes which were combined to form the structure of the orgininal cube.
SERIES 2: CUBE MODULES
with carrie wahl
developed pattern assigned to cube sides
developed pattern projected onto cube
sphere boolean into projected pattern
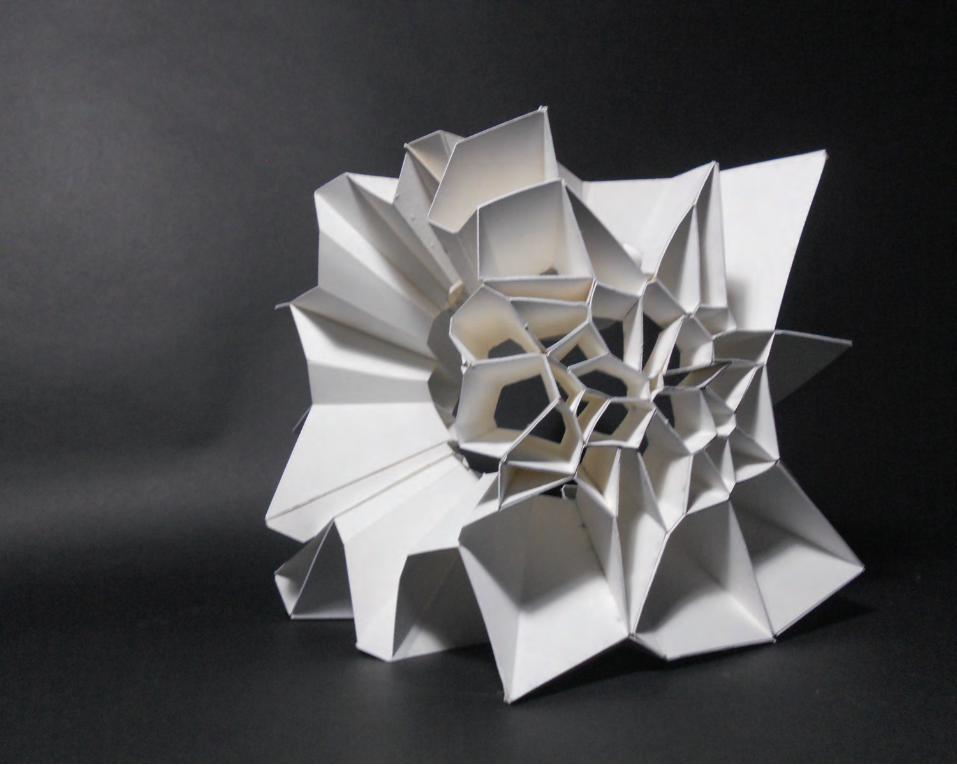
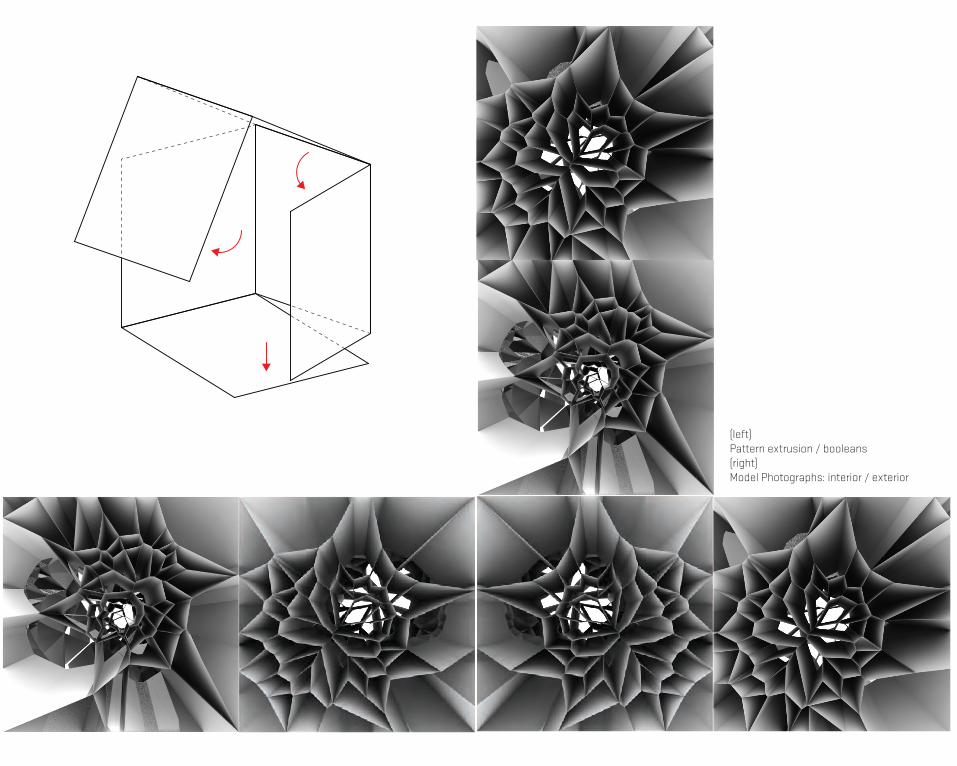
(left) Pattern extrusion / booleans (right)Model Photographs: interior / exterior
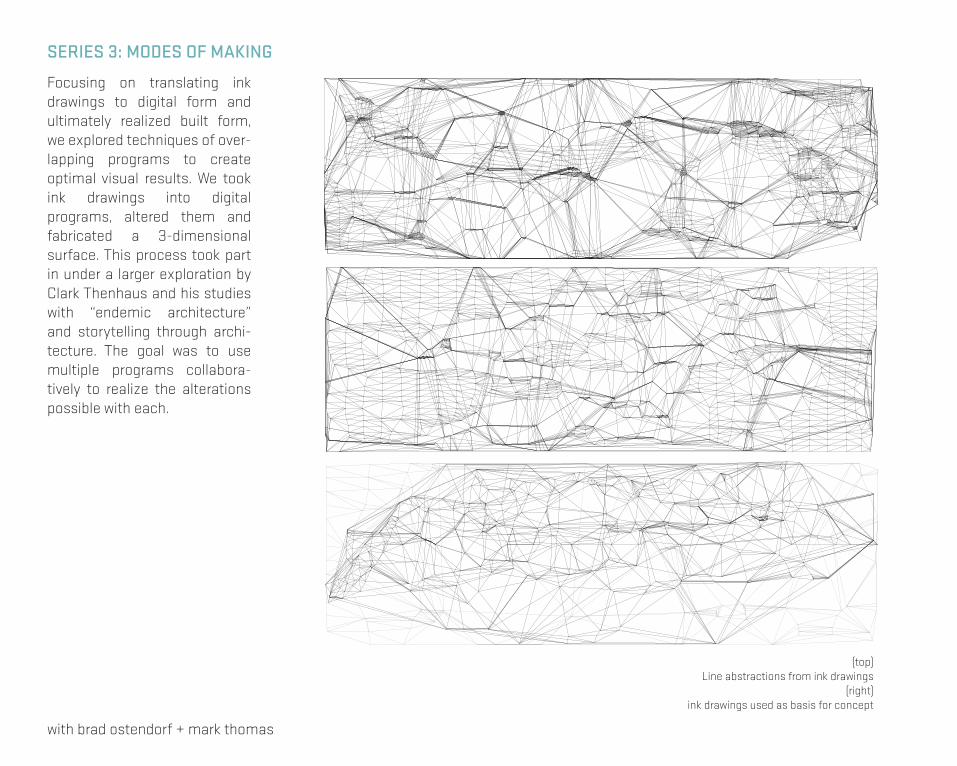
Focusing on translating ink drawings to digital form and ultimately realized built form, we explored techniques of over-lapping programs to create optimal visual results. We took ink drawings into digital programs, altered them and fabricated a 3-dimensional surface. This process took part in under a larger exploration by Clark Thenhaus and his studies with “endemic architecture” and storytelling through archi-tecture. The goal was to use multiple programs collabora-tively to realize the alterations possible with each.
SERIES 3: MODES OF MAKING
with brad ostendorf + mark thomas
(top)Line abstractions from ink drawings
(right)ink drawings used as basis for concept

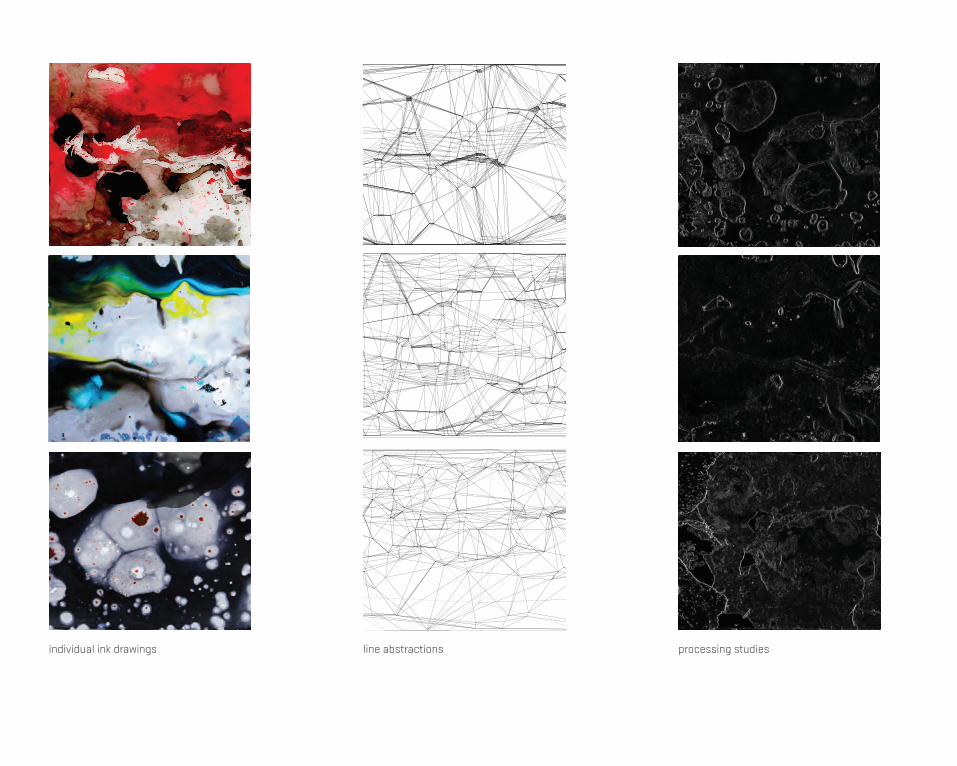
line abstractionsindividual ink drawings processing studies
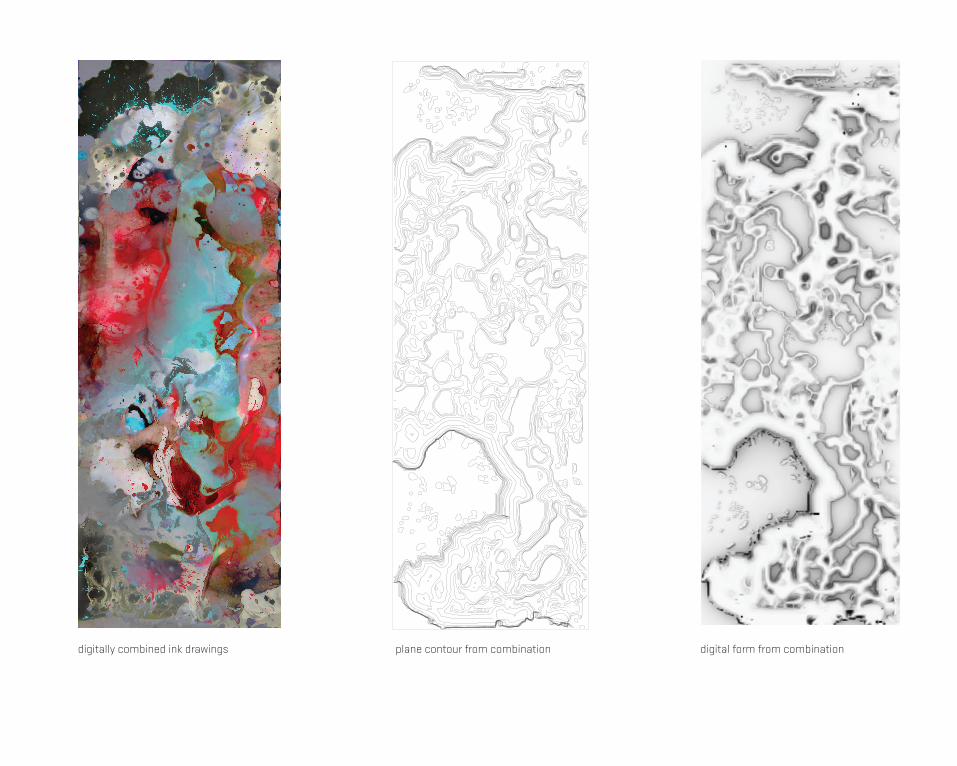
digitally combined ink drawings plane contour from combination digital form from combination