Embed Size (px)
Citation preview
March 23, 2015
Kathryn Walker, FCAS, MAAA, CPCUGary Wang, FCAS, MAAA
Usage Based Insurance: Trends and Considerations in the Current Personal Auto Market
Midwestern Actuarial ForumSpring 2015 Meeting

2
About the presenters
Kathryn A. Walker, FCAS, MAAA, CPCU• 15 years of property/casualty experience• Consulting actuary in the Chicago office
Gary Wang, FCAS, MAAA• 18 years of property/casualty experience• Consulting actuary in the Bloomington office
3
• The current UBI landscape • A survey of current UBI offerings• Customer segmentation• Telematics data and technology
• Into the Wild – A New Frontier for the Actuary• UBI strategy and program considerations• Customer Response to Usage-Based Insurance• Urban Traveler- UBI in the City
Discussion topics
4
The current UBI landscape
5
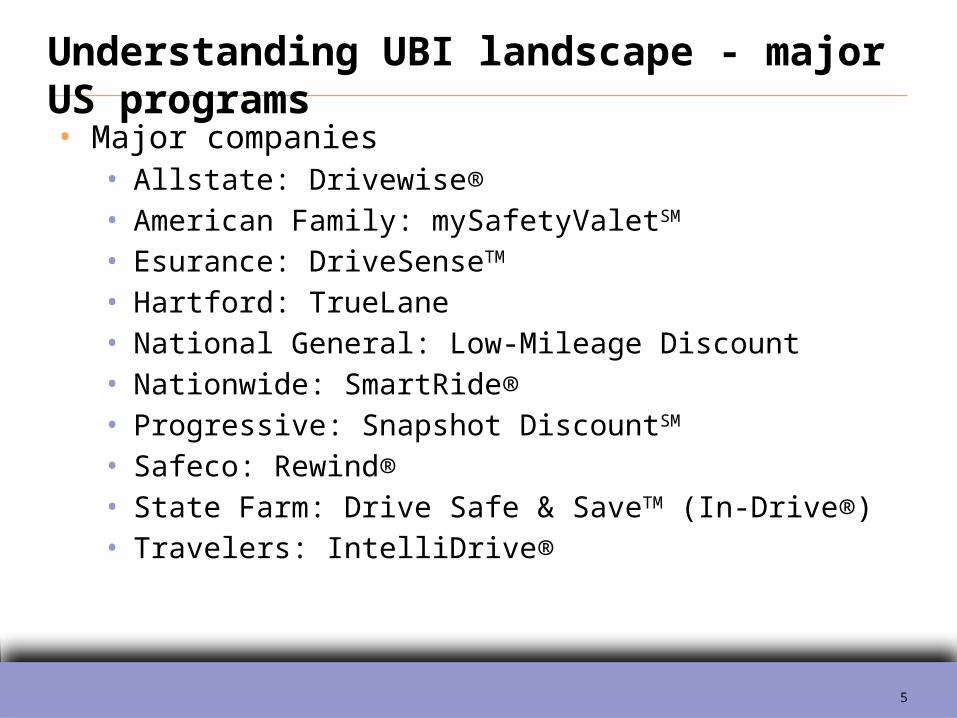
• Major companies• Allstate: Drivewise®• American Family: mySafetyValetSM
• Esurance: DriveSenseTM
• Hartford: TrueLane• National General: Low-Mileage Discount• Nationwide: SmartRide®• Progressive: Snapshot DiscountSM
• Safeco: Rewind®• State Farm: Drive Safe & SaveTM (In-Drive®)• Travelers: IntelliDrive®
Understanding UBI landscape - major US programs
6
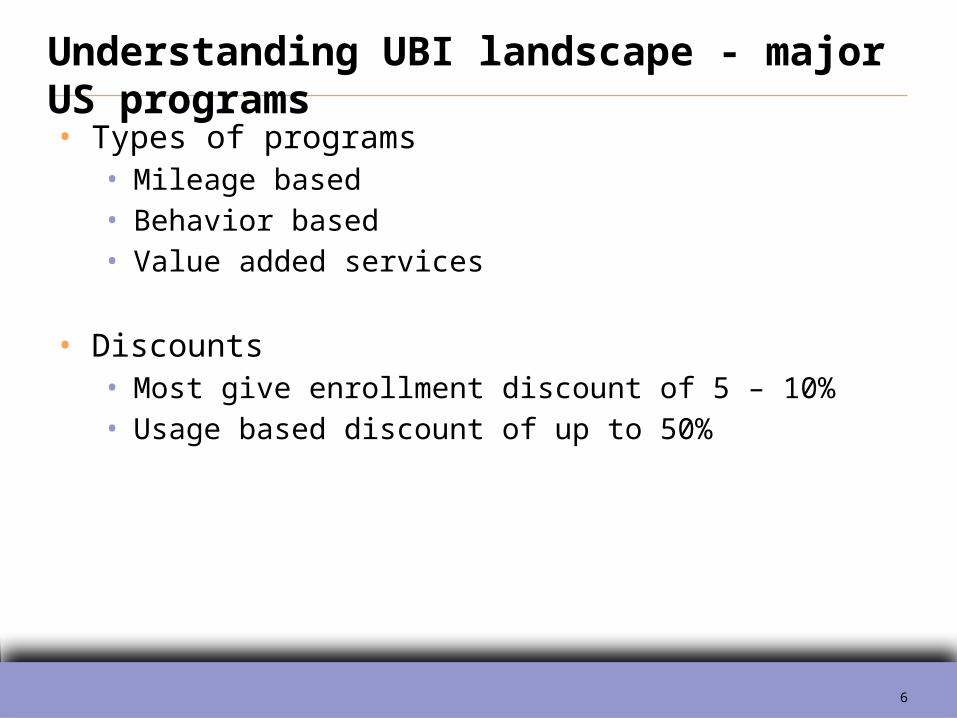
• Types of programs• Mileage based• Behavior based• Value added services
• Discounts• Most give enrollment discount of 5 – 10%• Usage based discount of up to 50%
Understanding UBI landscape - major US programs
7
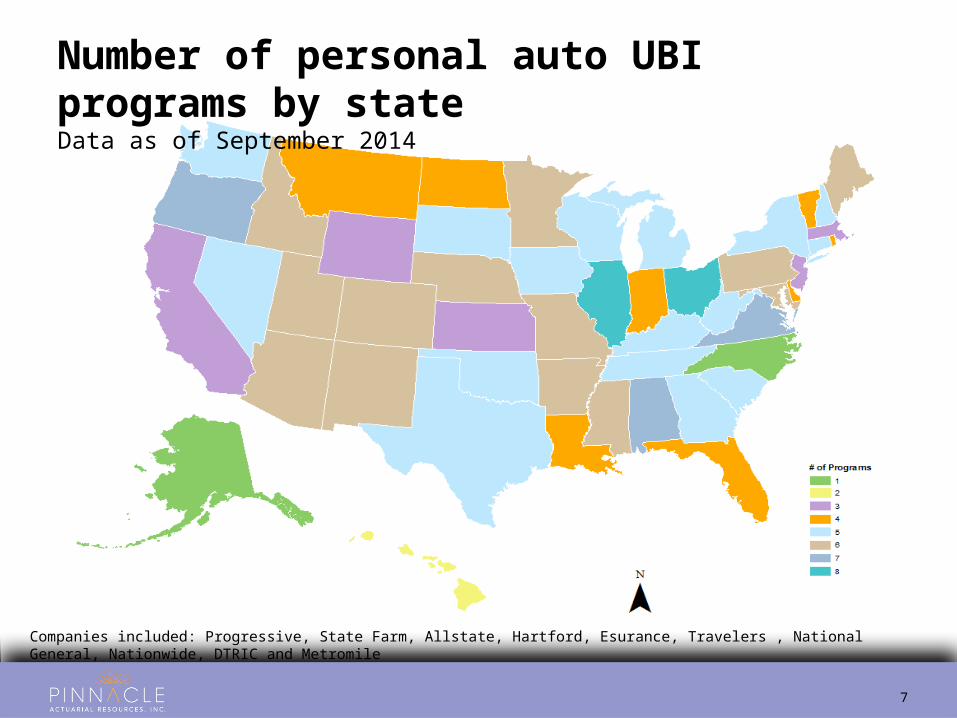
Number of personal auto UBI programs by stateData as of September 2014
Companies included: Progressive, State Farm, Allstate, Hartford, Esurance, Travelers , National General, Nationwide, DTRIC and Metromile
8
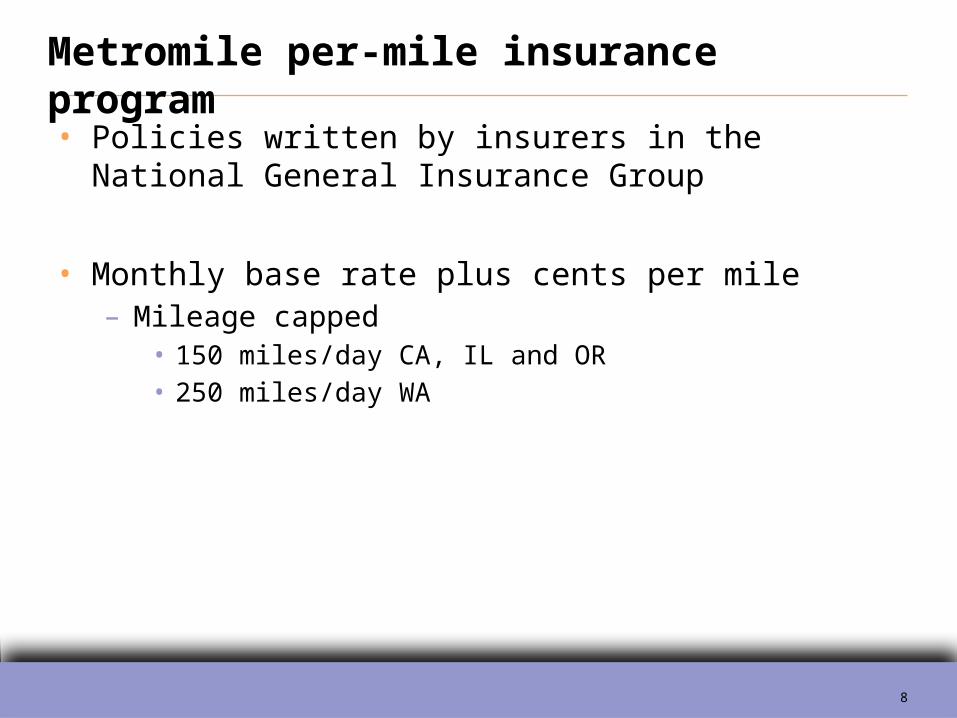
• Policies written by insurers in the National General Insurance Group
• Monthly base rate plus cents per mile– Mileage capped
• 150 miles/day CA, IL and OR• 250 miles/day WA
Metromile per-mile insurance program
9
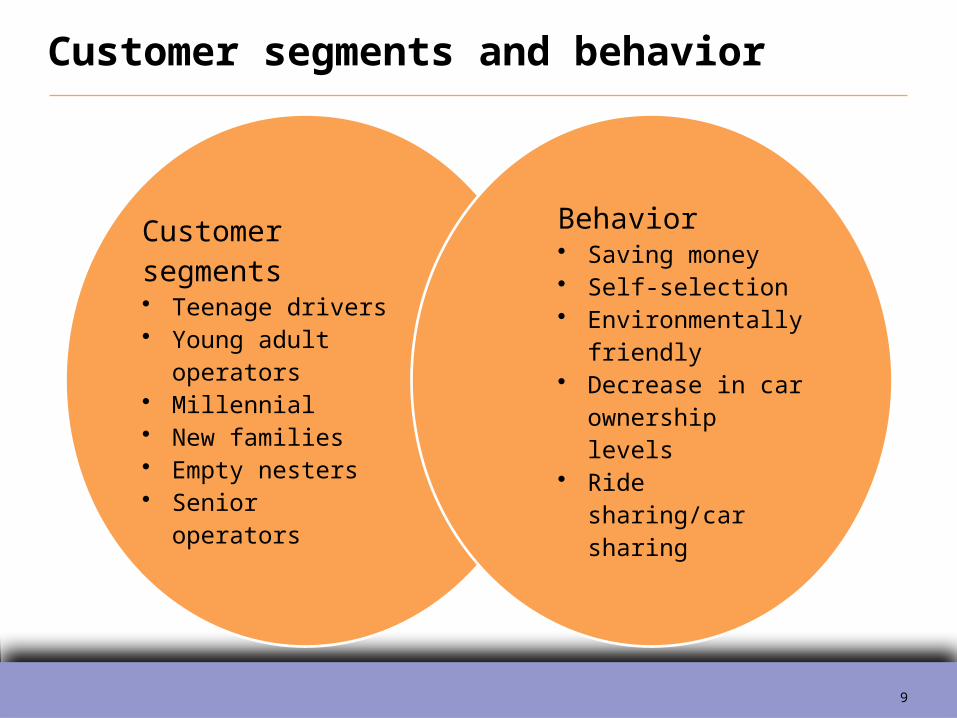
Customer segments• Teenage drivers• Young adult
operators• Millennial• New families• Empty nesters• Senior operators
Behavior• Saving money• Self-selection• Environmentally
friendly• Decrease in car
ownership levels• Ride sharing/car
sharing
Customer segments and behavior
10
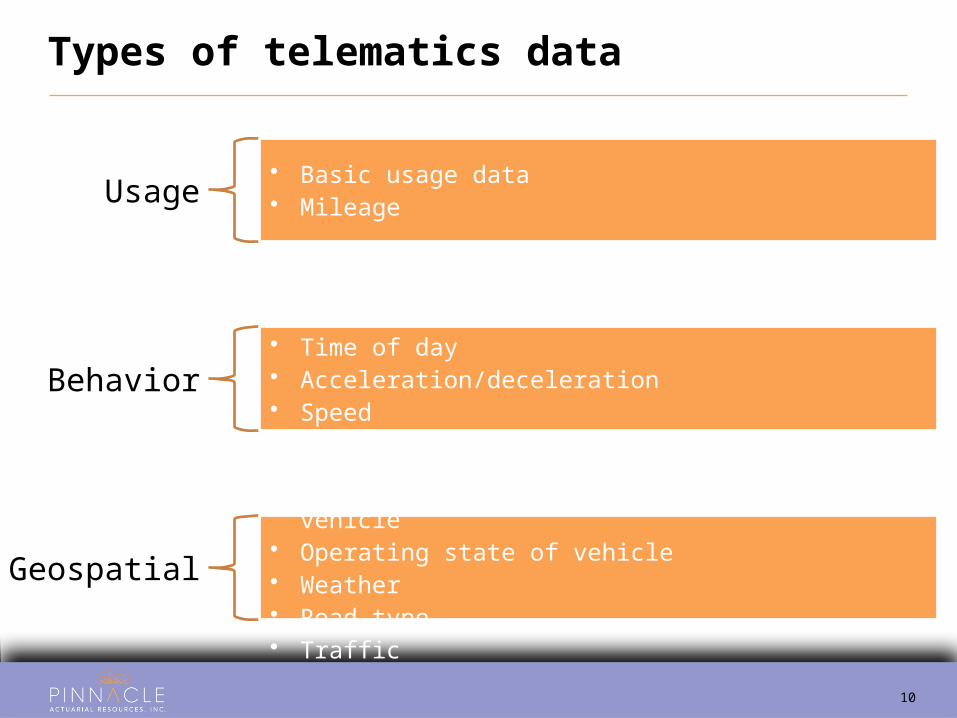
Types of telematics data
Usage• Basic usage data• Mileage
Behavior
• Measures vehicle behavior on road• Time of day• Acceleration/deceleration• Speed• Location
Geospatial
• Measures conditions of and surrounding vehicle• Operating state of vehicle• Weather• Road type• Traffic
11
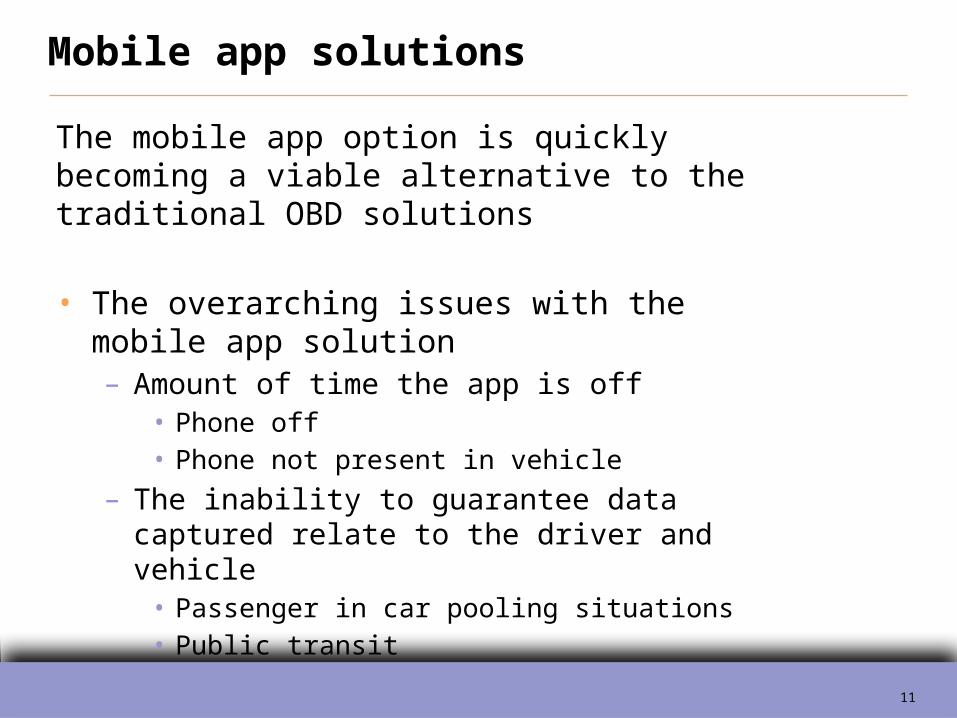
The mobile app option is quickly becoming a viable alternative to the traditional OBD solutions
• The overarching issues with the mobile app solution– Amount of time the app is off
• Phone off• Phone not present in vehicle
– The inability to guarantee data captured relate to the driver and vehicle
• Passenger in car pooling situations• Public transit
Mobile app solutions
12
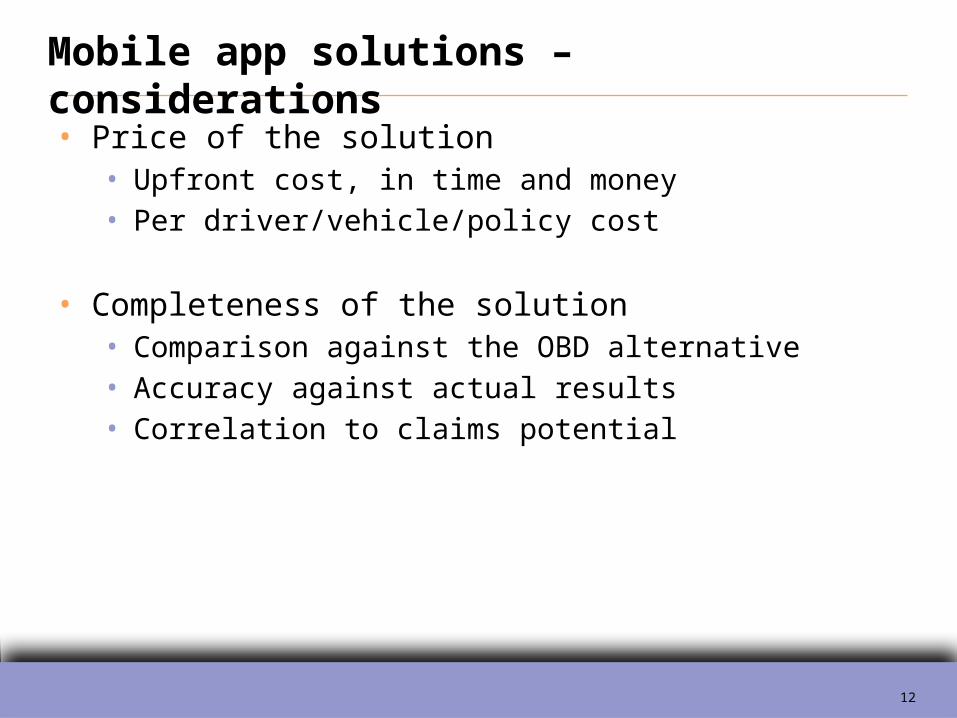
• Price of the solution• Upfront cost, in time and money• Per driver/vehicle/policy cost
• Completeness of the solution• Comparison against the OBD alternative• Accuracy against actual results• Correlation to claims potential
Mobile app solutions – considerations
13
Into the Wild –A New Frontier for the Technical
Actuary
14
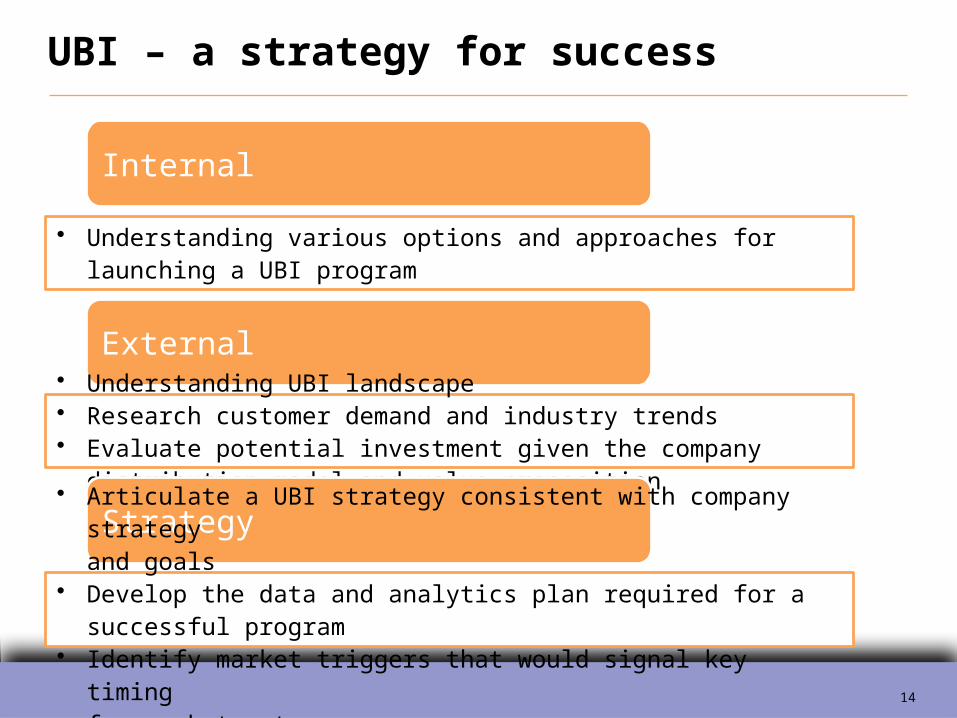
Internal
• Understanding various options and approaches for launching a UBI program
External• Understanding UBI landscape• Research customer demand and industry trends• Evaluate potential investment given the company distribution model
and value proposition
Strategy• Articulate a UBI strategy consistent with company strategy
and goals• Develop the data and analytics plan required for a
successful program• Identify market triggers that would signal key timing
for market entry
UBI – a strategy for success
15
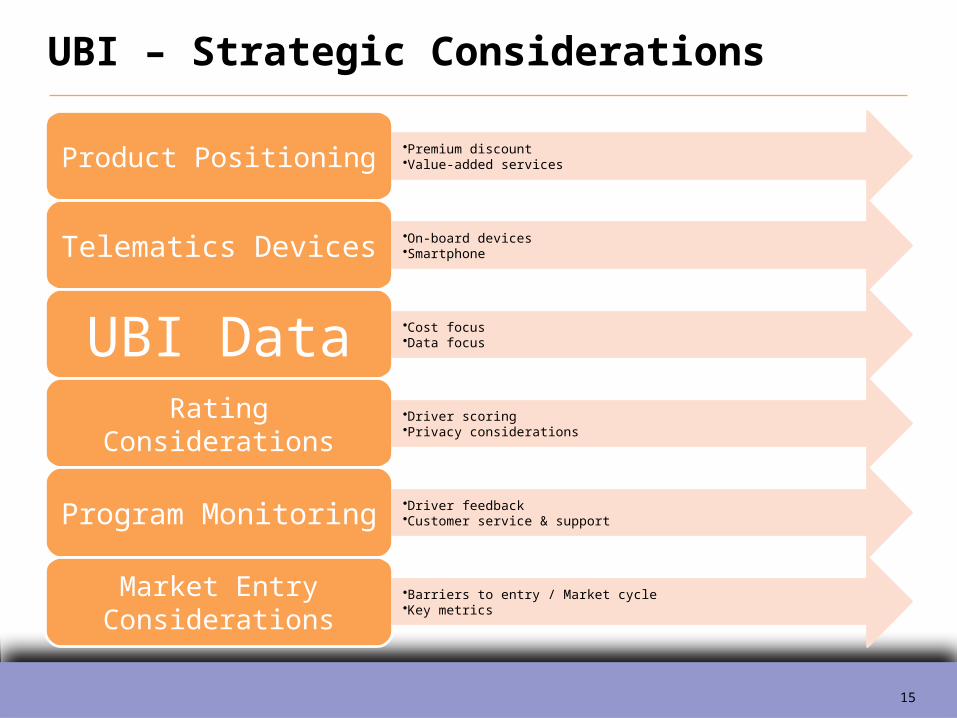
Product Positioning •Premium discount•Value-added services
Telematics Devices •On-board devices•Smartphone
UBI Data •Cost focus•Data focus
Rating Considerations •Driver scoring•Privacy considerations
Program Monitoring •Driver feedback•Customer service & support
Market Entry Considerations
•Barriers to entry / Market cycle•Key metrics
UBI – Strategic Considerations
16
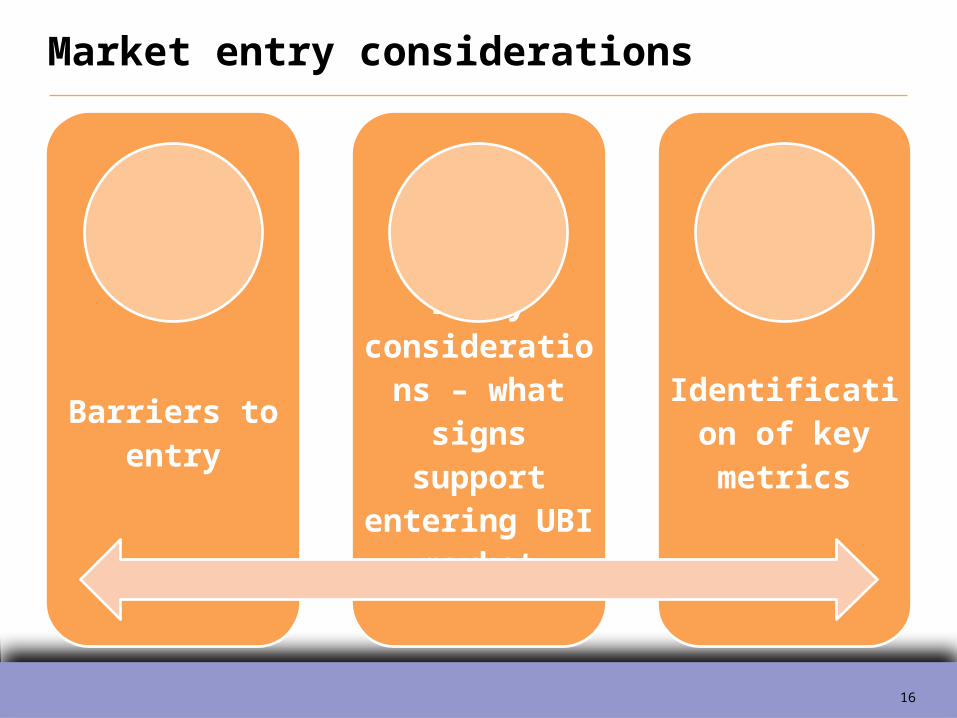
Barriers to entry
Entry considerations – what signs
support entering UBI
market
Identification of key metrics
Market entry considerations
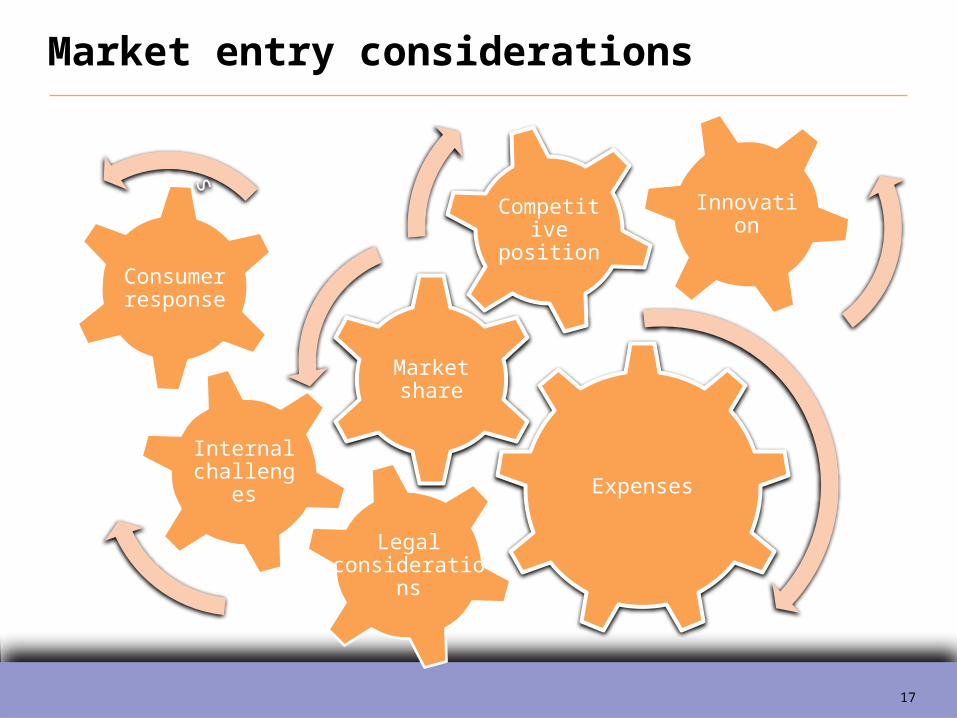
17
Market entry considerations
Expenses
Market share
Competitive position
Innovation
Legal considerations
Internal challenges
Consumer response
s
Customer Response to Usage Based InsuranceAn Analysis of Social Media Sentiments
September 2014
19
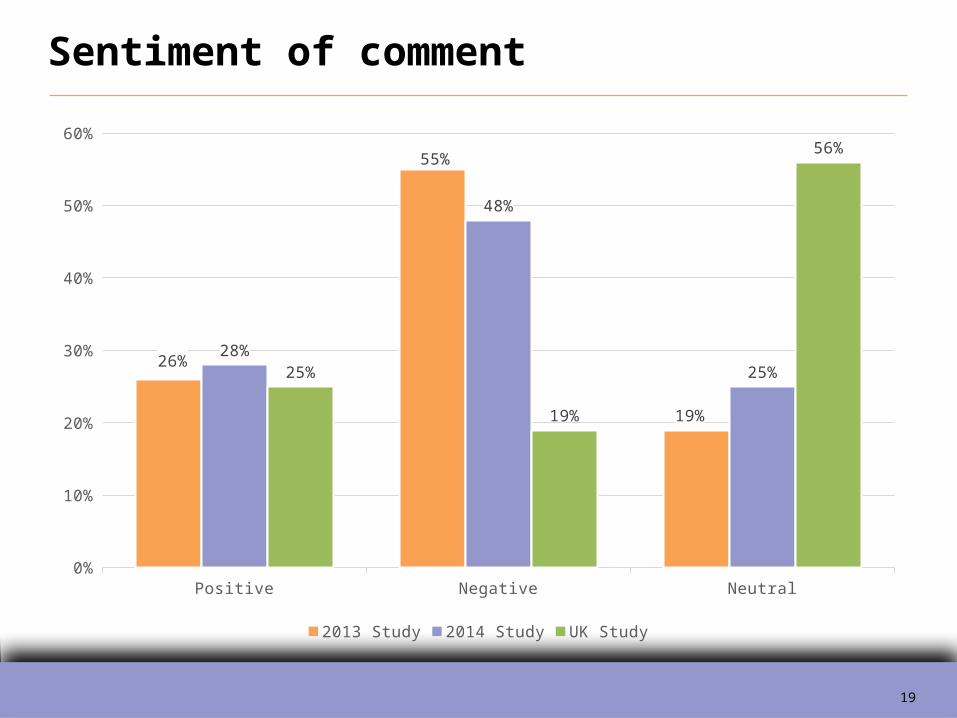
Positive Negative Neutral0%
10%
20%
30%
40%
50%
60%
26%
55%
19%
28%
48%
25%25%
19%
56%
2013 Study 2014 Study UK Study
Sentiment of comment
20
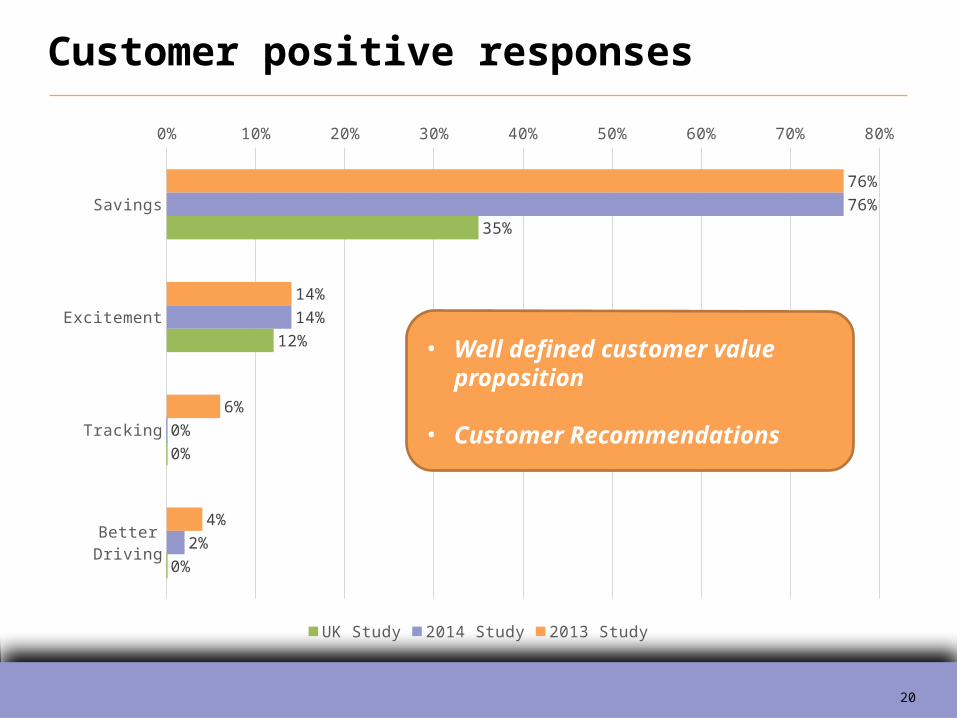
Savings
Excitement
Tracking
Better Driving
0% 10% 20% 30% 40% 50% 60% 70% 80%
76%
14%
6%
4%
76%
14%
0%
2%
35%
12%
0%
0%
UK Study 2014 Study 2013 Study
Customer positive responses
• Well defined customer value proposition
• Customer Recommendations
21
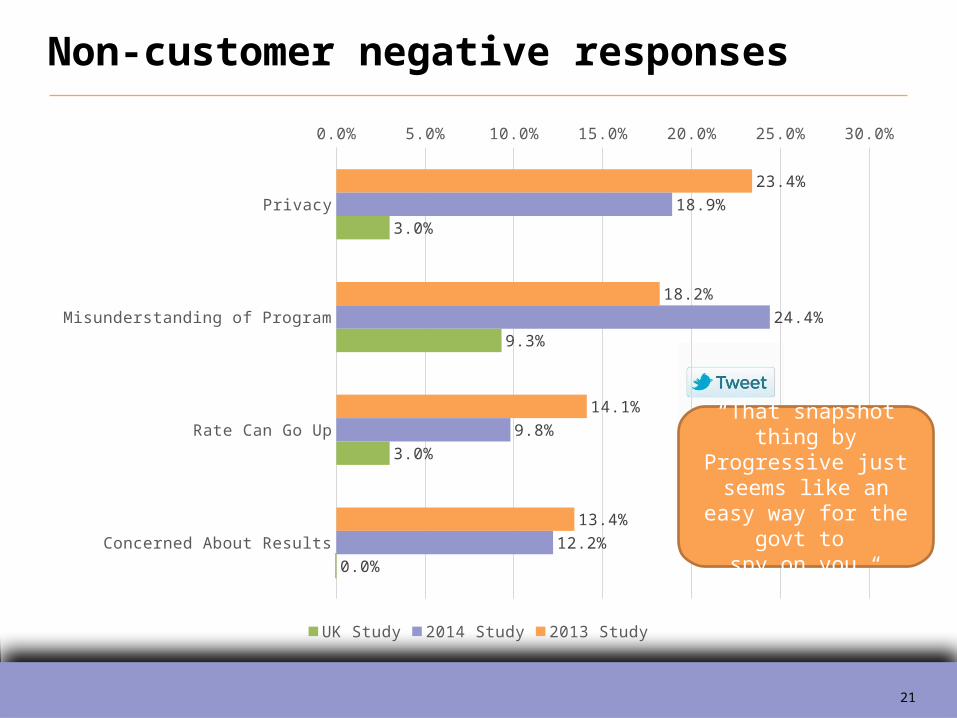
Privacy
Misunderstanding of Program
Rate Can Go Up
Concerned About Results
0.0% 5.0% 10.0% 15.0% 20.0% 25.0% 30.0%
23.4%
18.2%
14.1%
13.4%
18.9%
24.4%
9.8%
12.2%
3.0%
9.3%
3.0%
0.0%
UK Study 2014 Study 2013 Study
Non-customer negative responses
“That snapshot thing by Progressive just seems like an easy way for the govt to
spy on you.“
22
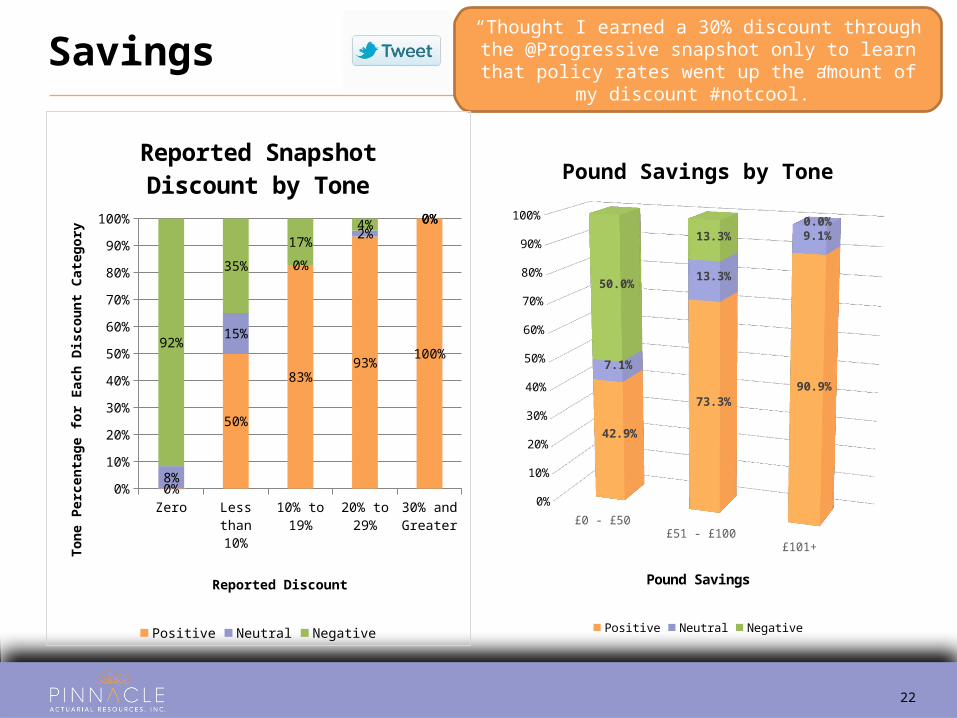
Savings
£0 - £50£51 - £100
£101+
0%
10%
20%
30%
40%
50%
60%
70%
80%
90%
100%
42.9%
73.3%90.9%
7.1%
13.3%
9.1%
50.0%
13.3%0.0%
Pound Savings by Tone
Positive Neutral Negative
Pound Savings
“Thought I earned a 30% discount through the @Progressive snapshot only to learn that policy rates
went up the amount of my discount #notcool.”
Zero Less than 10%
10% to 19%
20% to 29%
30% and Greater
0%
10%
20%
30%
40%
50%
60%
70%
80%
90%
100%
0%
50%
83%93%
100%
8%
15%
0%
2%0%
92%
35%
17%
4% 0%
Reported Snapshot Discount by Tone
Positive Neutral Negative
Reported Discount
To
ne
Per
cen
tag
e fo
r E
ach
Dis
cou
nt
Cat
ego
ry
Urban Traveler – UBI in the City
24
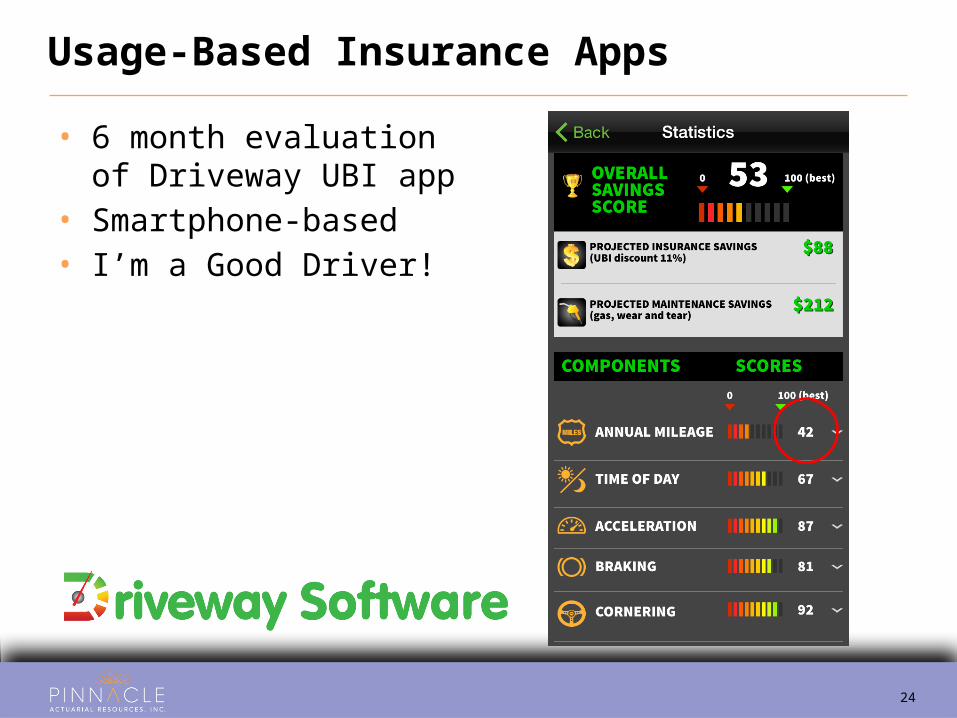
• 6 month evaluation of Driveway UBI app
• Smartphone-based• I’m a Good Driver!
Usage-Based Insurance Apps
25
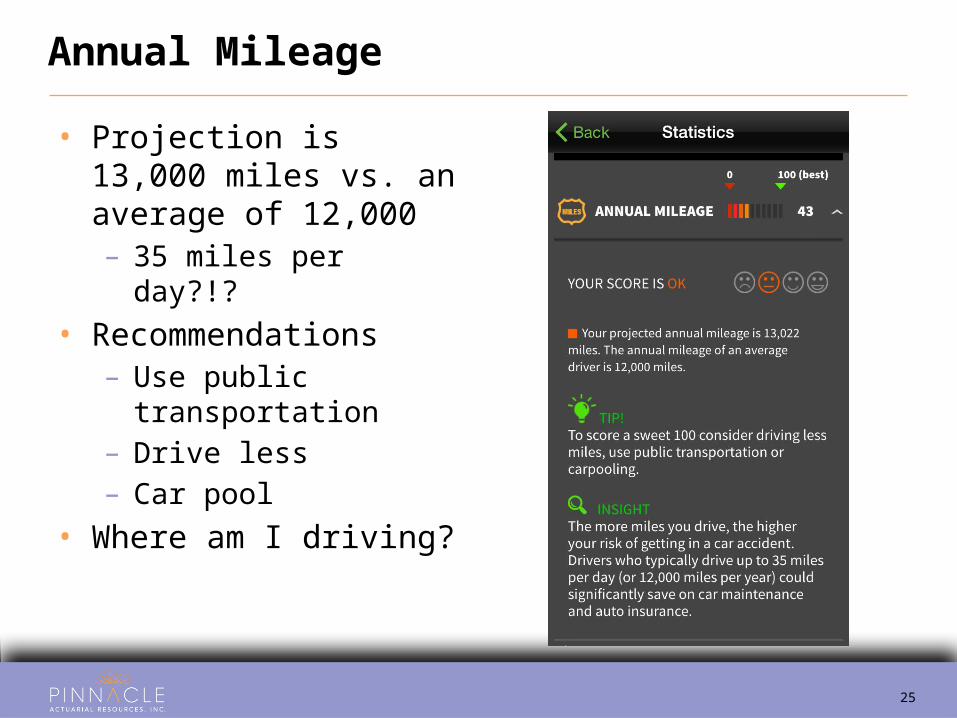
• Projection is 13,000 miles vs. an average of 12,000– 35 miles per day?!?
• Recommendations– Use public transportation– Drive less– Car pool
• Where am I driving?
Annual Mileage
26
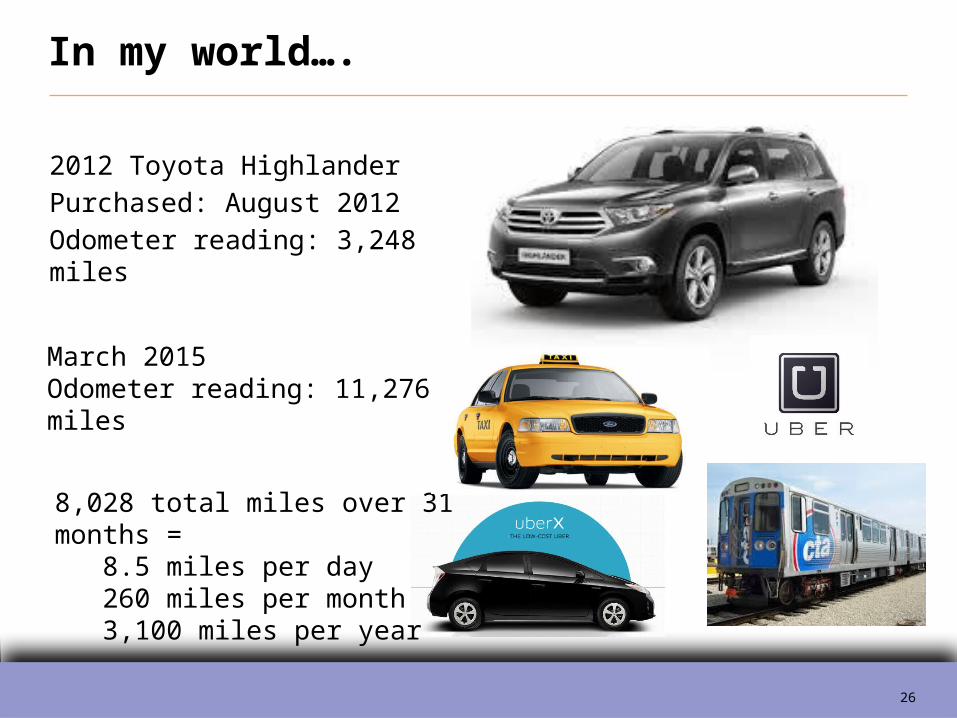
In my world….
2012 Toyota HighlanderPurchased: August 2012Odometer reading: 3,248 miles
March 2015Odometer reading: 11,276 miles
8,028 total miles over 31 months = 8.5 miles per day260 miles per month3,100 miles per year
27
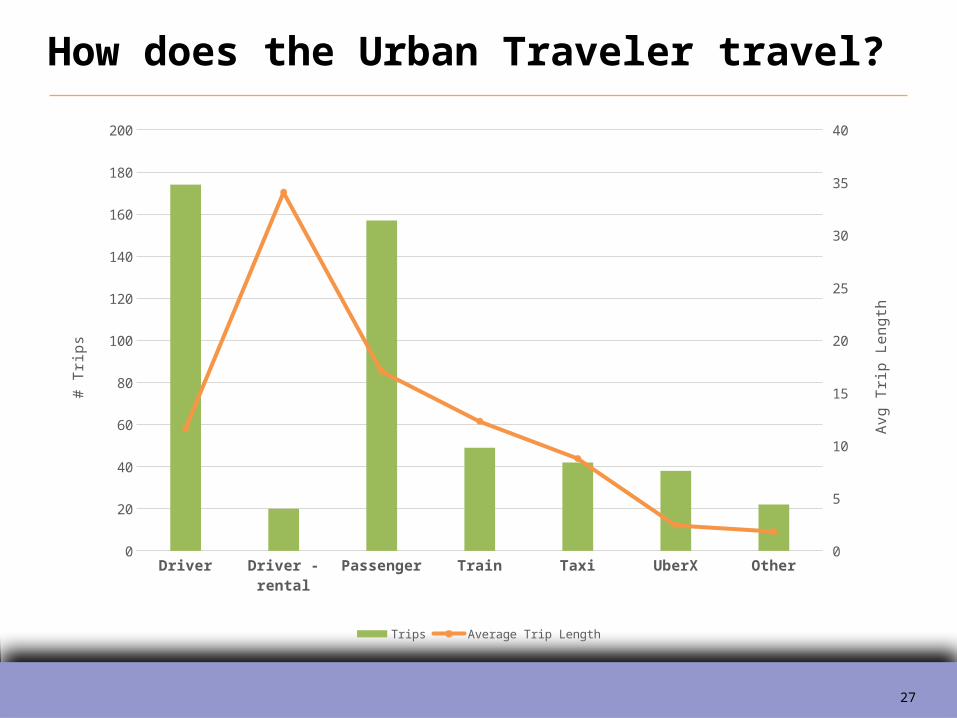
How does the Urban Traveler travel?
Driver Driver - rental
Passenger Train Taxi UberX Other0
20
40
60
80
100
120
140
160
180
200
0
5
10
15
20
25
30
35
40
Trips Average Trip Length
# T
rips
Avg
Trip
Len
gth
28
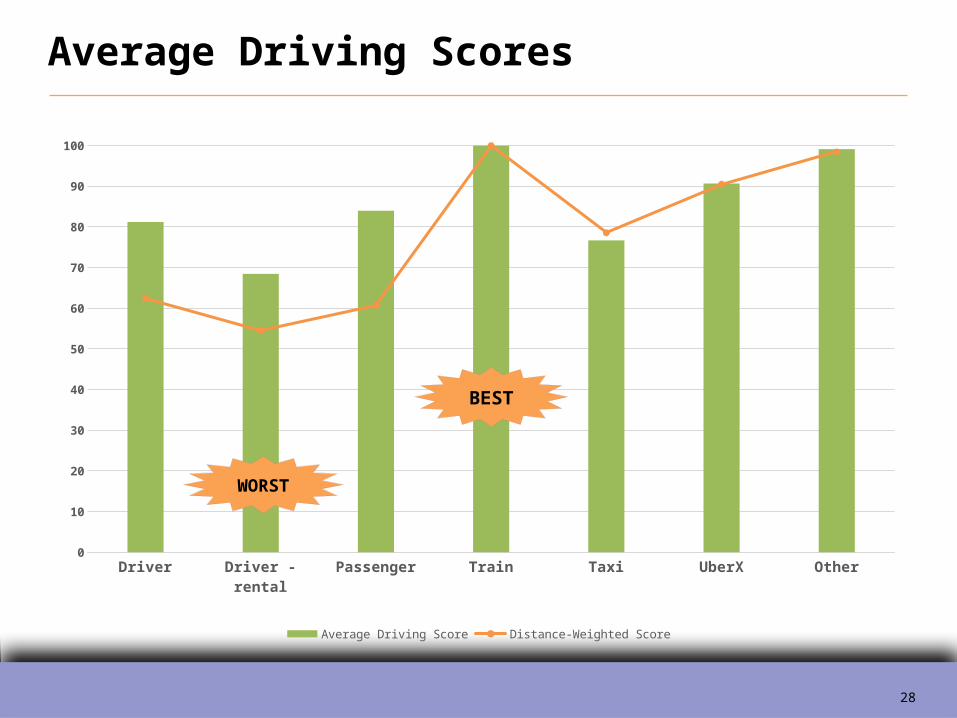
Average Driving Scores
Driver Driver - rental Passenger Train Taxi UberX Other0
10
20
30
40
50
60
70
80
90
100
Average Driving Score Distance-Weighted Score
BEST
WORST
29
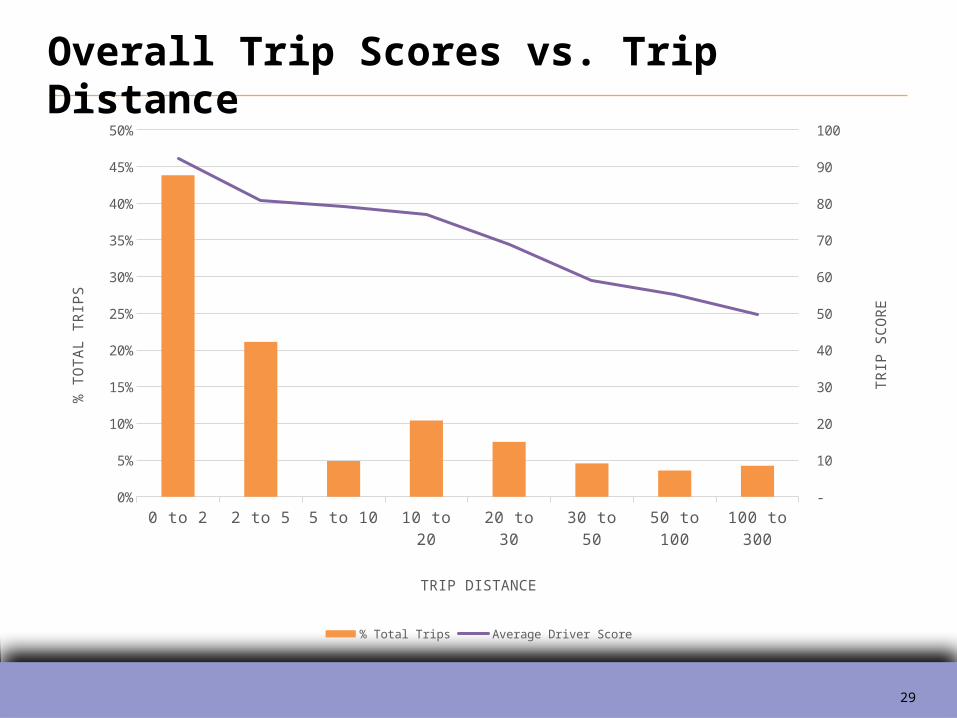
Overall Trip Scores vs. Trip Distance
0 to 2 2 to 5 5 to 10 10 to 20 20 to 30 30 to 50 50 to 100 100 to 3000%
5%
10%
15%
20%
25%
30%
35%
40%
45%
50%
-
10
20
30
40
50
60
70
80
90
100
% Total Trips Average Driver Score
TRIP DISTANCE
% T
OT
AL
TR
IPS
TR
IP S
CO
RE
30
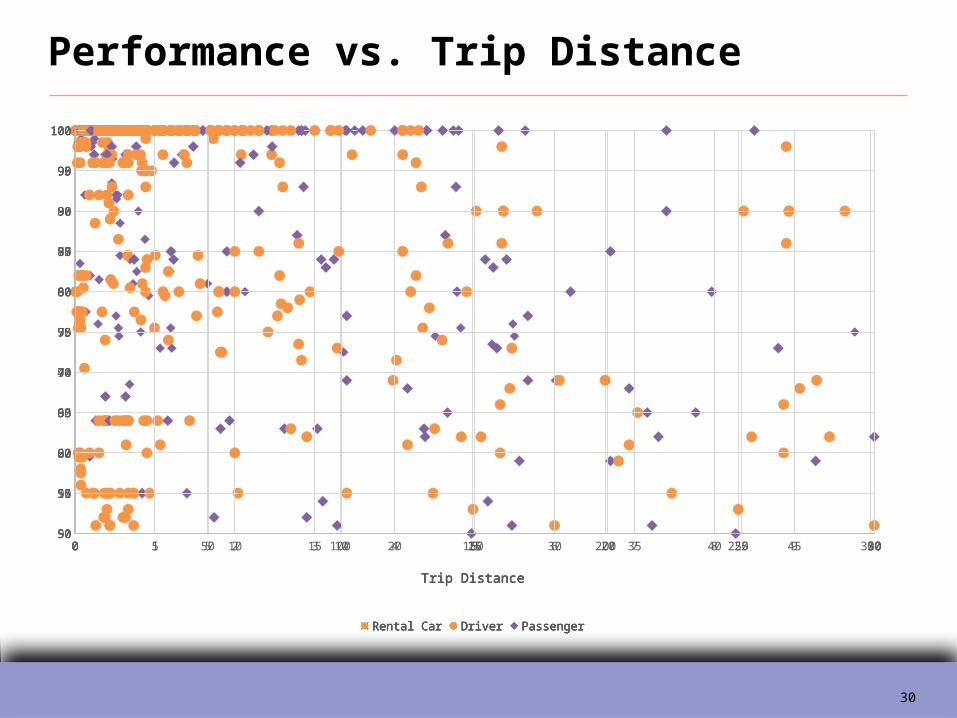
0 50 100 150 200 250 3000
10
20
30
40
50
60
70
80
90
100
Rental Car Driver Passenger
Trip Distance
Performance vs. Trip Distance
0 5 10 15 20 25 30 35 40 45 5050
55
60
65
70
75
80
85
90
95
100
Rental Car Driver Passenger
Trip Distance
0 5 10 15 20 25 3050
55
60
65
70
75
80
85
90
95
100
Rental Car Driver Passenger
Trip Distance
0 1 2 3 4 5 6 7 8 9 1090
91
92
93
94
95
96
97
98
99
100
Rental Car Driver Passenger
Trip Distance
31
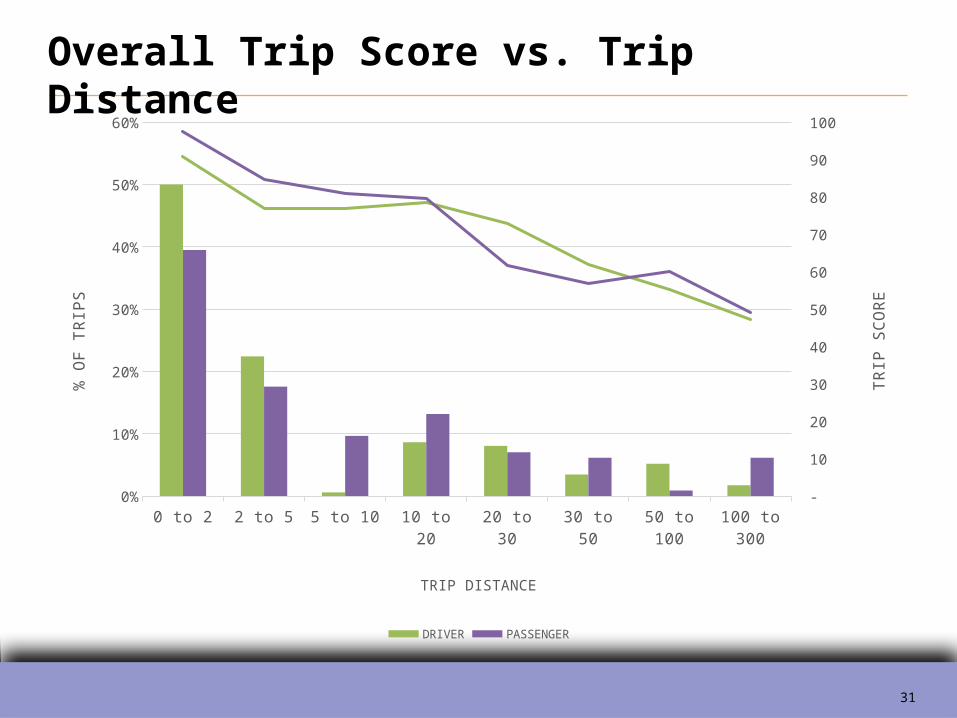
Overall Trip Score vs. Trip Distance
0 to 2 2 to 5 5 to 10 10 to 20 20 to 30 30 to 50 50 to 100 100 to 3000%
10%
20%
30%
40%
50%
60%
-
10
20
30
40
50
60
70
80
90
100
DRIVER PASSENGER
TRIP DISTANCE
% O
F T
RIP
S
TR
IP S
CO
RE
32
Mobile app solution has become a strong contender
Existing programs continue to expand into new states
Successful UBI Implementation requires alignment with company value propositions
Positive progress has been made in customer awareness
UBI lessons learned will come both domestically & abroad
Consumer experience is imperative
Conclusions

33
Thank you for your time and attention
Katey Walker, FCAS, MAAA, [email protected]
630-457-1298
309-807-2331
Gary Wang, FCAS, MAAA
Check us out: http://www.pinnacleactuaries.com Resource Knowledge CenterBlog