Embed Size (px)
Citation preview

| M
AR
INE
FR
ON
TIE
R @
UniK
L
2 MIMET Technical Bulletin Volume 2 (1) 2011
EDITORIALEDITORIAL
CHIEF EDITOR
Prof. Dato’ Dr. Mohd Mansor Salleh
EXECUTIVE EDITOR
Dr. Mohd Yuzri Mohd Yusop
COORDINATING EDITOR
Pn. Nurshahnawal Yaacob
EDITOR
En. Aminuddin Md Arof
En. Atroulnizam Abu
En. Ahmad Azmeer Roslee
En. Iwan Zamil Mustaffa Kamal
En. Hamdan Nuruddin
En. Aziz Abdullah
Pn. Nik Harnida Suhainai
EDITORIAL MEMBERS
En. Kamarul Nasser Mokri
Pn. Marhaini Jamaluddin
En. Rohaizad Hafidz Rozali
UniKL MIMET Dataran Industri Teknologi Kejuruteraan Marin
Bandar Teknologi Maritim, Jalan Pantai Remis, 32200 Lumut, Perak Darul
Ridzuan
+(605)- 6909000(Phone)
+(605)-6909091(Fax)
http://www.mimet.edu.my
R&D ACTIVITIESR&D ACTIVITIES Page 94‐96
SEMINAR ON WPC TECHNOLOGY
2ND BRAINSTORMING SESSION
FIELD EMISSION SCANNING ELECTRON MICROSCOPY (FESEM) AND ENERGY DISPERSIVE X‐RAY SPECTROMETER (EDS) SEMINAR
l CHIEF’S EDITOR MESSAGE l Page 3
Feature 1 l FISHES DETECTION INSIDE FISH LADDER USING SIMPLE BACKGROUND SUBTRACTION l
Page 4‐10
Feature 2 l MARINE CORROSION AND PROTECTION l Page 11‐15
Feature 3 l EFFECTS OF WEAVING PATTERNS
TOWARDS DIFFERENT WELDED JOINTS l Page 16‐20
Feature 4 l ANALYSIS ON FIRST LANGUAGE (L1) INTERFERENCE IN LEARNING SECOND LANGUAGE (L2)
WORDS WITH MULTIPLE MEANINGS l Page 21‐28
Feature 5 l EXPLORATION OF OFFSHORE FISHING BY INTERGRATED OFFSHORE FISHING VESSEL
CONCEPT (IOFVC) IN MALAYSIA l Page 29‐39
Feature 6 l TREND ANALYSIS OF SEA LEVEL RISE FOR WEST COAST OF PENINSULAR MALAYSIA
(PULAU PINANG) l Page 40‐48
Feature 7 l THE INFLUENCE OF MARPOL CONVENTION
ON LLOYD'S REGISTER RULES AND REGULATIONS l Page 49‐54
Feature 8 l A BRIEF REVIEW OF MODULAR
CONSTRUCTION METHOD IN THE
SHIPBUILDING INDUSTRY l
Page 55‐61
Feature 9 l DEVELOPMENT OF LEGAL FRAMEWORK GOVERNING THE CARRIAGE OF LIQUIFIED NATURAL GAS
(LNG) WITHIN COASTAL WATER FROM
CARRIER ASPECT (DESIGN SPECIFICATION) l
Page 62‐69
Feature 10| WAKE ADAPTED PROPELLER DESIGN
BASED ON LIFTING LINE AND LIFTING SURFACE THEORY l Page 70‐84
Feature 11|SEVEN WAYS TO MASTERING A COURSE l Page 85‐93
| M
AR
INE
FR
ON
TIE
R @
UniK
L
3 MIMET Technical Bulletin Volume 2 (1) 2011
Publish or Perish
Academics in Universities are expected to accomplish three things as part of their responsibilities.
They have to teach to impart knowledge to their students. They must do research in order to increase the
reservoir of knowledge and lastly they have to share their knowledge through service and doing consultancy
work for companies and society.
Research carried out should, as far as possible, be
relevant and useful to society. The days of
“research for research’s sake” are over. As such,
research results must be published to disseminate
new findings, to elucidate problems and complexi‐
ties. These research findings must be written in
simple explanation such that fruitful discussions
can be exchanged amongst researchers by way of
writings. Conferences are held to discuss these
results and to come to consensus and conclusions.
For research Universities, the statement “Publish
or Perish” is bandied about by the academics
themselves. For promotional purposes, especially
to the senior levels of academe i.e. the professor
and associate professor level, publications in re‐
puted and refereed journals is a must. If not, the
lecturer will remain a lecturer forever. At most,
he/she may be promoted to senior lecturer.
For us at UniKL‐MIMET, we are nurturing our
younger brethren to publish in our own “Marine
Frontier”. We hope this is the beginning of more
quality publications later on for our academic
staff. Use “ Marine Frontier” to hone our skills at
writing good presentations of our research and
consultancy work for the benefit of all.
Obviously, our first efforts may not be the best.
Hence, do not be discouraged or upset if the
referees or editors comment on your writings.
They do it with good intentions and to ensure
your presentations are understandable, precise
and succinct. Keep on at it and you are sure to
succeed and produce quality writings later on.
Happy writing!!!
Chief Editor.
| M
AR
INE
FR
ON
TIE
R @
UniK
L
4 MIMET Technical Bulletin Volume 2 (1) 2011
Feature Article 1 Feature Article 1
FISHES DETECTION INSIDE FISH LADDER USING SIMPLE BACKGROUND SUBTRACTION
ATZROULNIZAM ABU*
Department of Marine Electrical & Electronic Technology
Malaysian Institute of Marine Engineering Technology, Universiti Kuala Lumpur
Received: 13 Dec 2010; Revised: 29 Dec 2010 ; Accepted: 29 Dec 2010
ABSTRACT Automatic detection of moving objects is the fundamental tasks of many video‐based surveillance and monitoring sys‐tems. Motion detection provides the basis for detection of increased activity, detection of objects left behind, tracking of optical flow against established motion patterns, and other similar surveillance requirements. There are many challenges in developing a good background subtraction algorithm. First, it must be robust against changes in illumination. Second, it should avoid detecting non‐stationary underwater background objects such as underwater ray or light noise, underwa‐ter dust etc. This paper compared various background subtraction algorithms for detecting fishes inside fish ladder. De‐tection of moving objects in grayscale videos is based on changing texture in parts of the field of view. This report pro‐posed the method to create a background model in underwater non‐stationary scenes. For each component several dif‐ferent algorithms were first evaluated. For background subtraction, simple Frame Difference technique was evaluated. Simple technique often produces inferior performance but the result is still acceptable, while complicated techniques often produce superior performance but the process itself will take some time because of the computational complexity. The experiments showed that simple techniques such as background subtraction can produce good results with much lower computational complexity Keyword: fish detection, motion detection, Background Subtraction, Approximate Median filter, Mixture of Gaussian.
Corresponding Author: [email protected]
INTRODUCTION
Background modelling and subtraction are widely used nowadays in many vision systems. The main idea of this module is to automatically generate the background that is then used to classify any new ob‐servation as background or foreground. A common approach in background subtraction is to identify the moving objects, where each video frame is compared against a reference or background model. Pixels in the current frame that deviate significantly from the background are considered to be moving objects. These foreground pixels are further processed for object localization and tracking. Since background subtraction is often the first step in many computer vision applications, it is important that the extracted foreground pixels accurately correspond to the mov‐ing objects of interest. Even though many back‐ground subtraction algorithms have been proposed
in the literature, the problem of identifying moving objects in complex environment is still far from being completely solved. The main concern is how to effectively detect of the interested moving targets exist in the underwater monitoring system. Underwater environment is very complicated. There are a mass of inorganic material and various organic substances which are in different sizes, shapes, and performances. We must extract the interesting targets from complex background. Researchers have proposed many methods, for ex‐ample M estimation, character matching method and main motion estimation based on light flow. How‐ever, these methods have some shortcomings: com‐plicated transform, large computation, ineffectively extracting moving targets from complex background. We analyze in detail characteristics of underwater images and select an appropriate threshold level to
| M
AR
INE
FR
ON
TIE
R @
UniK
L
5 MIMET Technical Bulletin Volume 2 (1) 2011
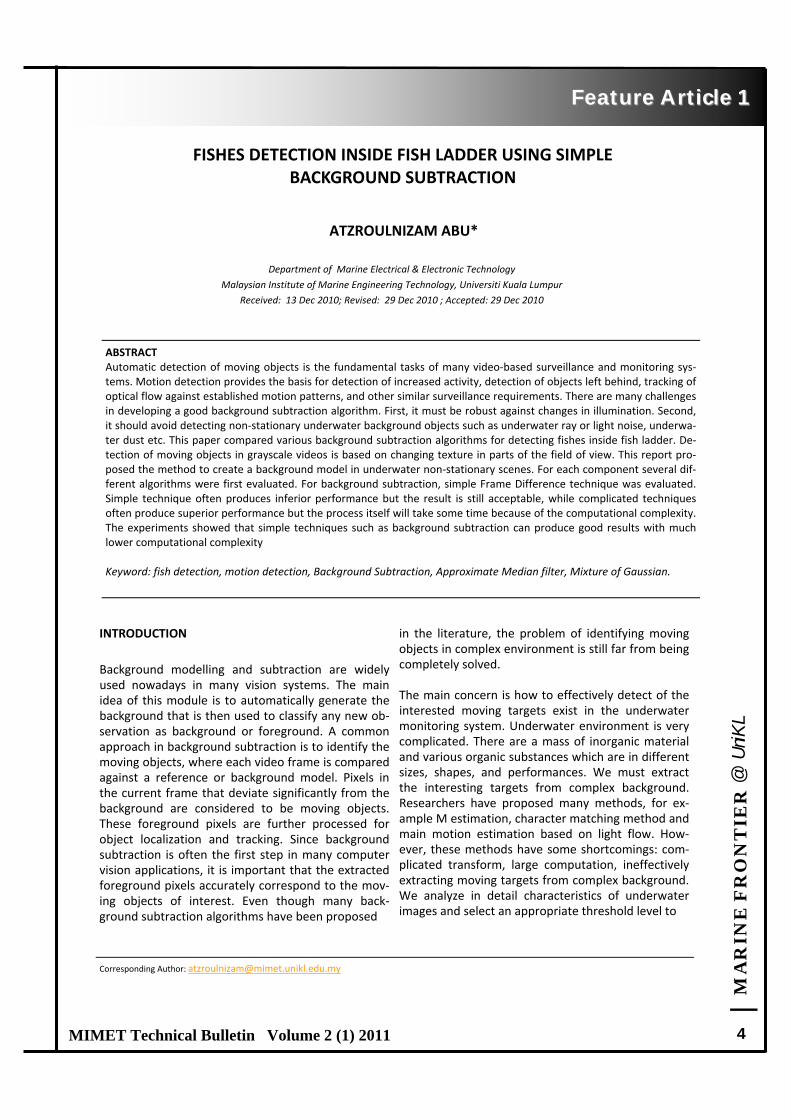
binaries the difference image of image sequence. Then, the segmentation of every part of the binary image changes into a single object in one image by using image segmentation algorithm.
We can see that the images are covered with a layer of green color and fog because of light noise introduced by scattering of complex composition of water. Scattering has declined image contrast greatly. Medium of objective space causes so great difference on image illumination between on‐axial and extra axial point that brightness of background is very different. In figure 1(a) part of the image is brighter than 1(b) since installment error of the underwater camera. Image background is so complicate that if we only process a single image and detect effec‐tively moving targets from it, the corresponding algo‐rithm will be too complicated, large computation and bad real‐time function. Image background is little differ‐ent between two continual frames in image sequence.
If we can wipe off resemble background to large extent, restrain noise and stand out targets the precision and efficiency to detect targets can meet the real‐time re‐quirement of monitoring system.
FISH DETECTION BASED ON BACKGROUND DIFFERENCE
The fish detection system requires several steps in order to detect the fishes. While at implementation level some of these steps can be merged, for clarity the different components are shown separately. The complete over‐view starting from the raw image feed from the digital camera ending with a segmented image and fish bounda‐ries is shown in Figure 2.
This system is proposed in which to detect the fishes in‐side the water ladder. Hence, from this project, it is ex‐pected that the system should be able to detect the fishes using background subtraction algorithm.
Fig. 1 : Two continual frames of images of underwater scene at sometime
(a) (b)
Fig. 2: Fish detection system algorithm
| M
AR
INE
FR
ON
TIE
R @
UniK
L
6 MIMET Technical Bulletin Volume 2 (1) 2011
INPUT IMAGE
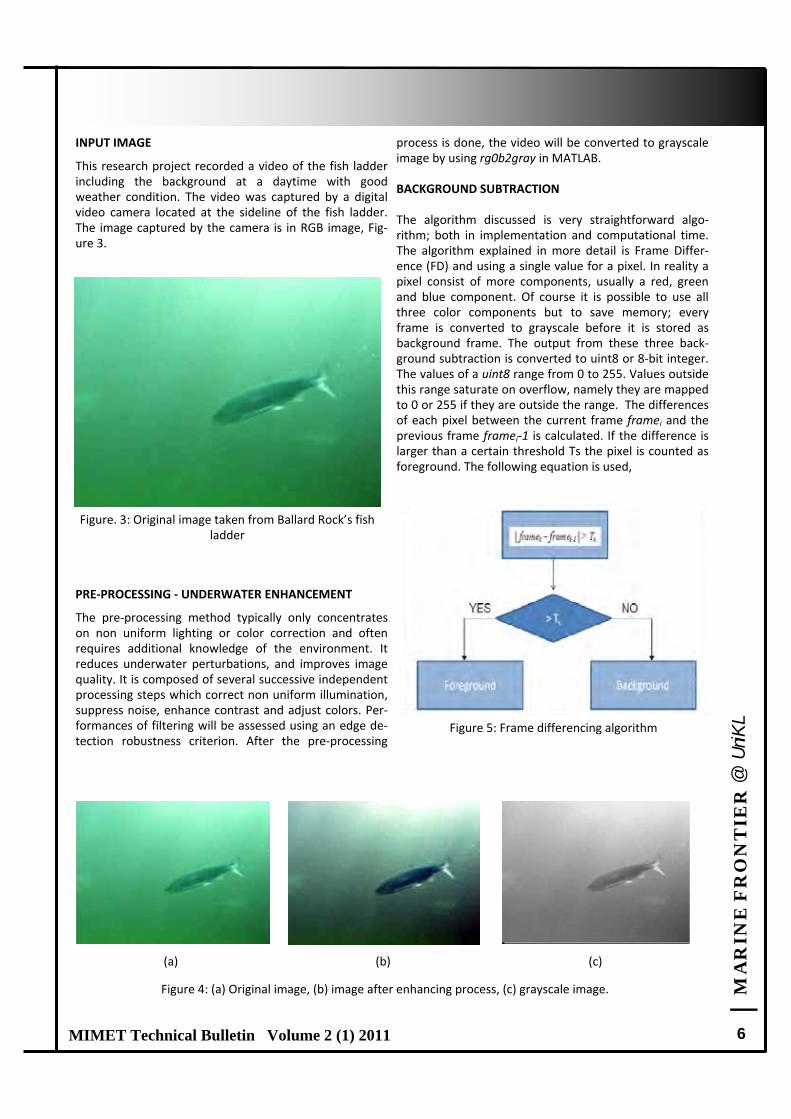
This research project recorded a video of the fish ladder including the background at a daytime with good weather condition. The video was captured by a digital video camera located at the sideline of the fish ladder. The image captured by the camera is in RGB image, Fig‐ure 3.
PRE‐PROCESSING ‐ UNDERWATER ENHANCEMENT
The pre‐processing method typically only concentrates on non uniform lighting or color correction and often requires additional knowledge of the environment. It reduces underwater perturbations, and improves image quality. It is composed of several successive independent processing steps which correct non uniform illumination, suppress noise, enhance contrast and adjust colors. Per‐formances of filtering will be assessed using an edge de‐tection robustness criterion. After the pre‐processing
process is done, the video will be converted to grayscale image by using rg0b2gray in MATLAB. BACKGROUND SUBTRACTION The algorithm discussed is very straightforward algo‐rithm; both in implementation and computational time. The algorithm explained in more detail is Frame Differ‐ence (FD) and using a single value for a pixel. In reality a pixel consist of more components, usually a red, green and blue component. Of course it is possible to use all three color components but to save memory; every frame is converted to grayscale before it is stored as background frame. The output from these three back‐ground subtraction is converted to uint8 or 8‐bit integer. The values of a uint8 range from 0 to 255. Values outside this range saturate on overflow, namely they are mapped to 0 or 255 if they are outside the range. The differences of each pixel between the current frame framei and the previous frame framei‐1 is calculated. If the difference is larger than a certain threshold Ts the pixel is counted as foreground. The following equation is used,
Figure. 3: Original image taken from Ballard Rock’s fish ladder
(a) (b) (c)
Figure 4: (a) Original image, (b) image after enhancing process, (c) grayscale image.
Figure 5: Frame differencing algorithm
| M
AR
INE
FR
ON
TIE
R @
UniK
L
7 MIMET Technical Bulletin Volume 2 (1) 2011
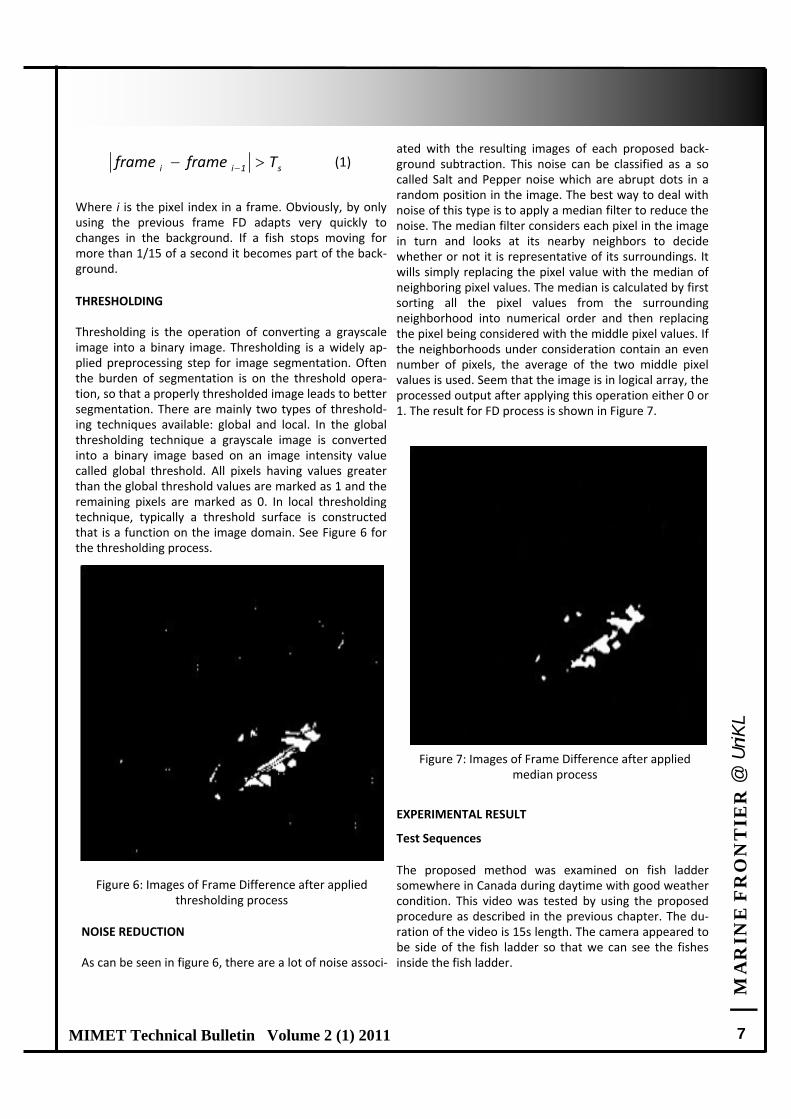
Figure 6: Images of Frame Difference after applied thresholding process
Where i is the pixel index in a frame. Obviously, by only using the previous frame FD adapts very quickly to changes in the background. If a fish stops moving for more than 1/15 of a second it becomes part of the back‐ground. THRESHOLDING Thresholding is the operation of converting a grayscale image into a binary image. Thresholding is a widely ap‐plied preprocessing step for image segmentation. Often the burden of segmentation is on the threshold opera‐tion, so that a properly thresholded image leads to better segmentation. There are mainly two types of threshold‐ing techniques available: global and local. In the global thresholding technique a grayscale image is converted into a binary image based on an image intensity value called global threshold. All pixels having values greater than the global threshold values are marked as 1 and the remaining pixels are marked as 0. In local thresholding technique, typically a threshold surface is constructed that is a function on the image domain. See Figure 6 for the thresholding process.
NOISE REDUCTION As can be seen in figure 6, there are a lot of noise associ‐
ated with the resulting images of each proposed back‐ground subtraction. This noise can be classified as a so called Salt and Pepper noise which are abrupt dots in a random position in the image. The best way to deal with noise of this type is to apply a median filter to reduce the noise. The median filter considers each pixel in the image in turn and looks at its nearby neighbors to decide whether or not it is representative of its surroundings. It wills simply replacing the pixel value with the median of neighboring pixel values. The median is calculated by first sorting all the pixel values from the surrounding neighborhood into numerical order and then replacing the pixel being considered with the middle pixel values. If the neighborhoods under consideration contain an even number of pixels, the average of the two middle pixel values is used. Seem that the image is in logical array, the processed output after applying this operation either 0 or 1. The result for FD process is shown in Figure 7.
EXPERIMENTAL RESULT
Test Sequences The proposed method was examined on fish ladder somewhere in Canada during daytime with good weather condition. This video was tested by using the proposed procedure as described in the previous chapter. The du‐ration of the video is 15s length. The camera appeared to be side of the fish ladder so that we can see the fishes inside the fish ladder.
s1ii Tframeframe (1)
Figure 7: Images of Frame Difference after applied median process
| M
AR
INE
FR
ON
TIE
R @
UniK
L
8 MIMET Technical Bulletin Volume 2 (1) 2011
(a)
(b)
(c)
(d)
(e)
(f)
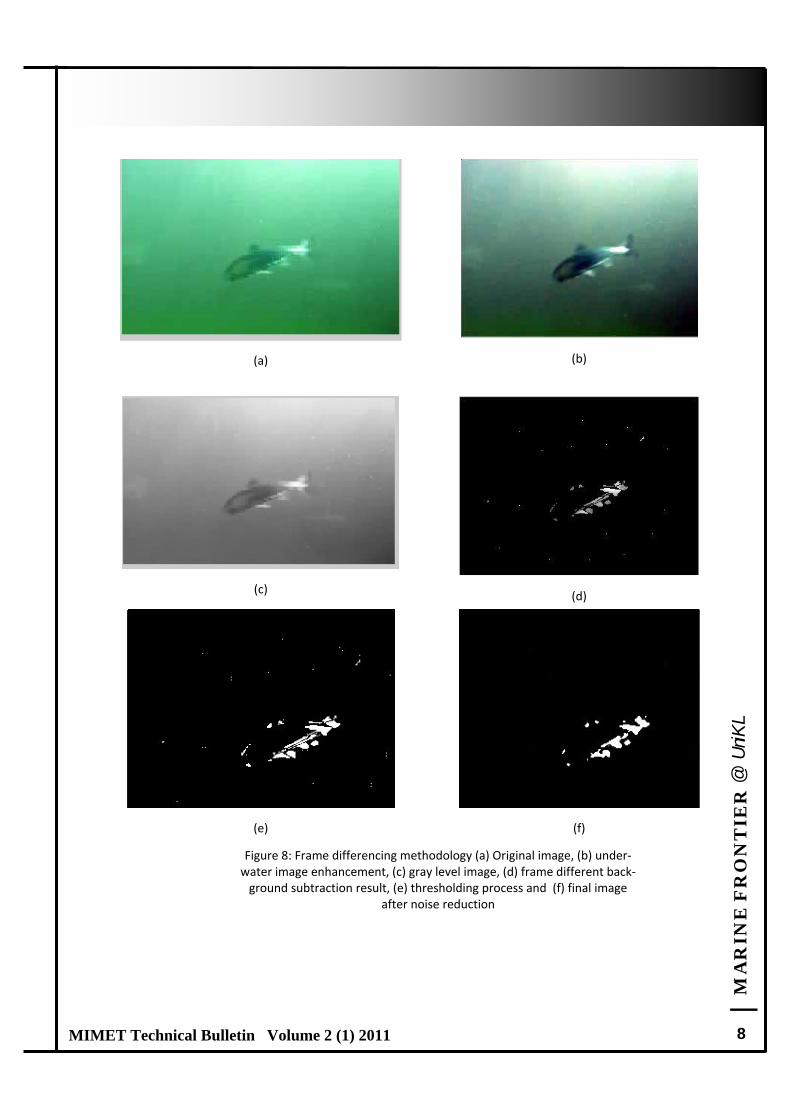
Figure 8: Frame differencing methodology (a) Original image, (b) under‐water image enhancement, (c) gray level image, (d) frame different back‐ground subtraction result, (e) thresholding process and (f) final image
after noise reduction
| M
AR
INE
FR
ON
TIE
R @
UniK
L
9 MIMET Technical Bulletin Volume 2 (1) 2011
(a)
(b)
(c)
(d)
(e)
(f)
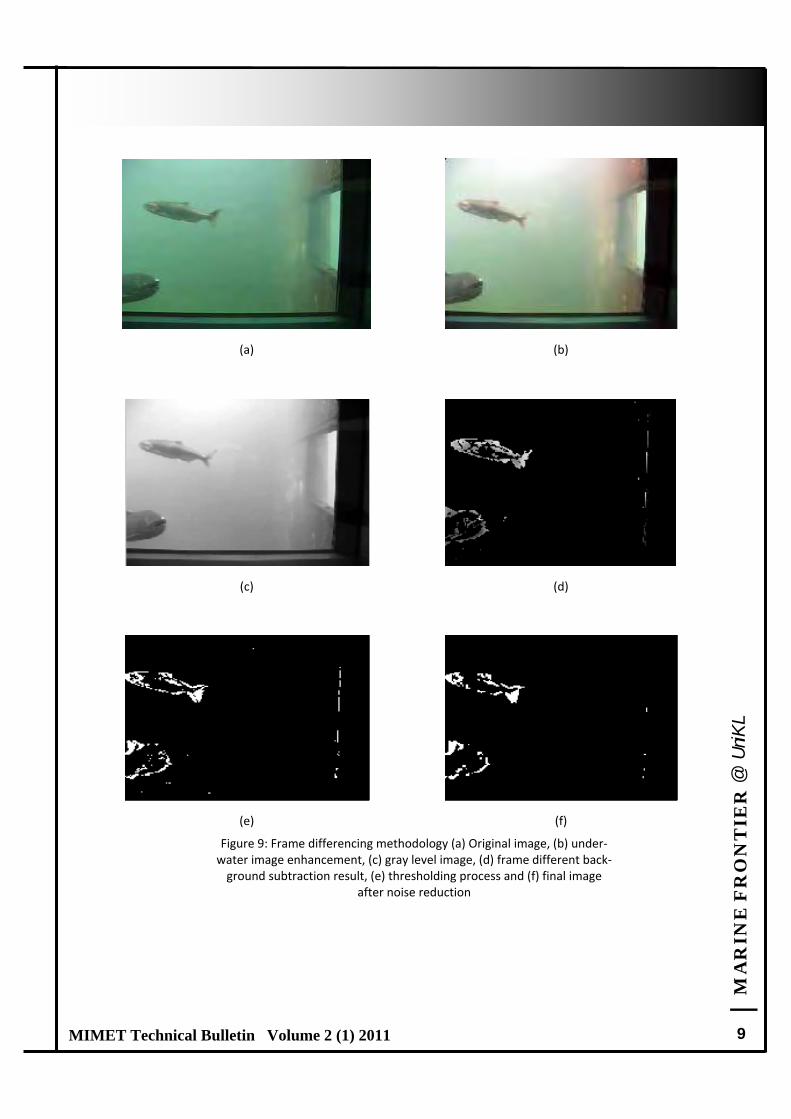
Figure 9: Frame differencing methodology (a) Original image, (b) under‐water image enhancement, (c) gray level image, (d) frame different back‐ground subtraction result, (e) thresholding process and (f) final image
after noise reduction
| M
AR
INE
FR
ON
TIE
R @
UniK
L
10 MIMET Technical Bulletin Volume 2 (1) 2011
EVALUATION AND DISCUSSION Based on the visual examination on the resulting fore‐ground masks, the following observations have been made regarding the background algorithms tested in this paper.
Automatic underwater enhancement is a parameter free algorithm which reduces underwater perturba‐tions and improves image quality. The algorithm composed several successive independent process‐ing steps which respectively correct non uniform illumination, suppress noise, enhance contrast and adjust color.
All background algorithms tested are sensitive to environmental noise. As we can see inside water the images are covered a layer of fog because of light noise introduced by scattering of complex composi‐tion of water.
The performance of the frame difference is very poor. Even though the fish is detected, the shape of the fish is still hard to recognize at the end of the process. Furthermore the system cannot detect the fishes that situated more depth inside the fish lad‐der.
Some of the experimental results of fish detection are shown in Figure 8. These images represent process of frame difference background subtraction from straight forward background subtraction to more complex algo‐rithm. It can be seen that the approach method generally worked good enough when detecting fishes but face some difficulties in detecting fishes. Figure 9 shows the results of other video of fishes inside fish ladder and same methodology has been applied. CONCLUSION An improved background subtraction based motion de‐tection method was proposed to detect the objects in the Computer Vision‐based fish behavior monitoring system. It fused the background difference and frame difference to update the background more correctly and completely with shorter time and the use the post‐processing method to segment the foreground objects from the frames. The improved algorithms are effective to detect fish in real‐time video sequence.
REFERENCES 1. Davide A.Migliore, Matteo Matteucci, Matteo Nac‐
cari; A revaluation of Frame Difference in Fast and Robust Motion Detection. VSSN06. 2006, 215‐218.
2. A J R Fairweather, M A Hodgetts, A R Greig, “Robust scene interpretation of underwater image se‐quences”, In 6th International Conference on Image Processing and its Applications, 1997, pp. 660 ‐664, ISBN: 0 85296 692 X
3. A. Mittal and D. Huttenlocher, Scene modeling for wide area surveillancd and imagesynthesis," in Pro‐ceedings IEEE conference on computer vision and pattern recognition, 2, pp.160{167, (Hilton Head Isand, SC), June 2000.
4. J. Kang, I. Cohen, and G. Medioni, Continuous track‐ing within and across camerastreams," in Proceed‐ings IEEE conference on computer vision and pattern recognition, 1, pp.267{272, (Madison, WI), June 2003.
5. Zawawi New Method of Underwater Enhancement, Master Research ULR Feb 2010
6. R. Cutler and L. Davis, View‐based detection," in Pro‐ceedings Fourteenth InternationalConference on Pattern Recognition, 1, pp. 495{500, (Brisbane, Aus‐tralia), Aug 1998.
7. S. Benton. Background subtraction, part 1: Matlab models. http://www.dspdesignline.com/210000460; Last accessed: October 04,2009.
8. C. Stau_er and W. Grimson, Learning patterns of activity using real‐time tracking," in IEEE Trans. on Pattern Analysis and Machine Intelligence, 22, pp. 747{57, Aug 2000.
9. P. KaewTraKulPong and R. Bowden, An improved adaptive background mixture model for real‐time tracking withshadow detection," in Proceedings of the 2nd European Workshop on Advanced Video‐Based Surveillance Systems, Sept. 2001.
10. M. Harville, A framework for high‐level feedback to adaptive, per‐pixel, mixture‐of‐Gaussian background models," in Proceedings of the Seventh European Conference onComputer Vision, Part III, pp. 543{60, (Copenhagen, Denmark), May 2002.
11. R. Cucchiara, M. Piccardi, and A. Prati, Detecting moving objects, ghosts, and shadowsin video streams," IEEE Transactions on Pattern Analysis and Machine Intelligence 25, pp. 1337{1342, Oct 2003.
12. Sen ching S. Cheung and Chandrika Kamath. Robust techniques for background subtraction in urban traf‐fic video. SPIE, 2004. doi: 10.1117/12.526886.
| M
AR
INE
FR
ON
TIE
R @
UniK
L
11 MIMET Technical Bulletin Volume 2 (1) 2011
Feature Article 2 Feature Article 2
MARINE CORROSION AND PROTECTION
AZIZ ABDULLAH*
Department of Marine Construction and Maintenance Technology Malaysian Institute of Marine Engineering Technology, Universiti Kuala Lumpur Received: 21 Jan 2011; Revised: 10 Feb 2011; Accepted: 10 Feb 2011
ABSTRACT Marine corrosion and protection in the marine environment is not just about choosing very durable paint coatings for application on corrosion prone materials, but rather the ability to synergize all the important elements to reduce corro‐sion to an acceptable and cost‐economic level. The selection of parent material and type of anti‐fouling coating therefore has to meet the requirements of both performance and cost. A most challenging factor in the marine environment is the protection of a ship’s hull that is submerged for prolonged periods and become prone to marine micro‐organism attacks. The area most severely affected is the boot topping zone that is intermittently exposed to both immersions and weather‐ing. Normally, underwater corrosion is suppressed through the use of a marine coating system that prevents electrolysis by excluding the electrolyte and oxygen that trigger corrosion. This capability of marine coating goes beyond the ordinary superstructure paint coating in term of adhesion, toughness, resistance to chemical, humidity and weather. In complying with IMO regulations it is required to protect the hull using non‐polluting and non‐toxic coating that protects ship hulls from marine fouling organisms and corrosion while keeping safe the non‐targeted marine environment organisms. This paper will seek to explore some recent developments in this field of underwater corrosion prevention and their perform‐ance in marine environment.
Keywords: Marine Corrosion, Bio‐Fouling, Corrosion Prevention, Anti‐Fouling Paints
Corresponding Author: [email protected]
INTRODUCTION A ship's underwater hull spends a large propor‐tion of its operational life submerged in water and is exposed to the harsh marine environ‐ment with high chloride content and high levels of humidity. Under these conditions corrosion is a common occurrence. Corrosion is a term used to describe the destruction of a metal that occurs through a chemical process when the metal reacts with the environment. This reac‐tion is an electrochemical oxidation process that usually produces rust or other metal oxides. A metal which corrodes rapidly is of little practical value as a structural material unless measures are taken to reduce the rate of corrosion. This is true for mild steel in a marine environment, but fortunately there are effective prevention measures that can help reduce the rate of cor‐rosion. Marine related corrosion can be divided into three broad categories;
a. Corrosion in sea water b. Corrosion in high humidity coastal
environments c. Microbiologically induced corrosion. Although mild steel is most commonly used for the construction of a ship’s hull it is not because of its resistance to marine corrosion. Its importance is more on its economic and physical strength perspective, easy availability and ease of fabrication.
Corrosion in sea water is normally associated with electrochemical reactions that can be illustrated by using two dissimilar metals, the anode (normally of zinc which is sometimes called the ‘sacrificial’ anode) and the cathode (normally the mild steel hull of a ship) that is submerged in seawater through which cur‐rent flows from the more reactive anode to the less reactive cathode, thereby corroding the zinc while protecting the steel from corro‐
| M
AR
INE
FR
ON
TIE
R @
UniK
L
12 MIMET Technical Bulletin Volume 2 (1) 2011
sion. The zinc, being less noble than steel in the gal‐vanic series, is eaten away while the cathode which is nobler in the galvanic series is always protected. However, the reaction may change depending on the type of metals used for the underwater hull and their hierarchy in the galvanic series. Electro chemi‐cal corrosion can be prevented by proper selection of materials and adequate cathodic protection. Thus, the correct choice of metals used for under‐water hull construction will determine whether the hull is amply protected from corrosion or otherwise. For corrosion that occurs in structures exposed to the high humidity such as in coastal marine environ‐ment, it is usually triggered by the following factors. a. Bimetallic contact (contact between two dis‐
similar metals) b. Break down of protective surface films c. Crevice corrosion When two different metals come in contact, the metal that is nobler will act as cathode and the other as anode and corrosion of anode then takes place. Underwater hull of ships are usually made up of different materials and this difference results in the corrosion of the material that is lower than the other in the galvanic series. While attack in the form of pitting would usually occur on protected surfaces when there is local breakdown of paint coating. When the paint coat‐ing is damaged a corrosion cell is established be‐tween the exposed cell metal which becomes the anode, and the surface mill scale (rust) that readily conducts electrons becomes the cathode. Although this exposed cell metal and the mill scale are of the same origin they continue to be affected due to their differing levels in the galvanic series. In fact, new steel, although of similar origin with old steel, will soon become anodic to this old steel. Similarly, brightly cut surfaces, such as pipe threads, are an‐odic to uncut surfaces. Therefore, corrosion not only affects two dissimilar metals in a humid marine environment but would also affect similar metals that have changed form. Corrosion that occurs in crevices usually results from two areas of the same metal being exposed to an electrolyte under conditions where different
oxygen concentration prevails. The area with a re‐duced level of oxygen becomes anodic and cor‐rodes. This situation is prevalent in crevices and corners where there is less oxygen, hence the most severe corrosion seems to occur in those positions. Microbiologically induced corrosion or bio‐corrosion occurs due to the accumulation of bio‐fouling or‐ganisms on the underwater hull of the ship. Organ‐isms may create corrosive products through their metabolism or decomposition that may damage the protective film of anti‐ corrosion products applied on the metal surfaces. Protective coatings or anti‐fouling paints are used to control their accumula‐tion, but they contain chemical substances which are toxic to those species which accumulate on the hull. These chemical substances remain toxic in sea water for a long time and may also kill non‐targeted marine species. LITERATURE REVIEW In gathering information on marine corrosion and its prevention further understanding was sought in not just knowing what corrosion is but how to con‐trol it. Controlling of corrosion is of paramount im‐portance to the maritime industry as a ship’s down‐time may affect the sustainability of a shipping busi‐ness that relies heavily on its ships’ availability that also would determine the business’s bottom line or profits. Knowledge in corrosion control would therefore require better understanding of materials selection, coatings, chemical inhibitors, cathodic and anodic protection (Bradford, 2001).As marine corrosion is important to both ship maintainers as well as ship owners who are concerned with their bottom line, it is imperative that basic concepts need to be mastered and understood by both par‐ties on how corrosion problems occur and how they can be prevented or controlled with modern tools before more serious problems can set in that may jeopardize operational availability of ships (Roberge, 2006). Galvanic corrosion affects the maritime industry in just about every field, thus information was sought on what to do when galvanic corrosion of common engineering materials occurs, especially in the ma‐rine environment. Further understanding on gal‐

| M
AR
INE
FR
ON
TIE
R @
UniK
L
13 MIMET Technical Bulletin Volume 2 (1) 2011
vanic corrosion was thus derived through a practical guide for engineers (Francis, 2000). More valuable insights on corrosion were gathered (Roberge, 2000) that covers general considerations of corrosion prevention and control with a focus on underwater materials selection. The coverage in‐cludes elements for understanding of protective coatings, corrosion inhibitors, cathodic protection and anodic protection. SIGNIFICANCE OF PAPER This paper is significantly important because it in‐volves major and expensive assets, namely ships, which require increasingly greater attention by ship owners on the maintenance of underwater hull ar‐eas. This particular area of a ship is important be‐cause problems associated with underwater corro‐sion would usually require costly high downtimes as a result of up‐slippings or dry‐dockings. As opera‐tional availability of ships is tied to business sustain‐ability an appropriate knowledge of corrosion man‐agement of the underwater hull is therefore neces‐sary. Ship owners can no longer underestimate the importance of maintaining their ship’ bottoms. This paper will seek to explore some areas of marine corrosion and recent developments in the area of corrosion prevention. CORROSION PREVENTION Most of the underwater hull corrosion types can be prevented by proper selection of hull materials, proper design of underwater appendages and struc‐tures, appropriate anti‐fouling coating and by ca‐thodic protection. Appropriate coating or painting is the most extensively used process for the preven‐tion of corrosion. Paint compositions cover a multi‐tude of proprietary products but the basic compo‐nents that make up the mechanisms of corrosion protection as incorporated in the mixture of the underwater paint composition are as follows: a A barrier coating (or primer) which pre
vents ingress of water and oxygen. To be effect‐
tive the painting must be of adequate thickness that can provide an impervious layer above the metal surface, free from flaws and firmly adher‐ent to the metal surface throughout its life.
a A corrosion inhibitor carrier such as zinc chro‐mate which is incorporated in the paint mixture.
b Cathodic protection of hull is made possible by incorporating a high concentration of zinc in the paint mixture. This high concentration of zinc would be effective in preventing corrosion un‐der the paint film. For painting to be cost effec‐tive good surface preparation is therefore es‐sential.
The zinc composition in the paint seals the underly‐ing parent metal from the corrosive environment. The anodic action of the zinc continues until the paint film is converted into a dense, impervious bar‐rier, resistant to weather, water and fume attack. However, if paint coating is damaged, fresh zinc would be readily available to provide further anodic action. Paint coating may also be damaged by mi‐cro‐biological organism that results in localized cor‐rosion. The area with the lowest oxygen availability (under the corrosion deposit) is forced to become the anode (gets eaten away) in the reaction, while the area outside acts as the cathode (being pro‐tected). The reaction depends on the electrolytic continuity between the anode and the cathode. If there is no electrolysis under the deposition then a crevice ef‐fect may occur, resulting in crevice ring of corrosion around the edge of the deposit. As a ship's hull be‐comes fouled with biological matter (such as barna‐cles), the resulting surface friction also causes a sig‐nificant increase in the power required to maintain a desired speed. The additional power required re‐sults in increased fuel consumption, which adds cost. As power output increases, the air pollution emission from a shipboard propulsion system also increases. Components of this air pollution include Nitrogen Oxides, Sulphur Oxides, particulate matter, and green house gases such as Carbon Dioxide.
| M
AR
INE
FR
ON
TIE
R @
UniK
L
14 MIMET Technical Bulletin Volume 2 (1) 2011
Therefore, using an appropriate anti‐fouling coating system helps in producing the following:‐ Increases fuel efficiency Prevents corrosion Decreases air pollution emission Increases operating speeds Prevention of bio‐fouling that causes bio‐
corrosion on underwater hull Thus, to control bio‐corrosion would require pre‐venting bio‐fouling organisms from settling on the underwater hull of the ship. This can be done by using anti‐fouling paints, which form the final paint coating on a ship’s underwater hull. ANTI‐FOULING PAINTS Anti‐fouling paints are applied on the underwater hull of ships to prevent bio‐fouling that causes bio‐corrosion. These anti‐fouling paints release chemi‐cals into the sea which are poisonous to bio‐fouling organisms and prevent their attachment to the un‐derwater hull surface. The main components of these paints are biocides and an acidic binder. The biocides are particles of poison and are distributed throughout the film of acidic binder. When this binder comes in contact with sea water which is alkaline in nature, hydrolysis reaction takes place and they release the poisonous biocide that kills the fouling organisms. Types of anti‐fouling paints com‐monly used by ship owners are as follows; Copper‐based anti‐fouling paint Tin‐based anti‐fouling paint Organo‐metallic anti‐fouling paint (TBT or Tribu‐
tyl Tin)
Copper‐based anti‐fouling paints are toxic mixtures that are formulated to kill or discourage sea life from attaching to an underwater hull of a ship. The cuprous oxide paints leached at a high rate in order to perform their function, and therefore had to be mechanically removed and renewed at frequent intervals. The high frequency of maintenance makes this type of anti‐fouling paint less efficient due to high downtime because of dry‐docking re‐quirements.
To overcome the difficulties posed by the usage of copper‐based anti‐fouling paints ship owners are replacing it with newer and improved anti‐fouling paints containing organo‐metallic compounds called TBT‐Tributyl Tin. The advantage of this new paint over the previous Cuprous Oxide type of anti‐fouling paint is that it is far more toxic to sea life and can be formulated with very low leach rates to perform their anti‐fouling function. Their anti‐fouling life may thus be prolonged and longer than Copper‐based anti‐fouling paints. However, ships' hulls us‐ing these organo‐metallic coatings do eventually require abrasive blasting to facilitate repainting. Since most of these organo‐metallic compounds are not bio‐degradable, they remain toxic in the sea water for longer periods and may kill non‐targeted organisms in the environment. The majority of anti‐fouling coatings contain solvents which are harmful by inhalation, by skin or eye contact. They can have a narcotic effect resulting in headache, dizziness, irritability and mental confusion. These reasons later resulted in the International Maritime Organi‐zation (IMO), the United Nations Agency concerned with prevention of marine pollution, to introduce a world‐wide ban on the use of TBT in anti‐fouling paints for ships. The IMO had agreed to ratify the following: a A global prohibition on the application of or‐
gano‐tin compounds acting as biocides, in anti‐fouling coatings on ships from January 2003; and
b A complete prohibition on the presence of such compounds in anti‐fouling coatings on ships by 1 January 2008.
The ban on TBT based anti‐fouling paints by IMO spurred the shipping industry to think of more cost effective non‐polluting paints to fight against bio‐fouling and bio‐corrosion. At present, the principal substitutes for TBT are still the Copper based sys‐tem which was used earlier. Copper is far from a perfect solution because it is also associated with negative environmental effects, though not be‐lieved to be as serious as those of TBT. Although there are less toxic alternative biocides under consideration, some of the most promising alternatives are those that approach the problem by
| M
AR
INE
FR
ON
TIE
R @
UniK
L
15 MIMET Technical Bulletin Volume 2 (1) 2011
inhibiting or repelling the adherence of the fouling species to the underwater hull rather than killing the species directly. Some anti‐fouling paint types are available which function by physical means rather than by wholly relying on the poisonous bio‐cides that they release. However, such methods tend to be more expensive than the usual biocide anti‐fouling coatings and their practical application is quite limited. Some of these products are still at their early stage of development and if used care‐fully may prove to be useful alternatives. An exam‐ple of this new type of anti‐fouling application is the Self‐Polishing Copolymer paint or SPC. This SPC paint is used quite extensively on various ship types throughout the world, being quite successful in a few local trials conducted on certain Royal Malay‐sian Navy ships during late 1990’s. In this anti‐fouling paint type the release of biocides takes place by hydrolysis, but the reaction occurs only near the underwater surface. Thus, controlled biocide release is made possible. SPC paint coatings have a longer service life than other types but they cost more than TBT and thus may be quite prohibitive, unless cost is not a primary concern to ship owners. Nevertheless, the use of SPC paint may reduce resis‐tance on underwater hull through the self polishing nature of the paint coating when bio‐foulings find itself difficult to adhere to the underwater hull. Re‐duced resistance may be translated to increase in speed at lower engine loads, thus improvements in overall fuel consumption may be achieved. Newer anti‐fouling developments are making it possible for newer technologies to be applied for underwater hull protection. This can be found, such as, in the form of using natural fungus in anti‐fouling paint mixtures. This new type of anti‐fouling paint uses an extract from the microscopic fungus Streptomy‐cin Avermitilis to poison the barnacles. The fungus is extremely poisonous to barnacles and other crus‐taceans which commonly stick to the underwater hull. When this fungus is added to the anti‐fouling paint for ship hulls, the underwater hull surface re‐mains entirely free from barnacles. The pure fungal extract in paint is sufficient to seriously affect the nervous system of barnacles that prevent any fur‐ther growth, as long as the paint is on a painted sur‐face. The main advantage of these paints is that when the paint is dissolved in sea water it does not
harm other organisms in the open sea. The fungal extract is probably both cheaper and, above all, more environmentally friendly than other anti‐fouling paints based on copper compounds and TBT available today. CONCLUSION Protection of a ship’s hull from corrosion is one of the most challenging factors facing ship owners and maintainers. Even a small corrosive element may eventually lead to tremendous financial or opera‐tional loss if not rectified early. The protective anti‐fouling paints that are commonly used to prevent the bio‐fouling are usually quite toxic in nature that may adversely affect the marine environment. However, if the anti‐fouling paints are not used then the underwater hull would be subjected to bio‐corrosion, lower operational availability of ships, increase in hull resistance that in turn would in‐crease fuel consumption, increase in costs to ship owners. A maritime nation like Malaysia would suf‐fer in terms of reduced earnings from sea trade and all these can be attributable to the effects of under‐water corrosion. So, anti‐fouling coatings are im‐portant as far as ships’ availability and sea trade are concerned. There are IMO regulations in place to control the detrimental effects of anti‐fouling coat‐ing systems. These regulations are in place due to the compelling need to minimize the environmental harm that is caused by the usage of these biocides in the anti‐fouling paints.Although less toxic alterna‐tive biocides are under consideration, other most promising alternatives may be those that approach the problem by inhibiting or preventing the adher‐ence of the bio‐fouling species to the hull rather than killing the species directly that would also af‐fect the non‐targeted marine species. REFERENCES 1. Bradford, S.A. (2001). Corrosion Control. 2nd
Edition. CASTI Publishing 2. Roberge, P.R. (2006). Corrosion Basics: An In‐
troduction. 2nd Edition. NACE Press Book. 3. Francis, R. (2000). A Practical Guide for Engi‐
neers. NACE Press Book. 4. Roberge, P.R (2000). Handbook of Corrosion
Engineering. McGraw Hill Publication.
| M
AR
INE
FR
ON
TIE
R @
UniK
L
16 MIMET Technical Bulletin Volume 2 (1) 2011
Feature Article 3 Feature Article 3
EFFECTS OF WEAVING PATTERNS TOWARDS DIFFERENT WELDED JOINTS
AZMAN ISMAIL*, MOHD NUZULRIZUAN BUSTAMAN AND NURUL IDA SUHANA LIAS Department of Marine Construction and Maintenance Technology
BET in Naval Architecture & Shipbuilding Malaysian Institute of Marine Engineering Technology, Universiti Kuala Lumpur Received: 5 Jan 2011; Revised: 14 Jan 2011 ; Accepted: 17 Jan 2011
ABSTRACT Welding plays major role in shipbuilding activities as it joins most metals. This requires many welders to be employed. When it comes to weaving, most welders have preferable patterns. There will be circular in motion, zigzag, crescent, straight and many more. Weaving can be defined as the way of manipulation of the torch during the welding process. However, there was no analysis done to study their effects on heat affected zone (HAZ) for each type of welded joint. In this paper, the author will focus on tee and butt joint.
Keywords: Welding, weaving and heat affected zone (HAZ)
Corresponding Author: [email protected]
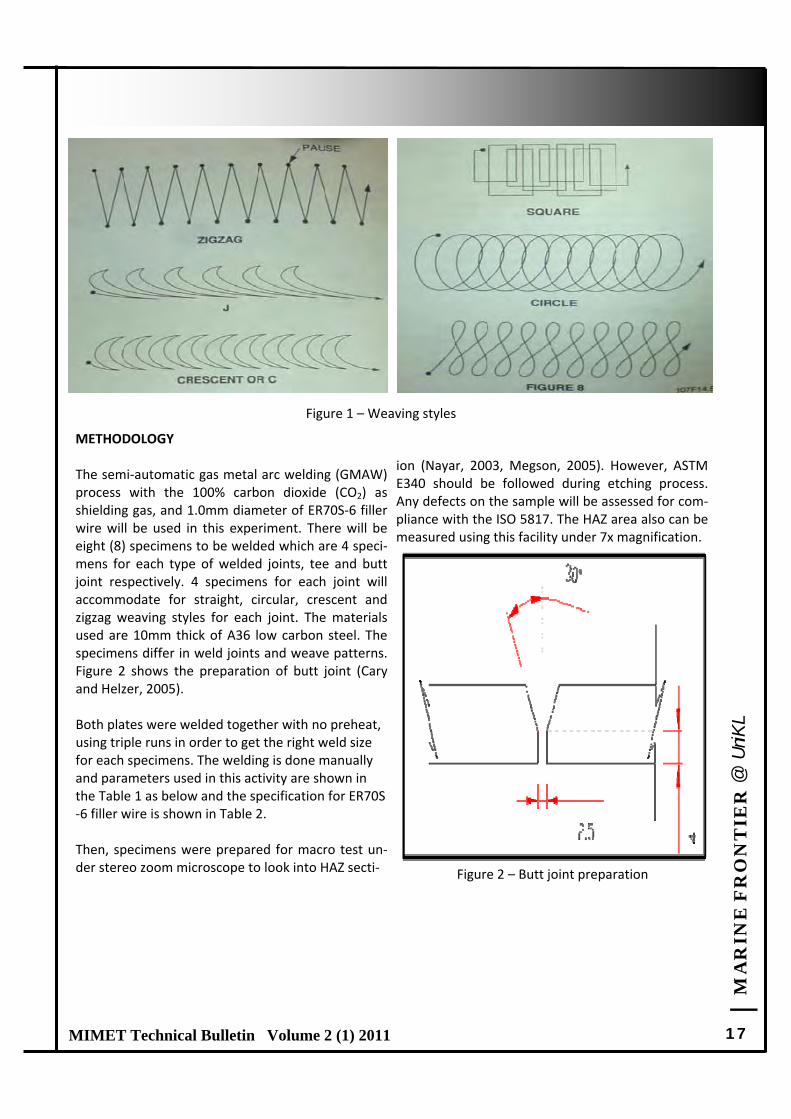
INTRODUCTION Welding is very important in term of productiv‐ity and quality of the end product, especially in shipbuilding practices. The quality of welding is not only restricted on the work done by the welder but also depends on many other factors such as welding parameters, shielding gaseous, working environment, joint accessibility, joint design, edge preparation, weld sequence, weld‐ing equipment and welder skill etc. Furthermore, a thorough training regarding preferable welding techniques is essential to ensure consistency in welder skill (Mandall, 2004). The weaving styles used are varying depending on the welder’s preferred choice. This weld can be made by moving the electrode/welding torch backward and forward. There were many different patterns/techniques can be used to make a weld including circles, J zigzag, crescent, straight and many more which shown in Figure 1
1. A clear understanding of the whole process is also required in order to produce sound (good) welds (American Welding Society, 2003). The use of welding processes and techniques may produce defects which are usually associ‐ated with a given process or technique. There‐fore, it is important to consider how the change in weaving style (welding techniques) can affect the HAZ of the welded joints (Jeffus, 2004, Sacks and Bohnart, 2005). There will be several joints and weave patterns
to be tested and analyzed. Tests that will be conducted after the welding are the morphologi‐cal observation in order to identify the HAZ by using the stereo zoom microscope and also the macro test with the compliance of ISO 5817. The results was then used to propose whichever patterns that will have minimum distortion char‐acteristic and also to identify the effective meth‐ods that are able to represent smallest (HAZ) precisely.
| M
AR
INE
FR
ON
TIE
R @
UniK
L
17 MIMET Technical Bulletin Volume 2 (1) 2011
METHODOLOGY The semi‐automatic gas metal arc welding (GMAW) process with the 100% carbon dioxide (CO2) as shielding gas, and 1.0mm diameter of ER70S‐6 filler wire will be used in this experiment. There will be eight (8) specimens to be welded which are 4 speci‐mens for each type of welded joints, tee and butt joint respectively. 4 specimens for each joint will accommodate for straight, circular, crescent and zigzag weaving styles for each joint. The materials used are 10mm thick of A36 low carbon steel. The specimens differ in weld joints and weave patterns. Figure 2 shows the preparation of butt joint (Cary and Helzer, 2005). Both plates were welded together with no preheat, using triple runs in order to get the right weld size for each specimens. The welding is done manually and parameters used in this activity are shown in the Table 1 as below and the specification for ER70S‐6 filler wire is shown in Table 2. Then, specimens were prepared for macro test un‐der stereo zoom microscope to look into HAZ secti‐
ion (Nayar, 2003, Megson, 2005). However, ASTM E340 should be followed during etching process. Any defects on the sample will be assessed for com‐pliance with the ISO 5817. The HAZ area also can be measured using this facility under 7x magnification.
Figure 1 – Weaving styles
Figure 2 – Butt joint preparation
| M
AR
INE
FR
ON
TIE
R @
UniK
L
18 MIMET Technical Bulletin Volume 2 (1) 2011
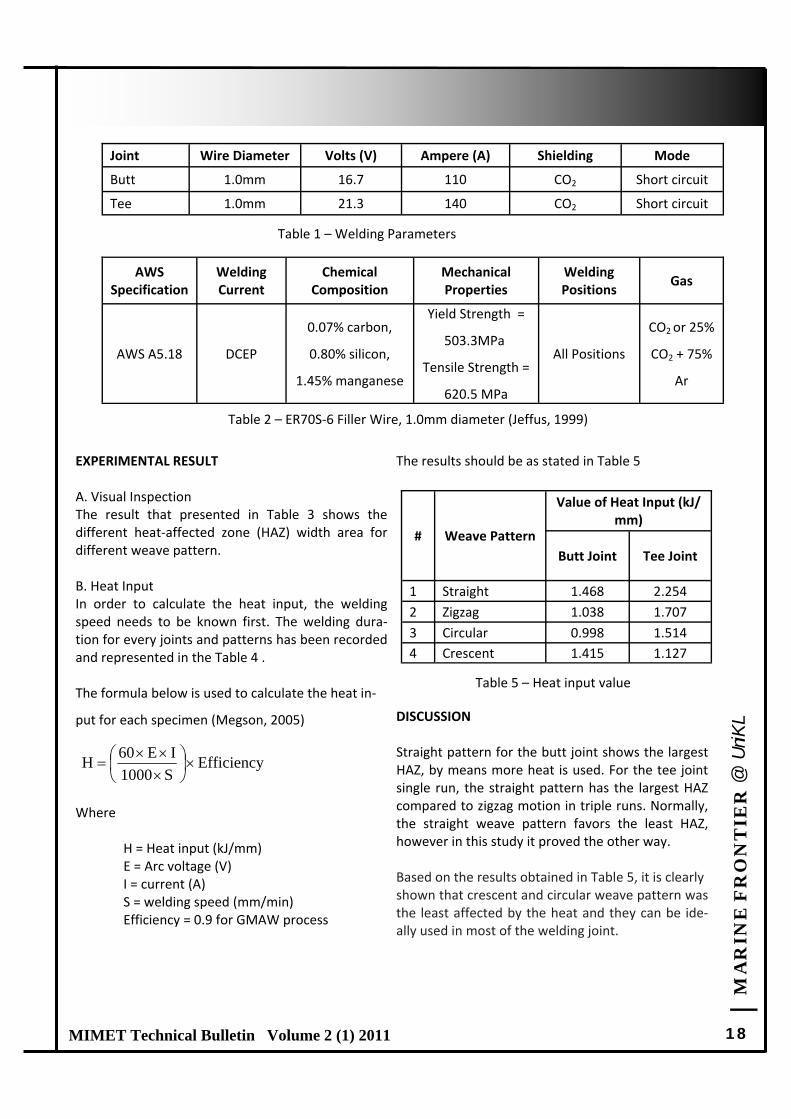
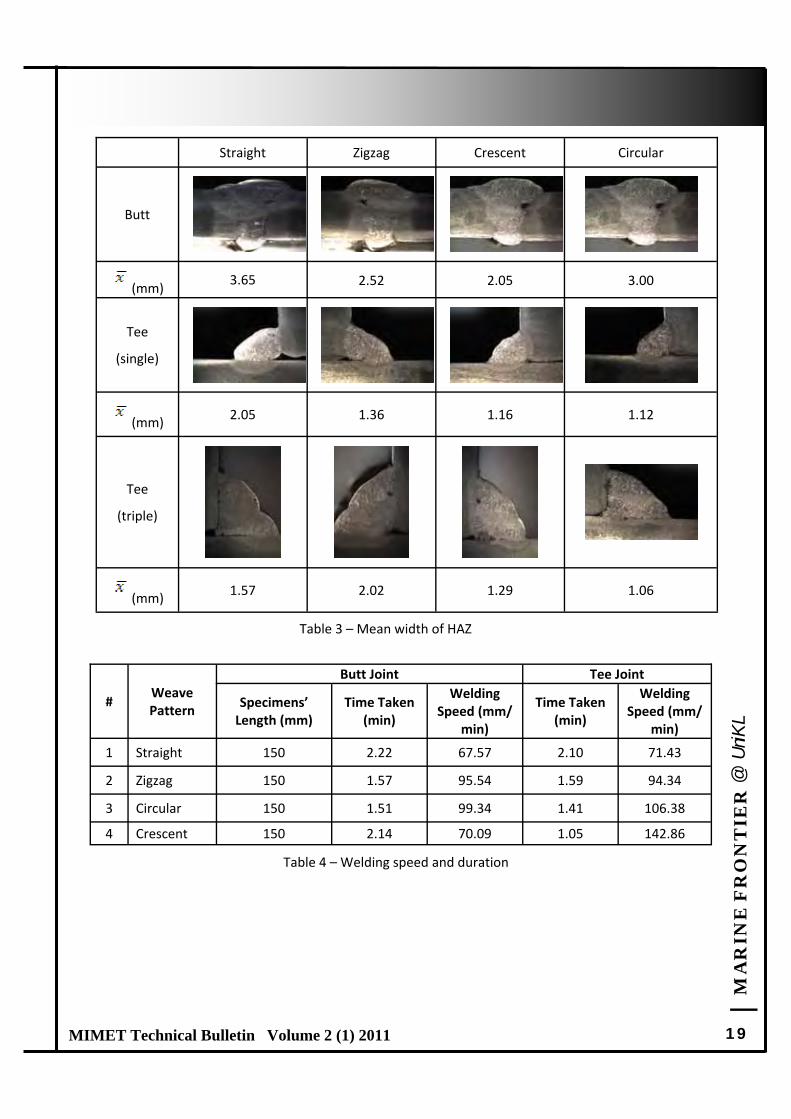
EXPERIMENTAL RESULT A. Visual Inspection The result that presented in Table 3 shows the different heat‐affected zone (HAZ) width area for different weave pattern. B. Heat Input In order to calculate the heat input, the welding speed needs to be known first. The welding dura‐tion for every joints and patterns has been recorded and represented in the Table 4 . The formula below is used to calculate the heat in‐
put for each specimen (Megson, 2005)
Where H = Heat input (kJ/mm) E = Arc voltage (V) I = current (A) S = welding speed (mm/min) Efficiency = 0.9 for GMAW process
The results should be as stated in Table 5
DISCUSSION Straight pattern for the butt joint shows the largest HAZ, by means more heat is used. For the tee joint single run, the straight pattern has the largest HAZ compared to zigzag motion in triple runs. Normally, the straight weave pattern favors the least HAZ, however in this study it proved the other way. Based on the results obtained in Table 5, it is clearly shown that crescent and circular weave pattern was the least affected by the heat and they can be ide‐ally used in most of the welding joint.
EfficiencyS1000
IE60H
Joint Wire Diameter Volts (V) Ampere (A) Shielding Mode
Butt 1.0mm 16.7 110 CO2 Short circuit
Tee 1.0mm 21.3 140 CO2 Short circuit
Table 1 – Welding Parameters
AWS Specification
Welding Current
Chemical Composition
Mechanical Properties
Welding Positions
Gas
AWS A5.18 DCEP
0.07% carbon,
0.80% silicon,
1.45% manganese
Yield Strength =
503.3MPa
Tensile Strength =
620.5 MPa
All Positions
CO2 or 25%
CO2 + 75%
Ar
Table 2 – ER70S‐6 Filler Wire, 1.0mm diameter (Jeffus, 1999)
# Weave Pattern
Value of Heat Input (kJ/mm)
Butt Joint Tee Joint
1 Straight 1.468 2.254
2 Zigzag 1.038 1.707
3 Circular 0.998 1.514
4 Crescent 1.415 1.127
Table 5 – Heat input value
| M
AR
INE
FR
ON
TIE
R @
UniK
L
19 MIMET Technical Bulletin Volume 2 (1) 2011
Straight Zigzag Crescent Circular
Butt
(mm) 3.65 2.52 2.05 3.00
Tee
(single)
(mm) 2.05 1.36 1.16 1.12
Tee
(triple)
(mm) 1.57 2.02 1.29 1.06
Table 3 – Mean width of HAZ
# Weave Pattern
Butt Joint Tee Joint
Specimens’ Length (mm)
Time Taken (min)
Welding Speed (mm/
min)
Time Taken (min)
Welding Speed (mm/
min)
1 Straight 150 2.22 67.57 2.10 71.43
2 Zigzag 150 1.57 95.54 1.59 94.34
3 Circular 150 1.51 99.34 1.41 106.38
4 Crescent 150 2.14 70.09 1.05 142.86
Table 4 – Welding speed and duration
| M
AR
INE
FR
ON
TIE
R @
UniK
L
20 MIMET Technical Bulletin Volume 2 (1) 2011
Considering on the time taken and welding speed for these patterns, the shipbuilder can make more profit when these patterns were applied in their work. However, this welding process is done manu‐ally. Therefore the uniformity of travel speed and weave pattern cannot be confirmed fully thus it will affect the final result. It is recommended that, ro‐botic arm welding should be used in future research to perform this activity as this will give better and reliable result (Marlow, 2002, Houldcroft and John, 1989, Marlow and Galvery, 2000). CONCLUSION As conclusion, crescent motion gives the least HAZ for butt joint and circular motion for tee joint re‐spectively. At the same time, these weave patterns also give least heat input for each joint. Thus pro‐vide minimum distortion characteristic for specified joints using these weaving styles. Although most welder have preferred pattern, hopefully with this findings it can give a clear view for better selection of the weave pattern during welding process which can produces less distortion and very practical in time saving. ACKNOWLEDGEMENT Special thanks to Advanced Materials Research Cen‐tre (AMREC) Kulim and, Science and Technology Research Institute for Defense (STRIDE) Lumut for
their kind support for laboratory works and facilities. REFERENCES 1. N.R.Mandal, Welding and Distortion Control,
UK: Alpha Science, 2004. 2. American Welding Society, Welding Level 1: An‐
notated Instructor’s Guide, New Jersey: Pearson Education, 2003.
3. Larry Jeffus. Welding Principles and Applica‐tions, Fifth Edition. New York: Thomson Delmar Learning. 2004.
4. Raymond J. Sacks, Edward R. Bohnart. Welding Principles and Practices, Third Edition. New York: McGraw‐Hill. 2005.
5. Howard B. Cary and Scott C. Helzer. Modern Welding Technology, Sixth Edition. New Jersey: Pearson Prentice Hall. 2005.
6. Larry Jeffus. Welding for Collision Repair. New York: Delmar Publisher. 1999.
7. Alok Nayar. The Steel Handbook. New Delhi: Tata McGraw‐Hill. 2003.
8. T.H.G. Megson. Structural and Stress Analysis, 2nd Edition. Butterworth – Heinemann. 2005.
9. Frank M. Marlow. Welding Fabrication and Re‐pair. New York: Industrial Press. 2002.
10. Peter Houldcroft and Robert John. Welding and Cutting. New York: Industrial Press. 1989.
11. Frank Marlow and William Galvery Welding Es‐sentials. New York: Industrial Press. 2000.

| M
AR
INE
FR
ON
TIE
R @
UniK
L
21 MIMET Technical Bulletin Volume 2 (1) 2011
Feature Article 4 Feature Article 4
ANALYSIS ON FIRST LANGUAGE (L1) INTERFERENCE IN LEARNING SECOND
LANGUAGE (L2) WORDS WITH MULTIPLE MEANINGS
NIK HARNIDA SUHAINAI*
Department of General Studies Malaysian Institute of Marine Engineering Technology, Universiti Kuala Lumpur Received: 3 Jan 2011; Revised: 17 Jan 2011 ; Accepted: 18 Jan 2011
ABSTRACT This study analyzed first language (L1) interference on second language (L2) vocabulary learning among Universiti Kuala Lumpur (MIMET) students. For this study, the first language is Malay language, as all students are Malays and the second language in this study is English. Fifty students participated in this study. Data were collected from essays, answers for translation exercise and vocabulary test answer scripts. The occurrences of misuse of homonyms or words with multiple meanings were identified and analyzed. Results suggested that the students have yet to master a certain number of words in English despite learning English for more than eleven years. Lessons on vocabulary especially words with multi‐ple meanings are needed to improve students’ proficiency level.
Keywords: L1 interference, L2 vocabulary and homonyms
Corresponding Author: [email protected]
INTRODUCTION English is known as the “most significant and global language” (Akande, 2003), which is used as the sole official language in relation to a wide range of topics. Based from the 7th Edition of Oxford Advanced Learner’s Dictionary (2005), one in five of the world’ population speaks Eng‐lish with some degree of competence and is spo‐ken as a first language by more than 300 million people throughout the world and used as a sec‐ond language by as many, if not more. As a re‐sult of the exceptional global spread of English, approximately only one out of every four users of the language in this world is a native speaker of it (Seidlhofer, 2005). Thus, it is acceptable to say that the interaction s in English happen among the non‐native speakers of the language. Jamian, Sidhu and Muzafar (2008) stated that learning a second or foreign language involves
not only learning the rules that govern the gram‐mar but also the vocabulary of the language. It is agreeable that learning a SL or FL is associated to lexical knowledge and syntactic rules, which are the crucial component of overall communi‐cative competence. Knowledge of vocabulary is vital for the development and demonstration of other related linguistic skills. Furthermore, Eng‐lish has more than 100 000 words, phrases and meanings, which may make the acquiring of the language becomes difficult. If a L2 learner speaks the target language with grammatical error, the message can still be delivered as long as the words used in the sentences are in con‐text and can be grasped by the listener. How‐ever, if the use of words is limited, the process of communication may be broken down by the failure of the listener to digest the content of the message. Obviously, unfamiliarity with cer‐tain vocabulary may give rise to problems in dis‐course (Webb, 2008). Frisson and Pickering
| M
AR
INE
FR
ON
TIE
R @
UniK
L
22 MIMET Technical Bulletin Volume 2 (1) 2011
(2001) mentioned in their study, a great deal of evi‐dence indicates that both spoken and written lan‐guage comprehension are essential, with the ability to interpret the meaning of each new word as soon as it is encountered by the students. In L2 learning environment, specifically in Malaysia, vocabulary items are taught in the earlier stage of the schooling years, either explicitly or implicitly. The words taught at this stage are mostly high fre‐quency words, which need to be taught as the fun‐damental knowledge of acquiring the L2. When it comes to secondary school levels, the lesson may not include explicit vocabulary teaching but is usu‐ally merged together as a whole. Nunan (2003) ex‐plained in his book Practical English Language Teaching that high frequency vocabulary should get deliberate attention, for receptive and productive use, through teaching and study and should be met and used in communicating messages. Webb (2008) found out through his study that L2 learners may incidentally gain knowledge of meaning through reading. However, some researchers suggest that explicit learning of vocabulary may be responsible for most L2 vocabulary learning. Understanding the meaning of words can either be easy or difficult, depending on the students’ ability to identify the meaning or meanings of the words. Moreover, majority of English words have multiple meanings, based on their types of the part of speech, the form and the structure of the words. Thus, it might be difficult for L2 learners to grasp each meaning for this type of words, known as ‘homonyms’, words that have different meanings but are pronounced and spelled the same. Examples are book, meaning a written work or to arrange with a hotel or restaurant. Obviously, L2 learners may not able to acquire all meanings and the forms of the used are being used. Moning (2007) said that learners’ meaning‐making is a complex and cogni‐tive process which occurs within the individual. It will be more difficult if the meanings are not related and the learners will interpret the meanings by making sense and looking for contextual clues within the sentence (Frisson and Pickering, 2001). Another problem that may arise is the learners will
have to deal with the literary devices, sociological aspect and cultural aspects of L2. Moning (2007) again mentioned in her study that learners have to use their schemata and worldview to understand the meaning. Thus, if the context of the clues is un‐authentic to the learners, the most possible way to get the meaning of the word or to use the word in a sentence is guessing and translation.L2 vocabulary learning is rather difficult as it is influenced by learn‐ers’ first language and if a word is learned per se, learner’s depth of vocabulary knowledge will not be depicted (Jamian, Sidhu and Muzafar, 2008). It is impossible to keep two languages apart. Therefore, when L2 learners fail to understand the meaning of a word or uncertain on how to put the word in a sentence, they will shift back to their L1 and try to directly translate the word. Even though the issue of translation from L1 to L2 has been a controversial issue in ESL classroom, some studies have proved that translation is a big help in L2 learning but if translation involves the instruction only. The learn‐ing through translation can be a meaningful learning if the students able to seize the lesson. Vaezi and Mirzaei (2007) stated that L1 can have various uses in L2 classroom, in creating authentic L2 uses rather than something to be shunned at all costs. Transla‐tion might work if the translation method only in‐volves instruction but may not be appropriate for students to translate the meaning of words into L1 as the differences between the two contexts are quite significant. The use of mother tongue had been banned since the existence of Direct Method. One of results found in a study by Kavari and Fazeli (2009) indicated that L1 translation method is not successful in meaningful learning and cannot help students to be successful in L2 acquisition. PROBLEM STATEMENT
L1 has various uses in L2 classroom. Vaezi and Mir‐zae (2007) mentioned that L1 is used in classroom management, giving instruction, explaining errors, discussing cross‐cultural issues and checking com‐prehension. Thus, it can be said that L1 use in L2classroom basically enfolds 100% of L1 teaching. Teachers use L1 to convey meaning, explain gram‐mar and also organizing the class. This may be an

| M
AR
INE
FR
ON
TIE
R @
UniK
L
23 MIMET Technical Bulletin Volume 2 (1) 2011
alternative for teachers in order to make sure that learning is taking place. Then again, one of the ef‐fects of L1 instruction in L2 learning environment is translation and guessing technique apply by the learners in L2 learning. If the teachers use transla‐tion in teaching, the learners may not be able to memorize all the translation items given to them. Moreover, majority of English vocabularies are homonyms, which will make it trickier for learners to understand the words in context. The purpose of this paper is to present an analysis on L1 interference in word meaning. Besides that, this paper will also examine the occurrence of mis‐use of homonyms in English essay among Universiti
Kuala Lumpur students.
METHODOLOGY Subjects The subjects were 50 diploma programs Malay stu‐dents in Universiti Kuala Lumpur Malaysian Institute of Marine Engineering Technology (UniKL MIMET). These students were in their first semester in vari‐ous courses such as Diploma in Engineering Tech‐nology (DET) Ship Design, DET Ship Construction and Maintenance, DET Marine Engineering and DET Marine Electrical and Electronic. The similarity among them is that they enrolled in a foundation course known as ‘Proficiency English’ after they failed the UniKL English Placement Test (UEPT). The placement test is compulsory for all UniKL students. The scoring scheme is Band 1 (weak) to 5 (excellent). Students who obtain less than Band 3 will have to enroll in this course. The subjects were 15 female students and 35 male students. Instrumentation The following instruments were used in this pro‐ject: 1. Essay writing
2. Translation exercise
3. Vocabulary test
Procedure Firstly, the subjects’ UEPT essays were analyzed and L1 interference was identified. Next, the subjects were given a translation exercise whereby they translated five English homonyms to L1, in this case, Malay language. After that, they were given a test, which consisted of ten Multiple Choice Questions. The questions in the test included the five similar words that they translated before. They had to choose the meaning of the word based from the given options. This test was carried out after a few lessons on ‘Words with Multiple Meanings’.
DATA ANALYSIS The subjects’ essays were analyzed and the sen‐tences that demonstrated the most obvious L1 in‐terference were discussed. For Task 2, the students were asked on the transla‐tion of the six words given. The subjects’ feedbacks were discussed. For the last task, the subjects’ answers from the vocabulary test were analyzed and discussed.
Results and Discussions The subjects wrote an essay entitled “Are mobile phones harmful?” for the UEPT. Out of 50 essays analyzed, there were seven sentences that demon‐strated the most obvious L1 interference. These essays were written before they enrolled in Profi‐ciency English course.
Table 1: Occurrence of L1 Interference in L2 sentence
Erroneous Sentence 1
Correct Sentence
It can snap picture with easy. Malay: Ia boleh mengambil gambar/foto dengan mudah.
It is easy to snap a picture by using mo‐bile phones.
| M
AR
INE
FR
ON
TIE
R @
UniK
L
24 MIMET Technical Bulletin Volume 2 (1) 2011
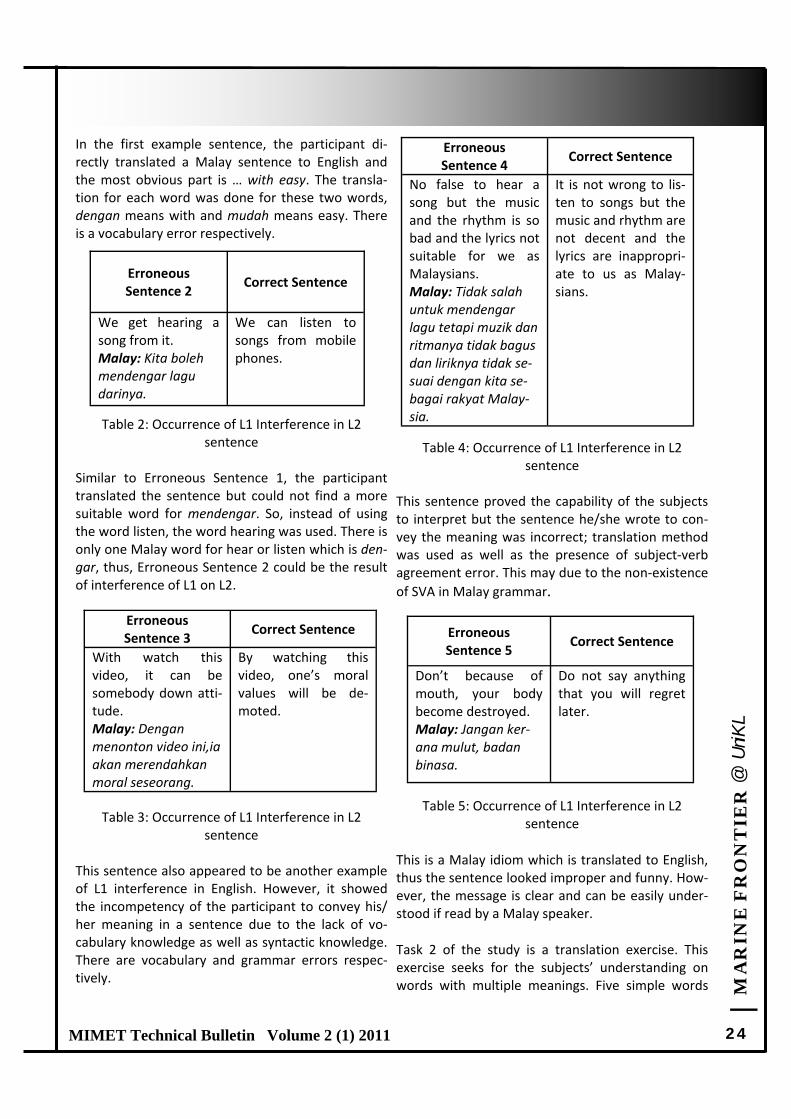
In the first example sentence, the participant di‐rectly translated a Malay sentence to English and the most obvious part is … with easy. The transla‐tion for each word was done for these two words, dengan means with and mudah means easy. There is a vocabulary error respectively.
Table 2: Occurrence of L1 Interference in L2 sentence
Similar to Erroneous Sentence 1, the participant translated the sentence but could not find a more suitable word for mendengar. So, instead of using the word listen, the word hearing was used. There is only one Malay word for hear or listen which is den‐gar, thus, Erroneous Sentence 2 could be the result of interference of L1 on L2.
Table 3: Occurrence of L1 Interference in L2 sentence
This sentence also appeared to be another example of L1 interference in English. However, it showed the incompetency of the participant to convey his/her meaning in a sentence due to the lack of vo‐cabulary knowledge as well as syntactic knowledge. There are vocabulary and grammar errors respec‐tively.
Table 4: Occurrence of L1 Interference in L2 sentence
This sentence proved the capability of the subjects to interpret but the sentence he/she wrote to con‐vey the meaning was incorrect; translation method was used as well as the presence of subject‐verb agreement error. This may due to the non‐existence
of SVA in Malay grammar.
Table 5: Occurrence of L1 Interference in L2 sentence
This is a Malay idiom which is translated to English, thus the sentence looked improper and funny. How‐ever, the message is clear and can be easily under‐stood if read by a Malay speaker.
Task 2 of the study is a translation exercise. This exercise seeks for the subjects’ understanding on words with multiple meanings. Five simple words
Erroneous Sentence 3
Correct Sentence
With watch this video, it can be somebody down atti‐tude. Malay: Dengan menonton video ini,ia akan merendahkan moral seseorang.
By watching this video, one’s moral values will be de‐moted.
Erroneous Sentence 2
Correct Sentence
We get hearing a song from it. Malay: Kita boleh mendengar lagu darinya.
We can listen to songs from mobile phones.
Erroneous Sentence 4
Correct Sentence
No false to hear a song but the music and the rhythm is so bad and the lyrics not suitable for we as Malaysians. Malay: Tidak salah untuk mendengar lagu tetapi muzik dan ritmanya tidak bagus dan liriknya tidak se‐suai dengan kita se‐bagai rakyat Malay‐sia.
It is not wrong to lis‐ten to songs but the music and rhythm are not decent and the lyrics are inappropri‐ate to us as Malay‐sians.
Erroneous Sentence 5
Correct Sentence
Don’t because of mouth, your body become destroyed. Malay: Jangan ker‐ana mulut, badan binasa.
Do not say anything that you will regret later.

| M
AR
INE
FR
ON
TIE
R @
UniK
L
25 MIMET Technical Bulletin Volume 2 (1) 2011
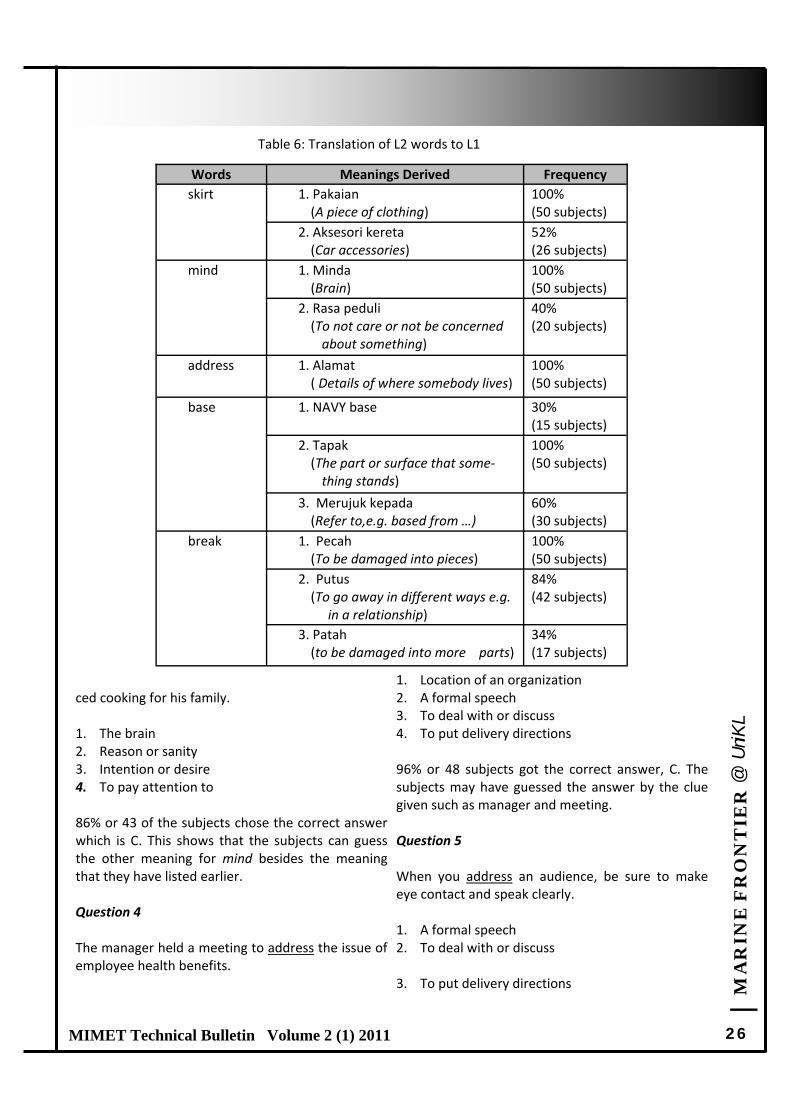
were given to them. The words are skirt, mind, ad‐dress, base and break. The subjects were asked to list down as many meanings that they know on the given words. These are the answers and the per‐centage of subjects who gave the answers. The meanings are also translated to English. As shown in the Table 6, most subjects gave the same meanings for the words. Only a certain mean‐ings derived from a few number of subjects such as the second meaning for skirt, second meaning for mind, first meaning for base and the third meaning for break. The second meaning for skirt refers to an outer cov‐ering or part used to protect the base of a vehicle or machine. This definition is taken from Oxford Ad‐vanced Learner’s Dictionary. This answer may derive from subjects who are passionate about motoring or car accessories. For the second meaning for mind is believed to de‐rive from the overuse phrase like “I don’t mind” or “Would you mind?”, thus it can be said that they gave the answer by translating the phrases directly to Malay language. The first meaning of base is derived due to the nearby Royal Naval Army base camp that situated in Lumut, Perak. The common name used for the army base is NAVY base, which is used by the residents in this district. The third meaning for break is similar to the first meaning, only the composition of the objects is dif‐ferent. The first meaning refers to a broken glass, which the object breaks into pieces, while the third meaning refers to a broken wood, which the object breaks into several parts. It also refers to a broken heart (patah hati), which means to be disappointed in love. Hence, from this exercise, it can be concluded that the knowledge of word meaning of the students is modest, which, the students have inadequate knowledge on words with multiple meanings. After
11 years of learning English in schools, they cannot grasp the meanings even for simple words. The vo‐cabulary knowledge of the students is still very lim‐ited. Task 3 is a vocabulary test which the subjects were given a 10‐question MCQ and the questions re‐quired the subjects to choose the meaning best complements the underlined word in a sentence. All underlined words are the same five words given in Task 2. This test was carried out after a few lessons on ‘Words with Multiple Meanings’ were delivered. This topic is one of the lessons in the syllabus. Question 1 Tom was uncomfortable talking about money, so he skirted the issue. 1. Garment worn to the waist 2. A flap on a saddle 3. To pass along the edge 4. To avoid 86% or 43 of the subjects chose the correct a swer which is D. This shows that the subjects can guess the other meaning for skirt besides the meaning that they have listed earlier. Question 2 Even though raking leaves is hard work, I don’t mind it at all. 1. Reason or sanity 2. To heed or obey 3. To pay attention to 4. To feel disturbed by The respondent had chosen the correct answer for this question which is D. The meaning for mind has already existed in the subjects’ schemata. Question 3 George had a mind to become a chef, so he practi‐
| M
AR
INE
FR
ON
TIE
R @
UniK
L
26 MIMET Technical Bulletin Volume 2 (1) 2011
ced cooking for his family. 1. The brain 2. Reason or sanity 3. Intention or desire 4. To pay attention to 86% or 43 of the subjects chose the correct answer which is C. This shows that the subjects can guess the other meaning for mind besides the meaning that they have listed earlier. Question 4 The manager held a meeting to address the issue of employee health benefits.
1. Location of an organization 2. A formal speech 3. To deal with or discuss 4. To put delivery directions 96% or 48 subjects got the correct answer, C. The subjects may have guessed the answer by the clue given such as manager and meeting. Question 5 When you address an audience, be sure to make eye contact and speak clearly. 1. A formal speech 2. To deal with or discuss 3. To put delivery directions
Table 6: Translation of L2 words to L1
Words Meanings Derived Frequency
skirt 1. Pakaian (A piece of clothing)
100% (50 subjects)
2. Aksesori kereta (Car accessories)
52% (26 subjects)
mind 1. Minda (Brain)
100% (50 subjects)
2. Rasa peduli (To not care or not be concerned
about something)
40% (20 subjects)
address 1. Alamat ( Details of where somebody lives)
100% (50 subjects)
base 1. NAVY base 30% (15 subjects)
2. Tapak (The part or surface that some‐
thing stands)
100% (50 subjects)
3. Merujuk kepada (Refer to,e.g. based from …)
60% (30 subjects)
break 1. Pecah (To be damaged into pieces)
100% (50 subjects)
2. Putus (To go away in different ways e.g.
in a relationship)
84% (42 subjects)
3. Patah (to be damaged into more parts)
34% (17 subjects)

| M
AR
INE
FR
ON
TIE
R @
UniK
L
27 MIMET Technical Bulletin Volume 2 (1) 2011
4. To speak up 50 % of the subjects chose the correct answer which is D. However, the other 25 subjects failed to guess the meaning, whereby the most answer chosen by them was A. Question 6 The doctor based her diagnosis on medical test re‐sults. 1. A fundamental principle 2. The bottom layer of coating 3. To establish as a fact 4. Of little or no value. 98% subjects chose the correct answer which C. Only one respondent chose A as the answer. Question 7 The statue looks valuable, but it is made of base material, not real gold. 1. The bottom layer of coating 2. A military supply site 3. Morally low, mean‐spirited 4. Of little or no value 72% or 36 subjects answered D which is the correct answer. There are 10 subjects answered A. Question 8 When people trip, they instinctually try to break the fall with their hands. 1. To rupture the surface of 2. To disclose or reveal 3. To lessen the impact of 4. To stop working All subjects chose the correct answer which is C. the subjects said that the meaning for break in this sen‐tence was easier to understand. Question 9
Anthony was so happy when he heard the good news that he broke into a song. 1. To smash violently 2. To disclose or reveal 3. To rupture the surface of 4. To begin suddenly 52% or 26 subjects got the correct answer, D. How‐ever the other 24 subjects answered B. This may due to the lack of understanding in the context. Ma‐lays usually will break into a prayer after getting good news. Question 10 After weeks of raining, the sun came out and we had a break in the weather. 1. An opening or gap 2. An abrupt change 3. A stroke of good fortune 4. A sudden dash or rush 52% or 26 subjects got the correct answer, B. How‐ever the other 24 subjects answered C. It is ex‐pected that this question is difficult, which is proved by the number of correct answer given. SUMMARY AND CONCLUSION The essay written by the subjects were taken from the UniKL English Placement Test, which was held during the induction week of July 2010 Semester. Thus, the comprehension of the essay was basically a raw responds from the subjects who are mostly school leavers and certificate holders. On the vo‐cabulary exercise given to the subjects, all of them performed relatively well as none of them got be‐low 6 out of 10 questions given. This may due to the lessons on related topic before conducting the test. However, a critical look at their performance indi‐cated that more than half of the whole subjects did not have a good knowledge of vocabulary, for ex‐ample the answers given by then in Task 2, transla‐ tion exercise. When they were given the contextual
| M
AR
INE
FR
ON
TIE
R @
UniK
L
28 MIMET Technical Bulletin Volume 2 (1) 2011
clues form of questions, they were able to guess the meaning of the words by looking at clues that en‐fold the sentence. Though this study revealed that the subjects did not have a good mastery of English vocabulary, it was found that there were few errors in the way the meanings for the words interpreted. Most errors were made either as a result of carelessness or ig‐norance on the meaning of clues given in the sen‐tence. Ali (2002) stated in his article that native lan‐guage interference is one of the sources of errors in L2 acquisition. A learner cannot escape from his/her dominant first language. Furthermore, the negative aspect of L1 interference is quite worrying because this may result in erroneous occur in utterances or writing, and unacceptable language switch. The study suggests that the type of pedagogical ap‐proach of the L2 vocabulary learning may have an impact on retention of the new L2 words. The find‐ings clearly demonstrate some results that can be applied in the preparation of vocabulary lessons, which suggests that contextual clue is one of the ways to teach homonyms. Some implications from this study may include the type of teaching method that supposedly cater the needs of the students in vocabulary acquisition, the functions of L1 transla‐tion method in vocabulary learning and the prepara‐tion of teaching materials that should provide the students with proper examples and drills. Some of the limitations of this study are similar to other studies, which in need of a larger size population and the need to conduct similar experiments on population with different proficiency levels. REFERENCES 1. Akande, A.T. (2003). Acquisition of the inflec‐
tional morphemes by Nigeria learners of English language. Nordic Journal of African Studies, 12(3), 310‐326. Retrieved from http:// pkukmweb.
ukm.my/~ppbl/GemaVol4.2.2004No4.pdf
2. Frisson, S., & Pickering, M. J. (2001). Obtaining a figurative interpretation of a word: Support for underspecification. Metaphor and Symbol, 16(3&4), 149‐171. Retrieved from www.psy.ed.ac.uk/people/martinp/pdf/frisson‐pickering‐ms01.pdf
3. Fromkin, V., Rodman, R.,& Hyams, N. (2011). An introduction to language (9th ed.). Bos‐ton:Thomson Wadsworth.
4. Haja Mohideen Mohamed Ali. (2002). Getting students to use English with fewer errors. Inter‐national Conference IPBA 2002. Retrieved from apps.emoe.gov.my/ipba/rdipba/cd1/article115.pdf
5. Jamian, L. S., Sidhu, G. K., & Muzaireen Muzafar.(2008). Assessing UiTM TESL students’ knowl‐edge of Vocabulary. Asian Journal of University Education, 4(2), 79‐98. Retrieved from http://eprints.ptar.uitm.edu.my
6. Kavari, S. E., & Fazeli, S. H. (2009). The impact of translation method on word meaning and fill‐in‐the‐blank tests procedures on short‐term and long‐term retention on vocabulary items. Lan‐guage in India, 9(9), 76‐87.Retrieved from www.languageinindia.com/sep2009/translationmethod.pdf
7. Norherani Moning. (2007). Teachers’ beliefs and practices on meaning‐making in the Teaching of Literature. Retrieved October 22, 2010 from http://psasir.upm.edu.myNunan, D. (2003). Practical English Language Teaching. McGraw‐Hill Education Asia.Vaezi, S., & Mirzaei, M. (2007). The effects of using translation from L1 to L2 as teaching techniques on the improve‐ment of EFL learners’ linguistic accuracy‐ Focus on Form. 9(5). Retrieved from http://www.hitmag.co.uk/sep07/mart03.htm
8. Webb, S. (2008). The effects of context on inci‐dental vocabulary learning. Reading in a Foreign Language, 20(2), 232‐245. Retrieved from nflrc.hawaii.edu/rfl/October2008/webb/webb.pdf
| M
AR
INE
FR
ON
TIE
R @
UniK
L
29 MIMET Technical Bulletin Volume 2 (1) 2011
Feature Article 5 Feature Article 5
EXPLORATION OF OFFSHORE FISHING BY INTERGRATED OFFSHORE FISHING VESSEL CONCEPT (IOFVC) IN MALAYSIA
ASMAWI ABDUL MALIK* Department of Marine Construction and Maintenance Technology
Malaysian Institute of Marine Engineering Technology, Universiti Kuala Lumpur Received: 8 March 2011; Revised: 2 May 2011; Accepted: 24 May 2011
ABSTRACT This paper discusses the status of deep sea fisheries exploitation and development in Malaysia and its potential by the introduction of Integrated Offshore Fishing Vessel Concept (IOFVC). As a backdrop to this discussion, this paper begins by briefly presenting the status of the national fisheries industry and leading on to ideas on how to further develop the offshore fishing. The main part of this paper discusses a number of key areas upon which the potential development of fisheries in Malaysia especially on IOFVC and its functions in boostering the deep sea market and supply towards balancing the supply. The approach is by reducing oversaturated situation on inshore and enhances the equilibrium and sustainable protein supply from both sectors. Finally, the paper highlights the main constraints and issues pertaining to fisheries development in Malaysia.
Keywords: Integrated Offshore Fishing Vessel Concept (IOFVC),
Corresponding Author: [email protected]
INTRODUCTION
Marine fish catches are allegedly falling, spe‐cies disappearing and many other symptoms of chronic overfishing are among the main is‐sue reported. There is an assumption that overfishing of the sea creatures is to blame by given symptoms. Malaysia inshore fish re‐sources is also facing the same symtoms and it is proven by stagnant data from Department of Fishery Malaysia. It is already heavily exploited and there is evidence that inshore fishing grounds are starting to be over saturated. Two consequence study conducted in 2005 and 2006, the inshore capture fishery peaked in the last two decades and is now stable or declining, depending on the area being fished (Simon, et. al, 2005), and Department of Fish‐ery, Malaysia stated that landing from this sec‐tor (Malaysia) have peaked and is not ex‐pected to expand any futher. Simon, et. al,
(2005) also found that the increasing of “Low value/trash fish” species with various charac‐teristics which they are generally small in size, have low consumer preference and have little or no direct commercial value. Later in 2009, Green Fact has summarized in FAO, (2009) that a bit more than half of all monitored fish stocks are now fully exploited, producing catches close to their maximum sustainable limits with no room for further expansion. Over a quarter are overexploited, depleted, or slowly recovering. Likewise, according to Fish‐ery Economic October 2008 (FAO, 2008), the global fish production per capita has been de‐clining since 1980. According to a 2008 study commissioned by the World Bank and the UN Food and Agriculture Organization (FAO), the exploitation and near depletion of the ocean’s most valuable fish stocks have caused an an‐nual net loss in the value of global marine fish‐eries in the order of US$50 billion. The exces‐
| M
AR
INE
FR
ON
TIE
R @
UniK
L
30 MIMET Technical Bulletin Volume 2 (1) 2011
sive build‐up of redundant fishing fleet capacity, the deployment and mismanagement of increas‐ingly fishing technologies, and increasing pollution and habitat loss are to blame (World Bank and FAO 2008). In order to increase catch and production in fishing means the world's fishing fleets need to work harder to keep their catch rates steady under sustainable approach and methodology. Meanwhile, over a ten year period from 2000 to 2009 and as of 2nd of July 2010, the total popula‐tion of Malaysia had increased by 19.64% from 23.32 million to 27.90 million (Dept of Statistics of Malaysia, 2010). All else constant, the figure is ex‐pected to grow up to 34.22 million in 2020. How‐ever the deep sea sector has shown positive sign‐age and has further potential for development as explored by David, J., A., (2003) which is about 4% of world catches are currently taken from deep sea species (including blue whiting, scabbardfish, grenadiers, redfish, orange roughy, Greenland hali‐but and argentines). Hong, et., al., (2010) argues that enhancing the effort in such having better ves‐sel for deep sea fishing grounds where fish stocks are more abundant, take longer fishing trips and get a larger catch as well as having more choice catch will contribute to achieving a larger amount of gross revenue.
RESEARCH BACKGROUND AND THE IDEA OF IOVC Fishery is an important part of Malaysian agricul‐ture sector and it contributes quite significantly to its economy. Apart from contributing to the na‐tional Gross Domestic Product (GDP), it is a signifi‐cant source of employment and foreign exchange revenue as well as a source of cheap animal pro‐tein. It directly contributes to the country’s eco‐nomic strength through job creation and national income. 1,391 million metric tons of fish were landed in 2009 valued at RM8.583 billion and when compared to the statistic in 2008 it shows an increase of 6.56% by quantity and 16.84% by value compared to 2008. During the same year fishing has contributed 1.3% of the national GDP (JPM, 2010). However, offshore fishing only contributed 16% or 0.23 million metric tons valued at RM1.373
billion. This rather slow performance of the off‐shore fishing sector was closely related to its low productivity due to the following contributing fac‐tors : There is a high possibility that the catches were
not landed at the registered fishing ports around Malaysia but were sold to exporters while in the middle of the ocean
Globally, the illegal, unreported and unregu‐lated (IUU) fishing was seriously undermining international efforts to conserve and manage fish stocks in a sustainable manner," says Ichiro Nomura, FAO Assistant Director‐General for Fisheries. (FAO, 2004)
The number of deep‐sea fishing vessels re‐mained small when compared to those operat‐ing in the inshore waters. In 2008, only 2.5% of deep‐sea fishing vessels were licensed in Ma‐laysia. (Dept. of Fishery, Malaysia, 2008)
Intergrated Offshore Fishing Vessel Concept (IOFVC) is a genuinely new concept to be built exactly with such intention. IOFVC will bring all the services the offshore fishermen require closer to them. These services shall include fish landing terminal, packing, packaging and storage, supplies and refueling, and tourism, etc. IOFVC would be strategically anchored in the middle of the ocean, close to the offshore fishing grounds. It will be a well equipped, safe and environmentally sustainable terminal. MATERIALS AND METHODS The information on marine capture fisheries man‐agement and utilization of fishing ground in Malay‐sia (especially in the East Coast) was derived and in cooperation with and from the Malaysia Fisheries Research Institute (MFRI), Department of Fisheries Malaysia (DOF), Food and Agriculture Organization (FAO) and related papers related to the develop‐ment of IOFVC in Malaysia. The data on marine catches and landing from Peninsular Malaysia was collected from the Annual Fisheries Statistics (2000– 2009). Wherever possible, this has been comple‐mented, cross checked and compared with secon‐dary data, national fisheries and other statistics.
| M
AR
INE
FR
ON
TIE
R @
UniK
L
31 MIMET Technical Bulletin Volume 2 (1) 2011
Informal interviews (which is a quantitative ap‐proach) were conducted with skippers, crew and knowledgeable key informants of fishing units who were specifically selected for their perceived re‐sponsiveness. THE STATUS OF MALAYSIA FISHING INDUSTRY A. Malaysia on the Map Malaysia is located at Latitude: 2º30´ North of the Equator and Longitude: 112º30´ East of Greenwich which lies in South East Asia (CIA World Fact Book, 2011). Mainly the country is di‐vided into two parts separated by the South China Sea. West Malaysia is known also as Peninsular Malaysia while the other side of the sea is known as East Malaysia formed by the states of Sabah and Sarawak. It is part of Borneo Island, located 1200 km to the east of the Peninsular across the South China Sea. The east coast of West Malaysia faces the South China Sea, as with Sarawak, and the western part of Sabah.
B. Malaysia Fisheries In 1996, overall fish production was 1,126,689 tonnes valued at RM3.3 billion. From this 994,144 tonnes were from coastal fisheries, 132,545 ton‐nes from deep sea fishing and 109,462 tonnes contributed by the aquaculture sub‐sector. The value of the 1996 fish production made up about 2.3% of the national GDP or some 3.5% of the ag‐riculture GDP. In terms of labour employment, there were 79,616 fishermen active in the sector. Then in 14 years time, according FAO (2009), 1,391 million metric tons of fish were landed in 2009 valued at RM8.583 billion and when com‐pared to the statistic in 2008 it shows an increase of 6.56% by quantity and 16.84% by value. During the same year fishing has contributed 1.3% of the national GDP (JPM, 2010). On the other hand, offshore fishing only contrib‐utes a 16% or 0.23 million metric tons valued at RM1.373 billion. Comparison the official landed fishery catch of 1996 and 2009, Malaysia is con‐
sidered as a net importer of fish in terms of vol‐ume and an exporter in monetary terms in order to accommodate of Malaysian protein intake from fish. In fishery and aquaculture report by FAO (2009), Malaysian Government is urged to make further expansion of capture fisheries that would need to come from the offshore subsector. It has been estimated that the potential yield from the offshore areas is slightly over 400 000 tonnes. Given the present level of landings, the scope for an increase in landings is quite limited. The contri‐bution from the coastal fisheries has remained fairly static lately at around 1.2 million tonnes based on official data given by Department of Fish‐ery of Malaysia. It is generally well accepted that the coastal fishery resources have been fully ex‐ploited. According to DOF (2009) report of fishery status (based on fishing gears) as in Table 1.1 and Table 1.2; the registered vessels of Trawlers (above 70 GRT) is 1,377 vessels and on Purse Seiners (above 70 GRT) is 1308 vessels in the West Coast of Penin‐sular Malaysia against the East Coast Peninsular of Malaysia with 1439 vessel for Trawlers and 1,710 vessels for Purse Seiners. Comparing the figures of Table 1.1 against those of Table 1.2; the fishing ef‐fort in East Coast of Peninsular Malaysia has re‐duced by 19.7% on Trawls Net and 42.6% on Purse Seiner effort given for deep sea fishing. Most of the deep sea fishing is carried out by purse seiners larger than 70 GRT which use FADs (lights and payao‐like devices). According to the author’s quantitative study which is based on informal inter‐view processes, most of the deep sea fishing vessels actually operated not far from 30 nautical miles limit. The true deep sea fishing vessels, which are those that can operate far out in the 200‐mile EEZ and which are 100 GRT and bigger, are only 4 in numbers and operated off the West Coast of Penin‐sular Malaysia. Based on fishery and aquaculture report by FAO (2009), it has been predicted that the South China Sea (in the EEZ waters) has a potential yield from the offshore areas of more than 400 000 tonnes and of that pelagic resources about 100,000
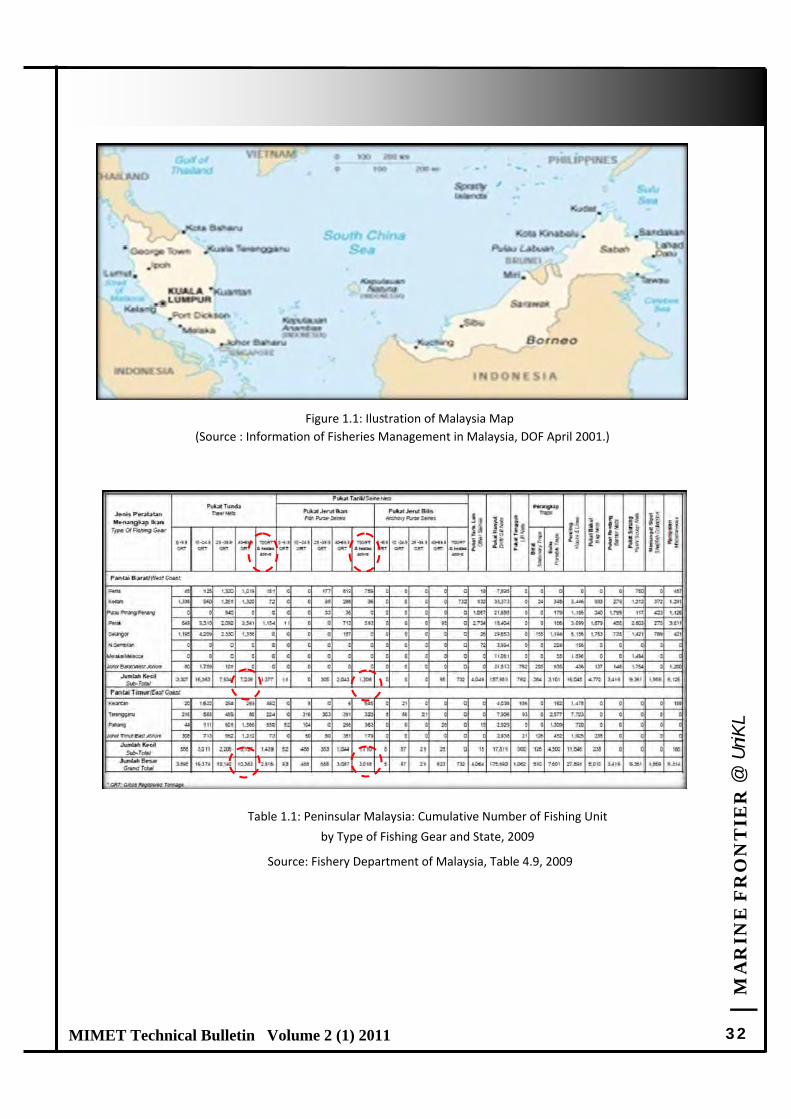
| M
AR
INE
FR
ON
TIE
R @
UniK
L
32 MIMET Technical Bulletin Volume 2 (1) 2011
Figure 1.1: Ilustration of Malaysia Map
(Source : Information of Fisheries Management in Malaysia, DOF April 2001.)
Table 1.1: Peninsular Malaysia: Cumulative Number of Fishing Unit
by Type of Fishing Gear and State, 2009
Source: Fishery Department of Malaysia, Table 4.9, 2009
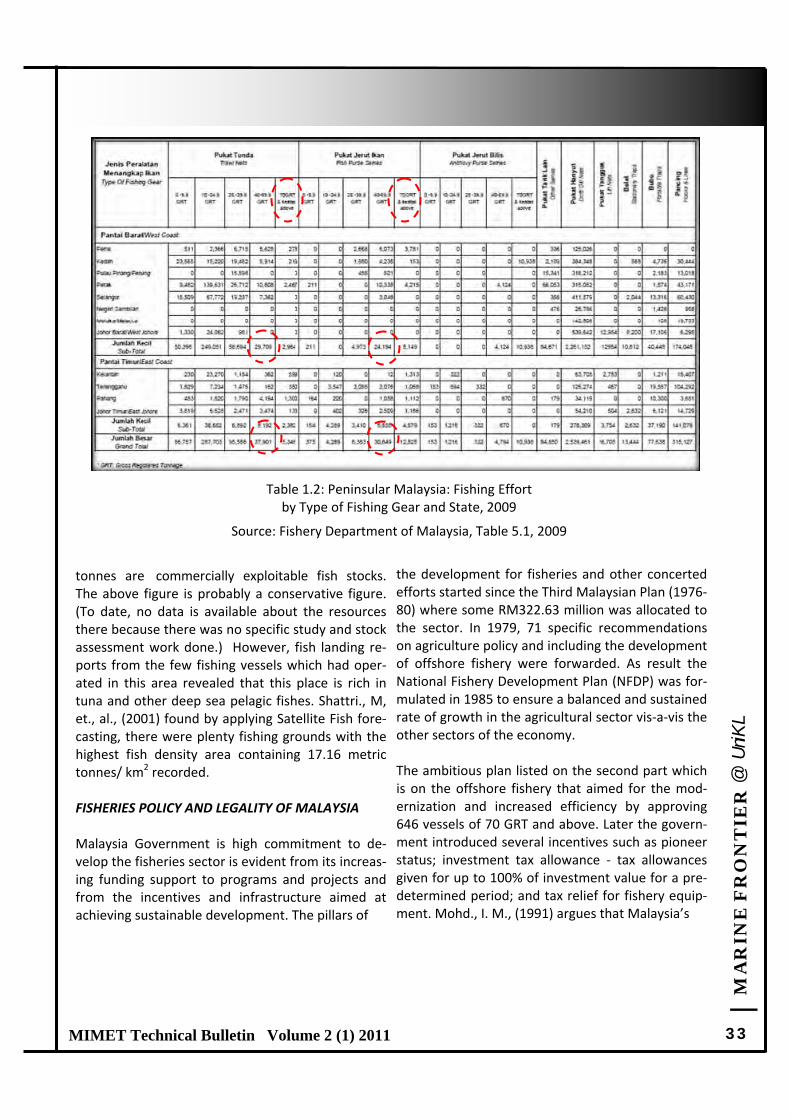
| M
AR
INE
FR
ON
TIE
R @
UniK
L
33 MIMET Technical Bulletin Volume 2 (1) 2011
tonnes are commercially exploitable fish stocks. The above figure is probably a conservative figure. (To date, no data is available about the resources there because there was no specific study and stock assessment work done.) However, fish landing re‐ports from the few fishing vessels which had oper‐ated in this area revealed that this place is rich in tuna and other deep sea pelagic fishes. Shattri., M, et., al., (2001) found by applying Satellite Fish fore‐casting, there were plenty fishing grounds with the highest fish density area containing 17.16 metric tonnes/ km2 recorded. FISHERIES POLICY AND LEGALITY OF MALAYSIA Malaysia Government is high commitment to de‐velop the fisheries sector is evident from its increas‐ing funding support to programs and projects and from the incentives and infrastructure aimed at achieving sustainable development. The pillars of
the development for fisheries and other concerted efforts started since the Third Malaysian Plan (1976‐80) where some RM322.63 million was allocated to the sector. In 1979, 71 specific recommendations on agriculture policy and including the development of offshore fishery were forwarded. As result the National Fishery Development Plan (NFDP) was for‐mulated in 1985 to ensure a balanced and sustained rate of growth in the agricultural sector vis‐a‐vis the other sectors of the economy. The ambitious plan listed on the second part which is on the offshore fishery that aimed for the mod‐ernization and increased efficiency by approving 646 vessels of 70 GRT and above. Later the govern‐ment introduced several incentives such as pioneer status; investment tax allowance ‐ tax allowances given for up to 100% of investment value for a pre‐determined period; and tax relief for fishery equip‐ment. Mohd., I. M., (1991) argues that Malaysia’s
Table 1.2: Peninsular Malaysia: Fishing Effort by Type of Fishing Gear and State, 2009
Source: Fishery Department of Malaysia, Table 5.1, 2009
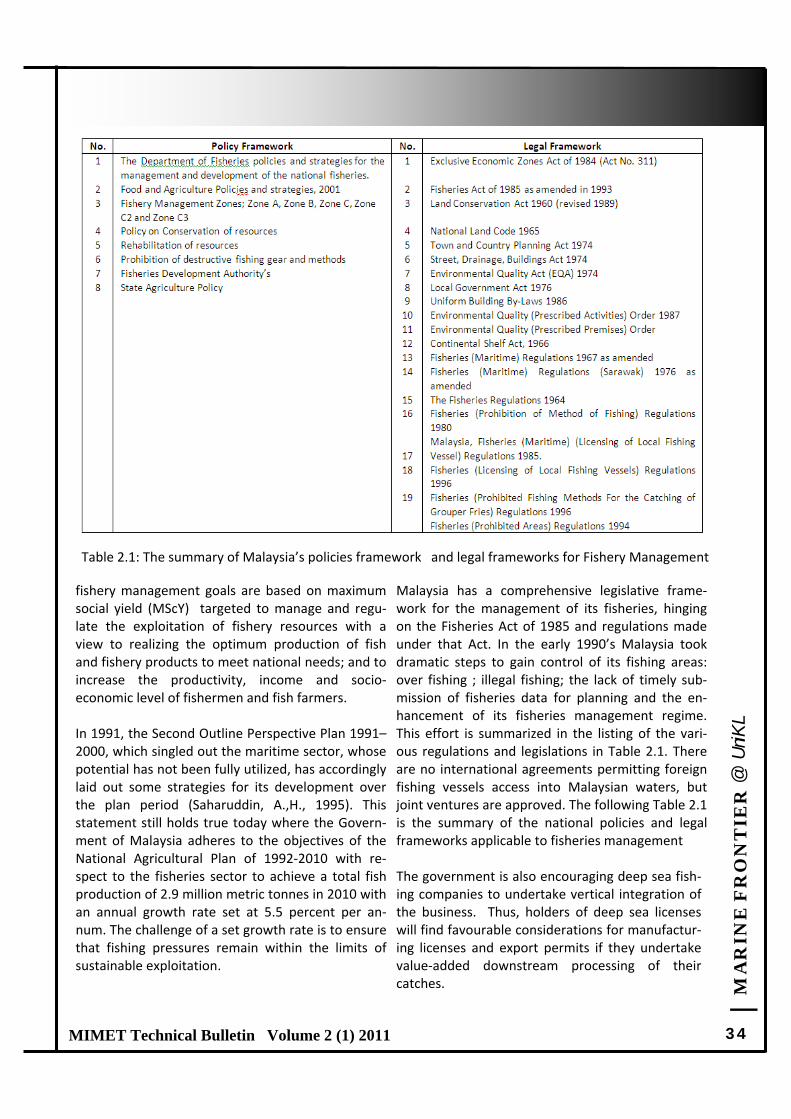
| M
AR
INE
FR
ON
TIE
R @
UniK
L
34 MIMET Technical Bulletin Volume 2 (1) 2011
fishery management goals are based on maximum social yield (MScY) targeted to manage and regu‐late the exploitation of fishery resources with a view to realizing the optimum production of fish and fishery products to meet national needs; and to increase the productivity, income and socio‐economic level of fishermen and fish farmers. In 1991, the Second Outline Perspective Plan 1991–2000, which singled out the maritime sector, whose potential has not been fully utilized, has accordingly laid out some strategies for its development over the plan period (Saharuddin, A.,H., 1995). This statement still holds true today where the Govern‐ment of Malaysia adheres to the objectives of the National Agricultural Plan of 1992‐2010 with re‐spect to the fisheries sector to achieve a total fish production of 2.9 million metric tonnes in 2010 with an annual growth rate set at 5.5 percent per an‐num. The challenge of a set growth rate is to ensure that fishing pressures remain within the limits of sustainable exploitation.
Malaysia has a comprehensive legislative frame‐work for the management of its fisheries, hinging on the Fisheries Act of 1985 and regulations made under that Act. In the early 1990’s Malaysia took dramatic steps to gain control of its fishing areas: over fishing ; illegal fishing; the lack of timely sub‐mission of fisheries data for planning and the en‐hancement of its fisheries management regime. This effort is summarized in the listing of the vari‐ous regulations and legislations in Table 2.1. There are no international agreements permitting foreign fishing vessels access into Malaysian waters, but joint ventures are approved. The following Table 2.1 is the summary of the national policies and legal frameworks applicable to fisheries management The government is also encouraging deep sea fish‐ing companies to undertake vertical integration of the business. Thus, holders of deep sea licenses will find favourable considerations for manufactur‐ing licenses and export permits if they undertake value‐added downstream processing of their catches.
Table 2.1: The summary of Malaysia’s policies framework and legal frameworks for Fishery Management
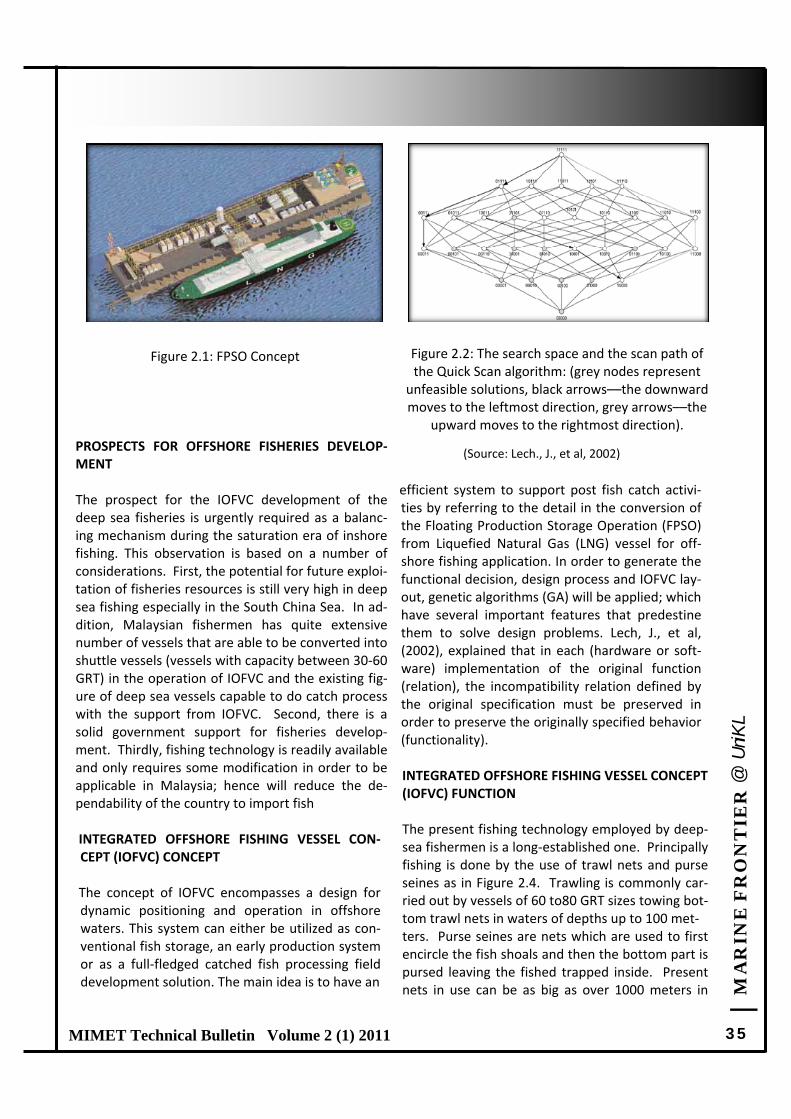
| M
AR
INE
FR
ON
TIE
R @
UniK
L
35 MIMET Technical Bulletin Volume 2 (1) 2011
PROSPECTS FOR OFFSHORE FISHERIES DEVELOP‐MENT The prospect for the IOFVC development of the deep sea fisheries is urgently required as a balanc‐ing mechanism during the saturation era of inshore fishing. This observation is based on a number of considerations. First, the potential for future exploi‐tation of fisheries resources is still very high in deep sea fishing especially in the South China Sea. In ad‐dition, Malaysian fishermen has quite extensive number of vessels that are able to be converted into shuttle vessels (vessels with capacity between 30‐60 GRT) in the operation of IOFVC and the existing fig‐ure of deep sea vessels capable to do catch process with the support from IOFVC. Second, there is a solid government support for fisheries develop‐ment. Thirdly, fishing technology is readily available and only requires some modification in order to be applicable in Malaysia; hence will reduce the de‐pendability of the country to import fish INTEGRATED OFFSHORE FISHING VESSEL CON‐CEPT (IOFVC) CONCEPT The concept of IOFVC encompasses a design for dynamic positioning and operation in offshore waters. This system can either be utilized as con‐ventional fish storage, an early production system or as a full‐fledged catched fish processing field development solution. The main idea is to have an
efficient system to support post fish catch activi‐ties by referring to the detail in the conversion of the Floating Production Storage Operation (FPSO) from Liquefied Natural Gas (LNG) vessel for off‐shore fishing application. In order to generate the functional decision, design process and IOFVC lay‐out, genetic algorithms (GA) will be applied; which have several important features that predestine them to solve design problems. Lech, J., et al, (2002), explained that in each (hardware or soft‐ware) implementation of the original function (relation), the incompatibility relation defined by the original specification must be preserved in order to preserve the originally specified behavior (functionality). INTEGRATED OFFSHORE FISHING VESSEL CONCEPT (IOFVC) FUNCTION The present fishing technology employed by deep‐sea fishermen is a long‐established one. Principally fishing is done by the use of trawl nets and purse seines as in Figure 2.4. Trawling is commonly car‐ried out by vessels of 60 to80 GRT sizes towing bot‐tom trawl nets in waters of depths up to 100 met‐ ters. Purse seines are nets which are used to first encircle the fish shoals and then the bottom part is pursed leaving the fished trapped inside. Present nets in use can be as big as over 1000 meters in
Figure 2.1: FPSO Concept Figure 2.2: The search space and the scan path of the Quick Scan algorithm: (grey nodes represent
unfeasible solutions, black arrows––the downward moves to the leftmost direction, grey arrows––the
upward moves to the rightmost direction).
(Source: Lech., J., et al, 2002)
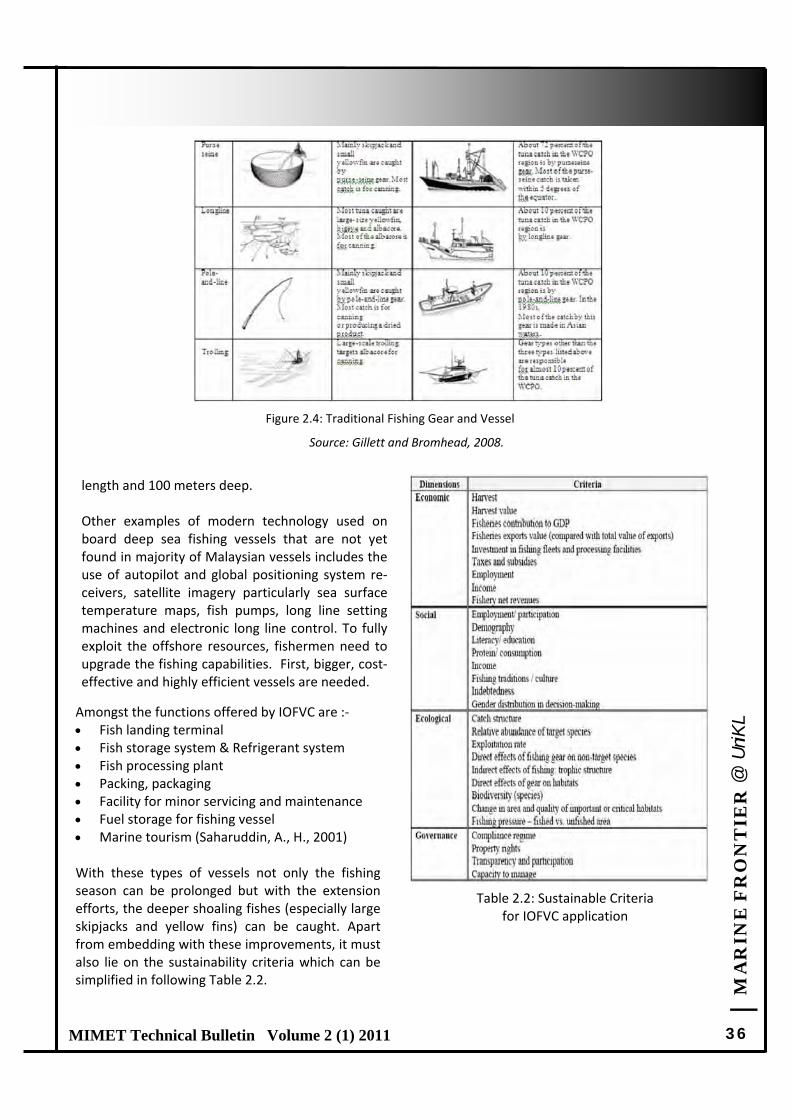
| M
AR
INE
FR
ON
TIE
R @
UniK
L
36 MIMET Technical Bulletin Volume 2 (1) 2011
length and 100 meters deep. Other examples of modern technology used on board deep sea fishing vessels that are not yet found in majority of Malaysian vessels includes the use of autopilot and global positioning system re‐ceivers, satellite imagery particularly sea surface temperature maps, fish pumps, long line setting machines and electronic long line control. To fully exploit the offshore resources, fishermen need to upgrade the fishing capabilities. First, bigger, cost‐effective and highly efficient vessels are needed.
Amongst the functions offered by IOFVC are :‐ Fish landing terminal Fish storage system & Refrigerant system Fish processing plant Packing, packaging Facility for minor servicing and maintenance Fuel storage for fishing vessel Marine tourism (Saharuddin, A., H., 2001) With these types of vessels not only the fishing season can be prolonged but with the extension efforts, the deeper shoaling fishes (especially large skipjacks and yellow fins) can be caught. Apart from embedding with these improvements, it must also lie on the sustainability criteria which can be simplified in following Table 2.2.
Figure 2.4: Traditional Fishing Gear and Vessel
Source: Gillett and Bromhead, 2008.
Table 2.2: Sustainable Criteria for IOFVC application
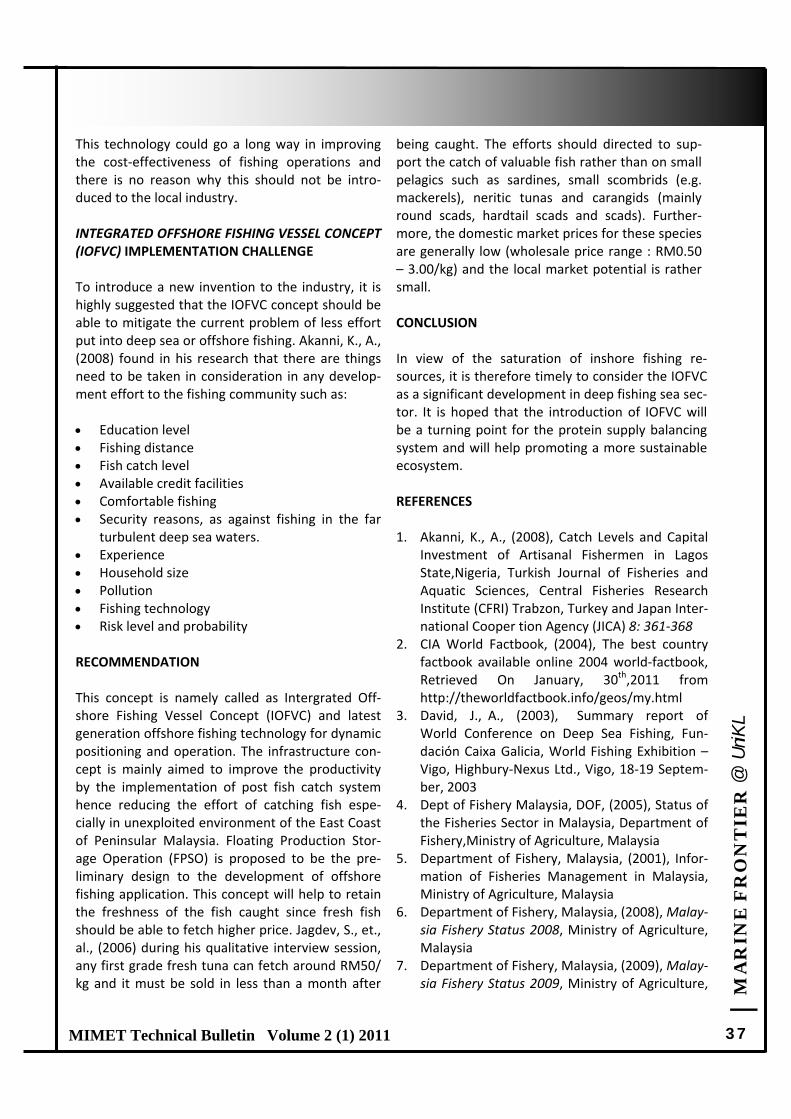
| M
AR
INE
FR
ON
TIE
R @
UniK
L
37 MIMET Technical Bulletin Volume 2 (1) 2011
This technology could go a long way in improving the cost‐effectiveness of fishing operations and there is no reason why this should not be intro‐duced to the local industry. INTEGRATED OFFSHORE FISHING VESSEL CONCEPT (IOFVC) IMPLEMENTATION CHALLENGE To introduce a new invention to the industry, it is highly suggested that the IOFVC concept should be able to mitigate the current problem of less effort put into deep sea or offshore fishing. Akanni, K., A., (2008) found in his research that there are things need to be taken in consideration in any develop‐ment effort to the fishing community such as: Education level Fishing distance Fish catch level Available credit facilities Comfortable fishing Security reasons, as against fishing in the far
turbulent deep sea waters. Experience Household size Pollution Fishing technology Risk level and probability RECOMMENDATION This concept is namely called as Intergrated Off‐shore Fishing Vessel Concept (IOFVC) and latest generation offshore fishing technology for dynamic positioning and operation. The infrastructure con‐cept is mainly aimed to improve the productivity by the implementation of post fish catch system hence reducing the effort of catching fish espe‐cially in unexploited environment of the East Coast of Peninsular Malaysia. Floating Production Stor‐age Operation (FPSO) is proposed to be the pre‐liminary design to the development of offshore fishing application. This concept will help to retain the freshness of the fish caught since fresh fish should be able to fetch higher price. Jagdev, S., et., al., (2006) during his qualitative interview session, any first grade fresh tuna can fetch around RM50/kg and it must be sold in less than a month after
being caught. The efforts should directed to sup‐port the catch of valuable fish rather than on small pelagics such as sardines, small scombrids (e.g. mackerels), neritic tunas and carangids (mainly round scads, hardtail scads and scads). Further‐more, the domestic market prices for these species are generally low (wholesale price range : RM0.50 – 3.00/kg) and the local market potential is rather small. CONCLUSION In view of the saturation of inshore fishing re‐sources, it is therefore timely to consider the IOFVC as a significant development in deep fishing sea sec‐tor. It is hoped that the introduction of IOFVC will be a turning point for the protein supply balancing system and will help promoting a more sustainable ecosystem. REFERENCES 1. Akanni, K., A., (2008), Catch Levels and Capital
Investment of Artisanal Fishermen in Lagos State,Nigeria, Turkish Journal of Fisheries and Aquatic Sciences, Central Fisheries Research Institute (CFRI) Trabzon, Turkey and Japan Inter‐national Cooper tion Agency (JICA) 8: 361‐368
2. CIA World Factbook, (2004), The best country factbook available online 2004 world‐factbook, Retrieved On January, 30th,2011 from http://theworldfactbook.info/geos/my.html
3. David, J., A., (2003), Summary report of World Conference on Deep Sea Fishing, Fun‐dación Caixa Galicia, World Fishing Exhibition – Vigo, Highbury‐Nexus Ltd., Vigo, 18‐19 Septem‐ber, 2003
4. Dept of Fishery Malaysia, DOF, (2005), Status of the Fisheries Sector in Malaysia, Department of Fishery,Ministry of Agriculture, Malaysia
5. Department of Fishery, Malaysia, (2001), Infor‐mation of Fisheries Management in Malaysia, Ministry of Agriculture, Malaysia
6. Department of Fishery, Malaysia, (2008), Malay‐sia Fishery Status 2008, Ministry of Agriculture, Malaysia
7. Department of Fishery, Malaysia, (2009), Malay‐sia Fishery Status 2009, Ministry of Agriculture,
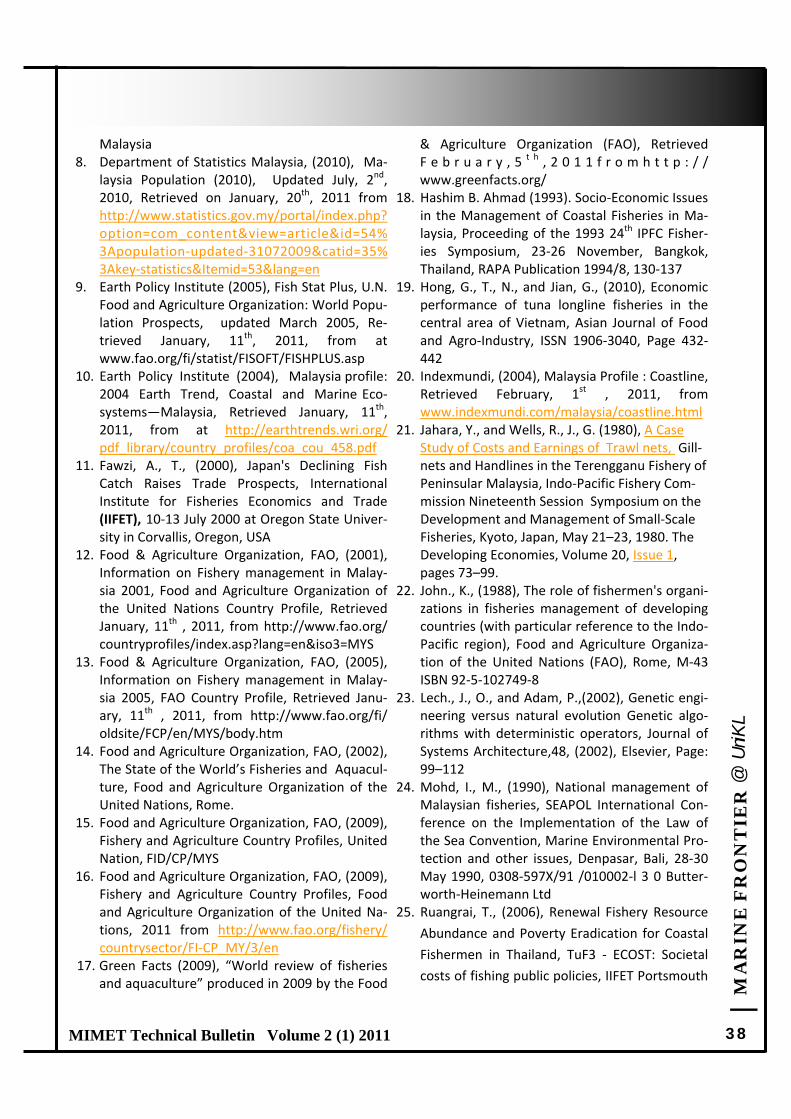
| M
AR
INE
FR
ON
TIE
R @
UniK
L
38 MIMET Technical Bulletin Volume 2 (1) 2011
Malaysia 8. Department of Statistics Malaysia, (2010), Ma‐
laysia Population (2010), Updated July, 2nd, 2010, Retrieved on January, 20th, 2011 from http://www.statistics.gov.my/portal/index.php?option=com_content&view=article&id=54%3Apopulation‐updated‐31072009&catid=35%3Akey‐statistics&Itemid=53&lang=en
9. Earth Policy Institute (2005), Fish Stat Plus, U.N. Food and Agriculture Organization: World Popu‐lation Prospects, updated March 2005, Re‐trieved January, 11th, 2011, from at www.fao.org/fi/statist/FISOFT/FISHPLUS.asp
10. Earth Policy Institute (2004), Malaysia profile: 2004 Earth Trend, Coastal and Marine Eco‐systems—Malaysia, Retrieved January, 11th, 2011, from at http://earthtrends.wri.org/pdf_library/country_profiles/coa_cou_458.pdf
11. Fawzi, A., T., (2000), Japan's Declining Fish Catch Raises Trade Prospects, International Institute for Fisheries Economics and Trade (IIFET), 10‐13 July 2000 at Oregon State Univer‐sity in Corvallis, Oregon, USA
12. Food & Agriculture Organization, FAO, (2001), Information on Fishery management in Malay‐sia 2001, Food and Agriculture Organization of the United Nations Country Profile, Retrieved January, 11th , 2011, from http://www.fao.org/countryprofiles/index.asp?lang=en&iso3=MYS
13. Food & Agriculture Organization, FAO, (2005), Information on Fishery management in Malay‐sia 2005, FAO Country Profile, Retrieved Janu‐ary, 11th , 2011, from http://www.fao.org/fi/oldsite/FCP/en/MYS/body.htm
14. Food and Agriculture Organization, FAO, (2002), The State of the World’s Fisheries and Aquacul‐ture, Food and Agriculture Organization of the United Nations, Rome.
15. Food and Agriculture Organization, FAO, (2009), Fishery and Agriculture Country Profiles, United Nation, FID/CP/MYS
16. Food and Agriculture Organization, FAO, (2009), Fishery and Agriculture Country Profiles, Food and Agriculture Organization of the United Na‐tions, 2011 from http://www.fao.org/fishery/countrysector/FI‐CP_MY/3/en
17. Green Facts (2009), “World review of fisheries and aquaculture” produced in 2009 by the Food
& Agriculture Organization (FAO), Retrieved F e b r u a r y , 5 t h , 2 0 1 1 f r o m h t t p : / /www.greenfacts.org/
18. Hashim B. Ahmad (1993). Socio‐Economic Issues in the Management of Coastal Fisheries in Ma‐laysia, Proceeding of the 1993 24th IPFC Fisher‐ies Symposium, 23‐26 November, Bangkok, Thailand, RAPA Publication 1994/8, 130‐137
19. Hong, G., T., N., and Jian, G., (2010), Economic performance of tuna longline fisheries in the central area of Vietnam, Asian Journal of Food and Agro‐Industry, ISSN 1906‐3040, Page 432‐442
20. Indexmundi, (2004), Malaysia Profile : Coastline, Retrieved February, 1st , 2011, from www.indexmundi.com/malaysia/coastline.html
21. Jahara, Y., and Wells, R., J., G. (1980), A Case Study of Costs and Earnings of Trawl nets, Gill‐nets and Handlines in the Terengganu Fishery of Peninsular Malaysia, Indo‐Pacific Fishery Com‐mission Nineteenth Session Symposium on the Development and Management of Small‐Scale Fisheries, Kyoto, Japan, May 21–23, 1980. The Developing Economies, Volume 20, Issue 1, pages 73–99.
22. John., K., (1988), The role of fishermen's organi‐zations in fisheries management of developing countries (with particular reference to the Indo‐Pacific region), Food and Agriculture Organiza‐tion of the United Nations (FAO), Rome, M‐43 ISBN 92‐5‐102749‐8
23. Lech., J., O., and Adam, P.,(2002), Genetic engi‐neering versus natural evolution Genetic algo‐rithms with deterministic operators, Journal of Systems Architecture,48, (2002), Elsevier, Page: 99–112
24. Mohd, I., M., (1990), National management of Malaysian fisheries, SEAPOL International Con‐ference on the Implementation of the Law of the Sea Convention, Marine Environmental Pro‐tection and other issues, Denpasar, Bali, 28‐30 May 1990, 0308‐597X/91 /010002‐l 3 0 Butter‐worth‐Heinemann Ltd
25. Ruangrai, T., (2006), Renewal Fishery Resource
Abundance and Poverty Eradication for Coastal
Fishermen in Thailand, TuF3 ‐ ECOST: Societal
costs of fishing public policies, IIFET Portsmouth
| M
AR
INE
FR
ON
TIE
R @
UniK
L
39 MIMET Technical Bulletin Volume 2 (1) 2011
Proceedings 26. Saharuddin, A., H., (1995). Development and
management of Malaysian Marine, Technical Conservation Measures, Elsevier Science, Great Britain, Vol. 19, No. 2, page. 115‐126
27. Sea Production, (2007), Generic FPSO Con‐cept, Retrieved on February, 15th, 2011 from http://www.seaproduction.no/index.php?n a m e = F P S O _ C a n d i d a t e s /Generic_FPSO_Concept
28. Shattri, M., Tan, C., K., Ibrahim, H., M., and Rashid, A., M., S., (2001), Satellite Fish Forecast‐ing In South China Sea, 22nd Asian Conference on Remote Sensing, 5‐9 November 2001, Singa‐pore
29. Simon, F., S., Erik, L., and Derek, S., (2005). Asian fisheries today: The production and use of low value/trash fish from marine fisheries in the Asia‐Pacific region, Food and Agriculture Organ‐
zation of The United Nations, Regional office for Asia and the Pacific.
30. Titto, D., S., (2004), Artisanal Deep‐Sea Fishing in Kerala: Prospects and problems (Discussion Paper Number 74), Kerala Research Programme on Local Level Development, Centre for Devel‐opment Studies, Prasanth Nagar, Ulloor, Thiru‐vananthapuram, ISBN No: 81‐87621‐77‐X
31. United Nations Food and Agriculture Organiza‐tion, FAO, (2008), Marine Fishing Industry Los‐ing $50 Billion Annually, Retrieved January, 26th, 2011,fromhttp://www.digitaljournal.com/article/260998#tab=comments&sc=0
32. United Nation Convention of Law of the Sea, UNCLOS, (1994), UNCLOS 3, Oceans and law of the sea, Division for Ocean Affairs and Law of the Sea
33. United Nation Convention of Law of the Sea, UNCLOS, (1984), Zone/EEZ, Act Number 311
| M
AR
INE
FR
ON
TIE
R @
UniK
L
40 MIMET Technical Bulletin Volume 2 (1) 2011
Feature Article 6 Feature Article 6
TREND ANALYSIS OF SEA LEVEL RISE FOR WEST COAST OF PENINSULAR MALAYSIA (PULAU PINANG)
AZURA BINTI AHMAD RADZI*, PROF. HADIBAH BINTI ISMAIL
Department of Applied Sciences & Advanced Technology Malaysian Institute of Marine Engineering Technology, Universiti Kuala Lumpur Coastal and Offshore Engineering Institute, Faculty of Civil Engineering,
Universiti Teknologi Malaysia Received: 15 Jan 2011; Revised: 15 Feb 2011; Accepted: 23 Feb 2011
ABSTRACT Future sea level rise would be expected to have a number of impacts, particularly on Malaysia coastal systems such as flooding and inundation, coastal erosion and salt water intrusion. This study analyzes the trend variation of sea level rise for selected locations along the West Coast of Peninsular Malaysia. Furthermore, rate of future SLR at selected station which is in Teluk Ewa, Langkawi will be predicted in the year 2050 and 2100. This study also examines the trend of sea level rise throughout the Straits of Malacca. The historical mean sea level data from the selected stations were used in the trend analysis. In this study, the non‐parametric Mann Kendal test was carried out to determine trends in sea level rise. From the analysis, the result shows that the SLR rate in Teluk Ewa, Langkawi is in incremental trend. The future pro‐jections of the trend line for an estimate SLR in the year 2050 and 2100, for all the selected station exhibit an increment in sea level rise. In 2050, the incremental SLR is 9.175 cm Subsequently, in 2100 the highest increment in SLR is 19.595 cm. The trend analysis and the future projection also have proven that the Straits of Malacca will experience a rise in sea level in 2050 and 2100.
Keywords : sea level rise, trend analysis, prediction, Straits of Malacca
Corresponding Author: [email protected]
INTRODUCTION
Sea level can change, both globally and locally, due to (i) changes in the shape of the ocean basins, (ii) changes in the total mass of water and (iii) changes in water density. Global mean sea level (MSL) has been rising since the end of the last ice age almost 18,000 years ago. Factors leading to sea level rise (SLR) under global warming include both increases in the total mass of water from the melting of land‐based snow and ice, and changes in water density from an increase in ocean water temperatures and salinity changes. As the world's oceans rise, low‐lying coastal ar‐eas will disappear. Flooding of coastal areas will become more common and more severe as storm surges have easier access to these lower‐lying areas. The occurrence of extreme high wa‐ter events related to storm surges, high tides,
surface waves, and flooding rivers will also in‐crease. Flooding and loss of land will have sig‐nificant impacts on humans, wildlife, and entire ecosystems.
PROBLEM STATEMENT Malaysia is a coastal nation, rich in biodiversity and natural resources. The country covers an area of 329,750 km2 with a coastline of 4809 km and is divided into two landmasses that are separated by the South China Sea. Peninsular Malaysia, in the west, has an area of 131,590 km2 and a coastline of 2031 km. Peninsular Ma‐laysia comprises 11 states and the Federal Terri‐tory of Kuala Lumpur. Two other states, Sabah and Sarawak, occupy an area of 73,711 km2 and 124,449 km2 respectively, and the Federal Terri‐tory of Labuan is located in the northwestern coast of Borneo island. Sabah has a coastline of 1743 km while Sarawak has a coastline of
| M
AR
INE
FR
ON
TIE
R @
UniK
L
41 MIMET Technical Bulletin Volume 2 (1) 2011
1035 km. The major towns, ports, large agriculture and aquaculture projects of Malaysia’s coast con‐tribute significantly to the nation’s economic de‐velopment. It is anticipated that the physical and economic impact for the whole nation of a green‐house‐induced sea level rise could be devastating. According to J.E Ong (2000) as quoted from Geyh et.al (1972), Kamaludin (1989) and Peltier & Tushingam (1989), there is good geological evi‐dence that showed over the last 5,000 years, sea level around Malaysian coast has been falling at a mean rate of about 1 mm/yr and the global tidal level is dropping at 2.4 ± 0.9 mm/yr. Meanwhile, the sedimentation rate which appears to be play‐ing a critical role in relative sea level change in Ma‐laysia is in the region of a few millimeters per year. In more recent finding, Malaysia sea level has risen at an average rate of 1.25 mm/yr over 1986 to 2006 (Initial National Communication, 2000 and National Coastal Vulnerability Index Study, DID, 2007). All of the above findings are signals to show that Malaysia coastal system might be vulnerable to SLR. Therefore, there is indication of the ur‐gency for Malaysia as one of the coastal nations to begin the progression of adapting to sea level rise not because there is an awaiting catastrophe, but because there are opportunities to avoid unpleas‐ant impacts by acting now, opportunities that may be lost if the process is delayed. Unfortunately, there is lack of official indication or measurement has been done in Malaysia on SLR. Hence, how should Malaysians prepare for sea level rise? Thus, this particular study is required to analyze the trend variation of SLR for selected locations along West Coast of Peninsular Malaysia and to predict SLR in the year 2050 & 2100 so that the conse‐quences of SLR can be reduced through a proper management and implementation of adaptation and mitigation measures. OBJECTIVES OF STUDY The objectives of this study are: i. To analyze the trend variation of sea level rise
for selected location in Peninsular Malaysia which is Teluk Ewa, Langkawi.
ii. To predict sea level rise for these locations in the year 2050 and 2100.
SCOPE OF THE STUDY The scope of this study can best be described as follows: i. A review of all literatures related to trend analy‐
sis methodologies and to apply the most suit‐able technique in the analysis for Teluk Ewa, Langkawi Station.
ii. Collection of data (tidal records) for all selected stations will be used for the purpose of trend analysis.
iii. Conduct of the selected methodology for the sea level rise trend analysis and prediction for the year 2050 and 2100.
STUDY AREA In this study, six locations along the West Coast of Peninsular Malaysia are selected for the purpose of trend analysis. The locations are Langkawi, Penang, Lumut, Port Klang, Tanjung Keling and Kukup. The locations are selected based on the existing tidal gauge stations along the West Coast of Peninsular Malaysia. Figure 1 below shows the selected loca‐tions. LITERATURE REVIEW THE CONCEPTUAL UNDERSTANDING OF SEA LEVEL RISE Sea level rise is due to a number of causes, some of which may exert a more regional influence than others. These include:
Thermal expansion – As seawater becomes warmer it expands. Heat in the upper layer of the ocean is released quickly into the atmos‐phere. However, heat absorbed by the deeper layers of the ocean will take much longer to be released and therefore, will be stored in the ocean much longer and have significant impacts on future ocean warming.
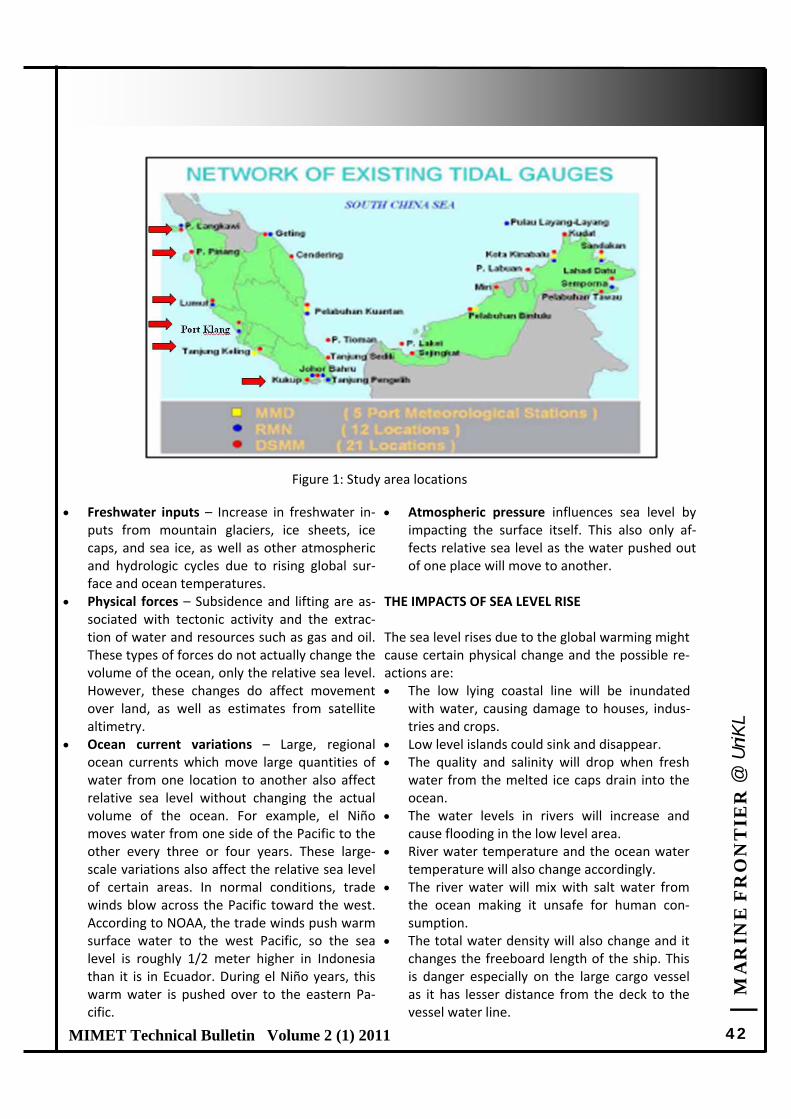
| M
AR
INE
FR
ON
TIE
R @
UniK
L
42 MIMET Technical Bulletin Volume 2 (1) 2011
Freshwater inputs – Increase in freshwater in‐
puts from mountain glaciers, ice sheets, ice caps, and sea ice, as well as other atmospheric and hydrologic cycles due to rising global sur‐face and ocean temperatures.
Physical forces – Subsidence and lifting are as‐sociated with tectonic activity and the extrac‐tion of water and resources such as gas and oil. These types of forces do not actually change the volume of the ocean, only the relative sea level. However, these changes do affect movement over land, as well as estimates from satellite altimetry.
Ocean current variations – Large, regional ocean currents which move large quantities of water from one location to another also affect relative sea level without changing the actual volume of the ocean. For example, el Niño moves water from one side of the Pacific to the other every three or four years. These large‐scale variations also affect the relative sea level of certain areas. In normal conditions, trade winds blow across the Pacific toward the west. According to NOAA, the trade winds push warm surface water to the west Pacific, so the sea level is roughly 1/2 meter higher in Indonesia than it is in Ecuador. During el Niño years, this warm water is pushed over to the eastern Pa‐cific.
Atmospheric pressure influences sea level by impacting the surface itself. This also only af‐fects relative sea level as the water pushed out of one place will move to another.
THE IMPACTS OF SEA LEVEL RISE
The sea level rises due to the global warming might cause certain physical change and the possible re‐actions are: The low lying coastal line will be inundated
with water, causing damage to houses, indus‐tries and crops.
Low level islands could sink and disappear. The quality and salinity will drop when fresh
water from the melted ice caps drain into the ocean.
The water levels in rivers will increase and cause flooding in the low level area.
River water temperature and the ocean water temperature will also change accordingly.
The river water will mix with salt water from the ocean making it unsafe for human con‐sumption.
The total water density will also change and it changes the freeboard length of the ship. This is danger especially on the large cargo vessel as it has lesser distance from the deck to the vessel water line.
Figure 1: Study area locations
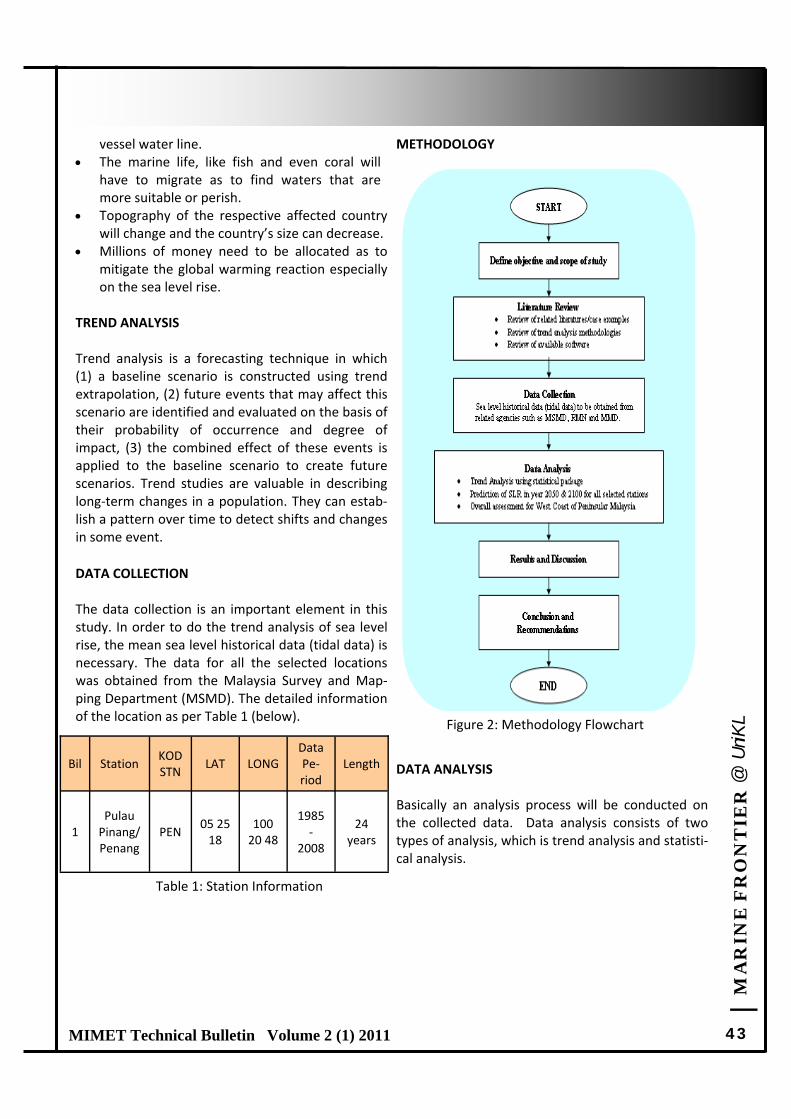
| M
AR
INE
FR
ON
TIE
R @
UniK
L
43 MIMET Technical Bulletin Volume 2 (1) 2011
vessel water line. The marine life, like fish and even coral will
have to migrate as to find waters that are more suitable or perish.
Topography of the respective affected country will change and the country’s size can decrease.
Millions of money need to be allocated as to mitigate the global warming reaction especially on the sea level rise.
TREND ANALYSIS Trend analysis is a forecasting technique in which (1) a baseline scenario is constructed using trend extrapolation, (2) future events that may affect this scenario are identified and evaluated on the basis of their probability of occurrence and degree of impact, (3) the combined effect of these events is applied to the baseline scenario to create future scenarios. Trend studies are valuable in describing long‐term changes in a population. They can estab‐lish a pattern over time to detect shifts and changes in some event.
DATA COLLECTION The data collection is an important element in this study. In order to do the trend analysis of sea level rise, the mean sea level historical data (tidal data) is necessary. The data for all the selected locations was obtained from the Malaysia Survey and Map‐ping Department (MSMD). The detailed information of the location as per Table 1 (below).
METHODOLOGY
DATA ANALYSIS Basically an analysis process will be conducted on the collected data. Data analysis consists of two types of analysis, which is trend analysis and statisti‐cal analysis.
Figure 2: Methodology Flowchart
Bil Station KOD STN
LAT LONG Data Pe‐riod
Length
1
Pulau Pinang/Penang
PEN 05 25 18
100 20 48
1985 ‐
2008
24 years
Table 1: Station Information
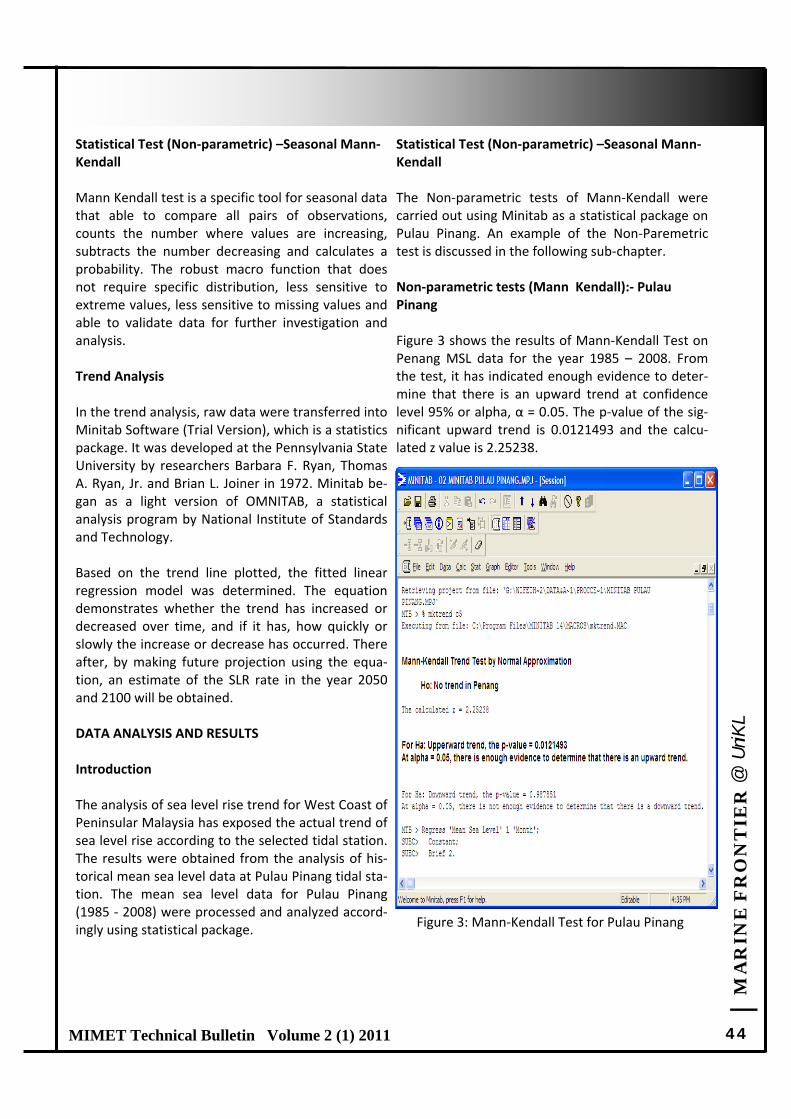
| M
AR
INE
FR
ON
TIE
R @
UniK
L
44 MIMET Technical Bulletin Volume 2 (1) 2011
Statistical Test (Non‐parametric) –Seasonal Mann‐Kendall Mann Kendall test is a specific tool for seasonal data that able to compare all pairs of observations, counts the number where values are increasing, subtracts the number decreasing and calculates a probability. The robust macro function that does not require specific distribution, less sensitive to extreme values, less sensitive to missing values and able to validate data for further investigation and analysis. Trend Analysis In the trend analysis, raw data were transferred into Minitab Software (Trial Version), which is a statistics package. It was developed at the Pennsylvania State University by researchers Barbara F. Ryan, Thomas A. Ryan, Jr. and Brian L. Joiner in 1972. Minitab be‐gan as a light version of OMNITAB, a statistical analysis program by National Institute of Standards and Technology. Based on the trend line plotted, the fitted linear regression model was determined. The equation demonstrates whether the trend has increased or decreased over time, and if it has, how quickly or slowly the increase or decrease has occurred. There after, by making future projection using the equa‐tion, an estimate of the SLR rate in the year 2050 and 2100 will be obtained.
DATA ANALYSIS AND RESULTS Introduction The analysis of sea level rise trend for West Coast of Peninsular Malaysia has exposed the actual trend of sea level rise according to the selected tidal station. The results were obtained from the analysis of his‐torical mean sea level data at Pulau Pinang tidal sta‐tion. The mean sea level data for Pulau Pinang (1985 ‐ 2008) were processed and analyzed accord‐ingly using statistical package.
Statistical Test (Non‐parametric) –Seasonal Mann‐Kendall The Non‐parametric tests of Mann‐Kendall were carried out using Minitab as a statistical package on Pulau Pinang. An example of the Non‐Paremetric test is discussed in the following sub‐chapter.
Non‐parametric tests (Mann Kendall):‐ Pulau Pinang Figure 3 shows the results of Mann‐Kendall Test on Penang MSL data for the year 1985 – 2008. From the test, it has indicated enough evidence to deter‐mine that there is an upward trend at confidence level 95% or alpha, α = 0.05. The p‐value of the sig‐nificant upward trend is 0.0121493 and the calcu‐lated z value is 2.25238.
Figure 3: Mann‐Kendall Test for Pulau Pinang
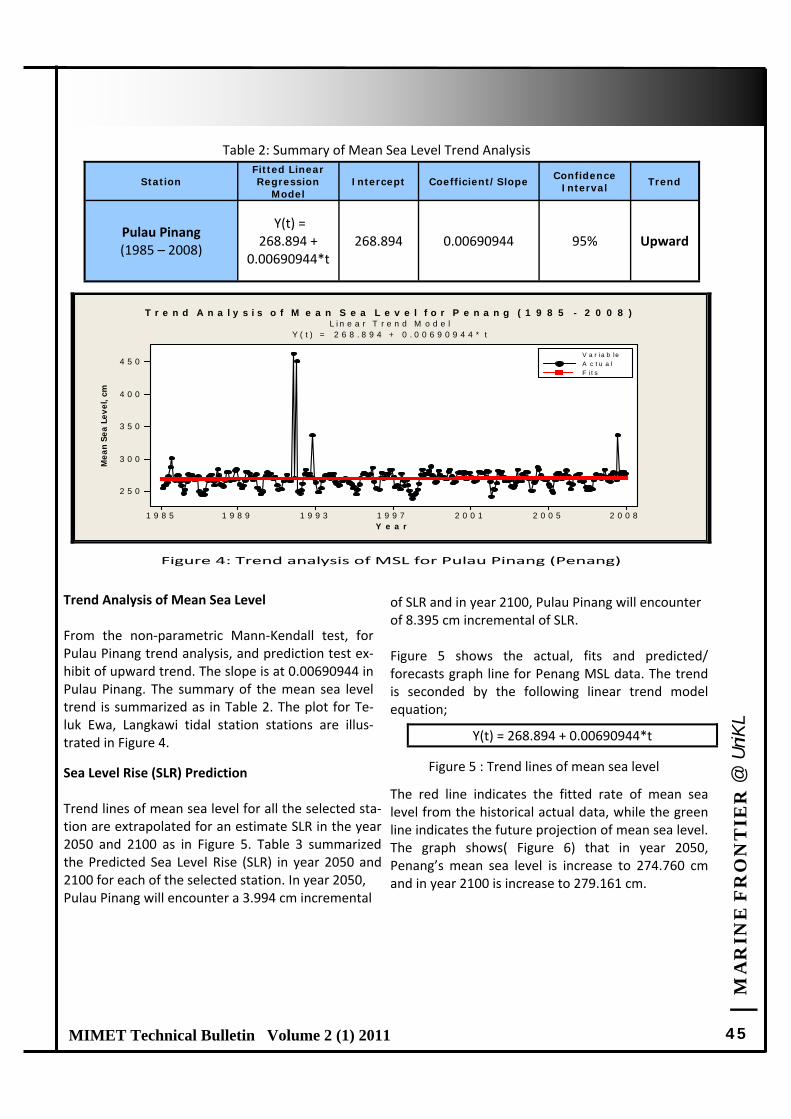
| M
AR
INE
FR
ON
TIE
R @
UniK
L
45 MIMET Technical Bulletin Volume 2 (1) 2011
Y e a r
Mea
n Se
a Le
vel,
cm
2 0 0 82 0 0 52 0 0 11 9 9 71 9 9 31 9 8 91 9 8 5
4 5 0
4 0 0
3 5 0
3 0 0
2 5 0
V a r ia b leA c t u a lF i t s
T r e n d A n a l y s i s o f M e a n S e a L e v e l f o r P e n a n g ( 1 9 8 5 - 2 0 0 8 )L i n e a r T r e n d M o d e l
Y ( t ) = 2 6 8 . 8 9 4 + 0 . 0 0 6 9 0 9 4 4 * t
Figure 4: Trend analysis of MSL for Pulau Pinang (Penang)
Trend Analysis of Mean Sea Level From the non‐parametric Mann‐Kendall test, for Pulau Pinang trend analysis, and prediction test ex‐hibit of upward trend. The slope is at 0.00690944 in Pulau Pinang. The summary of the mean sea level trend is summarized as in Table 2. The plot for Te‐luk Ewa, Langkawi tidal station stations are illus‐trated in Figure 4.
Sea Level Rise (SLR) Prediction
Trend lines of mean sea level for all the selected sta‐tion are extrapolated for an estimate SLR in the year 2050 and 2100 as in Figure 5. Table 3 summarized the Predicted Sea Level Rise (SLR) in year 2050 and 2100 for each of the selected station. In year 2050, Pulau Pinang will encounter a 3.994 cm incremental
of SLR and in year 2100, Pulau Pinang will encounter of 8.395 cm incremental of SLR. Figure 5 shows the actual, fits and predicted/forecasts graph line for Penang MSL data. The trend is seconded by the following linear trend model equation;
The red line indicates the fitted rate of mean sea level from the historical actual data, while the green line indicates the future projection of mean sea level. The graph shows( Figure 6) that in year 2050, Penang’s mean sea level is increase to 274.760 cm and in year 2100 is increase to 279.161 cm.
Station Fitted Linear Regression
Model Intercept Coefficient/Slope
Confidence Interval
Trend
Pulau Pinang (1985 – 2008)
Y(t) = 268.894 +
0.00690944*t 268.894 0.00690944 95% Upward
Table 2: Summary of Mean Sea Level Trend Analysis
Y(t) = 268.894 + 0.00690944*t
Figure 5 : Trend lines of mean sea level
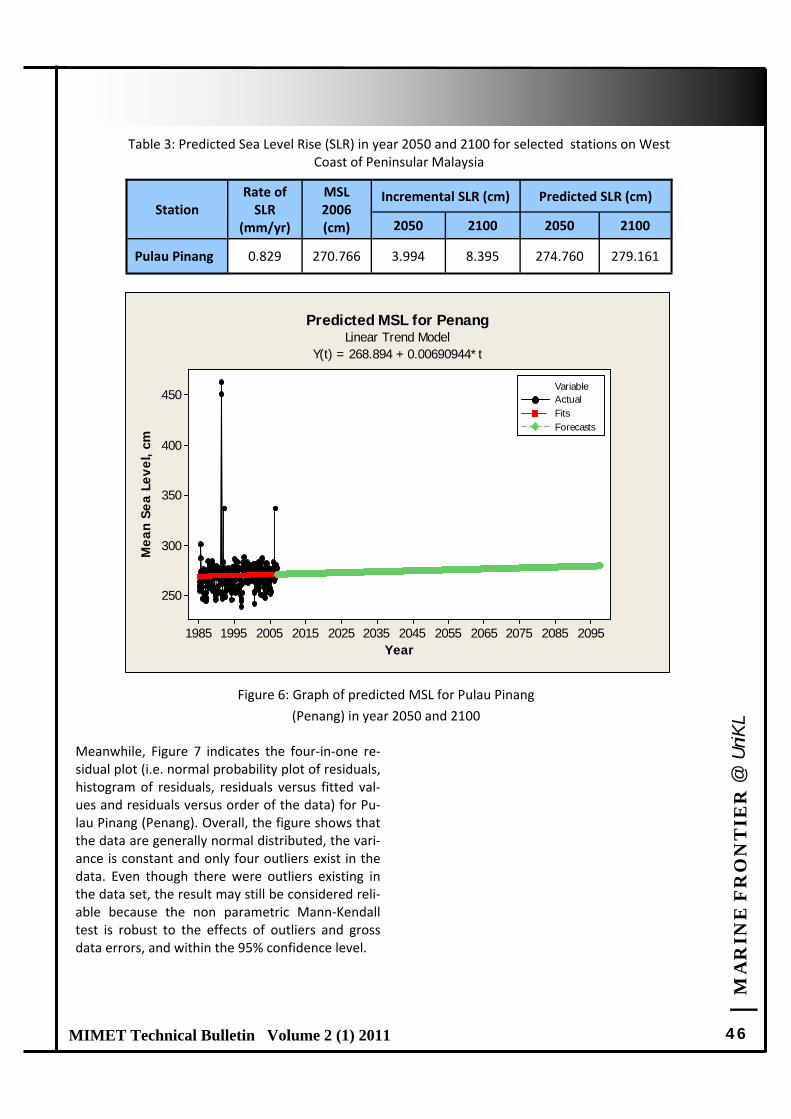
| M
AR
INE
FR
ON
TIE
R @
UniK
L
46 MIMET Technical Bulletin Volume 2 (1) 2011
Meanwhile, Figure 7 indicates the four‐in‐one re‐sidual plot (i.e. normal probability plot of residuals, histogram of residuals, residuals versus fitted val‐ues and residuals versus order of the data) for Pu‐lau Pinang (Penang). Overall, the figure shows that the data are generally normal distributed, the vari‐ance is constant and only four outliers exist in the data. Even though there were outliers existing in the data set, the result may still be considered reli‐able because the non parametric Mann‐Kendall test is robust to the effects of outliers and gross data errors, and within the 95% confidence level.
Table 3: Predicted Sea Level Rise (SLR) in year 2050 and 2100 for selected stations on West Coast of Peninsular Malaysia
Year
Mea
n Se
a Le
vel,
cm
209520852075206520552045203520252015200519951985
450
400
350
300
250
Variable
Forecasts
ActualFits
Predicted MSL for PenangLinear Trend Model
Y(t) = 268.894 + 0.00690944*t
Figure 6: Graph of predicted MSL for Pulau Pinang
(Penang) in year 2050 and 2100
Station Rate of SLR
(mm/yr)
MSL 2006 (cm)
Incremental SLR (cm) Predicted SLR (cm)
2050 2100 2050 2100
Pulau Pinang 0.829 270.766 3.994 8.395 274.760 279.161
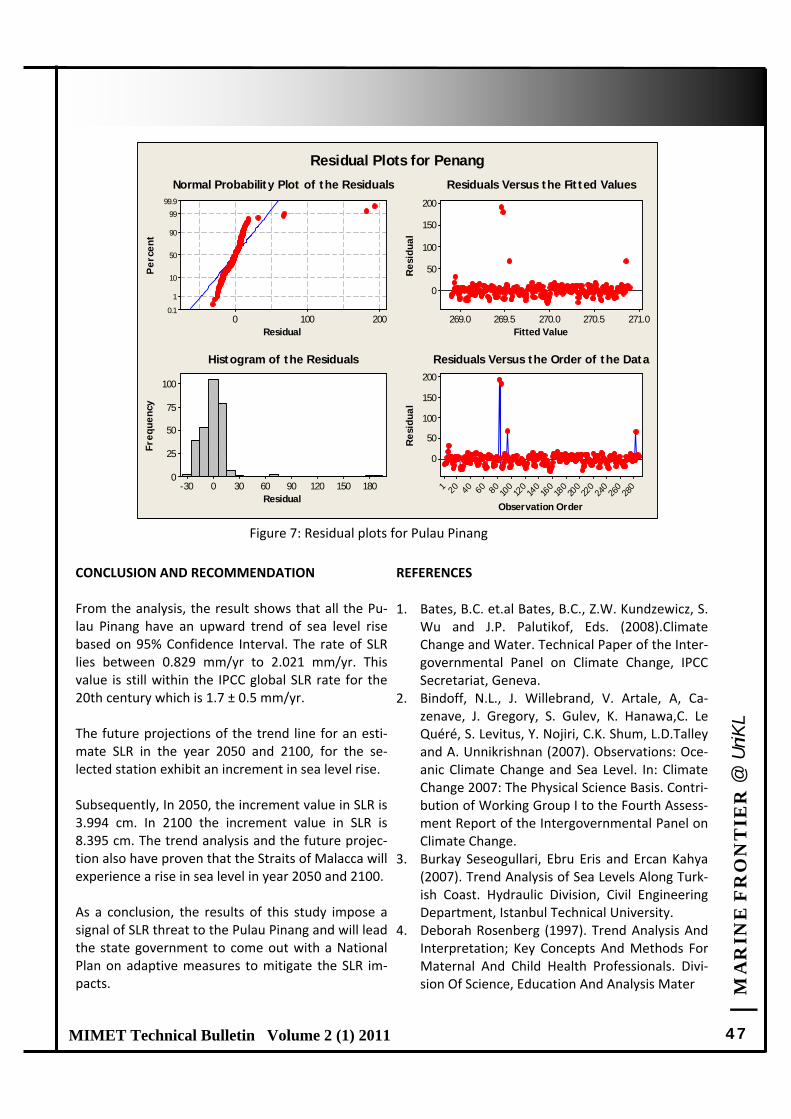
| M
AR
INE
FR
ON
TIE
R @
UniK
L
47 MIMET Technical Bulletin Volume 2 (1) 2011
CONCLUSION AND RECOMMENDATION From the analysis, the result shows that all the Pu‐lau Pinang have an upward trend of sea level rise based on 95% Confidence Interval. The rate of SLR lies between 0.829 mm/yr to 2.021 mm/yr. This value is still within the IPCC global SLR rate for the 20th century which is 1.7 ± 0.5 mm/yr.
The future projections of the trend line for an esti‐mate SLR in the year 2050 and 2100, for the se‐lected station exhibit an increment in sea level rise. Subsequently, In 2050, the increment value in SLR is 3.994 cm. In 2100 the increment value in SLR is 8.395 cm. The trend analysis and the future projec‐tion also have proven that the Straits of Malacca will experience a rise in sea level in year 2050 and 2100.
As a conclusion, the results of this study impose a signal of SLR threat to the Pulau Pinang and will lead the state government to come out with a National Plan on adaptive measures to mitigate the SLR im‐pacts.
REFERENCES
1. Bates, B.C. et.al Bates, B.C., Z.W. Kundzewicz, S.
Wu and J.P. Palutikof, Eds. (2008).Climate Change and Water. Technical Paper of the Inter‐governmental Panel on Climate Change, IPCC Secretariat, Geneva.
2. Bindoff, N.L., J. Willebrand, V. Artale, A, Ca‐zenave, J. Gregory, S. Gulev, K. Hanawa,C. Le Quéré, S. Levitus, Y. Nojiri, C.K. Shum, L.D.Talley and A. Unnikrishnan (2007). Observations: Oce‐anic Climate Change and Sea Level. In: Climate Change 2007: The Physical Science Basis. Contri‐bution of Working Group I to the Fourth Assess‐ment Report of the Intergovernmental Panel on Climate Change.
3. Burkay Seseogullari, Ebru Eris and Ercan Kahya (2007). Trend Analysis of Sea Levels Along Turk‐ish Coast. Hydraulic Division, Civil Engineering Department, Istanbul Technical University.
4. Deborah Rosenberg (1997). Trend Analysis And Interpretation; Key Concepts And Methods For Maternal And Child Health Professionals. Divi‐sion Of Science, Education And Analysis Mater
Residual
Per
cent
2001000
99.9
99
90
50
10
1
0.1
Fitted Value
Res
idua
l
271.0270.5270.0269.5269.0
200
150
100
50
0
Residual
Freq
uenc
y
1801501209060300-30
100
75
50
25
0
Observation Order
Res
idua
l
280
260
240
220
200
180
160
140
120
100806040201
200
150
100
50
0
Normal Probability Plot of the Residuals Residuals Versus the Fitted Values
Histogram of the Residuals Residuals Versus the Order of the Data
Residual Plots for Penang
Figure 7: Residual plots for Pulau Pinang

| M
AR
INE
FR
ON
TIE
R @
UniK
L
48 MIMET Technical Bulletin Volume 2 (1) 2011
nal And Child Health Bureau. 5. Douglas C. Montgomery, George C. Runger and
Norma Faris Hubele (2004). Engineering Statis‐tic, Third Edition. John Wiley and Sons Inc.
6. IPCC WGI Fourth Assessment Report, (2007) .Climate Change 2007: The Physical Sci‐ence Basis Summary for Policymakers.
7. James G. Titus et.al (1996). The Risk of Sea Level 8.Rise. U.S Environmental Protection Agency.
9. James G. Titus (1998) Rising Seas, Coastal Ero‐sion, And The Takings Clause: How To Save Wetlands And Beaches Without Hurting Prop‐erty Owners. Volume 57, Number 4, Maryland Law Review.
10. J. E. Ong (2000). Vulnerability of Malaysia To Sea‐Level Change. Centre for Marine and Coastal Studies, Universiti Sains Malaysia, Penang, Malaysia.
11. 10. Jabatan Pengairan dan Saliran Malaysia, Kementerian Sumber Asli dan Alam Sekitar (2007). National Coastal Vulnerability Index
Study – Phase I (Final Report). 12. Meehl, G.A., T.F. Stocker, W.D. Collins,
P.Friedlingstein, A.T. Gaye, J.M. Gregory, A. Kitoh, R. Knutti, J.M. Murphy, A. Noda, S.C.B. Raper, I.G. Watterson, A.J. Weaver and Z.‐C. Zhao, 2007: Global Climate Projections. In: Cli‐mate Change 2007: The Physical Science Basis. Contribution of Working Group I to the Fourth Assessment Report of the Intergovernmental Panel on Climate Change.
13. Report Of The Coastal Zone Management Sub‐group (1990). Strategies For Adaption To Sea Level Rise. Intergovernmental Panel On Cli‐mate Change Response Strategies Working Group Zainal Akamar Bin Harun (2008), Paper Presenter for National Coastal Vulnerability Index Study.Ministry Of Natural Resources And Environment (Nre), Second National Con‐ference On Extreme Weather And Climate Change: Understanding Science And Risk Re‐duction.

| M
AR
INE
FR
ON
TIE
R @
UniK
L
49 MIMET Technical Bulletin Volume 2 (1) 2011
Feature Article 7 Feature Article 7
THE INFLUENCE OF MARPOL CONVENTION ON LLYOD’S
REGISTER RULES AND REGULATIONS
AMINUDDIN MD AROF*, AZAHAR AB HAMED, MUHAMAD FARID SIDIK & W. ARIFF W. HASSAN
Department of Marine & Design Technology, BET in Naval Architecture & Shipbuilding
Malaysian Institute of Marine Engineering Technology, Universiti Kuala Lumpur Received: 28 April 2011; Revised: 2 May 2011 ; Accepted: 6 May 2011
ABSTRACT The continuous expansion of the merchant fleet has threatened not only the safety of other users of sea but also the marine environment and the living marine resources. Over the years since the beginning of the 20th century, unilateral enforcement of maritime laws and regulations seemed to be ineffective since customary international law allows ships to from one territorial sea to another without any requirement to notify the coastal states. Hence, many conventions were developed by the IMO over the last half a century and one of the most important conventions is the ‘International Con‐vention for the Prevention of Pollution of Ships 1973/1978’ or popularly known as the MARPOL convention. The Conven‐tion includes regulation aimed at preventing and minimizing pollution from ships’ accident and routine operation. This paper is meant to examine the development of the rules and regulations by Llyod’s Register in supporting the implemen‐tation of MARPOL Convention.
Keywords : MARPOL, LR, IMO, IBC Code, BCH Code
Corresponding Author: [email protected]
INTRODUCTION
More than two third of the world is covered by the sea and it is the most important transporta‐tion route for international cargo. Navigation and fishing are the common activities since the ancient history but today the sea is used for many other purposes, including recreation, sci‐entific research, seabed mining, power genera‐tion, military exercise, weapon testing and waste disposal. Notwithstanding the above activities, the world’s oceans are dominated by shipping activities serving about 90 percent of interna‐tional trade, carrying huge quantities of cargo in the most cost effective medium. The continuous expansion of the merchant fleet has threatened not only the safety of other users of sea but also the marine environment and the living marine resources. Over the years since the beginning of the 20th century, unilateral enforcement of mari‐time laws and regulations seemed to be ineffec‐tive since customary international law allows ships to from one territorial sea to another with‐
out any requirement to notify the coastal states. Hence, it would be easy for ships to escape the law enforcement of a particular state by choos‐ing to operate within the waters where law en‐forcements were less stringent. In this regard, the international community had recognized that there was a need for international stan‐dards to regulate shipping, which can be adopted and accepted by all states involved in shipping and international trade. The International Maritime Organization (IMO) was established in order to fulfill the obligation to promote maritime safety at sea through the development and enhancement of various inter‐national conventions and regulations. Those conventions and regulations will then be en‐forced by the member countries normally through the assistance of recognized ship classi‐fication societies that set specific technical stan‐dards in order to comply with various interna‐tional conventions. In order to be safe and sea‐worthy and be allowed to operate freely by the
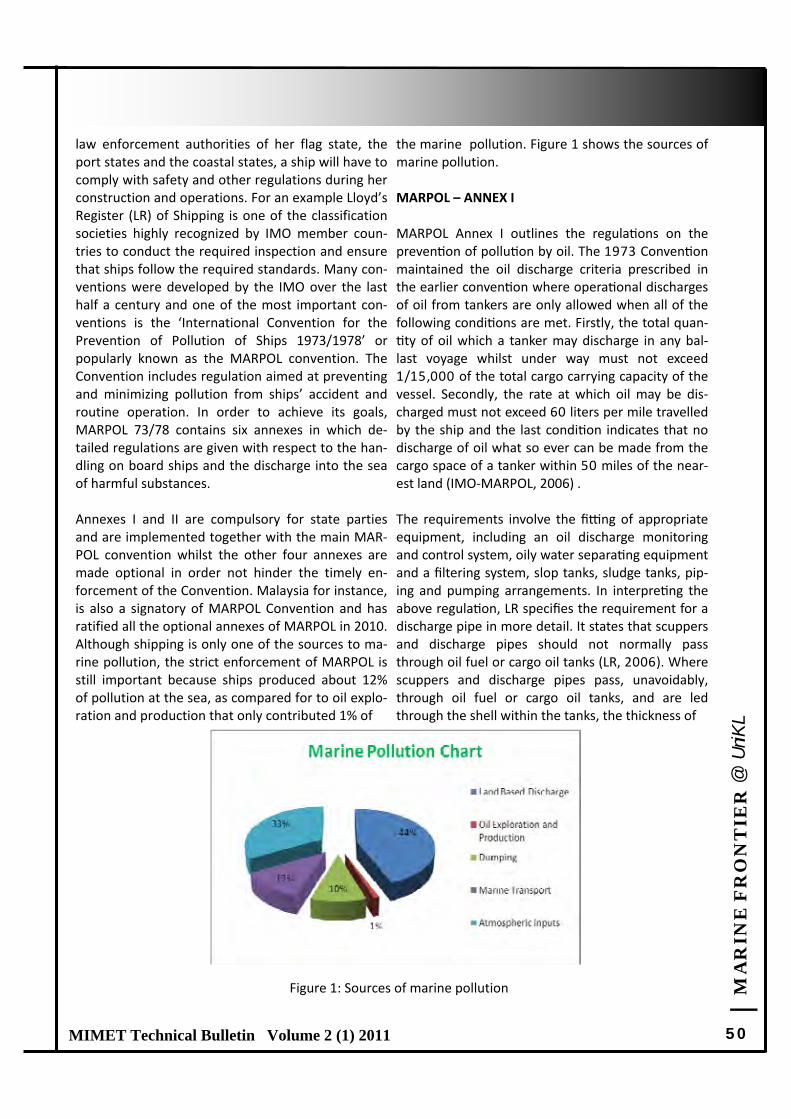
| M
AR
INE
FR
ON
TIE
R @
UniK
L
50 MIMET Technical Bulletin Volume 2 (1) 2011
law enforcement authorities of her flag state, the port states and the coastal states, a ship will have to comply with safety and other regulations during her construction and operations. For an example Lloyd’s Register (LR) of Shipping is one of the classification societies highly recognized by IMO member coun‐tries to conduct the required inspection and ensure that ships follow the required standards. Many con‐ventions were developed by the IMO over the last half a century and one of the most important con‐ventions is the ‘International Convention for the Prevention of Pollution of Ships 1973/1978’ or popularly known as the MARPOL convention. The Convention includes regulation aimed at preventing and minimizing pollution from ships’ accident and routine operation. In order to achieve its goals, MARPOL 73/78 contains six annexes in which de‐tailed regulations are given with respect to the han‐dling on board ships and the discharge into the sea of harmful substances. Annexes I and II are compulsory for state parties and are implemented together with the main MAR‐POL convention whilst the other four annexes are made optional in order not hinder the timely en‐forcement of the Convention. Malaysia for instance, is also a signatory of MARPOL Convention and has ratified all the optional annexes of MARPOL in 2010. Although shipping is only one of the sources to ma‐rine pollution, the strict enforcement of MARPOL is still important because ships produced about 12% of pollution at the sea, as compared for to oil explo‐ration and production that only contributed 1% of
the marine pollution. Figure 1 shows the sources of marine pollution. MARPOL – ANNEX I MARPOL Annex I outlines the regulations on the prevention of pollution by oil. The 1973 Convention maintained the oil discharge criteria prescribed in the earlier convention where operational discharges of oil from tankers are only allowed when all of the following conditions are met. Firstly, the total quan‐tity of oil which a tanker may discharge in any bal‐last voyage whilst under way must not exceed 1/15,000 of the total cargo carrying capacity of the vessel. Secondly, the rate at which oil may be dis‐charged must not exceed 60 liters per mile travelled by the ship and the last condition indicates that no discharge of oil what so ever can be made from the cargo space of a tanker within 50 miles of the near‐est land (IMO‐MARPOL, 2006) . The requirements involve the fitting of appropriate equipment, including an oil discharge monitoring and control system, oily water separating equipment and a filtering system, slop tanks, sludge tanks, pip‐ing and pumping arrangements. In interpreting the above regulation, LR specifies the requirement for a discharge pipe in more detail. It states that scuppers and discharge pipes should not normally pass through oil fuel or cargo oil tanks (LR, 2006). Where scuppers and discharge pipes pass, unavoidably, through oil fuel or cargo oil tanks, and are led through the shell within the tanks, the thickness of
Figure 1: Sources of marine pollution
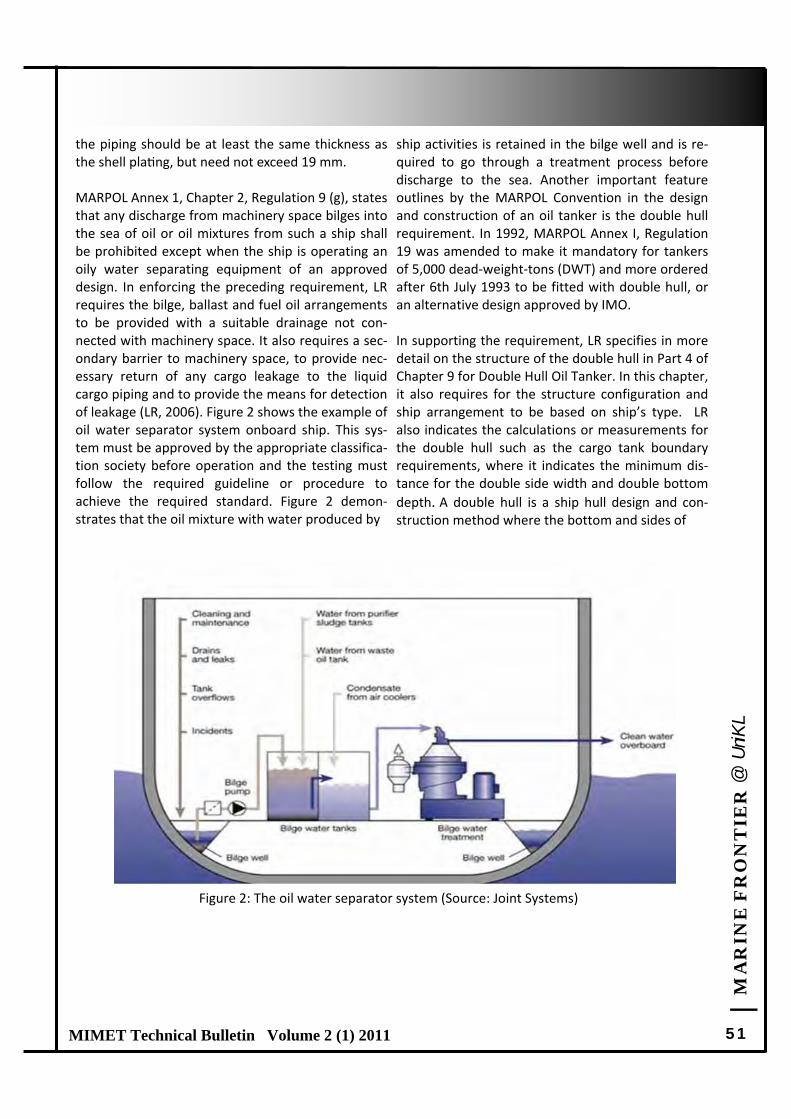
| M
AR
INE
FR
ON
TIE
R @
UniK
L
51 MIMET Technical Bulletin Volume 2 (1) 2011
the piping should be at least the same thickness as the shell plating, but need not exceed 19 mm. MARPOL Annex 1, Chapter 2, Regulation 9 (g), states that any discharge from machinery space bilges into the sea of oil or oil mixtures from such a ship shall be prohibited except when the ship is operating an oily water separating equipment of an approved design. In enforcing the preceding requirement, LR requires the bilge, ballast and fuel oil arrangements to be provided with a suitable drainage not con‐nected with machinery space. It also requires a sec‐ondary barrier to machinery space, to provide nec‐essary return of any cargo leakage to the liquid cargo piping and to provide the means for detection of leakage (LR, 2006). Figure 2 shows the example of oil water separator system onboard ship. This sys‐tem must be approved by the appropriate classifica‐tion society before operation and the testing must follow the required guideline or procedure to achieve the required standard. Figure 2 demon‐strates that the oil mixture with water produced by
ship activities is retained in the bilge well and is re‐quired to go through a treatment process before discharge to the sea. Another important feature outlines by the MARPOL Convention in the design and construction of an oil tanker is the double hull requirement. In 1992, MARPOL Annex I, Regulation 19 was amended to make it mandatory for tankers of 5,000 dead‐weight‐tons (DWT) and more ordered after 6th July 1993 to be fitted with double hull, or an alternative design approved by IMO. In supporting the requirement, LR specifies in more detail on the structure of the double hull in Part 4 of Chapter 9 for Double Hull Oil Tanker. In this chapter, it also requires for the structure configuration and ship arrangement to be based on ship’s type. LR also indicates the calculations or measurements for the double hull such as the cargo tank boundary requirements, where it indicates the minimum dis‐tance for the double side width and double bottom
depth. A double hull is a ship hull design and con‐struction method where the bottom and sides of
Figure 2: The oil water separator system (Source: Joint Systems)
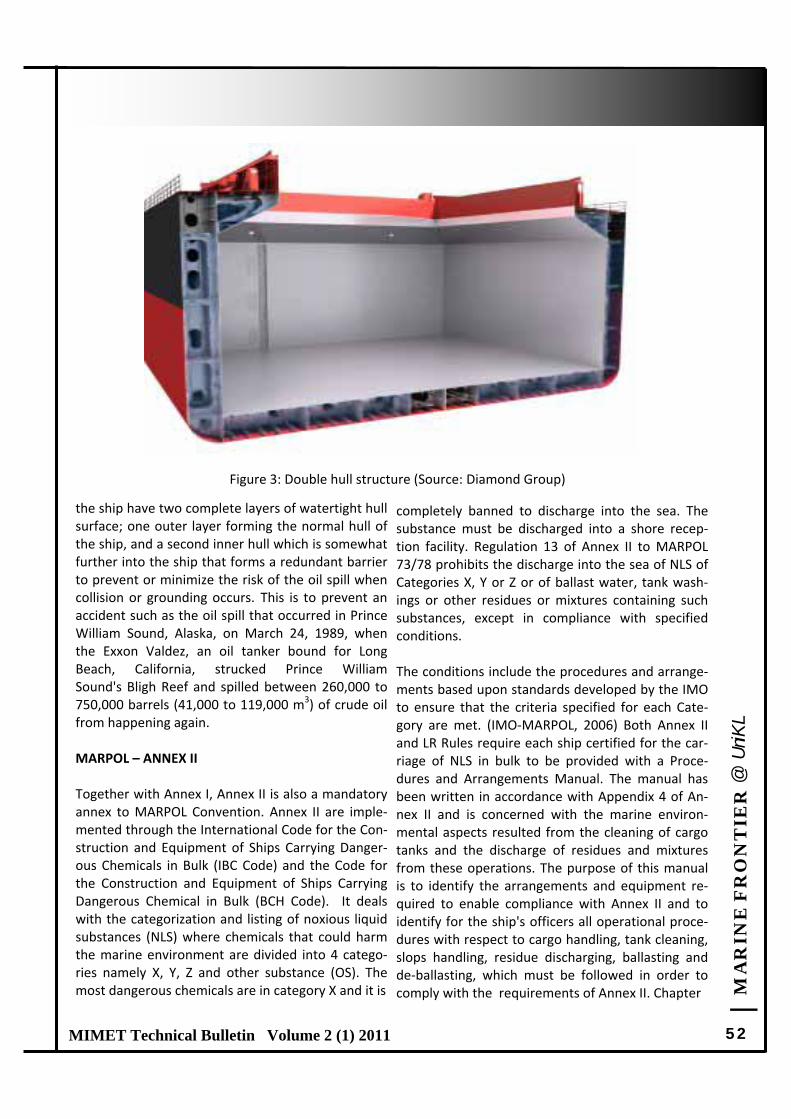
| M
AR
INE
FR
ON
TIE
R @
UniK
L
52 MIMET Technical Bulletin Volume 2 (1) 2011
the ship have two complete layers of watertight hull surface; one outer layer forming the normal hull of the ship, and a second inner hull which is somewhat further into the ship that forms a redundant barrier to prevent or minimize the risk of the oil spill when collision or grounding occurs. This is to prevent an accident such as the oil spill that occurred in Prince William Sound, Alaska, on March 24, 1989, when the Exxon Valdez, an oil tanker bound for Long Beach, California, strucked Prince William Sound's Bligh Reef and spilled between 260,000 to 750,000 barrels (41,000 to 119,000 m3) of crude oil from happening again. MARPOL – ANNEX II
Together with Annex I, Annex II is also a mandatory annex to MARPOL Convention. Annex II are imple‐mented through the International Code for the Con‐struction and Equipment of Ships Carrying Danger‐ous Chemicals in Bulk (IBC Code) and the Code for the Construction and Equipment of Ships Carrying Dangerous Chemical in Bulk (BCH Code). It deals with the categorization and listing of noxious liquid substances (NLS) where chemicals that could harm the marine environment are divided into 4 catego‐ries namely X, Y, Z and other substance (OS). The most dangerous chemicals are in category X and it is
completely banned to discharge into the sea. The substance must be discharged into a shore recep‐tion facility. Regulation 13 of Annex II to MARPOL 73/78 prohibits the discharge into the sea of NLS of Categories X, Y or Z or of ballast water, tank wash‐ings or other residues or mixtures containing such substances, except in compliance with specified conditions. The conditions include the procedures and arrange‐ments based upon standards developed by the IMO to ensure that the criteria specified for each Cate‐gory are met. (IMO‐MARPOL, 2006) Both Annex II and LR Rules require each ship certified for the car‐riage of NLS in bulk to be provided with a Proce‐dures and Arrangements Manual. The manual has been written in accordance with Appendix 4 of An‐nex II and is concerned with the marine environ‐mental aspects resulted from the cleaning of cargo tanks and the discharge of residues and mixtures from these operations. The purpose of this manual is to identify the arrangements and equipment re‐quired to enable compliance with Annex II and to identify for the ship's officers all operational proce‐dures with respect to cargo handling, tank cleaning, slops handling, residue discharging, ballasting and de‐ballasting, which must be followed in order to comply with the requirements of Annex II. Chapter
Figure 3: Double hull structure (Source: Diamond Group)
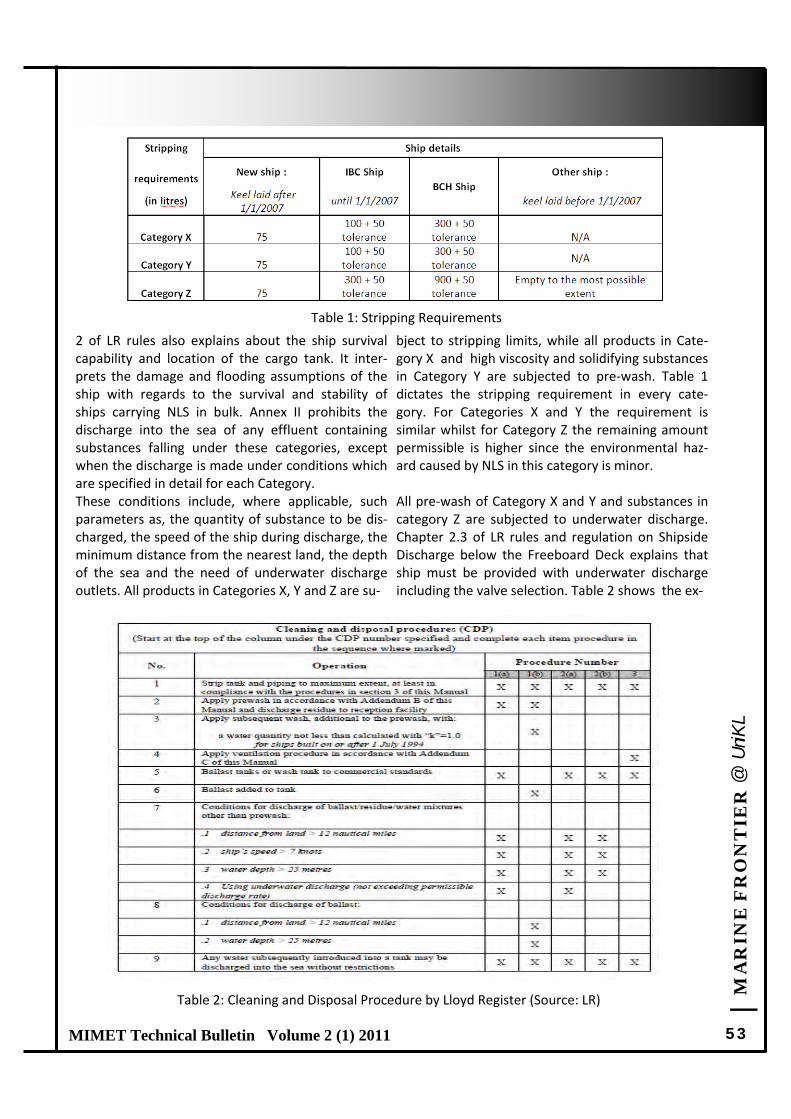
| M
AR
INE
FR
ON
TIE
R @
UniK
L
53 MIMET Technical Bulletin Volume 2 (1) 2011
2 of LR rules also explains about the ship survival capability and location of the cargo tank. It inter‐prets the damage and flooding assumptions of the ship with regards to the survival and stability of ships carrying NLS in bulk. Annex II prohibits the discharge into the sea of any effluent containing substances falling under these categories, except when the discharge is made under conditions which are specified in detail for each Category. These conditions include, where applicable, such parameters as, the quantity of substance to be dis‐charged, the speed of the ship during discharge, the minimum distance from the nearest land, the depth of the sea and the need of underwater discharge outlets. All products in Categories X, Y and Z are su‐
bject to stripping limits, while all products in Cate‐gory X and high viscosity and solidifying substances in Category Y are subjected to pre‐wash. Table 1 dictates the stripping requirement in every cate‐gory. For Categories X and Y the requirement is similar whilst for Category Z the remaining amount permissible is higher since the environmental haz‐ard caused by NLS in this category is minor. All pre‐wash of Category X and Y and substances in category Z are subjected to underwater discharge. Chapter 2.3 of LR rules and regulation on Shipside Discharge below the Freeboard Deck explains that ship must be provided with underwater discharge including the valve selection. Table 2 shows the ex‐
Table 1: Stripping Requirements
Table 2: Cleaning and Disposal Procedure by Lloyd Register (Source: LR)
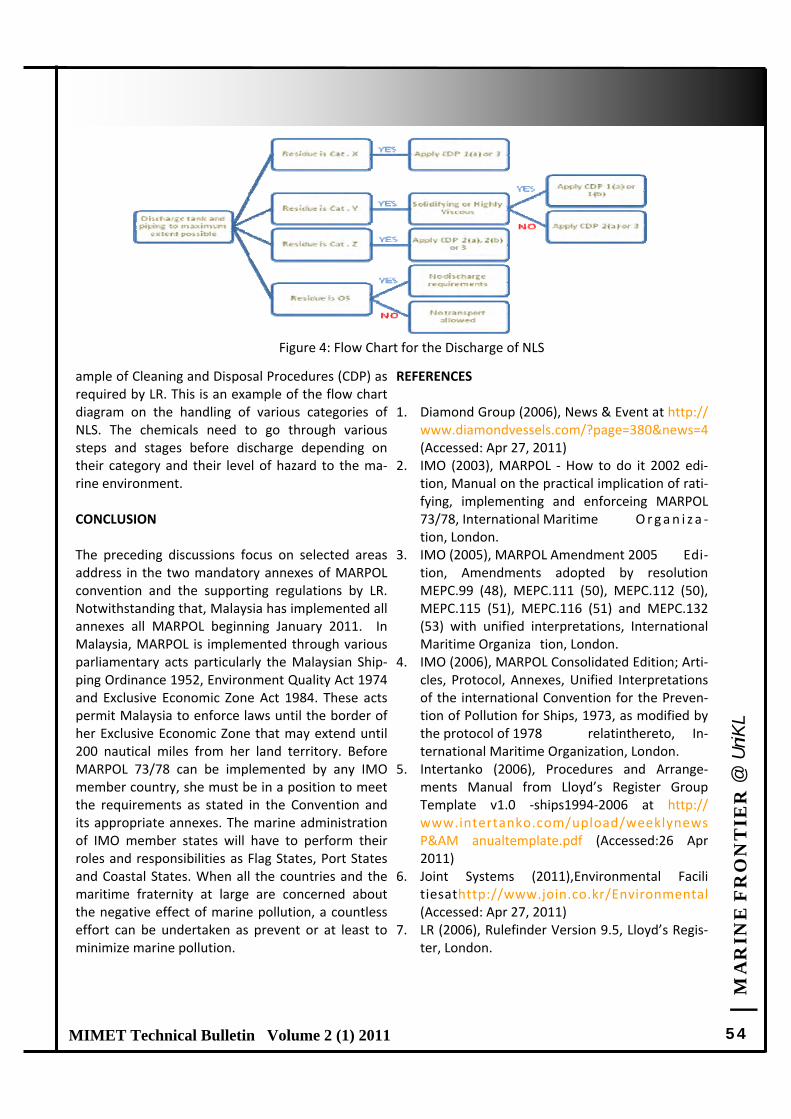
| M
AR
INE
FR
ON
TIE
R @
UniK
L
54 MIMET Technical Bulletin Volume 2 (1) 2011
ample of Cleaning and Disposal Procedures (CDP) as required by LR. This is an example of the flow chart diagram on the handling of various categories of NLS. The chemicals need to go through various steps and stages before discharge depending on their category and their level of hazard to the ma‐rine environment. CONCLUSION The preceding discussions focus on selected areas address in the two mandatory annexes of MARPOL convention and the supporting regulations by LR. Notwithstanding that, Malaysia has implemented all annexes all MARPOL beginning January 2011. In Malaysia, MARPOL is implemented through various parliamentary acts particularly the Malaysian Ship‐ping Ordinance 1952, Environment Quality Act 1974 and Exclusive Economic Zone Act 1984. These acts permit Malaysia to enforce laws until the border of her Exclusive Economic Zone that may extend until 200 nautical miles from her land territory. Before MARPOL 73/78 can be implemented by any IMO member country, she must be in a position to meet the requirements as stated in the Convention and its appropriate annexes. The marine administration of IMO member states will have to perform their roles and responsibilities as Flag States, Port States and Coastal States. When all the countries and the maritime fraternity at large are concerned about the negative effect of marine pollution, a countless effort can be undertaken as prevent or at least to minimize marine pollution.
REFERENCES 1. Diamond Group (2006), News & Event at http://
www.diamondvessels.com/?page=380&news=4 (Accessed: Apr 27, 2011)
2. IMO (2003), MARPOL ‐ How to do it 2002 edi‐tion, Manual on the practical implication of rati‐fying, implementing and enforceing MARPOL 73/78, International Maritime Organ i z a ‐tion, London.
3. IMO (2005), MARPOL Amendment 2005 Edi‐tion, Amendments adopted by resolution MEPC.99 (48), MEPC.111 (50), MEPC.112 (50), MEPC.115 (51), MEPC.116 (51) and MEPC.132 (53) with unified interpretations, International Maritime Organiza tion, London.
4. IMO (2006), MARPOL Consolidated Edition; Arti‐cles, Protocol, Annexes, Unified Interpretations of the international Convention for the Preven‐tion of Pollution for Ships, 1973, as modified by the protocol of 1978 relatinthereto, In‐ternational Maritime Organization, London.
5. Intertanko (2006), Procedures and Arrange‐ments Manual from Lloyd’s Register Group Template v1.0 ‐ships1994‐2006 at http://www.intertanko.com/upload/weeklynews P&AM anualtemplate.pdf (Accessed:26 Apr 2011)
6. Joint Systems (2011),Environmental Facili tiesathttp://www.join.co.kr/Environmental (Accessed: Apr 27, 2011)
7. LR (2006), Rulefinder Version 9.5, Lloyd’s Regis‐ter, London.
Figure 4: Flow Chart for the Discharge of NLS
| M
AR
INE
FR
ON
TIE
R @
UniK
L
55 MIMET Technical Bulletin Volume 2 (1) 2011
Feature Article 8 Feature Article 8
A BRIEF REVIEW OF MODULAR CONSTRUCTION METHOD IN THE SHIPBUILDING INDUSTRY
AZIZ ABDULLAH*
Department of Marine Construction and Maintenance Technology Malaysian Institute of Marine Engineering Technology, Universiti Kuala Lumpur Received: 27 April 2011; Revised: 3 May 2011; Accepted: 3 May 2011
ABSTRACT Modular construction is a contemporary approach to shipbuilding and has demonstrated its capabilities to be more cost effective as compared to traditional methods. Cost effectiveness is realized through savings in the utilization of work‐force, reduced reworks that lead to higher quality output and lesser disruptions on site. As a result, shipbuilders become less exposed to construction delays and able to maintain the production momentum that serve to enhance their reputa‐tion in the shipbuilding market.
Keywords: Modular Construction, Design Spiral, Work Breakdown Structure, Multi‐Sites Construction
Corresponding Author: [email protected]
INTRODUCTION
In the early shipbuilding era ships were built largely using medieval means whereby up‐ward from the keel, the hull was made by overlapping planks on either side with rivets fastening them together. The West later moved on into a new era of building the first regular ocean going vessels. These were of unprecedented size, complexity and costs. Shipyards later became large industrial com‐plexes and the ships built were financed by consortiums of investors. During the Indus‐trial Revolution, ships were generally built piece by piece, an approach with a very low investment cost, minimum crane require‐ments, and small‐scale transport.
In the 20th Century, along with the develop‐ment of production method, most shipbuilders have recognized the advantages of building larger portions of ships in covered production facilities, then assembling those portions in a dry dock or on a slipway. As larger numbers of similar ships are built, standardization, repeti‐tion, and auto‐
mation lead to economies of scale and produc‐tion efficiencies, and cause to lower the costs and reduced schedules. Today, the technique has evolved into what is now known as modular or block construction, a method which involves the assembly of prefabricated sections (Deans, 2010).
When a deck is constructed on a ship, and be‐fore the next deck above it is laid, prefabricated cabin modules are lifted by a crane from a pier, carried over the ship's hull, and deposited di‐rectly by the crane substantially at their final locations in a row spaced from the hull. Before the cabins are completed by the erection of wall elements that extend from the prefabricated cabin modules toward the hull, workers can at‐tend to the construction of the overlying deck, and easily carry out the welding and outfitting operations needed to secure the overlying deck to the hull. Furnishings and fixtures for each cabin are concentrated and fixed within the pre‐fabricated cabin modules, so that at least ap‐proximately 80% of the cabin construction la‐bour is carried out ashore in the prefabrication process.
| M
AR
INE
FR
ON
TIE
R @
UniK
L
56 MIMET Technical Bulletin Volume 2 (1) 2011
MODULAR CONSTRUCTION: THE PROCESS Modular, or sometimes referred to block, construc‐tion has become a common practice in many mod‐ern shipyards. It is an approach that uses a pre‐fabricated building process involving sub‐assembly on site to produce temporary parts of a ship that would later be brought together for the final ship assembly [1]. The main reasons for the popularity of the modular construction process are its proven efficiency in the supervision of ship building process and its ability in meeting project timelines.
Modular construction takes full advantage of a con‐trolled production environment that combines its design flexibility with traditional building methods to produce high‐quality prefabricated structures. The results are faster construction process, more cost‐effective, easier supervision and better control of product quality.
Modular construction method was introduced in the shipbuilding industry mainly to shorten or im‐prove the construction timeline. Basically, modular construction in shipbuilding can be defined as an engineered assembly that contains a set of pre‐defined modules that would later form a complete ship (Siddiqui, 2008). The rapid growth of ship de‐sign technology has made it possible for modules to be designed and built independently and then as‐sembled to form a complete ship. Modules and the blocks are built to very tight and exacting toler‐ances. The processes during construction and as‐sembly of the modules are continuously monitored and aided by laser trackers to ensure they are in the exact positions. The following are some advantages that can be derived from the modular construction method;
Superior quality
Achieved by factory‐based quality control and pre‐design of simi‐
lar modules.
Economy of scale
Repetition of pre‐fabricated units leads to considerable econ‐omy of scale in produc‐
tion.
Environmentally less sensitive
Efficient factory pro‐duction techniques are much less wasteful and installation is less dis‐
ruptive on site.
Reduced site labour requirement
The erection and finish‐ing teams, which install and complete modular
buildings, involve fewer workers on site than traditional build‐
ings.
Safer construction
Modular construction sites have proved to be significantly safer than traditional on‐site
building.
Services and bath‐rooms
Service modules can be used, even in tradi‐
tional builds.
Reduced professional fees
Standardized design
details simplify and
reduce the need for
specialist design input,
hence reduce profes‐
sional fees.
Short build times
Typically 50‐60% less than traditional on‐site construction,
leading to an earlier return on investment and savings in prelimi‐
naries.
Low weight
Compared to site con‐struction, modular
construction is about 30% of the weight of conventional masonry
construction.
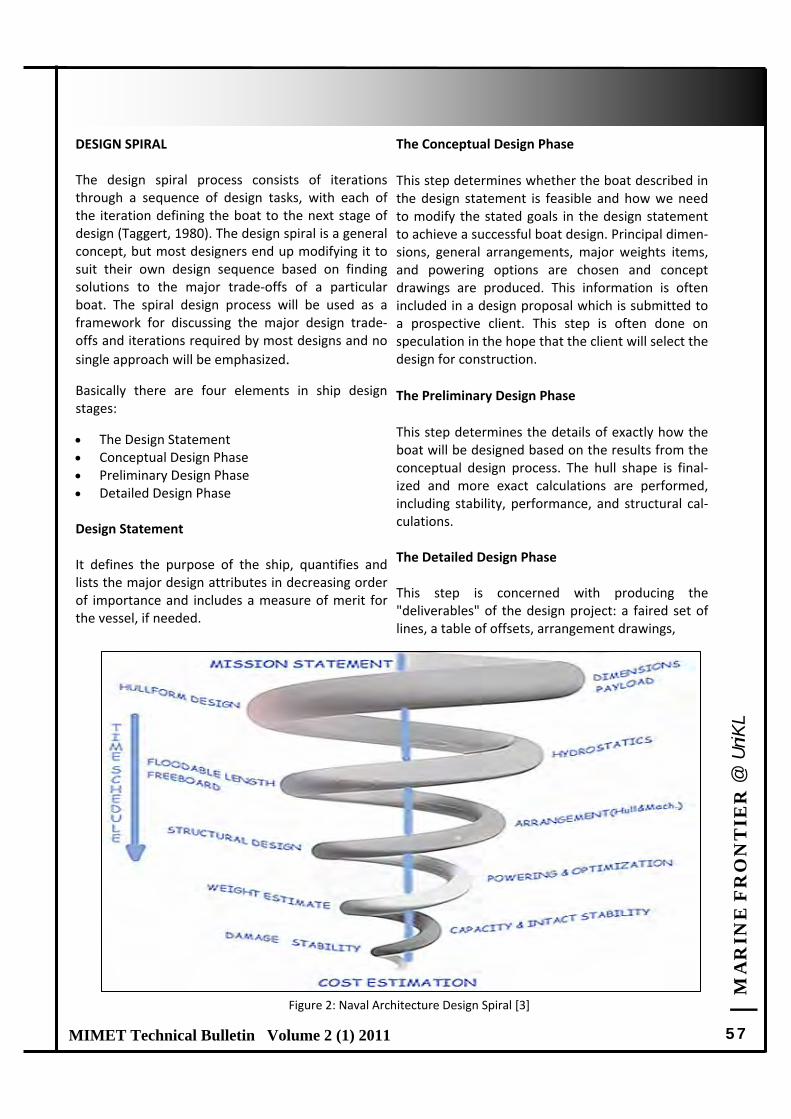
| M
AR
INE
FR
ON
TIE
R @
UniK
L
57 MIMET Technical Bulletin Volume 2 (1) 2011
DESIGN SPIRAL The design spiral process consists of iterations through a sequence of design tasks, with each of the iteration defining the boat to the next stage of design (Taggert, 1980). The design spiral is a general concept, but most designers end up modifying it to suit their own design sequence based on finding solutions to the major trade‐offs of a particular boat. The spiral design process will be used as a framework for discussing the major design trade‐offs and iterations required by most designs and no
single approach will be emphasized.
Basically there are four elements in ship design stages:
The Design Statement Conceptual Design Phase Preliminary Design Phase Detailed Design Phase Design Statement It defines the purpose of the ship, quantifies and lists the major design attributes in decreasing order of importance and includes a measure of merit for the vessel, if needed.
The Conceptual Design Phase
This step determines whether the boat described in the design statement is feasible and how we need to modify the stated goals in the design statement to achieve a successful boat design. Principal dimen‐sions, general arrangements, major weights items, and powering options are chosen and concept drawings are produced. This information is often included in a design proposal which is submitted to a prospective client. This step is often done on speculation in the hope that the client will select the design for construction.
The Preliminary Design Phase
This step determines the details of exactly how the boat will be designed based on the results from the conceptual design process. The hull shape is final‐ized and more exact calculations are performed, including stability, performance, and structural cal‐culations. The Detailed Design Phase This step is concerned with producing the "deliverables" of the design project: a faired set of lines, a table of offsets, arrangement drawings,
Figure 2: Naval Architecture Design Spiral [3]
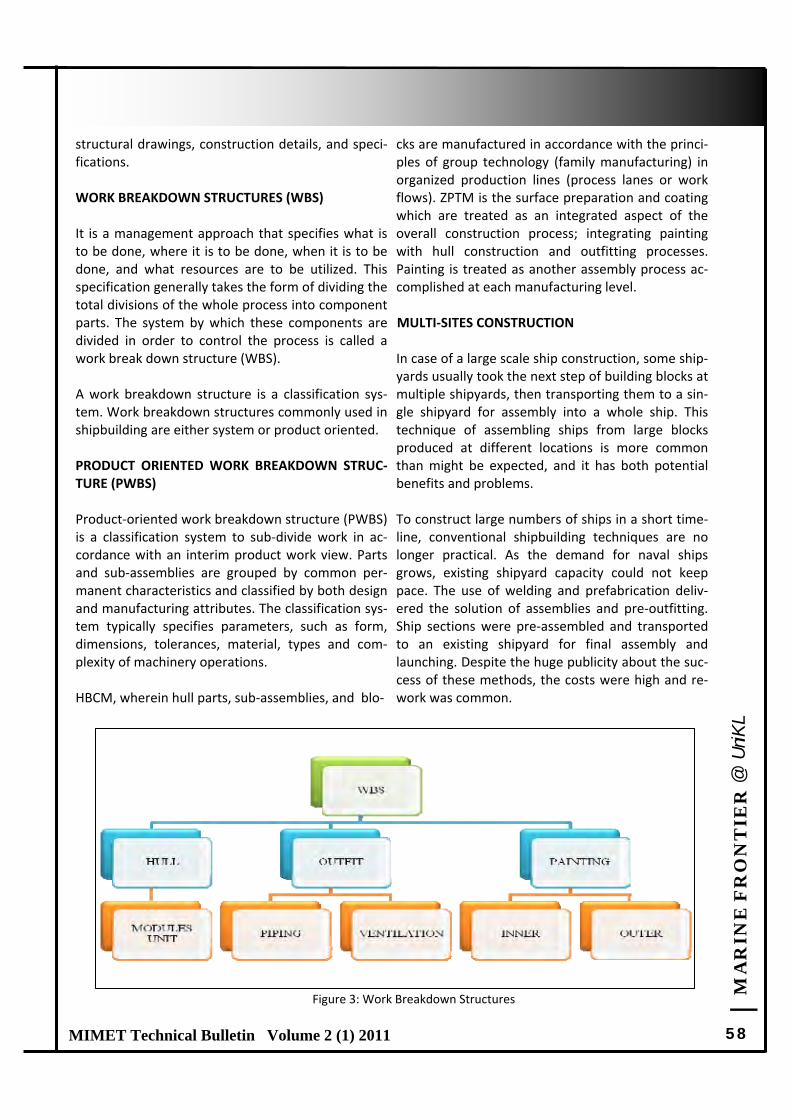
| M
AR
INE
FR
ON
TIE
R @
UniK
L
58 MIMET Technical Bulletin Volume 2 (1) 2011
structural drawings, construction details, and speci‐fications. WORK BREAKDOWN STRUCTURES (WBS) It is a management approach that specifies what is to be done, where it is to be done, when it is to be done, and what resources are to be utilized. This specification generally takes the form of dividing the total divisions of the whole process into component parts. The system by which these components are divided in order to control the process is called a work break down structure (WBS). A work breakdown structure is a classification sys‐tem. Work breakdown structures commonly used in shipbuilding are either system or product oriented. PRODUCT ORIENTED WORK BREAKDOWN STRUC‐TURE (PWBS) Product‐oriented work breakdown structure (PWBS) is a classification system to sub‐divide work in ac‐cordance with an interim product work view. Parts and sub‐assemblies are grouped by common per‐manent characteristics and classified by both design and manufacturing attributes. The classification sys‐tem typically specifies parameters, such as form, dimensions, tolerances, material, types and com‐plexity of machinery operations. HBCM, wherein hull parts, sub‐assemblies, and blo‐
cks are manufactured in accordance with the princi‐ples of group technology (family manufacturing) in organized production lines (process lanes or work flows). ZPTM is the surface preparation and coating which are treated as an integrated aspect of the overall construction process; integrating painting with hull construction and outfitting processes. Painting is treated as another assembly process ac‐complished at each manufacturing level. MULTI‐SITES CONSTRUCTION In case of a large scale ship construction, some ship‐yards usually took the next step of building blocks at multiple shipyards, then transporting them to a sin‐gle shipyard for assembly into a whole ship. This technique of assembling ships from large blocks produced at different locations is more common than might be expected, and it has both potential benefits and problems. To construct large numbers of ships in a short time‐line, conventional shipbuilding techniques are no longer practical. As the demand for naval ships grows, existing shipyard capacity could not keep pace. The use of welding and prefabrication deliv‐ered the solution of assemblies and pre‐outfitting. Ship sections were pre‐assembled and transported to an existing shipyard for final assembly and launching. Despite the huge publicity about the suc‐cess of these methods, the costs were high and re‐work was common.
Figure 3: Work Breakdown Structures
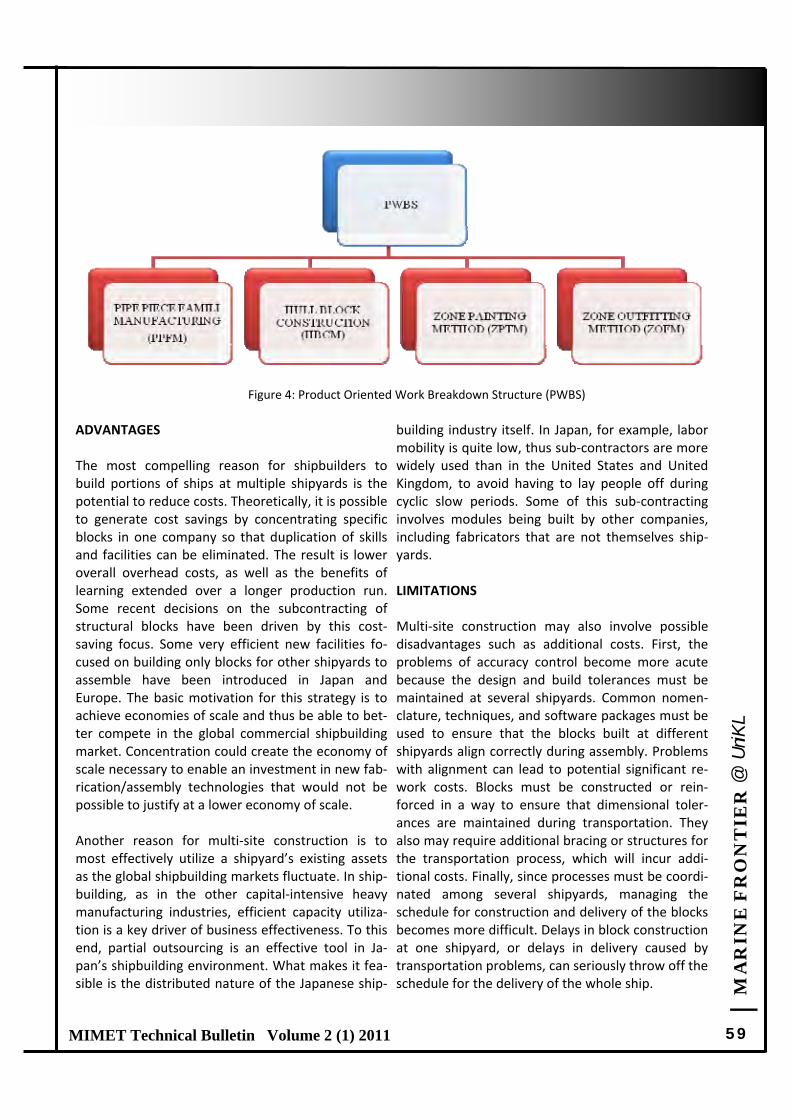
| M
AR
INE
FR
ON
TIE
R @
UniK
L
59 MIMET Technical Bulletin Volume 2 (1) 2011
ADVANTAGES The most compelling reason for shipbuilders to build portions of ships at multiple shipyards is the potential to reduce costs. Theoretically, it is possible to generate cost savings by concentrating specific blocks in one company so that duplication of skills and facilities can be eliminated. The result is lower overall overhead costs, as well as the benefits of learning extended over a longer production run. Some recent decisions on the subcontracting of structural blocks have been driven by this cost‐saving focus. Some very efficient new facilities fo‐cused on building only blocks for other shipyards to assemble have been introduced in Japan and Europe. The basic motivation for this strategy is to achieve economies of scale and thus be able to bet‐ter compete in the global commercial shipbuilding market. Concentration could create the economy of scale necessary to enable an investment in new fab‐rication/assembly technologies that would not be possible to justify at a lower economy of scale. Another reason for multi‐site construction is to most effectively utilize a shipyard’s existing assets as the global shipbuilding markets fluctuate. In ship‐building, as in the other capital‐intensive heavy manufacturing industries, efficient capacity utiliza‐tion is a key driver of business effectiveness. To this end, partial outsourcing is an effective tool in Ja‐pan’s shipbuilding environment. What makes it fea‐sible is the distributed nature of the Japanese ship‐
building industry itself. In Japan, for example, labor mobility is quite low, thus sub‐contractors are more widely used than in the United States and United Kingdom, to avoid having to lay people off during cyclic slow periods. Some of this sub‐contracting involves modules being built by other companies, including fabricators that are not themselves ship‐yards. LIMITATIONS Multi‐site construction may also involve possible disadvantages such as additional costs. First, the problems of accuracy control become more acute because the design and build tolerances must be maintained at several shipyards. Common nomen‐clature, techniques, and software packages must be used to ensure that the blocks built at different shipyards align correctly during assembly. Problems with alignment can lead to potential significant re‐work costs. Blocks must be constructed or rein‐forced in a way to ensure that dimensional toler‐ances are maintained during transportation. They also may require additional bracing or structures for the transportation process, which will incur addi‐tional costs. Finally, since processes must be coordi‐nated among several shipyards, managing the schedule for construction and delivery of the blocks becomes more difficult. Delays in block construction at one shipyard, or delays in delivery caused by transportation problems, can seriously throw off the schedule for the delivery of the whole ship.
Figure 4: Product Oriented Work Breakdown Structure (PWBS)
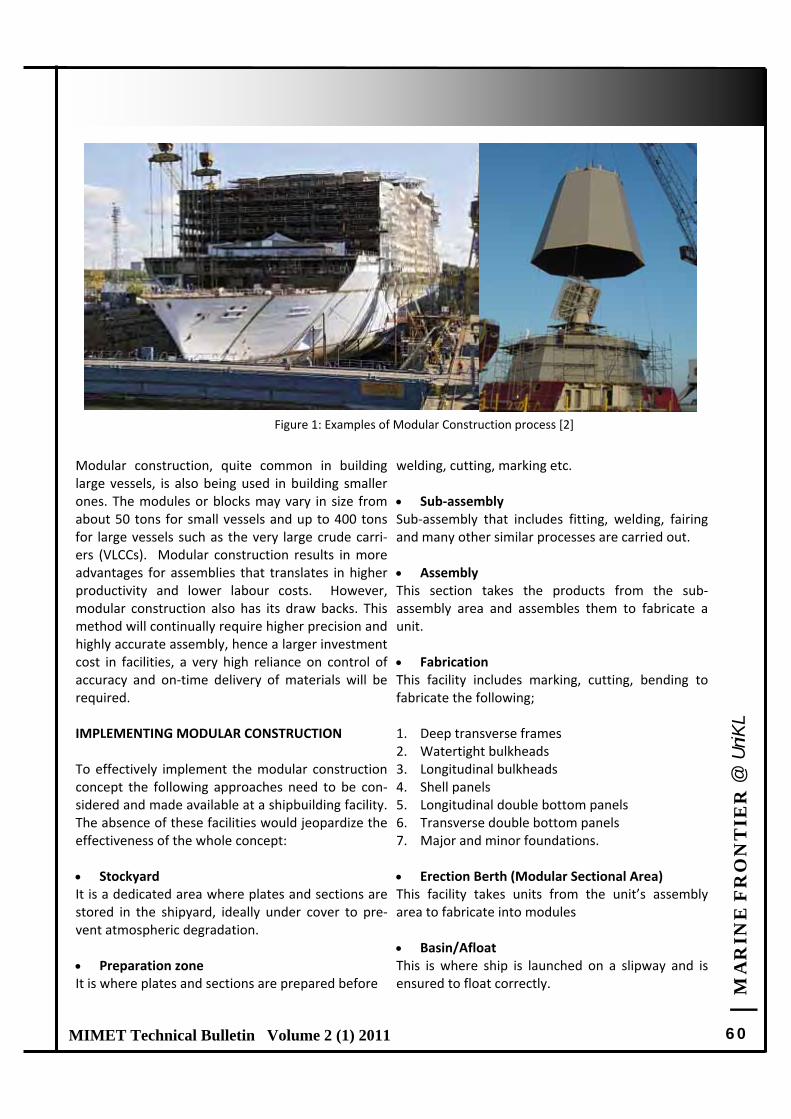
| M
AR
INE
FR
ON
TIE
R @
UniK
L
60 MIMET Technical Bulletin Volume 2 (1) 2011
Modular construction, quite common in building large vessels, is also being used in building smaller ones. The modules or blocks may vary in size from about 50 tons for small vessels and up to 400 tons for large vessels such as the very large crude carri‐ers (VLCCs). Modular construction results in more advantages for assemblies that translates in higher productivity and lower labour costs. However, modular construction also has its draw backs. This method will continually require higher precision and highly accurate assembly, hence a larger investment cost in facilities, a very high reliance on control of accuracy and on‐time delivery of materials will be required. IMPLEMENTING MODULAR CONSTRUCTION To effectively implement the modular construction concept the following approaches need to be con‐sidered and made available at a shipbuilding facility. The absence of these facilities would jeopardize the effectiveness of the whole concept: Stockyard It is a dedicated area where plates and sections are stored in the shipyard, ideally under cover to pre‐vent atmospheric degradation. Preparation zone It is where plates and sections are prepared before
welding, cutting, marking etc. Sub‐assembly Sub‐assembly that includes fitting, welding, fairing and many other similar processes are carried out. Assembly This section takes the products from the sub‐assembly area and assembles them to fabricate a unit. Fabrication This facility includes marking, cutting, bending to fabricate the following; 1. Deep transverse frames 2. Watertight bulkheads 3. Longitudinal bulkheads 4. Shell panels 5. Longitudinal double bottom panels 6. Transverse double bottom panels 7. Major and minor foundations. Erection Berth (Modular Sectional Area) This facility takes units from the unit’s assembly area to fabricate into modules Basin/Afloat This is where ship is launched on a slipway and is ensured to float correctly.
Figure 1: Examples of Modular Construction process [2]

| M
AR
INE
FR
ON
TIE
R @
UniK
L
61 MIMET Technical Bulletin Volume 2 (1) 2011
CONCLUSION It is obvious that modular construction process is capable of helping a shipyard becomes a dominant player in a modern shipbuilding industry. The bene‐fits of modular construction have demonstrated its capabilities to be more cost effective as compared to traditional methods, and have led to financial savings and reduced disruptions on site. These methods are being currently proven to be the most efficient technique to achieve the desired outcomes that satisfy both shipbuilders and customers.
Shipbuilders are less exposed to construction de‐lays, as time constraints always represent their ma‐jor concern in order to maintain the production mo‐mentum and reputation of the companies. Un‐
doubtedly, while still maintaining a good balance between cost, work‐force and quality control, modular constructions are preferably the best tech‐nique capable of increasing the growth of the ship‐building industry.
REFERENCES 1. Deans, D.C (2010). Modular Design and Con‐
struction of Warships. Available from: www.indiandefencereview.com (Accessed 11 Apr 2011)
2. Siddiqui, H (2008). Building Ships Made Easy. Available from: www.financial express.com (Accessed 17 Apr 2011)
3. Taggert, R (1980). Ship Design and Construction. 1st Edition. The Society of Naval Architects and Marine Engineers, New York.
| M
AR
INE
FR
ON
TIE
R @
UniK
L
62 MIMET Technical Bulletin Volume 2 (1) 2011
Feature Article 9 Feature Article 9
DEVELOPMENT OF LEGAL FRAMEWORK GOVERNING THE CARRIAGE OF LIQUIFIED NATURAL GAS (LNG) WITHIN COASTAL WATER FROM
CARRIER ASPECT (DESIGN SPECIFICATION)
ASMAWI ABDUL MALIK*
Department of Marine Construction and Maintenance Technology Malaysian Institute of Marine Engineering Technology, Universiti Kuala Lumpur Received: 2 Jan 2011; Revised: 23 Feb 2011 ; Accepted: 23 Feb 2011
ABSTRACT The inevitable LNG evolution into coastal waters had reflected the lack and absence of clear guidelines on legal frame‐work for governing the carriage of liquefied natural gas (LNG) within coastal water. IMO (Agenda item 21, MSC 83/INF.3/2007) does not pay much attention to sustainable coastal water transport development due to the novelty of such industry and the traditional procedures of UN developmental bodies, that normally needs sufficient time to consider new and emerging phenomenon in their agenda of work. Thus it is a major source of inefficiency and unsafe operation of the LNG carriage along the coast line. To date, there is no extension for LNG carriage within coastal waters on every estab‐lished rules and regulation. The main purpose of this study is to develop a legal framework model for the LNG transporta‐tion and carriage by using the IDEF0 structured modeling technique. The modeling process is divided into three phases, (i) the information gathering, (ii) the model development and (ii) the experts’ evaluation and validation. In the first phase, information on existing current legal practices were obtained through the literature study from applicable rules, regula‐tions, conventions, procedures, policies, research papers and accident cases. In the second phase, a process model was drafted through an iterative process using the IDEF0 and the questionnaire is developed. From the questionnaire pilot test, each question blocks has shown an acceptable Cronbach’s Alpha value which is above 0.70. In the third phase, the preliminary of legal framework model is tested through forty five (45) potential respondents from various fields in legal practices and thirty eight (38) responded. A promising result was obtained where data exhibit normal distribution trend, even though every group has their own stand on the legal framework. The ANOVA output has generated P‐values of 0.000. If P is less than or equal to the a‐level, one or more mean value are significantly different. Through data correla‐tion test, the correlated element blocks show a range of 0.0 to 0.4. A legal framework model for the LNG carriage within coastal water was constructed in the stand alone mode covering each aspect.
Keywords : Legal framework model, LNG carriage, structured modelling technique definition, Cronbach’s Alpha, NOVA and Correlation.
Corresponding Author: [email protected]
INTRODUCTION
In tandem with the increasing Liquefied Natural Gas (LNG) production in the emerging market, the LNG is depleting fast and will be required on a major scale to feed the world’s biggest gas market. Therefore, attention is needed to focus largely on the safety and security of LNG trans‐ported by marine transportation at commercial facilities near populated areas. As the nation’s LNG facility become developed, there is no spe‐cial framework for the LNG coastal transporta‐tion. In response to the overall safety and secu‐rity environment requirement, it is wise to seek a coastal water legal framework covering a broader understanding of hazardous chemical marine shipments and efforts to secure them. Recognizing these fatal factors is important in promoting for a legal framework for LNG trans‐portation in coastal water.
OBJECTIVE OF THE RESEARCH
The research on development of legal frame‐work governing the carriage of LNG within coastal water is expected to derive:
relevant element(s) for a legal framework on the carriage of LNG within coastal water
RESEARCH STATEMENT
In order to create relevant legal framework ele‐ment (s), several situations identified are to influence factors for safe transportation. The situations are as follows:
Liberalization of importers power and gas market
Number of receiving or discharging
Geographical topography that reduces the ability of LNG transportation.
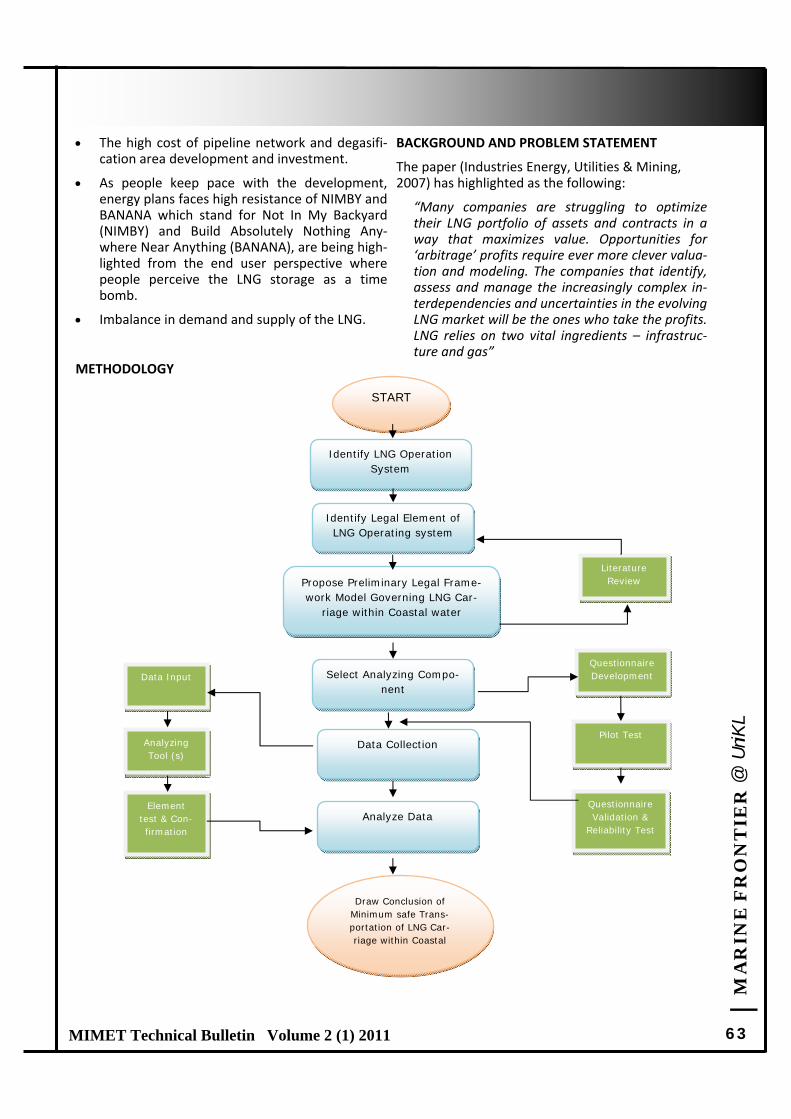
| M
AR
INE
FR
ON
TIE
R @
UniK
L
63 MIMET Technical Bulletin Volume 2 (1) 2011
The high cost of pipeline network and degasifi‐cation area development and investment.
As people keep pace with the development, energy plans faces high resistance of NIMBY and BANANA which stand for Not In My Backyard (NIMBY) and Build Absolutely Nothing Any‐where Near Anything (BANANA), are being high‐lighted from the end user perspective where people perceive the LNG storage as a time bomb.
Imbalance in demand and supply of the LNG.
METHODOLOGY
BACKGROUND AND PROBLEM STATEMENT
The paper (Industries Energy, Utilities & Mining, 2007) has highlighted as the following:
“Many companies are struggling to optimize their LNG portfolio of assets and contracts in a way that maximizes value. Opportunities for ‘arbitrage’ profits require ever more clever valua‐tion and modeling. The companies that identify, assess and manage the increasingly complex in‐terdependencies and uncertainties in the evolving LNG market will be the ones who take the profits. LNG relies on two vital ingredients – infrastruc‐ture and gas”
START
Identify LNG Operation System
Identify Legal Element of LNG Operating system
Propose Preliminary Legal Frame-work Model Governing LNG Car-
riage within Coastal water
Select Analyzing Compo-nent
Data Collection
Analyze Data
Draw Conclusion of Minimum safe Trans-portation of LNG Car-riage within Coastal
Literature Review
Questionnaire Development
Pilot Test
Questionnaire Validation &
Reliability Test
Data Input
Analyzing Tool (s)
Element test & Con-firmation
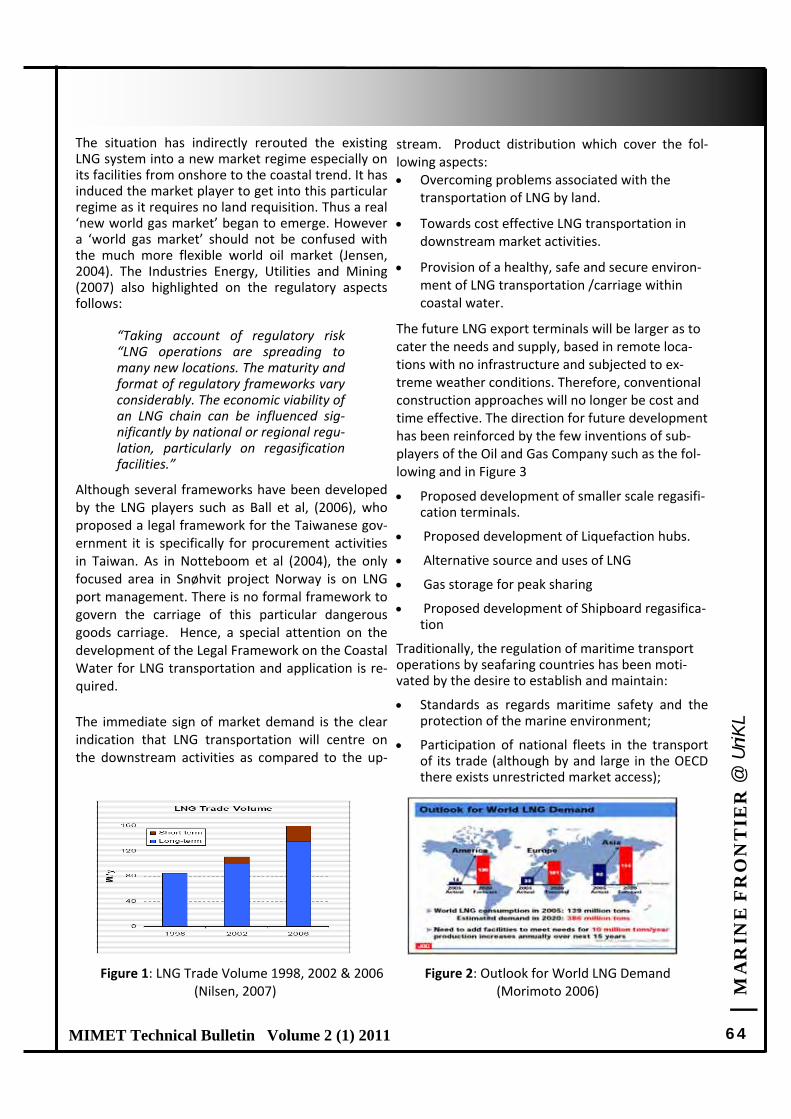
| M
AR
INE
FR
ON
TIE
R @
UniK
L
64 MIMET Technical Bulletin Volume 2 (1) 2011
The situation has indirectly rerouted the existing LNG system into a new market regime especially on its facilities from onshore to the coastal trend. It has induced the market player to get into this particular regime as it requires no land requisition. Thus a real ‘new world gas market’ began to emerge. However a ‘world gas market’ should not be confused with the much more flexible world oil market (Jensen, 2004). The Industries Energy, Utilities and Mining (2007) also highlighted on the regulatory aspects follows:
“Taking account of regulatory risk “LNG operations are spreading to many new locations. The maturity and format of regulatory frameworks vary considerably. The economic viability of an LNG chain can be influenced sig‐nificantly by national or regional regu‐lation, particularly on regasification facilities.”
Although several frameworks have been developed by the LNG players such as Ball et al, (2006), who proposed a legal framework for the Taiwanese gov‐ernment it is specifically for procurement activities in Taiwan. As in Notteboom et al (2004), the only focused area in Snøhvit project Norway is on LNG port management. There is no formal framework to govern the carriage of this particular dangerous goods carriage. Hence, a special attention on the development of the Legal Framework on the Coastal Water for LNG transportation and application is re‐quired. The immediate sign of market demand is the clear indication that LNG transportation will centre on the downstream activities as compared to the up‐
stream. Product distribution which cover the fol‐lowing aspects: Overcoming problems associated with the
transportation of LNG by land.
Towards cost effective LNG transportation in downstream market activities.
Provision of a healthy, safe and secure environ‐ment of LNG transportation /carriage within coastal water.
The future LNG export terminals will be larger as to cater the needs and supply, based in remote loca‐tions with no infrastructure and subjected to ex‐treme weather conditions. Therefore, conventional construction approaches will no longer be cost and time effective. The direction for future development has been reinforced by the few inventions of sub‐players of the Oil and Gas Company such as the fol‐lowing and in Figure 3
Proposed development of smaller scale regasifi‐cation terminals.
Proposed development of Liquefaction hubs.
Alternative source and uses of LNG
Gas storage for peak sharing
Proposed development of Shipboard regasifica‐tion
Traditionally, the regulation of maritime transport operations by seafaring countries has been moti‐vated by the desire to establish and maintain:
Standards as regards maritime safety and the protection of the marine environment;
Participation of national fleets in the transport of its trade (although by and large in the OECD there exists unrestricted market access);
Figure 1: LNG Trade Volume 1998, 2002 & 2006 (Nilsen, 2007)
Figure 2: Outlook for World LNG Demand (Morimoto 2006)
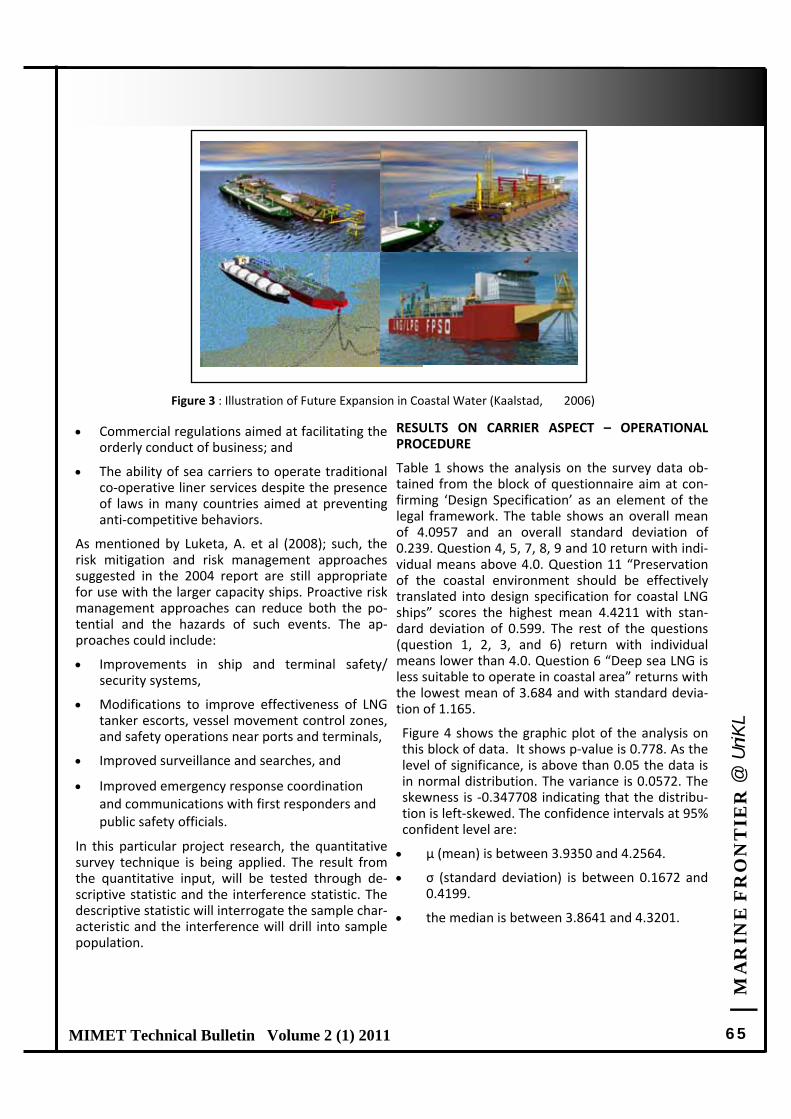
| M
AR
INE
FR
ON
TIE
R @
UniK
L
65 MIMET Technical Bulletin Volume 2 (1) 2011
Commercial regulations aimed at facilitating the orderly conduct of business; and
The ability of sea carriers to operate traditional co‐operative liner services despite the presence of laws in many countries aimed at preventing anti‐competitive behaviors.
As mentioned by Luketa, A. et al (2008); such, the risk mitigation and risk management approaches suggested in the 2004 report are still appropriate for use with the larger capacity ships. Proactive risk management approaches can reduce both the po‐tential and the hazards of such events. The ap‐proaches could include:
Improvements in ship and terminal safety/security systems,
Modifications to improve effectiveness of LNG tanker escorts, vessel movement control zones, and safety operations near ports and terminals,
Improved surveillance and searches, and
Improved emergency response coordination and communications with first responders and public safety officials.
In this particular project research, the quantitative survey technique is being applied. The result from the quantitative input, will be tested through de‐scriptive statistic and the interference statistic. The descriptive statistic will interrogate the sample char‐acteristic and the interference will drill into sample population.
RESULTS ON CARRIER ASPECT – OPERATIONAL PROCEDURE
Table 1 shows the analysis on the survey data ob‐tained from the block of questionnaire aim at con‐firming ‘Design Specification’ as an element of the legal framework. The table shows an overall mean of 4.0957 and an overall standard deviation of 0.239. Question 4, 5, 7, 8, 9 and 10 return with indi‐vidual means above 4.0. Question 11 “Preservation of the coastal environment should be effectively translated into design specification for coastal LNG ships” scores the highest mean 4.4211 with stan‐dard deviation of 0.599. The rest of the questions (question 1, 2, 3, and 6) return with individual means lower than 4.0. Question 6 “Deep sea LNG is less suitable to operate in coastal area” returns with the lowest mean of 3.684 and with standard devia‐tion of 1.165.
Figure 4 shows the graphic plot of the analysis on this block of data. It shows p‐value is 0.778. As the level of significance, is above than 0.05 the data is in normal distribution. The variance is 0.0572. The skewness is ‐0.347708 indicating that the distribu‐tion is left‐skewed. The confidence intervals at 95% confident level are:
µ (mean) is between 3.9350 and 4.2564.
σ (standard deviation) is between 0.1672 and 0.4199.
the median is between 3.8641 and 4.3201.
Figure 3 : Illustration of Future Expansion in Coastal Water (Kaalstad, 2006)
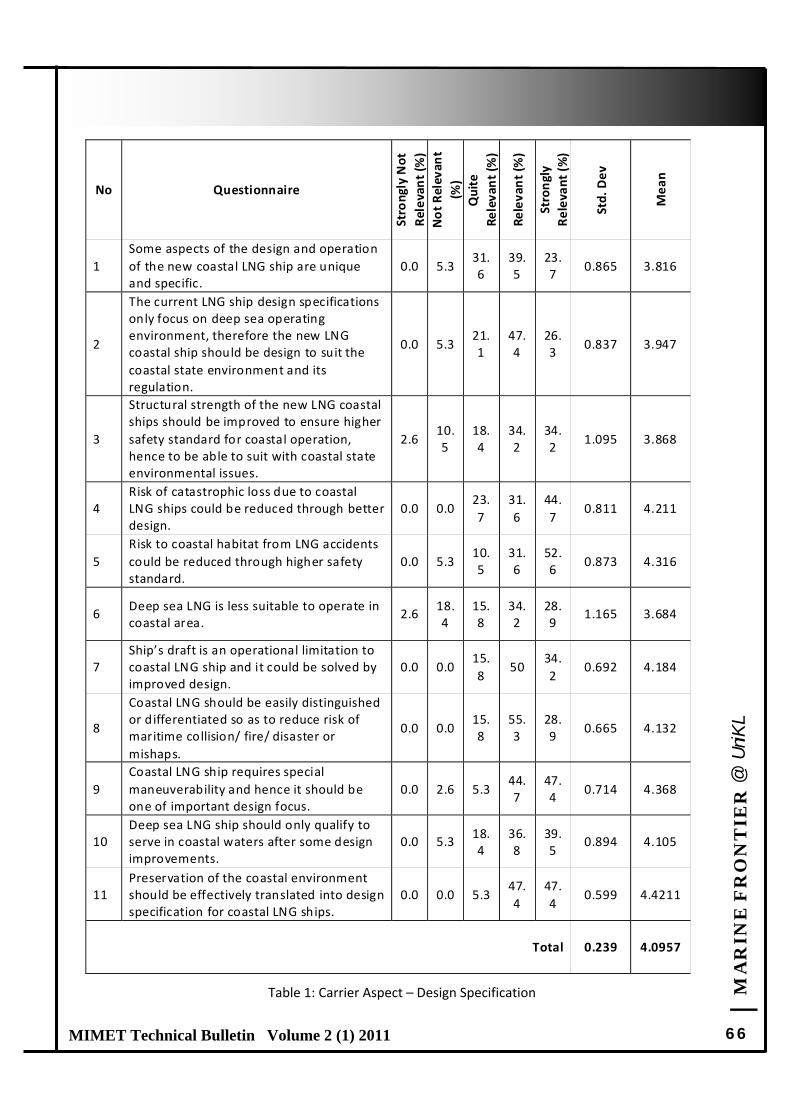
| M
AR
INE
FR
ON
TIE
R @
UniK
L
66 MIMET Technical Bulletin Volume 2 (1) 2011
No Questionnaire
Strongly Not
Relevant (%
)
Not Relevan
t
(%)
Quite
Relevan
t (%
)
Relevan
t (%
)
Strongly
Relevant (%
)
Std. Dev
Mean
1
Some aspects of the design and operation
of the new coastal LNG ship are unique and specific.
0.0 5.3 31.6
39.5
23.7
0.865 3.816
2
The current LNG ship design specifications only focus on deep sea operating environment, therefore the new LNG coastal ship should be design to suit the
coastal state environment and its regulation.
0.0 5.3 21.1
47.4
26.3
0.837 3.947
3
Structural strength of the new LNG coastal ships should be improved to ensure higher
safety standard for coastal operation, hence to be able to suit with coastal state environmental issues.
2.6 10.5
18.4
34.2
34.2
1.095 3.868
4 Risk of catastrophic loss due to coastal LNG ships could be reduced through better design.
0.0 0.0 23.
7
31.
6
44.
7 0.811 4.211
5
Risk to coastal habitat from LNG accidents
could be reduced through higher safety standard.
0.0 5.3 10.5
31.6
52.6
0.873 4.316
6 Deep sea LNG is less suitable to operate in coastal area.
2.6 18.4
15.8
34.2
28.9
1.165
3.684
7 Ship’s draft is an operational limitation to coastal LNG ship and it could be solved by improved design.
0.0 0.0 15.
8 50
34.
2 0.692 4.184
8
Coastal LNG should be easily distinguished or differentiated so as to reduce risk of maritime collision/ fire/ disaster or
mishaps.
0.0 0.0 15.8
55.3
28.9
0.665 4.132
9
Coastal LNG ship requires special
maneuverability and hence it should be one of important design focus.
0.0 2.6 5.3 44.7
47.4
0.714 4.368
10 Deep sea LNG ship should only qualify to serve in coastal waters after some design improvements.
0.0 5.3 18.4
36.8
39.5
0.894 4.105
11 Preservation of the coastal environment should be effectively translated into design specification for coastal LNG ships.
0.0 0.0 5.3 47.
4
47.
4 0.599 4.4211
Total 0.239 4.0957
Table 1: Carrier Aspect – Design Specification
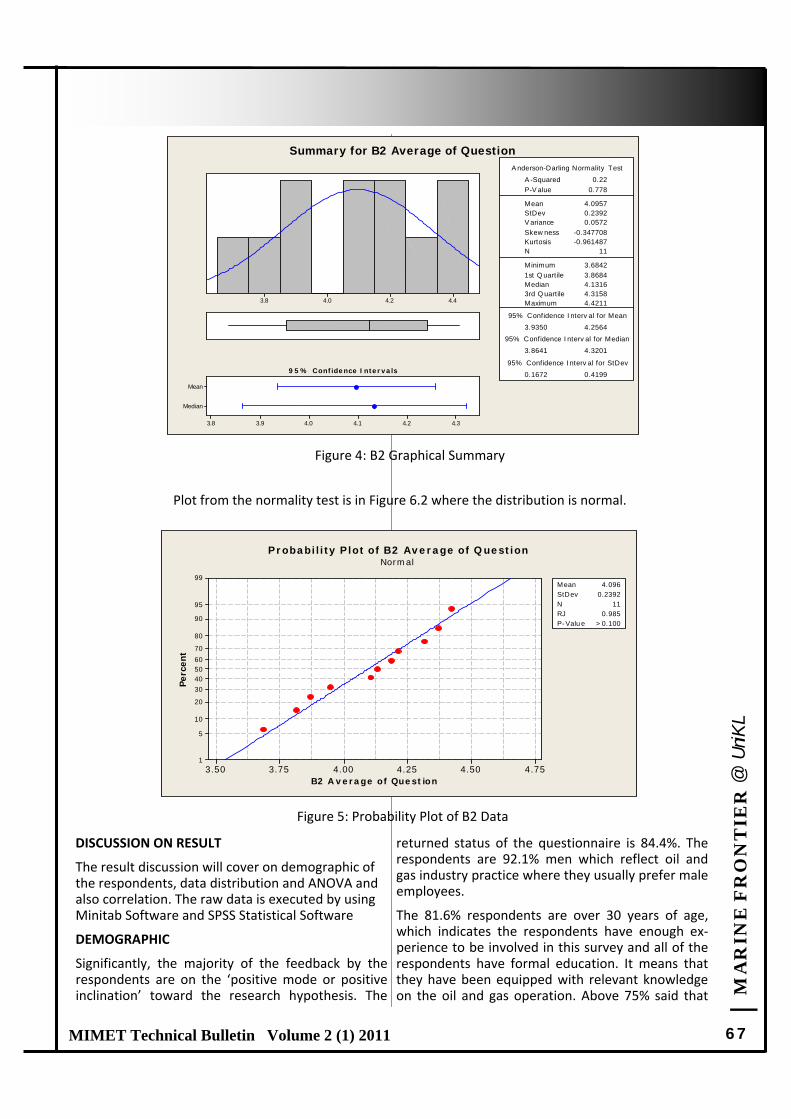
| M
AR
INE
FR
ON
TIE
R @
UniK
L
67 MIMET Technical Bulletin Volume 2 (1) 2011
4.44.24.03.8
Median
Mean
4.34.24.14.03.93.8
A nderson-Darling Normality Test
V ariance 0.0572Skew ness -0.347708Kurtosis -0.961487N 11
M inimum 3.6842
A -Squared
1st Q uartile 3.8684M edian 4.13163rd Q uartile 4.3158M aximum 4.4211
95% C onfidence Interv al for M ean
3.9350
0.22
4.2564
95% C onfidence Interv al for M edian
3.8641 4.3201
95% C onfidence Interv al for S tDev
0.1672 0.4199
P -V alue 0.778
M ean 4.0957S tDev 0.2392
9 5 % C onfidence Inter vals
Summary for B2 Average of Question
B2 A v erage of Quest ion
Perc
ent
4.754.504.254.003.753.50
99
95
90
80
70
60504030
20
10
5
1
M ean
>0.100
4.096S tD ev 0.2392N 11RJ 0.985P -Valu e
Probability P lot of B2 Average of Q uestionNorm al
Figure 4: B2 Graphical Summary
Plot from the normality test is in Figure 6.2 where the distribution is normal.
Figure 5: Probability Plot of B2 Data
DISCUSSION ON RESULT
The result discussion will cover on demographic of the respondents, data distribution and ANOVA and also correlation. The raw data is executed by using Minitab Software and SPSS Statistical Software
DEMOGRAPHIC
Significantly, the majority of the feedback by the respondents are on the ‘positive mode or positive inclination’ toward the research hypothesis. The
returned status of the questionnaire is 84.4%. The respondents are 92.1% men which reflect oil and gas industry practice where they usually prefer male employees.
The 81.6% respondents are over 30 years of age, which indicates the respondents have enough ex‐perience to be involved in this survey and all of the respondents have formal education. It means that they have been equipped with relevant knowledge on the oil and gas operation. Above 75% said that
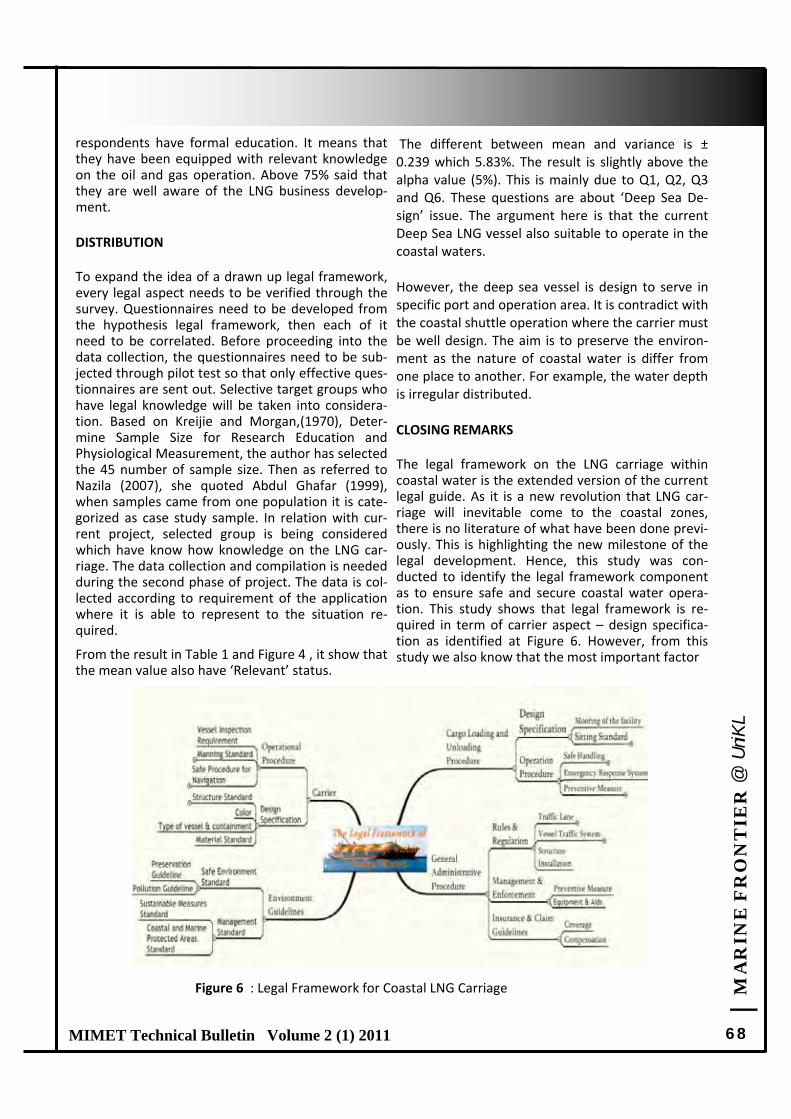
| M
AR
INE
FR
ON
TIE
R @
UniK
L
68 MIMET Technical Bulletin Volume 2 (1) 2011
respondents have formal education. It means that they have been equipped with relevant knowledge on the oil and gas operation. Above 75% said that they are well aware of the LNG business develop‐ment. DISTRIBUTION To expand the idea of a drawn up legal framework, every legal aspect needs to be verified through the survey. Questionnaires need to be developed from the hypothesis legal framework, then each of it need to be correlated. Before proceeding into the data collection, the questionnaires need to be sub‐jected through pilot test so that only effective ques‐tionnaires are sent out. Selective target groups who have legal knowledge will be taken into considera‐tion. Based on Kreijie and Morgan,(1970), Deter‐mine Sample Size for Research Education and Physiological Measurement, the author has selected the 45 number of sample size. Then as referred to Nazila (2007), she quoted Abdul Ghafar (1999), when samples came from one population it is cate‐gorized as case study sample. In relation with cur‐rent project, selected group is being considered which have know how knowledge on the LNG car‐riage. The data collection and compilation is needed during the second phase of project. The data is col‐lected according to requirement of the application where it is able to represent to the situation re‐quired.
From the result in Table 1 and Figure 4 , it show that the mean value also have ‘Relevant’ status.
The different between mean and variance is ± 0.239 which 5.83%. The result is slightly above the alpha value (5%). This is mainly due to Q1, Q2, Q3 and Q6. These questions are about ‘Deep Sea De‐sign’ issue. The argument here is that the current Deep Sea LNG vessel also suitable to operate in the coastal waters. However, the deep sea vessel is design to serve in specific port and operation area. It is contradict with the coastal shuttle operation where the carrier must be well design. The aim is to preserve the environ‐ment as the nature of coastal water is differ from one place to another. For example, the water depth is irregular distributed. CLOSING REMARKS The legal framework on the LNG carriage within coastal water is the extended version of the current legal guide. As it is a new revolution that LNG car‐riage will inevitable come to the coastal zones, there is no literature of what have been done previ‐ously. This is highlighting the new milestone of the legal development. Hence, this study was con‐ducted to identify the legal framework component as to ensure safe and secure coastal water opera‐tion. This study shows that legal framework is re‐quired in term of carrier aspect – design specifica‐tion as identified at Figure 6. However, from this study we also know that the most important factor
Figure 6 : Legal Framework for Coastal LNG Carriage

| M
AR
INE
FR
ON
TIE
R @
UniK
L
69 MIMET Technical Bulletin Volume 2 (1) 2011
is safe handling. The legal framework is expected to reduce the implication and impact to the surround‐ing in the event of mishandling or any mishaps. RECOMMENDATIONS AND SUGGESTIONS
Based on the finding of the study, here are some recommendation and suggestion in the hope to as‐sist future researcher and for the benefit of all LNG group of people. Based on the intended setting of the study, it would be fruitful for future researcher to get more elements included in the framework. It can be done with further research and conference involvement. Collaboration with oil and gas compa‐nies such as MISC, PETRONAS and SHELL would bring about greater point of view. Experience in ad‐miralty cases would produce greater impact on the legal framework development. Future researchers have to look into the possibility to expand the com‐ponents.
REFERENCES
1. Industries Energy, Utilities & Mining, (2007), Value and Growth in the liquefied natural gas market. [Brochure]. Price Water House Coo‐pers
2. Kaalstad, J.,P., (2006), Offshore LNG Terminals Capital Markets Day, APL Incorporation
3. Krejcie, R., V., and Morgan, D., W., (1970), De‐termining Sample Sizes for Research Activities: Educational and Psyhological Measurement, 30(3): 607 – 610
4. Koji Morita (2003), “LNG: Falling Prices and Increasing Flexibility of Supply—Risk Redistri‐bution Creates Contract Diversity,” Interna‐tional Institute of Energy Economics, Japan.
5. Luketa, A., M., and Michael, H., Steve A., (2008), Breach and Safety Analysis of Spills Over Water from Large Liquefied Natural Gas Carriers, Sandia Report
6. Maritime Safety Committee, (2007), Formal Safety Assessment of Liquefied Natural Gas (LNG), Carriers, International Maritime Or‐ganization (IMO)
7. Morimoto, S., (2006), Fiscal 2006 Interim Re‐sult Briefing, JGC Corporation
8. Nazila Abdullah (2007), Kajian Terhadap Kae‐dah Mengajar, Kefahaman, dan Pandangan Guru Terhadap Konsep Sekolah Bestari di Se‐buah Sekolah di Daerah Kulai, Universiti Teknologi Malaysia
9. Revised Draft EIR (2006), Cabrillo Port Lique‐fied Natural Gas Deepwater Port
| M
AR
INE
FR
ON
TIE
R @
UniK
L
70 MIMET Technical Bulletin Volume 2 (1) 2011
Feature Article 10 Feature Article 10
WAKE ADAPTED PROPELLER DESIGN BASED ON LIFTING LINE AND LIFTING SURFACE THEORY
IWAN ZAMIL MUSTAFFA KAMAL*,MOHAMAD SYAIFUL BAHARI MOHD SALLEH
Department of Marine & Design Technology, BET in Naval Architecture & Shipbuilding
Malaysian Institute of Marine Engineering Technology, Universiti Kuala Lumpur Received: 24 May 2011; Revised: 26 May 2011; Accepted: 27 May 2011
ABSTRACT This paper is aimed at researching on the procedures of designing wake‐adapted propellers. Priority is given to lifting line and lifting surface theories which produce good results in the incorporation of wake‐adapted factors. In this paper the utilization of current theories of lifting line and lifting surface are explained. The evaluation of the results obtained will be further analyzed in this paper. Finally some conclusion to the results of the study will be made along with appendix which contains flow chart of the design method used in the calculation.
Keywords : wake‐adapted propellers
Corresponding Author: [email protected]
INTRODUCTION
The main purpose of this paper is to demon‐strate on the calculation of wake adapted pro‐pellers using lifting line and lifting surface theo‐ries. In the process leading to the calculation of the design of wake‐adapted propellers, some literature review has to be done on the concept of the propeller theories presented by some prominent researchers.
It starts with the work of Prandtl, Betz and Hem‐bold in Germany led to the development of cir‐culation theory of propellers and lifting line the‐ory using induction factors. In 1955, propellers began to be designed on the computer, which enabled propellers to be designed using induc‐tion factors. These factors were a big advance because they make wake adapted propellers possible where the flow just before at the en‐trance of the suction of propeller is not always uniform due to the boundary layer around the stern region which is defined as wake.
RESEARCH PROBLEM STATEMENT Many methods and theories about propellers have evolved over the past years, from initial design by imagination, to a systematic series of
a wide range of propeller types. Progresses were made by Taylor, Troost and others with system‐atic series which derived from tests of model propellers in methodical series. However, the need of propellers for ever‐increasing powers and speeds cannot be met satisfactorily by a few series of propellers with a limited number of variations. Cavitation, vibration, and noise can‐not be properly solved by just referring to the charts. The introduction of the vortex theory by Lanchester in 1907 enabled the evolution of the theoretical part of propeller design to progress with good results. Prandtl in 1918 developed a mathematical solution to the basic lifting line theory for extension of the theory to propellers. Helmbold (1926) and Goldstein (1929) further developed these concepts for practical applica‐tion to propeller design. The incorporation of wake considerations into the propeller design resulted in a more accurate prediction of propel‐ler characteristics. The introduction of the lifting surface theory further enhanced the credibility of the design process by taking into account the radial distribution of thickness of each propeller blade.
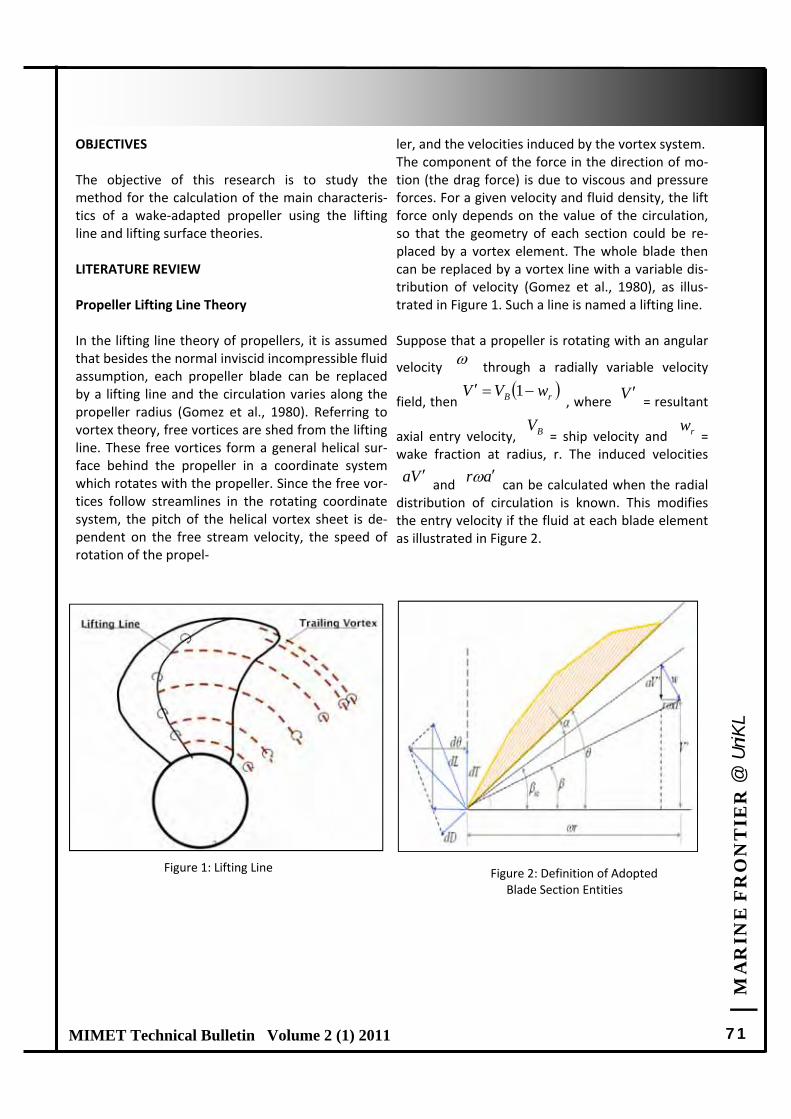
| M
AR
INE
FR
ON
TIE
R @
UniK
L
71 MIMET Technical Bulletin Volume 2 (1) 2011
OBJECTIVES The objective of this research is to study the method for the calculation of the main characteris‐tics of a wake‐adapted propeller using the lifting line and lifting surface theories. LITERATURE REVIEW Propeller Lifting Line Theory In the lifting line theory of propellers, it is assumed that besides the normal inviscid incompressible fluid assumption, each propeller blade can be replaced by a lifting line and the circulation varies along the propeller radius (Gomez et al., 1980). Referring to vortex theory, free vortices are shed from the lifting line. These free vortices form a general helical sur‐face behind the propeller in a coordinate system which rotates with the propeller. Since the free vor‐tices follow streamlines in the rotating coordinate system, the pitch of the helical vortex sheet is de‐pendent on the free stream velocity, the speed of rotation of the propel‐
ler, and the velocities induced by the vortex system. The component of the force in the direction of mo‐tion (the drag force) is due to viscous and pressure forces. For a given velocity and fluid density, the lift force only depends on the value of the circulation, so that the geometry of each section could be re‐placed by a vortex element. The whole blade then can be replaced by a vortex line with a variable dis‐tribution of velocity (Gomez et al., 1980), as illus‐trated in Figure 1. Such a line is named a lifting line. Suppose that a propeller is rotating with an angular
velocity through a radially variable velocity
field, then , where = resultant
axial entry velocity, = ship velocity and = wake fraction at radius, r. The induced velocities
and can be calculated when the radial distribution of circulation is known. This modifies the entry velocity if the fluid at each blade element as illustrated in Figure 2.
rB wVV 1 V
BV rw
Va ar
Figure 1: Lifting Line Figure 2: Definition of Adopted Blade Section Entities
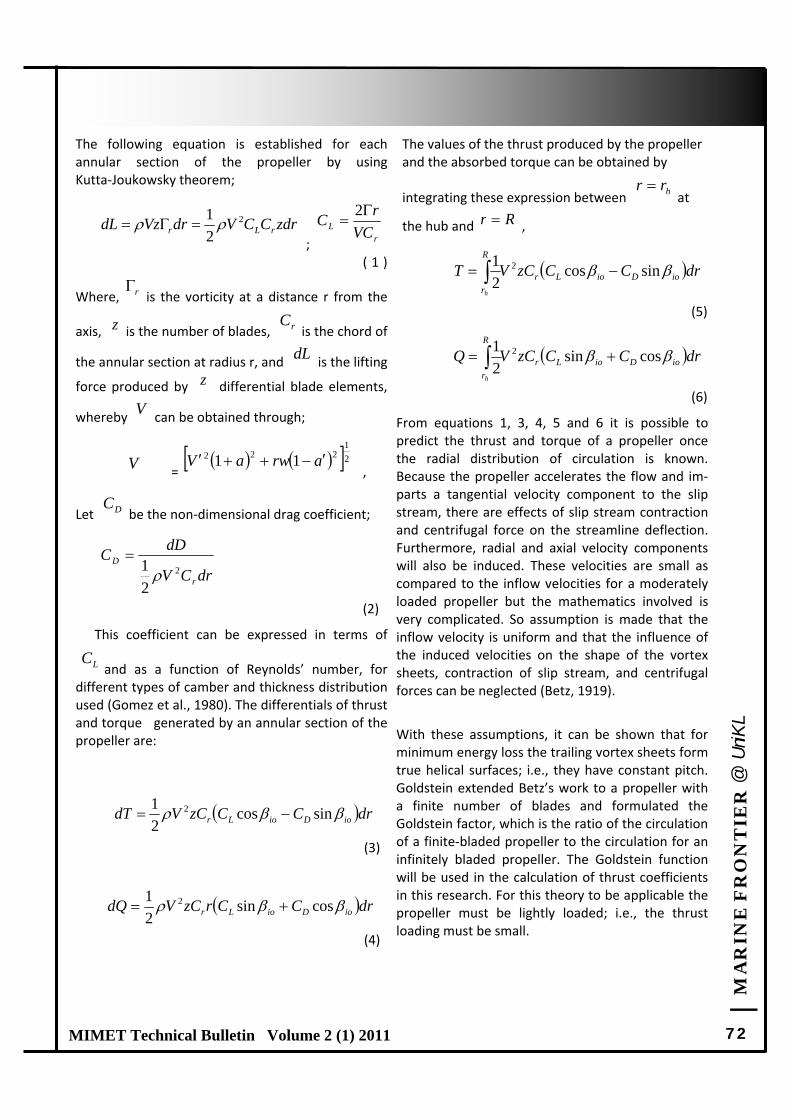
| M
AR
INE
FR
ON
TIE
R @
UniK
L
72 MIMET Technical Bulletin Volume 2 (1) 2011
The following equation is established for each annular section of the propeller by using Kutta‐Joukowsky theorem;
; ( 1 )
Where, is the vorticity at a distance r from the
axis, is the number of blades, is the chord of
the annular section at radius r, and is the lifting
force produced by differential blade elements,
whereby can be obtained through;
= ,
Let be the non‐dimensional drag coefficient;
(2)
This coefficient can be expressed in terms of
and as a function of Reynolds’ number, for different types of camber and thickness distribution used (Gomez et al., 1980). The differentials of thrust and torque generated by an annular section of the propeller are:
(3)
(4)
The values of the thrust produced by the propeller and the absorbed torque can be obtained by
integrating these expression between at
the hub and ,
(5)
(6)
From equations 1, 3, 4, 5 and 6 it is possible to predict the thrust and torque of a propeller once the radial distribution of circulation is known. Because the propeller accelerates the flow and im‐parts a tangential velocity component to the slip stream, there are effects of slip stream contraction and centrifugal force on the streamline deflection. Furthermore, radial and axial velocity components will also be induced. These velocities are small as compared to the inflow velocities for a moderately loaded propeller but the mathematics involved is very complicated. So assumption is made that the inflow velocity is uniform and that the influence of the induced velocities on the shape of the vortex sheets, contraction of slip stream, and centrifugal forces can be neglected (Betz, 1919).
With these assumptions, it can be shown that for minimum energy loss the trailing vortex sheets form true helical surfaces; i.e., they have constant pitch. Goldstein extended Betz’s work to a propeller with a finite number of blades and formulated the Goldstein factor, which is the ratio of the circulation of a finite‐bladed propeller to the circulation for an infinitely bladed propeller. The Goldstein function will be used in the calculation of thrust coefficients in this research. For this theory to be applicable the propeller must be lightly loaded; i.e., the thrust loading must be small.
zdrCCVdrVzdL rLr2
2
1 r
L VC
rC
2
r
z rC
dL
z
V
V 21222 11 arwaV
DC
drCV
dDC
r
D2
2
1
LC
drCCzCVdT ioDioLr sincos2
1 2
drCCrzCVdQ ioDioLr cossin2
1 2
hrr
Rr
drCCzCVT ioDioLr
R
rh
sincos2
1 2
drCCzCVQ ioDioLr
R
rh
cossin2
1 2
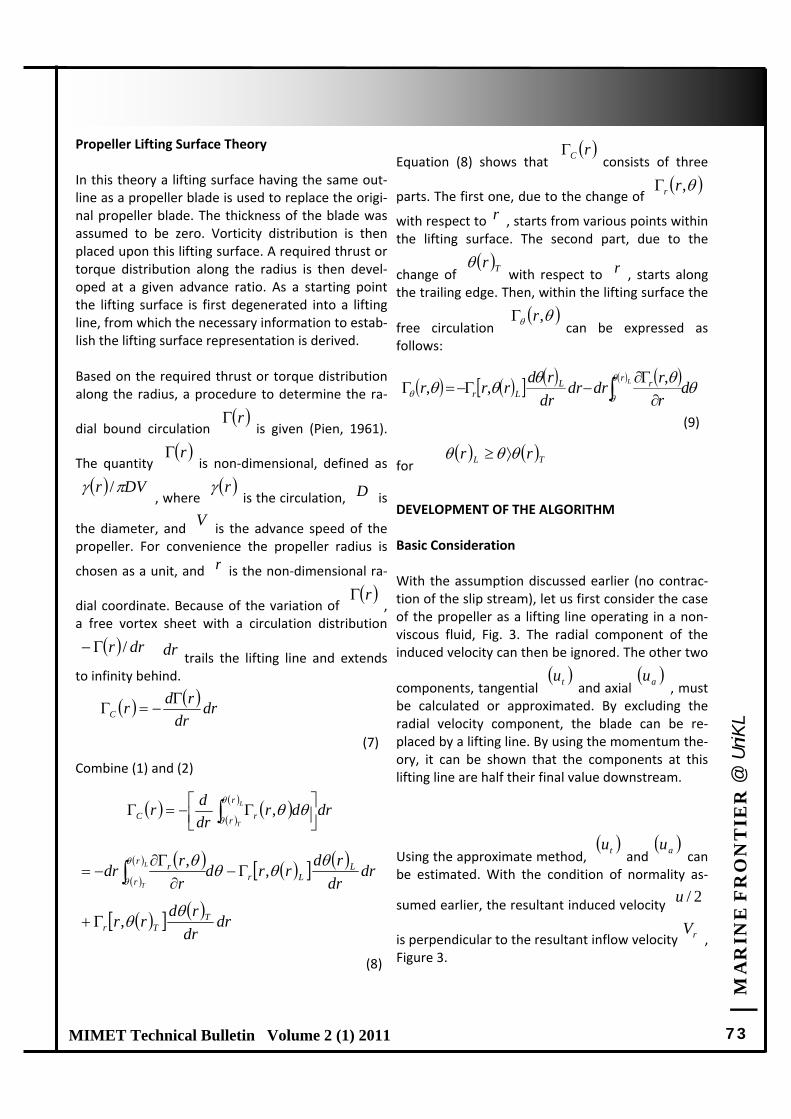
| M
AR
INE
FR
ON
TIE
R @
UniK
L
73 MIMET Technical Bulletin Volume 2 (1) 2011
Propeller Lifting Surface Theory In this theory a lifting surface having the same out‐line as a propeller blade is used to replace the origi‐nal propeller blade. The thickness of the blade was assumed to be zero. Vorticity distribution is then placed upon this lifting surface. A required thrust or torque distribution along the radius is then devel‐oped at a given advance ratio. As a starting point the lifting surface is first degenerated into a lifting line, from which the necessary information to estab‐lish the lifting surface representation is derived. Based on the required thrust or torque distribution along the radius, a procedure to determine the ra‐
dial bound circulation is given (Pien, 1961).
The quantity is non‐dimensional, defined as
, where is the circulation, is
the diameter, and is the advance speed of the propeller. For convenience the propeller radius is
chosen as a unit, and is the non‐dimensional ra‐
dial coordinate. Because of the variation of , a free vortex sheet with a circulation distribution
trails the lifting line and extends to infinity behind.
(7)
Combine (1) and (2)
(8)
Equation (8) shows that consists of three
parts. The first one, due to the change of
with respect to , starts from various points within the lifting surface. The second part, due to the
change of with respect to , starts along the trailing edge. Then, within the lifting surface the
free circulation can be expressed as follows:
(9)
for
DEVELOPMENT OF THE ALGORITHM Basic Consideration With the assumption discussed earlier (no contrac‐tion of the slip stream), let us first consider the case of the propeller as a lifting line operating in a non‐viscous fluid, Fig. 3. The radial component of the induced velocity can then be ignored. The other two
components, tangential and axial , must be calculated or approximated. By excluding the radial velocity component, the blade can be re‐placed by a lifting line. By using the momentum the‐ory, it can be shown that the components at this lifting line are half their final value downstream.
Using the approximate method, and can be estimated. With the condition of normality as‐
sumed earlier, the resultant induced velocity
is perpendicular to the resultant inflow velocity , Figure 3.
r
r
DVr / r D
V
r
r
drr / dr
dr
dr
rdrC
drdr
dr
dr
L
T
r
r rC
,
dr
dr
rdrrd
r
rdr L
Lr
r
r
rL
T
,
,
dr
dr
rdrr T
Tr
,
rC
,rr
r
Tr r
,r
dr
rdrdr
dr
rdrrr
LrrL
Lr
,
,,
TL rr
tu au
tu au
2/u
rV
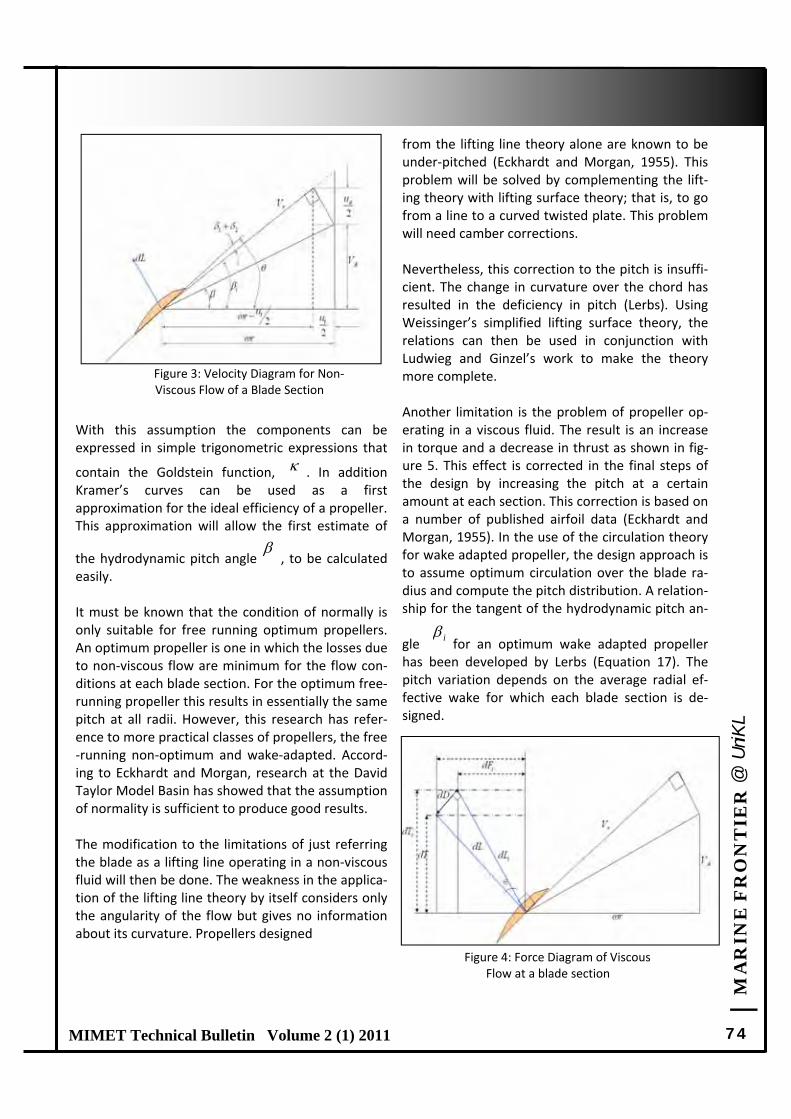
| M
AR
INE
FR
ON
TIE
R @
UniK
L
74 MIMET Technical Bulletin Volume 2 (1) 2011
With this assumption the components can be expressed in simple trigonometric expressions that
contain the Goldstein function, . In addition Kramer’s curves can be used as a first approximation for the ideal efficiency of a propeller. This approximation will allow the first estimate of
the hydrodynamic pitch angle , to be calculated easily. It must be known that the condition of normally is only suitable for free running optimum propellers. An optimum propeller is one in which the losses due to non‐viscous flow are minimum for the flow con‐ditions at each blade section. For the optimum free‐running propeller this results in essentially the same pitch at all radii. However, this research has refer‐ence to more practical classes of propellers, the free‐running non‐optimum and wake‐adapted. Accord‐ing to Eckhardt and Morgan, research at the David Taylor Model Basin has showed that the assumption of normality is sufficient to produce good results. The modification to the limitations of just referring the blade as a lifting line operating in a non‐viscous fluid will then be done. The weakness in the applica‐tion of the lifting line theory by itself considers only the angularity of the flow but gives no information about its curvature. Propellers designed
from the lifting line theory alone are known to be under‐pitched (Eckhardt and Morgan, 1955). This problem will be solved by complementing the lift‐ing theory with lifting surface theory; that is, to go from a line to a curved twisted plate. This problem will need camber corrections. Nevertheless, this correction to the pitch is insuffi‐cient. The change in curvature over the chord has resulted in the deficiency in pitch (Lerbs). Using Weissinger’s simplified lifting surface theory, the relations can then be used in conjunction with Ludwieg and Ginzel’s work to make the theory more complete. Another limitation is the problem of propeller op‐erating in a viscous fluid. The result is an increase in torque and a decrease in thrust as shown in fig‐ure 5. This effect is corrected in the final steps of the design by increasing the pitch at a certain amount at each section. This correction is based on a number of published airfoil data (Eckhardt and Morgan, 1955). In the use of the circulation theory for wake adapted propeller, the design approach is to assume optimum circulation over the blade ra‐dius and compute the pitch distribution. A relation‐ship for the tangent of the hydrodynamic pitch an‐
gle for an optimum wake adapted propeller has been developed by Lerbs (Equation 17). The pitch variation depends on the average radial ef‐fective wake for which each blade section is de‐signed.
i
Figure 3: Velocity Diagram for Non‐Viscous Flow of a Blade Section
Figure 4: Force Diagram of Viscous Flow at a blade section
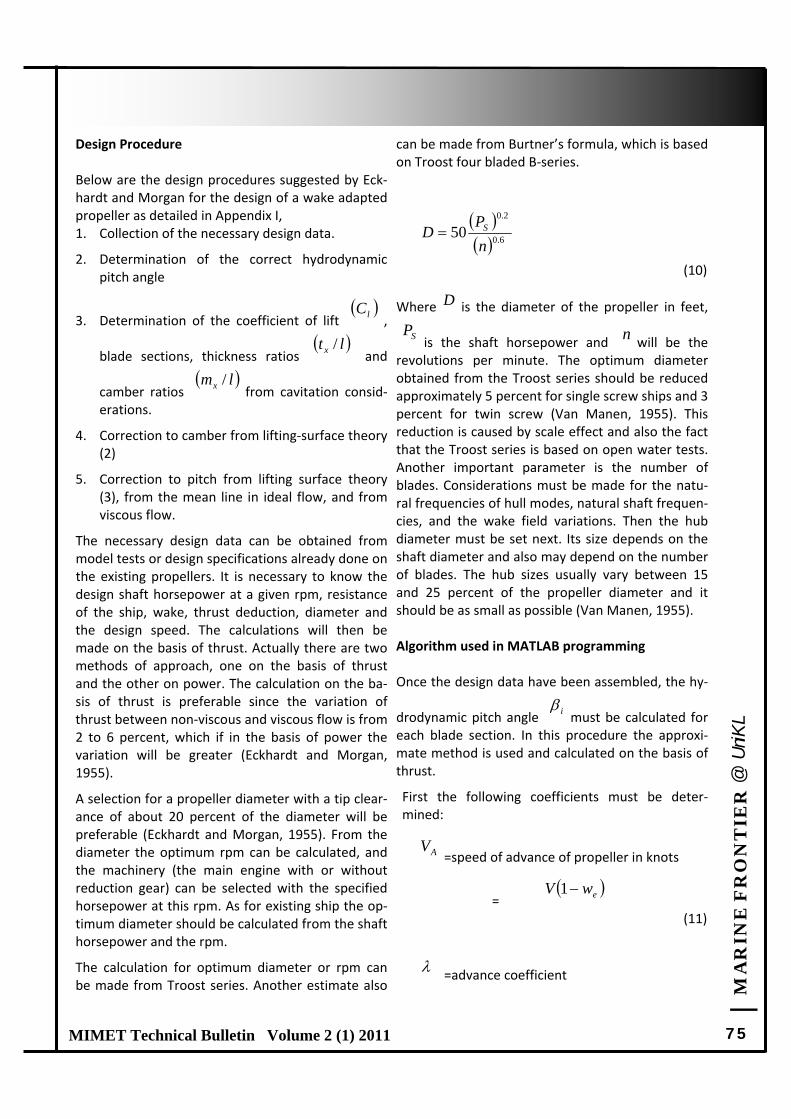
| M
AR
INE
FR
ON
TIE
R @
UniK
L
75 MIMET Technical Bulletin Volume 2 (1) 2011
Design Procedure Below are the design procedures suggested by Eck‐hardt and Morgan for the design of a wake adapted propeller as detailed in Appendix I, 1. Collection of the necessary design data.
2. Determination of the correct hydrodynamic pitch angle
3. Determination of the coefficient of lift ,
blade sections, thickness ratios and
camber ratios from cavitation consid‐erations.
4. Correction to camber from lifting‐surface theory (2)
5. Correction to pitch from lifting surface theory (3), from the mean line in ideal flow, and from viscous flow.
The necessary design data can be obtained from model tests or design specifications already done on the existing propellers. It is necessary to know the design shaft horsepower at a given rpm, resistance of the ship, wake, thrust deduction, diameter and the design speed. The calculations will then be made on the basis of thrust. Actually there are two methods of approach, one on the basis of thrust and the other on power. The calculation on the ba‐sis of thrust is preferable since the variation of thrust between non‐viscous and viscous flow is from 2 to 6 percent, which if in the basis of power the variation will be greater (Eckhardt and Morgan, 1955).
A selection for a propeller diameter with a tip clear‐ance of about 20 percent of the diameter will be preferable (Eckhardt and Morgan, 1955). From the diameter the optimum rpm can be calculated, and the machinery (the main engine with or without reduction gear) can be selected with the specified horsepower at this rpm. As for existing ship the op‐timum diameter should be calculated from the shaft horsepower and the rpm.
The calculation for optimum diameter or rpm can be made from Troost series. Another estimate also
can be made from Burtner’s formula, which is based on Troost four bladed B‐series.
(10)
Where is the diameter of the propeller in feet,
is the shaft horsepower and will be the revolutions per minute. The optimum diameter obtained from the Troost series should be reduced approximately 5 percent for single screw ships and 3 percent for twin screw (Van Manen, 1955). This reduction is caused by scale effect and also the fact that the Troost series is based on open water tests. Another important parameter is the number of blades. Considerations must be made for the natu‐ral frequencies of hull modes, natural shaft frequen‐cies, and the wake field variations. Then the hub diameter must be set next. Its size depends on the shaft diameter and also may depend on the number of blades. The hub sizes usually vary between 15 and 25 percent of the propeller diameter and it should be as small as possible (Van Manen, 1955). Algorithm used in MATLAB programming Once the design data have been assembled, the hy‐
drodynamic pitch angle must be calculated for each blade section. In this procedure the approxi‐mate method is used and calculated on the basis of thrust.
First the following coefficients must be deter‐mined:
=speed of advance of propeller in knots
= (11)
=advance coefficient
lC
lt x /
lmx /
6.0
2.0
50n
PD S
D
SP n
i
AV
ewV 1
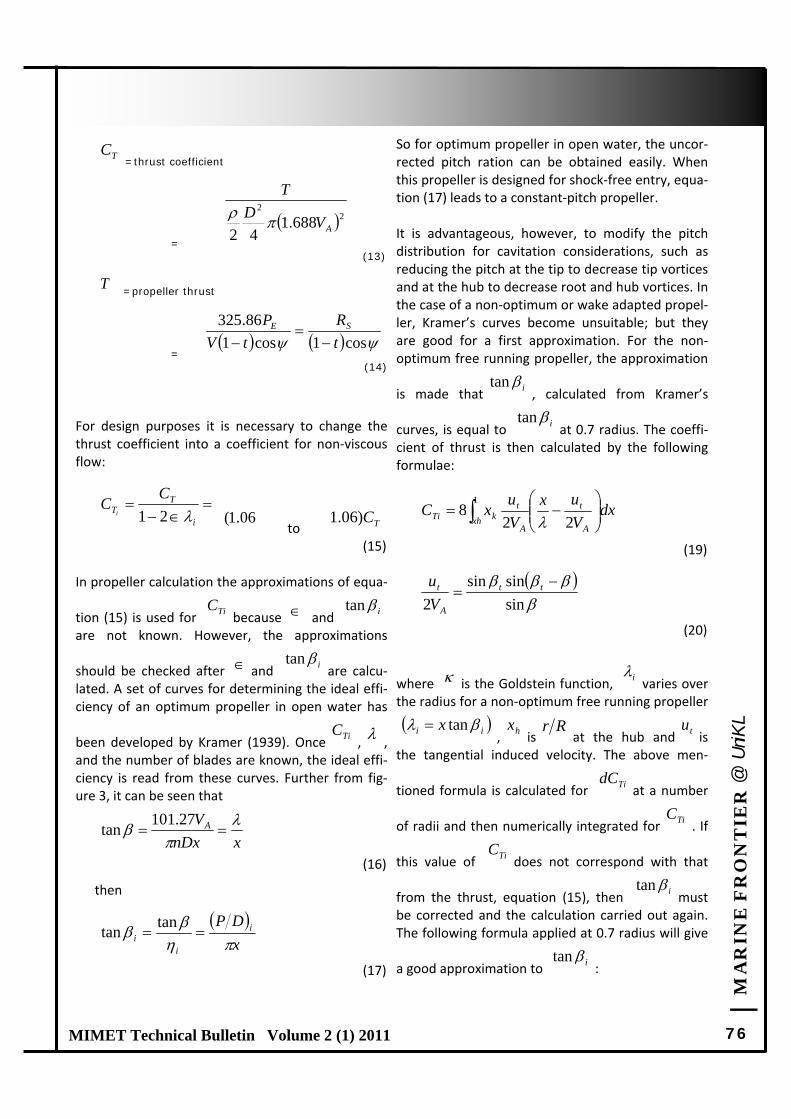
| M
AR
INE
FR
ON
TIE
R @
UniK
L
76 MIMET Technical Bulletin Volume 2 (1) 2011
=thrust coefficient
= (13)
=propeller thrust
= (14)
For design purposes it is necessary to change the thrust coefficient into a coefficient for non‐viscous flow:
to (15)
In propeller calculation the approximations of equa‐
tion (15) is used for because and are not known. However, the approximations
should be checked after and are calcu‐lated. A set of curves for determining the ideal effi‐ciency of an optimum propeller in open water has
been developed by Kramer (1939). Once , , and the number of blades are known, the ideal effi‐ciency is read from these curves. Further from fig‐ure 3, it can be seen that
(16)
then
(17)
So for optimum propeller in open water, the uncor‐rected pitch ration can be obtained easily. When this propeller is designed for shock‐free entry, equa‐tion (17) leads to a constant‐pitch propeller. It is advantageous, however, to modify the pitch distribution for cavitation considerations, such as reducing the pitch at the tip to decrease tip vortices and at the hub to decrease root and hub vortices. In the case of a non‐optimum or wake adapted propel‐ler, Kramer’s curves become unsuitable; but they are good for a first approximation. For the non‐optimum free running propeller, the approximation
is made that , calculated from Kramer’s
curves, is equal to at 0.7 radius. The coeffi‐cient of thrust is then calculated by the following formulae:
(19)
(20)
where is the Goldstein function, varies over the radius for a non‐optimum free running propeller
, is at the hub and is the tangential induced velocity. The above men‐
tioned formula is calculated for at a number
of radii and then numerically integrated for . If
this value of does not correspond with that
from the thrust, equation (15), then must be corrected and the calculation carried out again. The following formula applied at 0.7 radius will give
a good approximation to :
TC
22
688.142 AV
D
T
T
cos1cos1
86.325
t
R
tV
P SE
i
TT
CC
i 21 06.1( TC)06.1
TiC itan
itan
TiC
xnDx
VA
27.101
tan
x
DP i
ii
tan
tan
itan
itan
dxV
ux
V
uxC
A
t
xhA
tkTi
22
81
sin
sinsin
2
tt
A
t
V
u
i
ii x tan hx Rr tu
TidC
TiC
TiC
itan
itan

| M
AR
INE
FR
ON
TIE
R @
UniK
L
77 MIMET Technical Bulletin Volume 2 (1) 2011
(21)
For a wake adapted propeller only the principle of the preceding method applies, since the wake also varies with the radius. The following formulas were developed by Lerbs for wake adapted propellers,
where is the circumferential average of the wake at each section:
=advance coefficient based on ship speed
= 1 0 1 . 2 7 (22)
(23)
=thrust coefficient based on ship speed
(24)
For non‐viscous flow these become
(25)
to (26)
A first estimation of for equation (23) is based on Kramer’s curves. To calculate the thrust coeffi‐cient, the following formula will be integrated.
(27)
(28)
To obtain the correct for free running non‐optimum propeller, the procedure will be same as above. Next is the determination of coefficient of
lift using the following formula: For propellers in uniform flow
(29)For wake adapted propellers
(30)
where is the length of blade section, and is the number of blades.
desiredTi
calculatedTidesiredTipreviousicorrectedi C
CC
51tantan
xw
S
nDV
Xs wx 1tan
STC
22
688.142
VD
T
2
1
2
1
1
1tantan
x
o
ii
w
w
i
xos
x
ww
2
12
111
TsiC 02.1( TiC)06.1
i
dxV
ux
V
uxSC t
sxh
iTsi
22
1
sin
sinsin1
2
iixT w
V
u
itan
LC
i
A
t
A
t
L
V
uxV
ux
zD
lC
cos
2
24
it
s
t
L
V
uxV
ux
zD
lC
cos
2
24
l z

| M
AR
INE
FR
ON
TIE
R @
UniK
L
78 MIMET Technical Bulletin Volume 2 (1) 2011
The cavitation number of each section of the pro‐peller is calculated by the following formula: For propellers in uniform flow with a blade in the top position,
(31)
For wake adapted propellers
(32)
At this stage the lift length thickness coefficient is
calculated. The maximum thickness of each sec‐tion can be obtained from strength considerations calculations. From Taylor’s formula (1943) an esti‐mate of the blade thickness fraction can be made.
(33)
Where is defined as the thickness fraction,
, coefficient for estimating blade thickness and
is the maximum allowable stress. Then the ra‐dial distribution of maximum thickness is calculated from the blade thickness fraction using a formula given by Van Manen and Troost (1952)
(32)
Where is a coefficient for radial distribution of maximum thickness of blade elements. Two sec‐tions of the NACA airfoil, the NACA 16 and the NACA 66, are considered here because they have
low drag and good cavitation characteristics. The ordinates of the NACA series can be obtained from Abbott & von Doenhoff “Theory of Wing Sections”.
In the distribution of pressure the NACA a = 1.0 mean line is more desirable and it gives a section of minimum length for incipient cavitation. The a = 0.8 mean line has slightly greater suction at equal lift but the correction for viscous flow is close to zero. Nonetheless, experimental work at DTMB showed that both the a = 0.8 and a = 1.0 mean lines gave good results in viscous flow. Next step is the determination of camber ratio
and thickness ratio from the incipi‐ent cavitation charts corresponding to the selected section and mean line. The section lengths are cal‐culated from the thickness ratios, and the blade outline is then determined. It is best t limit the thickness ratio from 0.18 to 0.22. An arbitrary blade outline can be selected and this can be obtained from Troost B‐series. If the outline is selected arbitrarily, the camber will
be calculated from . The coefficient of lift is ob‐
tained from since is now known. The camber is then corrected for the consideration of lifting surface theory. Two corrections are read from the camber correction coefficient chart and applied as follows:
(33)
To get both and , the expanded area ratio
must be calculated. The correction for pitch follows with three corrections or additional angles of attack to be considered; i.e., friction cor‐rection, ideal angle of attack of the mean line (Abbott et. al., 1945), and correction from lifting surface effect (Lerbs, 1955). The first two correc‐tions can be combined into one additional angle of
attack , for a given mean line. This correction is made at each radius.
i
a
A
pp
V2
2
2 cos
sin
688.12
ix
a
Aw
pp
V2
2
2 1
sin
688.12
Zt
31
123.4
1
c
bo
nS
PC
DD
t
Dto /
lC
cS
D
t
D
tf
D
tDt tipotip
x /
f
lmx / llx
lC
DlCl Dl
lmxkklm correctedx 21
1k 2k
oE AA
1

| M
AR
INE
FR
ON
TIE
R @
UniK
L
79 MIMET Technical Bulletin Volume 2 (1) 2011
For a circular arc mean line, degree,
for NACA a = 1.0 mean line, degree
and for NACA a = 0.8 mean line, de‐gree. The effect of free and bound vortices must be corrected from lifting surface theory. The following
formulas represented the values of and func‐
tions of at 0.7 radius.
(34)
This correction is made in a few of steps and the first step involves the bound vortices.
(35)
where = angular position of blade
(36)
= non‐dimensional circulation per blade equal
to for a free running propeller and for a wake adapted propeller it will be as fol‐lows:
(37)
Calculations are made for a blade in the 90 deg posi‐tion, and the effect of the other blades is deter‐mined on the bound vortex of this blade. For a four
bladed propeller, calculations are made with equal to 90, 180, 270 and 360 degree. Then the ad
ditional angle of attack is equal to the sum of the calculations of these four blade positions. The correction for the effect of the free vortices then follows,
(38)
where , in radians. Then the addi‐tional angle of attack is obtained by the following equation,
(39) This correction to pitch is made at 0.7 radius and for other radii the same percentage change is applied.
(40) The final pitch is then,
(41) The design of the propeller is now complete. RESULT A sample data from DTMB 5415 will be used to per‐form the calculation. A program written in MATLAB was run for 5 bladed propeller. The example of the output of calculation at speed of 21 knots and at advance coefficient of 0.257 is shown in appendix II. Comparison showed that the values agree very well. A comparison of the main values and percentage difference is shown in Table 1.
lC86.21
lC35.21
lC15.11
Dl
i
oifb 2
1
3coscos7.0sin
2
sinxhi
ib
RP
Gdx
D
l
2
32
23 sin7.0coscos249.0
x
D
l
D
lxRP i
G
At Vuzx 2/)/2(
x
t
wV
u
z
x
1
1
2
2
b
1
2cos1
2
2
hi
if
ii
o
i
ib
h
11
2cos1
23.57
22
7.0
7.02
tan
tan1
i
i
DP
DP
DP
DPxDP i 1tan 1
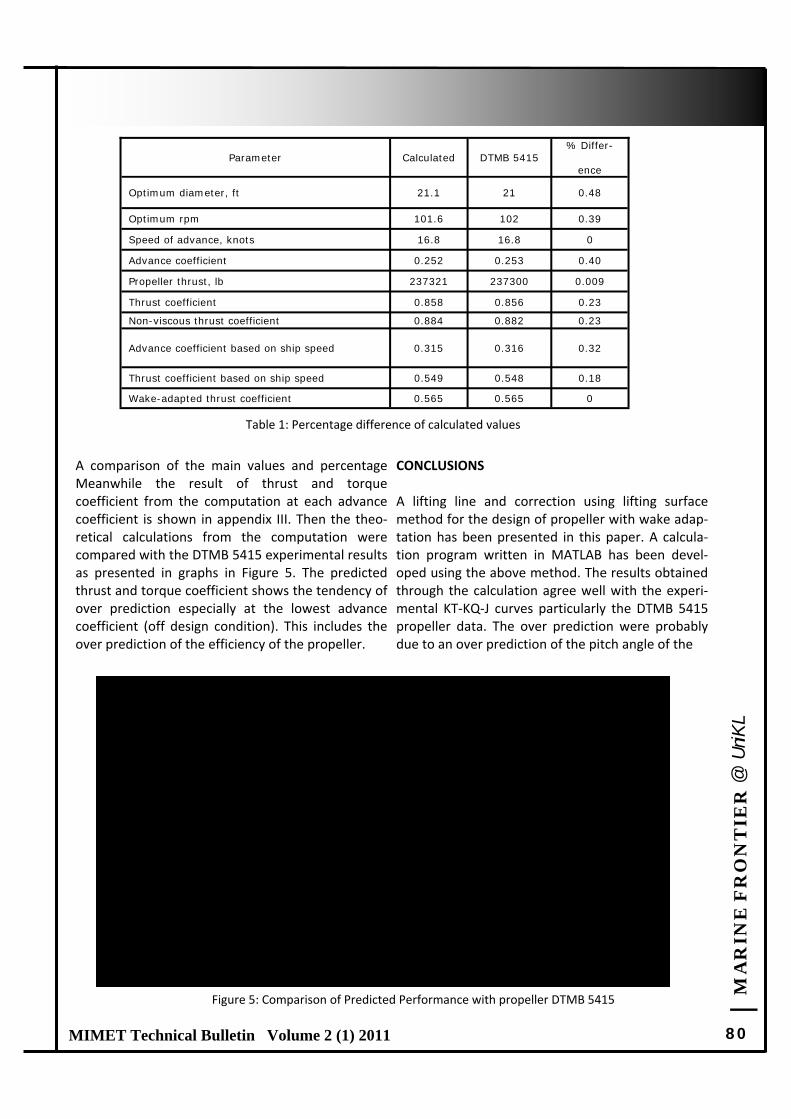
| M
AR
INE
FR
ON
TIE
R @
UniK
L
80 MIMET Technical Bulletin Volume 2 (1) 2011
A comparison of the main values and percentage Meanwhile the result of thrust and torque coefficient from the computation at each advance coefficient is shown in appendix III. Then the theo‐retical calculations from the computation were compared with the DTMB 5415 experimental results as presented in graphs in Figure 5. The predicted thrust and torque coefficient shows the tendency of over prediction especially at the lowest advance coefficient (off design condition). This includes the over prediction of the efficiency of the propeller.
CONCLUSIONS A lifting line and correction using lifting surface method for the design of propeller with wake adap‐tation has been presented in this paper. A calcula‐tion program written in MATLAB has been devel‐oped using the above method. The results obtained through the calculation agree well with the experi‐mental KT‐KQ‐J curves particularly the DTMB 5415 propeller data. The over prediction were probably due to an over prediction of the pitch angle of the
Parameter Calculated DTMB 5415 % Differ-
ence
Optimum diameter, ft 21.1 21 0.48
Optimum rpm 101.6 102 0.39
Speed of advance, knots 16.8 16.8 0
Advance coefficient 0.252 0.253 0.40
Propeller thrust, lb 237321 237300 0.009
Thrust coefficient 0.858 0.856 0.23
Non-viscous thrust coefficient 0.884 0.882 0.23
Advance coefficient based on ship speed 0.315 0.316 0.32
Thrust coefficient based on ship speed 0.549 0.548 0.18
Wake-adapted thrust coefficient 0.565 0.565 0
Table 1: Percentage difference of calculated values
0
0.1
0.2
0.3
0.4
0.5
0.6
0.7
0.8
0 0.2 0.4 0.6 0.8 1
KT, 10KQ, Eff
Advance Coefficient, J
KT (Theory) 10KQ (Theory) Eff (Theory)
10KQ (Exp ‐ DTMB 5415) KT (Exp ‐ DTMB 5415) Eff (Exp ‐ DTMB 5415)
Figure 5: Comparison of Predicted Performance with propeller DTMB 5415

| M
AR
INE
FR
ON
TIE
R @
UniK
L
81 MIMET Technical Bulletin Volume 2 (1) 2011
free vortex in the wake. Further development is to validate the method with other types of propeller especially on high skewed propeller having a totally different camber distribution. The other recommen‐dation is to use the method proposed by Kerwin, 1982 on the modified lifting surface theory by Vor‐tex Lattice method. REFERENCES 1. Cox, G. G. and Morgan, W. B., The Use of Theory
in Propeller Design, Fluid Mechanics and Design of Turbomachinery Symposium, Pennsylvania State University, Sept 1970.
2. Eckhardt, M.K. and Morgan, W. B., A Propeller Design Method, Trans. SNAME, Vol. 63, 1955.
3. Gomez, G.P., Linares, F. G., Briones, I. B., Some Improvements of Traditional Lifting Line Theory
for Ship Propellers, International Shipbuilding Progress, Vol. 24, 1980.
4. Hill, J.G., The Design of Propellers, Trans. SNAME, Vol. 60, 1949.
5. Kuiper, G., The Wageningen Propeller Series, MARIN, 1992
6. Morgan, W.B., and Wrench, J. W., Some Compu‐tational Aspects of Propeller Design, Methods in Computational Physics, Academic Press, Inc., 1965.
7. Murray, M. T., Propeller Design and Analysis by Lifting Surface Theory, International Shipbuild‐ing Progress, Vol. 14, 1967.
8. Pien, P.C., The Calculation of Marine Propellers based on Lifting Surface Theory, Journal of Ship Research, Vol. 5, No. 2, 1961.
9. Schoenherr, Karl E., Recent Developments in Propeller Design, Trans. SNAME Vol. 42, 1934
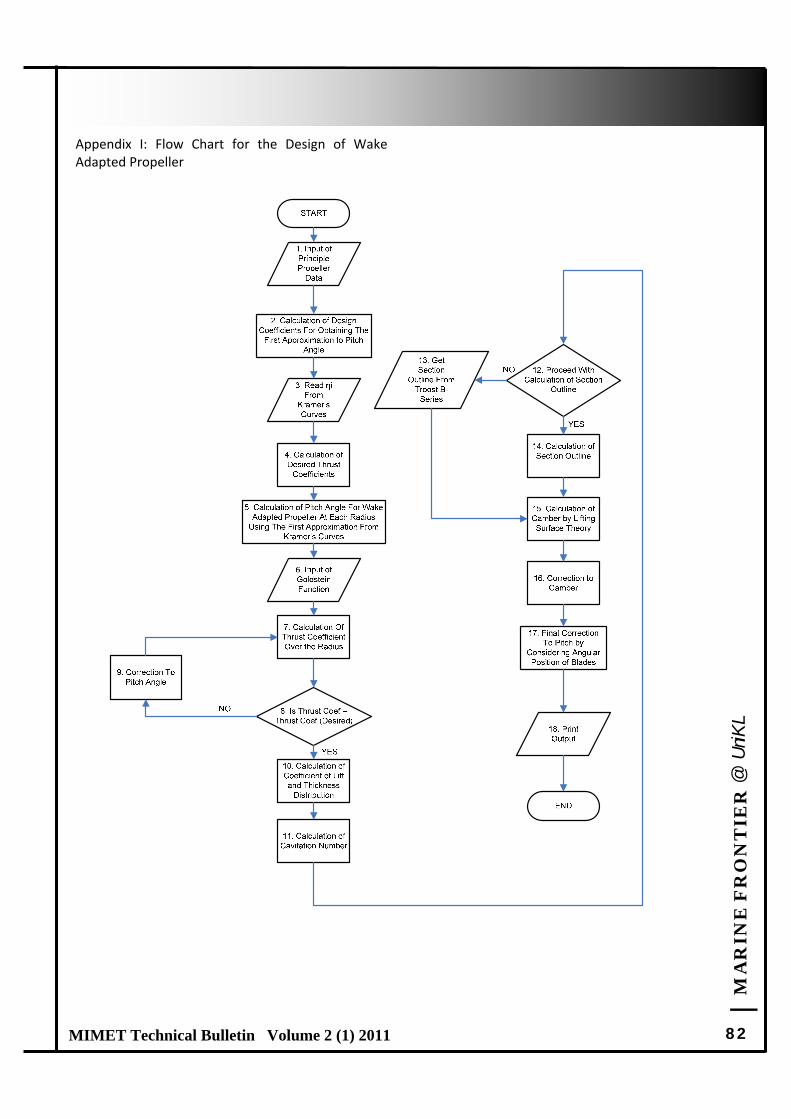
| M
AR
INE
FR
ON
TIE
R @
UniK
L
82 MIMET Technical Bulletin Volume 2 (1) 2011
Appendix I: Flow Chart for the Design of Wake Adapted Propeller
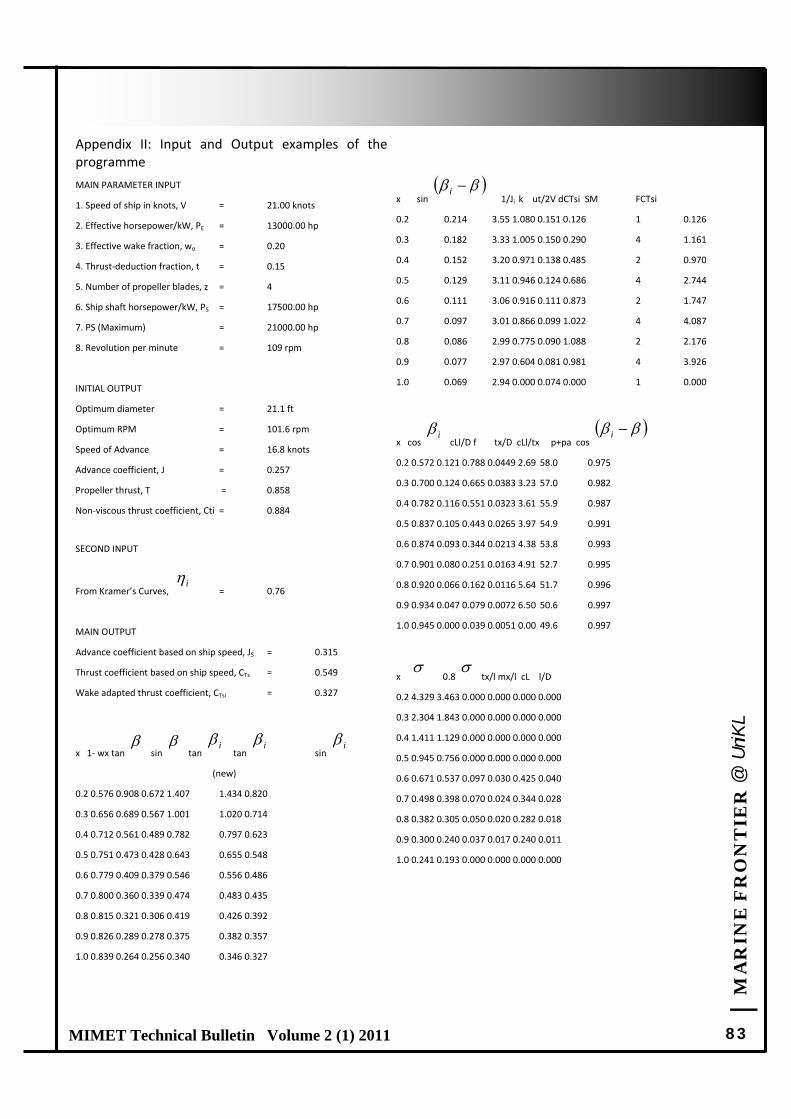
| M
AR
INE
FR
ON
TIE
R @
UniK
L
83 MIMET Technical Bulletin Volume 2 (1) 2011
Appendix II: Input and Output examples of the programme
MAIN PARAMETER INPUT
1. Speed of ship in knots, V = 21.00 knots
2. Effective horsepower/kW, PE = 13000.00 hp
3. Effective wake fraction, wo = 0.20
4. Thrust‐deduction fraction, t = 0.15
5. Number of propeller blades, z = 4
6. Ship shaft horsepower/kW, PS = 17500.00 hp
7. PS (Maximum) = 21000.00 hp
8. Revolution per minute = 109 rpm
INITIAL OUTPUT
Optimum diameter = 21.1 ft
Optimum RPM = 101.6 rpm
Speed of Advance = 16.8 knots
Advance coefficient, J = 0.257
Propeller thrust, T = 0.858
Non‐viscous thrust coefficient, Cti = 0.884
SECOND INPUT
From Kramer’s Curves, = 0.76
MAIN OUTPUT
Advance coefficient based on ship speed, JS = 0.315
Thrust coefficient based on ship speed, CTs = 0.549
Wake adapted thrust coefficient, CTsi = 0.327
x 1‐ wx tan sin tan tan sin
(new)
0.2 0.576 0.908 0.672 1.407 1.434 0.820
0.3 0.656 0.689 0.567 1.001 1.020 0.714
0.4 0.712 0.561 0.489 0.782 0.797 0.623
0.5 0.751 0.473 0.428 0.643 0.655 0.548
0.6 0.779 0.409 0.379 0.546 0.556 0.486
0.7 0.800 0.360 0.339 0.474 0.483 0.435
0.8 0.815 0.321 0.306 0.419 0.426 0.392
0.9 0.826 0.289 0.278 0.375 0.382 0.357
1.0 0.839 0.264 0.256 0.340 0.346 0.327
x sin 1/Ji k ut/2V dCTsi SM FCTsi
0.2 0.214 3.55 1.080 0.151 0.126 1 0.126
0.3 0.182 3.33 1.005 0.150 0.290 4 1.161
0.4 0.152 3.20 0.971 0.138 0.485 2 0.970
0.5 0.129 3.11 0.946 0.124 0.686 4 2.744
0.6 0.111 3.06 0.916 0.111 0.873 2 1.747
0.7 0.097 3.01 0.866 0.099 1.022 4 4.087
0.8 0.086 2.99 0.775 0.090 1.088 2 2.176
0.9 0.077 2.97 0.604 0.081 0.981 4 3.926
1.0 0.069 2.94 0.000 0.074 0.000 1 0.000
x cos cLl/D f tx/D cLl/tx p+pa cos
0.2 0.572 0.121 0.788 0.0449 2.69 58.0 0.975
0.3 0.700 0.124 0.665 0.0383 3.23 57.0 0.982
0.4 0.782 0.116 0.551 0.0323 3.61 55.9 0.987
0.5 0.837 0.105 0.443 0.0265 3.97 54.9 0.991
0.6 0.874 0.093 0.344 0.0213 4.38 53.8 0.993
0.7 0.901 0.080 0.251 0.0163 4.91 52.7 0.995
0.8 0.920 0.066 0.162 0.0116 5.64 51.7 0.996
0.9 0.934 0.047 0.079 0.0072 6.50 50.6 0.997
1.0 0.945 0.000 0.039 0.0051 0.00 49.6 0.997
x 0.8 tx/l mx/l cL l/D
0.2 4.329 3.463 0.000 0.000 0.000 0.000
0.3 2.304 1.843 0.000 0.000 0.000 0.000
0.4 1.411 1.129 0.000 0.000 0.000 0.000
0.5 0.945 0.756 0.000 0.000 0.000 0.000
0.6 0.671 0.537 0.097 0.030 0.425 0.040
0.7 0.498 0.398 0.070 0.024 0.344 0.028
0.8 0.382 0.305 0.050 0.020 0.282 0.018
0.9 0.300 0.240 0.037 0.017 0.240 0.011
1.0 0.241 0.193 0.000 0.000 0.000 0.000
i
i i i
i
i i
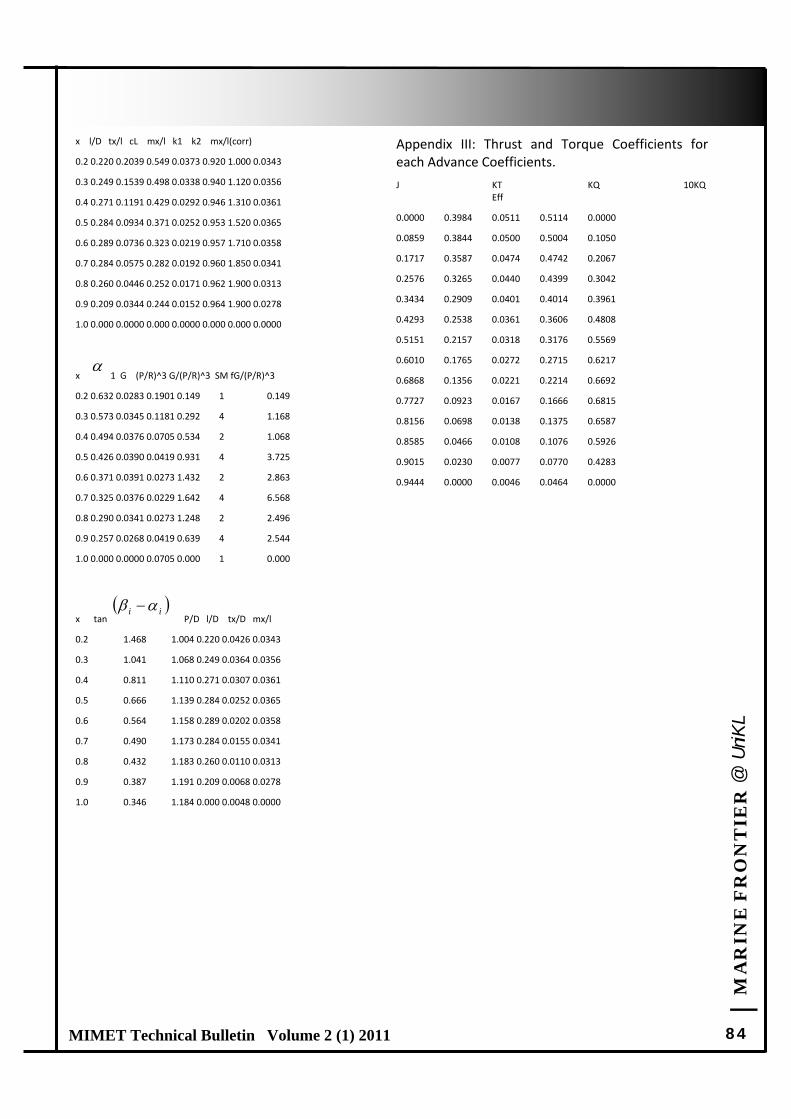
| M
AR
INE
FR
ON
TIE
R @
UniK
L
84 MIMET Technical Bulletin Volume 2 (1) 2011
x l/D tx/l cL mx/l k1 k2 mx/l(corr)
0.2 0.220 0.2039 0.549 0.0373 0.920 1.000 0.0343
0.3 0.249 0.1539 0.498 0.0338 0.940 1.120 0.0356
0.4 0.271 0.1191 0.429 0.0292 0.946 1.310 0.0361
0.5 0.284 0.0934 0.371 0.0252 0.953 1.520 0.0365
0.6 0.289 0.0736 0.323 0.0219 0.957 1.710 0.0358
0.7 0.284 0.0575 0.282 0.0192 0.960 1.850 0.0341
0.8 0.260 0.0446 0.252 0.0171 0.962 1.900 0.0313
0.9 0.209 0.0344 0.244 0.0152 0.964 1.900 0.0278
1.0 0.000 0.0000 0.000 0.0000 0.000 0.000 0.0000
x 1 G (P/R)^3 G/(P/R)^3 SM fG/(P/R)^3
0.2 0.632 0.0283 0.1901 0.149 1 0.149
0.3 0.573 0.0345 0.1181 0.292 4 1.168
0.4 0.494 0.0376 0.0705 0.534 2 1.068
0.5 0.426 0.0390 0.0419 0.931 4 3.725
0.6 0.371 0.0391 0.0273 1.432 2 2.863
0.7 0.325 0.0376 0.0229 1.642 4 6.568
0.8 0.290 0.0341 0.0273 1.248 2 2.496
0.9 0.257 0.0268 0.0419 0.639 4 2.544
1.0 0.000 0.0000 0.0705 0.000 1 0.000
x tan P/D l/D tx/D mx/l
0.2 1.468 1.004 0.220 0.0426 0.0343
0.3 1.041 1.068 0.249 0.0364 0.0356
0.4 0.811 1.110 0.271 0.0307 0.0361
0.5 0.666 1.139 0.284 0.0252 0.0365
0.6 0.564 1.158 0.289 0.0202 0.0358
0.7 0.490 1.173 0.284 0.0155 0.0341
0.8 0.432 1.183 0.260 0.0110 0.0313
0.9 0.387 1.191 0.209 0.0068 0.0278
1.0 0.346 1.184 0.000 0.0048 0.0000
Appendix III: Thrust and Torque Coefficients for each Advance Coefficients.
J KT KQ 10KQ Eff
0.0000 0.3984 0.0511 0.5114 0.0000
0.0859 0.3844 0.0500 0.5004 0.1050
0.1717 0.3587 0.0474 0.4742 0.2067
0.2576 0.3265 0.0440 0.4399 0.3042
0.3434 0.2909 0.0401 0.4014 0.3961
0.4293 0.2538 0.0361 0.3606 0.4808
0.5151 0.2157 0.0318 0.3176 0.5569
0.6010 0.1765 0.0272 0.2715 0.6217
0.6868 0.1356 0.0221 0.2214 0.6692
0.7727 0.0923 0.0167 0.1666 0.6815
0.8156 0.0698 0.0138 0.1375 0.6587
0.8585 0.0466 0.0108 0.1076 0.5926
0.9015 0.0230 0.0077 0.0770 0.4283
0.9444 0.0000 0.0046 0.0464 0.0000
ii
| M
AR
INE
FR
ON
TIE
R @
UniK
L
85 MIMET Technical Bulletin Volume 2 (1) 2011
Feature Article 11 Feature Article 11
SEVEN WAYS TO MASTERING A COURSE
ABDUL AZIZ BIN ABDUL RAHIM *
Department of Applied Science and Advanced Technology Malaysian Institute of Marine Engineering Technology, Universiti Kuala Lumpur
Received: xxx; Revised: xxx ; Accepted: xxx
ABSTRACT The current scenario of the students pursuing studies, either locally or abroad, shows their standard of knowledge espe‐cially in the concept understanding for such course or program have deteriorated. The major factors contributing to this phenomenon may be the lack of suitable approach when attending to such course and the lack of appropriate method of study in ensuring the smoothness of the students’ learning process. This paper attempts to magnify the ways in tackling and handling the related issues to help readers adopt the means for better enhancement of knowledge that could be applied as an added value for the benefit of graduating students.
Keywords : Mastering a course,pounding, panting
Corresponding Author: [email protected]
INTRODUCTION Tertiary education nowadays has become a norm to everyone in Malaysia. Students after the Sijil Pelajaran Malaysia (SPM) level continue their studies in various colleges, institutes and universities either locally or in other countries such as the United States of America, United Kingdom as well as Australia [4]. Unfortunately their level of understanding of the concept of such programs or courses could be below the level that is normally expected in the higher education sector. This so called ‘phenomenon’ or ‘syndrome’ has been manifested upon their completion of study in the way of their conduct especially during interviews and presentations. The reasons behind this are still subject to fur‐ther research and analysis and yet to be identi‐fied. Are the students really undertaking the course because of their interest or being forced by their parents? We leave this answer to the readers who are directly or indirectly involved in the psychology of education. Through observa‐tion and experience gathered it could be sum‐marized that there are seven ways in mastering a program or course either in a university, an institute or a college. The writer will focus and magnify one after another to enable the reader
especially students to look into and utilize fur‐ther in their learning process. UNDERSTANDING THE CONCEPT What is meant by concept? A concept is a com‐mon feature, characteristic, an idea or a com‐mon notion. Every course has its own concept. As an example, the “ Fluid Mechanics” course which is a fundamental to any other course in engineering either mechanical, civil, chemical, naval architectural or biochemical. Students should be able to understand and uphold not only the concept of fluid but also the concept of mechanics. Definitely to understand the concept is not that easy as students need to relate to what they have seen or have experienced to the idea behind the course. Occasionally, the synop‐sis and the learning outcomes provided in the Module Descriptor or Lesson Plan assists the students in understanding the concept. This is not necessarily true to all as the level of educa‐tion and fundamental understanding for such individual may not be the same. Different per‐ception and wrong interpretation on the out‐comes of such a course adversely affect the un‐derstanding of the correct concept and its appli‐cation.

| M
AR
INE
FR
ON
TIE
R @
UniK
L
86 MIMET Technical Bulletin Volume 2 (1) 2011
The logical acts of the understanding by which con‐cepts are generated are divided into three opera‐tions: 1. comparison, i.e., the likening of mental images
to one another in relation to the unity of con‐sciousness;
2. reflection, i.e., the going back over different mental images, how they can be comprehended in one consciousness; and finally
3. abstraction or the segregation of everything else by which the mental images differ
In order to make their mental images into concepts, students must thus be able to compare, reflect, and abstract, for these three logical operations of the understanding are essential and general conditions of generating any concept whatever. For example, we see a fir, a willow, and a linden. In firstly com‐paring these objects, we notice that they are differ‐ent from one another in respect of trunk, branches, leaves, and the like; further, however, we reflect only on what they have in common, the trunk, the branches, the leaves themselves, and abstract from their size, shape, and so forth; thus we gain a con‐cept of a tree. Not like a story of the six blind men in understanding the concept of an elephant. In which one of them happened to describe elephant as hav‐ing a long trunk as a snake, whilst the others’ per‐ceptions on the elephant as a tree, a fan, a spear, a wall and a rope. Is it wrong with their perceptions? The answer to that is they are correct in their re‐spective reflection but wrong in the actual concept. The writer elucidates again the story of “The Six Blind Men and the Elephant” for the reader to pro‐
found the knowledge in concept understanding. THE STORY OF THE SIX BLIND MEN AND THE ELEPHANT Once upon a time there were six blind men. They lived in a town in India. They thought they were very clever. One day an elephant came into the town. The blind men did not know what an elephant looked like but they could smell it and they could hear it. 'What is this animal like?' they said. Each man touched a different part of the elephant.
The first man touched the elephant's body. It felt hard, big and wide. 'An elephant is like a wall' he said. The second man touched one of the elephant's tusks. It felt smooth and hard and sharp. 'An ele‐phant is like a spear' he said. The third man touched the elephant's trunk. It felt long and thin and wiggly. 'An elephant is like a snake' he said. The fourth man touched on one of the legs. It felt thick and rough and hard and round. 'An elephant is like a tree' he said. The fifth man touched one of the elephant's ears. It felt thin and it moved. 'An elephant is like a fan' he said. The sixth man touched the elephant's tail. It felt long and thin and strong. 'An elephant is like a rope' he said. The men argued. It's like a wall! No, it isn't! It's like a spear! No it isn't! It's like a snake! They did not agree. The king had been watching and listening to the men. 'You are not very clever. You only touched part of the elephant. You did not feel the whole ani‐mal. An elephant is not like a wall or a spear or a snake, or a tree or a fan or a rope'. The men left the town still arguing. A little girl heard them and said 'Each of you is right but you are all wrong … but I know what you are talking about'
Conclusively from the story to understand concept one need to deploy his or her brain either left or right or both in balance. We ought to have good knowledge in maneuvering our brain. The left brain is concerned more to logic, language, linearity, mathematics and analysis in comparison with the right brain which is focusing towards the arts and imagination. Perhaps in mastering the course the educator must first understand the concept then he must convey his understanding to the students under his supervi‐sion. This may require strong effort and esteem de‐termination not only on the students but also on the lecturers themselves. ENHANCING THE VOCABULARY OF TERMINOLOGY Terminology is derived from the word ‘term’ which defines as the study of terms and their use. Terms are words or compound words that are used in the specific contexts. Terminology therefore denotes a more formal discipline which systematically studies
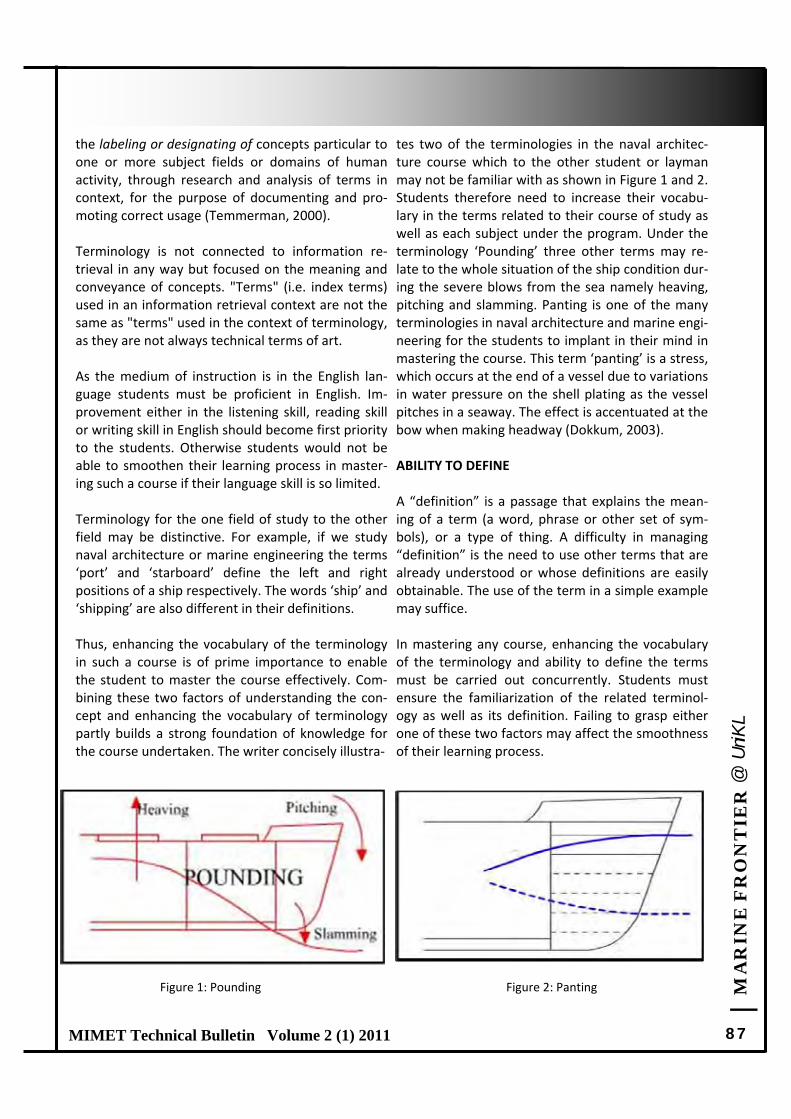
| M
AR
INE
FR
ON
TIE
R @
UniK
L
87 MIMET Technical Bulletin Volume 2 (1) 2011
the labeling or designating of concepts particular to one or more subject fields or domains of human activity, through research and analysis of terms in context, for the purpose of documenting and pro‐moting correct usage (Temmerman, 2000). Terminology is not connected to information re‐trieval in any way but focused on the meaning and conveyance of concepts. "Terms" (i.e. index terms) used in an information retrieval context are not the same as "terms" used in the context of terminology, as they are not always technical terms of art. As the medium of instruction is in the English lan‐guage students must be proficient in English. Im‐provement either in the listening skill, reading skill or writing skill in English should become first priority to the students. Otherwise students would not be able to smoothen their learning process in master‐ing such a course if their language skill is so limited. Terminology for the one field of study to the other field may be distinctive. For example, if we study naval architecture or marine engineering the terms ‘port’ and ‘starboard’ define the left and right positions of a ship respectively. The words ‘ship’ and ‘shipping’ are also different in their definitions. Thus, enhancing the vocabulary of the terminology in such a course is of prime importance to enable the student to master the course effectively. Com‐bining these two factors of understanding the con‐cept and enhancing the vocabulary of terminology partly builds a strong foundation of knowledge for the course undertaken. The writer concisely illustra‐
tes two of the terminologies in the naval architec‐ture course which to the other student or layman may not be familiar with as shown in Figure 1 and 2. Students therefore need to increase their vocabu‐lary in the terms related to their course of study as well as each subject under the program. Under the terminology ‘Pounding’ three other terms may re‐late to the whole situation of the ship condition dur‐ing the severe blows from the sea namely heaving, pitching and slamming. Panting is one of the many terminologies in naval architecture and marine engi‐neering for the students to implant in their mind in mastering the course. This term ‘panting’ is a stress, which occurs at the end of a vessel due to variations in water pressure on the shell plating as the vessel pitches in a seaway. The effect is accentuated at the bow when making headway (Dokkum, 2003). ABILITY TO DEFINE A “definition” is a passage that explains the mean‐ing of a term (a word, phrase or other set of sym‐bols), or a type of thing. A difficulty in managing “definition” is the need to use other terms that are already understood or whose definitions are easily obtainable. The use of the term in a simple example may suffice. In mastering any course, enhancing the vocabulary of the terminology and ability to define the terms must be carried out concurrently. Students must ensure the familiarization of the related terminol‐ogy as well as its definition. Failing to grasp either one of these two factors may affect the smoothness of their learning process.
Figure 1: Pounding Figure 2: Panting
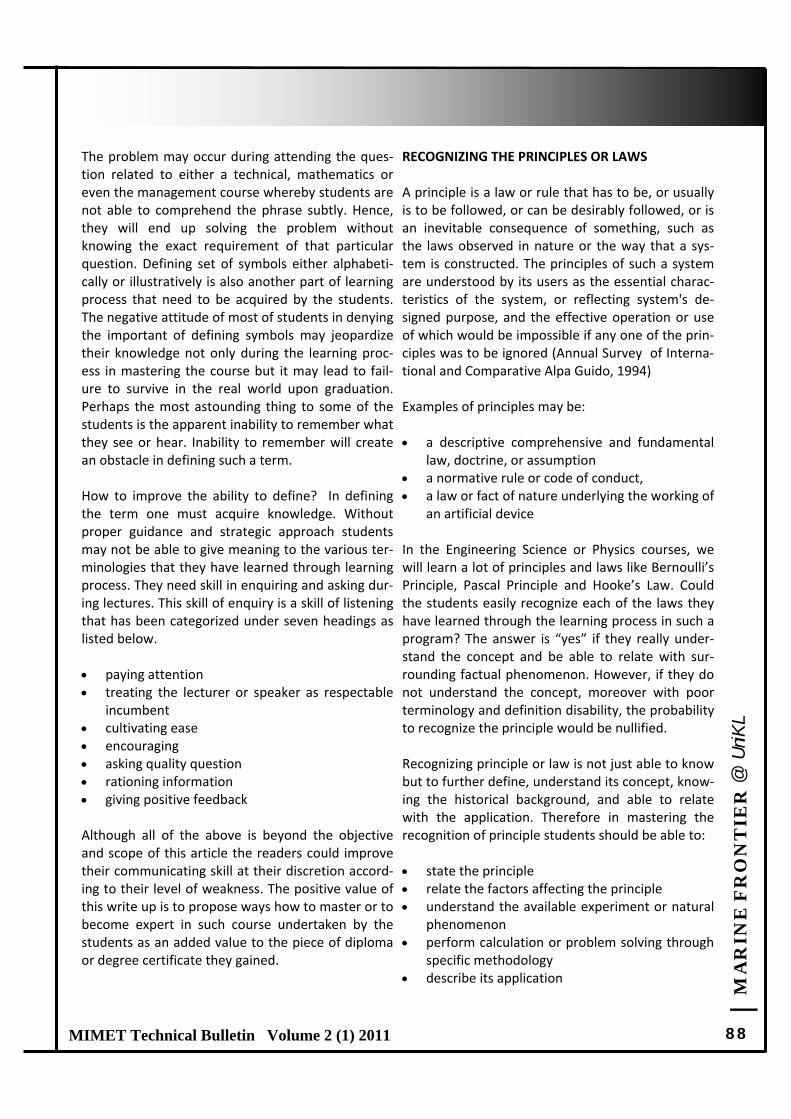
| M
AR
INE
FR
ON
TIE
R @
UniK
L
88 MIMET Technical Bulletin Volume 2 (1) 2011
The problem may occur during attending the ques‐tion related to either a technical, mathematics or even the management course whereby students are not able to comprehend the phrase subtly. Hence, they will end up solving the problem without knowing the exact requirement of that particular question. Defining set of symbols either alphabeti‐cally or illustratively is also another part of learning process that need to be acquired by the students. The negative attitude of most of students in denying the important of defining symbols may jeopardize their knowledge not only during the learning proc‐ess in mastering the course but it may lead to fail‐ure to survive in the real world upon graduation. Perhaps the most astounding thing to some of the students is the apparent inability to remember what they see or hear. Inability to remember will create an obstacle in defining such a term. How to improve the ability to define? In defining the term one must acquire knowledge. Without proper guidance and strategic approach students may not be able to give meaning to the various ter‐minologies that they have learned through learning process. They need skill in enquiring and asking dur‐ing lectures. This skill of enquiry is a skill of listening that has been categorized under seven headings as listed below. paying attention treating the lecturer or speaker as respectable
incumbent cultivating ease encouraging asking quality question rationing information giving positive feedback Although all of the above is beyond the objective and scope of this article the readers could improve their communicating skill at their discretion accord‐ing to their level of weakness. The positive value of this write up is to propose ways how to master or to become expert in such course undertaken by the students as an added value to the piece of diploma or degree certificate they gained.
RECOGNIZING THE PRINCIPLES OR LAWS A principle is a law or rule that has to be, or usually is to be followed, or can be desirably followed, or is an inevitable consequence of something, such as the laws observed in nature or the way that a sys‐tem is constructed. The principles of such a system are understood by its users as the essential charac‐teristics of the system, or reflecting system's de‐signed purpose, and the effective operation or use of which would be impossible if any one of the prin‐ciples was to be ignored (Annual Survey of Interna‐tional and Comparative Alpa Guido, 1994) Examples of principles may be: a descriptive comprehensive and fundamental
law, doctrine, or assumption a normative rule or code of conduct, a law or fact of nature underlying the working of
an artificial device In the Engineering Science or Physics courses, we will learn a lot of principles and laws like Bernoulli’s Principle, Pascal Principle and Hooke’s Law. Could the students easily recognize each of the laws they have learned through the learning process in such a program? The answer is “yes” if they really under‐stand the concept and be able to relate with sur‐rounding factual phenomenon. However, if they do not understand the concept, moreover with poor terminology and definition disability, the probability to recognize the principle would be nullified. Recognizing principle or law is not just able to know but to further define, understand its concept, know‐ing the historical background, and able to relate with the application. Therefore in mastering the recognition of principle students should be able to: state the principle relate the factors affecting the principle understand the available experiment or natural
phenomenon perform calculation or problem solving through
specific methodology describe its application
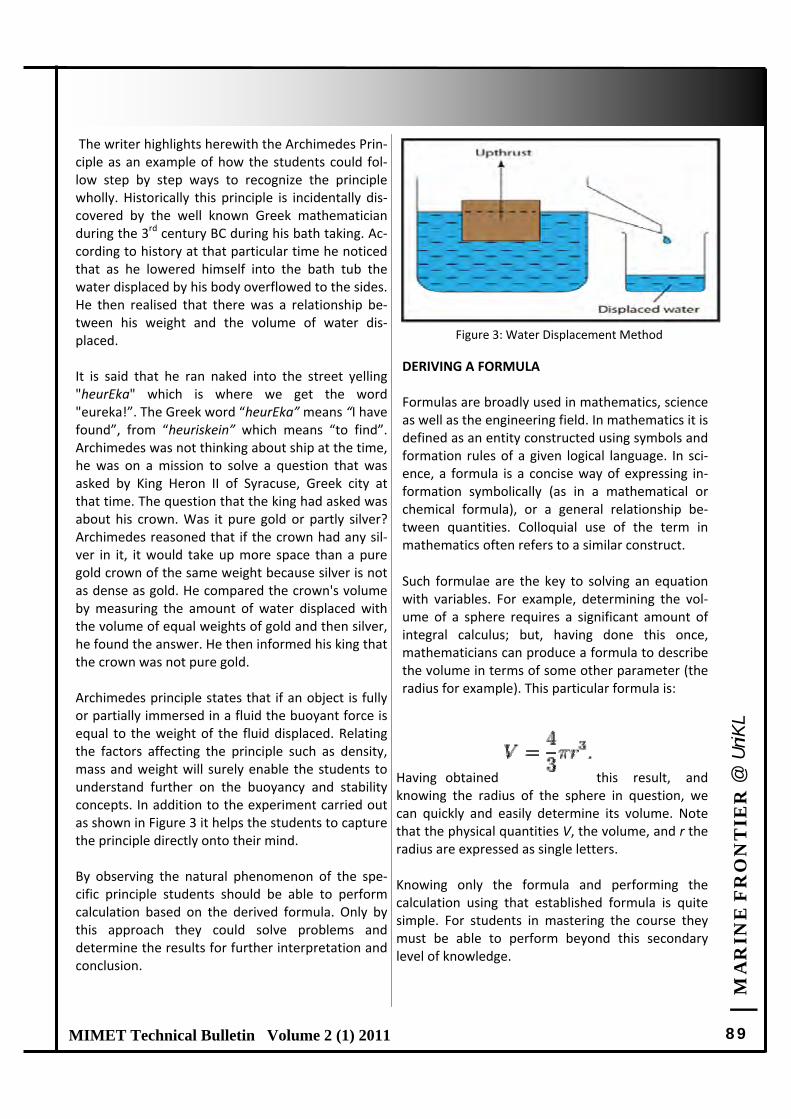
| M
AR
INE
FR
ON
TIE
R @
UniK
L
89 MIMET Technical Bulletin Volume 2 (1) 2011
The writer highlights herewith the Archimedes Prin‐ciple as an example of how the students could fol‐low step by step ways to recognize the principle wholly. Historically this principle is incidentally dis‐covered by the well known Greek mathematician during the 3rd century BC during his bath taking. Ac‐cording to history at that particular time he noticed that as he lowered himself into the bath tub the water displaced by his body overflowed to the sides. He then realised that there was a relationship be‐tween his weight and the volume of water dis‐placed. It is said that he ran naked into the street yelling "heurEka" which is where we get the word "eureka!”. The Greek word “heurEka” means “I have found”, from “heuriskein” which means “to find”. Archimedes was not thinking about ship at the time, he was on a mission to solve a question that was asked by King Heron II of Syracuse, Greek city at that time. The question that the king had asked was about his crown. Was it pure gold or partly silver? Archimedes reasoned that if the crown had any sil‐ver in it, it would take up more space than a pure gold crown of the same weight because silver is not as dense as gold. He compared the crown's volume by measuring the amount of water displaced with the volume of equal weights of gold and then silver, he found the answer. He then informed his king that the crown was not pure gold. Archimedes principle states that if an object is fully or partially immersed in a fluid the buoyant force is equal to the weight of the fluid displaced. Relating the factors affecting the principle such as density, mass and weight will surely enable the students to understand further on the buoyancy and stability concepts. In addition to the experiment carried out as shown in Figure 3 it helps the students to capture the principle directly onto their mind. By observing the natural phenomenon of the spe‐cific principle students should be able to perform calculation based on the derived formula. Only by this approach they could solve problems and determine the results for further interpretation and conclusion.
DERIVING A FORMULA Formulas are broadly used in mathematics, science as well as the engineering field. In mathematics it is defined as an entity constructed using symbols and formation rules of a given logical language. In sci‐ence, a formula is a concise way of expressing in‐formation symbolically (as in a mathematical or chemical formula), or a general relationship be‐tween quantities. Colloquial use of the term in mathematics often refers to a similar construct.
Such formulae are the key to solving an equation with variables. For example, determining the vol‐ume of a sphere requires a significant amount of integral calculus; but, having done this once, mathematicians can produce a formula to describe the volume in terms of some other parameter (the radius for example). This particular formula is: Having obtained this result, and knowing the radius of the sphere in question, we can quickly and easily determine its volume. Note that the physical quantities V, the volume, and r the radius are expressed as single letters. Knowing only the formula and performing the calculation using that established formula is quite simple. For students in mastering the course they must be able to perform beyond this secondary level of knowledge.
Figure 3: Water Displacement Method
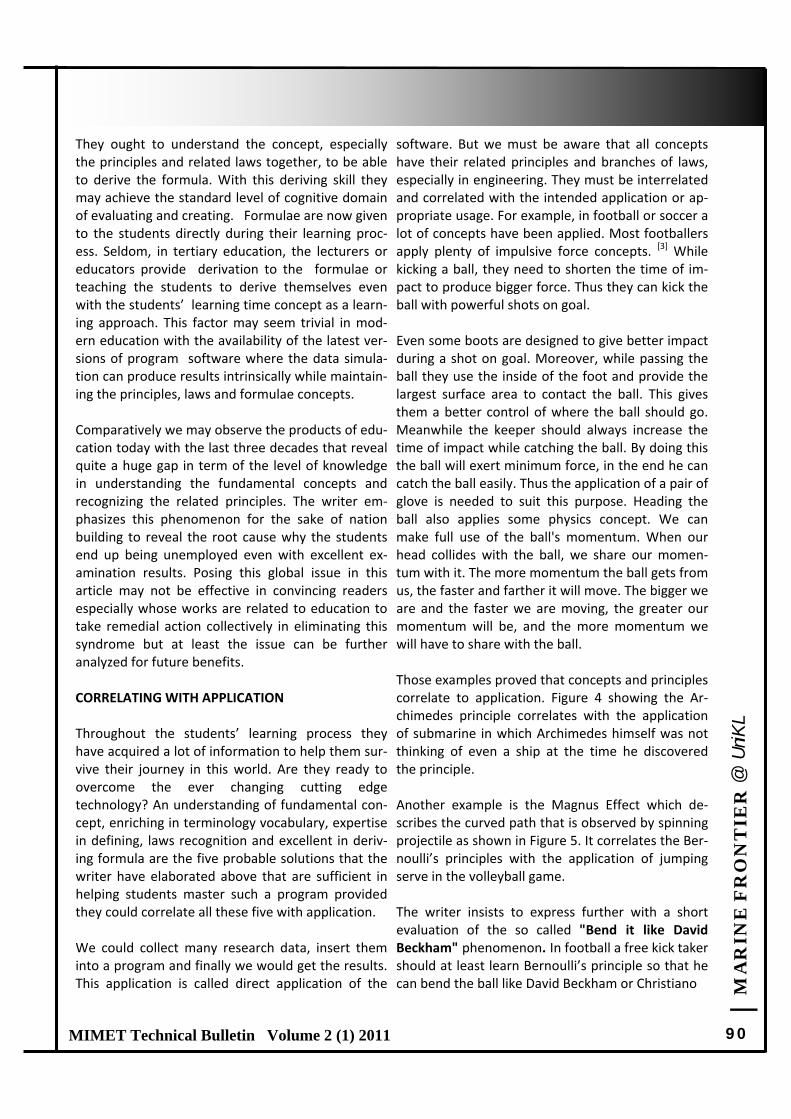
| M
AR
INE
FR
ON
TIE
R @
UniK
L
90 MIMET Technical Bulletin Volume 2 (1) 2011
They ought to understand the concept, especially the principles and related laws together, to be able to derive the formula. With this deriving skill they may achieve the standard level of cognitive domain of evaluating and creating. Formulae are now given to the students directly during their learning proc‐ess. Seldom, in tertiary education, the lecturers or educators provide derivation to the formulae or teaching the students to derive themselves even with the students’ learning time concept as a learn‐ing approach. This factor may seem trivial in mod‐ern education with the availability of the latest ver‐sions of program software where the data simula‐tion can produce results intrinsically while maintain‐ing the principles, laws and formulae concepts. Comparatively we may observe the products of edu‐cation today with the last three decades that reveal quite a huge gap in term of the level of knowledge in understanding the fundamental concepts and recognizing the related principles. The writer em‐phasizes this phenomenon for the sake of nation building to reveal the root cause why the students end up being unemployed even with excellent ex‐amination results. Posing this global issue in this article may not be effective in convincing readers especially whose works are related to education to take remedial action collectively in eliminating this syndrome but at least the issue can be further analyzed for future benefits. CORRELATING WITH APPLICATION Throughout the students’ learning process they have acquired a lot of information to help them sur‐vive their journey in this world. Are they ready to overcome the ever changing cutting edge technology? An understanding of fundamental con‐cept, enriching in terminology vocabulary, expertise in defining, laws recognition and excellent in deriv‐ing formula are the five probable solutions that the writer have elaborated above that are sufficient in helping students master such a program provided they could correlate all these five with application. We could collect many research data, insert them into a program and finally we would get the results. This application is called direct application of the
software. But we must be aware that all concepts have their related principles and branches of laws, especially in engineering. They must be interrelated and correlated with the intended application or ap‐propriate usage. For example, in football or soccer a lot of concepts have been applied. Most footballers apply plenty of impulsive force concepts. [3] While kicking a ball, they need to shorten the time of im‐pact to produce bigger force. Thus they can kick the ball with powerful shots on goal. Even some boots are designed to give better impact during a shot on goal. Moreover, while passing the ball they use the inside of the foot and provide the largest surface area to contact the ball. This gives them a better control of where the ball should go. Meanwhile the keeper should always increase the time of impact while catching the ball. By doing this the ball will exert minimum force, in the end he can catch the ball easily. Thus the application of a pair of glove is needed to suit this purpose. Heading the ball also applies some physics concept. We can make full use of the ball's momentum. When our head collides with the ball, we share our momen‐tum with it. The more momentum the ball gets from us, the faster and farther it will move. The bigger we are and the faster we are moving, the greater our momentum will be, and the more momentum we will have to share with the ball. Those examples proved that concepts and principles correlate to application. Figure 4 showing the Ar‐chimedes principle correlates with the application of submarine in which Archimedes himself was not thinking of even a ship at the time he discovered the principle. Another example is the Magnus Effect which de‐scribes the curved path that is observed by spinning projectile as shown in Figure 5. It correlates the Ber‐noulli’s principles with the application of jumping serve in the volleyball game. The writer insists to express further with a short evaluation of the so called "Bend it like David Beckham" phenomenon. In football a free kick taker should at least learn Bernoulli’s principle so that he can bend the ball like David Beckham or Christiano

| M
AR
INE
FR
ON
TIE
R @
UniK
L
91 MIMET Technical Bulletin Volume 2 (1) 2011
Ronaldo. Therefore to bend it like David Beckham the ball should be simply kicked slightly off center, causing it to spin horizontally. When the ball travels, air moves over the ball. The air will move more quickly around one side, making less pressure on that side of the ball (referring to Bernoulli’s Princi‐ple faster speed of air means lower pressure) [3]. On the other side of the ball, the air moves more slowly, as the spin is going directly against the flow of the air, causing more pressure on that side of the ball. The ball is pushed in the direction from high pressure to low pressure, making the ball curve. The spinning ball produces different speed which produces difference in pressure. Thus a resul‐tant force is produced which causes the ball to be bent with a curvy motion. Nevertheless the ability to master such a course would not be possible if the final way has not been acquired by the students. Blending all the other six ways with the ‘guided practicing’ which will be dis‐cussed later in this article would make the students develop their skills in mastering the course under‐taken by them. GUIDED PRACTICING We always hear the phrase ‘Practice makes Perfect’ throughout our learning process. However do the students really apply and utilize this motivational quotation during their learning time? If they do, how effective would be their practicing? Actually, it is not adequate to just doing repetitively without being guided by any lecturer or mentor in such a co‐
urse or program. The students themselves must en‐sure to acquire knowledge on how to practice effec‐tively and efficiently to enable them to master in any course they undertake and the lecturers or mentors are responsible to guide systematically through the process. How well the student im‐proves with practice depends on several factors, such as the frequency it is engaged in, and the type of feedback that is available for improvement. If feedback is not appropriate (either from an instruc‐tor or from self‐reference to an information source), then the practice tends to be ineffective or even detrimental to learning. If the students do not prac‐tice often enough, reinforcement fades, and they are likely to forget what was learned. Therefore, practice is often scheduled, to ensure enough of it is performed to reach one's training objectives. How much practice is required depends upon the nature of the activity, and upon each individual capability. Some students improve on a particular activity faster than others. Practice in an instructional set‐ting may be effective if repeated only one time (for some simple verbal information) or three times (for concepts), or it may be practiced many times before evaluation (Morreti, 2009). Given that practice is merely the reinforcement of actions that serve to generate an outcome or out‐comes, it is believed that by improving the type of practice the students do, they could in turn gener‐ate results at a faster rate. But all of these are inter‐dependent within the level of knowledge, creativity and analytical skills as well as attitude possessed by the students.
Figure 4: Submarine (Correlating Application of Archimedes Principle)
Figure 5: Volleyball Top Spin Serve (Correlating Application of Bernoulli’s Principle)
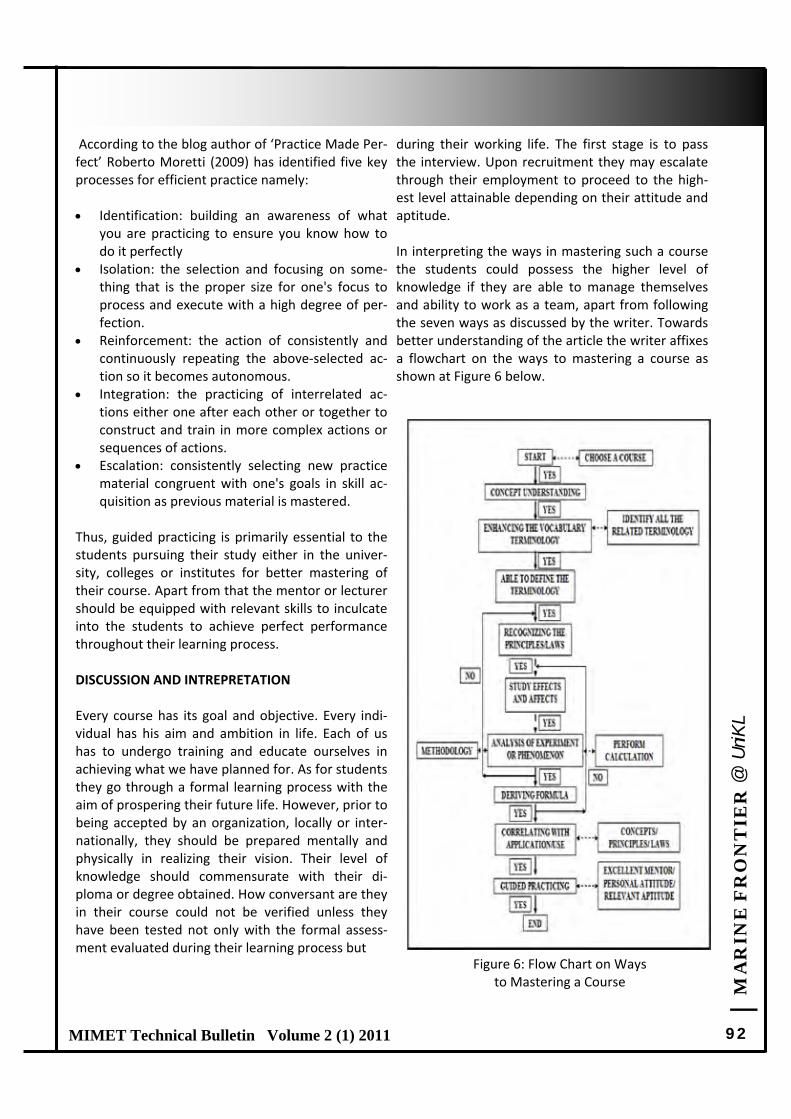
| M
AR
INE
FR
ON
TIE
R @
UniK
L
92 MIMET Technical Bulletin Volume 2 (1) 2011
According to the blog author of ‘Practice Made Per‐fect’ Roberto Moretti (2009) has identified five key processes for efficient practice namely: Identification: building an awareness of what
you are practicing to ensure you know how to do it perfectly
Isolation: the selection and focusing on some‐thing that is the proper size for one's focus to process and execute with a high degree of per‐fection.
Reinforcement: the action of consistently and continuously repeating the above‐selected ac‐tion so it becomes autonomous.
Integration: the practicing of interrelated ac‐tions either one after each other or together to construct and train in more complex actions or sequences of actions.
Escalation: consistently selecting new practice material congruent with one's goals in skill ac‐quisition as previous material is mastered.
Thus, guided practicing is primarily essential to the students pursuing their study either in the univer‐sity, colleges or institutes for better mastering of their course. Apart from that the mentor or lecturer should be equipped with relevant skills to inculcate into the students to achieve perfect performance throughout their learning process. DISCUSSION AND INTREPRETATION Every course has its goal and objective. Every indi‐vidual has his aim and ambition in life. Each of us has to undergo training and educate ourselves in achieving what we have planned for. As for students they go through a formal learning process with the aim of prospering their future life. However, prior to being accepted by an organization, locally or inter‐nationally, they should be prepared mentally and physically in realizing their vision. Their level of knowledge should commensurate with their di‐ploma or degree obtained. How conversant are they in their course could not be verified unless they have been tested not only with the formal assess‐ment evaluated during their learning process but
during their working life. The first stage is to pass the interview. Upon recruitment they may escalate through their employment to proceed to the high‐est level attainable depending on their attitude and aptitude. In interpreting the ways in mastering such a course the students could possess the higher level of knowledge if they are able to manage themselves and ability to work as a team, apart from following the seven ways as discussed by the writer. Towards better understanding of the article the writer affixes a flowchart on the ways to mastering a course as shown at Figure 6 below.
Figure 6: Flow Chart on Ways to Mastering a Course

| M
AR
INE
FR
ON
TIE
R @
UniK
L
93 MIMET Technical Bulletin Volume 2 (1) 2011
CONCLUSION Mastering a course is either an art or a science and may be considered as both. It depends on the indi‐vidual level of knowledge, good attitude and as well as the right aptitude. They are interrelated and in‐fluenced by the imperfections of human weakness. However, if the students equip themselves with seven appropriate ways as been listed and elabo‐rated in this article, with proper guidance through‐out the learning process together with the adequate resources to facilitate them mentally and physically, surely they would achieve a positive imprint on their minds. They would then ready to be tested, to give constructive views, to propose new designs and ever willing to go the extra mile. REFERENCES 1. Annual Survey of International & Compara tive
Alpa, Guido (1994) "General Principles of Law," Law: Vol. 1: Iss. 1,Article 2.
2. Ben Sweetland, (2001), I CAN : The Key To Life’s Golden Secret, Cadillac Publishing Co. Inc.
3. Eastlake, Charles N. (2002) "An Aerodynami‐cist's View of Lift, Bernoulli, and Newton", The Physics Teacher 40
4. Ministry of Higher Education Malaysia (2005). Code of Practice Quality Assurance in Public Universities in Malysia. 3rd Edition.
5. Klass Van Dokkum, (2003), Ship Knowledge: A Modern Encyclopedia. Dokmar Netherlands
6. Roberto Morreti, (2009) Practice Made Perfect: How Anyone Can Master Anything Quicker, Eas‐ier and Better Than Ever. Amazon.com.uk
7. Temmerman, R. (2000). Towards new ways of terminology description: the socio cognitive‐approach. John Benjamins Publishing Co.
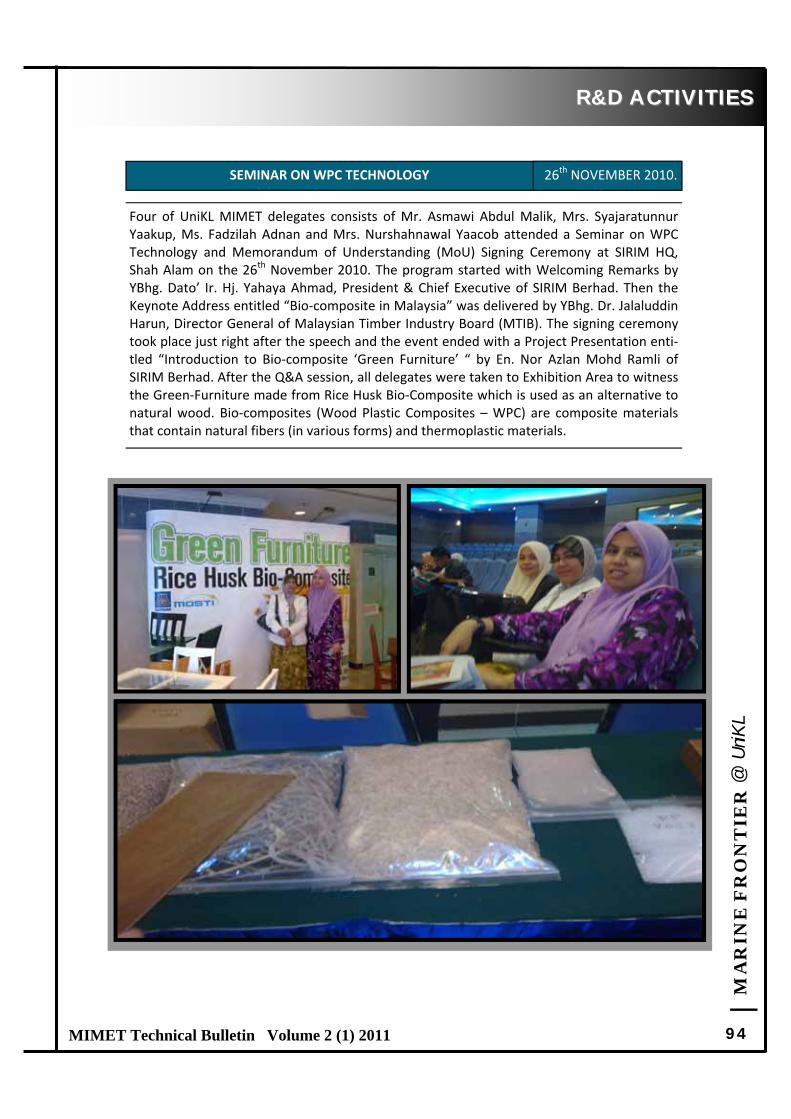
| M
AR
INE
FR
ON
TIE
R @
UniK
L
94 MIMET Technical Bulletin Volume 2 (1) 2011
R&D ACTIVITIESR&D ACTIVITIES
SEMINAR ON WPC TECHNOLOGY 26th NOVEMBER 2010.
Four of UniKL MIMET delegates consists of Mr. Asmawi Abdul Malik, Mrs. Syajaratunnur Yaakup, Ms. Fadzilah Adnan and Mrs. Nurshahnawal Yaacob attended a Seminar on WPC Technology and Memorandum of Understanding (MoU) Signing Ceremony at SIRIM HQ, Shah Alam on the 26th November 2010. The program started with Welcoming Remarks by YBhg. Dato’ Ir. Hj. Yahaya Ahmad, President & Chief Executive of SIRIM Berhad. Then the Keynote Address entitled “Bio‐composite in Malaysia” was delivered by YBhg. Dr. Jalaluddin Harun, Director General of Malaysian Timber Industry Board (MTIB). The signing ceremony took place just right after the speech and the event ended with a Project Presentation enti‐tled “Introduction to Bio‐composite ‘Green Furniture’ “ by En. Nor Azlan Mohd Ramli of SIRIM Berhad. After the Q&A session, all delegates were taken to Exhibition Area to witness the Green‐Furniture made from Rice Husk Bio‐Composite which is used as an alternative to natural wood. Bio‐composites (Wood Plastic Composites – WPC) are composite materials that contain natural fibers (in various forms) and thermoplastic materials.
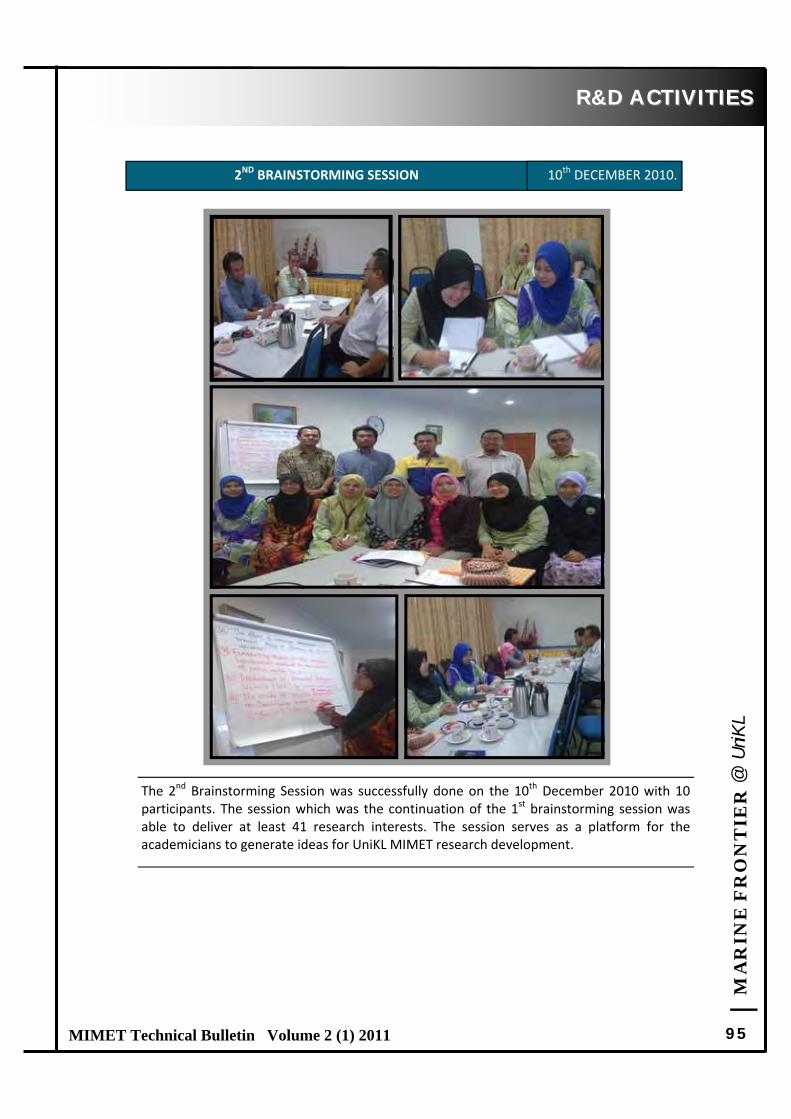
| M
AR
INE
FR
ON
TIE
R @
UniK
L
95 MIMET Technical Bulletin Volume 2 (1) 2011
R&D ACTIVITIESR&D ACTIVITIES
2ND BRAINSTORMING SESSION 10th DECEMBER 2010.
The 2nd Brainstorming Session was successfully done on the 10th December 2010 with 10 participants. The session which was the continuation of the 1st brainstorming session was able to deliver at least 41 research interests. The session serves as a platform for the academicians to generate ideas for UniKL MIMET research development.

| M
AR
INE
FR
ON
TIE
R @
UniK
L
96 MIMET Technical Bulletin Volume 2 (1) 2011
R&D ACTIVITIESR&D ACTIVITIES
Field Emission Scanning Electron Microscopy (FESEM) and Energy Dispersive X‐Ray Spectrometer (EDS) Seminar
13th APRIL 2011.
Field Emission Scanning Electron Microscopy (FESEM) and Energy Dispersive X‐Ray
Spectrometer (EDS) Seminar was held on the 13th April 2011 at Advance Technology Train‐
ing Centre (ADTEC) in Kamunting, Taiping, Perak. The half‐day seminar was attended by
more than 100 participants and was sponsored by Hi‐Tech Instruments Sdn. Bhd.
UniKL MIMET was invited to participate in the half‐day seminar and UniKL MIMET
delegations includes Head of Campus, Prof. Dato’ Dr. Mohd Mansor bin Salleh, Head of
Section of Marine Construction and Maintenance Technology Section, Mr. Kamarul Nasser
Mokri, R&D Coordinator, Mrs. Nurshahnawal Yaacob, lecturers from Applied Science and
Advance Technology Section, Mr. Zulzamri Salleh, Mrs. Syajaratunnur Yaakup, Mrs.
Syarmela Alaauldin, Ms. Fadzilah Adnan and Ms. Leanna Ismail along with one lecturer
from General Studies Section, Mrs. Norazizah Che Mat.
The half‐day seminar was officiated by ADTEC Director, Tn. Hj. Nik Othman bin Daud. Two
papers were presented by the Application Section Head of Hi ‐Tech Instruments Sdn. Bhd.,
Ms. Seow Siew Siew: The Principle of SEM‐FESEM and its Applications as well as The
Principle of Energy Dispersive X‐Ray Spectrometer (EDS). The technical papers presented
are useful for those involved in research work especially in the analysis part.
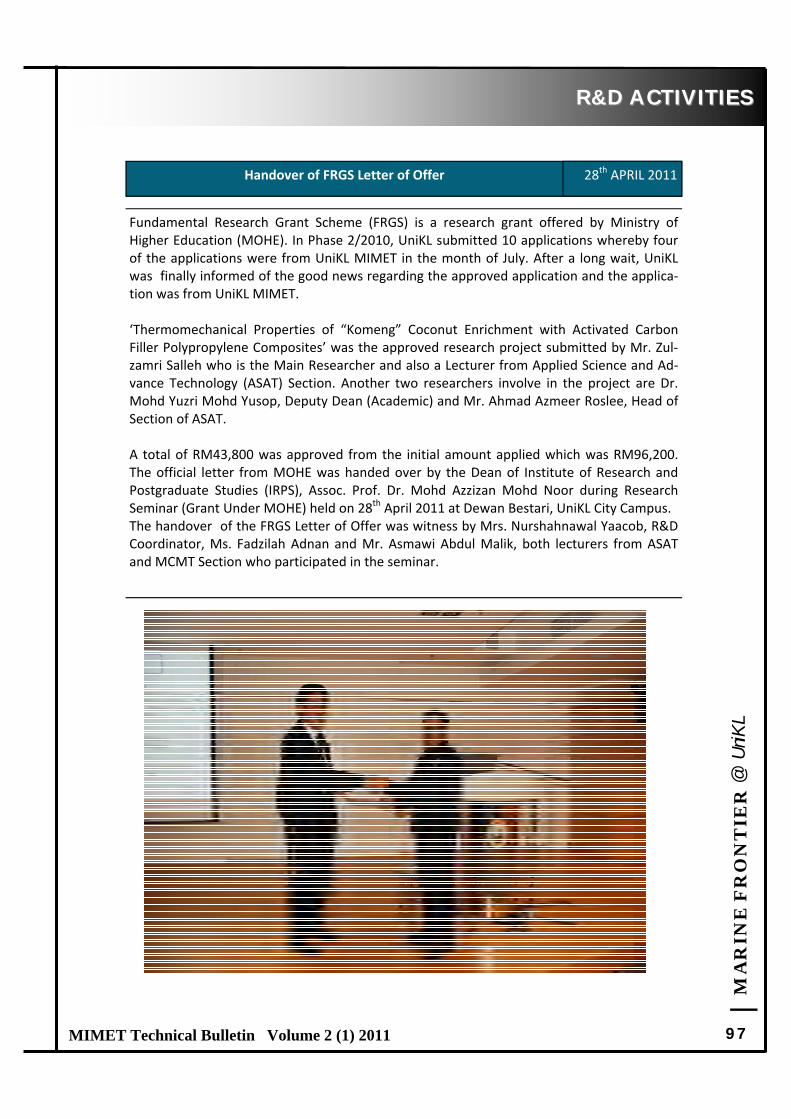
| M
AR
INE
FR
ON
TIE
R @
UniK
L
97 MIMET Technical Bulletin Volume 2 (1) 2011
R&D ACTIVITIESR&D ACTIVITIES
Handover of FRGS Letter of Offer 28th APRIL 2011
Fundamental Research Grant Scheme (FRGS) is a research grant offered by Ministry of Higher Education (MOHE). In Phase 2/2010, UniKL submitted 10 applications whereby four of the applications were from UniKL MIMET in the month of July. After a long wait, UniKL was finally informed of the good news regarding the approved application and the applica‐tion was from UniKL MIMET. ‘Thermomechanical Properties of “Komeng” Coconut Enrichment with Activated Carbon Filler Polypropylene Composites’ was the approved research project submitted by Mr. Zul‐zamri Salleh who is the Main Researcher and also a Lecturer from Applied Science and Ad‐vance Technology (ASAT) Section. Another two researchers involve in the project are Dr. Mohd Yuzri Mohd Yusop, Deputy Dean (Academic) and Mr. Ahmad Azmeer Roslee, Head of Section of ASAT. A total of RM43,800 was approved from the initial amount applied which was RM96,200. The official letter from MOHE was handed over by the Dean of Institute of Research and Postgraduate Studies (IRPS), Assoc. Prof. Dr. Mohd Azzizan Mohd Noor during Research Seminar (Grant Under MOHE) held on 28th April 2011 at Dewan Bestari, UniKL City Campus. The handover of the FRGS Letter of Offer was witness by Mrs. Nurshahnawal Yaacob, R&D Coordinator, Ms. Fadzilah Adnan and Mr. Asmawi Abdul Malik, both lecturers from ASAT and MCMT Section who participated in the seminar.
| M
AR
INE
FR
ON
TIE
R @
UniK
L
98 MIMET Technical Bulletin Volume 2 (1) 2011
R&D ACTIVITIESR&D ACTIVITIES
Made in UniKL – The Final Year Project Competition 2011 18th ‐19th MAY 2011 .
The Final Year Project Competition 2011 was successfully held on 18th till 19th May 2011 at UniKL City Campus and was officiated by Y.Bhg. Prof. Dato’ Dr. Abdul Hakim Juri the Presi‐dent of UniKL. Five Final Year Projects from UniKL MIMET participated in the two‐day com‐petition and compete with a total of 31 projects from various UniKL Campuses. The first day started with exhibition by the participants at the UniKL City Campus lobby. Each project was evaluated by 4 professional judges led by Assoc. Prof. Dr. Mohd Zahit Ali, Senior Lecturer from UniKL Malaysian Institute of Chemical and Bioengineering Technology (UniKL MICET), En. Ridza Ramza Ramli from SME Bank, Ms. Khairul Mazwan Ibrahim Pati from Multimedia Development Corporation (MDE) and En. Ritakamal Sadiman from e2B Consulting. The projects were assessed based on the originality, uniqueness and commercial values of the inventions. The top 10 Final Year Projects were announced on the next day at Dewan Bestari, UniKL City Campus. Winners of the competition will represent UniKL to the 2011 National Research and Innovation Competition (NRIC 2011) which will be held at Universiti Sains Malaysia (USM) in June. UniKL MIMET participation was done at the very last minute of the competition. Even though none of UniKL MIMET projects were selected as the top 10, the participants gave a very good cooperation and put a lot of effort for the exhibition. The projects that represented UniKL MIMET to the competition were: 1. Steering Gear System by Mohd Zaki bin Yahya, Azrul Effendi bin Alias and Ahmad Farez
bin Yacob. The project is supervised by Mr. Faisal Ikram Abd Samad. 2. Miniature Model for Electrical Power Generation, Transmission and Distribution System
by Muhammad Asyraf bin Mustaffa, Samsul Anuar bin Ibrahim and Amirul Ridzwan Ramli. The supervisor for the project is Mr. Azhar Othman.
3. Design Assessment: Structural Analysis on Tanker Conversion by Tengku Hamdan bin Tengku Mohd Hanafiah and Mohd Hanis @ Mohd Fadhil bin Mohd Nor. The project is supervised by Mr. Zaimi Zainal Mukhtar.
4. The Investigation of Manoeuvring Test 67.8 m Anchor Handing Tug and Supply Vessel (AHTS) by MATLAB Simulink Software by Joe‐Na Thean Chee Yee. The supervisor for this project is Engr. Iwan Zamil Mustaffa Kamal.
5. The Development of a Computer Programme to Calculate Laminating Schedule for GRP Hull according to Class Rule by Mohamad Ashik bin Abdul Kadir and Adawiyah binti Ab‐dul Rahim. The project is supervised by Mr. Asmawi Abdul Malik.
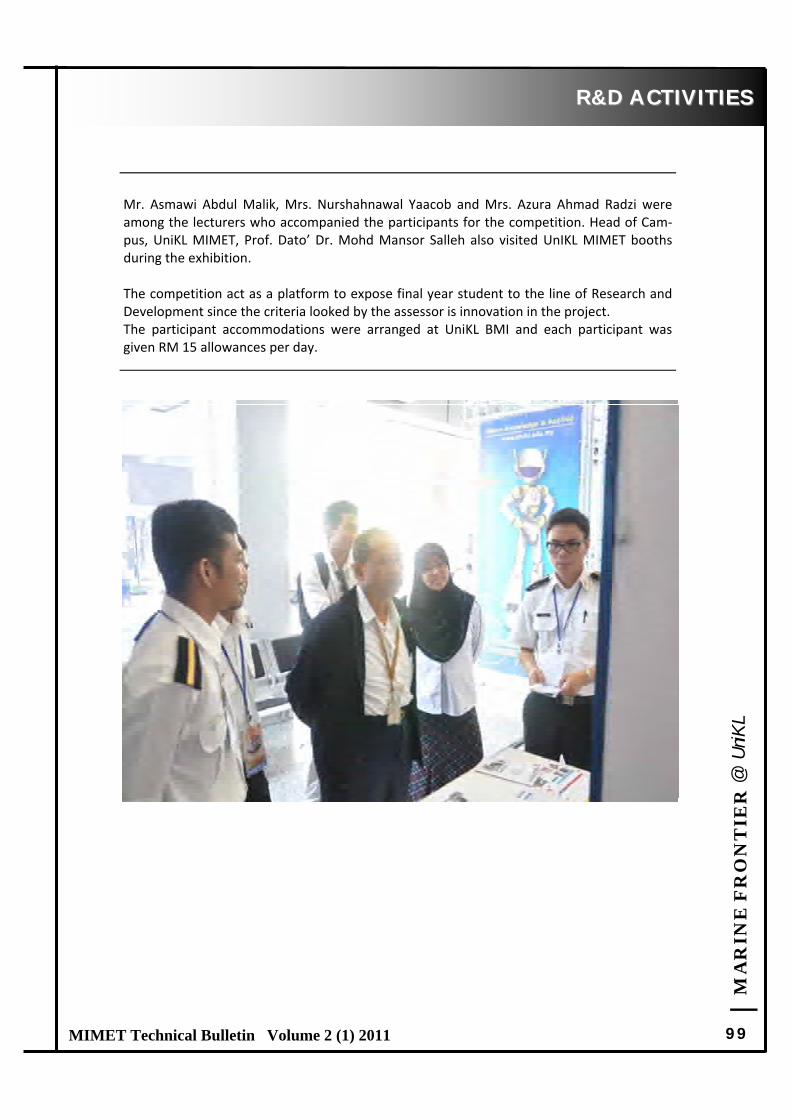
| M
AR
INE
FR
ON
TIE
R @
UniK
L
99 MIMET Technical Bulletin Volume 2 (1) 2011
R&D ACTIVITIESR&D ACTIVITIES
Mr. Asmawi Abdul Malik, Mrs. Nurshahnawal Yaacob and Mrs. Azura Ahmad Radzi were among the lecturers who accompanied the participants for the competition. Head of Cam‐pus, UniKL MIMET, Prof. Dato’ Dr. Mohd Mansor Salleh also visited UnIKL MIMET booths during the exhibition. The competition act as a platform to expose final year student to the line of Research and Development since the criteria looked by the assessor is innovation in the project. The participant accommodations were arranged at UniKL BMI and each participant was given RM 15 allowances per day.

| M
AR
INE
FR
ON
TIE
R @
UniK
L
100 MIMET Technical Bulletin Volume 2 (1) 2011
R&D ACTIVITIESR&D ACTIVITIES
Malaysian Toray Science Foundation (MTSF) Promotional Road Show 11th MARCH 2011.
On March 11th 2011, UniKL MIMET delegations participated in the 18th program of the Ma‐laysian Toray Science Foundation (MTSF) Promotional Road Show which was conducted at Universiti Tunku Abdul Rahman (UTAR) at Kampar Campus. MTSF under Toray Malaysia group is a privately funded charitable organization with the pri‐mary objective of advancing science and technology in Malaysia. The Malaysia Toray Sci‐ence Foundation was established in 1993 through a RM4 million endowment by Toray In‐dustries, Inc. Japan. The foundation offers three types of grants: Science and Technology Award, Science and Technology Research Grants and Science Education Award. UniKL MIMET successfully submitted two applications under Science and Technology Re‐search Grants entitled ‘Flame Retardance Effect of N500 Series Carbon black in Polyester Resin for Marine Application’ and ‘Synthesis and Characterization of Short Carbon Rein‐forced Recycled PET (Polyethylene terephthalate) for Sailboat Hull’ for the application clos‐ing date ended on the 31st May 2011. The road show had motivated the academic staff to apply for more external grants which is in line with the university mission. UniKL MIMET delegations consisted of four lecturers, Mrs. Syajaratunnur Yaakup, Ms. Fadzilah Adnan, Ms. Norazlina Abdul Nasir, Mr. Asmawi Abdul Malik and R&D Coordinator, Mrs. Nurshahnawal Yaacob.

| M
AR
INE
FR
ON
TIE
R @
UniK
L
101 MIMET Technical Bulletin Volume 2 (1) 2011
CALL FOR PAPERSCALL FOR PAPERS
To inculcate the research culture amongst academics, Universiti Kuala Lumpur Malaysian Institute of Marine Engineer-ing Technology (UniKL MIMET) is publishing the Marine Frontier@UniKL Research Bulletin. For a start, the bulletin will be published four times a year, in January, April, July and October. Original research papers, which have not been pub-lished or currently being considered for publication elsewhere, will be considered. Accepted Types of Research The papers accepted for the bulletins must be based on any of the following types of research:
Basic research (pure basic research and strategic basic research)
Applied research
Experimental development
Critical review
Pure basic research is experimental and theoretical work undertaken to acquire new knowledge without looking for long-terms benefits other than advancement of knowledge. Strategic basic research is experimental and theoretical work undertaken to acquire new knowledge directed into specified broad areas in the expectation of useful discoveries. It provides the broad base of knowledge necessary for the solution of recognised practical problems. Applied research is original work undertaken primarily to acquire new knowledge with a specific application in view. It is undertaken either to determine possible use for the findings of basic research or to determine new ways of achieving some specific and predetermined objectives. Experimental development is systematic work, using existing knowledge gained from research or practical experience that is directed to producing new materials, products or devices, to installing new processes, systems and services, or to improving substantially those already produced or installed. Critical review is a comprehensive preview and critical analysis of existing literature. It must also propose a unique lens, framework or model that helps understand specific body of knowledge or address specific research issues. Condition of Acceptance The editorial board considers all papers on the condition that:
They are original
The authors hold the property or copyright of the paper
They have not been published already
They are not under consideration for publication elsewhere, nor in press elsewhere
They use non-discriminatory language
The use of proper English (except for manuscripts written in Bahasa Melayu-applicable for selective only)
All papers must be typed on A4 size page using Microsoft Words. The complete paper must be approximately 3, 500 words long (excluding references and appendixes). The format is described in detail in the next section. All papers are reviewed by the editorial board and evaluated according to:
Originality
Significance in contributing new knowledge
Technical adequacy
Appropriateness for the bulletin
Clarity of presentation
All papers will be directed to the appropriate team and/or track. The papers will be reviewed by reviewer(s) and/or editor. All review comments and suggestions should be addressed in the final submission if the paper is accepted for publication, copyright is transferred to the bulletin. Please submit your paper directly to the Chief Editor- [email protected] or the Executive Editor- [email protected] for publication in the next issue of the Marine Frontier@UniKL.