Embed Size (px)
Citation preview
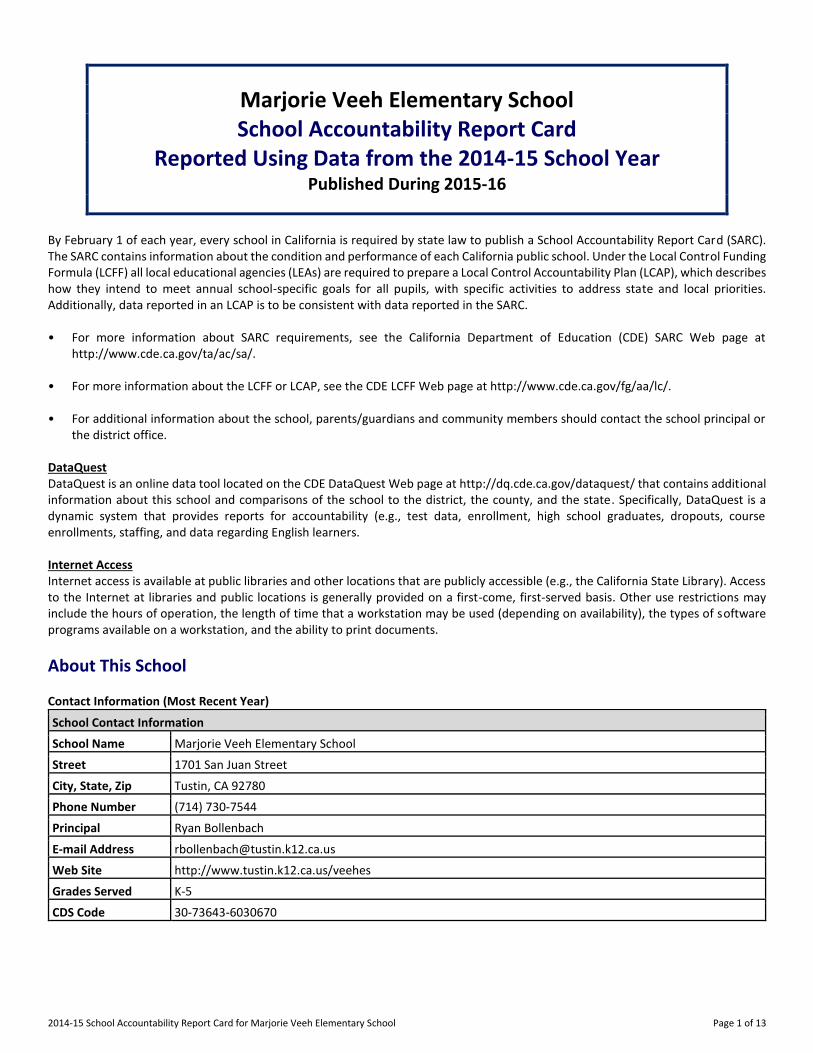
2014-15 School Accountability Report Card for Marjorie Veeh Elementary School Page 1 of 13
Marjorie Veeh Elementary School
School Accountability Report Card
Reported Using Data from the 2014-15 School Year
Published During 2015-16
By February 1 of each year, every school in California is required by state law to publish a School Accountability Report Card (SARC). The SARC contains information about the condition and performance of each California public school. Under the Local Control Funding Formula (LCFF) all local educational agencies (LEAs) are required to prepare a Local Control Accountability Plan (LCAP), which describes how they intend to meet annual school-specific goals for all pupils, with specific activities to address state and local priorities. Additionally, data reported in an LCAP is to be consistent with data reported in the SARC. • For more information about SARC requirements, see the California Department of Education (CDE) SARC Web page at
http://www.cde.ca.gov/ta/ac/sa/. • For more information about the LCFF or LCAP, see the CDE LCFF Web page at http://www.cde.ca.gov/fg/aa/lc/. • For additional information about the school, parents/guardians and community members should contact the school principal or
the district office. DataQuest DataQuest is an online data tool located on the CDE DataQuest Web page at http://dq.cde.ca.gov/dataquest/ that contains additional information about this school and comparisons of the school to the district, the county, and the state. Specifically, DataQuest is a dynamic system that provides reports for accountability (e.g., test data, enrollment, high school graduates, dropouts, course enrollments, staffing, and data regarding English learners. Internet Access Internet access is available at public libraries and other locations that are publicly accessible (e.g., the California State Library). Access to the Internet at libraries and public locations is generally provided on a first-come, first-served basis. Other use restrictions may include the hours of operation, the length of time that a workstation may be used (depending on availability), the types of software programs available on a workstation, and the ability to print documents.
About This School Contact Information (Most Recent Year)
School Contact Information
School Name------- Marjorie Veeh Elementary School
Street------- 1701 San Juan Street
City, State, Zip------- Tustin, CA 92780
Phone Number------- (714) 730-7544
Principal------- Ryan Bollenbach
E-mail Address------- [email protected]
Web Site------- http://www.tustin.k12.ca.us/veehes
Grades Served K-5
CDS Code 30-73643-6030670
2014-15 School Accountability Report Card for Marjorie Veeh Elementary School Page 2 of 13
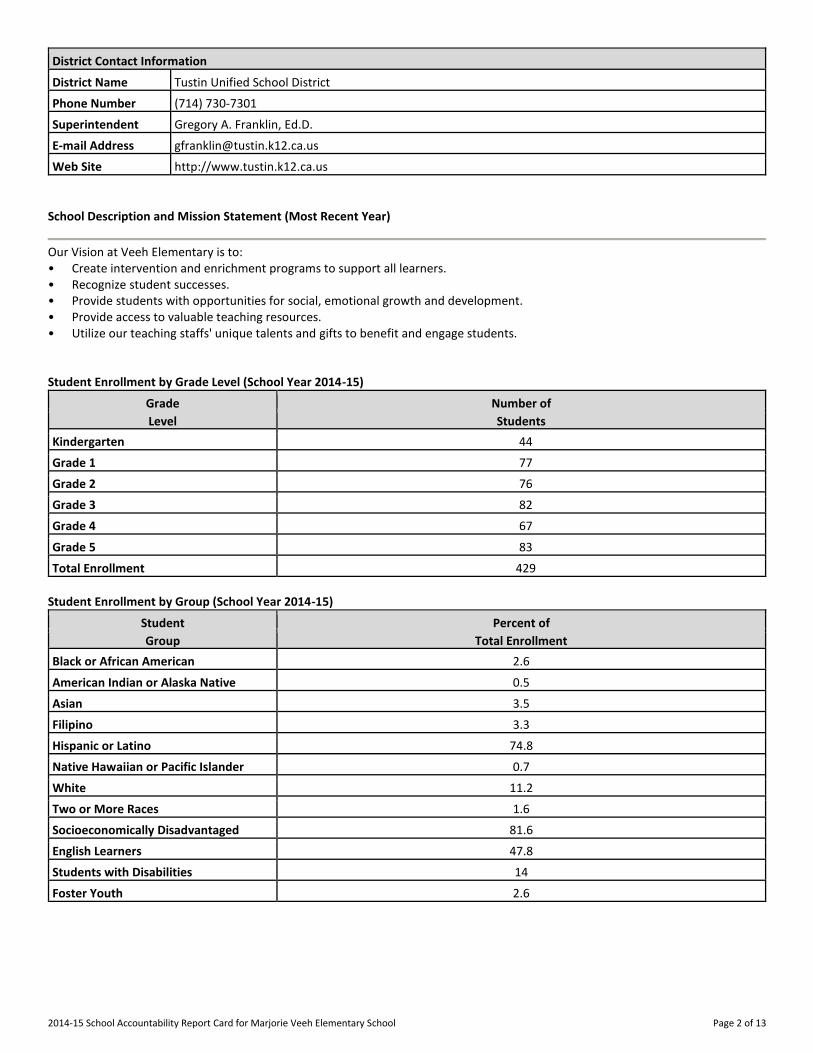
District Contact Information
District Name------- Tustin Unified School District
Phone Number------- (714) 730-7301
Superintendent-------
Gregory A. Franklin, Ed.D.
E-mail Address------- [email protected]
Web Site------- http://www.tustin.k12.ca.us
School Description and Mission Statement (Most Recent Year)
Our Vision at Veeh Elementary is to: • Create intervention and enrichment programs to support all learners. • Recognize student successes. • Provide students with opportunities for social, emotional growth and development. • Provide access to valuable teaching resources. • Utilize our teaching staffs' unique talents and gifts to benefit and engage students. Student Enrollment by Grade Level (School Year 2014-15)
Grade Number of
Level Students
Kindergarten 44
Grade 1 77
Grade 2 76
Grade 3 82
Grade 4 67
Grade 5 83
Total Enrollment 429
Student Enrollment by Group (School Year 2014-15)
Student Percent of
Group Total Enrollment
Black or African American 2.6
American Indian or Alaska Native 0.5
Asian 3.5
Filipino 3.3
Hispanic or Latino 74.8
Native Hawaiian or Pacific Islander 0.7
White 11.2
Two or More Races 1.6
Socioeconomically Disadvantaged 81.6
English Learners 47.8
Students with Disabilities 14
Foster Youth 2.6
2014-15 School Accountability Report Card for Marjorie Veeh Elementary School Page 3 of 13
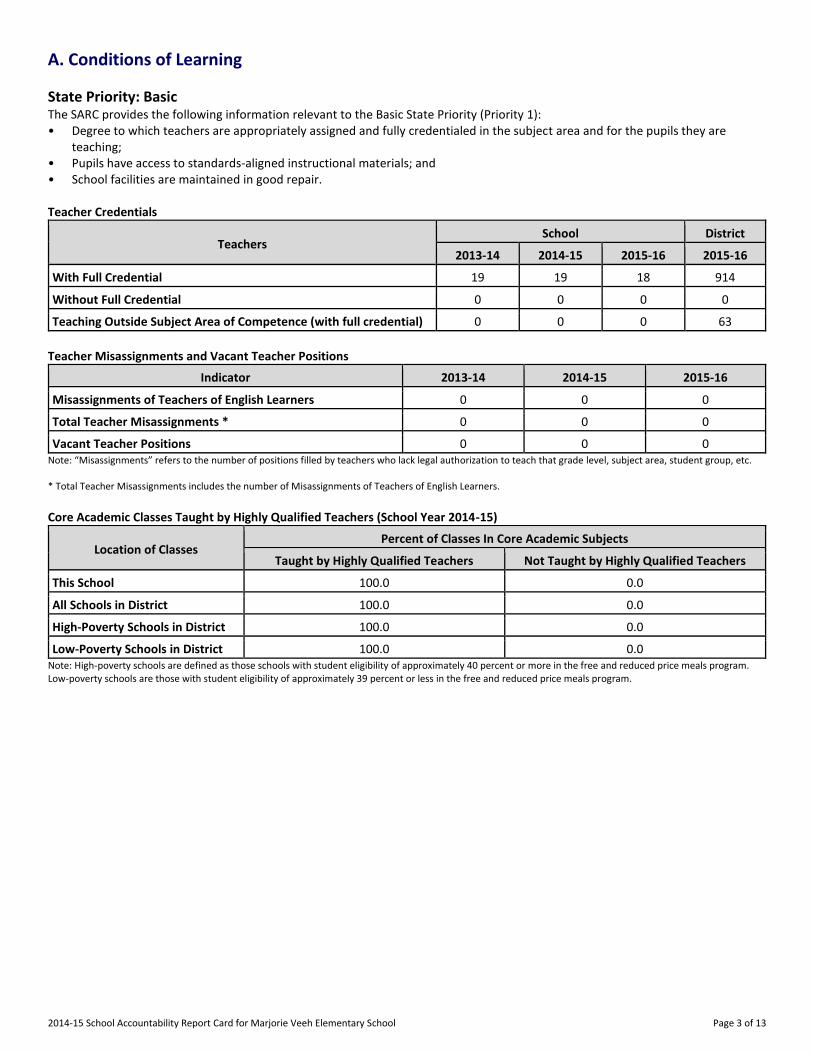
A. Conditions of Learning
State Priority: Basic The SARC provides the following information relevant to the Basic State Priority (Priority 1): • Degree to which teachers are appropriately assigned and fully credentialed in the subject area and for the pupils they are
teaching; • Pupils have access to standards-aligned instructional materials; and • School facilities are maintained in good repair. Teacher Credentials
Teachers School District
2013-14 2014-15 2015-16 2015-16
With Full Credential 19 19 18 914
Without Full Credential 0 0 0 0
Teaching Outside Subject Area of Competence (with full credential) 0 0 0 63
Teacher Misassignments and Vacant Teacher Positions
Indicator 2013-14 2014-15 2015-16
Misassignments of Teachers of English Learners 0 0 0
Total Teacher Misassignments * 0 0 0
Vacant Teacher Positions 0 0 0 Note: “Misassignments” refers to the number of positions filled by teachers who lack legal authorization to teach that grade level, subject area, student group, etc. * Total Teacher Misassignments includes the number of Misassignments of Teachers of English Learners. Core Academic Classes Taught by Highly Qualified Teachers (School Year 2014-15)
Location of Classes Percent of Classes In Core Academic Subjects
Taught by Highly Qualified Teachers Not Taught by Highly Qualified Teachers
This School 100.0 0.0
All Schools in District 100.0 0.0
High-Poverty Schools in District 100.0 0.0
Low-Poverty Schools in District 100.0 0.0 Note: High-poverty schools are defined as those schools with student eligibility of approximately 40 percent or more in the free and reduced price meals program. Low-poverty schools are those with student eligibility of approximately 39 percent or less in the free and reduced price meals program.
2014-15 School Accountability Report Card for Marjorie Veeh Elementary School Page 4 of 13
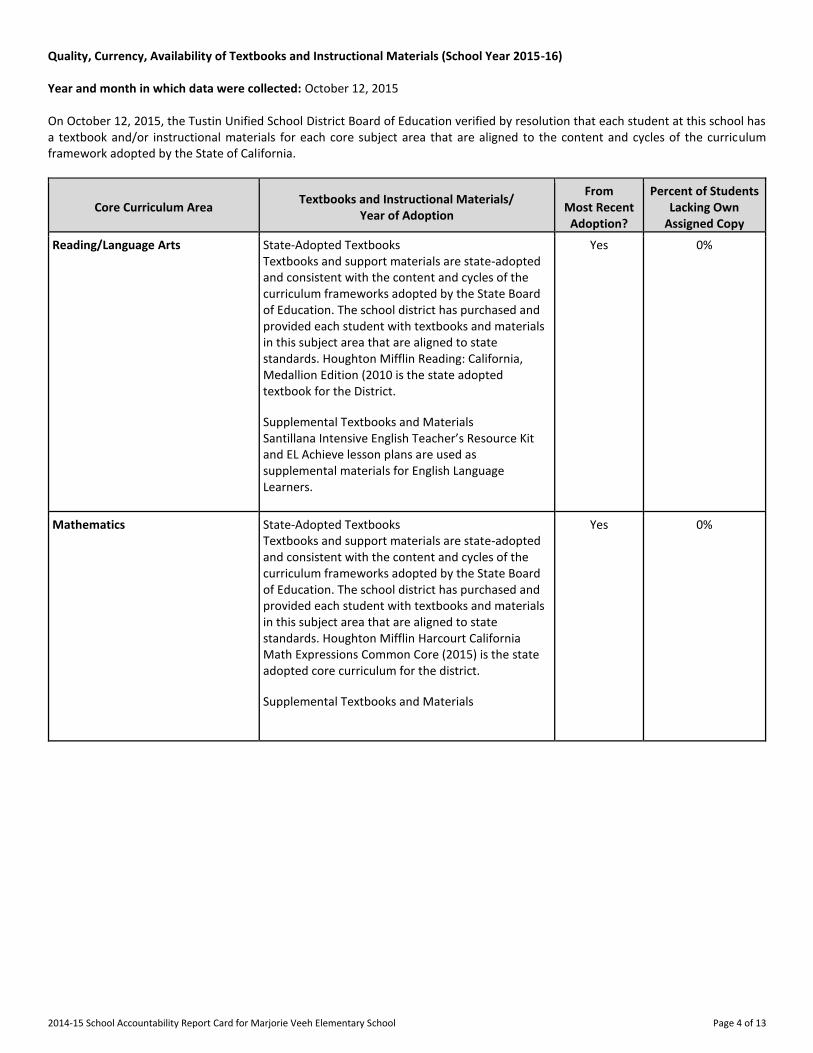
Quality, Currency, Availability of Textbooks and Instructional Materials (School Year 2015-16) Year and month in which data were collected: October 12, 2015 On October 12, 2015, the Tustin Unified School District Board of Education verified by resolution that each student at this school has a textbook and/or instructional materials for each core subject area that are aligned to the content and cycles of the curriculum framework adopted by the State of California.
Core Curriculum Area Textbooks and Instructional Materials/
Year of Adoption
From Most Recent
Adoption?
Percent of Students Lacking Own
Assigned Copy
Reading/Language Arts State-Adopted Textbooks
Textbooks and support materials are state-adopted and consistent with the content and cycles of the curriculum frameworks adopted by the State Board of Education. The school district has purchased and provided each student with textbooks and materials in this subject area that are aligned to state standards. Houghton Mifflin Reading: California, Medallion Edition (2010 is the state adopted textbook for the District.
Supplemental Textbooks and Materials
Santillana Intensive English Teacher’s Resource Kit and EL Achieve lesson plans are used as supplemental materials for English Language Learners.
Yes 0%
Mathematics State-Adopted Textbooks
Textbooks and support materials are state-adopted and consistent with the content and cycles of the curriculum frameworks adopted by the State Board of Education. The school district has purchased and provided each student with textbooks and materials in this subject area that are aligned to state standards. Houghton Mifflin Harcourt California Math Expressions Common Core (2015) is the state adopted core curriculum for the district.
Supplemental Textbooks and Materials
Yes 0%
2014-15 School Accountability Report Card for Marjorie Veeh Elementary School Page 5 of 13
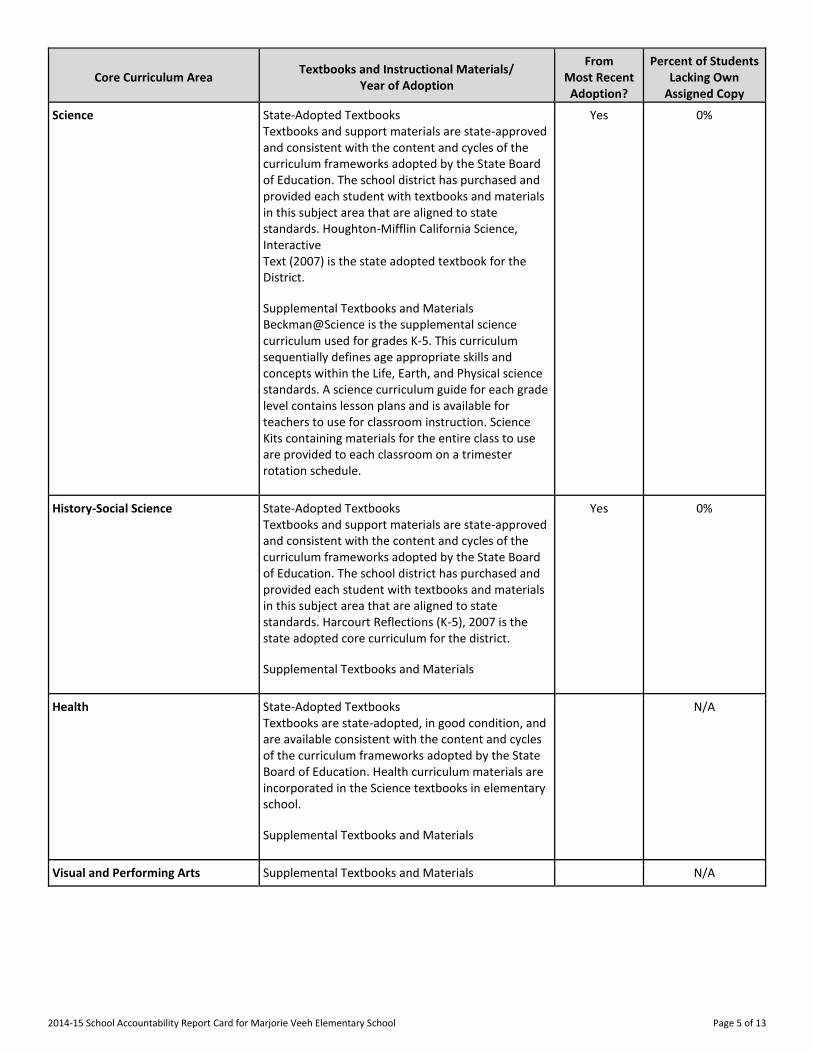
Core Curriculum Area Textbooks and Instructional Materials/
Year of Adoption
From Most Recent
Adoption?
Percent of Students Lacking Own
Assigned Copy
Science State-Adopted Textbooks
Textbooks and support materials are state-approved and consistent with the content and cycles of the curriculum frameworks adopted by the State Board of Education. The school district has purchased and provided each student with textbooks and materials in this subject area that are aligned to state standards. Houghton-Mifflin California Science, Interactive
Text (2007) is the state adopted textbook for the District.
Supplemental Textbooks and Materials
Beckman@Science is the supplemental science curriculum used for grades K-5. This curriculum sequentially defines age appropriate skills and concepts within the Life, Earth, and Physical science standards. A science curriculum guide for each grade level contains lesson plans and is available for teachers to use for classroom instruction. Science Kits containing materials for the entire class to use are provided to each classroom on a trimester rotation schedule.
Yes 0%
History-Social Science State-Adopted Textbooks
Textbooks and support materials are state-approved and consistent with the content and cycles of the curriculum frameworks adopted by the State Board of Education. The school district has purchased and provided each student with textbooks and materials in this subject area that are aligned to state standards. Harcourt Reflections (K-5), 2007 is the state adopted core curriculum for the district.
Supplemental Textbooks and Materials
Yes 0%
Health State-Adopted Textbooks
Textbooks are state-adopted, in good condition, and are available consistent with the content and cycles of the curriculum frameworks adopted by the State Board of Education. Health curriculum materials are incorporated in the Science textbooks in elementary school.
Supplemental Textbooks and Materials
N/A
Visual and Performing Arts Supplemental Textbooks and Materials N/A
2014-15 School Accountability Report Card for Marjorie Veeh Elementary School Page 6 of 13
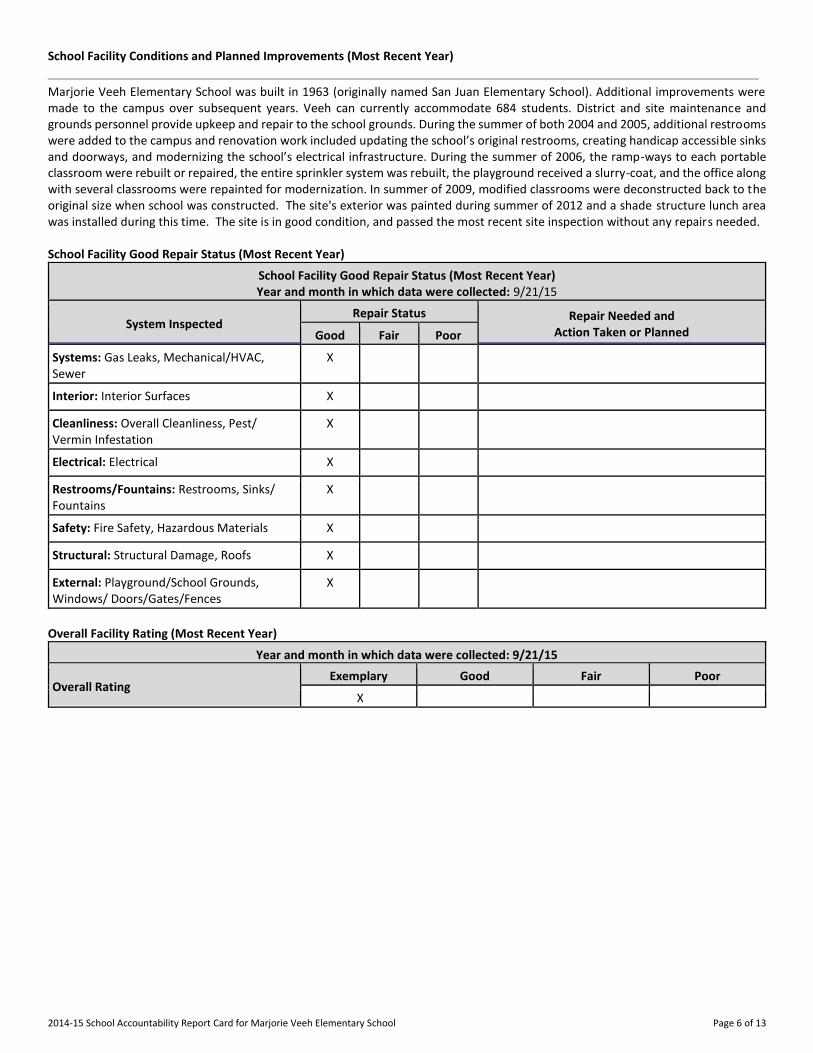
School Facility Conditions and Planned Improvements (Most Recent Year)
Marjorie Veeh Elementary School was built in 1963 (originally named San Juan Elementary School). Additional improvements were made to the campus over subsequent years. Veeh can currently accommodate 684 students. District and site maintenance and grounds personnel provide upkeep and repair to the school grounds. During the summer of both 2004 and 2005, additional restrooms were added to the campus and renovation work included updating the school’s original restrooms, creating handicap accessible sinks and doorways, and modernizing the school’s electrical infrastructure. During the summer of 2006, the ramp-ways to each portable classroom were rebuilt or repaired, the entire sprinkler system was rebuilt, the playground received a slurry-coat, and the office along with several classrooms were repainted for modernization. In summer of 2009, modified classrooms were deconstructed back to the original size when school was constructed. The site's exterior was painted during summer of 2012 and a shade structure lunch area was installed during this time. The site is in good condition, and passed the most recent site inspection without any repairs needed. School Facility Good Repair Status (Most Recent Year)
School Facility Good Repair Status (Most Recent Year) Year and month in which data were collected: 9/21/15
System Inspected Repair Status Repair Needed and
Action Taken or Planned Good Fair Poor
Systems: Gas Leaks, Mechanical/HVAC, Sewer
X
Interior: Interior Surfaces X
Cleanliness: Overall Cleanliness, Pest/ Vermin Infestation
X
Electrical: Electrical X
Restrooms/Fountains: Restrooms, Sinks/ Fountains
X
Safety: Fire Safety, Hazardous Materials X
Structural: Structural Damage, Roofs X
External: Playground/School Grounds, Windows/ Doors/Gates/Fences
X
Overall Facility Rating (Most Recent Year)
Year and month in which data were collected: 9/21/15
Overall Rating Exemplary Good Fair Poor
X
2014-15 School Accountability Report Card for Marjorie Veeh Elementary School Page 7 of 13
B. Pupil Outcomes
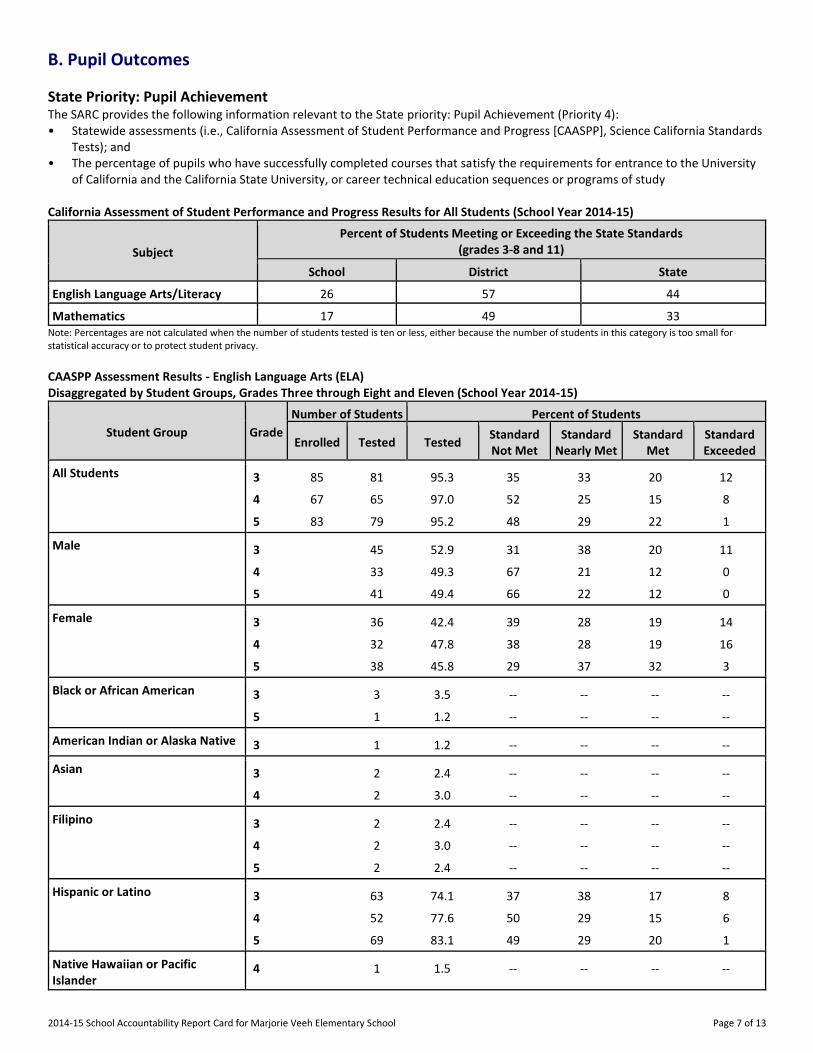
State Priority: Pupil Achievement The SARC provides the following information relevant to the State priority: Pupil Achievement (Priority 4): • Statewide assessments (i.e., California Assessment of Student Performance and Progress [CAASPP], Science California Standards
Tests); and • The percentage of pupils who have successfully completed courses that satisfy the requirements for entrance to the University
of California and the California State University, or career technical education sequences or programs of study California Assessment of Student Performance and Progress Results for All Students (School Year 2014-15)
Subject
Percent of Students Meeting or Exceeding the State Standards (grades 3-8 and 11)
School District State
English Language Arts/Literacy 26 57 44
Mathematics 17 49 33 Note: Percentages are not calculated when the number of students tested is ten or less, either because the number of students in this category is too small for statistical accuracy or to protect student privacy.
CAASPP Assessment Results - English Language Arts (ELA) Disaggregated by Student Groups, Grades Three through Eight and Eleven (School Year 2014-15)
Student Group Grade
Number of Students Percent of Students
Enrolled Tested Tested Standard Not Met
Standard Nearly Met
Standard Met
Standard Exceeded
All Students 3 85 81 95.3 35 33 20 12
4 67 65 97.0 52 25 15 8
5 83 79 95.2 48 29 22 1
Male 3 45 52.9 31 38 20 11
4 33 49.3 67 21 12 0
5 41 49.4 66 22 12 0
Female 3 36 42.4 39 28 19 14
4 32 47.8 38 28 19 16
5 38 45.8 29 37 32 3
Black or African American 3 3 3.5 -- -- -- --
5 1 1.2 -- -- -- --
American Indian or Alaska Native 3 1 1.2 -- -- -- --
Asian 3 2 2.4 -- -- -- --
4 2 3.0 -- -- -- --
Filipino 3 2 2.4 -- -- -- --
4 2 3.0 -- -- -- --
5 2 2.4 -- -- -- --
Hispanic or Latino 3 63 74.1 37 38 17 8
4 52 77.6 50 29 15 6
5 69 83.1 49 29 20 1
Native Hawaiian or Pacific Islander
4 1 1.5 -- -- -- --
2014-15 School Accountability Report Card for Marjorie Veeh Elementary School Page 8 of 13
Student Group Grade
Number of Students Percent of Students
Enrolled Tested Tested Standard Not Met
Standard Nearly Met
Standard Met
Standard Exceeded
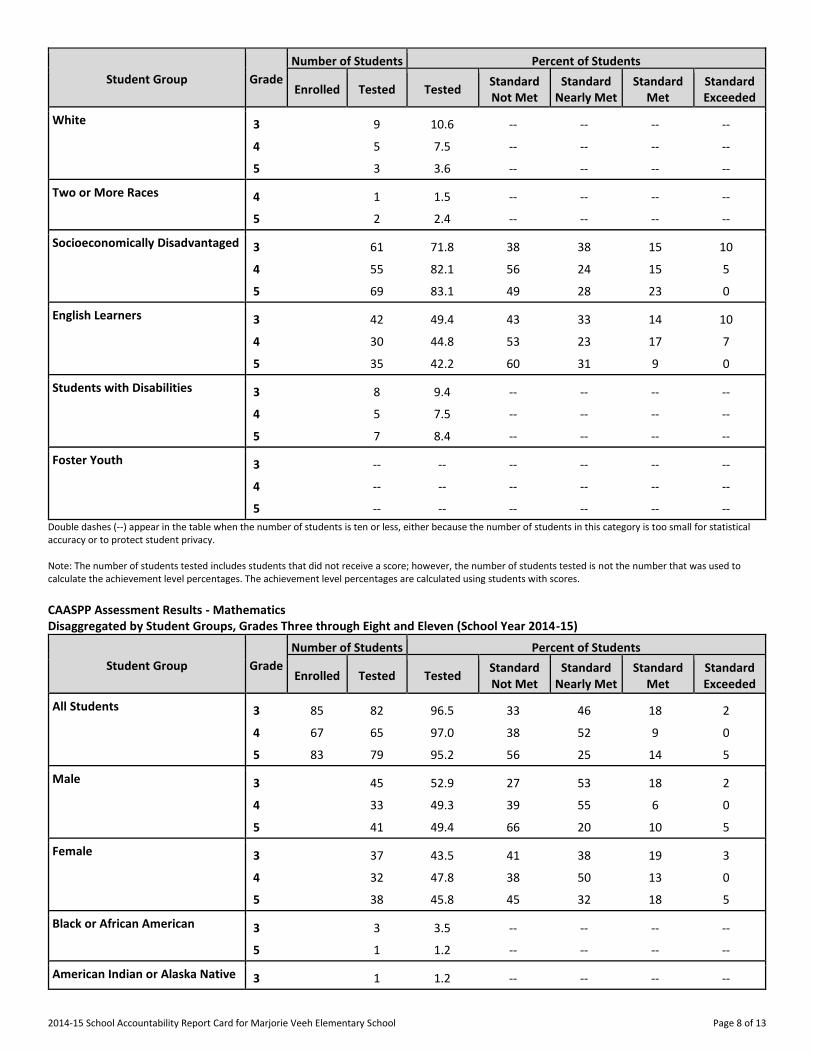
White 3 9 10.6 -- -- -- --
4 5 7.5 -- -- -- --
5 3 3.6 -- -- -- --
Two or More Races 4 1 1.5 -- -- -- --
5 2 2.4 -- -- -- --
Socioeconomically Disadvantaged 3 61 71.8 38 38 15 10
4 55 82.1 56 24 15 5
5 69 83.1 49 28 23 0
English Learners 3 42 49.4 43 33 14 10
4 30 44.8 53 23 17 7
5 35 42.2 60 31 9 0
Students with Disabilities 3 8 9.4 -- -- -- --
4 5 7.5 -- -- -- --
5 7 8.4 -- -- -- --
Foster Youth 3 -- -- -- -- -- --
4 -- -- -- -- -- --
5 -- -- -- -- -- --
Double dashes (--) appear in the table when the number of students is ten or less, either because the number of students in this category is too small for statistical accuracy or to protect student privacy. Note: The number of students tested includes students that did not receive a score; however, the number of students tested is not the number that was used to calculate the achievement level percentages. The achievement level percentages are calculated using students with scores.
CAASPP Assessment Results - Mathematics Disaggregated by Student Groups, Grades Three through Eight and Eleven (School Year 2014-15)
Student Group Grade
Number of Students Percent of Students
Enrolled Tested Tested Standard Not Met
Standard Nearly Met
Standard Met
Standard Exceeded
All Students 3 85 82 96.5 33 46 18 2
4 67 65 97.0 38 52 9 0
5 83 79 95.2 56 25 14 5
Male 3 45 52.9 27 53 18 2
4 33 49.3 39 55 6 0
5 41 49.4 66 20 10 5
Female 3 37 43.5 41 38 19 3
4 32 47.8 38 50 13 0
5 38 45.8 45 32 18 5
Black or African American 3 3 3.5 -- -- -- --
5 1 1.2 -- -- -- --
American Indian or Alaska Native 3 1 1.2 -- -- -- --
2014-15 School Accountability Report Card for Marjorie Veeh Elementary School Page 9 of 13
Student Group Grade
Number of Students Percent of Students
Enrolled Tested Tested Standard Not Met
Standard Nearly Met
Standard Met
Standard Exceeded
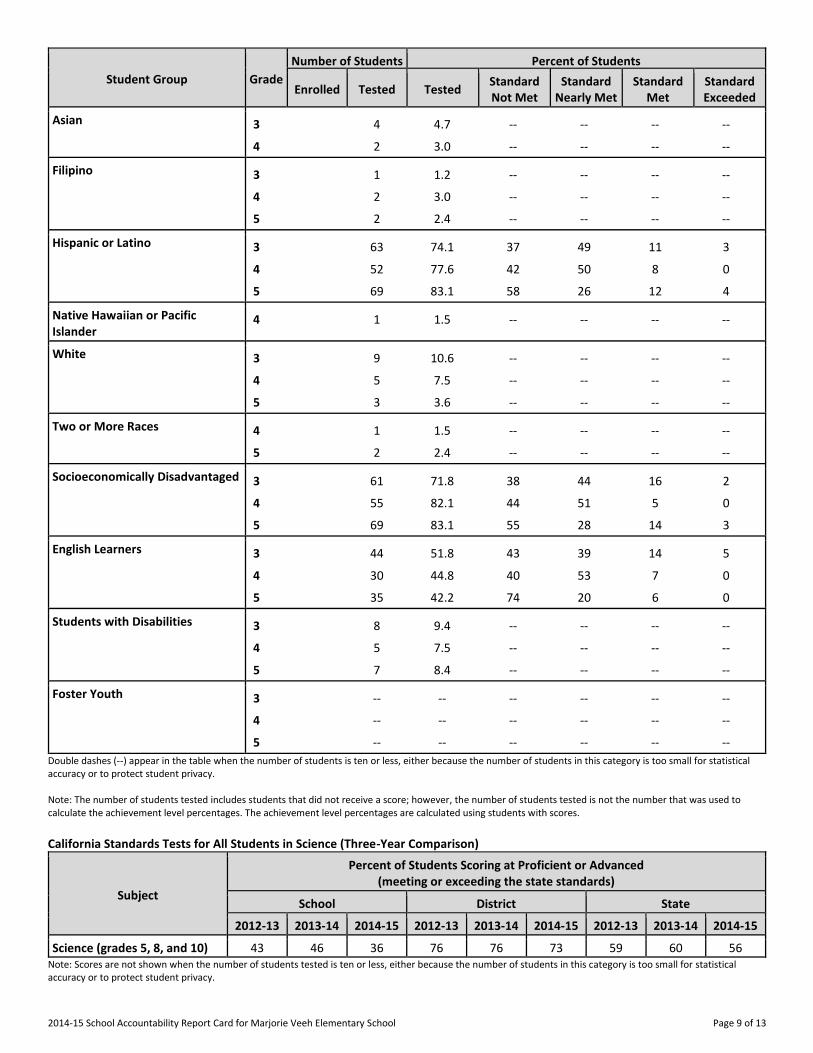
Asian 3 4 4.7 -- -- -- --
4 2 3.0 -- -- -- --
Filipino 3 1 1.2 -- -- -- --
4 2 3.0 -- -- -- --
5 2 2.4 -- -- -- --
Hispanic or Latino 3 63 74.1 37 49 11 3
4 52 77.6 42 50 8 0
5 69 83.1 58 26 12 4
Native Hawaiian or Pacific Islander
4 1 1.5 -- -- -- --
White 3 9 10.6 -- -- -- --
4 5 7.5 -- -- -- --
5 3 3.6 -- -- -- --
Two or More Races 4 1 1.5 -- -- -- --
5 2 2.4 -- -- -- --
Socioeconomically Disadvantaged 3 61 71.8 38 44 16 2
4 55 82.1 44 51 5 0
5 69 83.1 55 28 14 3
English Learners 3 44 51.8 43 39 14 5
4 30 44.8 40 53 7 0
5 35 42.2 74 20 6 0
Students with Disabilities 3 8 9.4 -- -- -- --
4 5 7.5 -- -- -- --
5 7 8.4 -- -- -- --
Foster Youth 3 -- -- -- -- -- --
4 -- -- -- -- -- --
5 -- -- -- -- -- --
Double dashes (--) appear in the table when the number of students is ten or less, either because the number of students in this category is too small for statistical accuracy or to protect student privacy. Note: The number of students tested includes students that did not receive a score; however, the number of students tested is not the number that was used to calculate the achievement level percentages. The achievement level percentages are calculated using students with scores.
California Standards Tests for All Students in Science (Three-Year Comparison)
Subject
Percent of Students Scoring at Proficient or Advanced (meeting or exceeding the state standards)
School District State
2012-13 2013-14 2014-15 2012-13 2013-14 2014-15 2012-13 2013-14 2014-15
Science (grades 5, 8, and 10) 43 46 36 76 76 73 59 60 56 Note: Scores are not shown when the number of students tested is ten or less, either because the number of students in this category is too small for statistical accuracy or to protect student privacy.
2014-15 School Accountability Report Card for Marjorie Veeh Elementary School Page 10 of 13
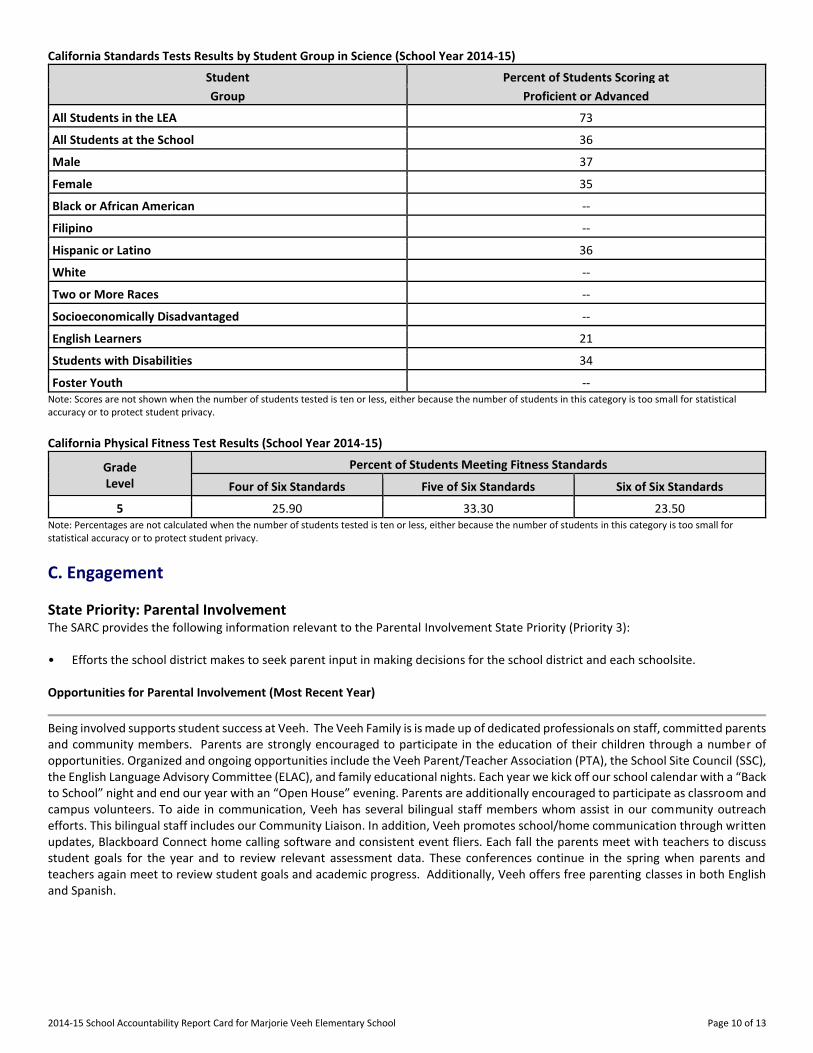
California Standards Tests Results by Student Group in Science (School Year 2014-15)
Student Percent of Students Scoring at
Group Proficient or Advanced
All Students in the LEA 73
All Students at the School 36
Male 37
Female 35
Black or African American --
Filipino --
Hispanic or Latino 36
White --
Two or More Races --
Socioeconomically Disadvantaged --
English Learners 21
Students with Disabilities 34
Foster Youth -- Note: Scores are not shown when the number of students tested is ten or less, either because the number of students in this category is too small for statistical accuracy or to protect student privacy.
California Physical Fitness Test Results (School Year 2014-15)
Grade Level
Percent of Students Meeting Fitness Standards
Four of Six Standards Five of Six Standards Six of Six Standards
---5--- 25.90 33.30 23.50 Note: Percentages are not calculated when the number of students tested is ten or less, either because the number of students in this category is too small for statistical accuracy or to protect student privacy.
C. Engagement
State Priority: Parental Involvement The SARC provides the following information relevant to the Parental Involvement State Priority (Priority 3): • Efforts the school district makes to seek parent input in making decisions for the school district and each schoolsite. Opportunities for Parental Involvement (Most Recent Year)
Being involved supports student success at Veeh. The Veeh Family is is made up of dedicated professionals on staff, committed parents and community members. Parents are strongly encouraged to participate in the education of their children through a number of opportunities. Organized and ongoing opportunities include the Veeh Parent/Teacher Association (PTA), the School Site Council (SSC), the English Language Advisory Committee (ELAC), and family educational nights. Each year we kick off our school calendar with a “Back to School” night and end our year with an “Open House” evening. Parents are additionally encouraged to participate as classroom and campus volunteers. To aide in communication, Veeh has several bilingual staff members whom assist in our community outreach efforts. This bilingual staff includes our Community Liaison. In addition, Veeh promotes school/home communication through written updates, Blackboard Connect home calling software and consistent event fliers. Each fall the parents meet with teachers to discuss student goals for the year and to review relevant assessment data. These conferences continue in the spring when parents and teachers again meet to review student goals and academic progress. Additionally, Veeh offers free parenting classes in both English and Spanish.
2014-15 School Accountability Report Card for Marjorie Veeh Elementary School Page 11 of 13
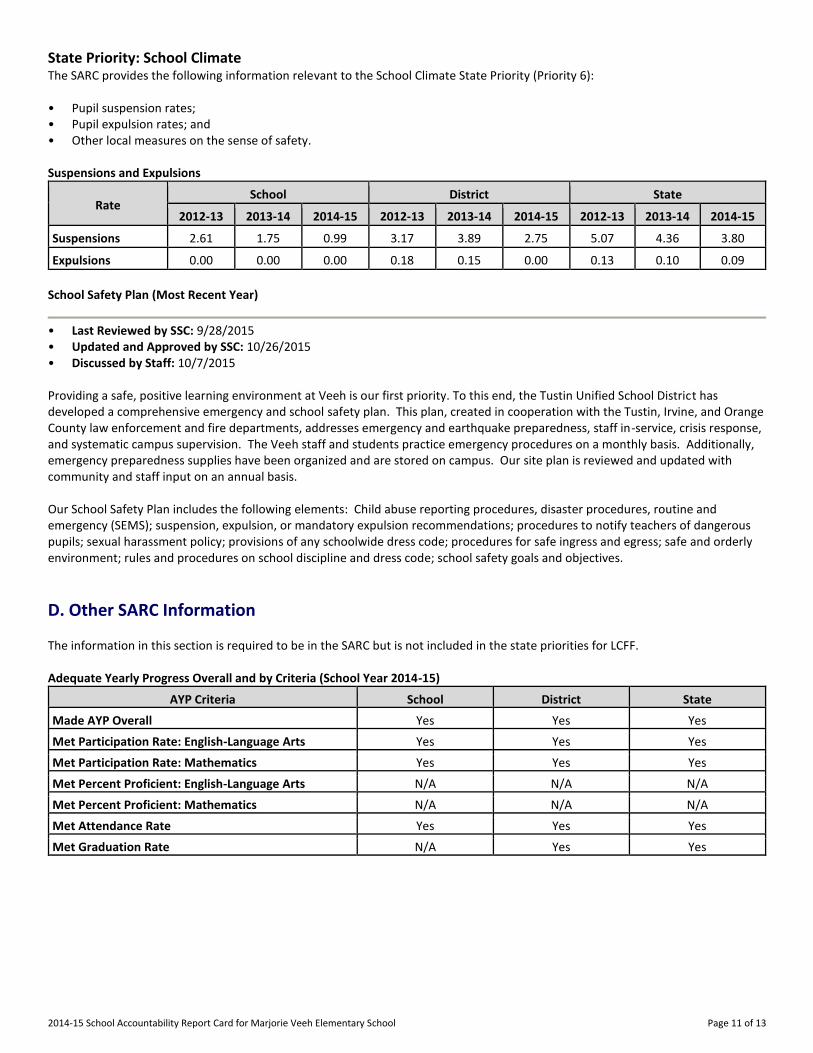
State Priority: School Climate The SARC provides the following information relevant to the School Climate State Priority (Priority 6): • Pupil suspension rates; • Pupil expulsion rates; and • Other local measures on the sense of safety. Suspensions and Expulsions
Rate School District State
2012-13 2013-14 2014-15 2012-13 2013-14 2014-15 2012-13 2013-14 2014-15
Suspensions------- 2.61 1.75 0.99 3.17 3.89 2.75 5.07 4.36 3.80
Expulsions------- 0.00 0.00 0.00 0.18 0.15 0.00 0.13 0.10 0.09
School Safety Plan (Most Recent Year)
• Last Reviewed by SSC: 9/28/2015 • Updated and Approved by SSC: 10/26/2015 • Discussed by Staff: 10/7/2015 Providing a safe, positive learning environment at Veeh is our first priority. To this end, the Tustin Unified School District has developed a comprehensive emergency and school safety plan. This plan, created in cooperation with the Tustin, Irvine, and Orange County law enforcement and fire departments, addresses emergency and earthquake preparedness, staff in-service, crisis response, and systematic campus supervision. The Veeh staff and students practice emergency procedures on a monthly basis. Additionally, emergency preparedness supplies have been organized and are stored on campus. Our site plan is reviewed and updated with community and staff input on an annual basis. Our School Safety Plan includes the following elements: Child abuse reporting procedures, disaster procedures, routine and emergency (SEMS); suspension, expulsion, or mandatory expulsion recommendations; procedures to notify teachers of dangerous pupils; sexual harassment policy; provisions of any schoolwide dress code; procedures for safe ingress and egress; safe and orderly environment; rules and procedures on school discipline and dress code; school safety goals and objectives.
D. Other SARC Information
The information in this section is required to be in the SARC but is not included in the state priorities for LCFF. Adequate Yearly Progress Overall and by Criteria (School Year 2014-15)
AYP Criteria School District State
Made AYP Overall Yes Yes Yes
Met Participation Rate: English-Language Arts Yes Yes Yes
Met Participation Rate: Mathematics Yes Yes Yes
Met Percent Proficient: English-Language Arts N/A N/A N/A
Met Percent Proficient: Mathematics N/A N/A N/A
Met Attendance Rate Yes Yes Yes
Met Graduation Rate N/A Yes Yes
2014-15 School Accountability Report Card for Marjorie Veeh Elementary School Page 12 of 13
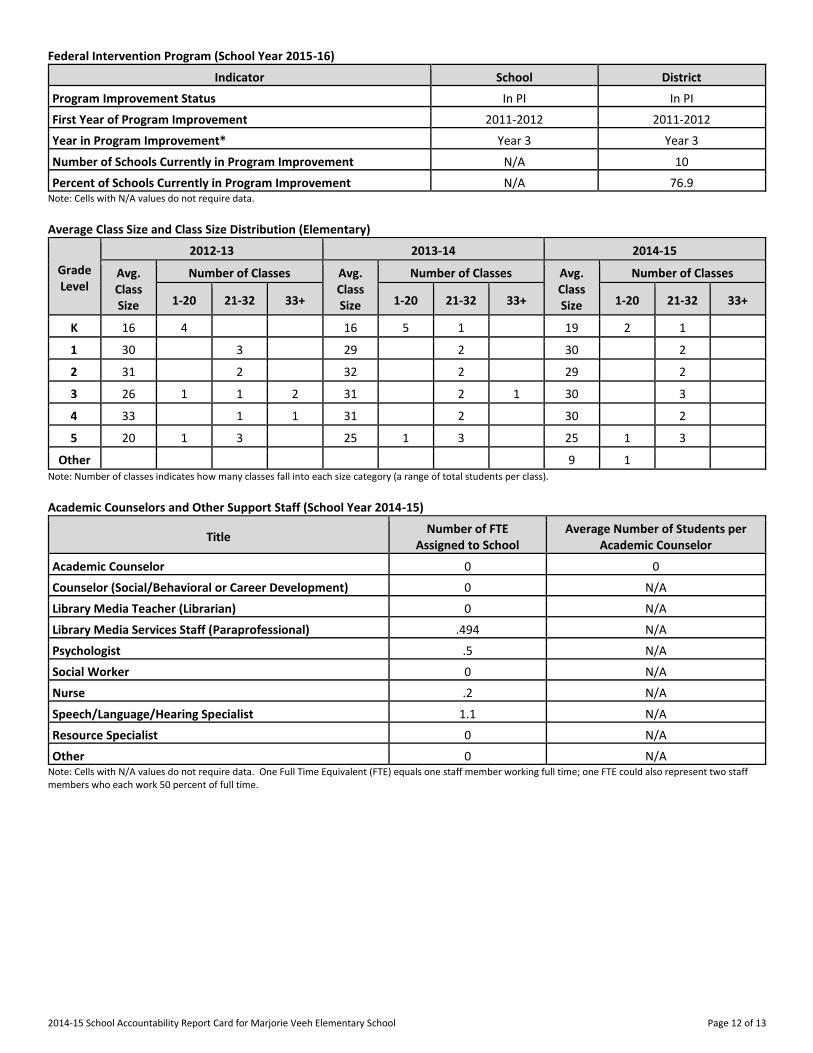
Federal Intervention Program (School Year 2015-16)
Indicator School District
Program Improvement Status In PI In PI
First Year of Program Improvement 2011-2012 2011-2012
Year in Program Improvement* Year 3 Year 3
Number of Schools Currently in Program Improvement N/A 10
Percent of Schools Currently in Program Improvement N/A 76.9 Note: Cells with N/A values do not require data.
Average Class Size and Class Size Distribution (Elementary)
Grade Level
2012-13 2013-14 2014-15
Avg. Class Size
Number of Classes Avg. Class Size
Number of Classes Avg. Class Size
Number of Classes
1-20 21-32 33+ 1-20 21-32 33+ 1-20 21-32 33+
K
16 4 16 5 1 19 2 1
1
30 3 29 2 30 2
2
31 2 32 2 29 2
3
26 1 1 2 31 2 1 30 3
4
33 1 1 31 2 30 2
5
20 1 3 25 1 3 25 1 3
Other
9 1 Note: Number of classes indicates how many classes fall into each size category (a range of total students per class).
Academic Counselors and Other Support Staff (School Year 2014-15)
Title Number of FTE
Assigned to School Average Number of Students per
Academic Counselor
Academic Counselor------- 0 0
Counselor (Social/Behavioral or Career Development) 0 N/A
Library Media Teacher (Librarian) 0 N/A
Library Media Services Staff (Paraprofessional) .494 N/A
Psychologist------- .5 N/A
Social Worker------- 0 N/A
Nurse------- .2 N/A
Speech/Language/Hearing Specialist 1.1 N/A
Resource Specialist------- 0 N/A
Other------- 0 N/A Note: Cells with N/A values do not require data. One Full Time Equivalent (FTE) equals one staff member working full time; one FTE could also represent two staff members who each work 50 percent of full time.
2014-15 School Accountability Report Card for Marjorie Veeh Elementary School Page 13 of 13
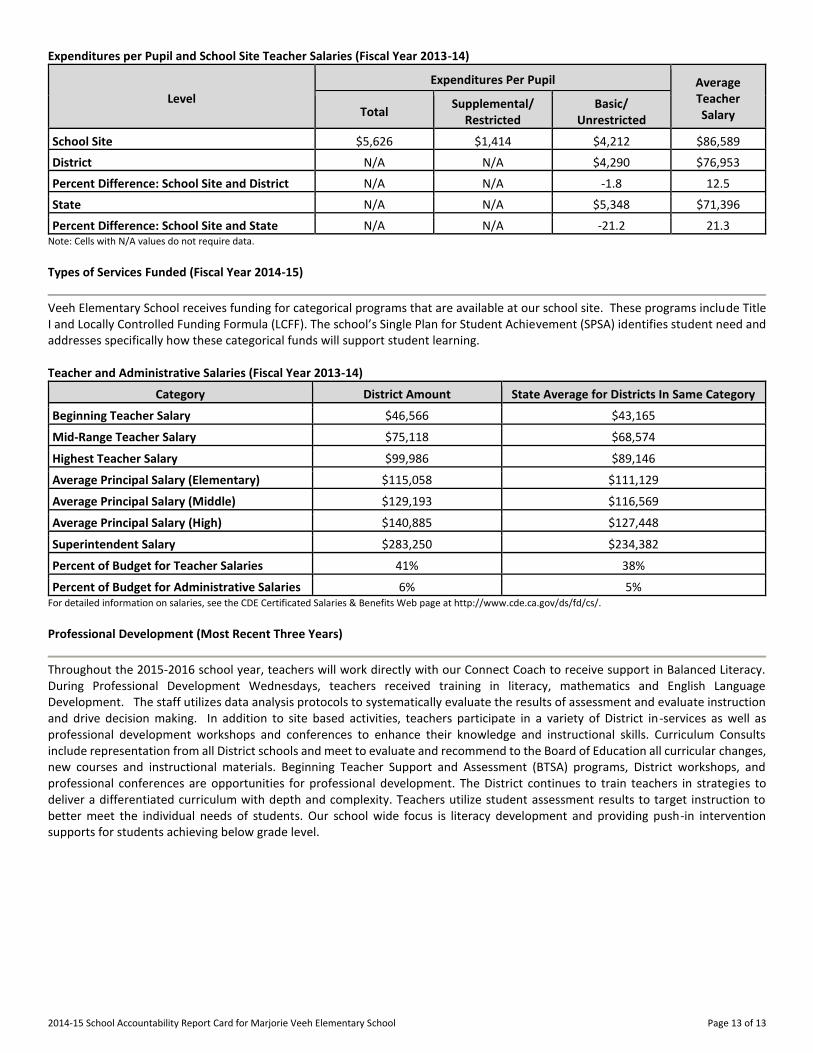
Expenditures per Pupil and School Site Teacher Salaries (Fiscal Year 2013-14)
Level
Expenditures Per Pupil Average Teacher Salary Total
Supplemental/ Restricted
Basic/ Unrestricted
School Site------- $5,626 $1,414 $4,212 $86,589
District------- N/A N/A $4,290 $76,953
Percent Difference: School Site and District N/A N/A -1.8 12.5
State------- N/A N/A $5,348 $71,396
Percent Difference: School Site and State N/A N/A -21.2 21.3 Note: Cells with N/A values do not require data.
Types of Services Funded (Fiscal Year 2014-15)
Veeh Elementary School receives funding for categorical programs that are available at our school site. These programs include Title I and Locally Controlled Funding Formula (LCFF). The school’s Single Plan for Student Achievement (SPSA) identifies student need and addresses specifically how these categorical funds will support student learning. Teacher and Administrative Salaries (Fiscal Year 2013-14)
Category District Amount State Average for Districts In Same Category
Beginning Teacher Salary $46,566 $43,165
Mid-Range Teacher Salary $75,118 $68,574
Highest Teacher Salary $99,986 $89,146
Average Principal Salary (Elementary) $115,058 $111,129
Average Principal Salary (Middle) $129,193 $116,569
Average Principal Salary (High) $140,885 $127,448
Superintendent Salary $283,250 $234,382
Percent of Budget for Teacher Salaries 41% 38%
Percent of Budget for Administrative Salaries 6% 5% For detailed information on salaries, see the CDE Certificated Salaries & Benefits Web page at http://www.cde.ca.gov/ds/fd/cs/. Professional Development (Most Recent Three Years)
Throughout the 2015-2016 school year, teachers will work directly with our Connect Coach to receive support in Balanced Literacy. During Professional Development Wednesdays, teachers received training in literacy, mathematics and English Language Development. The staff utilizes data analysis protocols to systematically evaluate the results of assessment and evaluate instruction and drive decision making. In addition to site based activities, teachers participate in a variety of District in-services as well as professional development workshops and conferences to enhance their knowledge and instructional skills. Curriculum Consults include representation from all District schools and meet to evaluate and recommend to the Board of Education all curricular changes, new courses and instructional materials. Beginning Teacher Support and Assessment (BTSA) programs, District workshops, and professional conferences are opportunities for professional development. The District continues to train teachers in strategies to deliver a differentiated curriculum with depth and complexity. Teachers utilize student assessment results to target instruction to better meet the individual needs of students. Our school wide focus is literacy development and providing push-in intervention supports for students achieving below grade level.