Embed Size (px)
Citation preview
UNIVERSITY OF CAMBRIDGE INTERNATIONAL EXAMINATIONS
GCE Advanced Subsidiary and Advanced Level
MARK SCHEME for the June 2004 question papers
9706 ACCOUNTING
9706/01 Paper 1 (Multiple Choice), maximum raw mark 30
9706/02 Paper 2 (Structured Questions), maximum raw mark 90
9706/03 Paper 3 (Multiple Choice), maximum raw mark 30
9706/04 Paper 4 (Problem Solving), maximum raw mark 120
These mark schemes are published as an aid to teachers and students, to indicate the requirements of the examination. They show the basis on which Examiners were initially instructed to award marks. They do not indicate the details of the discussions that took place at an Examiners’ meeting before marking began. Any substantial changes to the mark scheme that arose from these discussions will be recorded in the published Report on the Examination. All Examiners are instructed that alternative correct answers and unexpected approaches in candidates’ scripts must be given marks that fairly reflect the relevant knowledge and skills demonstrated. Mark schemes must be read in conjunction with the question papers and the Report on the Examination.
• CIE will not enter into discussion or correspondence in connection with these mark schemes. CIE is publishing the mark schemes for the June 2004 question papers for most IGCSE and GCE Advanced Level syllabuses.
www.theallpapers.com
Grade thresholds taken for Syllabus 9706 (Accounting) in the June 2004 examination.
minimum mark required for grade: maximum mark
available A B E
Component 1 30 21 19 14
Component 2 90 64 58 38
Component 3 30 22 20 14
Component 4 120 88 79 45
The thresholds (minimum marks) for Grades C and D are normally set by dividing the mark range between the B and the E thresholds into three. For example, if the difference between the B and the E threshold is 24 marks, the C threshold is set 8 marks below the B threshold and the D threshold is set another 8 marks down. If dividing the interval by three results in a fraction of a mark, then the threshold is normally rounded down.
www.theallpapers.com
JUNE 2004
GCE A AND AS LEVEL
MARK SCHEME
MAXIMUM MARK: 30
SYLLABUS/COMPONENT: 9706/01
ACCOUNTING Paper 1 (Multiple Choice)
www.theallpapers.com
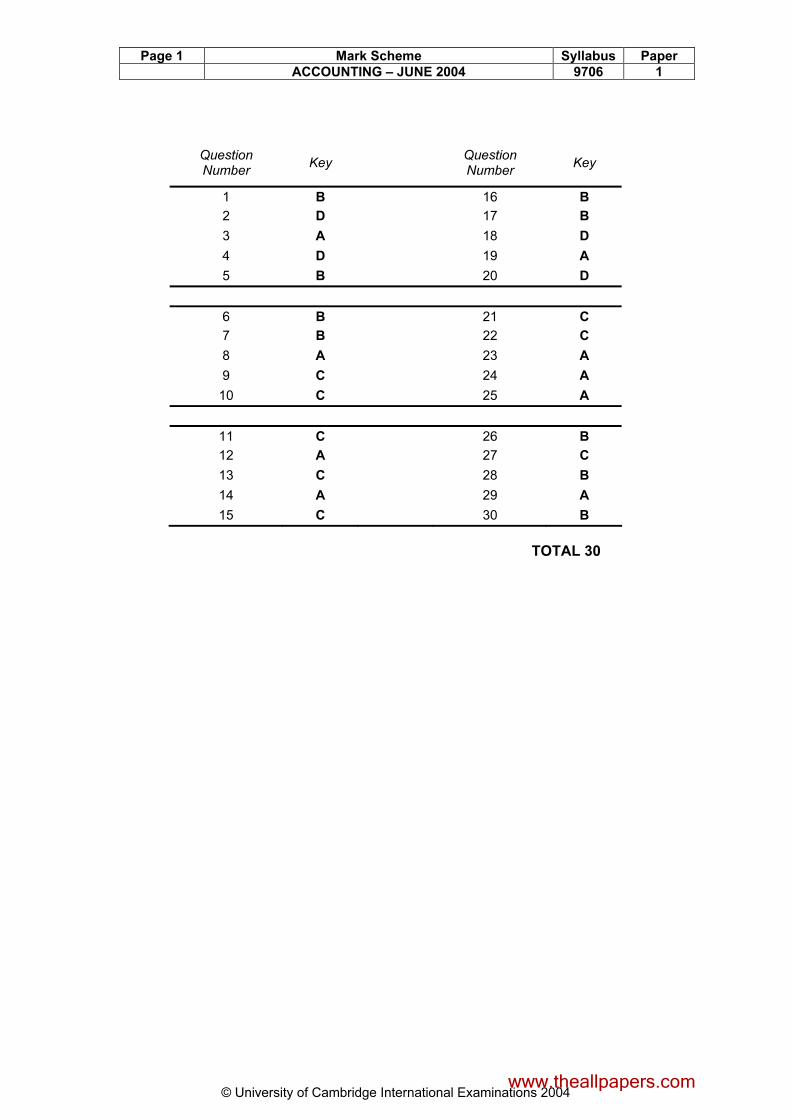
Page 1 Mark Scheme Syllabus Paper
ACCOUNTING – JUNE 2004 9706 1
© University of Cambridge International Examinations 2004
Question Number
Key Question Number
Key
1 B 16 B
2 D 17 B
3 A 18 D
4 D 19 A
5 B 20 D
6 B 21 C
7 B 22 C
8 A 23 A
9 C 24 A
10 C 25 A
11 C 26 B
12 A 27 C
13 C 28 B
14 A 29 A
15 C 30 B
TOTAL 30
www.theallpapers.com
JUNE 2004
GCE A AND AS LEVEL
MARK SCHEME
MAXIMUM MARK: 90
SYLLABUS/COMPONENT: 9706/02
ACCOUNTING Paper 2 (Structured Questions)
www.theallpapers.com
Page 1 Mark Scheme Syllabus Paper ACCOUNTING – JUNE 2004 9706 2
© University of Cambridge International Examinations 2004
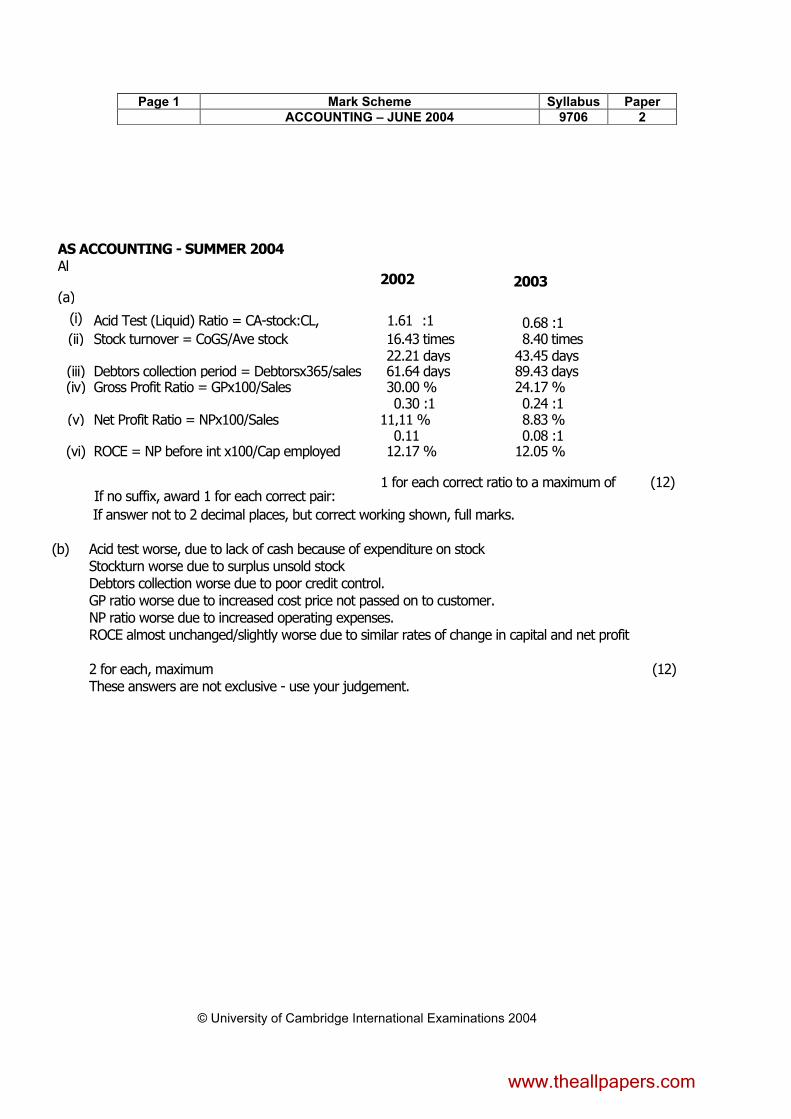
AS ACCOUNTING - SUMMER 2004
Al
(a)
2002 2003
(i) Acid Test (Liquid) Ratio = CA-stock:CL, 1.61 :1 0.68 :1 (ii) Stock turnover = CoGS/Ave stock 16.43 times 8.40 times
22.21 days 43.45 days (iii) Debtors collection period = Debtorsx365/sales 61.64 days 89.43 days (iv) Gross Profit Ratio = GPx100/Sales 30.00 % 24.17 %
0.30 :1 0.24 :1 (v) Net Profit Ratio = NPx100/Sales 11,11 % 8.83 %
0.11 0.08 :1 (vi) ROCE = NP before int x100/Cap employed 12.17 % 12.05 %
1 for each correct ratio to a maximum of (12)
If no suffix, award 1 for each correct pair:
If answer not to 2 decimal places, but correct working shown, full marks. (b) Acid test worse, due to lack of cash because of expenditure on stock
Stockturn worse due to surplus unsold stock Debtors collection worse due to poor credit control. GP ratio worse due to increased cost price not passed on to customer. NP ratio worse due to increased operating expenses. ROCE almost unchanged/slightly worse due to similar rates of change in capital and net profit
2 for each, maximum (12) These answers are not exclusive - use your judgement.
www.theallpapers.com
Page 2 Mark Scheme Syllabus Paper ACCOUNTING – JUNE 2004 9706 2
© University of Cambridge International Examinations 2004
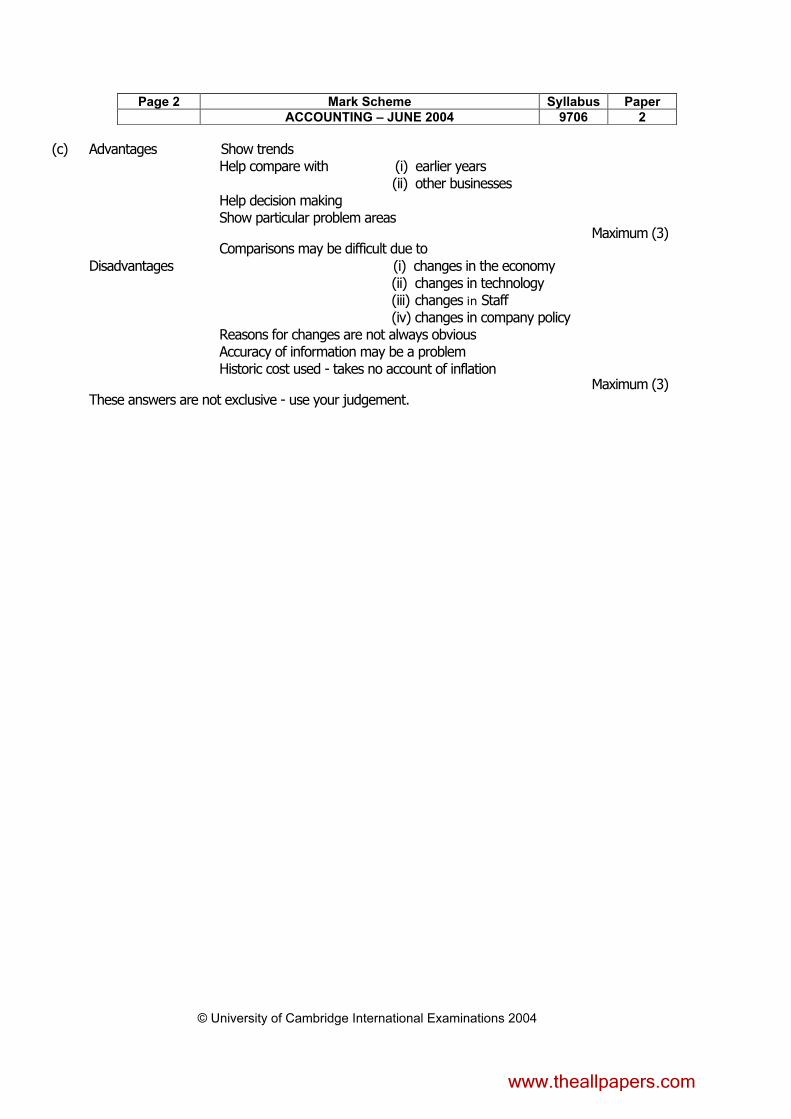
(c) Advantages Show trends Help compare with (i) earlier years (ii) other businesses Help decision making Show particular problem areas
Maximum (3) Comparisons may be difficult due to
Disadvantages (i) changes in the economy (ii) changes in technology (iii) changes in Staff (iv) changes in company policy
Reasons for changes are not always obvious Accuracy of information may be a problem Historic cost used - takes no account of inflation
Maximum (3) These answers are not exclusive - use your judgement.
www.theallpapers.com
Page 3 Mark Scheme Syllabus Paper ACCOUNTING – JUNE 2004 9706 2
© University of Cambridge International Examinations 2004
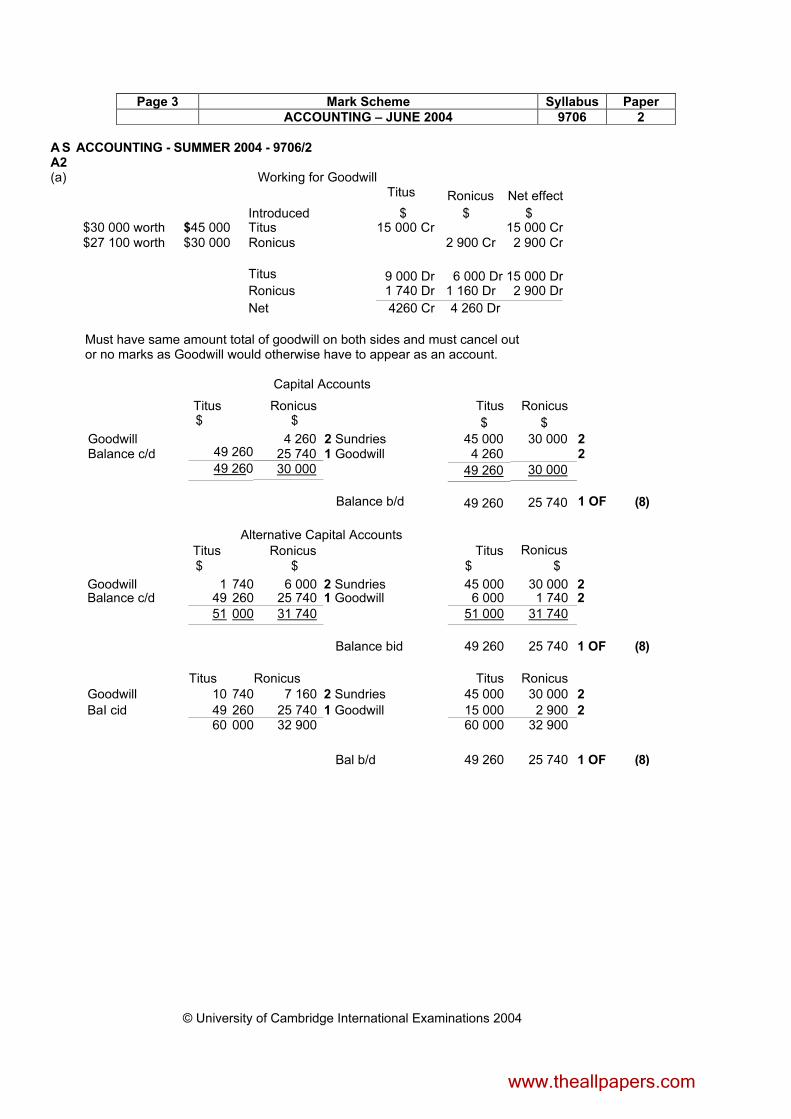
A S ACCOUNTING - SUMMER 2004 - 9706/2 A2 (a) Working for Goodwill
Titus Ronicus Net effect
Introduced $ $ $$30 000 worth $45 000 Titus 15 000 Cr 15 000 Cr$27 100 worth $30 000 Ronicus 2 900 Cr 2 900 Cr
Titus 9 000 Dr 6 000 Dr 15 000 Dr
Ronicus 1 740 Dr 1 160 Dr 2 900 Dr
Net 4260 Cr 4 260 Dr
Must have same amount total of goodwill on both sides and must cancel out or no marks as Goodwill would otherwise have to appear as an account.
Capital Accounts
Titus Ronicus Titus Ronicus $ $ $ $
49 260 4 260
25 740 30 000 45 000
4 260 30 000 49 260 30 000 49 260
2 Sundries 1 Goodwill
Balance b/d
Alternative Capital Accounts
Goodwill Balance c/d
Titus Ronicus
49 260
Titus
25 740
Ronicus
2 2
1 OF (8)
$ $ $ $
Goodwill 1 740 6 000 2 Sundries 45 000 30 000 2 Balance c/d 49 260 25 740 1 Goodwill 6 000 1 740 2
51 000 31 740 51 000 31 740
Balance bid 49 260 25 740 1 OF (8)
Titus
Ronicus
Titus Ronicus
Goodwill 10 740 7 160 2 Sundries 45 000 30 000 2
BaI cid 49 260 25 740 1 Goodwill 15 000 2 900 2 60 000 32 900 60 000 32 900
Bal b/d 49 260 25 740 1 OF (8)
www.theallpapers.com
Page 4 Mark Scheme Syllabus Paper ACCOUNTING – JUNE 2004 9706 2
© University of Cambridge International Examinations 2004
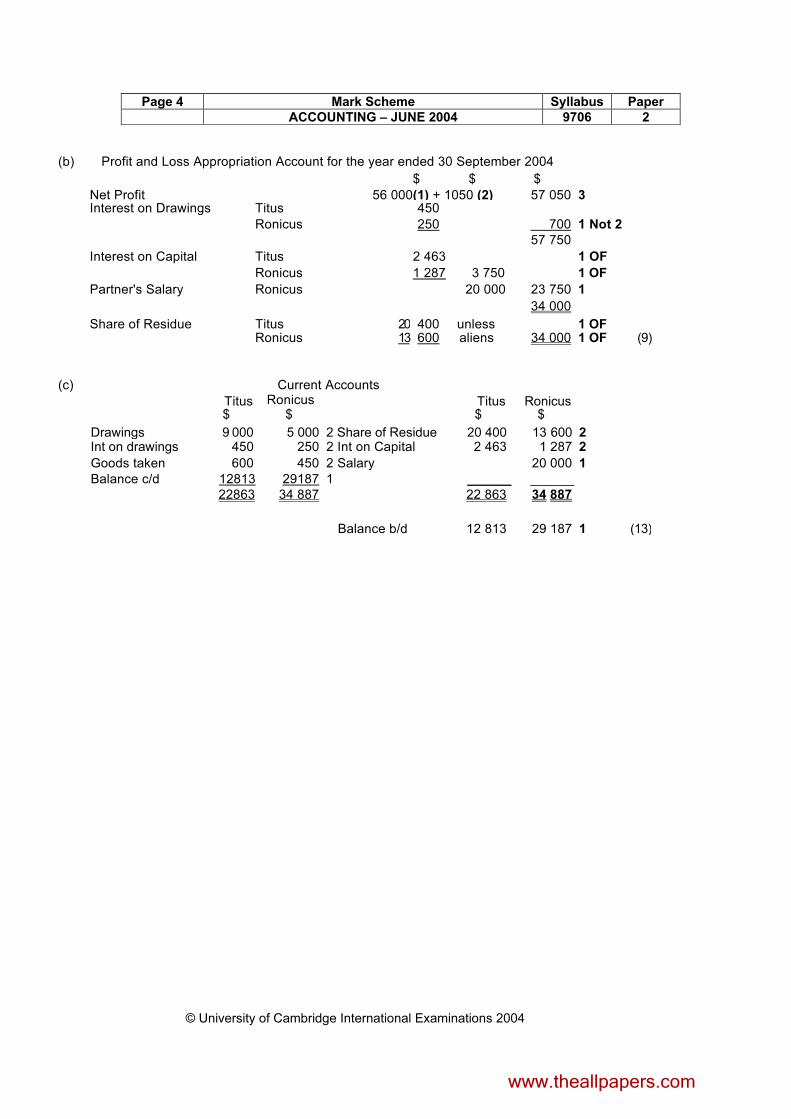
(b) Profit and Loss Appropriation Account for the year ended 30 September 2004
$ $ $
Net Profit 56 000 (1) + 1050 (2) 57 050 3 Interest on Drawings Titus 450
Ronicus 250 700 1 Not 2 57 750
Interest on Capital Titus 2 463 1 OF
Ronicus 1 287 3 750 1 OF
Partner's Salary Ronicus 20 000 23 750 1
34 000
Share of Residue Titus 20 400 unless 1 OF Ronicus 13 600 aliens 34 000 1 OF (9)
(c)
Titus
Current Accounts Ronicus
Titus Ronicus
$ $ $ $
Drawings 9 000 5 000 2 Share of Residue 20 400 13 600 2 Int on drawings 450 250 2 Int on Capital 2 463 1 287 2
Goods taken 600 450 2 Salary 20 000 1 Balance c/d 12813 29187 1 ______ ______
22863 34 887 22 863 34 887
Balance b/d 12 813 29 187 1 (13)
www.theallpapers.com
Page 5 Mark Scheme Syllabus Paper
ACCOUNTING – JUNE 2004 9706 2
© University of Cambridge International Examinations 2004
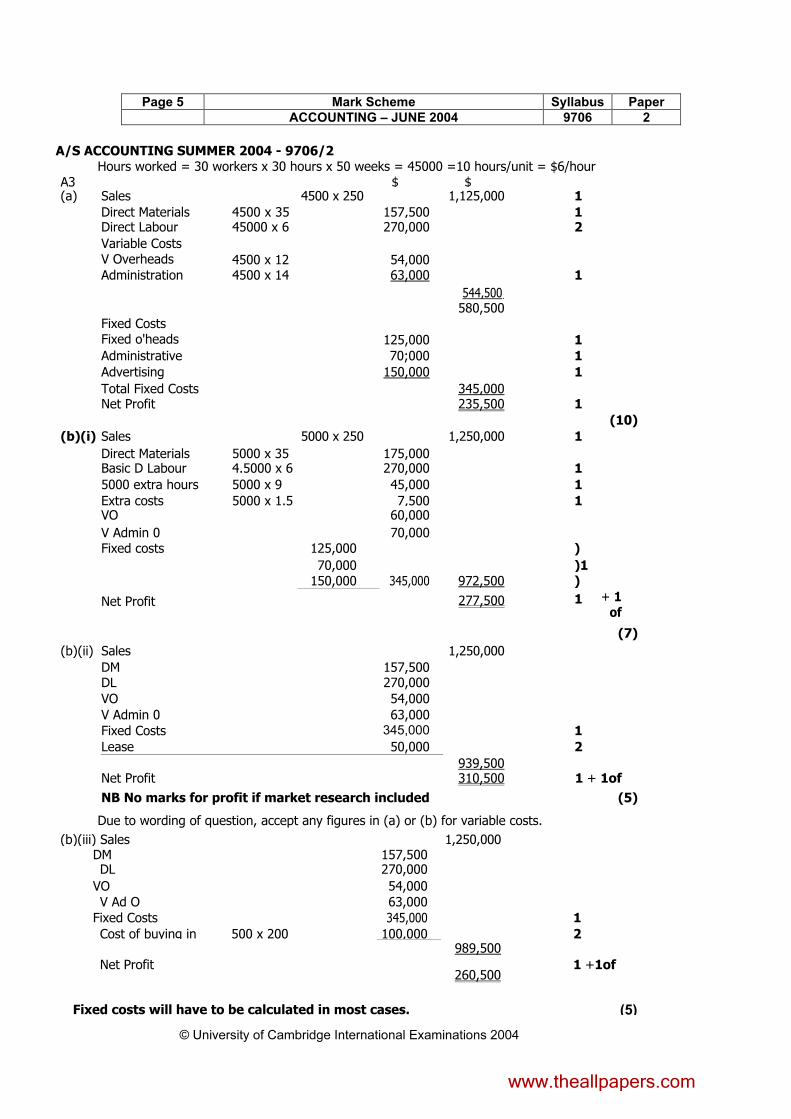
A/S ACCOUNTING SUMMER 2004 - 9706/2 Hours worked = 30 workers x 30 hours x 50 weeks = 45000 =10 hours/unit = $6/hour
A3 $ $ (a) Sales 4500 x 250 1,125,000 1
Direct Materials 4500 x 35 157,500 1 Direct Labour 45000 x 6 270,000 2
Variable Costs V Overheads 4500 x 12
54,000
Administration 4500 x 14 63,000 1
544,500,
580,500 Fixed Costs
Fixed o'heads
125,000
1
Administrative 70;000 1
Advertising 150,000 1
Total Fixed Costs 345,000 Net Profit 235,500 1
(10)
(b)(i) Sales 5000 x 250 1,250,000 1
Direct Materials 5000 x 35 175,000 Basic D Labour 4.5000 x 6 270,000 1
5000 extra hours 5000 x 9 45,000 1
Extra costs 5000 x 1.5 7,500 1 VO 60,000
V Admin 0 70,000 Fixed costs 125,000 )
70,000 )1 150,000 345,000 972,500 ) Net Profit 277,500 1 + 1
of
(7)
(b)(ii) Sales 1,250,000
DM 157,500 DL 270,000
VO 54,000
V Admin 0 63,000
Fixed Costs 345,000 1
Lease 50,000 2
939,500 Net Profit 310,500 1 + 1of
NB No marks for profit if market research included (5)
Due to wording of question, accept any figures in (a) or (b) for variable costs.
(b)(iii) Sales 1,250,000 DM 157,500 DL 270,000
VO 54,000 V Ad O 63,000
Fixed Costs 345,000 1
Cost of buying in 500 x 200 100,000 2 989,500
Net Profit 260,500
1 +1of
(5) Fixed costs will have to be calculated in most cases.
www.theallpapers.com
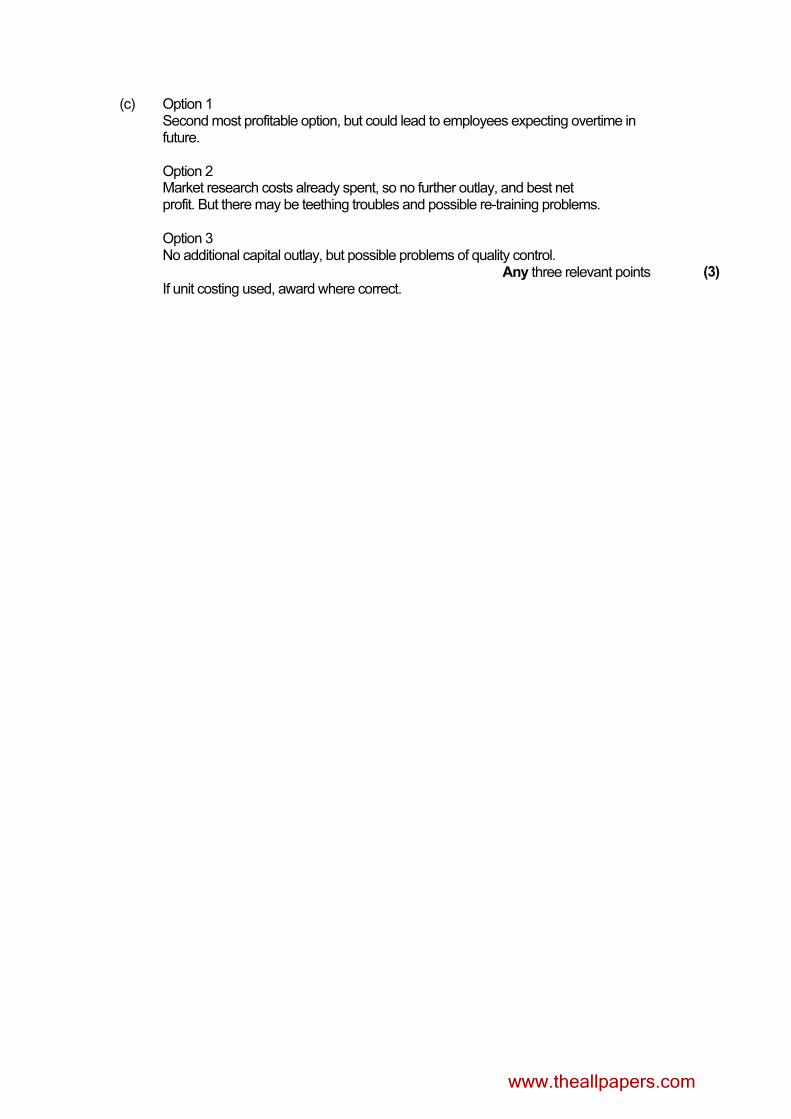
(c) Option 1 Second most profitable option, but could lead to employees expecting overtime in future.
Option 2 Market research costs already spent, so no further outlay, and best net profit. But there may be teething troubles and possible re-training problems.
Option 3 No additional capital outlay, but possible problems of quality control. Any three relevant points If unit costing used, award where correct.
(3)
www.theallpapers.com

JUNE 2004
GCE A AND AS LEVEL
MARK SCHEME
MAXIMUM MARK: 30
SYLLABUS/COMPONENT: 9706/03
ACCOUNTING Paper 3 (Multiple Choice)
www.theallpapers.com
Page 1 Mark Scheme Syllabus Paper
ACCOUNTING – JUNE 2004 9706 3
© University of Cambridge International Examinations 2004
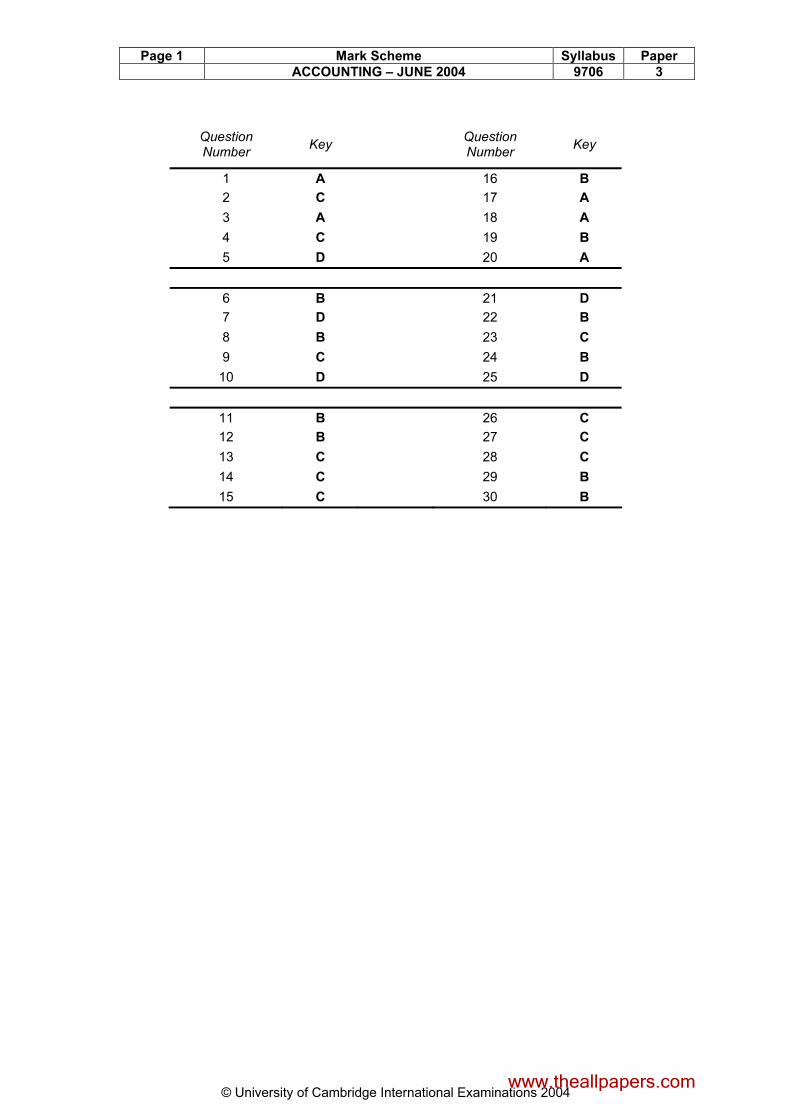
Question Number
Key Question Number
Key
1 A 16 B
2 C 17 A
3 A 18 A
4 C 19 B
5 D 20 A
6 B 21 D
7 D 22 B
8 B 23 C
9 C 24 B
10 D 25 D
11 B 26 C
12 B 27 C
13 C 28 C
14 C 29 B
15 C 30 B
www.theallpapers.com
JUNE 2004
GCE A AND AS LEVEL
MARK SCHEME
MAXIMUM MARK: 120
SYLLABUS/COMPONENT: 9706/04
ACCOUNTING Paper 4 (Problem Solving)
www.theallpapers.com
Page 1 Mark Scheme Syllabus Paper
ACCOUNTING – JUNE 2004 9706 4
© University of Cambridge International Examinations 2004
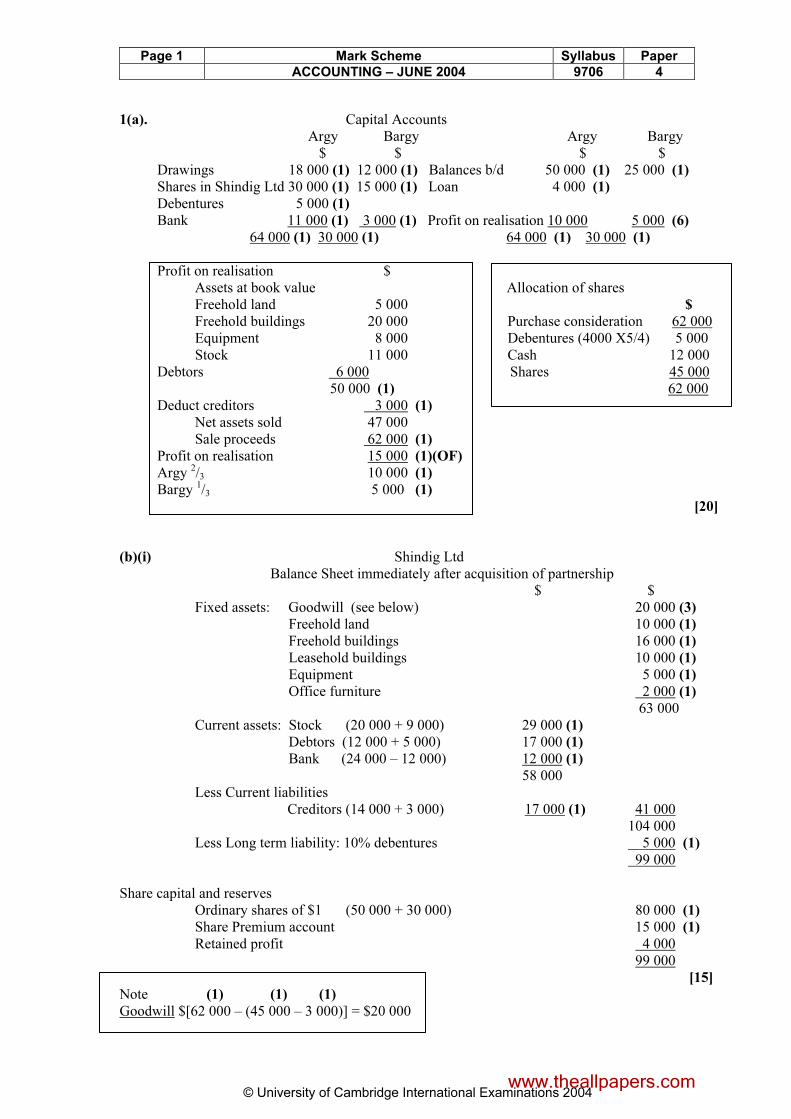
1(a). Capital Accounts Argy Bargy Argy Bargy $ $ $ $ Drawings 18 000 (1) 12 000 (1) Balances b/d 50 000 (1) 25 000 (1)
Shares in Shindig Ltd 30 000 (1) 15 000 (1) Loan 4 000 (1) Debentures 5 000 (1) Bank 11 000 (1) 3 000 (1) Profit on realisation 10 000 5 000 (6)
64 000 (1) 30 000 (1) 64 000 (1) 30 000 (1)
Profit on realisation $
Assets at book value Allocation of shares Freehold land 5 000 $
Freehold buildings 20 000 Purchase consideration 62 000 Equipment 8 000 Debentures (4000 X5/4) 5 000 Stock 11 000 Cash 12 000 Debtors 6 000 Shares 45 000 50 000 (1) 62 000
Deduct creditors 3 000 (1) Net assets sold 47 000 Sale proceeds 62 000 (1)
Profit on realisation 15 000 (1)(OF)
Argy 2/3 10 000 (1) Bargy 1/3 5 000 (1)
[20]
(b)(i) Shindig Ltd Balance Sheet immediately after acquisition of partnership $ $ Fixed assets: Goodwill (see below) 20 000 (3) Freehold land 10 000 (1) Freehold buildings 16 000 (1) Leasehold buildings 10 000 (1) Equipment 5 000 (1) Office furniture 2 000 (1)
63 000 Current assets: Stock (20 000 + 9 000) 29 000 (1) Debtors (12 000 + 5 000) 17 000 (1) Bank (24 000 – 12 000) 12 000 (1)
58 000 Less Current liabilities Creditors (14 000 + 3 000) 17 000 (1) 41 000 104 000 Less Long term liability: 10% debentures 5 000 (1) 99 000 Share capital and reserves Ordinary shares of $1 (50 000 + 30 000) 80 000 (1)
Share Premium account 15 000 (1)
Retained profit 4 000 99 000 [15]
Note (1) (1) (1)
Goodwill $[62 000 – (45 000 – 3 000)] = $20 000
www.theallpapers.com
Page 2 Mark Scheme Syllabus Paper
ACCOUNTING – JUNE 2004 9706 4
© University of Cambridge International Examinations 2004
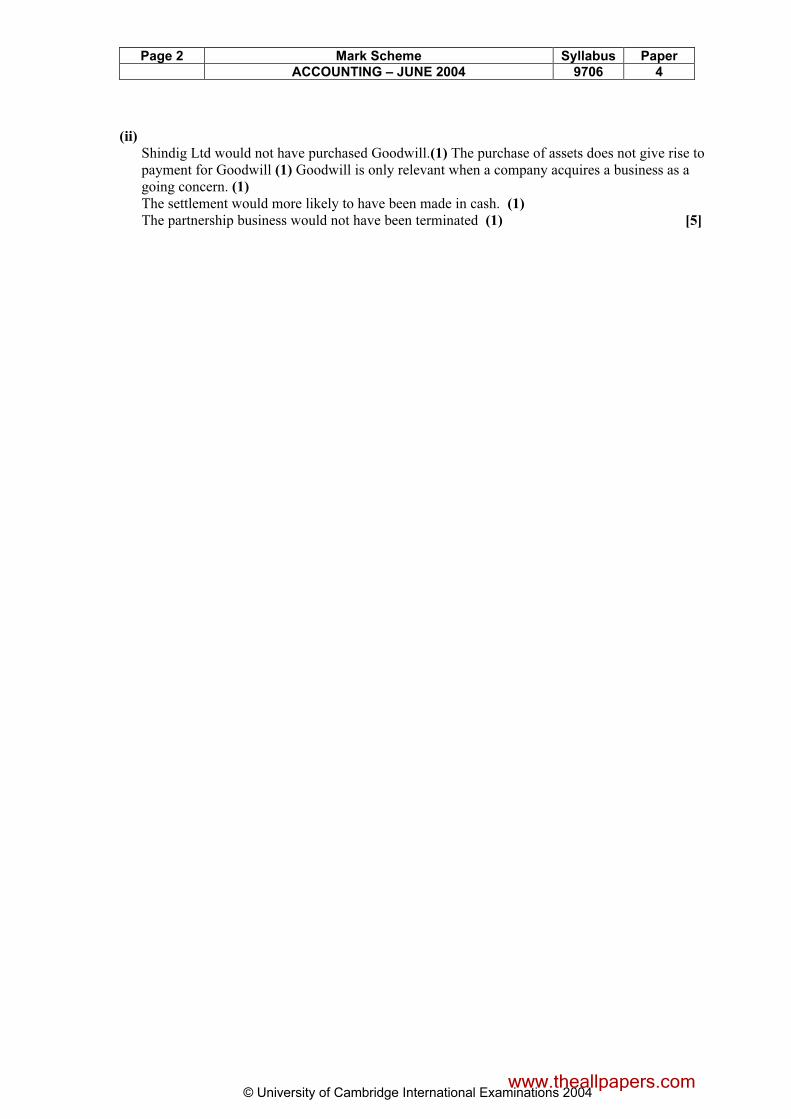
(ii) Shindig Ltd would not have purchased Goodwill.(1) The purchase of assets does not give rise to payment for Goodwill (1) Goodwill is only relevant when a company acquires a business as a going concern. (1) The settlement would more likely to have been made in cash. (1)
The partnership business would not have been terminated (1) [5]
www.theallpapers.com
Page 3 Mark Scheme Syllabus Paper
ACCOUNTING – JUNE 2004 9706 4
© University of Cambridge International Examinations 2004
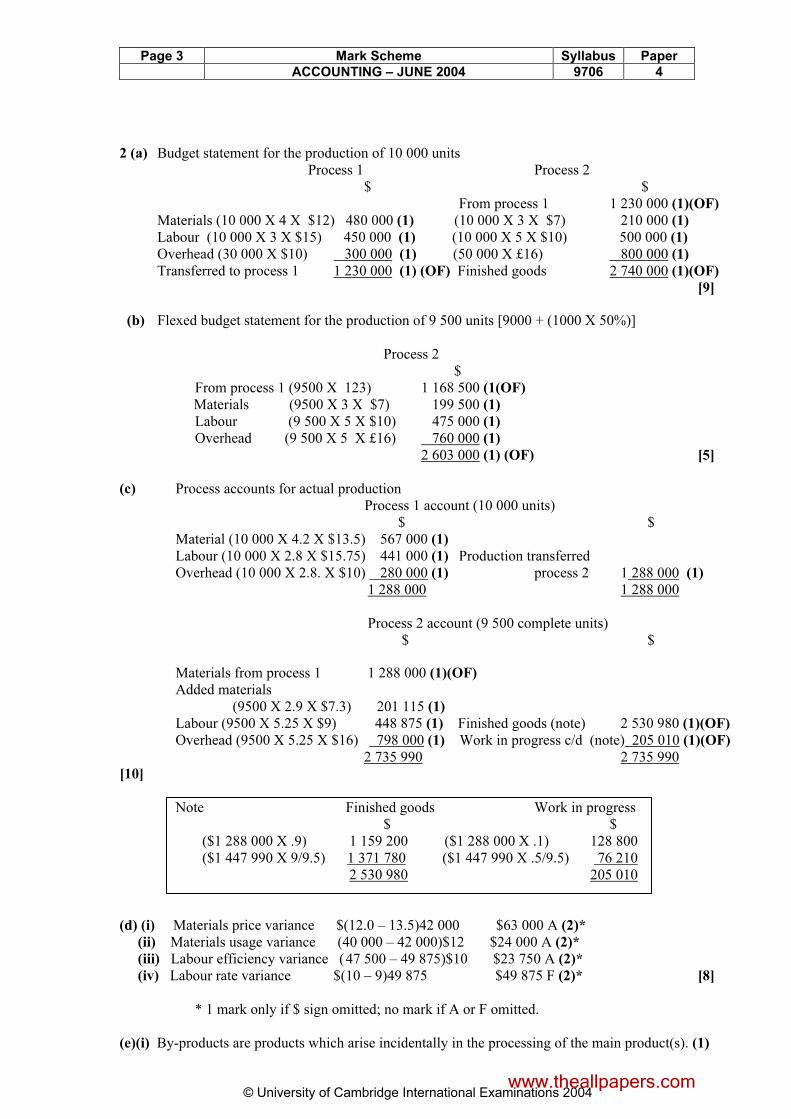
2 (a) Budget statement for the production of 10 000 units Process 1 Process 2 $ $ From process 1 1 230 000 (1)(OF)
Materials (10 000 X 4 X $12) 480 000 (1) (10 000 X 3 X $7) 210 000 (1) Labour (10 000 X 3 X $15) 450 000 (1) (10 000 X 5 X $10) 500 000 (1) Overhead (30 000 X $10) 300 000 (1) (50 000 X £16) 800 000 (1) Transferred to process 1 1 230 000 (1) (OF) Finished goods 2 740 000 (1)(OF) [9]
(b) Flexed budget statement for the production of 9 500 units [9000 + (1000 X 50%)] Process 2 $ From process 1 (9500 X 123) 1 168 500 (1(OF) Materials (9500 X 3 X $7) 199 500 (1) Labour (9 500 X 5 X $10) 475 000 (1) Overhead (9 500 X 5 X £16) 760 000 (1)
2 603 000 (1) (OF) [5]
(c) Process accounts for actual production
Process 1 account (10 000 units) $ $ Material (10 000 X 4.2 X $13.5) 567 000 (1) Labour (10 000 X 2.8 X $15.75) 441 000 (1) Production transferred Overhead (10 000 X 2.8. X $10) 280 000 (1) process 2 1 288 000 (1) 1 288 000 1 288 000 Process 2 account (9 500 complete units) $ $
Materials from process 1 1 288 000 (1)(OF) Added materials (9500 X 2.9 X $7.3) 201 115 (1) Labour (9500 X 5.25 X $9) 448 875 (1) Finished goods (note) 2 530 980 (1)(OF) Overhead (9500 X 5.25 X $16) 798 000 (1) Work in progress c/d (note) 205 010 (1)(OF)
2 735 990 2 735 990 [10]
Note Finished goods Work in progress $ $ ($1 288 000 X .9) 1 159 200 ($1 288 000 X .1) 128 800 ($1 447 990 X 9/9.5) 1 371 780 ($1 447 990 X .5/9.5) 76 210 2 530 980 205 010 (d) (i) Materials price variance $(12.0 – 13.5)42 000 $63 000 A (2)* (ii) Materials usage variance (40 000 – 42 000)$12 $24 000 A (2)*
(iii) Labour efficiency variance ( 47 500 – 49 875)$10 $23 750 A (2)*
(iv) Labour rate variance $(10 – 9)49 875 $49 875 F (2)* [8] * 1 mark only if $ sign omitted; no mark if A or F omitted.
(e)(i) By-products are products which arise incidentally in the processing of the main product(s). (1)
www.theallpapers.com
Page 4 Mark Scheme Syllabus Paper
ACCOUNTING – JUNE 2004 9706 4
© University of Cambridge International Examinations 2004
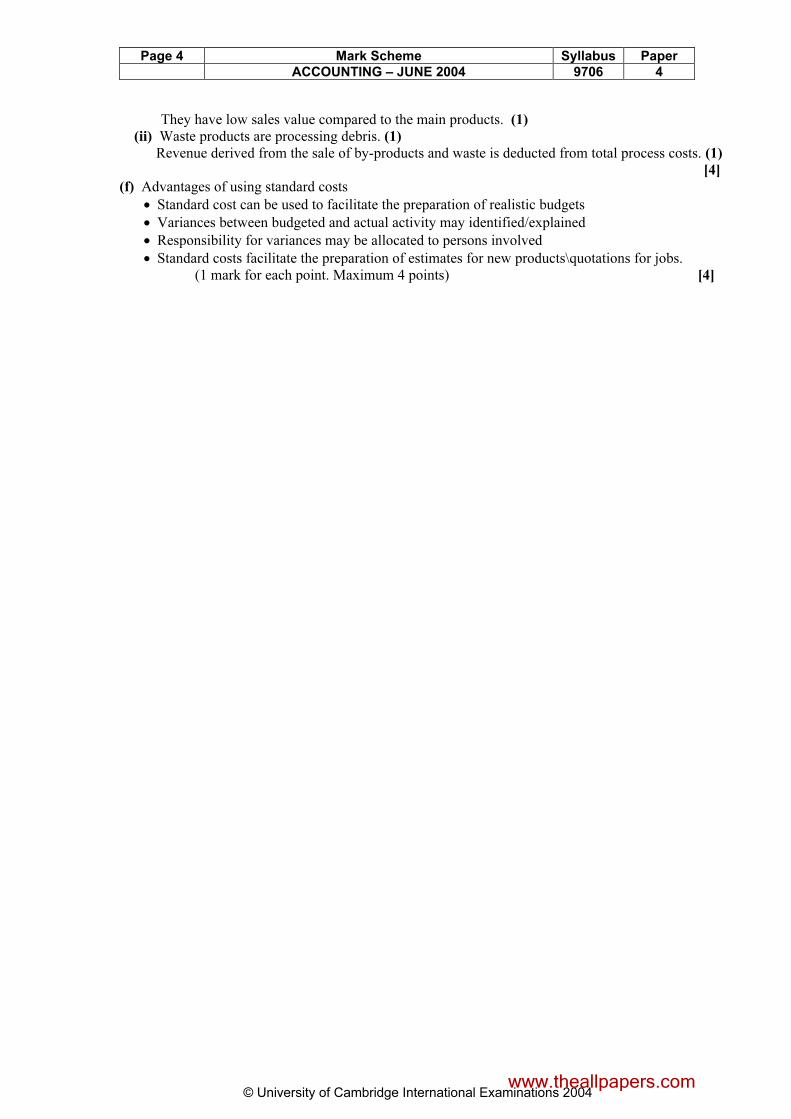
They have low sales value compared to the main products. (1) (ii) Waste products are processing debris. (1)
Revenue derived from the sale of by-products and waste is deducted from total process costs. (1)
[4]
(f) Advantages of using standard costs
• Standard cost can be used to facilitate the preparation of realistic budgets
• Variances between budgeted and actual activity may identified/explained
• Responsibility for variances may be allocated to persons involved
• Standard costs facilitate the preparation of estimates for new products\quotations for jobs. (1 mark for each point. Maximum 4 points) [4]
www.theallpapers.com
Page 5 Mark Scheme Syllabus Paper
ACCOUNTING – JUNE 2004 9706 4
© University of Cambridge International Examinations 2004
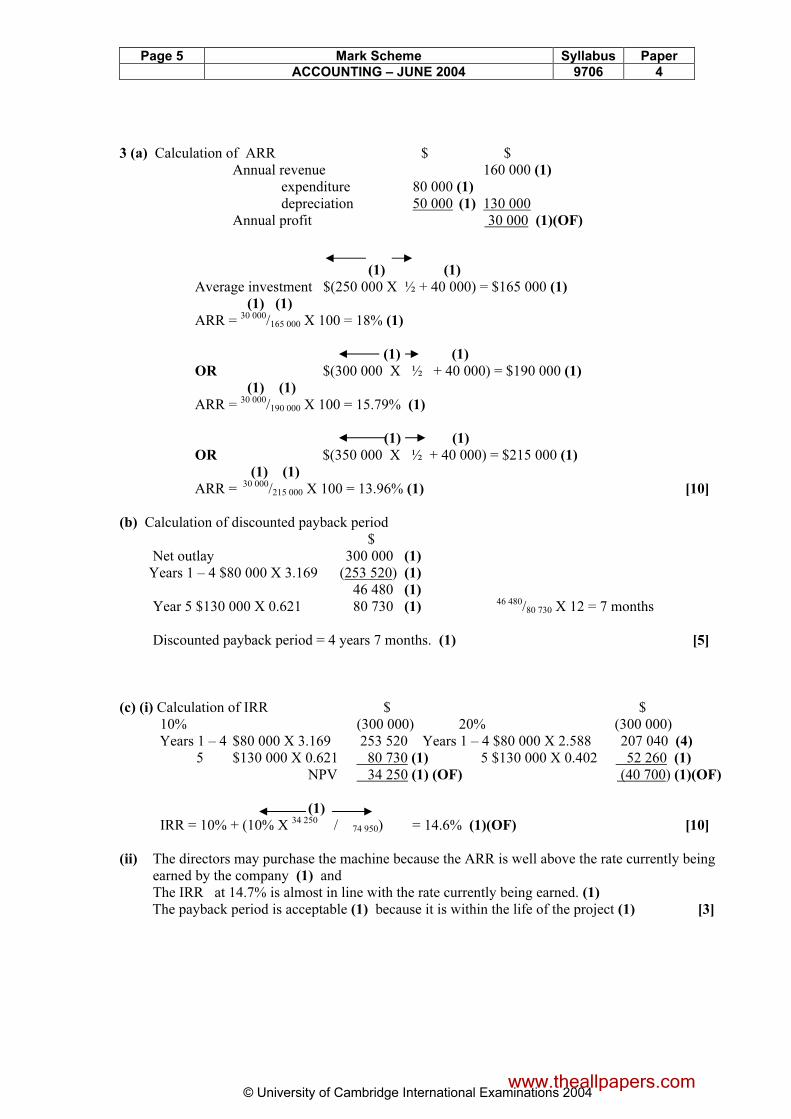
3 (a) Calculation of ARR $ $ Annual revenue 160 000 (1) expenditure 80 000 (1)
depreciation 50 000 (1) 130 000 Annual profit 30 000 (1)(OF)
(1) (1)
Average investment $(250 000 X ½ + 40 000) = $165 000 (1) (1) (1) ARR = 30 000/165 000 X 100 = 18% (1)
(1) (1)
OR $(300 000 X ½ + 40 000) = $190 000 (1)
(1) (1)
ARR = 30 000/190 000 X 100 = 15.79% (1)
(1) (1)
OR $(350 000 X ½ + 40 000) = $215 000 (1)
(1) (1)
ARR = 30 000/215 000 X 100 = 13.96% (1) [10]
(b) Calculation of discounted payback period $ Net outlay 300 000 (1) Years 1 – 4 $80 000 X 3.169 (253 520) (1)
46 480 (1) Year 5 $130 000 X 0.621 80 730 (1) 46 480/80 730 X 12 = 7 months Discounted payback period = 4 years 7 months. (1) [5]
(c) (i) Calculation of IRR $ $
10% (300 000) 20% (300 000) Years 1 – 4 $80 000 X 3.169 253 520 Years 1 – 4 $80 000 X 2.588 207 040 (4) 5 $130 000 X 0.621 80 730 (1) 5 $130 000 X 0.402 52 260 (1)
NPV 34 250 (1) (OF) (40 700) (1)(OF)
(1)
IRR = 10% + (10% X 34 250 / 74 950) = 14.6% (1)(OF) [10]
(ii) The directors may purchase the machine because the ARR is well above the rate currently being earned by the company (1) and The IRR at 14.7% is almost in line with the rate currently being earned. (1) The payback period is acceptable (1) because it is within the life of the project (1) [3]
www.theallpapers.com
Page 6 Mark Scheme Syllabus Paper
ACCOUNTING – JUNE 2004 9706 4
© University of Cambridge International Examinations 2004
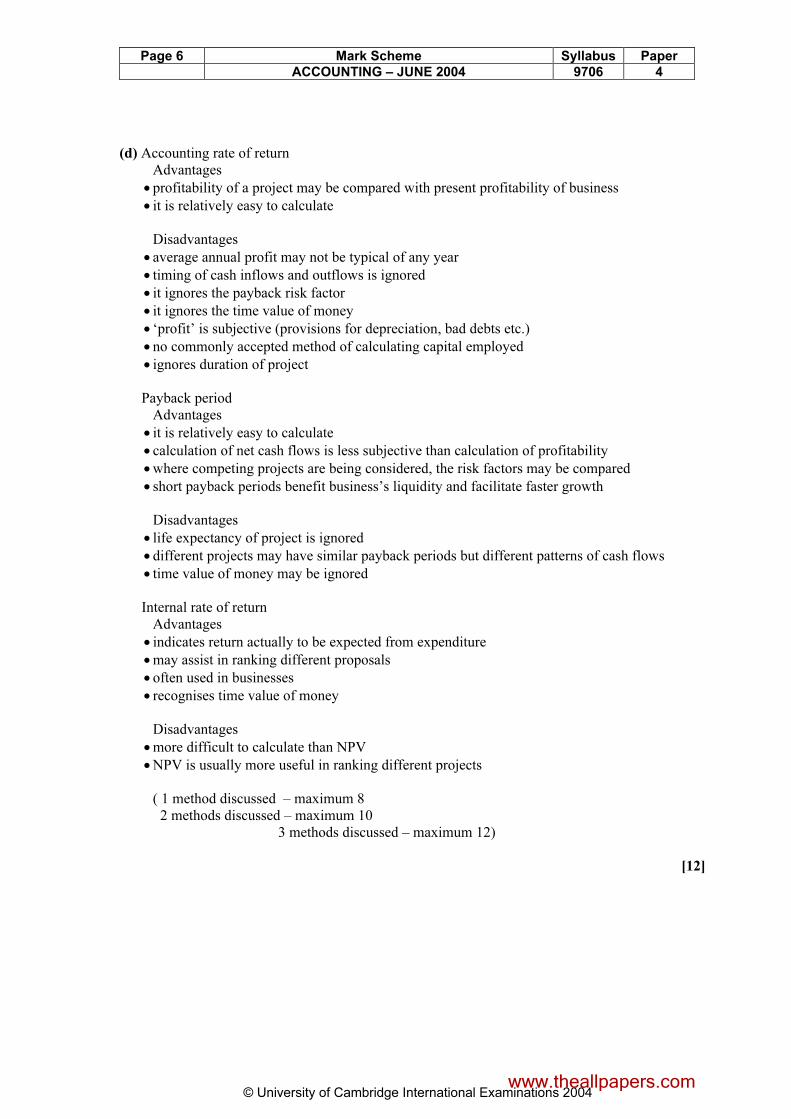
(d) Accounting rate of return Advantages
• profitability of a project may be compared with present profitability of business
• it is relatively easy to calculate Disadvantages
• average annual profit may not be typical of any year
• timing of cash inflows and outflows is ignored
• it ignores the payback risk factor
• it ignores the time value of money
• ‘profit’ is subjective (provisions for depreciation, bad debts etc.)
• no commonly accepted method of calculating capital employed
• ignores duration of project Payback period Advantages
• it is relatively easy to calculate
• calculation of net cash flows is less subjective than calculation of profitability
• where competing projects are being considered, the risk factors may be compared
• short payback periods benefit business’s liquidity and facilitate faster growth Disadvantages
• life expectancy of project is ignored
• different projects may have similar payback periods but different patterns of cash flows
• time value of money may be ignored Internal rate of return Advantages
• indicates return actually to be expected from expenditure
• may assist in ranking different proposals
• often used in businesses
• recognises time value of money Disadvantages
• more difficult to calculate than NPV
• NPV is usually more useful in ranking different projects ( 1 method discussed – maximum 8 2 methods discussed – maximum 10 3 methods discussed – maximum 12) [12]
www.theallpapers.com