Embed Size (px)
Citation preview
P1: LMD
Biochemical Genetics [bigi] PP218-343110 August 10, 2001 14:22 Style file version Nov. 19th, 1999
Biochemical Genetics, Vol. 39, Nos. 7/8, August 2001 (c© 2001)
Marker Assisted Selection of Bacterial BlightResistance Genes in Rice
A. P. Davierwala,1 A. P. K. Reddy,2 M. D. Lagu,1 P. K. Ranjekar,1
and V. S. Gupta1,3
Received 19 Oct. 2000—Final 7 Apr. 2001
Bacterial leaf blight caused by Xanthomonas oryzae pv.oryzaeis one of the mostimportant diseases affecting rice production in Asia. We were interested in sur-veying rice genotypes that are popularly used in the Indian breeding program forconferring resistance to bacterial blight, using 11 STMS and 6 STS markers. Thebasis of selection of these DNA markers was their close linkage toxa5, xa13, andXa21genes and their positions on the rice genetic map relative to bacterial blightresistance genes. Eight lines were found to contain thexa5gene while two linescontainedXa21gene and none of the lines contained thexa13gene with the ex-ception of its near-isogenic line. Using the polymorphic markers obtained in theinitial survey, marker-assisted selection was performed in the F3 population of across between IR-64 and IET-14444 to detect lines containing multiple resistancegenes. Of the 59 progeny lines analyzed, eight lines contained both the resistancegenes,xa5andXa4.
KEY WORDS: rice; bacterial blight; resistance genes; marker assisted selection.
INTRODUCTION
Bacterial blight, caused by the rod-shaped bacterium,Xanthomonas oryzaepv.oryzae(Xoo) (ex Ishiyama, 1922), is the most important bacterial disease of rice,second only to the fungal disease, blast. This disease, which occurs as vascular
1 Plant Molecular Biology Unit, Division of Biochemical Sciences, National Chemical Laboratory,Pune 411008, India.
2 Department of Plant Pathology, Directorate of Rice Research, Rajendranagar, Hyderabad 500030,India.
3 To whom correspondence should be addressed. e-mail: [email protected].
2610006-2928/01/0800-0261$19.50/0C© 2001 Plenum Publishing Corporation
P1: LMD
Biochemical Genetics [bigi] PP218-343110 August 10, 2001 14:22 Style file version Nov. 19th, 1999
262 Davierwala, Reddy, Lagu, Ranjekar, and Gupta
wilt at the early stages of crop growth (nursery to tillering) and as leaf blight atlater stages (panicle initiation to flowering), severely affects production of ricecultivated in Asia, Australia, Latin America, Africa, and the United States (Khushand Virmani, 1985; Lozano, 1977; Mew, 1987; Mewet al., 1993). Since the in-troduction and widespread cultivation of high yielding but susceptible rice culti-vars, bacterial blight has been especially prevalent in irrigated and rainfed lowlandareas in Asia. The estimated yield loss of 2–74% in experimental plots, depends onlocation, season, weather, crop growth stage, and cultivar (Reddy, 1989). In India,the states of Punjab, Haryana, and western Uttar Pradesh experienced major epi-demics in 1979 and 1980, wherein total crop failure was reported (Durgapal, 1985).Bacterial blight management methods include chemical protection by use of bac-tericidal agents, host plant resistance, and nitrogen management (Padmanabhan,1983; Srivastava, 1972). However, chemical control is not feasible, practical, oreffective (Sidhuet al., 1978) and hence development and introduction of resistantcultivars is the most economical, effective, and environmentally sound means ofcontrolling the disease (Khushet al., 1989; Ogawa, 1993).
To date, more than 21 genes conferring resistance to specific races of thepathogen,Xoo, have been identified by classical genetic analysis in rice (Kaku,1997), the majority of which are dominant. Several of these resistance genes havebeen mapped by various scientists on the genetic map of rice (Blair and McCouch,1997; Ikedaet al., 1992, 1995; McCouchet al., 1992; Ogawaet al., 1986; Ronaldet al., 1992; Sanchezet al., 1999; A. Yoshimuraet al., 1983; S. Yoshimuraet al.,1992; G. Zhanget al., 1996), and some of them have been incorporated into ricecultivars to develop new resistant varieties. However, most of these major resis-tance genes have been overcome by newly evolved, indigenous, and unrecognizedpathogen races. The breakdown of resistance to bacterial blight in the rice varietyAsakaze in Japan is a famous example of the instability of major genes (Ezukaand Sakaguchi, 1978). In 1972, an isolate strain, designated “Isabela,” from thenorthern part of the Philippines was found to cause breakdown ofXa4resistance(IRRI, 1973) and in 1975, IRRI cultivars carrying theXa4gene became suscepti-ble to bacterial blight not only in the Philippines (Mew and Vera Cruz, 1979) butalso in many areas of India, Indonesia, and China (Huanget al., 1997; Q. Zhanget al., 1988, 1995). Thus, large-scale and long-term cultivation ofXa4containingvarieties has resulted in significant shifts in the race frequency ofXoo(Mew et al.,1992). Recently, breakdown of resistance toXa21has been reported in certainregions of India (A. P. K. Reddy, personal communication; S. Gnanamanickan,personal communication).
One method to delay breakdown of resistance is to provide a broad-spectrumof resistance by combining multiple genes having complementary resistance spec-tra, relative to the pathogen subpopulations, into a single plant genotype (Babujeeand Gnanamanickam, 2000). Gene pyramiding would thus result in genotypeswith more durable resistance through both ordinary gene action and quantitative
P1: LMD
Biochemical Genetics [bigi] PP218-343110 August 10, 2001 14:22 Style file version Nov. 19th, 1999
Marker Assisted Selection of Bacterial Blight Resistance Genes in Rice 263
complementation (Ogawaet al., 1987; Yoshimuraet al., 1995). However, usingconventional breeding methods, plants with multiple resistance genes cannot beselected based on phenotype alone, because of epistasis and/or the masking effectof genes, wherein the action of a gene conferring resistance to many races of thepathogen may mask the action of another resistance gene. However, using DNAmarkers it would be easily possible to select plants having multiple resistancegenes without actual disease inoculation.
Recently, several RFLP markers linked to resistance genes have been con-verted into PCR-based STS (sequence-tagged site) markers (Blair and McCouch,1997; Huanget al., 1997; C. E. Williamset al., 1996) and microsatellite markerslinked to a resistance genexa5 have been reported (Blair and McCouch, 1997).These markers would be extremely useful for efficient and effective marker-assistedselection of resistance genes.
Previously, we have shown the utility of DNA markers for profiling genotypesof rice (Guptaet al., 1994; Joshiet al., 2000; Ramakrishnaet al., 1994, 1995) aswell as its pathogen,Xoo(Rajebhosaleet al., 1997). Here, we report diagnosis ofthe presence of different bacterial blight resistance genes,xa5, xa13, andXa21,using STS and STMS markers linked to these resistance genes and investigatetheir utility for marker-assisted selection ofxa5. This will be extremely useful forselecting suitable disease resistant parents for future breeding programs in India.
MATERIALS AND METHODS
Plant Material and DNA Extraction
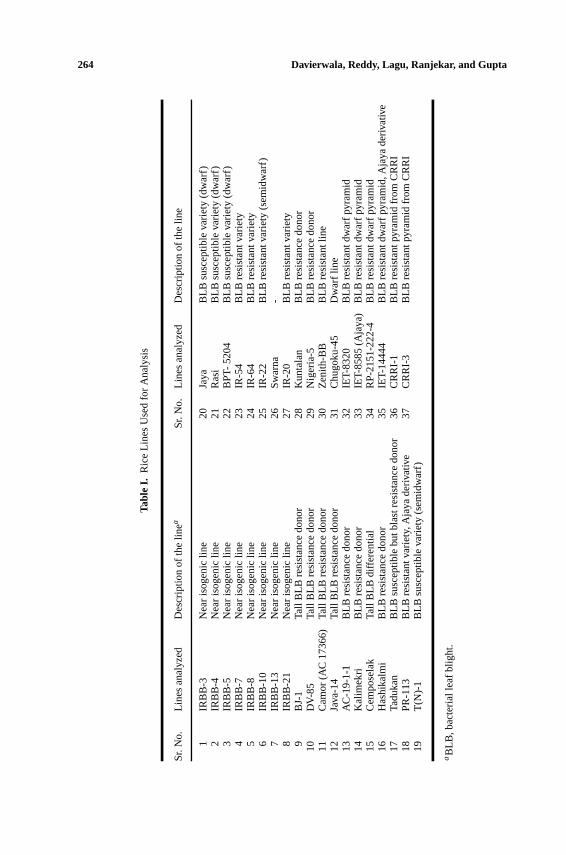
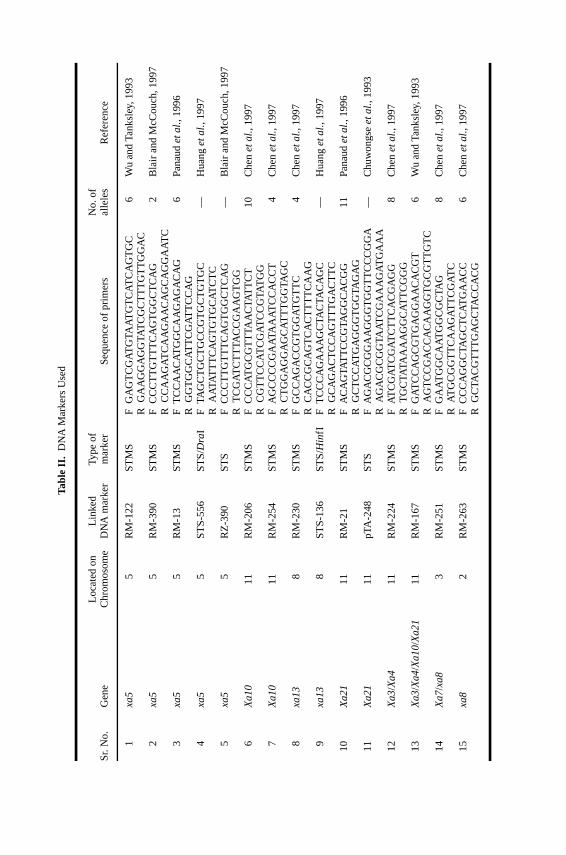
Thirty-seven rice lines including near-isogenic lines, tall donors, susceptible va-rieties, and dwarf pyramids (Table I) were initially surveyed for the presence ofbacterial blight resistance genes, using DNA markers linked to bacterial blightresistance genes (Table II). The leaf tissue for all 37 lines surveyed was obtainedfrom the Directorate of Rice Research, Hyderabad.
The F3 population, containing 59 lines, of a cross between IET-14444 and IR-64 (Table I) was developed and marker-assisted selection was performed in orderto diagnose the plants containing resistance genes. Of the 59 F3 lines, 31 lines wereobtained from seeds of one panicle of an F1 plant while 28 lines were obtainedusing seeds of a second panicle of the same F1 plant. The crossing was done at theDirectorate of Rice Research, Hyderabad.
DNA was extracted from leaf tissue by the hexadecyltrimethylammoniumbromide (CTAB) method (Rogers and Bendich, 1988).
STS Analysis
The STS reactions were performed in a 25µL volume containing 200µM ofdNTPs (U.S. Biochemical Corp., U.K.), 50 ng of each primer, 0.8 U ofTaqDNA
P1: LMD
Biochemical Genetics [bigi] PP218-343110 August 10, 2001 14:22 Style file version Nov. 19th, 1999
264 Davierwala, Reddy, Lagu, Ranjekar, and Gupta
Tabl
eI.
Ric
eLi
nes
Use
dfo
rA
naly
sis
Sr.
No.
Line
san
alyz
edD
escr
iptio
nof
the
line
aS
r.N
o.Li
nes
anal
yzed
Des
crip
tion
ofth
elin
e
1IR
BB
-3N
ear
isog
enic
line
20Ja
yaB
LBsu
scep
tible
varie
ty(d
war
f)2
IRB
B-4
Nea
ris
ogen
iclin
e21
Ras
iB
LBsu
scep
tible
varie
ty(d
war
f)3
IRB
B-5
Nea
ris
ogen
iclin
e22
BP
T-52
04B
LBsu
scep
tible
varie
ty(d
war
f)4
IRB
B-7
Nea
ris
ogen
iclin
e23
IR-5
4B
LBre
sist
antv
arie
ty5
IRB
B-8
Nea
ris
ogen
iclin
e24
IR-6
4B
LBre
sist
antv
arie
ty6
IRB
B-1
0N
ear
isog
enic
line
25IR
-22
BLB
resi
stan
tvar
iety
(sem
idw
arf)
7IR
BB
-13
Nea
ris
ogen
iclin
e26
Sw
arna
-8
IRB
B-2
1N
ear
isog
enic
line
27IR
-20
BLB
resi
stan
tvar
iety
9B
J-1
Tall
BLB
resi
stan
cedo
nor
28K
unta
lan
BLB
resi
stan
cedo
nor
10D
V-8
5Ta
llB
LBre
sist
ance
dono
r29
Nig
eria
-5B
LBre
sist
ance
dono
r11
Cam
or(A
C17
366)
Tall
BLB
resi
stan
cedo
nor
30Z
enith
-BB
BLB
resi
stan
tlin
e12
Java
-14
Tall
BLB
resi
stan
cedo
nor
31C
hugo
ku-4
5D
war
flin
e13
AC
-19-
1-1
BLB
resi
stan
cedo
nor
32IE
T-83
20B
LBre
sist
antd
war
fpyr
amid
14K
alim
ekri
BLB
resi
stan
cedo
nor
33IE
T-85
85(A
jaya
)B
LBre
sist
antd
war
fpyr
amid
15C
empo
sela
kTa
llB
LBdi
ffere
ntia
l34
RP
-215
1-22
2-4
BLB
resi
stan
tdw
arfp
yram
id16
Has
hika
lmi
BLB
resi
stan
cedo
nor
35IE
T-14
444
BLB
resi
stan
tdw
arfp
yram
id,A
jaya
deriv
ativ
e17
Tadu
kan
BLB
susc
eptib
lebu
tbla
stre
sist
ance
dono
r36
CR
RI-
1B
LBre
sist
antp
yram
idfr
omC
RR
I18
PR
-113
BLB
resi
stan
tvar
iety
,Aja
yade
rivat
ive
37C
RR
I-3
BLB
resi
stan
tpyr
amid
from
CR
RI
19T
(N)-
1B
LBsu
scep
tible
varie
ty(s
emid
war
f)
aB
LB,b
acte
riall
eafb
light
.
P1: LMD
Biochemical Genetics [bigi] PP218-343110 August 10, 2001 14:22 Style file version Nov. 19th, 1999
Tabl
eII.
DN
AM
arke
rsU
sed
Loca
ted
onLi
nked
Type
ofN
o.of
Sr.
No.
Gen
eC
hrom
osom
eD
NA
mar
ker
mar
ker
Seq
uenc
eof
prim
ers
alle
les
Ref
eren
ce
1xa
55
RM
-122
ST
MS
FG
AG
TC
GAT
GTA
ATG
TC
ATC
AG
TG
C6
Wu
and
Tank
sley
,199
3R
GA
AG
GA
GG
TAT
CG
CT
TT
GT
TG
GA
C2
xa5
5R
M-3
90S
TM
SF
CC
CT
TG
TT
TC
AG
TG
GC
TC
AG
2B
lair
and
McC
ouch
,199
7R
CC
AA
GAT
CA
AG
AA
CA
GC
AG
GA
ATC
3xa
55
RM
-13
ST
MS
FT
CC
AA
CAT
GG
CA
AG
AG
AC
AG
6P
anau
deta
l.,19
96R
GG
TG
GC
ATT
CG
ATT
CC
AG
4xa
55
ST
S-5
56S
TS
/Dra
IF
TAG
CT
GC
TG
CC
GT
GC
TG
TG
C—
Hua
ngeta
l.,19
97R
AAT
ATT
TC
AG
TG
TG
CAT
CT
C5
xa5
5R
Z-3
90S
TS
FC
CC
TT
GT
TT
CA
GT
GG
CT
CA
G—
Bla
iran
dM
cCou
ch,1
997
RT
CG
ATC
TT
TAC
CG
AA
GT
GG
6X
a1
011
RM
-206
ST
MS
FC
CC
ATG
CG
TT
TAA
CTA
TT
CT
10C
henet
al.,
1997
RC
GT
TC
CAT
CG
ATC
CG
TAT
GG
7X
a1
011
RM
-254
ST
MS
FA
GC
CC
CG
AAT
AA
ATC
CA
CC
T4
Che
neta
l.,19
97R
CT
GG
AG
GA
GC
ATT
TG
GTA
GC
8xa
13
8R
M-2
30S
TM
SF
GC
CA
GA
CC
GT
GG
ATG
TT
C4
Che
neta
l.,19
97R
CA
CC
GC
AG
TC
AC
TT
TT
CA
AG
9xa
13
8S
TS
-136
ST
S/Hin
fIF
TC
CC
AG
AA
AG
CTA
CTA
CA
GC
—H
uang
eta
l.,19
97R
GC
AG
AC
TC
CA
GT
TT
GA
CT
TC
10X
a2
111
RM
-21
ST
MS
FA
CA
GTA
TT
CC
GTA
GG
CA
CG
G11
Pan
aud
eta
l.,19
96R
GC
TC
CAT
GA
GG
GT
GG
TAG
AG
11X
a2
111
pTA
-248
ST
SF
AG
AC
GC
GG
AA
GG
GT
GG
TT
CC
CG
GA
—C
huw
ongs
ee
tal.,
1993
RA
GA
CG
CG
GTA
ATC
GA
AA
GAT
GA
AA
12X
a3/
Xa
411
RM
-224
ST
MS
FAT
CG
ATC
GAT
CT
TC
AC
GA
GG
8C
henet
al.,
1997
RT
GC
TATA
AA
AG
GC
ATT
CG
GG
13X
a3/
Xa
4/X
a1
0/X
a2
111
RM
-167
ST
MS
FG
ATC
CA
GC
GT
GA
GG
AA
CA
CG
T6
Wu
and
Tank
sley
,199
3R
AG
TC
CG
AC
CA
CA
AG
GT
GC
GT
TG
TC
14X
a7/
xa8
3R
M-2
51S
TM
SF
GA
ATG
GC
AAT
GG
CG
CTA
G8
Che
neta
l.,19
97R
ATG
CG
GT
TC
AA
GAT
TC
GAT
C15
xa8
2R
M-2
63S
TM
SF
CC
CA
GG
CTA
GC
TC
ATG
AA
CC
6C
henet
al.,
1997
RG
CTA
CG
TT
TG
AG
CTA
CC
AC
G
265
P1: LMD
Biochemical Genetics [bigi] PP218-343110 August 10, 2001 14:22 Style file version Nov. 19th, 1999
266 Davierwala, Reddy, Lagu, Ranjekar, and Gupta
polymerase (Perkin Elmer, U.S.A.) in 10 mM Tris-HCl (pH 8.3), 1.5 mM MgCl2,50 mM KCl, and 0.5 mM spermidine. Amplifications were carried out in a M. J. Re-search thermal cycler (DNA Engine) programmed with an initial denaturation of5 min at 94◦C, followed by 30 cycles of denaturation at 94◦C for 1 min, primerannealing at 55◦C for 1.5 min, and primer extension at 72◦C for 2 min, with a finalextension at 72◦C for 5 min.
Initially 5 µL of PCR product was loaded on 1% agarose gel in 0.5× TAE(Tris-acetate-EDTA) buffer (pH 8.0) to determine the success of the PCR amplifi-cation. The remaining 20µL of successfully amplified product was digested withdifferent restriction endonucleases (REs), such asAluI, DraI, EcoRI, HinfI, HpaI,MspI, XbaI, and XhoI. The total volume of the reaction for restriction enzymedigestion was 25µL with 2.5 µL of 10× RE buffer, 0.5µL of RE (10 u/µL)(Promega, U.S.A.), 2µL of sterile distilled water, and 20µL of PCR product.The reaction mixture was incubated overnight at 37◦C. The reaction digests wereelectrophoresed on 1.2% agarose gels, stained with ethidium bromide, and thefluorescence was visualized under UV light.
The list of STS markers used and the restriction enzyme with which thePCR products were digested is given in Table II. All the STS markers used in ourstudy were synthesized at the primer synthesis facility at the National ChemicalLaboratory, Pune, India.
STMS Analysis
Primers flanking mapped microsatellite loci were obtained from Research Genet-ics, U.S.A. (Table II) and STMS reactions were carried out according to the methoddescribed by Wu and Tanksley (1993). PCR amplification was performed in a 10µLvolume containing 200µM each of dCTP, dGTP, and dTTP, 25µM of dATP (U.S.Biochemical Corp., U.K.), 1µCi of [α-32P]dATP, 20 ng of each primer, 0.24 U ofTaqDNA polymerase (Perkin Elmer, Switzerland) in 10 mM Tris-HCl (pH 8.3),1.5 mM MgCl2, 50 mM KCl, and 0.5 mM spermidine. Amplification reactionswere done in a M. J. Research thermal cycler (DNA Engine) programmed with aninitial denaturation at 94◦C for 1 min, 30 cycles of denaturation at 94◦C for 1 min,primer annealing at 55◦C for 1 min, and primer extension at 72◦C for 2 min, witha final extension at 72◦C for 5 min.
After amplification, a half volume of stop solution (98% deionized for-mamide, 10 mM EDTA, 0.025% Bromophenol blue, and 0.025% Xylene cyanol)was added to individual reactions. Samples were denatured at 70–80◦C for 2–3 minand then electrophoresed on 6% denaturing polyacrylamide gels containing 7 Murea in 0.5× TBE (Tris-borate-EDTA) buffer (pH 8.0), at 1500 V for 2 h, andvisualized by autoradiography.
φX DNA digested with restriction enzymeHaeIII (Bangalore Genei,India) was dephosphorylated using calf intestinal phosphatase (CIP) (Boehringer
P1: LMD
Biochemical Genetics [bigi] PP218-343110 August 10, 2001 14:22 Style file version Nov. 19th, 1999
Marker Assisted Selection of Bacterial Blight Resistance Genes in Rice 267
Mannheim, Germany) and end-labeled using [γ 32P] ATP according to Sambrooket al. (1989) and loaded as molecular weight standard. Band sizes of each of theSTS and STMS alleles were calculated in base pairs, using the program, SeqAid II(tm) version 3.5. (Schaffer and Sederoff, 1981), wherein the distance of migrationof the bands in the marker lane were considered as standards, against which thesizes of the fragments of interest in the remaining lanes were calculated.
Data Analysis
The fragments amplified using STS and STMS markers were scored as present(1) or absent (0) and the data entered into a binary matrix were analyzed usingthe Winboot program (Yap and Nelson, 1996). Coefficients of similarity werecalculated using the Dice coefficient and cluster analysis was performed by theagglomerative technique using the UPGMA (Unweighted Pair Group Method withArithmetic Mean) method. The relationships between the different bacterial leafblight resistant and susceptible lines studied were portrayed graphically in the formof dendrograms.
RESULTS AND DISCUSSION
DNA markers have been used for mapping and tagging of major genes of agro-nomic and economic importance in rice. Since DNA markers are not affected byenvironmental variations or growth stage of the plant, they can be used to ac-curately select plants carrying the target gene (Abeneset al., 1993; Hittalmaniet al., 1994; Tanksleyet al., 1989; Yoshimuraet al., 1995; G. Zhanget al., 1996),which will provide a potentially powerful tool to improve conventional breedingefficiency.
Survey of Polymorphism Using STS Markers Linked to Bacterial BlightResistance Genes
Eight near-isogenic lines, donors of bacterial blight resistance genes, susceptiblelines, resistant varieties, and lines containing multiple resistance genes from bothIndia and IRRI (Table I) were surveyed using STS markers linked to the bacterialblight resistance genes,xa5, xa13, andXa21.
Analysis of Recessive Resistance Genes,Xa5andXa13
For the recessive genexa5, two different STS markers viz. STS556 and STS390located within 1 cM (centimorgan) ofxa5 (Blair and McCouch, 1997; Sanchezet al., 1997) were used. Both these markers resulted in single monomorphic bands
P1: LMD
Biochemical Genetics [bigi] PP218-343110 August 10, 2001 14:22 Style file version Nov. 19th, 1999
268 Davierwala, Reddy, Lagu, Ranjekar, and Gupta
of 1.4 kb and 1.2 kb, respectively, on amplification. RFLP or RAPD markers whenconverted into STS markers result in codominant, single locus markers, which canbe easily developed once sequence data of the cloned genomic DNA are avail-able (Inoueet al., 1994). However, very often they are less polymorphic thanthe RFLPs from which they are derived (Ghareyazieet al., 1995), and requirethe PCR product to be digested with restriction enzyme to detect polymorphismbetween the two parents. We, therefore, examined the specific amplicon poly-morphism (SAP) between the near-isogenic line forxa5, donor line forxa5, andsusceptible lines by digesting the PCR product with restriction enzymes (Blairand McCouch, 1997; Huanget al., 1997; M. Williamset al., 1991). The PCRproduct of STS556, when digested with restriction enzymeDraI, resulted in poly-morphism between the two lines IR-64, which does not contain thexa5gene, andIET-14444, which contains thexa5 gene. For STS 390, none of the restrictionenzymes viz.AluI, DraI, or HinfI resulted in any polymorphism between the twogenotypes.
The STS marker, STS136, which maps at a distance of 3.7 cM fromxa13(G. Zhanget al., 1996), resulted in a single band of approximately 1 kb in all the ricelines studied. In order to detect polymorphism, digestion of the PCR product wasperformed using several restriction enzyme viz.AluI, DraI, EcoRI, HinfI, HpaI,MspI, XbaI, andXhoI. However, onlyHinfI could detect polymorphism betweenthe near-isogenic line IRBB-13 and other susceptible lines such as T(N)1, Jaya,Rasi, and BPT-5204. All the resistant lines resulted in two bands of 0.5 kb ondigestion withHinfI, while the same enzyme did not digest the PCR product ofsusceptible lines. No polymorphism was detected between the two parents, IR-64and IET-14444, indicating that they probably did not contain thexa13gene, or ifpresent, it could not be detected by the STS136 marker, due to some recombinationin the 3.7 cM region between thexa13gene and STS136 marker.
As reported by Huanget al. (1997), if there is an allelic interaction be-tween the resistance gene and marker alleles, lines possessing the same genes asthe corresponding near-isogenic line might possess the resistance gene presentin the near-isogenic line. Thus, of the 37 lines studied, in addition to the near-isogenic line, IRRB-5, 17 lines viz. BJ-I, DV-85, Camor, Java-14, AC-19-1-1,Kalimekri, Cemposelak, Hashikalmi, PR-113, Zenith-BB, Chugoku-45, IET-8320,IET-8585, RP-2151-222-4, IET-1444, CRRI-1, and CRRI-3 showed the presenceof the STS556 marker, closely linked to thexa5 gene at a distance of 0.8 cM(Sanchezet al., 1997), possibly indicating the presence ofxa5in these lines. How-ever, as reported by Blair and McCouch (1997), the STS390 marker obtained fromthe cDNA clone RZ390, located within 1 cM of thexa5gene, was unable to detectany polymorphism between the parents even after digestion with several restric-tion enzymes. The absence of polymorphism with STS390 could be due to thefact that the cDNA clone, RZ390, which encoded for cytochrome b5 (Blair andMcCouch, 1997), was present in the conserved region of the genome, which was
P1: LMD
Biochemical Genetics [bigi] PP218-343110 August 10, 2001 14:22 Style file version Nov. 19th, 1999
Marker Assisted Selection of Bacterial Blight Resistance Genes in Rice 269
extremely stable with no sequence variations. Using the STS136 marker, none ofthe 37 lines except the near-isogenic line IRBB-13 showed the presence of the0.5 kb bands, indicating the possibility of absence of this gene in all these lines.However, two additional lines viz. IRBB-55 and IRBB-60, when analyzed withSTS-136, showed the presence of the two 0.5 kb bands, indicating the presence ofthexa13gene in these lines.
Analysis of Dominant Resistance Gene,Xa21
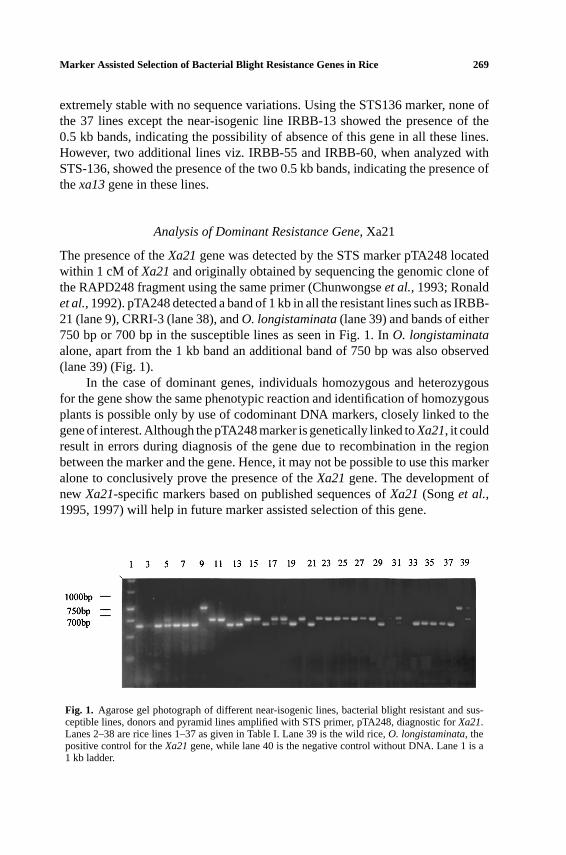
The presence of theXa21gene was detected by the STS marker pTA248 locatedwithin 1 cM of Xa21and originally obtained by sequencing the genomic clone ofthe RAPD248 fragment using the same primer (Chunwongseet al., 1993; Ronaldet al., 1992). pTA248 detected a band of 1 kb in all the resistant lines such as IRBB-21 (lane 9), CRRI-3 (lane 38), andO. longistaminata(lane 39) and bands of either750 bp or 700 bp in the susceptible lines as seen in Fig. 1. InO. longistaminataalone, apart from the 1 kb band an additional band of 750 bp was also observed(lane 39) (Fig. 1).
In the case of dominant genes, individuals homozygous and heterozygousfor the gene show the same phenotypic reaction and identification of homozygousplants is possible only by use of codominant DNA markers, closely linked to thegene of interest. Although the pTA248 marker is genetically linked toXa21, it couldresult in errors during diagnosis of the gene due to recombination in the regionbetween the marker and the gene. Hence, it may not be possible to use this markeralone to conclusively prove the presence of theXa21gene. The development ofnew Xa21-specific markers based on published sequences ofXa21(Songet al.,1995, 1997) will help in future marker assisted selection of this gene.
Fig. 1. Agarose gel photograph of different near-isogenic lines, bacterial blight resistant and sus-ceptible lines, donors and pyramid lines amplified with STS primer, pTA248, diagnostic forXa21.Lanes 2–38 are rice lines 1–37 as given in Table I. Lane 39 is the wild rice,O. longistaminata, thepositive control for theXa21gene, while lane 40 is the negative control without DNA. Lane 1 is a1 kb ladder.
P1: LMD
Biochemical Genetics [bigi] PP218-343110 August 10, 2001 14:22 Style file version Nov. 19th, 1999
270 Davierwala, Reddy, Lagu, Ranjekar, and Gupta
Survey of Polymorphism Using Known Linked STMS Markers
The STS analysis indicated the presence of thexa5 gene in some specific linesin this study. The microsatellite markers RM122, RM390, and RM13 have beenshown to be linked to thexa5gene at distances of 0.4 cM, 0.8 cM, and 14.1 cM,respectively (Blair and McCouch, 1997; Sanchezet al., 1997). All these threeSTMS markers were, therefore, used on the near-isogenic line IRBB-5, susceptiblelines, and the two parents IR-64 and IET-14444 to determine if they were suit-able for marker-aided selection (MAS) of thexa5gene in the F3 population to beanalyzed.
The STMS marker RM122 resulted in a common band of 236 bp in the near-isogenic line IRBB-5 and in one of the parents IET-14444, which was absent in boththe susceptible line and the second parent IR-64, indicating that this marker couldbe used for MAS of the F3 progeny. In addition to the two lines mentioned earlier,the lines AC-19-1-1, IET-8585, CRRI-1, and CRRI-3 also showed the presenceof the specific band present in the near-isogenic line for thexa5gene, indicatingthat thexa5gene may be present in these lines.
The other microsatellite marker RM390 could not distinguish between thenear-isogenic line and susceptible lines and, therefore, was not of any value inMAS. RM13 however, could detect polymorphism between the near-isogenic lineand susceptible lines and also between the two parents, IR-64 and IET-14444. Aband of the same size (127 bp) as observed in the near-isogenic lines IRBB-5and IET-14444 was also detected in BJI, DV-85, Hashikalmi, PR-113, IET-8320,IET-8585, RP-2151-222-4, CRRI-1, and CRRI-3.
The results obtained using the different markers linked toxa5 gene viz.STS556, RM122, and RM13, demonstrated that the lines AC19-1-1, PR-113, IET-8320, IET-8585, IET-14444, CRRI-1, and CRRI-3 possibly contained thexa5genesince both markers flanking the gene were present in these lines.
Marker Assisted Selection (MAS) of the F3 Progeny
Based on the results of the initial germplasm survey, we analyzed the F3 populationof a cross between IR-64 and IET-14444, using markers that were found to besuitable for the particular parental lines used. IR-64, which was selected as oneof the parents in the cross, is an indica variety that is widely planted throughouttropical Asia and in India (ca> 50, 000 hectares) (Reddy, 1989) and is knownto contain theXa4 gene and several QTLs for bacterial leaf blight resistance.The other parent selected for crossing, IET-14444, on the other hand, is a linecontaining multiple genes viz.Xa4andxa5, and, therefore, forms a good sourcefor transferring thexa5gene into an IR-64 background. MAS was performed todetermine the progeny lines containing thexa5gene in addition to theXa4gene.The F3 lines of the above cross were analyzed using markers that were found to
P1: LMD
Biochemical Genetics [bigi] PP218-343110 August 10, 2001 14:22 Style file version Nov. 19th, 1999
Marker Assisted Selection of Bacterial Blight Resistance Genes in Rice 271
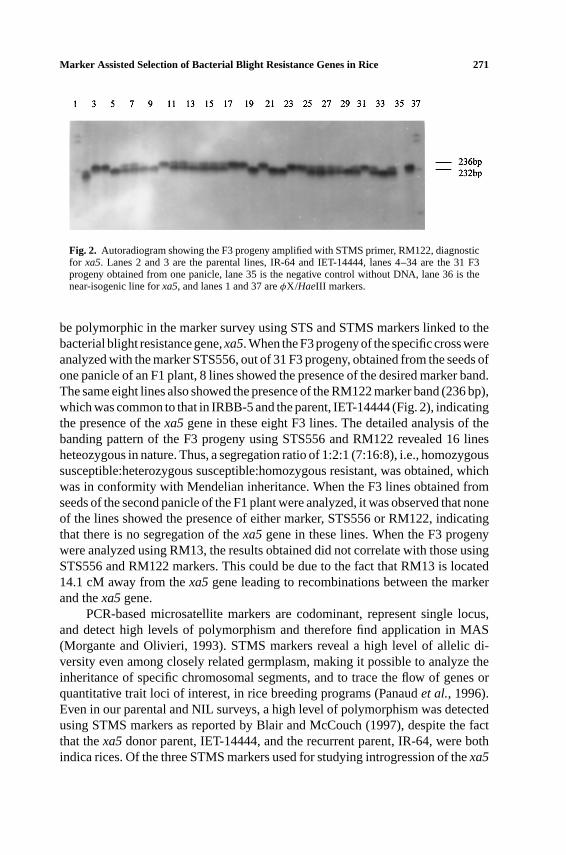
Fig. 2. Autoradiogram showing the F3 progeny amplified with STMS primer, RM122, diagnosticfor xa5. Lanes 2 and 3 are the parental lines, IR-64 and IET-14444, lanes 4–34 are the 31 F3progeny obtained from one panicle, lane 35 is the negative control without DNA, lane 36 is thenear-isogenic line forxa5, and lanes 1 and 37 areφX/HaeIII markers.
be polymorphic in the marker survey using STS and STMS markers linked to thebacterial blight resistance gene,xa5. When the F3 progeny of the specific cross wereanalyzed with the marker STS556, out of 31 F3 progeny, obtained from the seeds ofone panicle of an F1 plant, 8 lines showed the presence of the desired marker band.The same eight lines also showed the presence of the RM122 marker band (236 bp),which was common to that in IRBB-5 and the parent, IET-14444 (Fig. 2), indicatingthe presence of thexa5gene in these eight F3 lines. The detailed analysis of thebanding pattern of the F3 progeny using STS556 and RM122 revealed 16 linesheteozygous in nature. Thus, a segregation ratio of 1:2:1 (7:16:8), i.e., homozygoussusceptible:heterozygous susceptible:homozygous resistant, was obtained, whichwas in conformity with Mendelian inheritance. When the F3 lines obtained fromseeds of the second panicle of the F1 plant were analyzed, it was observed that noneof the lines showed the presence of either marker, STS556 or RM122, indicatingthat there is no segregation of thexa5gene in these lines. When the F3 progenywere analyzed using RM13, the results obtained did not correlate with those usingSTS556 and RM122 markers. This could be due to the fact that RM13 is located14.1 cM away from thexa5gene leading to recombinations between the markerand thexa5gene.
PCR-based microsatellite markers are codominant, represent single locus,and detect high levels of polymorphism and therefore find application in MAS(Morgante and Olivieri, 1993). STMS markers reveal a high level of allelic di-versity even among closely related germplasm, making it possible to analyze theinheritance of specific chromosomal segments, and to trace the flow of genes orquantitative trait loci of interest, in rice breeding programs (Panaudet al., 1996).Even in our parental and NIL surveys, a high level of polymorphism was detectedusing STMS markers as reported by Blair and McCouch (1997), despite the factthat thexa5donor parent, IET-14444, and the recurrent parent, IR-64, were bothindica rices. Of the three STMS markers used for studying introgression of thexa5
P1: LMD
Biochemical Genetics [bigi] PP218-343110 August 10, 2001 14:22 Style file version Nov. 19th, 1999
272 Davierwala, Reddy, Lagu, Ranjekar, and Gupta
gene, only two, viz. RM122 (Wu and Tanksley, 1993) and RM13 (Panaudet al.,1996), were polymorphic in the initial NIL and parental survey. However, sinceRM13 was located 14.1 cM away from thexa5gene, while RM122 was 0.4 cMfrom thexa5gene, we only used RM122 for further MAS.
The third STMS marker, RM390, located within 1 cM of thexa5gene, wasthe simple sequence repeat at the 5′ untranslated region (5′ UTR) of the RZ390clone, which comprises a block of five tandem (CT) repeats and an adjacent AT-rich region (Blair and McCouch, 1997). This marker was monomorphic for theNIL, IRBB-5, its recurrent parent, IR-24, and the susceptible lines; however, itwas polymorphic for the two parents of the cross viz., IR-64 and IET-14444.The lack of polymorphism at the RM390 locus could be due to its location inthe transcribed region of cytochrome b5 gene rather than in the nontranscribedregion (Blair and McCouch, 1997). Simple sequence repeats (SSRs) present intranscribed regions of DNA may cause disruptions through frame-shift mutationsand small-scale insertions/deletions, that limit the number of alleles possible atthese loci (Morgante and Olivieri, 1993). Also, shorter the length of SSRs in plantmicrosatellites, lower is the level of polymorphism of the marker (Akkayaet al.,1992; Becker and Heun, 1995). Hence, RM390 with less than ten units of repeatmotifs was inherently less polymorphic. However, none of the STMS markerslinked to thexa5gene could be used to predict unambiguously the presence of thisgene in untested germplasm because of the absence of a specific allele, uniquelyfound in all the lines containing thexa5gene.
Germplasm Analysis Using Different STMS Markers
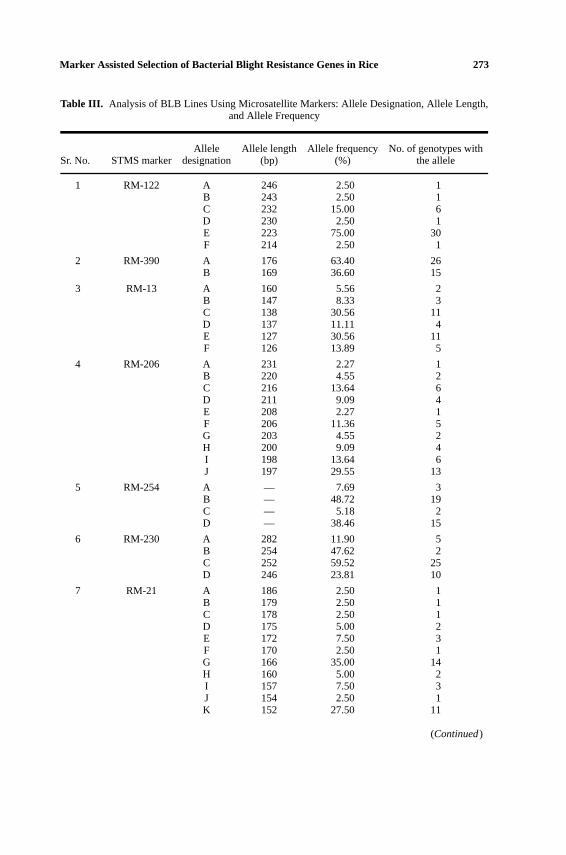
In addition to the three STMS markers linked to thexa5gene, 37 lines were ana-lyzed using eight STMS markers, which are close to the bacterial blight resistancegenes in the linkage map (Chenet al., 1997) but not studied for cosegregationanalysis. The 11 STMS markers represented five different rice chromosomes andtargeted eight different bacterial blight resistance genes (Table II). The microsatel-lite marker RM21 located on chromosome 11 had the maximum number of 11 al-leles [ranging in size from 186 bp to 152 bp] followed by RM206 on the samechromosome, with 10 alleles [from 231 bp to 197 bp], and RM224 and RM251 onchromosomes 11 and 3, respectively, with eight alleles each (Tables II and III). Theremaining STMS markers resulted in six (RM13, RM122, RM167, and RM263),four (RM230, RM254), and two (RM390) alleles, respectively (Tables II and III).Most of the rice lines studied resulted in a single allele per microsatellite primerpair; however, a few of the lines amplified two alleles with a single STMS markerand IR-22 resulted in 4 bands on amplification with RM206.
Analysis of the frequencies of various alleles obtained with different STMSmarkers revealed that for all the markers one or two alleles predominated (Table III).Allele E of 223 bp, obtained on amplification of RM122, was the most abundant
P1: LMD
Biochemical Genetics [bigi] PP218-343110 August 10, 2001 14:22 Style file version Nov. 19th, 1999
Marker Assisted Selection of Bacterial Blight Resistance Genes in Rice 273
Table III. Analysis of BLB Lines Using Microsatellite Markers: Allele Designation, Allele Length,and Allele Frequency
Allele Allele length Allele frequency No. of genotypes withSr. No. STMS marker designation (bp) (%) the allele
1 RM-122 A 246 2.50 1B 243 2.50 1C 232 15.00 6D 230 2.50 1E 223 75.00 30F 214 2.50 1
2 RM-390 A 176 63.40 26B 169 36.60 15
3 RM-13 A 160 5.56 2B 147 8.33 3C 138 30.56 11D 137 11.11 4E 127 30.56 11F 126 13.89 5
4 RM-206 A 231 2.27 1B 220 4.55 2C 216 13.64 6D 211 9.09 4E 208 2.27 1F 206 11.36 5G 203 4.55 2H 200 9.09 4I 198 13.64 6J 197 29.55 13
5 RM-254 A — 7.69 3B — 48.72 19C — 5.18 2D — 38.46 15
6 RM-230 A 282 11.90 5B 254 47.62 2C 252 59.52 25D 246 23.81 10
7 RM-21 A 186 2.50 1B 179 2.50 1C 178 2.50 1D 175 5.00 2E 172 7.50 3F 170 2.50 1G 166 35.00 14H 160 5.00 2I 157 7.50 3J 154 2.50 1K 152 27.50 11
(Continued)
P1: LMD
Biochemical Genetics [bigi] PP218-343110 August 10, 2001 14:22 Style file version Nov. 19th, 1999
274 Davierwala, Reddy, Lagu, Ranjekar, and Gupta
Table III. (Continued)
Allele Allele length Allele frequency No. of genotypes withSr. No. STMS marker designation (bp) (%) the allele
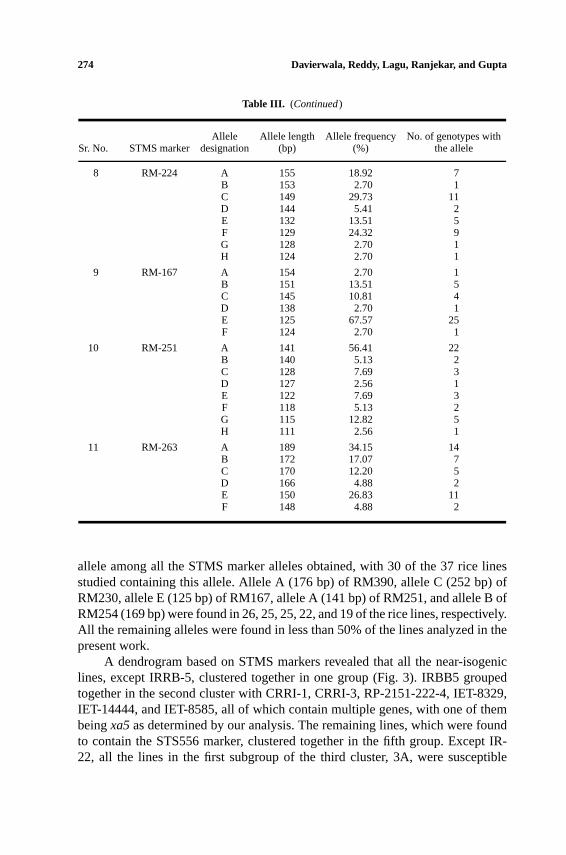
8 RM-224 A 155 18.92 7B 153 2.70 1C 149 29.73 11D 144 5.41 2E 132 13.51 5F 129 24.32 9G 128 2.70 1H 124 2.70 1
9 RM-167 A 154 2.70 1B 151 13.51 5C 145 10.81 4D 138 2.70 1E 125 67.57 25F 124 2.70 1
10 RM-251 A 141 56.41 22B 140 5.13 2C 128 7.69 3D 127 2.56 1E 122 7.69 3F 118 5.13 2G 115 12.82 5H 111 2.56 1
11 RM-263 A 189 34.15 14B 172 17.07 7C 170 12.20 5D 166 4.88 2E 150 26.83 11F 148 4.88 2
allele among all the STMS marker alleles obtained, with 30 of the 37 rice linesstudied containing this allele. Allele A (176 bp) of RM390, allele C (252 bp) ofRM230, allele E (125 bp) of RM167, allele A (141 bp) of RM251, and allele B ofRM254 (169 bp) were found in 26, 25, 25, 22, and 19 of the rice lines, respectively.All the remaining alleles were found in less than 50% of the lines analyzed in thepresent work.
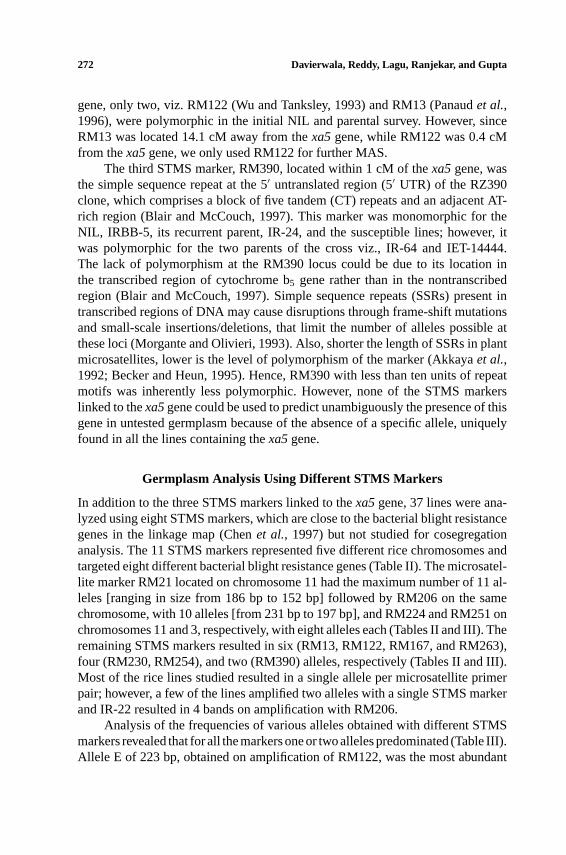
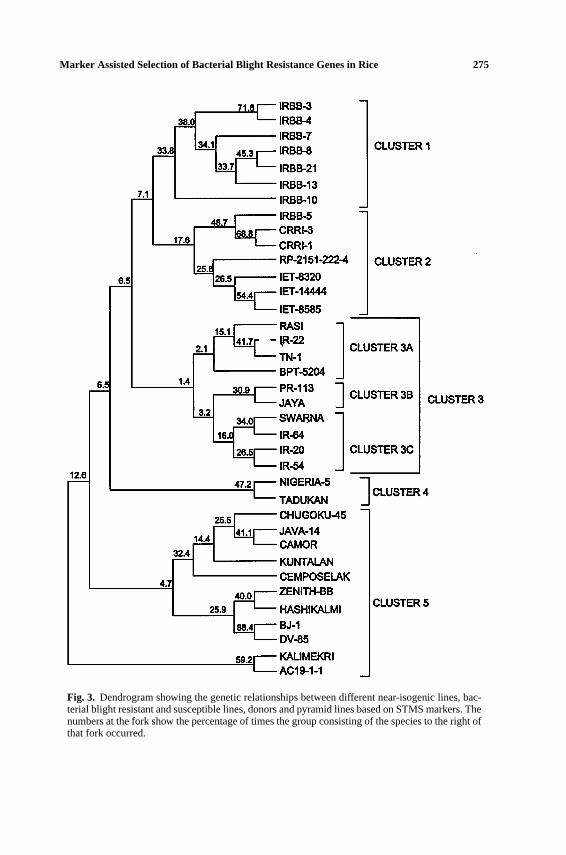
A dendrogram based on STMS markers revealed that all the near-isogeniclines, except IRRB-5, clustered together in one group (Fig. 3). IRBB5 groupedtogether in the second cluster with CRRI-1, CRRI-3, RP-2151-222-4, IET-8329,IET-14444, and IET-8585, all of which contain multiple genes, with one of thembeingxa5as determined by our analysis. The remaining lines, which were foundto contain the STS556 marker, clustered together in the fifth group. Except IR-22, all the lines in the first subgroup of the third cluster, 3A, were susceptible
P1: LMD
Biochemical Genetics [bigi] PP218-343110 August 10, 2001 14:22 Style file version Nov. 19th, 1999
Marker Assisted Selection of Bacterial Blight Resistance Genes in Rice 275
Fig. 3. Dendrogram showing the genetic relationships between different near-isogenic lines, bac-terial blight resistant and susceptible lines, donors and pyramid lines based on STMS markers. Thenumbers at the fork show the percentage of times the group consisting of the species to the right ofthat fork occurred.
P1: LMD
Biochemical Genetics [bigi] PP218-343110 August 10, 2001 14:22 Style file version Nov. 19th, 1999
276 Davierwala, Reddy, Lagu, Ranjekar, and Gupta
to bacterial blight, while the lines in the third subgroup of the same cluster, 3C,mainly containedXa4gene. Thus, the dendrogram obtained revealed that the linesclustered together on the basis of the resistance genes present in them.
In summary, using STMS markers close to bacterial blight resistance genes,the germplasm could be clustered based on the resistance genes present in them.Our analysis using STS and STMS markers has shown that these can serve as aguide to select suitable gene donors and recipients of thexa5, xa13, andXa21genes for future breeding programs.
ACKNOWLEDGMENTS
APD thanks the Council of Scientific and Industrial Research (CSIR), New Delhi,for the award of Senior Research Fellowship. This work was supported by a grantfrom the Rockefeller Foundation, U.S.A., Grant No. RF 95001, #327.
REFERENCES
Abenes, M. L. P., Angeles, E. R., Khush, G. S., and Huang, N. (1993). Selection of bacterial blightresistant rice plants in the F2 generation via their linkage to molecular markers.Rice Genet. Newsl.10:120–123.
Akkaya, M. S., Bhagwat, A. A., and Cregan, P. B. (1992). Length polymorphisms of simple sequencerepeat DNA in soybean genetics.Genetics132:1131–1139.
Babujee, L., and Gnanamickam, S. S. (2000). Molecular tools for characterization of rice blast pathogen(Magnaporthe grisea) population and molecular marker-assisted breeding for disease resistance.Current Sci.78:248–257.
Becker, J. B., and Heun, M. (1995). Barley microsatellites: Allele variation and mapping.Plant Mol.Biol. 27:835–845.
Blair, M. W., and McCouch, S. R. (1997). Microsatellite and sequence-tagged site markers diagnosticfor the rice bacterial leaf blight resistance genexa5. Theor. Appl. Genet.95:174–184.
Chen, X., Temnykh, S., Xu, Y., Cho, Y. G., and McCouch, S. R. (1997). Development of a microsatelliteframework map providing genome-wide coverage in rice (Oryza sativaL.). Theor. Appl. Genet.95:553–567.
Chunwongse, J., Martin, G. B., and Tanksley, S. D. (1993). Pre-germination genotypic screening usingPCR amplification of half seeds.Theor. Appl. Genet.86:694–698.
Durgapal, J. C. (1985). High virulence ofXanthomonas campestrispv oryzae, a factor in the 1980epiphytotic in the non-traditional rice-growing region of northwest India.Ind. J. Agric. Sci.55(2):133–135.
Ezuka, A., and Sakaguchi, S. (1978). Host-parasite relationship in bacterial blight of rice caused byXanthomonas oryzae. Rev. Plant. Prot. Res.11:93–118.
Ghareyazie, B., Huang, N., Second, G., Bennett, J., and Khush, G. S. (1995). Classification of ricegermplasm I. Analysis using ALP and PCR-based RFLP.Theor. Appl. Genet.91:218–227.
Gupta, V. S., Ramakrishna, W., Rawat, S. R., and Ranjekar, P. K. (1994). (CAC)5 detects DNA finger-prints and sequences homologous to gene transcripts in rice.Biochem. Genet.32:1–8.
Hittalmani, S., Foolad, M., Mew, T., Rodriguez, R., and Huang, N. (1994). Identification of blastresistance gene,Pi-2(t) in rice plants by flanking DNA markers.Rice Genet. Newsl.11:144–146.
Huang, N., Angeles, E. R., Domingo, J., Magpantay, G., Singh, S., Zhang, G., Kumaravadivel, N.,Bennett, J., and Khush, G. S. (1997). Pyramiding bacterial blight resistance genes in rice: Markerassisted selection using RFLP and PCR.Theor. Appl. Genet.95:313–320.
Ikeda, R., Tabien, R. E., and Khush, G. S. (1992). Chromosomal location ofXa21. Rice Genet. Newsl.8:102–103.
P1: LMD
Biochemical Genetics [bigi] PP218-343110 August 10, 2001 14:22 Style file version Nov. 19th, 1999
Marker Assisted Selection of Bacterial Blight Resistance Genes in Rice 277
Ikeda, R., Tabien, R. E., and Ogawa, T. (1995). Linkage analysis of resistance genes to bacterial blightin rice.JARQ29:137–142.
Inoue, T., Zhong, H. S., Miyao, A., Ashikawa, I., Monna, L., Fukoaka, S., Miyadera, N., Nagamura,Y., Kurata, N., Sasaki, T., and Minobe, Y. (1994). Sequence-tagged sites (STSs) as standardlandmarkers in rice genome.Theor. Appl. Genet.89:728–734.
International Rice Research Institute (IRRI). (1973).Annual Report for 1972. International Rice Re-search Institute, Los Banos, Philippines.
Ishiyama, S. (1992). Studies on the white leaf disease of rice plants. Report of the Agricultural Exper-imental Station, Tokyo,45:233–251.
Joshi, S. P., Gupta, V. S., Aggarwal, R. K., Ranjekar, P. K., and Brar, D. S. (2000). Genetic diversityand phylogenetic relationship as revealed by inter-simple sequence repeat (ISSR) polymorphismin the genusOryza. Theor. Appl. Genet.100:1311–1320.
Kaku, H. (1997). The dosage effect of bacterial blight resistance genesXa-1 andXa-3 in rice.RiceGenet. Newsl.14:64–67.
Khush, G. S., Mackill, D. J., and Sidhu, G. S. (1989). Breeding of rice for resistance to bacterialblight. In Bacterial Blight of Rice. International Rice Research Institute, Los Banos, Philippines,pp. 207–217.
Khush, G. S., and Virmani, S. S. (1985). Breeding rice for disease resistance. In Russell, G. E. (ed.),Progress in Plant Breeding, Vol. I, Butterworths, London, pp. 239–279.
Lozano, J. C. (1977). Identification of bacterial blight in rice caused byXanthomonas oryzaein America.Plant Dis. Report61:644–648.
McCouch, S. R., Abenes, M. L., Angeles, E. R., Khush, G. S., and Tanksley, S. D. (1992). Moleculartagging of a recessive gene,xa5, for resistance to bacterial blight of rice.Rice Genet. Newsl.8:143–145.
Mew, T. W. (1987). Current status and future prospects of research on Bacterial blight of rice.Annu.Rev. Phytopathol.25:359–382.
Mew, T. W., Alvarez, A. M., Leach, J. E., and Swings, J. (1993). Focus on bacterial blight of rice.PlantDis. 77:5–12.
Mew, T. W., and Vera Cruz C. M. (1979). Variability ofXanthomonas oryzaepv oryzae: Specificity ininfection of rice differentials.Phytopathology69:152–155.
Mew, T. W., Vera Cruz, C. M., and Medella, E. S. (1992). Change in race frequency ofXanthomonasoryzaepvoryzaein response to the planting of rice cultivars in the Philippines.Plant Dis.76:1029–1032.
Morgante, M., and Olivieri, A. M. (1993). PCR-amplified microsatellite markers in plant genetics.Plant J.3:175–182.
Ogawa, T. (1993). Methods and strategy for monitoring race distribution and identification of resis-tance genes to bacterial leaf blight (Xanthomonas campestrispv oryzae) in rice. JARQ27:71–80.
Ogawa, T., Lin, L., Tabien, R. E., and Khush, G. S. (1987). A new gene for resistance to bacterial blightof rice.Rice Genet. Newsl.4:98–100.
Ogawa, T., Tabien, R. E., Busto, G. A., Khush, G. S., and Mew, T. W. (1986). The relationship betweenXa3, Xa4andXa4b for resistance to rice bacterial blight.Rice Genet. Newsl.3:83–84.
Padmanabhan, S. Y. (1983). Integrated control of bacterial blight of rice.Oryza20:188–189.Panaud, O., Chen, X., and McCouch, S. R. (1996). Development of microsatellite markers and charac-
terization of simple sequence length polymorphism (SSLP) in rice (Oryza sativaL.). Mol. Gen.Genet.252:597–607.
Rajebhosale, M. D., Chowdari, K. V., Ramakrishna, W., Tamhankar, S. A., Gupta, V. S.,Gnanamanickam, S. S., and Ranjekar, P. K. (1997). DNA fingerprinting of Indian isolates ofXanthomonas oryzaepv oryzae. Theor. Appl. Genet.95:103–111.
Ramakrishna, W., Chowdari, K. V., Lagu, M. D., Gupta, V. S., and Ranjekar, P. K. (1995). DNAfingerprinting to detect genetic variation in rice using hypervariable DNA sequences.Theor. Appl.Genet.90:1000–1006.
Ramakrishna, W., Lagu, M. D., Gupta, V. S., and Ranjekar, P. K. (1994). DNA fingerprinting in riceusing oligonucleotide probes specific for simple repetitive DNA sequences.Theor. Appl. Genet.88:402–406.
P1: LMD
Biochemical Genetics [bigi] PP218-343110 August 10, 2001 14:22 Style file version Nov. 19th, 1999
278 Davierwala, Reddy, Lagu, Ranjekar, and Gupta
Reddy, A. P. K. (1989). Bacterial blight: Crop loss assessment and disease management. InProceedingsof the International Workshop on Bacterial Blight of Rice, March 14–18, 1988, International RiceResearch institute, Manila, Philippines, pp. 79–88.
Rogers, S. O., and Bendich, A. J. (1988). Extraction of DNA from plant tissues. In Gelvin, S. B., andSchilperoort, R. A. (eds.),Plant Molecular Biology Manual A6.1, Kluwer, Dordrecht.
Ronald, P. C., Albano, B., Tabien, R., Abenes, L., Wu, K., McCouch, S. R., and Tanksley, S. D. (1992).Genetic and physical analysis of the rice bacterial blight disease resistance locus,Xa21. Mol. Gen.Genet.236:113–120.
Sambrook, J., Fritsch, E. F., and Maniatis, T. (1989).Molecular Cloning: A Laboratory Manual, 2ndedn., Cold Spring Harbor Laboratory Press, Cold Spring Harbor, NY.
Sanchez, A. C., Ilag, L. L., Yang, D., Brar, D. S., Ausubel, F., Khush, G. S., Yano, M., Sasaki, T.,Li, Z., and Huang, N. (1999). Genetic and physical mapping ofxa13, a recessive bacterial blightresistance gene in rice.Theor. Appl. Genet.98:1022–1028.
Sanchez, A. C., Yang, D., Khush, G. S., Zhu, Y., and Huang, N. (1997). Construction of overlappingBAC clones forxa5region of chromosome 5.Rice Genet. Newsl.14:118–119.
Schaffer, H. E., and Sederoff, R. R. (1981). Improved estimation of DNA fragment lengths from agarosegels.Anal. Biochem.115:113–122.
Sidhu, G. S., Khush, G. S., and Mew, T. W. (1978). Genetic analysis of bacterial blight resistance inseventy-four cultivars of rice (Oryza sativaL.). Theor. Appl. Genet.53:105–111.
Song, W. Y., Pi, L. Y., Wang, G. L., Gardener, J., Holsten, T., and Ronald, P. C. (1997). Evolution ofthe riceXa21disease resistance gene family.Plant Cell8:429–445.
Song, W. Y., Wang, G. L., Chen, L. L., Kim, H. S., Pi, L. Y., Holsten, T., Wang, B., Zhai, W. X., Zhu, H.,Fauquet, C., and Ronald, P. C. (1995). A receptor-kinase like protein encoded by the rice diseaseresistance gene,Xa21. Science270:1804–1806.
Srivastava, D. N. (1972). Bacterial leaf blight of rice.Indian Phytopathol.26:1–16.Tanksley, S. D., Young, N. D., Paterson, A. H., and Bonierbale, M. W. (1989). RFLP mapping in plant
breeding: New tools for an old science.Biotechnology7:257–264.Williams, C. E., Wang, B., Holsten, T. E., Scambray, J., de Assis Goes da Silva, F., and Ronald,
P. C. (1996). Markers for selection of the riceXa21disease resistance gene.Theor. Appl. Genet.93:1119–1122.
Williams, M. N. V., Pande, N., Nair, S., Mohan, M., and Bennett J. (1991). Restriction fragment lengthpolymorphism analysis of polymerase chain reaction products amplified from mapped loci of rice(Oryza sativaL.) genomic DNA.Theor. Appl. Genet.82:489–498.
Wu, K. S., and Tanksley, S. D. (1993). Abundance, polymorphism and genetic mapping of microsatel-lites in rice.Mol. Gen. Genet.241:225–235.
Yap, I. V., and Nelson, R. J. (1996). Winboot: A program for performing bootstrap analysis of binarydata to determine the confidence limits of UPGMA-based dendrograms. IRRI discussion paper,series No. 14, Manila, Philippines.
Yoshimura, A., Mew, T. W., Khush, G. S., and Omura, T. (1983). Inheritance of resistance to bacterialblight in rice cultivar Cas209.Phytopathology73:1409–1412.
Yoshimura, S., Yoshimura, A., Iwata, N., McCouch, S. R., Abenes, M. L., Baraoidan, M. R., Mew,T. W., and Nelson, R. J. (1995). Tagging and combining bacterial blight resistance genes in riceusing RAPD and RFLP markers.Mol. Breeding1:375–387.
Yoshimura, S., Yoshimura, A., Saito, A., Kinoshimoto, N., Kawase, M., Yano, M., Nakagahra, M.,Ogawa, T., and Iwata, N. (1992). RFLP analysis of introgressed chromosomal segments in threenear-isogenic lines of rice for bacterial blight resistance genesxa1, xa3andxa4. Jpn. J. Genet.67:29–37.
Zhang, G., Angeles, E. R., Abenes, M. L. P., Khush, G. S., and Huang, N. (1996). RAPD and RFLPmapping of the bacterial blight resistance genexa13in rice.Theor. Appl. Genet.93:65–70.
Zhang, Q. (1995). Utilization and strategy of genes for resistance to rice bacterial blight in China.ActaPhytopathol. Sin.22:241–246.
Zhang, Q., Wang, C., and Lin, S. (1988). Studies on disease resistance in rice breeding. III. Resistant-susceptible reaction of major rice cultivars to certain bacterial blight strains of China.Sci. Agric.Sin.21:41–49.