Embed Size (px)
Citation preview
www.angelbroking.com
Market Outlook August 17, 2017
www.angelbroking.com
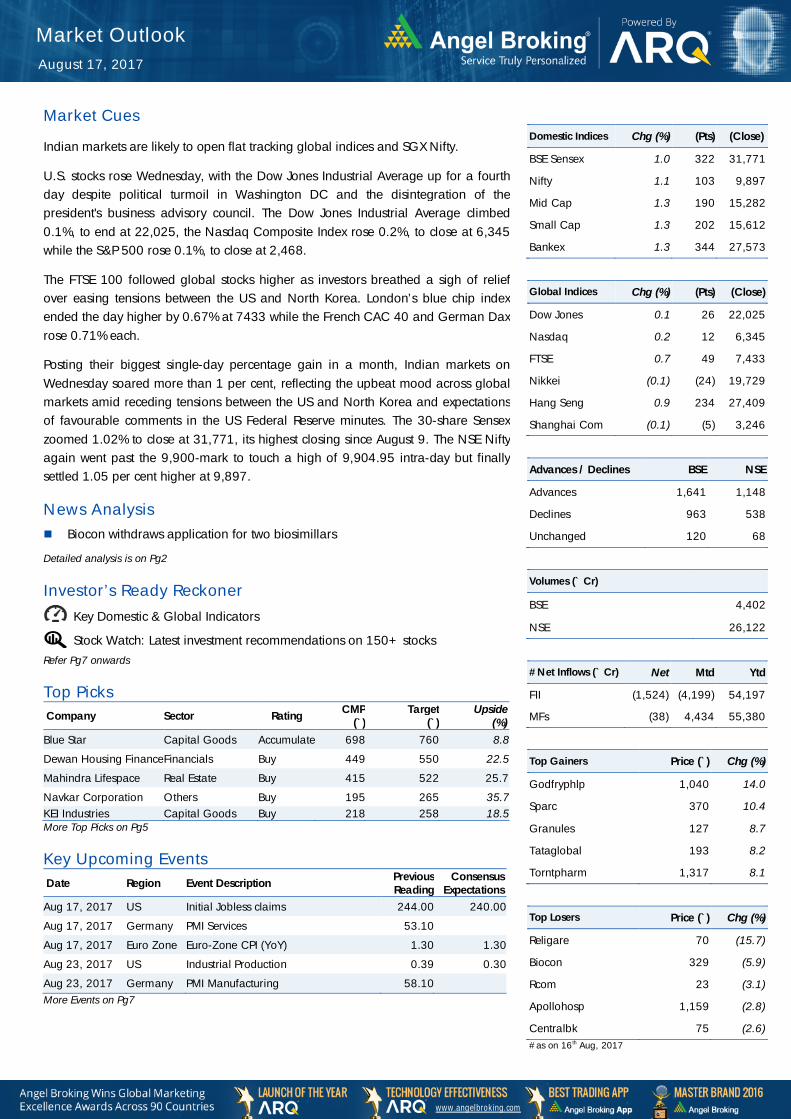
Market Cues
Indian markets are likely to open flat tracking global indices and SGX Nifty.
U.S. stocks rose Wednesday, with the Dow Jones Industrial Average up for a fourth day despite political turmoil in Washington DC and the disintegration of the president's business advisory council. The Dow Jones Industrial Average climbed 0.1%, to end at 22,025, the Nasdaq Composite Index rose 0.2%, to close at 6,345 while the S&P 500 rose 0.1%, to close at 2,468.
The FTSE 100 followed global stocks higher as investors breathed a sigh of relief over easing tensions between the US and North Korea. London’s blue chip index ended the day higher by 0.67% at 7433 while the French CAC 40 and German Dax rose 0.71% each.
Posting their biggest single-day percentage gain in a month, Indian markets on Wednesday soared more than 1 per cent, reflecting the upbeat mood across global markets amid receding tensions between the US and North Korea and expectations of favourable comments in the US Federal Reserve minutes. The 30-share Sensex zoomed 1.02% to close at 31,771, its highest closing since August 9. The NSE Nifty again went past the 9,900-mark to touch a high of 9,904.95 intra-day but finally settled 1.05 per cent higher at 9,897.
News Analysis Biocon withdraws application for two biosimillars
Detailed analysis is on Pg2
Investor’s Ready Reckoner
Key Domestic & Global Indicators
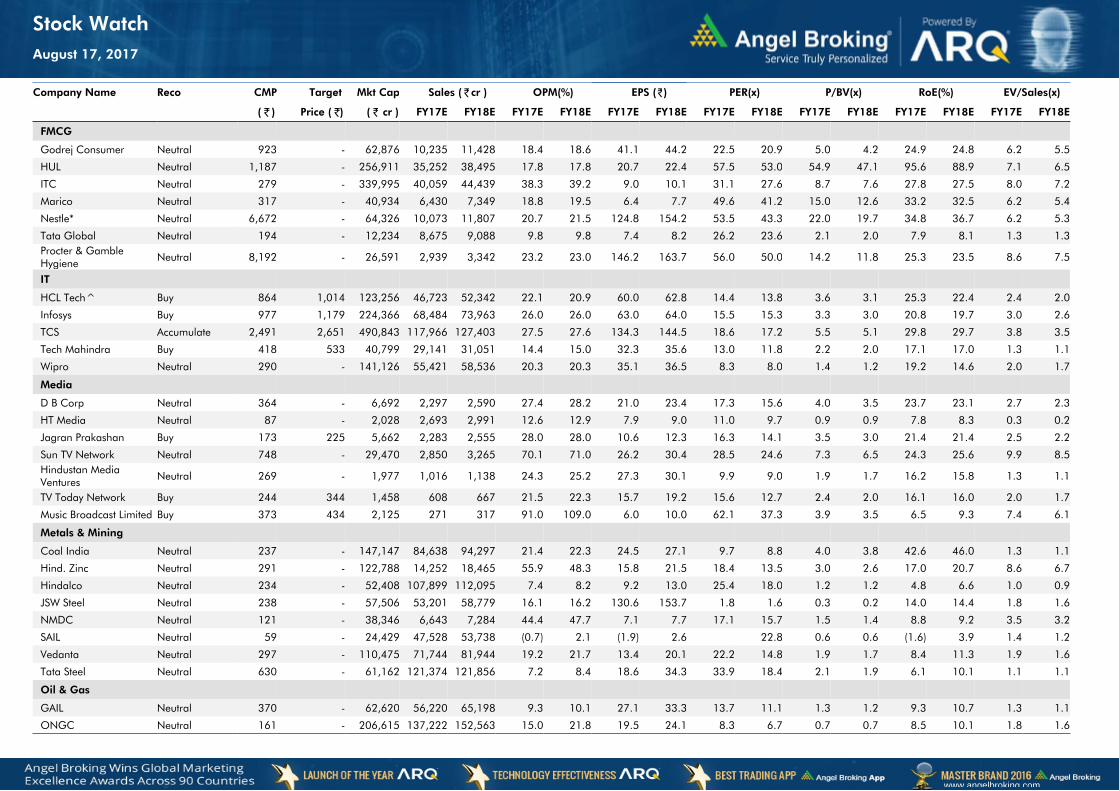
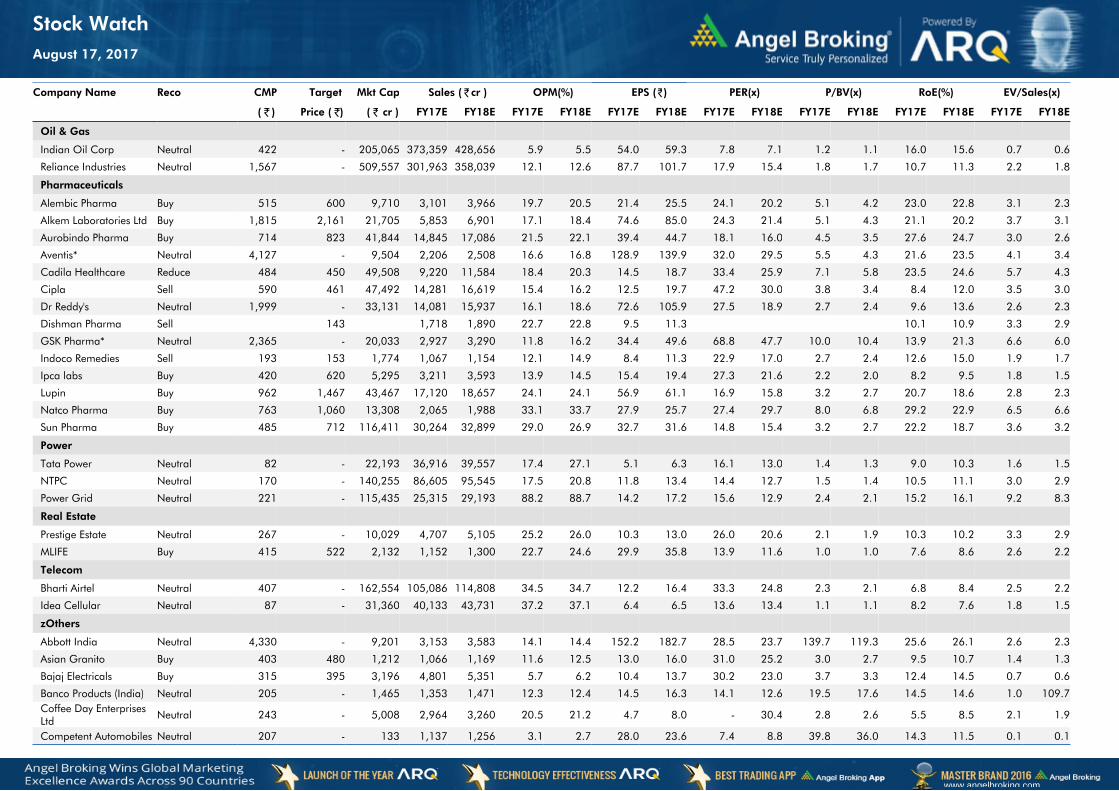
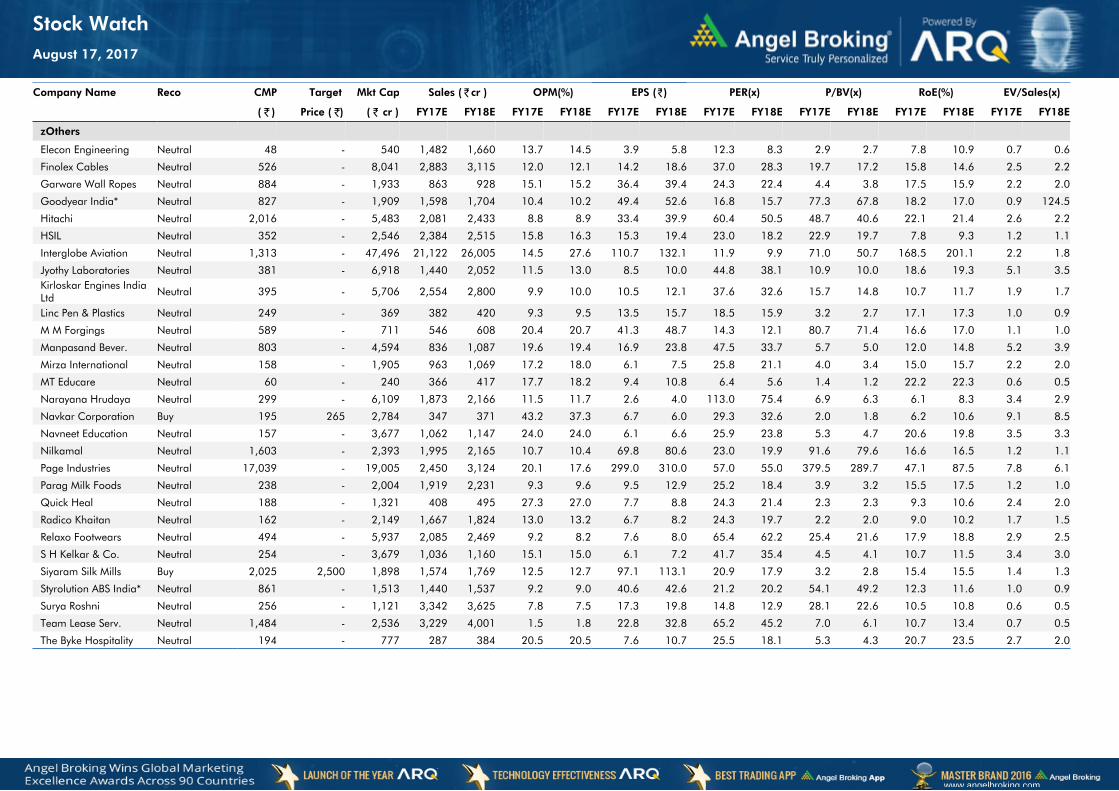
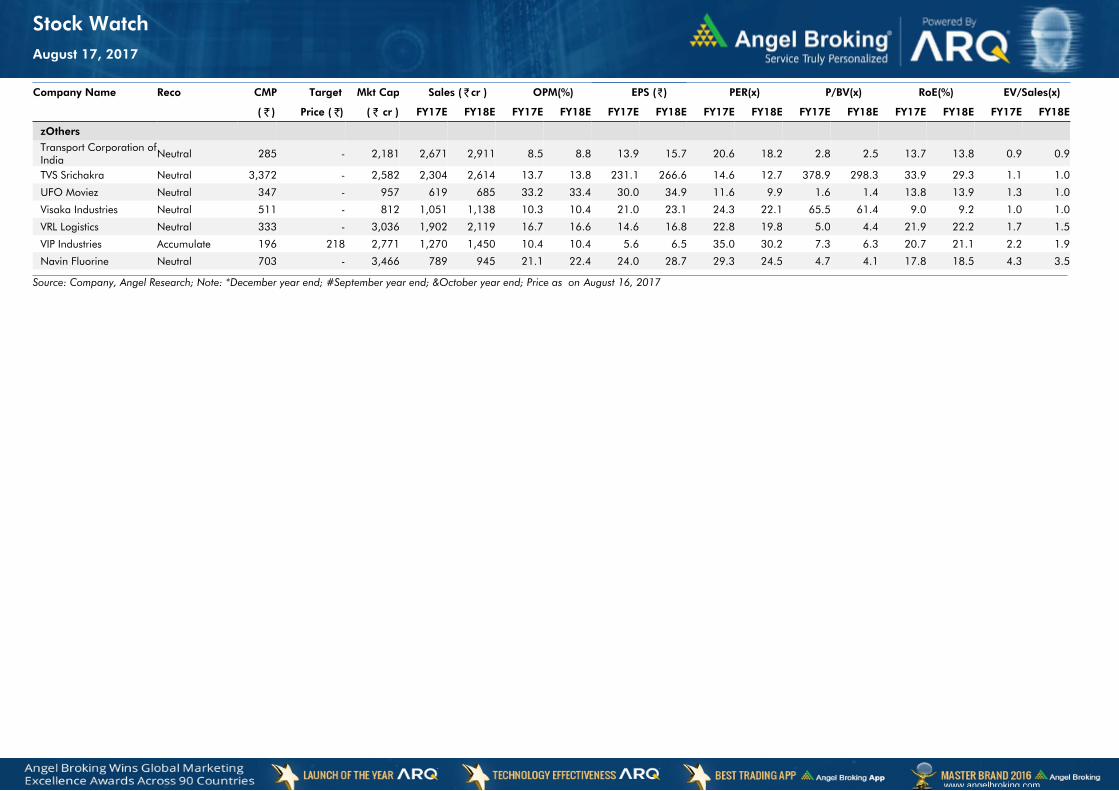
Stock Watch: Latest investment recommendations on 150+ stocks
Refer Pg7 onwards
Top Picks Company Sector Rating
CMP (`)
Target (`)
Upside (%)
Blue Star Capital Goods Accumulate 698 760 8.8
Dewan Housing FinanceFinancials Buy 449 550 22.5
Mahindra Lifespace Real Estate Buy 415 522 25.7
Navkar Corporation Others Buy 195 265 35.7 KEI Industries Capital Goods Buy 218 258 18.5 More Top Picks on Pg5
Key Upcoming Events Date Region Event Description
Previous Reading
Consensus Expectations
Aug 17, 2017 US Initial Jobless claims 244.00 240.00
Aug 17, 2017 Germany PMI Services 53.10
Aug 17, 2017 Euro Zone Euro-Zone CPI (YoY) 1.30 1.30
Aug 23, 2017 US Industrial Production 0.39 0.30
Aug 23, 2017 Germany PMI Manufacturing 58.10More Events on Pg7
Domestic Indices Chg (%) (Pts) (Close)
BSE Sensex 0.3 86 29,422
Nifty 0.4 33 9,136
Mid Cap 0.7 95 14,485
Small Cap 1.1 171 15,128
Bankex (0.5) (131) 24,444
Global Indices Chg (%) (Pts) (Close)
Dow Jones 0.9 174 20,579
Nasdaq 0.9 54 5,917
FTSE 0.1 4 7,119
Nikkei (0.0) (2) 18,430
Hang Seng 1.0 231 24,057
Shanghai Com 0.0 1 3,172
Advances / Declines BSE NSE
Advances 1,849 1,130
Declines 1,039 543
Unchanged 164 74
Volumes (` Cr)
BSE 4,029
NSE 25,391
#Net Inflows (` Cr) Net Mtd Ytd
FII (565) (2,249) 41,972
MFs 804 4,895 14,333
Top Gainers Price (`) Chg (%)
Indiacem 190 8.8
Jktyre 154 8.4
Gsfc 124 7.5
Sobha 392 7.3
Jetairways 511 6.5
Top Losers Price (`) Chg (%)
Irb 240 (5.0)
Yesbank 1,545 (3.8)
Icicibank 273 (2.9)
Polaris 214 (2.5)
Concor 1,186 (2.5) #As on April 20, 2017
Domestic Indices Chg (%) (Pts) (Close)
BSE Sensex 1.0 322 31,771
Nifty 1.1 103 9,897
Mid Cap 1.3 190 15,282
Small Cap 1.3 202 15,612
Bankex 1.3 344 27,573
Global Indices Chg (%) (Pts) (Close)
Dow Jones 0.1 26 22,025
Nasdaq 0.2 12 6,345
FTSE 0.7 49 7,433
Nikkei (0.1) (24) 19,729
Hang Seng 0.9 234 27,409
Shanghai Com (0.1) (5) 3,246
Advances / Declines BSE NSE
Advances 1,641 1,148
Declines 963 538
Unchanged 120 68
Volumes (` Cr)
BSE 4,402
NSE 26,122
#Net Inflows (` Cr) Net Mtd Ytd
FII (1,524) (4,199) 54,197
MFs (38) 4,434 55,380
Top Gainers Price (`) Chg (%)
Godfryphlp 1,040 14.0
Sparc 370 10.4
Granules 127 8.7
Tataglobal 193 8.2
Torntpharm 1,317 8.1
Top Losers Price (`) Chg (%)
Religare 70 (15.7)
Biocon 329 (5.9)
Rcom 23 (3.1)
Apollohosp 1,159 (2.8)
Centralbk 75 (2.6) #as on 16th Aug, 2017
www.angelbroking.com
Market Outlook August 17, 2017
www.angelbroking.com
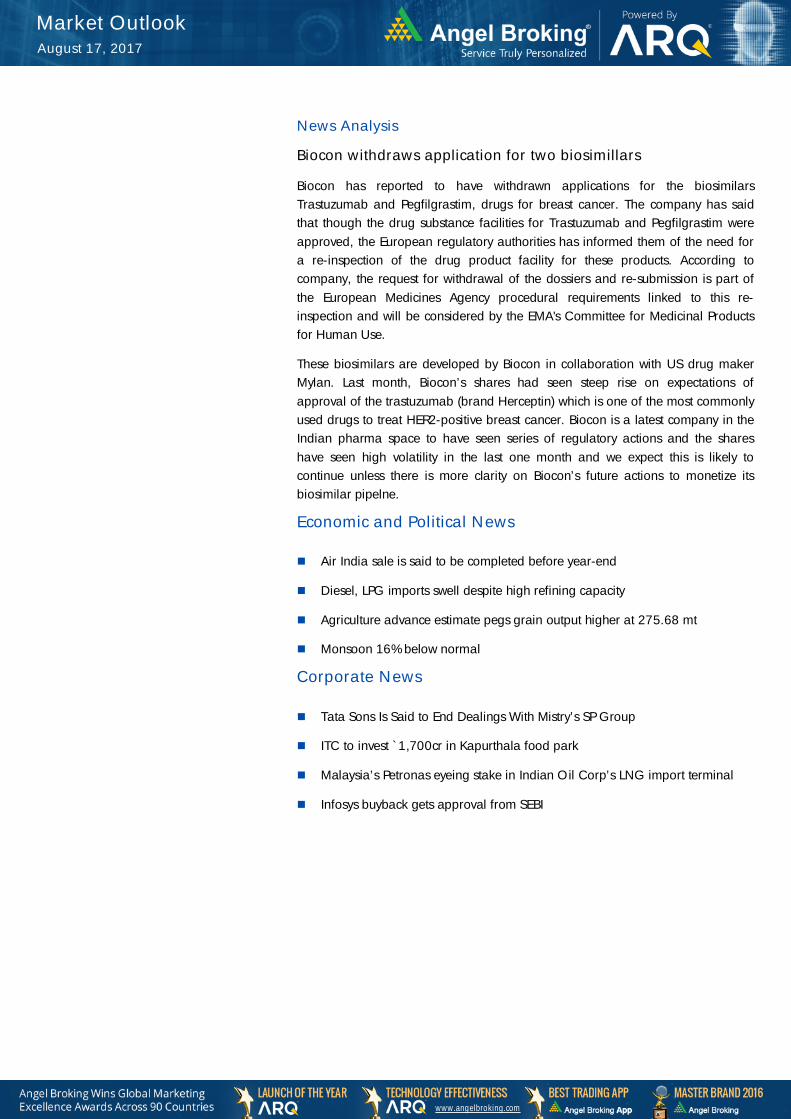
News Analysis
Biocon withdraws application for two biosimillars
Biocon has reported to have withdrawn applications for the biosimilars Trastuzumab and Pegfilgrastim, drugs for breast cancer. The company has said that though the drug substance facilities for Trastuzumab and Pegfilgrastim were approved, the European regulatory authorities has informed them of the need for a re-inspection of the drug product facility for these products. According to company, the request for withdrawal of the dossiers and re-submission is part of the European Medicines Agency procedural requirements linked to this re-inspection and will be considered by the EMA's Committee for Medicinal Products for Human Use.
These biosimilars are developed by Biocon in collaboration with US drug maker Mylan. Last month, Biocon’s shares had seen steep rise on expectations of approval of the trastuzumab (brand Herceptin) which is one of the most commonly used drugs to treat HER2-positive breast cancer. Biocon is a latest company in the Indian pharma space to have seen series of regulatory actions and the shares have seen high volatility in the last one month and we expect this is likely to continue unless there is more clarity on Biocon’s future actions to monetize its biosimilar pipelne.
Economic and Political News Air India sale is said to be completed before year-end
Diesel, LPG imports swell despite high refining capacity
Agriculture advance estimate pegs grain output higher at 275.68 mt
Monsoon 16% below normal
Corporate News Tata Sons Is Said to End Dealings With Mistry’s SP Group
ITC to invest `1,700cr in Kapurthala food park
Malaysia’s Petronas eyeing stake in Indian Oil Corp’s LNG import terminal
Infosys buyback gets approval from SEBI
www.angelbroking.com
Market Outlook August 17, 2017
www.angelbroking.com
Top Picks Company
Market Cap(` Cr)
CMP (`)
Target (`)
Upside (%)
Rationale
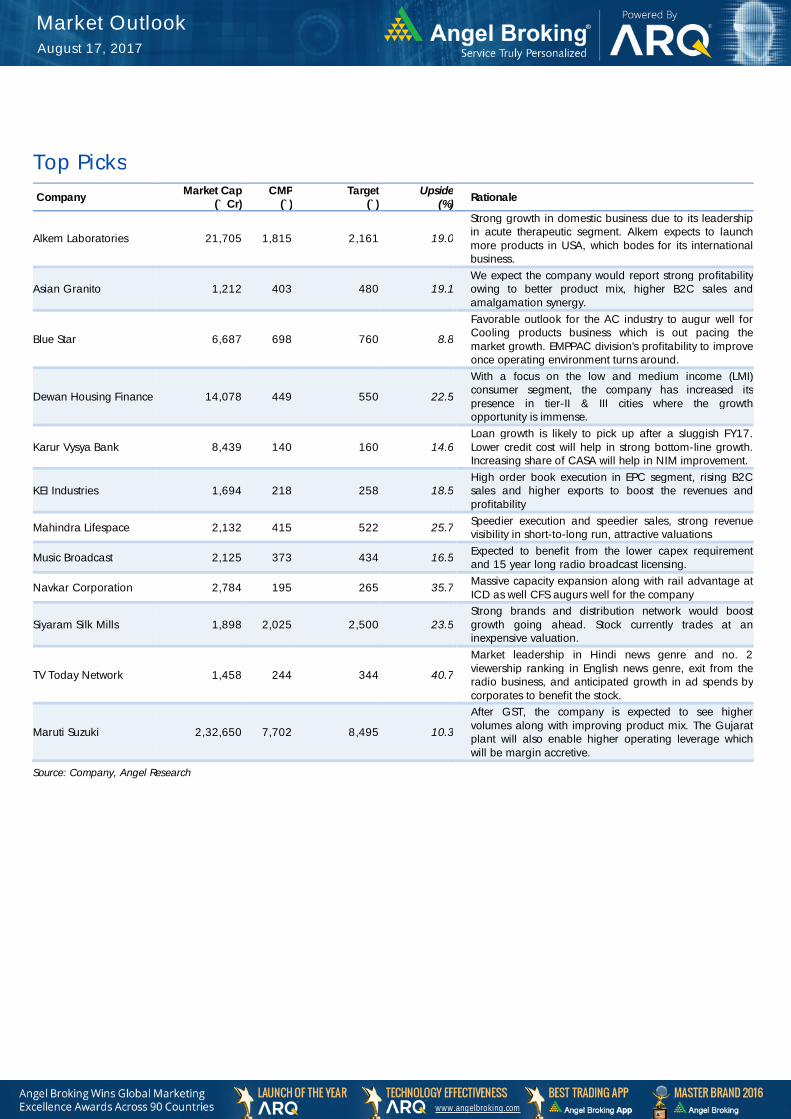
Alkem Laboratories 21,705 1,815 2,161 19.0
Strong growth in domestic business due to its leadership in acute therapeutic segment. Alkem expects to launch more products in USA, which bodes for its international business.
Asian Granito 1,212 403 480 19.1 We expect the company would report strong profitability owing to better product mix, higher B2C sales and amalgamation synergy.
Blue Star 6,687 698 760 8.8
Favorable outlook for the AC industry to augur well for Cooling products business which is out pacing the market growth. EMPPAC division's profitability to improve once operating environment turns around.
Dewan Housing Finance 14,078 449 550 22.5
With a focus on the low and medium income (LMI) consumer segment, the company has increased its presence in tier-II & III cities where the growth opportunity is immense.
Karur Vysya Bank 8,439 140 160 14.6 Loan growth is likely to pick up after a sluggish FY17. Lower credit cost will help in strong bottom-line growth. Increasing share of CASA will help in NIM improvement.
KEI Industries 1,694 218 258 18.5 High order book execution in EPC segment, rising B2C sales and higher exports to boost the revenues and profitability
Mahindra Lifespace 2,132 415 522 25.7 Speedier execution and speedier sales, strong revenue visibility in short-to-long run, attractive valuations
Music Broadcast 2,125 373 434 16.5 Expected to benefit from the lower capex requirement and 15 year long radio broadcast licensing.
Navkar Corporation 2,784 195 265 35.7 Massive capacity expansion along with rail advantage at ICD as well CFS augurs well for the company
Siyaram Silk Mills 1,898 2,025 2,500 23.5 Strong brands and distribution network would boost growth going ahead. Stock currently trades at an inexpensive valuation.
TV Today Network 1,458 244 344 40.7
Market leadership in Hindi news genre and no. 2 viewership ranking in English news genre, exit from the radio business, and anticipated growth in ad spends by corporates to benefit the stock.
Maruti Suzuki 2,32,650 7,702 8,495 10.3
After GST, the company is expected to see higher volumes along with improving product mix. The Gujarat plant will also enable higher operating leverage which will be margin accretive.
Source: Company, Angel Research
Market Outlook August 17, 2017
Key Upcoming Events
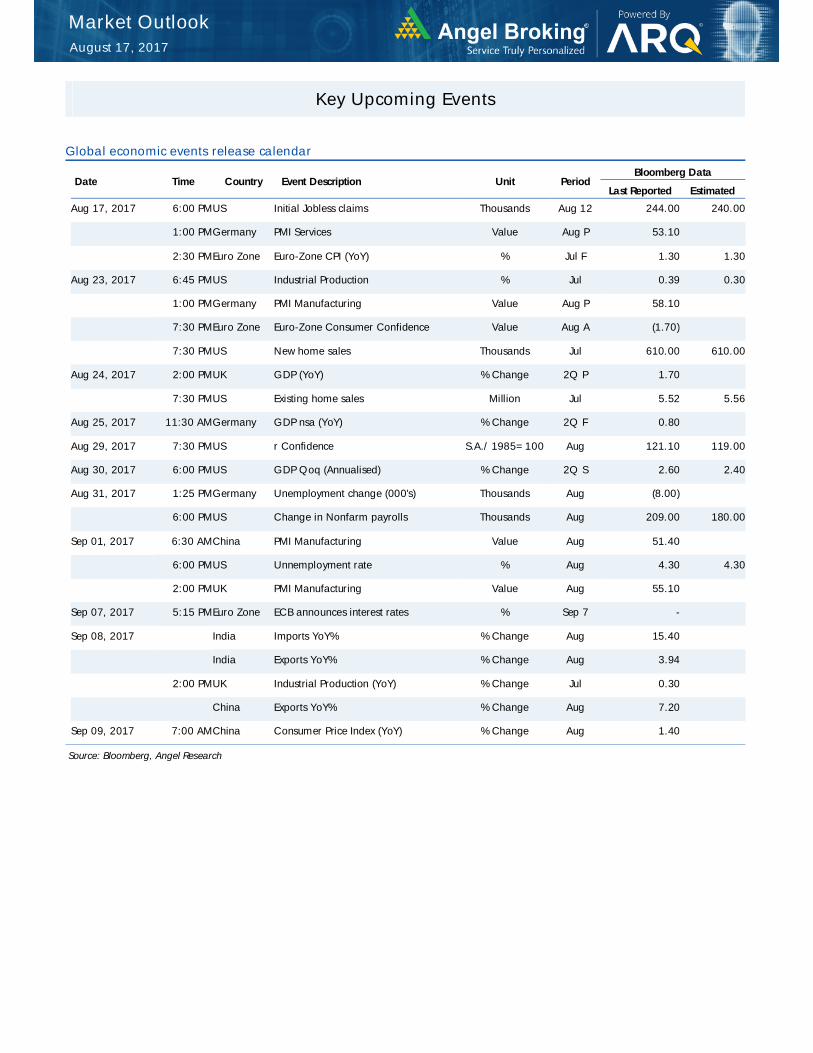
Global economic events release calendar
Date Time Country Event Description Unit Period Bloomberg Data
Last Reported Estimated
Aug 17, 2017 6:00 PMUS Initial Jobless claims Thousands Aug 12 244.00 240.00
1:00 PMGermany PMI Services Value Aug P 53.10
2:30 PMEuro Zone Euro-Zone CPI (YoY) % Jul F 1.30 1.30
Aug 23, 2017 6:45 PMUS Industrial Production % Jul 0.39 0.30
1:00 PMGermany PMI Manufacturing Value Aug P 58.10
7:30 PMEuro Zone Euro-Zone Consumer Confidence Value Aug A (1.70)
7:30 PMUS New home sales Thousands Jul 610.00 610.00
Aug 24, 2017 2:00 PMUK GDP (YoY) % Change 2Q P 1.70
7:30 PMUS Existing home sales Million Jul 5.52 5.56
Aug 25, 2017 11:30 AMGermany GDP nsa (YoY) % Change 2Q F 0.80
Aug 29, 2017 7:30 PMUS r Confidence S.A./ 1985=100 Aug 121.10 119.00
Aug 30, 2017 6:00 PMUS GDP Qoq (Annualised) % Change 2Q S 2.60 2.40
Aug 31, 2017 1:25 PMGermany Unemployment change (000's) Thousands Aug (8.00)
6:00 PMUS Change in Nonfarm payrolls Thousands Aug 209.00 180.00
Sep 01, 2017 6:30 AMChina PMI Manufacturing Value Aug 51.40
6:00 PMUS Unnemployment rate % Aug 4.30 4.30
2:00 PMUK PMI Manufacturing Value Aug 55.10
Sep 07, 2017 5:15 PMEuro Zone ECB announces interest rates % Sep 7 -
Sep 08, 2017 India Imports YoY% % Change Aug 15.40
India Exports YoY% % Change Aug 3.94
2:00 PMUK Industrial Production (YoY) % Change Jul 0.30
China Exports YoY% % Change Aug 7.20
Sep 09, 2017 7:00 AMChina Consumer Price Index (YoY) % Change Aug 1.40
Source: Bloomberg, Angel Research
Market Outlook August 17, 2017
Macro watch
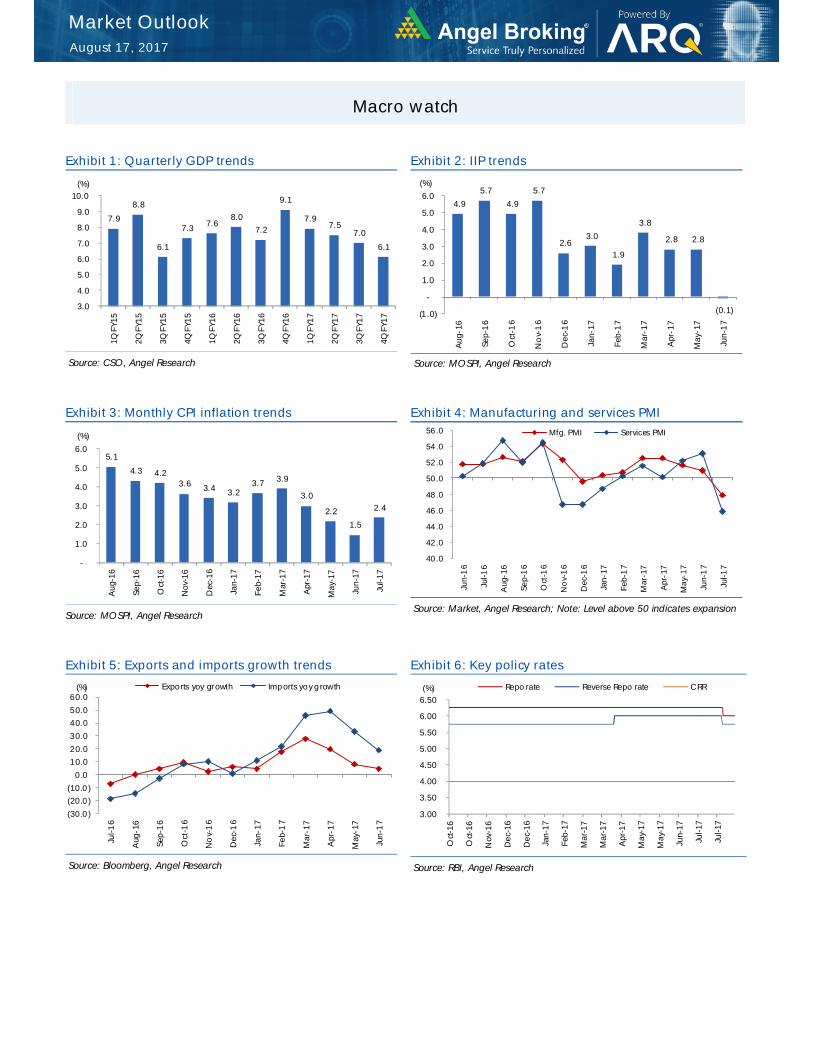
Exhibit 1: Quarterly GDP trends
Source: CSO, Angel Research
Exhibit 2: IIP trends
Source: MOSPI, Angel Research
Exhibit 3: Monthly CPI inflation trends
Source: MOSPI, Angel Research
Exhibit 4: Manufacturing and services PMI
Source: Market, Angel Research; Note: Level above 50 indicates expansion
Exhibit 5: Exports and imports growth trends
Source: Bloomberg, Angel Research
Exhibit 6: Key policy rates
Source: RBI, Angel Research
7.9
8.8
6.1
7.3 7.6 8.0
7.2
9.1
7.9 7.5
7.0
6.1
3.0
4.0
5.0
6.0
7.0
8.0
9.0
10.0
1QFY
15
2QFY
15
3QFY
15
4QFY
15
1QFY
16
2QFY
16
3QFY
16
4QFY
16
1QFY
17
2QFY
17
3QFY
17
4QFY
17
(%)
4.9
5.7
4.9
5.7
2.6 3.0
1.9
3.8
2.8 2.8
(0.1) (1.0)
-
1.0
2.0
3.0
4.0
5.0
6.0
Aug
-16
Sep-
16
Oct
-16
No
v-1
6
Dec
-16
Jan-
17
Feb-
17
Mar
-17
Apr
-17
May
-17
Jun-
17
(%)
5.1
4.3 4.2 3.6 3.4 3.2
3.7 3.9
3.0
2.2
1.5
2.4
-
1.0
2.0
3.0
4.0
5.0
6.0
Aug
-16
Sep-
16
Oct
-16
Nov
-16
Dec
-16
Jan-
17
Feb-
17
Mar
-17
Apr
-17
May
-17
Jun-
17
Jul-1
7
(%)
40.0
42.0
44.0
46.0
48.0
50.0
52.0
54.0
56.0
Jun-
16
Jul-1
6
Aug
-16
Sep-
16
Oct
-16
No
v-1
6
Dec
-16
Jan-
17
Feb-
17
Mar
-17
Apr
-17
May
-17
Jun-
17
Jul-1
7
Mfg. PMI Services PMI
(30.0)
(20.0)
(10.0)
0.0
10.0
20.0
30.0
40.0
50.0
60.0
Jul-1
6
Aug
-16
Sep-
16
Oct
-16
No
v-1
6
Dec
-16
Jan-
17
Feb-
17
Mar
-17
Apr
-17
May
-17
Jun-
17
Exports yoy growth Imports yoy growth(%)
3.00
3.50
4.00
4.50
5.00
5.50
6.00
6.50
Oct
-16
Oct
-16
Nov
-16
Dec
-16
Dec
-16
Jan-
17
Feb-
17
Mar
-17
Mar
-17
Apr
-17
May
-17
May
-17
Jun-
17
Jul-1
7
Jul-1
7
Repo rate Reverse Repo rate CRR (%)
Market Outlook August 17, 2017
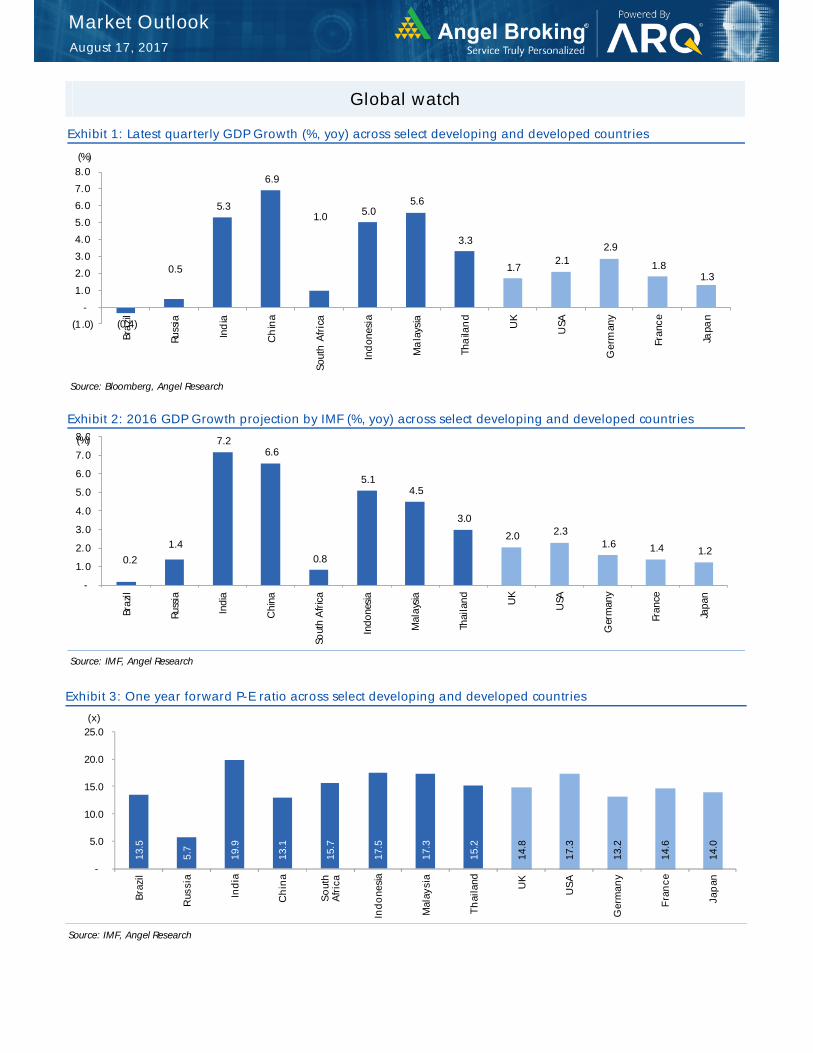
Global watch
Exhibit 1: Latest quarterly GDP Growth (%, yoy) across select developing and developed countries
Source: Bloomberg, Angel Research
Exhibit 2: 2016 GDP Growth projection by IMF (%, yoy) across select developing and developed countries
Source: IMF, Angel Research
Exhibit 3: One year forward P-E ratio across select developing and developed countries
Source: IMF, Angel Research
(0.4)
0.5
5.3
6.9
1.0 5.0 5.6
3.3
1.7 2.1
2.9
1.8 1.3
(1.0)
-
1.0
2.0
3.0
4.0
5.0
6.0
7.0
8.0
Bra
zil
Russ
ia
Ind
ia
Ch
ina
Sout
h A
fric
a
Ind
ones
ia
Ma
lays
ia
Tha
ilan
d
UK
USA
Ger
man
y
Fran
ce
Japa
n
(%)
0.2
1.4
7.2 6.6
0.8
5.1 4.5
3.0
2.0 2.3 1.6 1.4 1.2
-
1.0
2.0
3.0
4.0
5.0
6.0
7.0
8.0
Braz
il
Russ
ia
Indi
a
Chi
na
Sout
h A
fric
a
Indo
nesi
a
Mal
aysi
a
Thai
land UK
USA
Ger
man
y
Fran
ce
Japa
n
(%)
13.5
5.7
19.9
13.1
15.7
17.5
17.3
15.2
14.8
17.3
13.2
14.6
14.0
-
5.0
10.0
15.0
20.0
25.0
Braz
il
Rus
sia
Indi
a
Chi
na
Sout
h Af
rica
Indo
nesia
Mal
aysi
a
Thai
land UK
USA
Ger
man
y
Fran
ce
Japa
n(x)
Market Outlook August 17, 2017
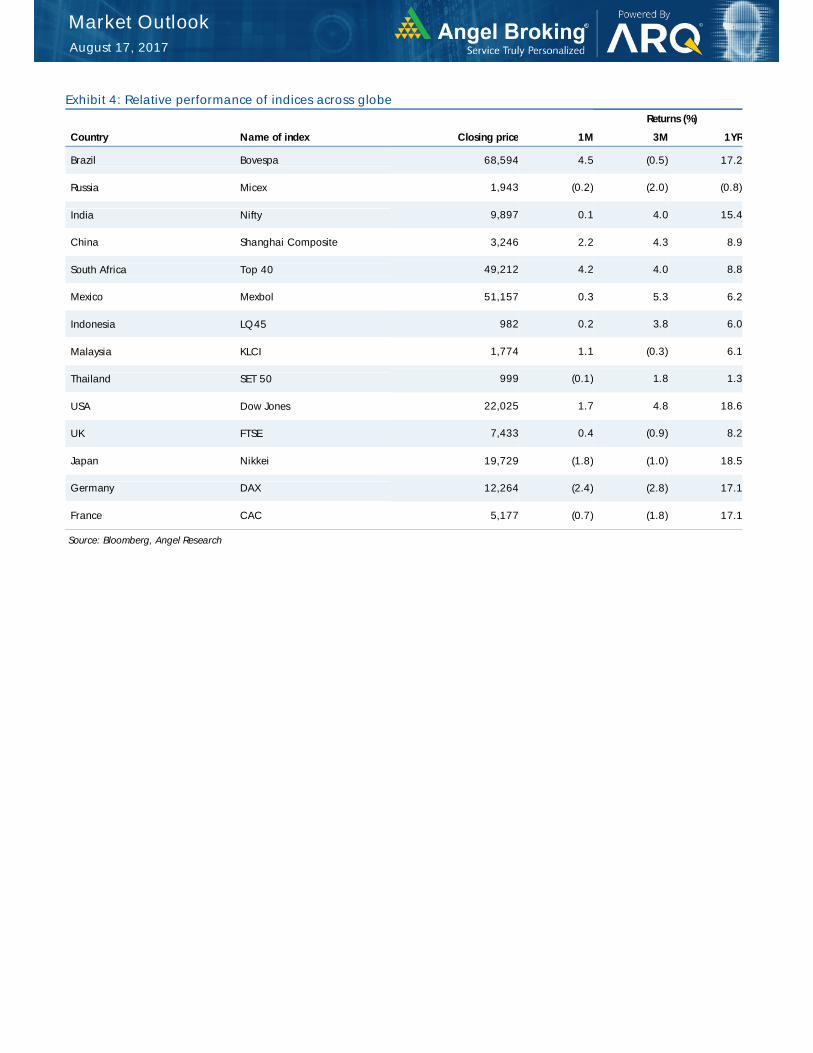
Exhibit 4: Relative performance of indices across globe
Returns (%)
Country Name of index Closing price 1M 3M 1YR
Brazil Bovespa 68,594 4.5 (0.5) 17.2
Russia Micex 1,943 (0.2) (2.0) (0.8)
India Nifty 9,897 0.1 4.0 15.4
China Shanghai Composite 3,246 2.2 4.3 8.9
South Africa Top 40 49,212 4.2 4.0 8.8
Mexico Mexbol 51,157 0.3 5.3 6.2
Indonesia LQ45 982 0.2 3.8 6.0
Malaysia KLCI 1,774 1.1 (0.3) 6.1
Thailand SET 50 999 (0.1) 1.8 1.3
USA Dow Jones 22,025 1.7 4.8 18.6
UK FTSE 7,433 0.4 (0.9) 8.2
Japan Nikkei 19,729 (1.8) (1.0) 18.5
Germany DAX 12,264 (2.4) (2.8) 17.1
France CAC 5,177 (0.7) (1.8) 17.1
Source: Bloomberg, Angel Research
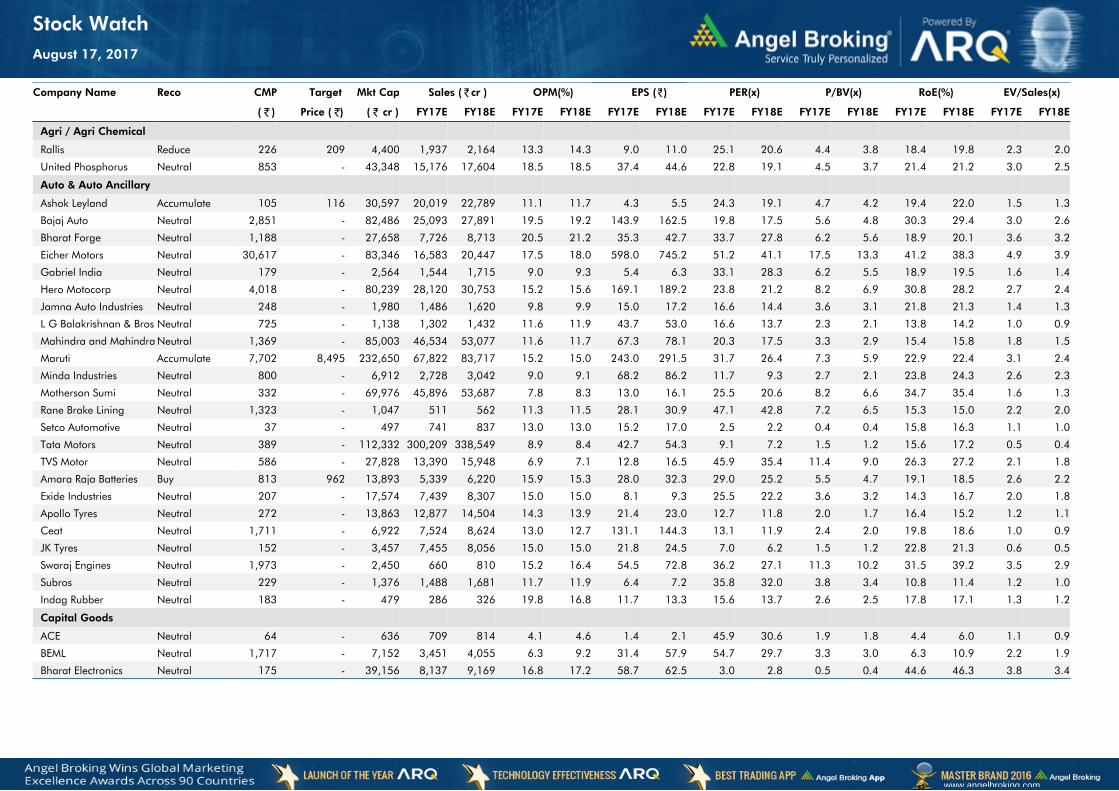
Company Name Reco CMP Target Mkt Cap Sales ( ₹cr ) OPM(%) EPS (₹) PER(x) P/BV(x) RoE(%) EV/Sales(x)
( ₹ ) Price ( ₹) ( ₹ cr ) FY17E FY18E FY17E FY18E FY17E FY18E FY17E FY18E FY17E FY18E FY17E FY18E FY17E FY18E
Agri / Agri Chemical
Rallis Reduce 226 209 4,400 1,937 2,164 13.3 14.3 9.0 11.0 25.1 20.6 4.4 3.8 18.4 19.8 2.3 2.0
United Phosphorus Neutral 853 - 43,348 15,176 17,604 18.5 18.5 37.4 44.6 22.8 19.1 4.5 3.7 21.4 21.2 3.0 2.5
Auto & Auto Ancillary
Ashok Leyland Accumulate 105 116 30,597 20,019 22,789 11.1 11.7 4.3 5.5 24.3 19.1 4.7 4.2 19.4 22.0 1.5 1.3
Bajaj Auto Neutral 2,851 - 82,486 25,093 27,891 19.5 19.2 143.9 162.5 19.8 17.5 5.6 4.8 30.3 29.4 3.0 2.6
Bharat Forge Neutral 1,188 - 27,658 7,726 8,713 20.5 21.2 35.3 42.7 33.7 27.8 6.2 5.6 18.9 20.1 3.6 3.2
Eicher Motors Neutral 30,617 - 83,346 16,583 20,447 17.5 18.0 598.0 745.2 51.2 41.1 17.5 13.3 41.2 38.3 4.9 3.9
Gabriel India Neutral 179 - 2,564 1,544 1,715 9.0 9.3 5.4 6.3 33.1 28.3 6.2 5.5 18.9 19.5 1.6 1.4
Hero Motocorp Neutral 4,018 - 80,239 28,120 30,753 15.2 15.6 169.1 189.2 23.8 21.2 8.2 6.9 30.8 28.2 2.7 2.4
Jamna Auto Industries Neutral 248 - 1,980 1,486 1,620 9.8 9.9 15.0 17.2 16.6 14.4 3.6 3.1 21.8 21.3 1.4 1.3
L G Balakrishnan & Bros Neutral 725 - 1,138 1,302 1,432 11.6 11.9 43.7 53.0 16.6 13.7 2.3 2.1 13.8 14.2 1.0 0.9
Mahindra and Mahindra Neutral 1,369 - 85,003 46,534 53,077 11.6 11.7 67.3 78.1 20.3 17.5 3.3 2.9 15.4 15.8 1.8 1.5
Maruti Accumulate 7,702 8,495 232,650 67,822 83,717 15.2 15.0 243.0 291.5 31.7 26.4 7.3 5.9 22.9 22.4 3.1 2.4
Minda Industries Neutral 800 - 6,912 2,728 3,042 9.0 9.1 68.2 86.2 11.7 9.3 2.7 2.1 23.8 24.3 2.6 2.3
Motherson Sumi Neutral 332 - 69,976 45,896 53,687 7.8 8.3 13.0 16.1 25.5 20.6 8.2 6.6 34.7 35.4 1.6 1.3
Rane Brake Lining Neutral 1,323 - 1,047 511 562 11.3 11.5 28.1 30.9 47.1 42.8 7.2 6.5 15.3 15.0 2.2 2.0
Setco Automotive Neutral 37 - 497 741 837 13.0 13.0 15.2 17.0 2.5 2.2 0.4 0.4 15.8 16.3 1.1 1.0
Tata Motors Neutral 389 - 112,332 300,209 338,549 8.9 8.4 42.7 54.3 9.1 7.2 1.5 1.2 15.6 17.2 0.5 0.4
TVS Motor Neutral 586 - 27,828 13,390 15,948 6.9 7.1 12.8 16.5 45.9 35.4 11.4 9.0 26.3 27.2 2.1 1.8
Amara Raja Batteries Buy 813 962 13,893 5,339 6,220 15.9 15.3 28.0 32.3 29.0 25.2 5.5 4.7 19.1 18.5 2.6 2.2
Exide Industries Neutral 207 - 17,574 7,439 8,307 15.0 15.0 8.1 9.3 25.5 22.2 3.6 3.2 14.3 16.7 2.0 1.8
Apollo Tyres Neutral 272 - 13,863 12,877 14,504 14.3 13.9 21.4 23.0 12.7 11.8 2.0 1.7 16.4 15.2 1.2 1.1
Ceat Neutral 1,711 - 6,922 7,524 8,624 13.0 12.7 131.1 144.3 13.1 11.9 2.4 2.0 19.8 18.6 1.0 0.9
JK Tyres Neutral 152 - 3,457 7,455 8,056 15.0 15.0 21.8 24.5 7.0 6.2 1.5 1.2 22.8 21.3 0.6 0.5
Swaraj Engines Neutral 1,973 - 2,450 660 810 15.2 16.4 54.5 72.8 36.2 27.1 11.3 10.2 31.5 39.2 3.5 2.9
Subros Neutral 229 - 1,376 1,488 1,681 11.7 11.9 6.4 7.2 35.8 32.0 3.8 3.4 10.8 11.4 1.2 1.0
Indag Rubber Neutral 183 - 479 286 326 19.8 16.8 11.7 13.3 15.6 13.7 2.6 2.5 17.8 17.1 1.3 1.2
Capital Goods
ACE Neutral 64 - 636 709 814 4.1 4.6 1.4 2.1 45.9 30.6 1.9 1.8 4.4 6.0 1.1 0.9
BEML Neutral 1,717 - 7,152 3,451 4,055 6.3 9.2 31.4 57.9 54.7 29.7 3.3 3.0 6.3 10.9 2.2 1.9
Bharat Electronics Neutral 175 - 39,156 8,137 9,169 16.8 17.2 58.7 62.5 3.0 2.8 0.5 0.4 44.6 46.3 3.8 3.4
www.angelbroking.com
Stock WatchAugust 17, 2017
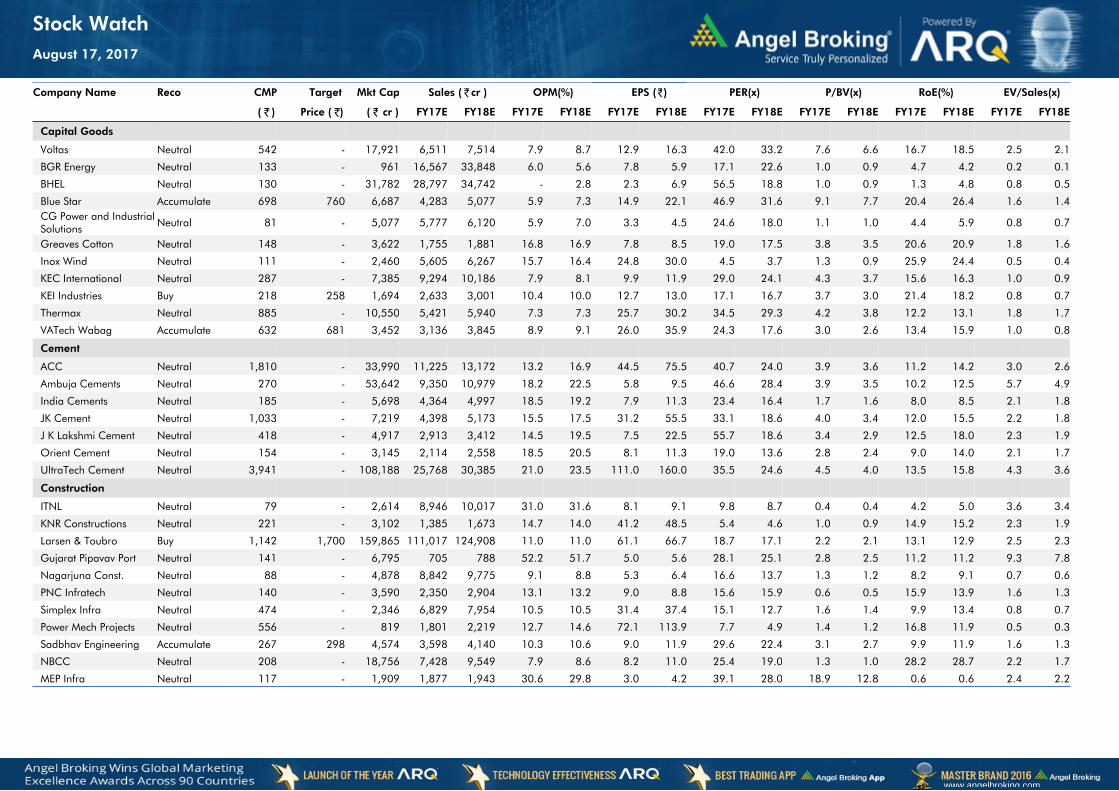
Company Name Reco CMP Target Mkt Cap Sales ( ₹cr ) OPM(%) EPS (₹) PER(x) P/BV(x) RoE(%) EV/Sales(x)
( ₹ ) Price ( ₹) ( ₹ cr ) FY17E FY18E FY17E FY18E FY17E FY18E FY17E FY18E FY17E FY18E FY17E FY18E FY17E FY18E
Capital Goods
Voltas Neutral 542 - 17,921 6,511 7,514 7.9 8.7 12.9 16.3 42.0 33.2 7.6 6.6 16.7 18.5 2.5 2.1
BGR Energy Neutral 133 - 961 16,567 33,848 6.0 5.6 7.8 5.9 17.1 22.6 1.0 0.9 4.7 4.2 0.2 0.1
BHEL Neutral 130 - 31,782 28,797 34,742 - 2.8 2.3 6.9 56.5 18.8 1.0 0.9 1.3 4.8 0.8 0.5
Blue Star Accumulate 698 760 6,687 4,283 5,077 5.9 7.3 14.9 22.1 46.9 31.6 9.1 7.7 20.4 26.4 1.6 1.4CG Power and Industrial Solutions Neutral 81 - 5,077 5,777 6,120 5.9 7.0 3.3 4.5 24.6 18.0 1.1 1.0 4.4 5.9 0.8 0.7
Greaves Cotton Neutral 148 - 3,622 1,755 1,881 16.8 16.9 7.8 8.5 19.0 17.5 3.8 3.5 20.6 20.9 1.8 1.6
Inox Wind Neutral 111 - 2,460 5,605 6,267 15.7 16.4 24.8 30.0 4.5 3.7 1.3 0.9 25.9 24.4 0.5 0.4
KEC International Neutral 287 - 7,385 9,294 10,186 7.9 8.1 9.9 11.9 29.0 24.1 4.3 3.7 15.6 16.3 1.0 0.9
KEI Industries Buy 218 258 1,694 2,633 3,001 10.4 10.0 12.7 13.0 17.1 16.7 3.7 3.0 21.4 18.2 0.8 0.7
Thermax Neutral 885 - 10,550 5,421 5,940 7.3 7.3 25.7 30.2 34.5 29.3 4.2 3.8 12.2 13.1 1.8 1.7
VATech Wabag Accumulate 632 681 3,452 3,136 3,845 8.9 9.1 26.0 35.9 24.3 17.6 3.0 2.6 13.4 15.9 1.0 0.8
Cement
ACC Neutral 1,810 - 33,990 11,225 13,172 13.2 16.9 44.5 75.5 40.7 24.0 3.9 3.6 11.2 14.2 3.0 2.6
Ambuja Cements Neutral 270 - 53,642 9,350 10,979 18.2 22.5 5.8 9.5 46.6 28.4 3.9 3.5 10.2 12.5 5.7 4.9
India Cements Neutral 185 - 5,698 4,364 4,997 18.5 19.2 7.9 11.3 23.4 16.4 1.7 1.6 8.0 8.5 2.1 1.8
JK Cement Neutral 1,033 - 7,219 4,398 5,173 15.5 17.5 31.2 55.5 33.1 18.6 4.0 3.4 12.0 15.5 2.2 1.8
J K Lakshmi Cement Neutral 418 - 4,917 2,913 3,412 14.5 19.5 7.5 22.5 55.7 18.6 3.4 2.9 12.5 18.0 2.3 1.9
Orient Cement Neutral 154 - 3,145 2,114 2,558 18.5 20.5 8.1 11.3 19.0 13.6 2.8 2.4 9.0 14.0 2.1 1.7
UltraTech Cement Neutral 3,941 - 108,188 25,768 30,385 21.0 23.5 111.0 160.0 35.5 24.6 4.5 4.0 13.5 15.8 4.3 3.6
Construction
ITNL Neutral 79 - 2,614 8,946 10,017 31.0 31.6 8.1 9.1 9.8 8.7 0.4 0.4 4.2 5.0 3.6 3.4
KNR Constructions Neutral 221 - 3,102 1,385 1,673 14.7 14.0 41.2 48.5 5.4 4.6 1.0 0.9 14.9 15.2 2.3 1.9
Larsen & Toubro Buy 1,142 1,700 159,865 111,017 124,908 11.0 11.0 61.1 66.7 18.7 17.1 2.2 2.1 13.1 12.9 2.5 2.3
Gujarat Pipavav Port Neutral 141 - 6,795 705 788 52.2 51.7 5.0 5.6 28.1 25.1 2.8 2.5 11.2 11.2 9.3 7.8
Nagarjuna Const. Neutral 88 - 4,878 8,842 9,775 9.1 8.8 5.3 6.4 16.6 13.7 1.3 1.2 8.2 9.1 0.7 0.6
PNC Infratech Neutral 140 - 3,590 2,350 2,904 13.1 13.2 9.0 8.8 15.6 15.9 0.6 0.5 15.9 13.9 1.6 1.3
Simplex Infra Neutral 474 - 2,346 6,829 7,954 10.5 10.5 31.4 37.4 15.1 12.7 1.6 1.4 9.9 13.4 0.8 0.7
Power Mech Projects Neutral 556 - 819 1,801 2,219 12.7 14.6 72.1 113.9 7.7 4.9 1.4 1.2 16.8 11.9 0.5 0.3
Sadbhav Engineering Accumulate 267 298 4,574 3,598 4,140 10.3 10.6 9.0 11.9 29.6 22.4 3.1 2.7 9.9 11.9 1.6 1.3
NBCC Neutral 208 - 18,756 7,428 9,549 7.9 8.6 8.2 11.0 25.4 19.0 1.3 1.0 28.2 28.7 2.2 1.7
MEP Infra Neutral 117 - 1,909 1,877 1,943 30.6 29.8 3.0 4.2 39.1 28.0 18.9 12.8 0.6 0.6 2.4 2.2
www.angelbroking.com
Stock WatchAugust 17, 2017
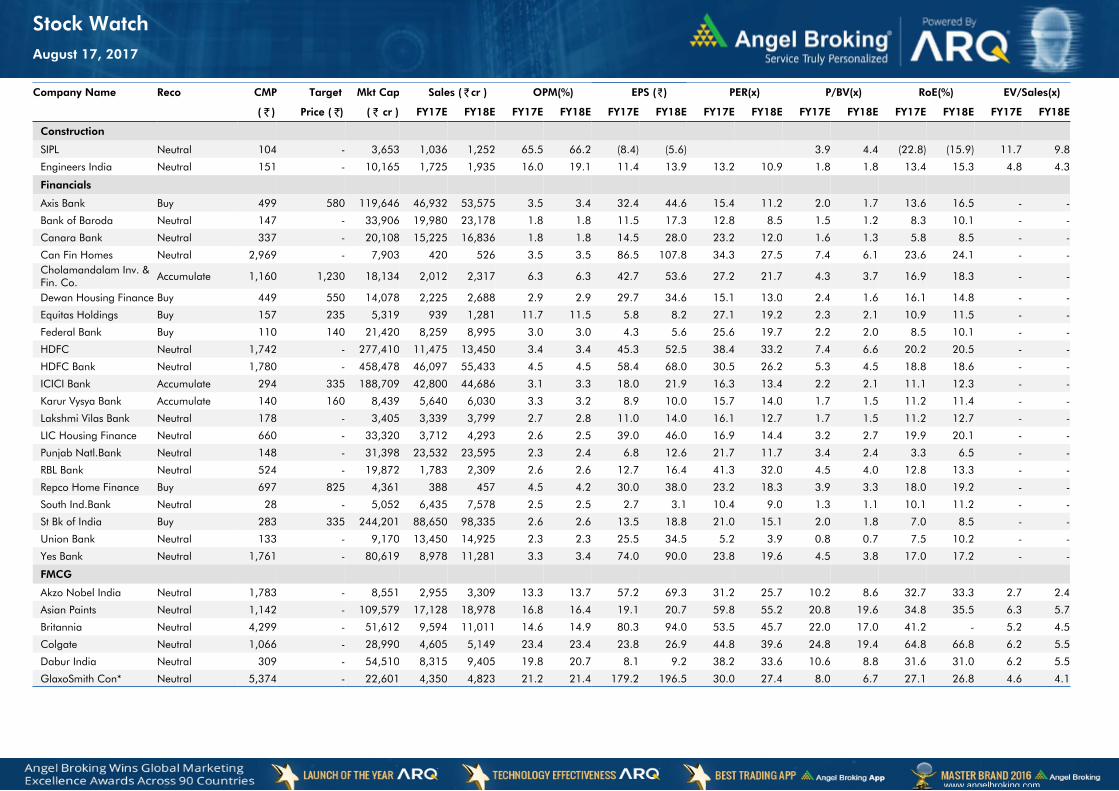
Company Name Reco CMP Target Mkt Cap Sales ( ₹cr ) OPM(%) EPS (₹) PER(x) P/BV(x) RoE(%) EV/Sales(x)
( ₹ ) Price ( ₹) ( ₹ cr ) FY17E FY18E FY17E FY18E FY17E FY18E FY17E FY18E FY17E FY18E FY17E FY18E FY17E FY18E
Construction
SIPL Neutral 104 - 3,653 1,036 1,252 65.5 66.2 (8.4) (5.6) 3.9 4.4 (22.8) (15.9) 11.7 9.8
Engineers India Neutral 151 - 10,165 1,725 1,935 16.0 19.1 11.4 13.9 13.2 10.9 1.8 1.8 13.4 15.3 4.8 4.3
Financials
Axis Bank Buy 499 580 119,646 46,932 53,575 3.5 3.4 32.4 44.6 15.4 11.2 2.0 1.7 13.6 16.5 - -
Bank of Baroda Neutral 147 - 33,906 19,980 23,178 1.8 1.8 11.5 17.3 12.8 8.5 1.5 1.2 8.3 10.1 - -
Canara Bank Neutral 337 - 20,108 15,225 16,836 1.8 1.8 14.5 28.0 23.2 12.0 1.6 1.3 5.8 8.5 - -
Can Fin Homes Neutral 2,969 - 7,903 420 526 3.5 3.5 86.5 107.8 34.3 27.5 7.4 6.1 23.6 24.1 - -Cholamandalam Inv. & Fin. Co. Accumulate 1,160 1,230 18,134 2,012 2,317 6.3 6.3 42.7 53.6 27.2 21.7 4.3 3.7 16.9 18.3 - -
Dewan Housing Finance Buy 449 550 14,078 2,225 2,688 2.9 2.9 29.7 34.6 15.1 13.0 2.4 1.6 16.1 14.8 - -
Equitas Holdings Buy 157 235 5,319 939 1,281 11.7 11.5 5.8 8.2 27.1 19.2 2.3 2.1 10.9 11.5 - -
Federal Bank Buy 110 140 21,420 8,259 8,995 3.0 3.0 4.3 5.6 25.6 19.7 2.2 2.0 8.5 10.1 - -
HDFC Neutral 1,742 - 277,410 11,475 13,450 3.4 3.4 45.3 52.5 38.4 33.2 7.4 6.6 20.2 20.5 - -
HDFC Bank Neutral 1,780 - 458,478 46,097 55,433 4.5 4.5 58.4 68.0 30.5 26.2 5.3 4.5 18.8 18.6 - -
ICICI Bank Accumulate 294 335 188,709 42,800 44,686 3.1 3.3 18.0 21.9 16.3 13.4 2.2 2.1 11.1 12.3 - -
Karur Vysya Bank Accumulate 140 160 8,439 5,640 6,030 3.3 3.2 8.9 10.0 15.7 14.0 1.7 1.5 11.2 11.4 - -
Lakshmi Vilas Bank Neutral 178 - 3,405 3,339 3,799 2.7 2.8 11.0 14.0 16.1 12.7 1.7 1.5 11.2 12.7 - -
LIC Housing Finance Neutral 660 - 33,320 3,712 4,293 2.6 2.5 39.0 46.0 16.9 14.4 3.2 2.7 19.9 20.1 - -
Punjab Natl.Bank Neutral 148 - 31,398 23,532 23,595 2.3 2.4 6.8 12.6 21.7 11.7 3.4 2.4 3.3 6.5 - -
RBL Bank Neutral 524 - 19,872 1,783 2,309 2.6 2.6 12.7 16.4 41.3 32.0 4.5 4.0 12.8 13.3 - -
Repco Home Finance Buy 697 825 4,361 388 457 4.5 4.2 30.0 38.0 23.2 18.3 3.9 3.3 18.0 19.2 - -
South Ind.Bank Neutral 28 - 5,052 6,435 7,578 2.5 2.5 2.7 3.1 10.4 9.0 1.3 1.1 10.1 11.2 - -
St Bk of India Buy 283 335 244,201 88,650 98,335 2.6 2.6 13.5 18.8 21.0 15.1 2.0 1.8 7.0 8.5 - -
Union Bank Neutral 133 - 9,170 13,450 14,925 2.3 2.3 25.5 34.5 5.2 3.9 0.8 0.7 7.5 10.2 - -
Yes Bank Neutral 1,761 - 80,619 8,978 11,281 3.3 3.4 74.0 90.0 23.8 19.6 4.5 3.8 17.0 17.2 - -
FMCG
Akzo Nobel India Neutral 1,783 - 8,551 2,955 3,309 13.3 13.7 57.2 69.3 31.2 25.7 10.2 8.6 32.7 33.3 2.7 2.4
Asian Paints Neutral 1,142 - 109,579 17,128 18,978 16.8 16.4 19.1 20.7 59.8 55.2 20.8 19.6 34.8 35.5 6.3 5.7
Britannia Neutral 4,299 - 51,612 9,594 11,011 14.6 14.9 80.3 94.0 53.5 45.7 22.0 17.0 41.2 - 5.2 4.5
Colgate Neutral 1,066 - 28,990 4,605 5,149 23.4 23.4 23.8 26.9 44.8 39.6 24.8 19.4 64.8 66.8 6.2 5.5
Dabur India Neutral 309 - 54,510 8,315 9,405 19.8 20.7 8.1 9.2 38.2 33.6 10.6 8.8 31.6 31.0 6.2 5.5
GlaxoSmith Con* Neutral 5,374 - 22,601 4,350 4,823 21.2 21.4 179.2 196.5 30.0 27.4 8.0 6.7 27.1 26.8 4.6 4.1
www.angelbroking.com
Stock WatchAugust 17, 2017
Company Name Reco CMP Target Mkt Cap Sales ( ₹cr ) OPM(%) EPS (₹) PER(x) P/BV(x) RoE(%) EV/Sales(x)
( ₹ ) Price ( ₹) ( ₹ cr ) FY17E FY18E FY17E FY18E FY17E FY18E FY17E FY18E FY17E FY18E FY17E FY18E FY17E FY18E
FMCG
Godrej Consumer Neutral 923 - 62,876 10,235 11,428 18.4 18.6 41.1 44.2 22.5 20.9 5.0 4.2 24.9 24.8 6.2 5.5
HUL Neutral 1,187 - 256,911 35,252 38,495 17.8 17.8 20.7 22.4 57.5 53.0 54.9 47.1 95.6 88.9 7.1 6.5
ITC Neutral 279 - 339,995 40,059 44,439 38.3 39.2 9.0 10.1 31.1 27.6 8.7 7.6 27.8 27.5 8.0 7.2
Marico Neutral 317 - 40,934 6,430 7,349 18.8 19.5 6.4 7.7 49.6 41.2 15.0 12.6 33.2 32.5 6.2 5.4
Nestle* Neutral 6,672 - 64,326 10,073 11,807 20.7 21.5 124.8 154.2 53.5 43.3 22.0 19.7 34.8 36.7 6.2 5.3
Tata Global Neutral 194 - 12,234 8,675 9,088 9.8 9.8 7.4 8.2 26.2 23.6 2.1 2.0 7.9 8.1 1.3 1.3Procter & Gamble Hygiene Neutral 8,192 - 26,591 2,939 3,342 23.2 23.0 146.2 163.7 56.0 50.0 14.2 11.8 25.3 23.5 8.6 7.5
IT
HCL Tech^ Buy 864 1,014 123,256 46,723 52,342 22.1 20.9 60.0 62.8 14.4 13.8 3.6 3.1 25.3 22.4 2.4 2.0
Infosys Buy 977 1,179 224,366 68,484 73,963 26.0 26.0 63.0 64.0 15.5 15.3 3.3 3.0 20.8 19.7 3.0 2.6
TCS Accumulate 2,491 2,651 490,843 117,966 127,403 27.5 27.6 134.3 144.5 18.6 17.2 5.5 5.1 29.8 29.7 3.8 3.5
Tech Mahindra Buy 418 533 40,799 29,141 31,051 14.4 15.0 32.3 35.6 13.0 11.8 2.2 2.0 17.1 17.0 1.3 1.1
Wipro Neutral 290 - 141,126 55,421 58,536 20.3 20.3 35.1 36.5 8.3 8.0 1.4 1.2 19.2 14.6 2.0 1.7
Media
D B Corp Neutral 364 - 6,692 2,297 2,590 27.4 28.2 21.0 23.4 17.3 15.6 4.0 3.5 23.7 23.1 2.7 2.3
HT Media Neutral 87 - 2,028 2,693 2,991 12.6 12.9 7.9 9.0 11.0 9.7 0.9 0.9 7.8 8.3 0.3 0.2
Jagran Prakashan Buy 173 225 5,662 2,283 2,555 28.0 28.0 10.6 12.3 16.3 14.1 3.5 3.0 21.4 21.4 2.5 2.2
Sun TV Network Neutral 748 - 29,470 2,850 3,265 70.1 71.0 26.2 30.4 28.5 24.6 7.3 6.5 24.3 25.6 9.9 8.5Hindustan Media Ventures Neutral 269 - 1,977 1,016 1,138 24.3 25.2 27.3 30.1 9.9 9.0 1.9 1.7 16.2 15.8 1.3 1.1
TV Today Network Buy 244 344 1,458 608 667 21.5 22.3 15.7 19.2 15.6 12.7 2.4 2.0 16.1 16.0 2.0 1.7
Music Broadcast Limited Buy 373 434 2,125 271 317 91.0 109.0 6.0 10.0 62.1 37.3 3.9 3.5 6.5 9.3 7.4 6.1
Metals & Mining
Coal India Neutral 237 - 147,147 84,638 94,297 21.4 22.3 24.5 27.1 9.7 8.8 4.0 3.8 42.6 46.0 1.3 1.1
Hind. Zinc Neutral 291 - 122,788 14,252 18,465 55.9 48.3 15.8 21.5 18.4 13.5 3.0 2.6 17.0 20.7 8.6 6.7
Hindalco Neutral 234 - 52,408 107,899 112,095 7.4 8.2 9.2 13.0 25.4 18.0 1.2 1.2 4.8 6.6 1.0 0.9
JSW Steel Neutral 238 - 57,506 53,201 58,779 16.1 16.2 130.6 153.7 1.8 1.6 0.3 0.2 14.0 14.4 1.8 1.6
NMDC Neutral 121 - 38,346 6,643 7,284 44.4 47.7 7.1 7.7 17.1 15.7 1.5 1.4 8.8 9.2 3.5 3.2
SAIL Neutral 59 - 24,429 47,528 53,738 (0.7) 2.1 (1.9) 2.6 22.8 0.6 0.6 (1.6) 3.9 1.4 1.2
Vedanta Neutral 297 - 110,475 71,744 81,944 19.2 21.7 13.4 20.1 22.2 14.8 1.9 1.7 8.4 11.3 1.9 1.6
Tata Steel Neutral 630 - 61,162 121,374 121,856 7.2 8.4 18.6 34.3 33.9 18.4 2.1 1.9 6.1 10.1 1.1 1.1
Oil & Gas
GAIL Neutral 370 - 62,620 56,220 65,198 9.3 10.1 27.1 33.3 13.7 11.1 1.3 1.2 9.3 10.7 1.3 1.1
ONGC Neutral 161 - 206,615 137,222 152,563 15.0 21.8 19.5 24.1 8.3 6.7 0.7 0.7 8.5 10.1 1.8 1.6
www.angelbroking.com
Stock WatchAugust 17, 2017
Company Name Reco CMP Target Mkt Cap Sales ( ₹cr ) OPM(%) EPS (₹) PER(x) P/BV(x) RoE(%) EV/Sales(x)
( ₹ ) Price ( ₹) ( ₹ cr ) FY17E FY18E FY17E FY18E FY17E FY18E FY17E FY18E FY17E FY18E FY17E FY18E FY17E FY18E
Oil & Gas
Indian Oil Corp Neutral 422 - 205,065 373,359 428,656 5.9 5.5 54.0 59.3 7.8 7.1 1.2 1.1 16.0 15.6 0.7 0.6
Reliance Industries Neutral 1,567 - 509,557 301,963 358,039 12.1 12.6 87.7 101.7 17.9 15.4 1.8 1.7 10.7 11.3 2.2 1.8
Pharmaceuticals
Alembic Pharma Buy 515 600 9,710 3,101 3,966 19.7 20.5 21.4 25.5 24.1 20.2 5.1 4.2 23.0 22.8 3.1 2.3
Alkem Laboratories Ltd Buy 1,815 2,161 21,705 5,853 6,901 17.1 18.4 74.6 85.0 24.3 21.4 5.1 4.3 21.1 20.2 3.7 3.1
Aurobindo Pharma Buy 714 823 41,844 14,845 17,086 21.5 22.1 39.4 44.7 18.1 16.0 4.5 3.5 27.6 24.7 3.0 2.6
Aventis* Neutral 4,127 - 9,504 2,206 2,508 16.6 16.8 128.9 139.9 32.0 29.5 5.5 4.3 21.6 23.5 4.1 3.4
Cadila Healthcare Reduce 484 450 49,508 9,220 11,584 18.4 20.3 14.5 18.7 33.4 25.9 7.1 5.8 23.5 24.6 5.7 4.3
Cipla Sell 590 461 47,492 14,281 16,619 15.4 16.2 12.5 19.7 47.2 30.0 3.8 3.4 8.4 12.0 3.5 3.0
Dr Reddy's Neutral 1,999 - 33,131 14,081 15,937 16.1 18.6 72.6 105.9 27.5 18.9 2.7 2.4 9.6 13.6 2.6 2.3
Dishman Pharma Sell 143 1,718 1,890 22.7 22.8 9.5 11.3 10.1 10.9 3.3 2.9
GSK Pharma* Neutral 2,365 - 20,033 2,927 3,290 11.8 16.2 34.4 49.6 68.8 47.7 10.0 10.4 13.9 21.3 6.6 6.0
Indoco Remedies Sell 193 153 1,774 1,067 1,154 12.1 14.9 8.4 11.3 22.9 17.0 2.7 2.4 12.6 15.0 1.9 1.7
Ipca labs Buy 420 620 5,295 3,211 3,593 13.9 14.5 15.4 19.4 27.3 21.6 2.2 2.0 8.2 9.5 1.8 1.5
Lupin Buy 962 1,467 43,467 17,120 18,657 24.1 24.1 56.9 61.1 16.9 15.8 3.2 2.7 20.7 18.6 2.8 2.3
Natco Pharma Buy 763 1,060 13,308 2,065 1,988 33.1 33.7 27.9 25.7 27.4 29.7 8.0 6.8 29.2 22.9 6.5 6.6
Sun Pharma Buy 485 712 116,411 30,264 32,899 29.0 26.9 32.7 31.6 14.8 15.4 3.2 2.7 22.2 18.7 3.6 3.2
Power
Tata Power Neutral 82 - 22,193 36,916 39,557 17.4 27.1 5.1 6.3 16.1 13.0 1.4 1.3 9.0 10.3 1.6 1.5
NTPC Neutral 170 - 140,255 86,605 95,545 17.5 20.8 11.8 13.4 14.4 12.7 1.5 1.4 10.5 11.1 3.0 2.9
Power Grid Neutral 221 - 115,435 25,315 29,193 88.2 88.7 14.2 17.2 15.6 12.9 2.4 2.1 15.2 16.1 9.2 8.3
Real Estate
Prestige Estate Neutral 267 - 10,029 4,707 5,105 25.2 26.0 10.3 13.0 26.0 20.6 2.1 1.9 10.3 10.2 3.3 2.9
MLIFE Buy 415 522 2,132 1,152 1,300 22.7 24.6 29.9 35.8 13.9 11.6 1.0 1.0 7.6 8.6 2.6 2.2
Telecom
Bharti Airtel Neutral 407 - 162,554 105,086 114,808 34.5 34.7 12.2 16.4 33.3 24.8 2.3 2.1 6.8 8.4 2.5 2.2
Idea Cellular Neutral 87 - 31,360 40,133 43,731 37.2 37.1 6.4 6.5 13.6 13.4 1.1 1.1 8.2 7.6 1.8 1.5
zOthers
Abbott India Neutral 4,330 - 9,201 3,153 3,583 14.1 14.4 152.2 182.7 28.5 23.7 139.7 119.3 25.6 26.1 2.6 2.3
Asian Granito Buy 403 480 1,212 1,066 1,169 11.6 12.5 13.0 16.0 31.0 25.2 3.0 2.7 9.5 10.7 1.4 1.3
Bajaj Electricals Buy 315 395 3,196 4,801 5,351 5.7 6.2 10.4 13.7 30.2 23.0 3.7 3.3 12.4 14.5 0.7 0.6
Banco Products (India) Neutral 205 - 1,465 1,353 1,471 12.3 12.4 14.5 16.3 14.1 12.6 19.5 17.6 14.5 14.6 1.0 109.7Coffee Day Enterprises Ltd Neutral 243 - 5,008 2,964 3,260 20.5 21.2 4.7 8.0 - 30.4 2.8 2.6 5.5 8.5 2.1 1.9
Competent Automobiles Neutral 207 - 133 1,137 1,256 3.1 2.7 28.0 23.6 7.4 8.8 39.8 36.0 14.3 11.5 0.1 0.1
www.angelbroking.com
Stock WatchAugust 17, 2017
Company Name Reco CMP Target Mkt Cap Sales ( ₹cr ) OPM(%) EPS (₹) PER(x) P/BV(x) RoE(%) EV/Sales(x)
( ₹ ) Price ( ₹) ( ₹ cr ) FY17E FY18E FY17E FY18E FY17E FY18E FY17E FY18E FY17E FY18E FY17E FY18E FY17E FY18E
zOthers
Elecon Engineering Neutral 48 - 540 1,482 1,660 13.7 14.5 3.9 5.8 12.3 8.3 2.9 2.7 7.8 10.9 0.7 0.6
Finolex Cables Neutral 526 - 8,041 2,883 3,115 12.0 12.1 14.2 18.6 37.0 28.3 19.7 17.2 15.8 14.6 2.5 2.2
Garware Wall Ropes Neutral 884 - 1,933 863 928 15.1 15.2 36.4 39.4 24.3 22.4 4.4 3.8 17.5 15.9 2.2 2.0
Goodyear India* Neutral 827 - 1,909 1,598 1,704 10.4 10.2 49.4 52.6 16.8 15.7 77.3 67.8 18.2 17.0 0.9 124.5
Hitachi Neutral 2,016 - 5,483 2,081 2,433 8.8 8.9 33.4 39.9 60.4 50.5 48.7 40.6 22.1 21.4 2.6 2.2
HSIL Neutral 352 - 2,546 2,384 2,515 15.8 16.3 15.3 19.4 23.0 18.2 22.9 19.7 7.8 9.3 1.2 1.1
Interglobe Aviation Neutral 1,313 - 47,496 21,122 26,005 14.5 27.6 110.7 132.1 11.9 9.9 71.0 50.7 168.5 201.1 2.2 1.8
Jyothy Laboratories Neutral 381 - 6,918 1,440 2,052 11.5 13.0 8.5 10.0 44.8 38.1 10.9 10.0 18.6 19.3 5.1 3.5Kirloskar Engines India Ltd Neutral 395 - 5,706 2,554 2,800 9.9 10.0 10.5 12.1 37.6 32.6 15.7 14.8 10.7 11.7 1.9 1.7
Linc Pen & Plastics Neutral 249 - 369 382 420 9.3 9.5 13.5 15.7 18.5 15.9 3.2 2.7 17.1 17.3 1.0 0.9
M M Forgings Neutral 589 - 711 546 608 20.4 20.7 41.3 48.7 14.3 12.1 80.7 71.4 16.6 17.0 1.1 1.0
Manpasand Bever. Neutral 803 - 4,594 836 1,087 19.6 19.4 16.9 23.8 47.5 33.7 5.7 5.0 12.0 14.8 5.2 3.9
Mirza International Neutral 158 - 1,905 963 1,069 17.2 18.0 6.1 7.5 25.8 21.1 4.0 3.4 15.0 15.7 2.2 2.0
MT Educare Neutral 60 - 240 366 417 17.7 18.2 9.4 10.8 6.4 5.6 1.4 1.2 22.2 22.3 0.6 0.5
Narayana Hrudaya Neutral 299 - 6,109 1,873 2,166 11.5 11.7 2.6 4.0 113.0 75.4 6.9 6.3 6.1 8.3 3.4 2.9
Navkar Corporation Buy 195 265 2,784 347 371 43.2 37.3 6.7 6.0 29.3 32.6 2.0 1.8 6.2 10.6 9.1 8.5
Navneet Education Neutral 157 - 3,677 1,062 1,147 24.0 24.0 6.1 6.6 25.9 23.8 5.3 4.7 20.6 19.8 3.5 3.3
Nilkamal Neutral 1,603 - 2,393 1,995 2,165 10.7 10.4 69.8 80.6 23.0 19.9 91.6 79.6 16.6 16.5 1.2 1.1
Page Industries Neutral 17,039 - 19,005 2,450 3,124 20.1 17.6 299.0 310.0 57.0 55.0 379.5 289.7 47.1 87.5 7.8 6.1
Parag Milk Foods Neutral 238 - 2,004 1,919 2,231 9.3 9.6 9.5 12.9 25.2 18.4 3.9 3.2 15.5 17.5 1.2 1.0
Quick Heal Neutral 188 - 1,321 408 495 27.3 27.0 7.7 8.8 24.3 21.4 2.3 2.3 9.3 10.6 2.4 2.0
Radico Khaitan Neutral 162 - 2,149 1,667 1,824 13.0 13.2 6.7 8.2 24.3 19.7 2.2 2.0 9.0 10.2 1.7 1.5
Relaxo Footwears Neutral 494 - 5,937 2,085 2,469 9.2 8.2 7.6 8.0 65.4 62.2 25.4 21.6 17.9 18.8 2.9 2.5
S H Kelkar & Co. Neutral 254 - 3,679 1,036 1,160 15.1 15.0 6.1 7.2 41.7 35.4 4.5 4.1 10.7 11.5 3.4 3.0
Siyaram Silk Mills Buy 2,025 2,500 1,898 1,574 1,769 12.5 12.7 97.1 113.1 20.9 17.9 3.2 2.8 15.4 15.5 1.4 1.3
Styrolution ABS India* Neutral 861 - 1,513 1,440 1,537 9.2 9.0 40.6 42.6 21.2 20.2 54.1 49.2 12.3 11.6 1.0 0.9
Surya Roshni Neutral 256 - 1,121 3,342 3,625 7.8 7.5 17.3 19.8 14.8 12.9 28.1 22.6 10.5 10.8 0.6 0.5
Team Lease Serv. Neutral 1,484 - 2,536 3,229 4,001 1.5 1.8 22.8 32.8 65.2 45.2 7.0 6.1 10.7 13.4 0.7 0.5
The Byke Hospitality Neutral 194 - 777 287 384 20.5 20.5 7.6 10.7 25.5 18.1 5.3 4.3 20.7 23.5 2.7 2.0
www.angelbroking.com
Stock WatchAugust 17, 2017
Company Name Reco CMP Target Mkt Cap Sales ( ₹cr ) OPM(%) EPS (₹) PER(x) P/BV(x) RoE(%) EV/Sales(x)
( ₹ ) Price ( ₹) ( ₹ cr ) FY17E FY18E FY17E FY18E FY17E FY18E FY17E FY18E FY17E FY18E FY17E FY18E FY17E FY18E
zOthers
Transport Corporation of India Neutral 285 - 2,181 2,671 2,911 8.5 8.8 13.9 15.7 20.6 18.2 2.8 2.5 13.7 13.8 0.9 0.9
TVS Srichakra Neutral 3,372 - 2,582 2,304 2,614 13.7 13.8 231.1 266.6 14.6 12.7 378.9 298.3 33.9 29.3 1.1 1.0
UFO Moviez Neutral 347 - 957 619 685 33.2 33.4 30.0 34.9 11.6 9.9 1.6 1.4 13.8 13.9 1.3 1.0
Visaka Industries Neutral 511 - 812 1,051 1,138 10.3 10.4 21.0 23.1 24.3 22.1 65.5 61.4 9.0 9.2 1.0 1.0
VRL Logistics Neutral 333 - 3,036 1,902 2,119 16.7 16.6 14.6 16.8 22.8 19.8 5.0 4.4 21.9 22.2 1.7 1.5
VIP Industries Accumulate 196 218 2,771 1,270 1,450 10.4 10.4 5.6 6.5 35.0 30.2 7.3 6.3 20.7 21.1 2.2 1.9
Navin Fluorine Neutral 703 - 3,466 789 945 21.1 22.4 24.0 28.7 29.3 24.5 4.7 4.1 17.8 18.5 4.3 3.5
Source: Company, Angel Research; Note: *December year end; #September year end; &October year end; Price as on August 16, 2017
www.angelbroking.com
Stock WatchAugust 17, 2017
Research Team Tel: 022 - 39357800 E-mail: [email protected] Website: www.angelbroking.com
DISCLAIMER
Angel Broking Private Limited (hereinafter referred to as “Angel”) is a registered Member of National Stock Exchange of India Limited,Bombay Stock Exchange Limited and Metropolitan Stock Exchange Limited. It is also registered as a Depository Participant with CDSL and Portfolio Manager with SEBI. It also has registration with AMFI as a Mutual Fund Distributor. Angel Broking Private Limited is a registered entity with SEBI for Research Analyst in terms of SEBI (Research Analyst) Regulations, 2014 vide registration number INH000000164. Angel or its associates has not been debarred/ suspended by SEBI or any other regulatory authority for accessing /dealing in securities Market. Angel or its associates/analyst has not received any compensation / managed or co-managed public offering of securities of the company covered by Analyst during the past twelve months.
This document is solely for the personal information of the recipient, and must not be singularly used as the basis of any investmentdecision. Nothing in this document should be construed as investment or financial advice. Each recipient of this document should make such investigations as they deem necessary to arrive at an independent evaluation of an investment in the securities of the companies referred to in this document (including the merits and risks involved), and should consult their own advisors to determine the merits and risks of such an investment.
Reports based on technical and derivative analysis center on studying charts of a stock's price movement, outstanding positions andtrading volume, as opposed to focusing on a company's fundamentals and, as such, may not match with a report on a company'sfundamentals. Investors are advised to refer the Fundamental and Technical Research Reports available on our website to evaluate the contrary view, if any.
The information in this document has been printed on the basis of publicly available information, internal data and other reliablesources believed to be true, but we do not represent that it is accurate or complete and it should not be relied on as such, as thisdocument is for general guidance only. Angel Broking Pvt. Limited or any of its affiliates/ group companies shall not be in any wayresponsible for any loss or damage that may arise to any person from any inadvertent error in the information contained in this report.Angel Broking Pvt. Limited has not independently verified all the information contained within this document. Accordingly, we cannottestify, nor make any representation or warranty, express or implied, to the accuracy, contents or data contained within this document.While Angel Broking Pvt. Limited endeavors to update on a reasonable basis the information discussed in this material, there may beregulatory, compliance, or other reasons that prevent us from doing so.
This document is being supplied to you solely for your information, and its contents, information or data may not be reproduced,redistributed or passed on, directly or indirectly.
Neither Angel Broking Pvt. Limited, nor its directors, employees or affiliates shall be liable for any loss or damage that may arise fromor in connection with the use of this information.
www.angelbroking.com
Market OutlookAugust 17, 2017