Embed Size (px)
Citation preview

1
MASS AND SIZE ESTIMATION OF CITRUS FRUIT BY MACHINE VISION AND CITRUS GREENING DISEASED FRUIT DETECTION USING SPECTRAL ANALYSIS
By
JUNSU SHIN
A THESIS PRESENTED TO THE GRADUATE SCHOOL OF THE UNIVERSITY OF FLORIDA IN PARTIAL FULFILLMENT
OF THE REQUIREMENTS FOR THE DEGREE OF MASTER OF ENGINEERING
UNIVERSITY OF FLORIDA
2012

2
© 2012 Junsu Shin

3
To my loving wife for all her support

4
ACKNOWLEDGMENTS
I would like to thank my major advisor, Dr. Won Suk “Daniel” Lee, for his support
and encouragement, both in my research and in my life. I would also like to give thanks
to my other supervisory committee members, Dr. Reza Ehsani and Dr. Arunava
Banerjee, for their advice and suggestions during my research. I would also like to thank
CREC staffs, Lioubov Polonik and Cindy Basnaw, for helping me collect citrus fruit
samples. My family and friends were a great help and sustained through the good and
bad times of this educational journey. Above all however, I would like to thank my
wonderful and caring wife. I would surely not have pursued and finished graduate study
without her by my side.
5
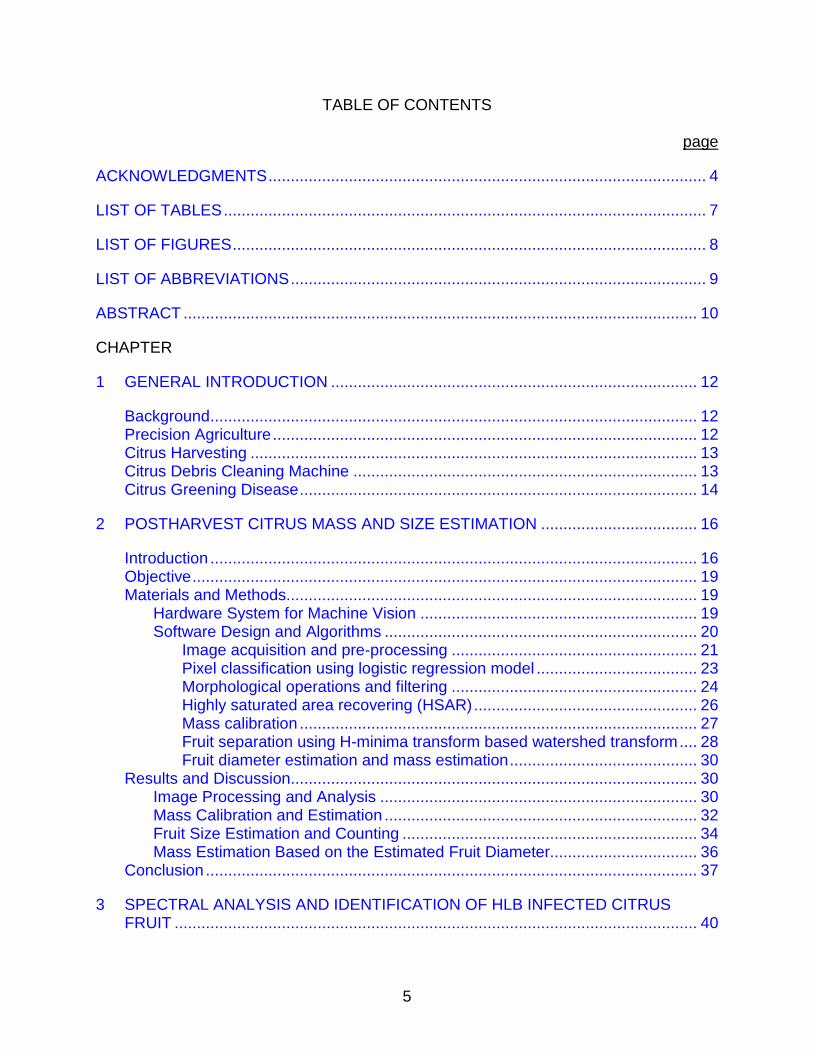
TABLE OF CONTENTS page
ACKNOWLEDGMENTS .................................................................................................. 4
LIST OF TABLES ............................................................................................................ 7
LIST OF FIGURES .......................................................................................................... 8
LIST OF ABBREVIATIONS ............................................................................................. 9
ABSTRACT ................................................................................................................... 10
CHAPTER
1 GENERAL INTRODUCTION .................................................................................. 12
Background ............................................................................................................. 12
Precision Agriculture ............................................................................................... 12 Citrus Harvesting .................................................................................................... 13 Citrus Debris Cleaning Machine ............................................................................. 13
Citrus Greening Disease ......................................................................................... 14
2 POSTHARVEST CITRUS MASS AND SIZE ESTIMATION ................................... 16
Introduction ............................................................................................................. 16
Objective ................................................................................................................. 19
Materials and Methods............................................................................................ 19 Hardware System for Machine Vision .............................................................. 19 Software Design and Algorithms ...................................................................... 20
Image acquisition and pre-processing ....................................................... 21 Pixel classification using logistic regression model .................................... 23
Morphological operations and filtering ....................................................... 24 Highly saturated area recovering (HSAR) .................................................. 26 Mass calibration ......................................................................................... 27
Fruit separation using H-minima transform based watershed transform .... 28 Fruit diameter estimation and mass estimation .......................................... 30
Results and Discussion........................................................................................... 30 Image Processing and Analysis ....................................................................... 30
Mass Calibration and Estimation ...................................................................... 32 Fruit Size Estimation and Counting .................................................................. 34 Mass Estimation Based on the Estimated Fruit Diameter................................. 36
Conclusion .............................................................................................................. 37
3 SPECTRAL ANALYSIS AND IDENTIFICATION OF HLB INFECTED CITRUS FRUIT ..................................................................................................................... 40
6
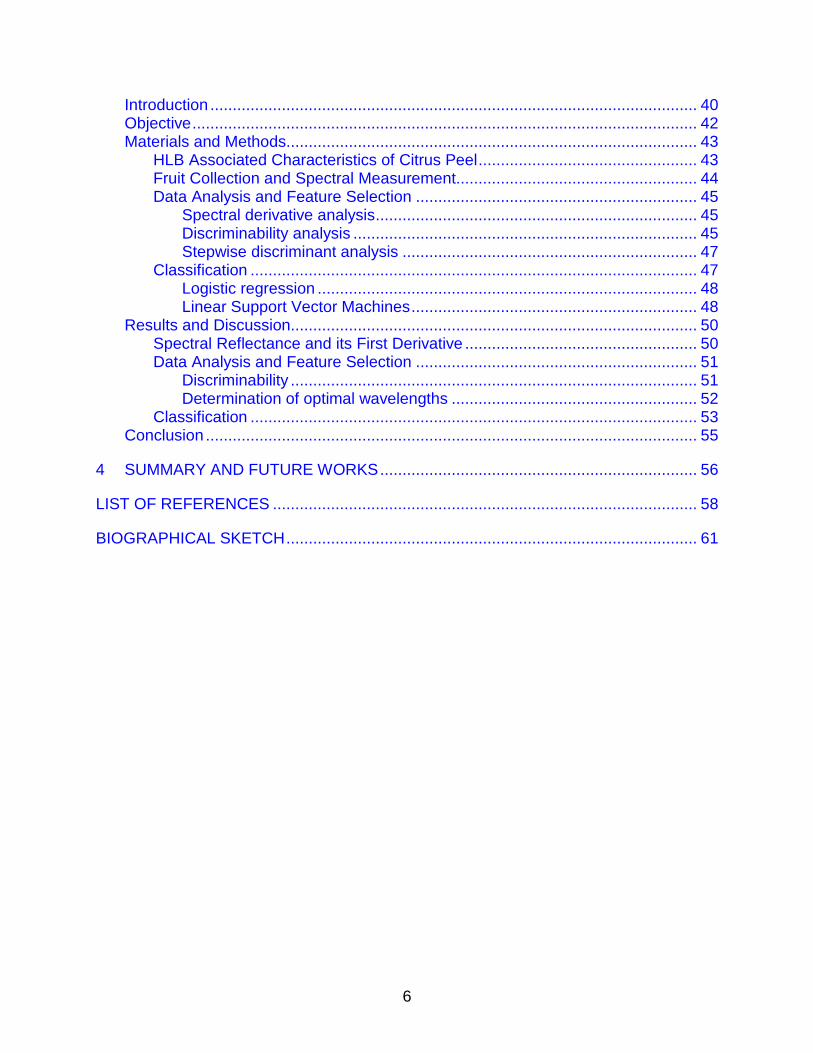
Introduction ............................................................................................................. 40
Objective ................................................................................................................. 42 Materials and Methods............................................................................................ 43
HLB Associated Characteristics of Citrus Peel ................................................. 43 Fruit Collection and Spectral Measurement...................................................... 44 Data Analysis and Feature Selection ............................................................... 45
Spectral derivative analysis ........................................................................ 45 Discriminability analysis ............................................................................. 45
Stepwise discriminant analysis .................................................................. 47 Classification .................................................................................................... 47
Logistic regression ..................................................................................... 48 Linear Support Vector Machines ................................................................ 48
Results and Discussion........................................................................................... 50
Spectral Reflectance and its First Derivative .................................................... 50 Data Analysis and Feature Selection ............................................................... 51
Discriminability ........................................................................................... 51
Determination of optimal wavelengths ....................................................... 52 Classification .................................................................................................... 53
Conclusion .............................................................................................................. 55
4 SUMMARY AND FUTURE WORKS ....................................................................... 56
LIST OF REFERENCES ............................................................................................... 58
BIOGRAPHICAL SKETCH ............................................................................................ 61
7
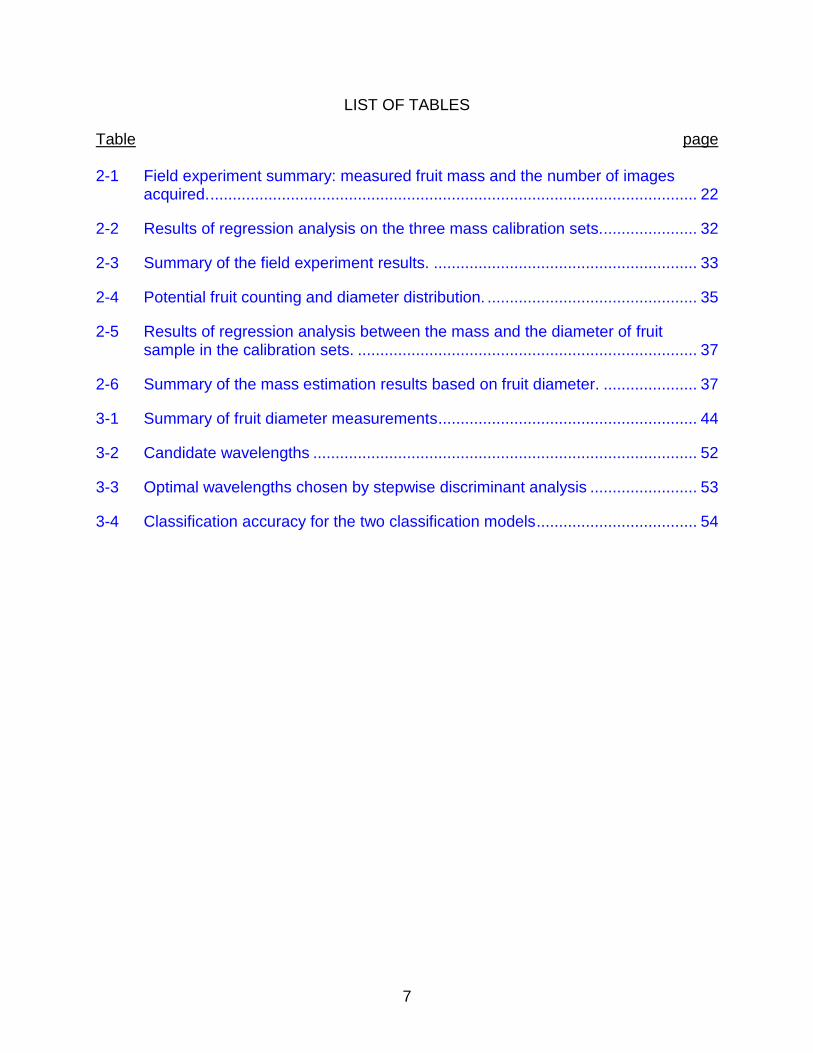
LIST OF TABLES
Table page 2-1 Field experiment summary: measured fruit mass and the number of images
acquired. ............................................................................................................. 22
2-2 Results of regression analysis on the three mass calibration sets. ..................... 32
2-3 Summary of the field experiment results. ........................................................... 33
2-4 Potential fruit counting and diameter distribution. ............................................... 35
2-5 Results of regression analysis between the mass and the diameter of fruit sample in the calibration sets. ............................................................................ 37
2-6 Summary of the mass estimation results based on fruit diameter. ..................... 37
3-1 Summary of fruit diameter measurements .......................................................... 44
3-2 Candidate wavelengths ...................................................................................... 52
3-3 Optimal wavelengths chosen by stepwise discriminant analysis ........................ 53
3-4 Classification accuracy for the two classification models .................................... 54
8
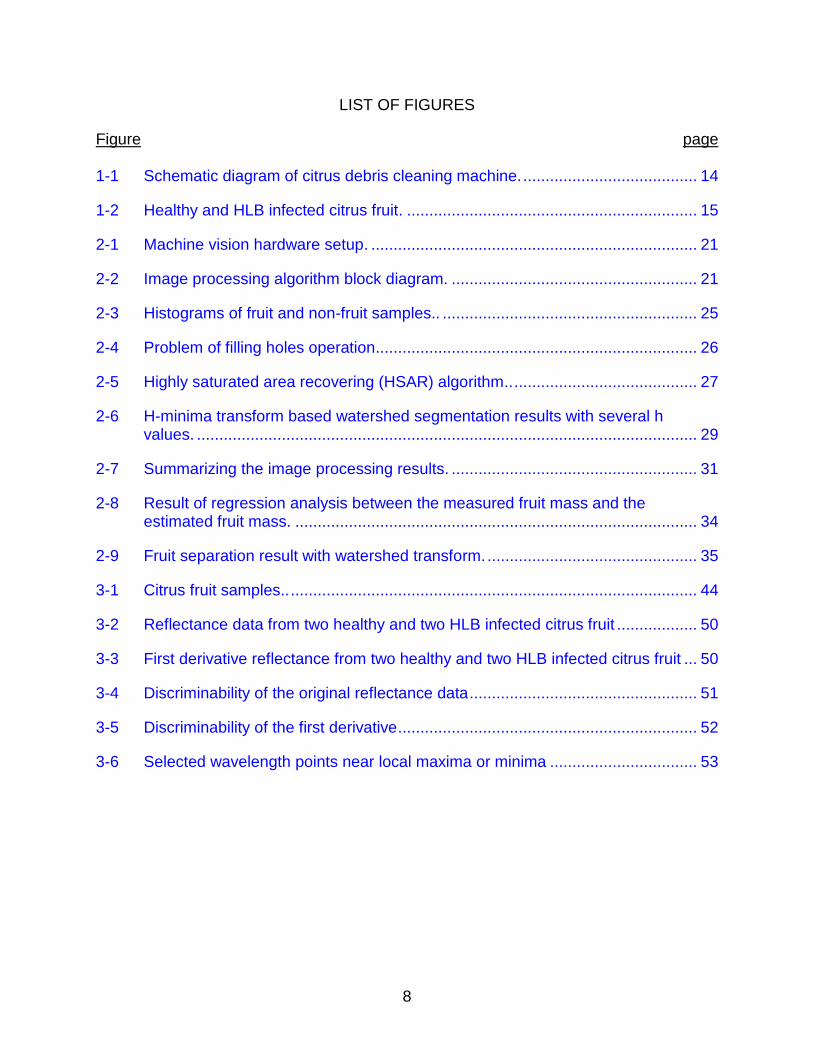
LIST OF FIGURES
Figure page 1-1 Schematic diagram of citrus debris cleaning machine. ....................................... 14
1-2 Healthy and HLB infected citrus fruit. ................................................................. 15
2-1 Machine vision hardware setup. ......................................................................... 21
2-2 Image processing algorithm block diagram. ....................................................... 21
2-3 Histograms of fruit and non-fruit samples.. ......................................................... 25
2-4 Problem of filling holes operation.. ...................................................................... 26
2-5 Highly saturated area recovering (HSAR) algorithm.. ......................................... 27
2-6 H-minima transform based watershed segmentation results with several h values. ................................................................................................................ 29
2-7 Summarizing the image processing results. ....................................................... 31
2-8 Result of regression analysis between the measured fruit mass and the estimated fruit mass. .......................................................................................... 34
2-9 Fruit separation result with watershed transform. ............................................... 35
3-1 Citrus fruit samples.. ........................................................................................... 44
3-2 Reflectance data from two healthy and two HLB infected citrus fruit .................. 50
3-3 First derivative reflectance from two healthy and two HLB infected citrus fruit ... 50
3-4 Discriminability of the original reflectance data ................................................... 51
3-5 Discriminability of the first derivative ................................................................... 52
3-6 Selected wavelength points near local maxima or minima ................................. 53
9
LIST OF ABBREVIATIONS
AYMS Automated Yield Monitoring System
ECHO Extraction and Classification of Homogenous Objects
GIS Geographic Information System
GPS Global Positioning System
HLB Huanglongbing or citrus greening
HSAR Highly Saturated Area Recovering
HSV Hue, Saturation and Value
NASS National Agriculture Statistics Survey
PCA Principal Components Analysis
PCR Polymercase Chain Reaction
PDF Probability Density Function
R2 Coefficient of determination
ROI Region of Interest
RMSE Root Mean Square Error
RGB Red, Green and Blue
SSE Error sum of squares
SVM Support Vector Machines
YCbCr Luminance, chrominance in blue and chrominance in red
YIQ Luminance, in-phase chrominance and quadrature chrominance
10
Abstract of Thesis Presented to the Graduate School of the University of Florida in Partial Fulfillment of the Requirements for the Degree of Master of Engineering
MASS AND SIZE ESTIMATION OF CITRUS FRUIT BY MACHINE VISION AND
CITRUS GREENING DISEASED FRUIT DETECTION USING SPECTRAL ANALYSIS
By
Junsu Shin
December 2012
Chair: Won Suk “Daniel” Lee Major: Agricultural and Biological Engineering
Citrus is the major fruit crop in Florida. Citrus industry occupies a significant
portion of Florida’s agricultural economy. There have been many efforts to minimize
producing costs, improve productivity and increase profit. Precision agriculture emerged
as a solution to such efforts. A machine vision based imaging and a visible-near infrared
spectroscopy are examples of precision farming technology widely used in agricultural
sectors.
A machine vision system for estimation of citrus fruit mass, fruit count, and fruit
size during postharvest processing was investigated towards the development of an
advanced citrus yield mapping system. Such yield mapping system enables the citrus
growers to efficiently manage the in-grove spatial variability factors such as: soil type,
soil fertility, moisture content, etc., and can help increase yield and profits. Thus, a
machine vision system was developed and installed in a citrus debris cleaning machine,
which removes debris from mechanically harvested loads. An image processing
algorithm was developed to identify fruit from images of the postharvest citrus from a
commercial citrus grove. For fruit detection, logistic regression model based pixel
11
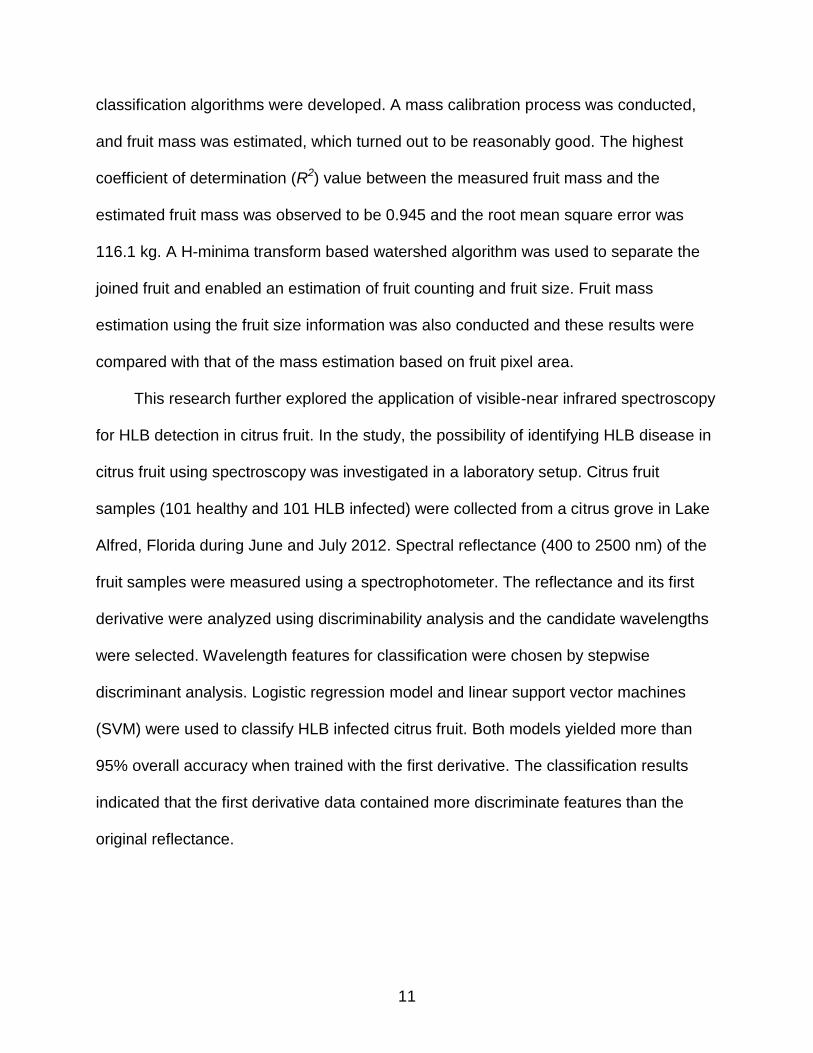
classification algorithms were developed. A mass calibration process was conducted,
and fruit mass was estimated, which turned out to be reasonably good. The highest
coefficient of determination (R2) value between the measured fruit mass and the
estimated fruit mass was observed to be 0.945 and the root mean square error was
116.1 kg. A H-minima transform based watershed algorithm was used to separate the
joined fruit and enabled an estimation of fruit counting and fruit size. Fruit mass
estimation using the fruit size information was also conducted and these results were
compared with that of the mass estimation based on fruit pixel area.
This research further explored the application of visible-near infrared spectroscopy
for HLB detection in citrus fruit. In the study, the possibility of identifying HLB disease in
citrus fruit using spectroscopy was investigated in a laboratory setup. Citrus fruit
samples (101 healthy and 101 HLB infected) were collected from a citrus grove in Lake
Alfred, Florida during June and July 2012. Spectral reflectance (400 to 2500 nm) of the
fruit samples were measured using a spectrophotometer. The reflectance and its first
derivative were analyzed using discriminability analysis and the candidate wavelengths
were selected. Wavelength features for classification were chosen by stepwise
discriminant analysis. Logistic regression model and linear support vector machines
(SVM) were used to classify HLB infected citrus fruit. Both models yielded more than
95% overall accuracy when trained with the first derivative. The classification results
indicated that the first derivative data contained more discriminate features than the
original reflectance.
12
CHAPTER 1 GENERAL INTRODUCTION
Background
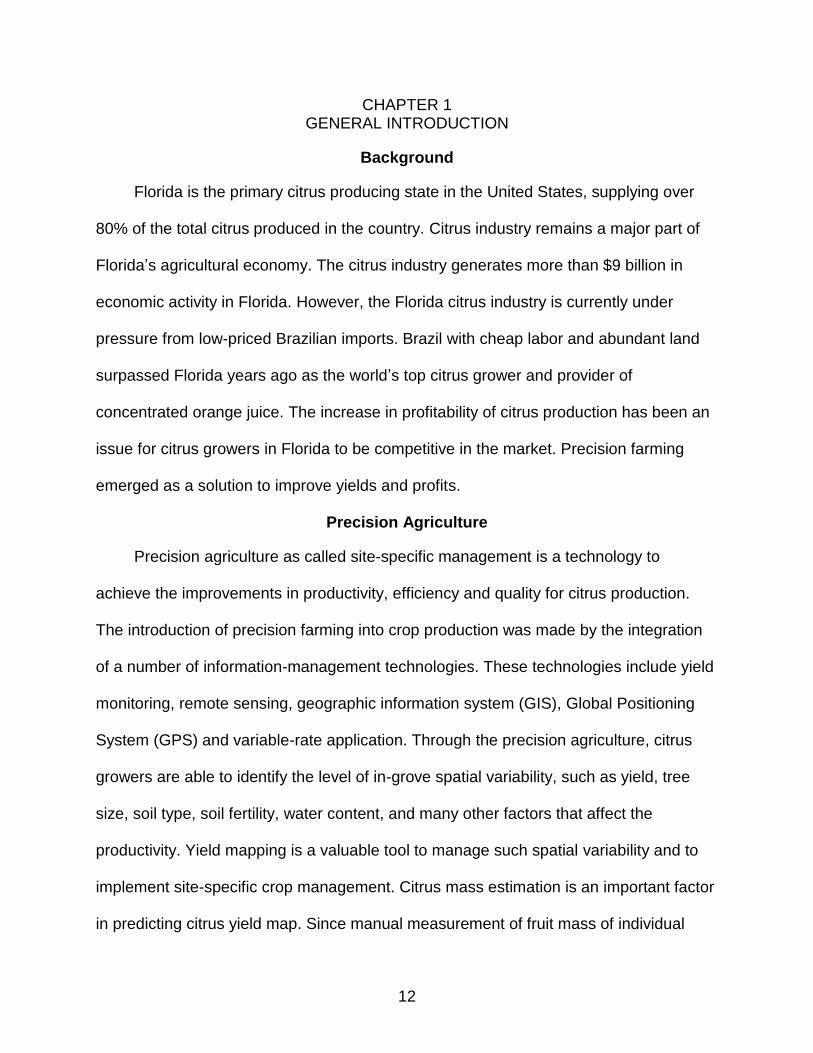
Florida is the primary citrus producing state in the United States, supplying over
80% of the total citrus produced in the country. Citrus industry remains a major part of
Florida’s agricultural economy. The citrus industry generates more than $9 billion in
economic activity in Florida. However, the Florida citrus industry is currently under
pressure from low-priced Brazilian imports. Brazil with cheap labor and abundant land
surpassed Florida years ago as the world’s top citrus grower and provider of
concentrated orange juice. The increase in profitability of citrus production has been an
issue for citrus growers in Florida to be competitive in the market. Precision farming
emerged as a solution to improve yields and profits.
Precision Agriculture
Precision agriculture as called site-specific management is a technology to
achieve the improvements in productivity, efficiency and quality for citrus production.
The introduction of precision farming into crop production was made by the integration
of a number of information-management technologies. These technologies include yield
monitoring, remote sensing, geographic information system (GIS), Global Positioning
System (GPS) and variable-rate application. Through the precision agriculture, citrus
growers are able to identify the level of in-grove spatial variability, such as yield, tree
size, soil type, soil fertility, water content, and many other factors that affect the
productivity. Yield mapping is a valuable tool to manage such spatial variability and to
implement site-specific crop management. Citrus mass estimation is an important factor
in predicting citrus yield map. Since manual measurement of fruit mass of individual
13
citrus trees is time-consuming and laborious, indirect yield estimation techniques are
required.
Citrus Harvesting
The common method of citrus harvesting is hand harvesting, but the hand
harvesting is a labor intensive task involving large number of workers depending on the
grove size. In order to improve production and decrease costs associated with hand
harvesting, a cost-effective mechanical harvesting machine has been developed and
used. Its usage has been increased during the past several years. One of the
mechanical harvesting machines commonly used in the fields is a canopy shake and
catch harvester. Although mechanical harvester brings many benefits to citrus growers,
the harvester still has its drawbacks. Mechanical removal of leaves, twigs and branches
along with fruit during harvesting results in more debris being delivered to processing
plants. Debris should be separated from fruit at a later stage.
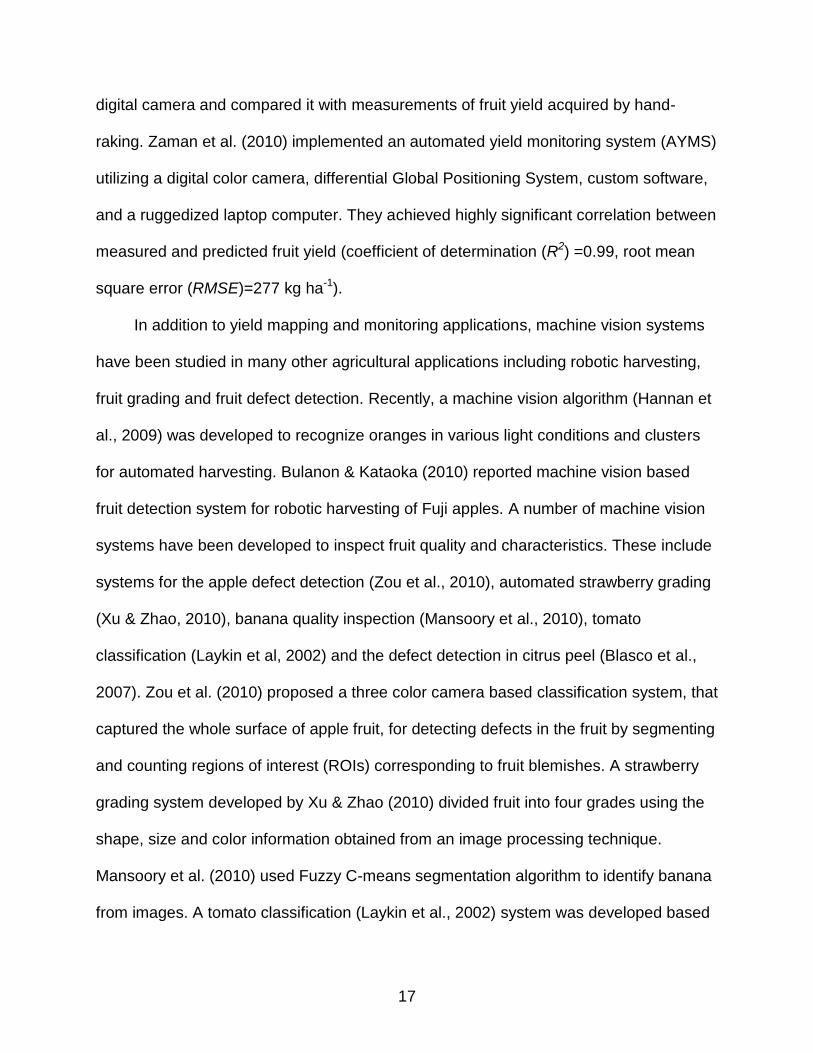
Citrus Debris Cleaning Machine
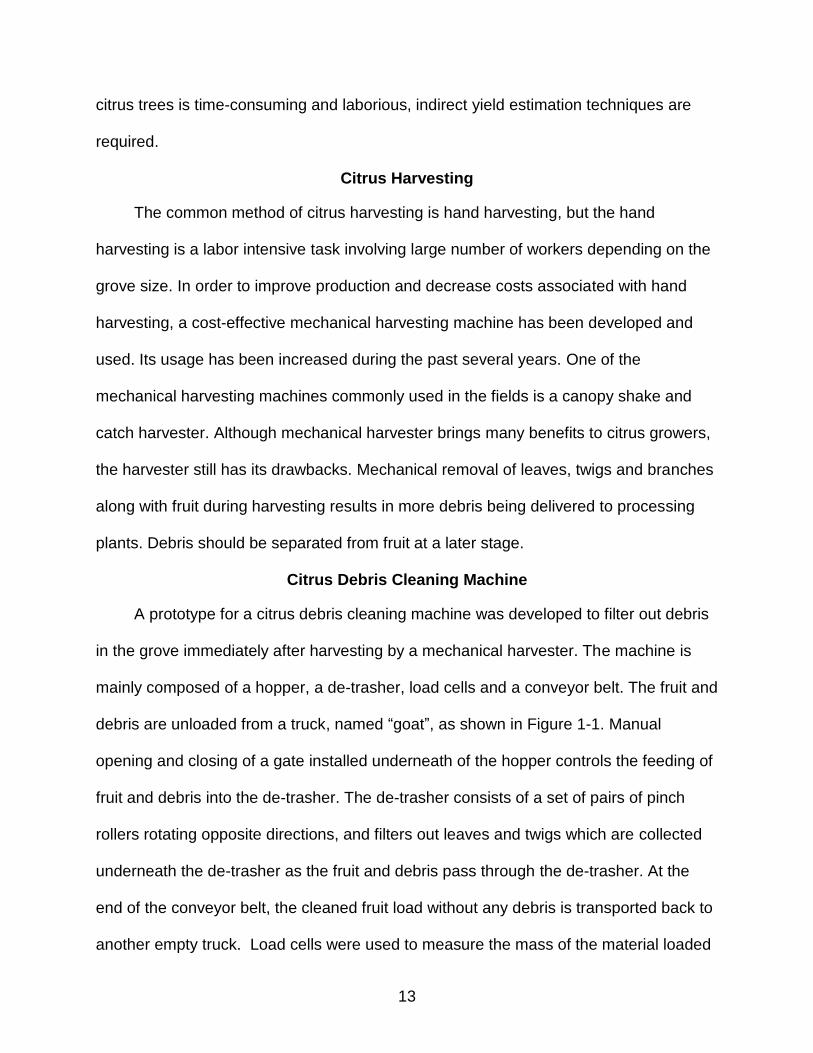
A prototype for a citrus debris cleaning machine was developed to filter out debris
in the grove immediately after harvesting by a mechanical harvester. The machine is
mainly composed of a hopper, a de-trasher, load cells and a conveyor belt. The fruit and
debris are unloaded from a truck, named “goat”, as shown in Figure 1-1. Manual
opening and closing of a gate installed underneath of the hopper controls the feeding of
fruit and debris into the de-trasher. The de-trasher consists of a set of pairs of pinch
rollers rotating opposite directions, and filters out leaves and twigs which are collected
underneath the de-trasher as the fruit and debris pass through the de-trasher. At the
end of the conveyor belt, the cleaned fruit load without any debris is transported back to
another empty truck. Load cells were used to measure the mass of the material loaded
14
in the hopper. The load cells were located on the four corners of the hopper. The
measured mass is displayed on digital screen (Model 715, Avery Weigh-Tronix,
Fairmont, MN, USA). The mass of the collected debris is measured using a weighing
scale (XI-60K, IP-65, Denver Instrument, Bohemia, NY, USA). The fruit mass is
determined by subtracting the mass of the collected debris from the mass measured by
the load cells.
Figure 1-1. Schematic diagram of citrus debris cleaning machine.
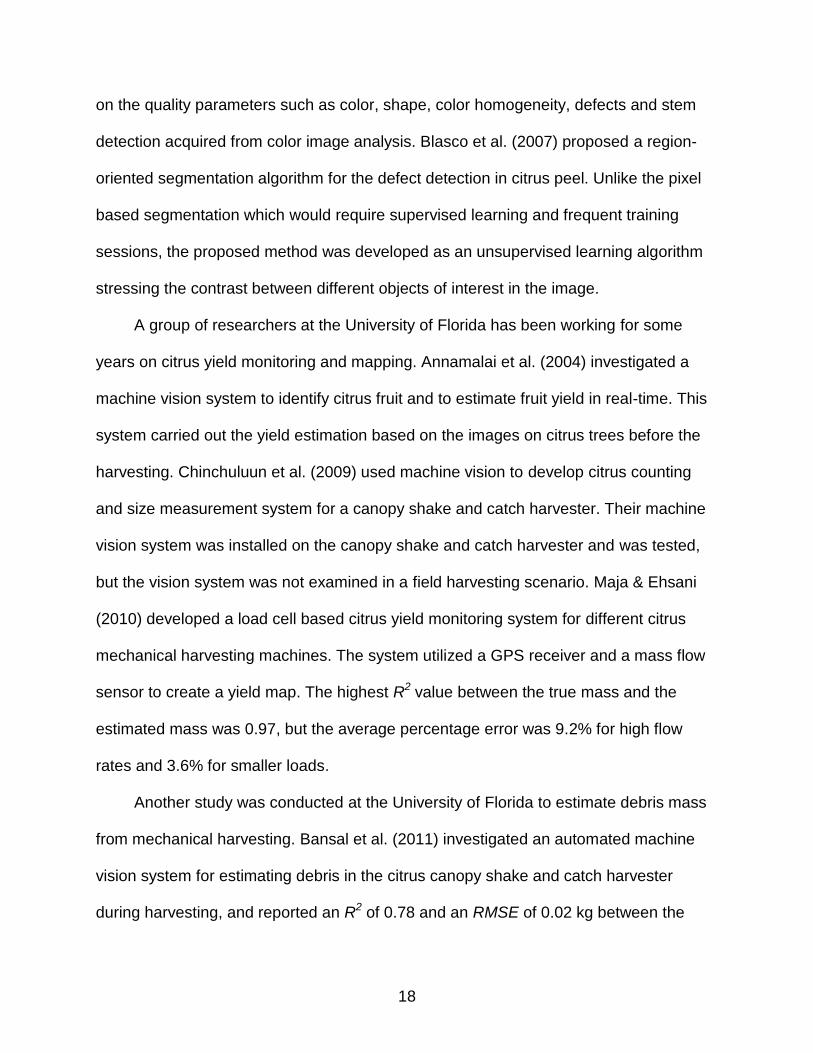
Citrus Greening Disease
However, in recent years the citrus industry has been threatened by citrus
greening disease also known as Haunglongbing (HLB). Haunglongbing is a destructive
and rapidly spreading disease of citrus. The diseased tree will decline in its health and
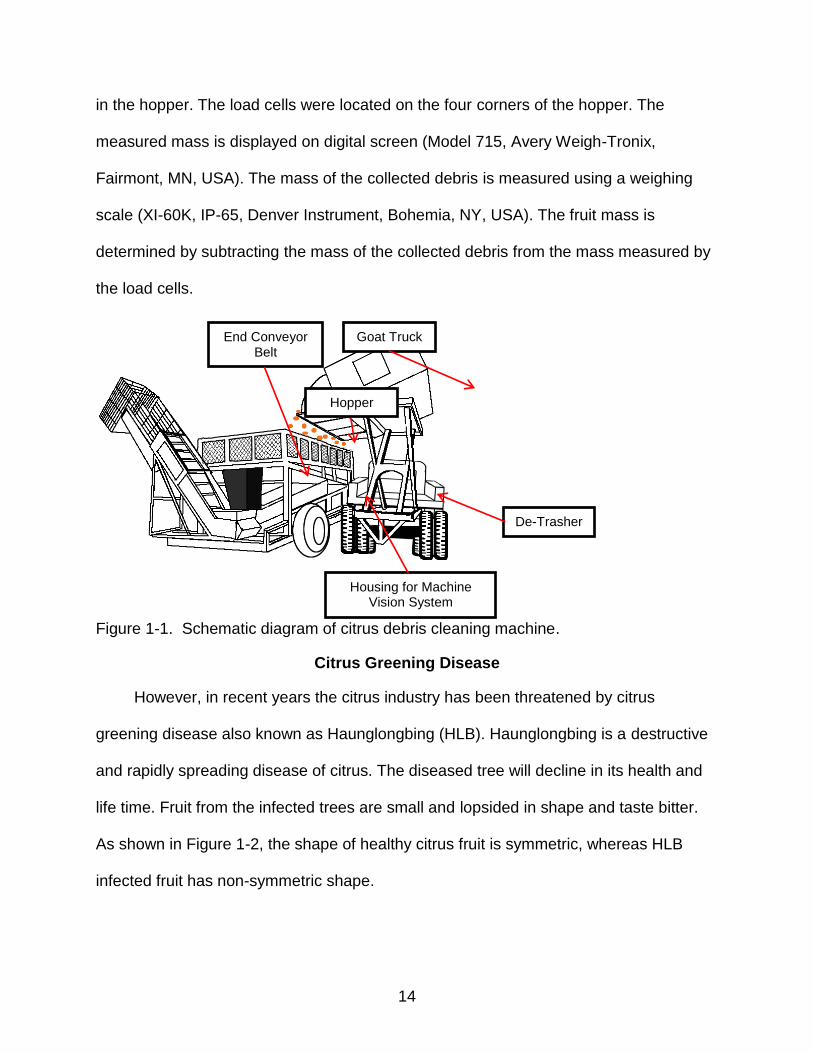
life time. Fruit from the infected trees are small and lopsided in shape and taste bitter.
As shown in Figure 1-2, the shape of healthy citrus fruit is symmetric, whereas HLB
infected fruit has non-symmetric shape.
Goat Truck
De-Trasher
Hopper
End Conveyor Belt
Housing for Machine Vision System
15
A B Figure 1-2. Healthy and HLB infected citrus fruit. A) healthy fruit. B) HLB infected fruit
Since there is no cure once a tree becomes infected, the spread of HLB is
prevented only by removing the infected trees. The disease damages not only economic
value of fruit, but also the whole citrus industry. Since symptoms of HLB disease
resemble those of nutrient deficiencies such as iron or zinc deficiency, the identification
of HLB infected trees and fruit is a difficult task only depending on field observations.
16
CHAPTER 2 POSTHARVEST CITRUS MASS AND SIZE ESTIMATION
Introduction
Florida is the primary citrus producing state in the United States, supplying over
80% of the total citrus produced in the country. The increase in profitability of citrus
production has been an issue for citrus growers to be competitive in the market.
Precision farming is a technology to achieve the improvements in productivity, efficiency
and quality for citrus production. Through this technology, citrus growers are able to
identify the level of in-grove spatial variability, such as yield, tree size, soil type, soil
fertility, water content, and many other factors that affect the productivity. Yield mapping
is a valuable tool to manage such spatial variability and to implement site-specific crop
management.
Image processing based machine vision technology has been employed in many
yield monitoring and mapping applications. The widespread use of the machine vision
technology in the agricultural sector is due to its capability of recognizing size, shape,
color, texture and numerical attributes of the objects (Chen et al., 2002). Recently,
Aggelopoulou et al. (2011) developed an image processing based algorithm for early
yield estimation in an apple orchard. The algorithm forecasts tree yield by analyzing the
texture of the tree image at full bloom. Safren et al. (2007) presented a multistage
algorithm that estimated the number of green apples in hyperspectral images of apple
trees. The algorithm utilized principal components analysis (PCA) and extraction and
classification of homogenous objects (ECHO) as well as machine vision techniques.
Another type of vision system for fruit yield estimation was attempted by Zaman et
al. (2008). They investigated the feasibility of estimating ripe blueberry fruit yield using a
17
digital camera and compared it with measurements of fruit yield acquired by hand-
raking. Zaman et al. (2010) implemented an automated yield monitoring system (AYMS)
utilizing a digital color camera, differential Global Positioning System, custom software,
and a ruggedized laptop computer. They achieved highly significant correlation between
measured and predicted fruit yield (coefficient of determination (R2) =0.99, root mean
square error (RMSE)=277 kg ha-1).
In addition to yield mapping and monitoring applications, machine vision systems
have been studied in many other agricultural applications including robotic harvesting,
fruit grading and fruit defect detection. Recently, a machine vision algorithm (Hannan et
al., 2009) was developed to recognize oranges in various light conditions and clusters
for automated harvesting. Bulanon & Kataoka (2010) reported machine vision based
fruit detection system for robotic harvesting of Fuji apples. A number of machine vision
systems have been developed to inspect fruit quality and characteristics. These include
systems for the apple defect detection (Zou et al., 2010), automated strawberry grading
(Xu & Zhao, 2010), banana quality inspection (Mansoory et al., 2010), tomato
classification (Laykin et al, 2002) and the defect detection in citrus peel (Blasco et al.,
2007). Zou et al. (2010) proposed a three color camera based classification system, that
captured the whole surface of apple fruit, for detecting defects in the fruit by segmenting
and counting regions of interest (ROIs) corresponding to fruit blemishes. A strawberry
grading system developed by Xu & Zhao (2010) divided fruit into four grades using the
shape, size and color information obtained from an image processing technique.
Mansoory et al. (2010) used Fuzzy C-means segmentation algorithm to identify banana
from images. A tomato classification (Laykin et al., 2002) system was developed based
18
on the quality parameters such as color, shape, color homogeneity, defects and stem
detection acquired from color image analysis. Blasco et al. (2007) proposed a region-
oriented segmentation algorithm for the defect detection in citrus peel. Unlike the pixel
based segmentation which would require supervised learning and frequent training
sessions, the proposed method was developed as an unsupervised learning algorithm
stressing the contrast between different objects of interest in the image.
A group of researchers at the University of Florida has been working for some
years on citrus yield monitoring and mapping. Annamalai et al. (2004) investigated a
machine vision system to identify citrus fruit and to estimate fruit yield in real-time. This
system carried out the yield estimation based on the images on citrus trees before the
harvesting. Chinchuluun et al. (2009) used machine vision to develop citrus counting
and size measurement system for a canopy shake and catch harvester. Their machine
vision system was installed on the canopy shake and catch harvester and was tested,
but the vision system was not examined in a field harvesting scenario. Maja & Ehsani
(2010) developed a load cell based citrus yield monitoring system for different citrus
mechanical harvesting machines. The system utilized a GPS receiver and a mass flow
sensor to create a yield map. The highest R2 value between the true mass and the
estimated mass was 0.97, but the average percentage error was 9.2% for high flow
rates and 3.6% for smaller loads.
Another study was conducted at the University of Florida to estimate debris mass
from mechanical harvesting. Bansal et al. (2011) investigated an automated machine
vision system for estimating debris in the citrus canopy shake and catch harvester
during harvesting, and reported an R2 of 0.78 and an RMSE of 0.02 kg between the
19
actual and estimated debris mass. The debris materials include non-citrus objects such
as leaves and twigs which are collected along with citrus fruit during harvesting.
Diseased debris is a primary source of spreading citrus diseases such as citrus canker.
Hence, it is imperative to have an automated debris disposal system. In an effort to
build such system, a citrus debris cleaning machine that collects debris postharvest was
developed. Previous yield monitoring systems were developed such that measurement
took place during or before harvesting. This type of measurement could reduce
estimation accuracy since debris or non-fruit objects might be included. Hence,
measurement after the removal of unnecessary objects would increase yield estimation
accuracy. For such a system, image acquisition after the cleaning process would be
required.
Objective
The objective of this research was to develop a real-time machine vision system
for citrus mass and size estimation in the postharvest citrus debris cleaning machine. To
achieve fruit detection, a supervised learning algorithm was developed, and a modified
version of the watershed algorithm was proposed. The fruit detection algorithms were
developed such that they could form a basis for developing an advanced citrus yield
mapping system in future research.
Materials and Methods
Hardware System for Machine Vision
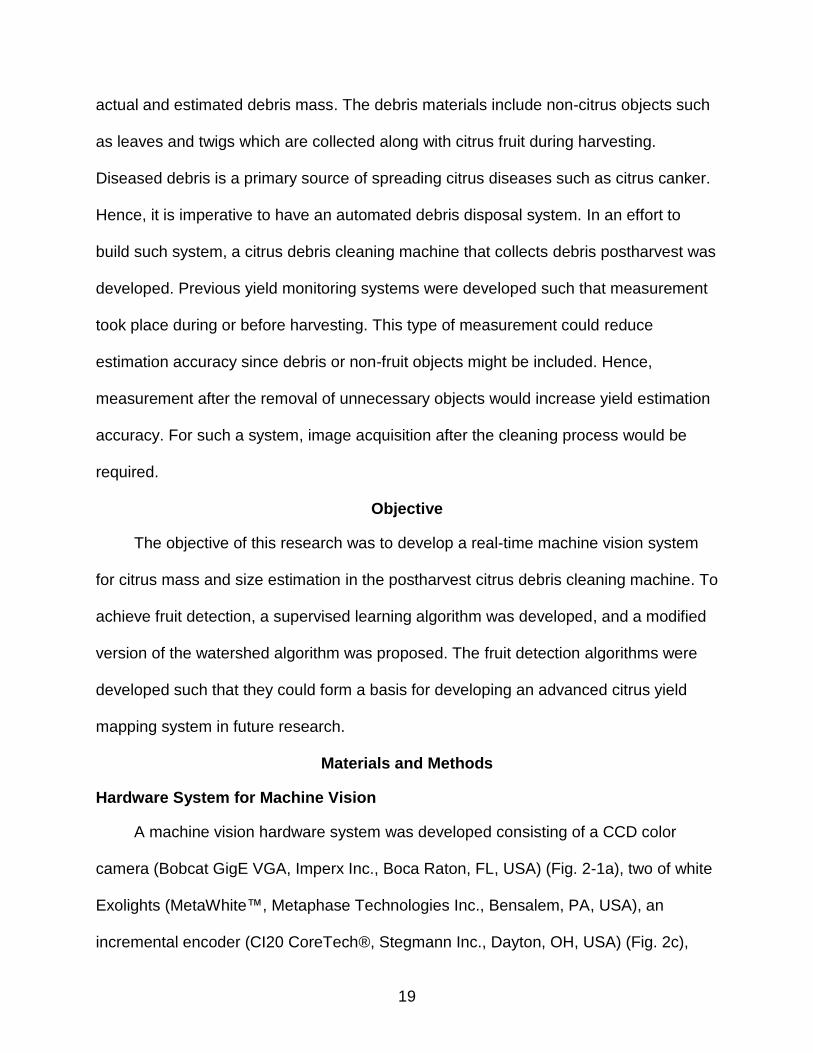
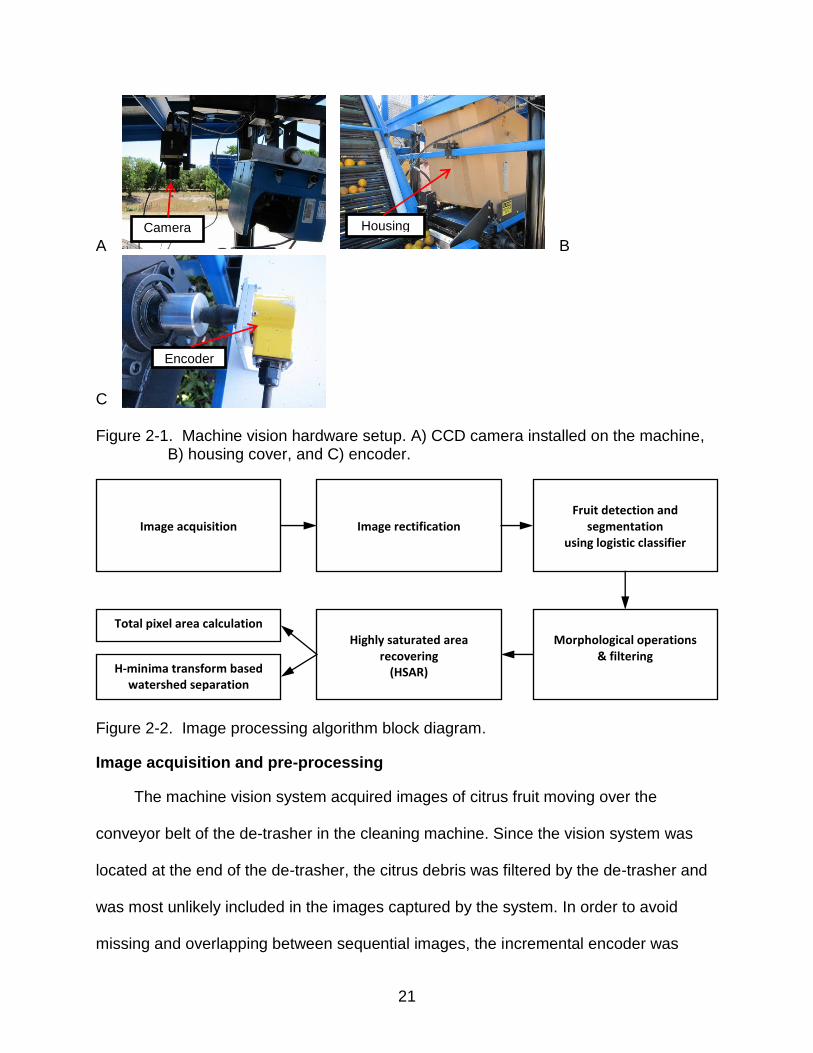
A machine vision hardware system was developed consisting of a CCD color
camera (Bobcat GigE VGA, Imperx Inc., Boca Raton, FL, USA) (Fig. 2-1a), two of white
Exolights (MetaWhite™, Metaphase Technologies Inc., Bensalem, PA, USA), an
incremental encoder (CI20 CoreTech® , Stegmann Inc., Dayton, OH, USA) (Fig. 2c),
20
and a data acquisition card (DAQCard-6036E, National Instruments, Austin, TX, USA).
A camera with high frame rates (206 fps) feature was chosen for the acquisition of clear
high quality images. The size of the images acquired from the camera was 640×480
and the resolution was 0.78×1.16 mm pixel-1. To synchronize with the conveyor belt for
image acquisition, an incremental encoder was installed on a rotating axis of the
conveyor. The average speed of the conveyor belt was 0.67 m sec-1.
The above hardware was installed in a citrus debris cleaning machine described
previously. The cleaning machine was operated by a power take-off from the tractor and
the tractor battery was used as a power source. In order to remove the effect of
variations in sunlight, a housing that covers the camera and the two lights was designed
(Fig. 2-1b). The housing box was made of cardboard. The appropriate height of the
camera was determined such that the entire area inside the housing could be acquired,
and high quality images could be obtained with uniform illumination. For the uniform
light distribution, high quality light was chosen, which could provide shadow free
illumination and diffused light. All hardware setups are shown in Figure 2-1.
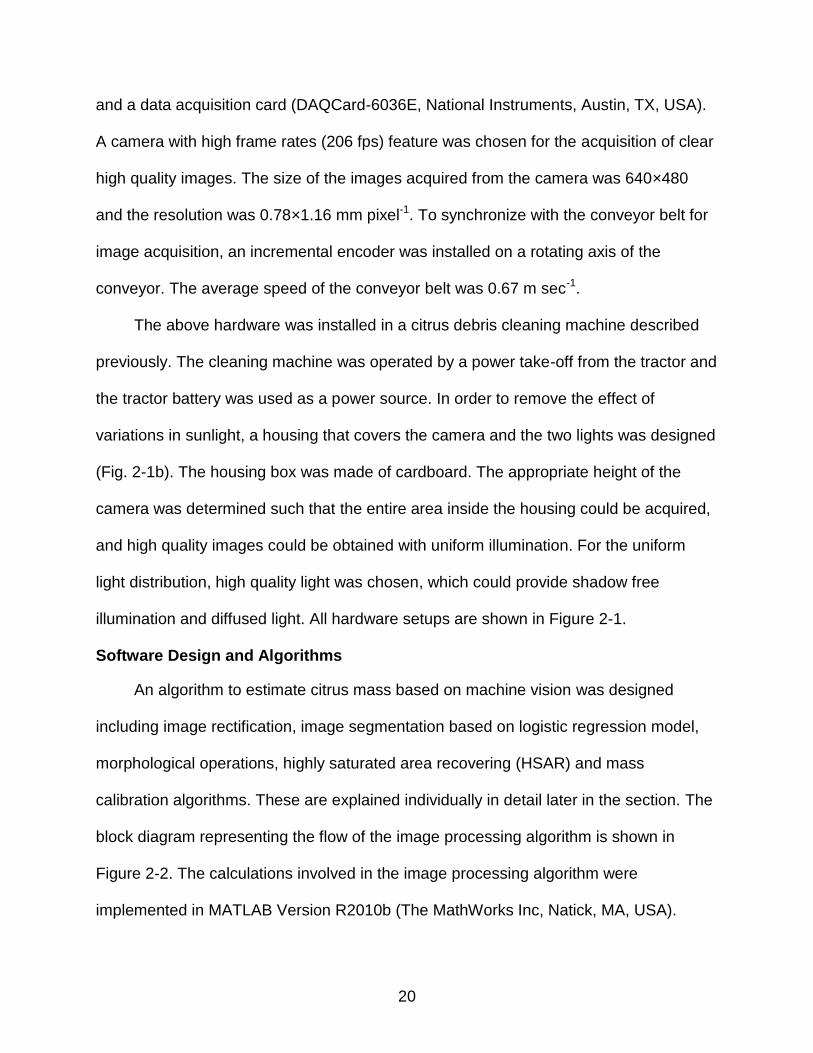
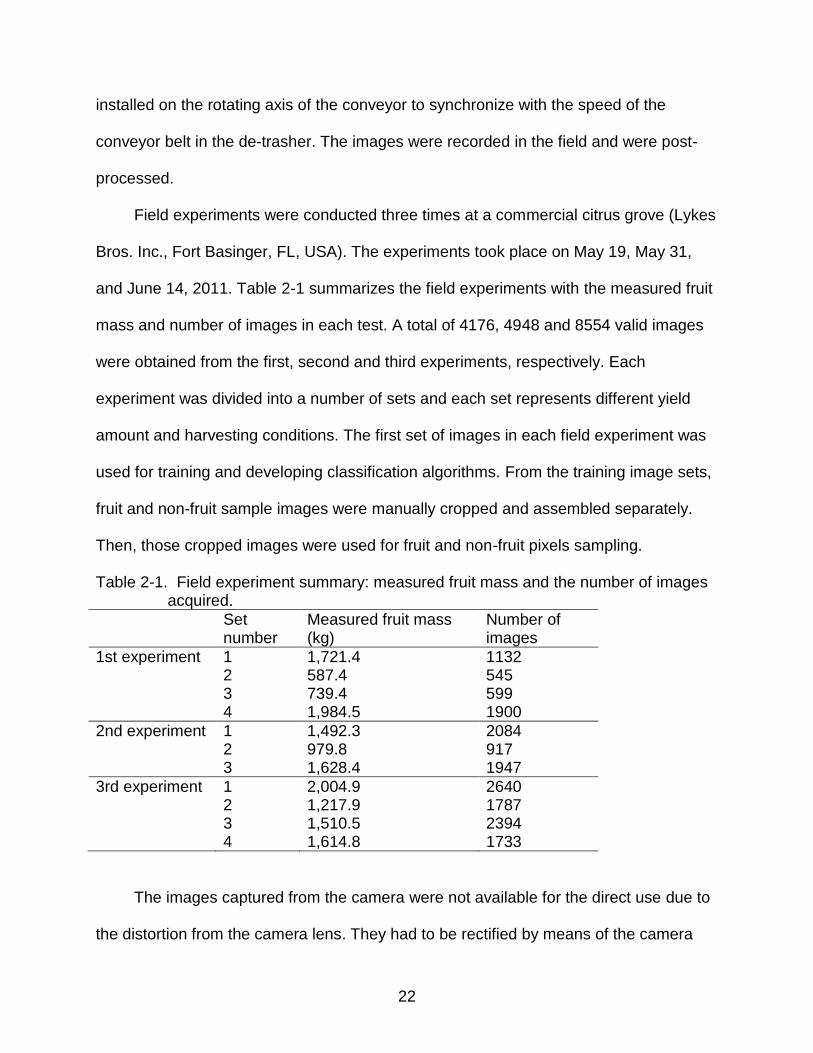
Software Design and Algorithms
An algorithm to estimate citrus mass based on machine vision was designed
including image rectification, image segmentation based on logistic regression model,
morphological operations, highly saturated area recovering (HSAR) and mass
calibration algorithms. These are explained individually in detail later in the section. The
block diagram representing the flow of the image processing algorithm is shown in
Figure 2-2. The calculations involved in the image processing algorithm were
implemented in MATLAB Version R2010b (The MathWorks Inc, Natick, MA, USA).
21
A B
C
Figure 2-1. Machine vision hardware setup. A) CCD camera installed on the machine,
B) housing cover, and C) encoder.
Figure 2-2. Image processing algorithm block diagram.
Image acquisition and pre-processing
The machine vision system acquired images of citrus fruit moving over the
conveyor belt of the de-trasher in the cleaning machine. Since the vision system was
located at the end of the de-trasher, the citrus debris was filtered by the de-trasher and
was most unlikely included in the images captured by the system. In order to avoid
missing and overlapping between sequential images, the incremental encoder was
Image acquisition
Image rectification
Fruit detection and
segmentation using logistic classifier
Morphological operations
& filtering
Total pixel area calculation Highly saturated area
recovering (HSAR) H-minima transform based
watershed separation
Camera Housing
Encoder
22
installed on the rotating axis of the conveyor to synchronize with the speed of the
conveyor belt in the de-trasher. The images were recorded in the field and were post-
processed.
Field experiments were conducted three times at a commercial citrus grove (Lykes
Bros. Inc., Fort Basinger, FL, USA). The experiments took place on May 19, May 31,
and June 14, 2011. Table 2-1 summarizes the field experiments with the measured fruit
mass and number of images in each test. A total of 4176, 4948 and 8554 valid images
were obtained from the first, second and third experiments, respectively. Each
experiment was divided into a number of sets and each set represents different yield
amount and harvesting conditions. The first set of images in each field experiment was
used for training and developing classification algorithms. From the training image sets,
fruit and non-fruit sample images were manually cropped and assembled separately.
Then, those cropped images were used for fruit and non-fruit pixels sampling.
Table 2-1. Field experiment summary: measured fruit mass and the number of images acquired.
Set number
Measured fruit mass (kg)
Number of images
1st experiment 1 1,721.4 1132 2 587.4 545 3 739.4 599 4 1,984.5 1900
2nd experiment 1 1,492.3 2084 2 979.8 917 3 1,628.4 1947
3rd experiment 1 2,004.9 2640 2 1,217.9 1787 3 1,510.5 2394 4 1,614.8 1733
The images captured from the camera were not available for the direct use due to
the distortion from the camera lens. They had to be rectified by means of the camera
23
calibration process. To rectify images, models for both the camera’s geometry and lens
distortion were derived. These two models along with custom software were used to
correct intrinsic deviations and lens distortions. The software program was written using
OpenCV C++ library (Bradski & Kaehler, 2008). All of images taken during the field tests
were rectified using this program. This rectification process can be plugged into the
algorithm proposed in this research such that all the processing can be done in real-
time.
Pixel classification using logistic regression model
Classifying pixels into fruit or non-fruit is regarded as the binary classification
problem. For the binary classification, logistic regression model is utilized. Logistic
regression is quick to train and easy to implement. In addition, the model runs rapidly,
so it is suitable for real-time processing. The logistic regression model is defined by Eq.
2-1.
1,0 ,1
1)(
y
exwgy
xw
TT
(2-1)
where
zezg
1
1)( (2-2)
A function )(zg in Eq. 2-2 is the logistic sigmoid function (Bishop, 2006). The
variable in Eq. 2-1 represents the feature vector. A weight vector represented by the
variable w is determined by the gradient ascent rule satisfying maximum likelihood
condition. The outcome of this pixel classification is in the form of a binary image. The
value zero (0) indicates a black pixel, and the value one (1) represents a white pixel in
the binary output image. The white pixel region denotes where fruit resides in an image,
but the black pixel area denotes background (non-fruit).
24
To find distinctive feature vectors for the classification, the training images were
converted from red, green, and blue (RGB) color space to various type of color spaces,
such as hue, saturation, and value (HSV); luminance, in-phase chrominance and
quadrature chrominance (YIQ); and luminance, chrominance in blue, and chrominance
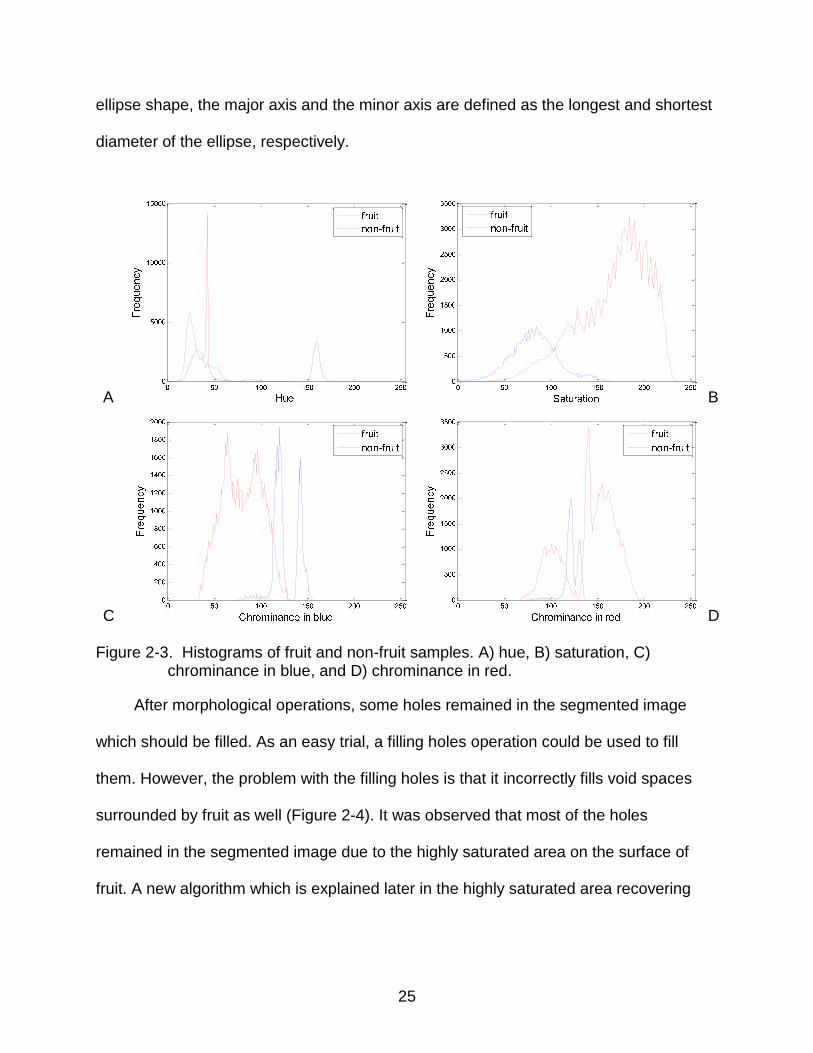
in red (YCbCr). The histogram analysis was performed in each color space. As shown
in Figure 2-3, fruit and non-fruit pixels occupy separate places with little overlapping in
the histogram of hue (H), saturation (S), chrominance in blue (Cb) and chrominance in
red (Cr) color spaces. Hence, these four color components were chosen as the feature
vector. It is noted that more color feature vector could have been chosen, but then the
feature data would have contained redundant data. The feature vector is described as
below.
4321x xxxx
pixel afor valuehue1 x
pixel afor valuesaturation2 x
pixel afor valuebluein echrominanc3 x
pixel afor valueredin echrominanc4 x
(2-3)
Morphological operations and filtering
Morphological operations including erosion, dilation and opening were applied to
make a correction on segmentation errors and to remove noise from the segmented
image. For the morphological operations, a disk-shaped structural element of a size of
three pixels was used. This size was chosen empirically. Also, the geometrical
information on the segmented part such as the ratio of major axis length to minor axis
length was used to filter out the false segmentation. Assuming that a single fruit has an
25
ellipse shape, the major axis and the minor axis are defined as the longest and shortest
diameter of the ellipse, respectively.
A B
C D Figure 2-3. Histograms of fruit and non-fruit samples. A) hue, B) saturation, C)
chrominance in blue, and D) chrominance in red.
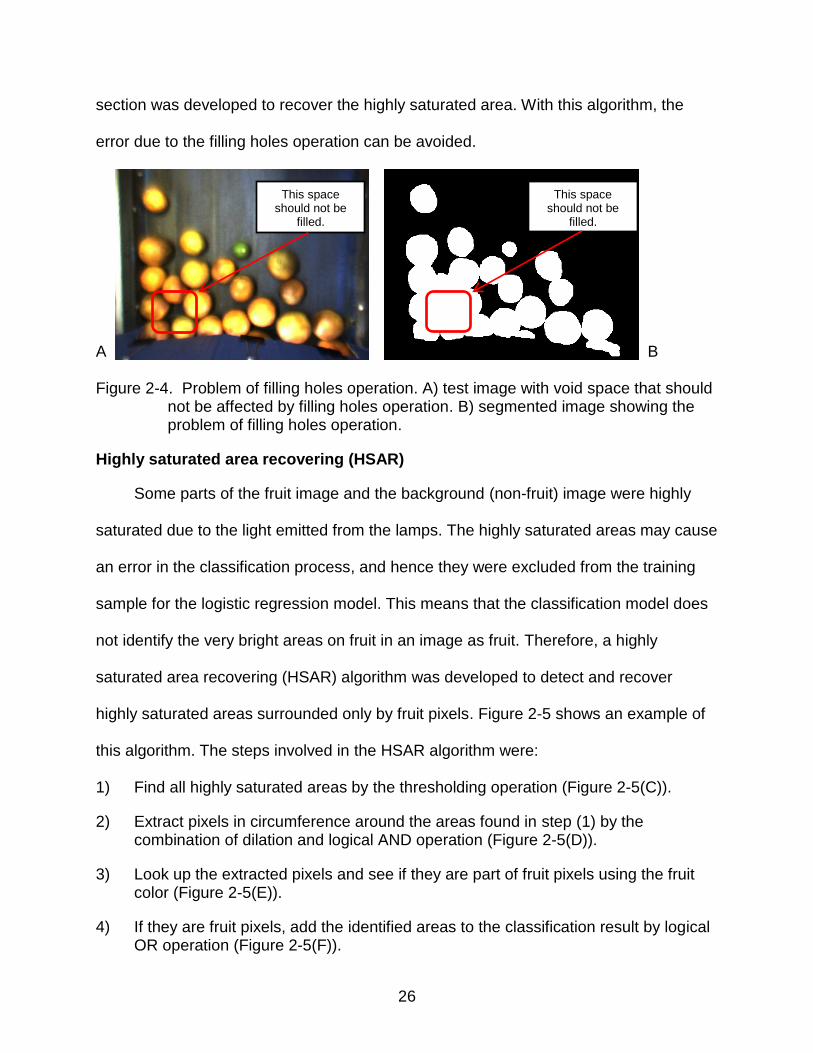
After morphological operations, some holes remained in the segmented image
which should be filled. As an easy trial, a filling holes operation could be used to fill
them. However, the problem with the filling holes is that it incorrectly fills void spaces
surrounded by fruit as well (Figure 2-4). It was observed that most of the holes
remained in the segmented image due to the highly saturated area on the surface of
fruit. A new algorithm which is explained later in the highly saturated area recovering
26
section was developed to recover the highly saturated area. With this algorithm, the
error due to the filling holes operation can be avoided.
A B Figure 2-4. Problem of filling holes operation. A) test image with void space that should
not be affected by filling holes operation. B) segmented image showing the problem of filling holes operation.
Highly saturated area recovering (HSAR)
Some parts of the fruit image and the background (non-fruit) image were highly
saturated due to the light emitted from the lamps. The highly saturated areas may cause
an error in the classification process, and hence they were excluded from the training
sample for the logistic regression model. This means that the classification model does
not identify the very bright areas on fruit in an image as fruit. Therefore, a highly
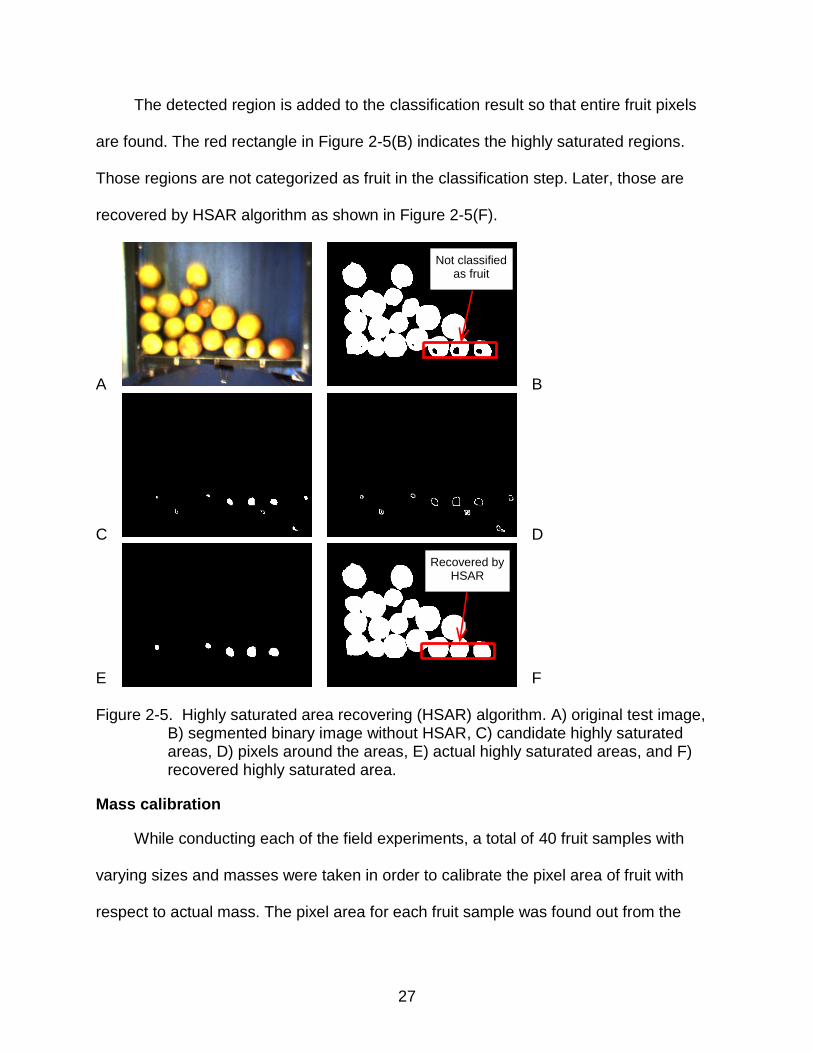
saturated area recovering (HSAR) algorithm was developed to detect and recover
highly saturated areas surrounded only by fruit pixels. Figure 2-5 shows an example of
this algorithm. The steps involved in the HSAR algorithm were:
1) Find all highly saturated areas by the thresholding operation (Figure 2-5(C)).
2) Extract pixels in circumference around the areas found in step (1) by the combination of dilation and logical AND operation (Figure 2-5(D)).
3) Look up the extracted pixels and see if they are part of fruit pixels using the fruit color (Figure 2-5(E)).
4) If they are fruit pixels, add the identified areas to the classification result by logical OR operation (Figure 2-5(F)).
This space should not be
filled.
This space should not be
filled.
27
The detected region is added to the classification result so that entire fruit pixels
are found. The red rectangle in Figure 2-5(B) indicates the highly saturated regions.
Those regions are not categorized as fruit in the classification step. Later, those are
recovered by HSAR algorithm as shown in Figure 2-5(F).
A B
C D
E F Figure 2-5. Highly saturated area recovering (HSAR) algorithm. A) original test image,
B) segmented binary image without HSAR, C) candidate highly saturated areas, D) pixels around the areas, E) actual highly saturated areas, and F) recovered highly saturated area.
Mass calibration
While conducting each of the field experiments, a total of 40 fruit samples with
varying sizes and masses were taken in order to calibrate the pixel area of fruit with
respect to actual mass. The pixel area for each fruit sample was found out from the
Not classified as fruit
Recovered by HSAR
28
binary images obtained from manual cropping using an image editing software (GIMP,
GNU Image Manipulation Program). The mass of the individual fruit sample was
measured using a weighing scale (Adventurer, Ohaus Corporation, Pine Brook, NJ,
USA). A regression analysis was conducted to find a relationship between pixel area
and actual mass. A linear model was assumed in the analysis. Hence, the model has
the form of Eq. 2-4.
21(kg) ppixel areap massEstimated (2-4)
Fruit separation using H-minima transform based watershed transform
In order to count the number of fruit and to estimate the fruit diameter, neighboring
fruit which joined together in the output binary image need to be separated. To separate
the touching fruit into individual fruits, a watershed transformation was conducted on the
inverse distance transform of the complement of the output binary images, which were
obtained from the image processing algorithm. However, it should be noted that the
watershed separation yields over-segmentation results because every local minimum
forms its own catchment basin which comprises one segmented area after the
transform. To minimize the over-segmentation effect, local minima that are too shallow
are eliminated using H-minima transform (Jung & Kim, 2010).
The H-minima transform is a powerful tool to suppress local minima whose depth
is lower than a given threshold constant h. The H-minima transform is defined by Eq. 2-
5. The operator
fR in the Eq. 5 represents the morphological reconstruction by erosion
of f . Here, f denotes the inverse distance map of the binary image.
)()( hfRfHMIN fh (2-5)
29
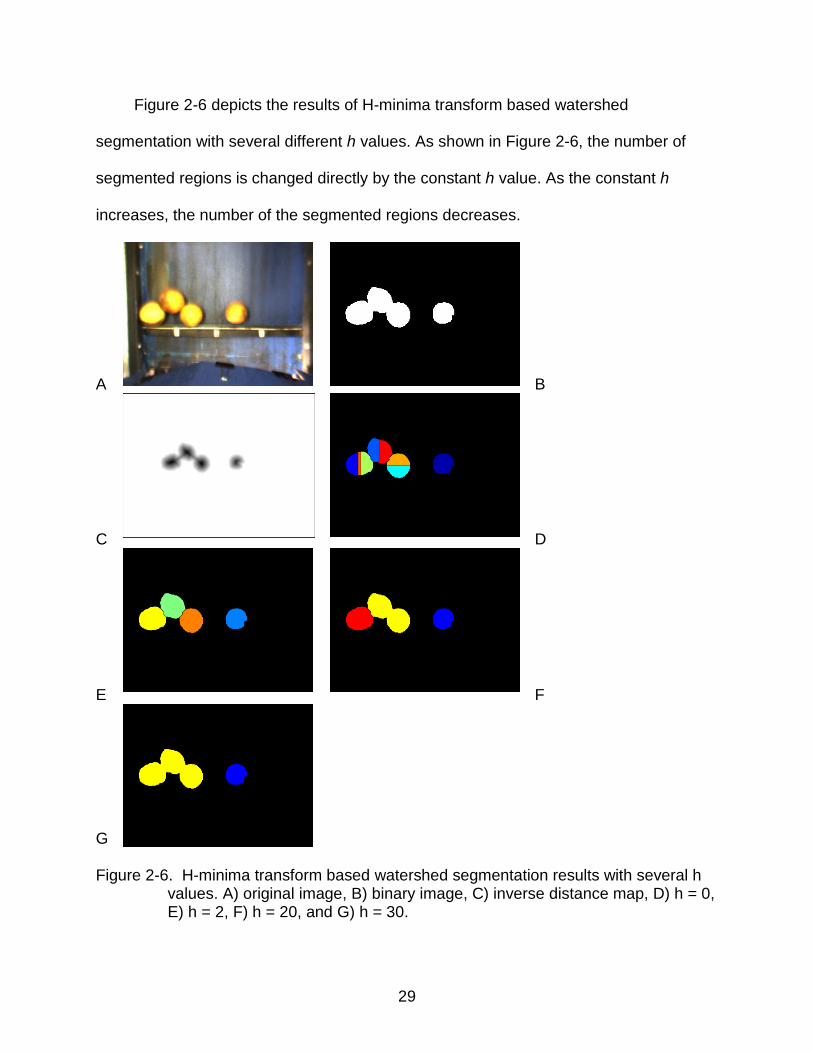
Figure 2-6 depicts the results of H-minima transform based watershed
segmentation with several different h values. As shown in Figure 2-6, the number of
segmented regions is changed directly by the constant h value. As the constant h
increases, the number of the segmented regions decreases.
A B
C D
E
F
G
Figure 2-6. H-minima transform based watershed segmentation results with several h
values. A) original image, B) binary image, C) inverse distance map, D) h = 0, E) h = 2, F) h = 20, and G) h = 30.
30
Fruit diameter estimation and mass estimation
When the calibration image sets were acquired, the diameter of each fruit sample
was measured using a digital calliper. Based on the diameter measurement, the
diameter of the segmented fruit in image can be estimated. Since the measurement was
conducted on only the second and the third experiments, the diameter estimation can
be performed on only those two experiments.
The calibration sets for the second and the third field experiments include the
mass and diameter of the individual fruit samples. Using an equation obtained from a
regression analysis, the estimated diameter can be mapped to fruit mass. The mapping
equation has the form of Eq. 2-6.
43(kg) pdiameterp massEstimated (2-6)
Results and Discussion
Image Processing and Analysis
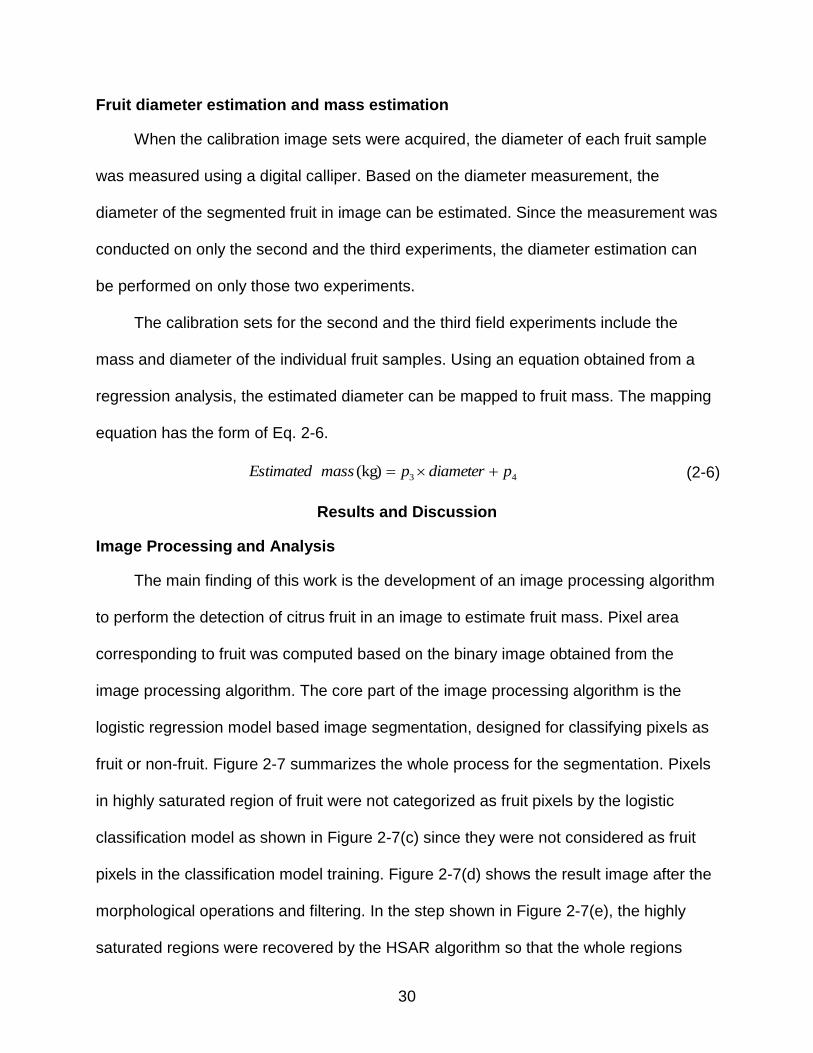
The main finding of this work is the development of an image processing algorithm
to perform the detection of citrus fruit in an image to estimate fruit mass. Pixel area
corresponding to fruit was computed based on the binary image obtained from the
image processing algorithm. The core part of the image processing algorithm is the
logistic regression model based image segmentation, designed for classifying pixels as
fruit or non-fruit. Figure 2-7 summarizes the whole process for the segmentation. Pixels
in highly saturated region of fruit were not categorized as fruit pixels by the logistic
classification model as shown in Figure 2-7(c) since they were not considered as fruit
pixels in the classification model training. Figure 2-7(d) shows the result image after the
morphological operations and filtering. In the step shown in Figure 2-7(e), the highly
saturated regions were recovered by the HSAR algorithm so that the whole regions
31
representing fruit in an image were detected. Figure 2-7(f) depicts the result of the fruit
separation using H-minima transform based watershed transform.
A B
C D
E F Figure 2-7. Summarizing the image processing results. A) original image, B) rectified
image, C) segmented image using logistic regression model, D) image after morphological operations and filtering, E) image after HSAR, and F) image after H-minima transform based watershed separation.
Execution time of the image processing algorithm written in MATLAB for a single
image ranged between 0.512 and 0.676 s. The processing time could be reduced
32
significantly if the algorithm is implemented in machine-level programming language
such as C and C++.
Most of the errors found in the segmentation procedure were due to regions that
share similar color characteristics with fruit. The HSAR algorithm was developed in an
effort to avoid those errors, but it detects only the highly saturated areas, which are very
bright regions. However, dark colored regions can cause the segmentation errors as
well as the very bright regions. Some fruit had dark colored skin. These were very hard
to distinguish from the dark colored non-fruit regions, such as the image of the worn-out
floor of the conveyor belt. Thus, the unwanted area could be classified as fruit pixels.
This would result in a false positive classification error in the mass estimation step.
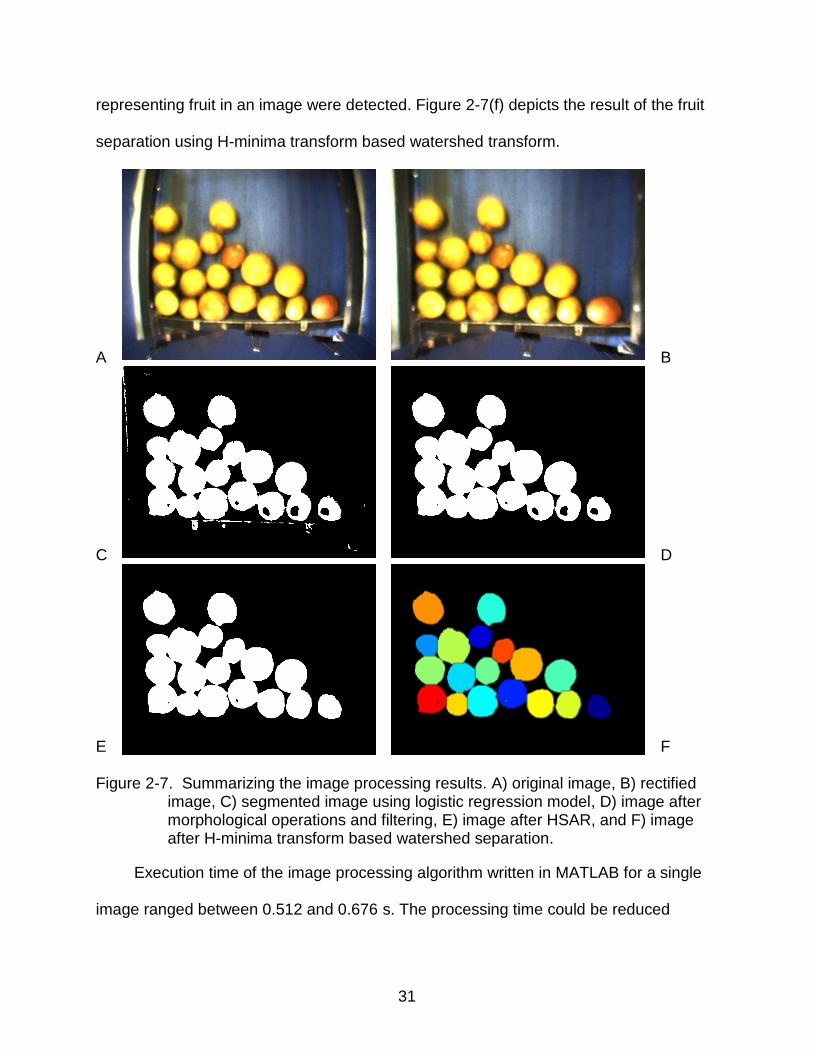
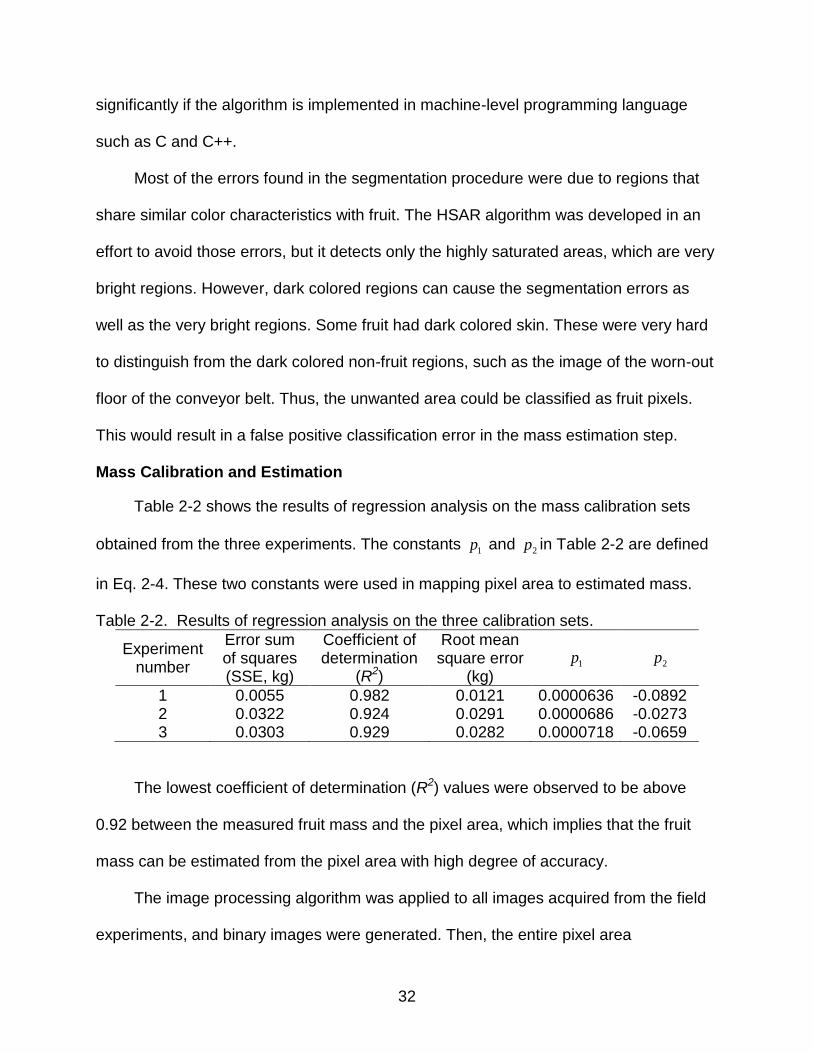
Mass Calibration and Estimation
Table 2-2 shows the results of regression analysis on the mass calibration sets
obtained from the three experiments. The constants 1p and 2p in Table 2-2 are defined
in Eq. 2-4. These two constants were used in mapping pixel area to estimated mass.
Table 2-2. Results of regression analysis on the three calibration sets.
Experiment number
Error sum of squares (SSE, kg)
Coefficient of determination
(R2)
Root mean square error
(kg) 1p 2p
1 0.0055 0.982 0.0121 0.0000636 -0.0892 2 0.0322 0.924 0.0291 0.0000686 -0.0273 3 0.0303 0.929 0.0282 0.0000718 -0.0659
The lowest coefficient of determination (R2) values were observed to be above
0.92 between the measured fruit mass and the pixel area, which implies that the fruit
mass can be estimated from the pixel area with high degree of accuracy.
The image processing algorithm was applied to all images acquired from the field
experiments, and binary images were generated. Then, the entire pixel area
33
corresponding to citrus fruit in the experiment set was computed. The sum of pixel area
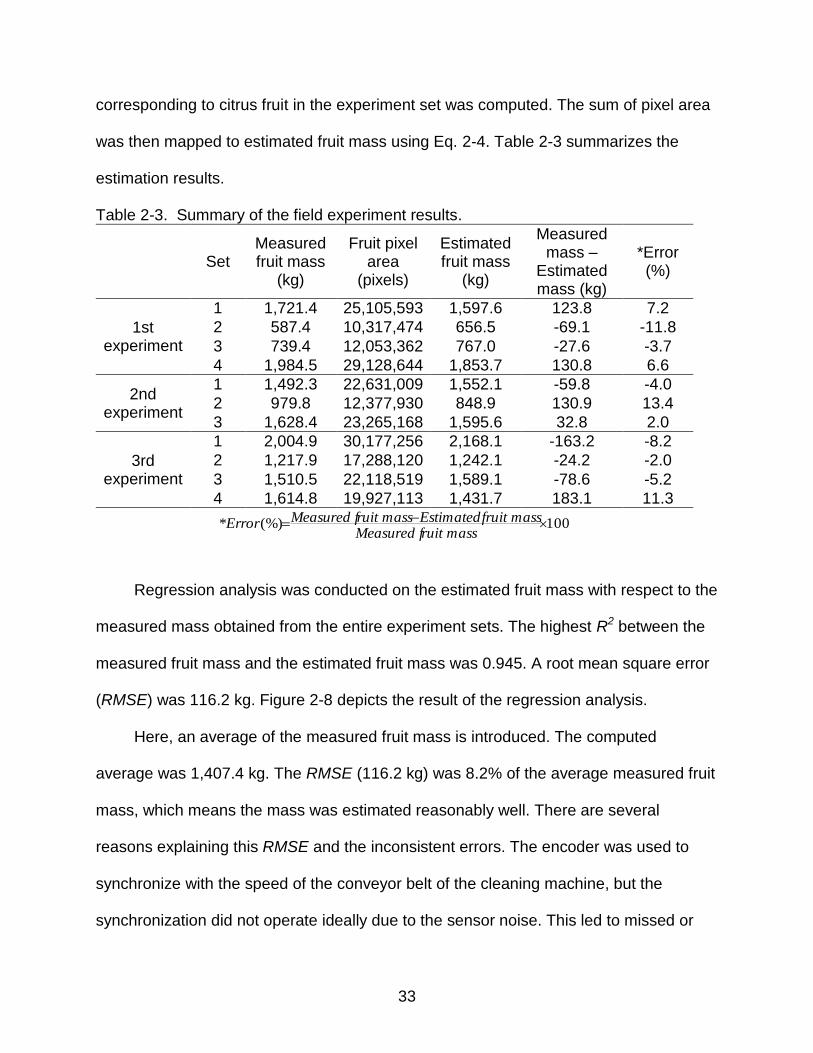
was then mapped to estimated fruit mass using Eq. 2-4. Table 2-3 summarizes the
estimation results.
Table 2-3. Summary of the field experiment results.
Set Measured fruit mass
(kg)
Fruit pixel area
(pixels)
Estimated fruit mass
(kg)
Measured mass –
Estimated mass (kg)
*Error (%)
1st experiment
1 1,721.4 25,105,593 1,597.6 123.8 7.2
2 587.4 10,317,474 656.5 -69.1 -11.8
3 739.4 12,053,362 767.0 -27.6 -3.7
4 1,984.5 29,128,644 1,853.7 130.8 6.6
2nd experiment
1 1,492.3 22,631,009 1,552.1 -59.8 -4.0
2 979.8 12,377,930 848.9 130.9 13.4
3 1,628.4 23,265,168 1,595.6 32.8 2.0
3rd experiment
1 2,004.9 30,177,256 2,168.1 -163.2 -8.2
2 1,217.9 17,288,120 1,242.1 -24.2 -2.0
3 1,510.5 22,118,519 1,589.1 -78.6 -5.2
4 1,614.8 19,927,113 1,431.7 183.1 11.3
100(%)* ruit massMeasured f
fruit massEstimated ruit massMeasured fError
Regression analysis was conducted on the estimated fruit mass with respect to the
measured mass obtained from the entire experiment sets. The highest R2 between the
measured fruit mass and the estimated fruit mass was 0.945. A root mean square error
(RMSE) was 116.2 kg. Figure 2-8 depicts the result of the regression analysis.
Here, an average of the measured fruit mass is introduced. The computed
average was 1,407.4 kg. The RMSE (116.2 kg) was 8.2% of the average measured fruit
mass, which means the mass was estimated reasonably well. There are several
reasons explaining this RMSE and the inconsistent errors. The encoder was used to
synchronize with the speed of the conveyor belt of the cleaning machine, but the
synchronization did not operate ideally due to the sensor noise. This led to missed or
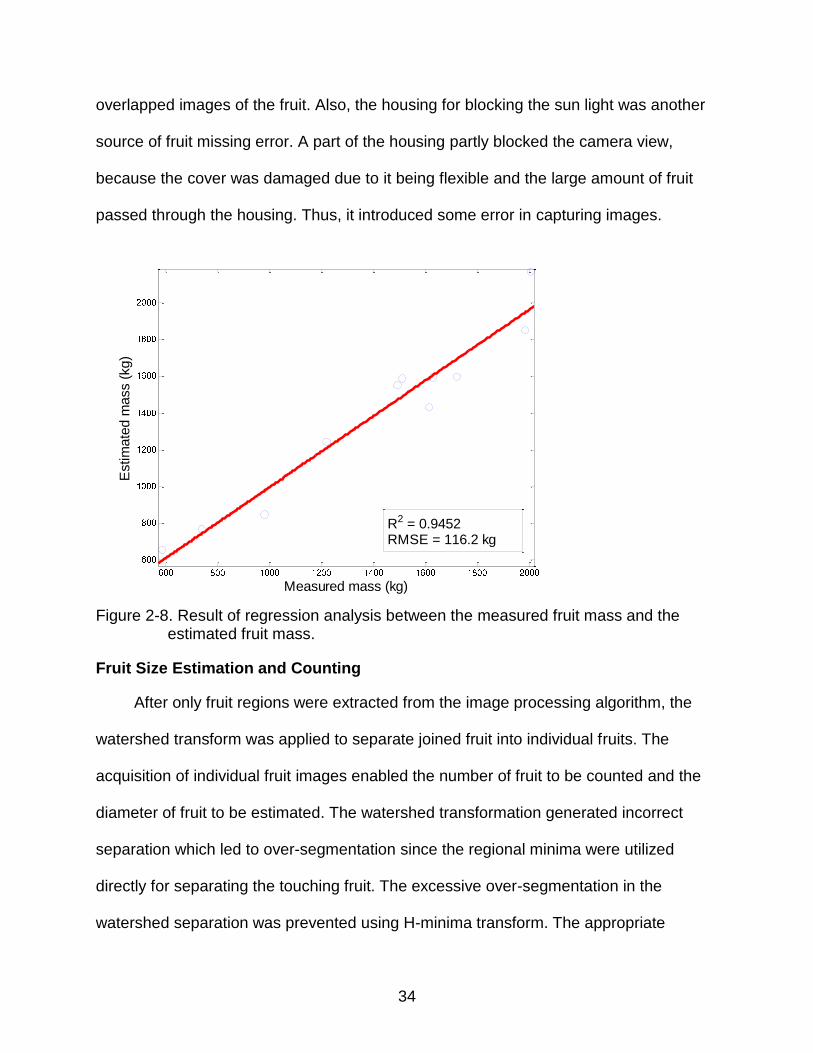
34
overlapped images of the fruit. Also, the housing for blocking the sun light was another
source of fruit missing error. A part of the housing partly blocked the camera view,
because the cover was damaged due to it being flexible and the large amount of fruit
passed through the housing. Thus, it introduced some error in capturing images.
Measured mass (kg)
Estim
ate
d m
ass (
kg)
R2 = 0.9452RMSE = 116.2 kg
Figure 2-8. Result of regression analysis between the measured fruit mass and the
estimated fruit mass.
Fruit Size Estimation and Counting
After only fruit regions were extracted from the image processing algorithm, the
watershed transform was applied to separate joined fruit into individual fruits. The
acquisition of individual fruit images enabled the number of fruit to be counted and the
diameter of fruit to be estimated. The watershed transformation generated incorrect
separation which led to over-segmentation since the regional minima were utilized
directly for separating the touching fruit. The excessive over-segmentation in the
watershed separation was prevented using H-minima transform. The appropriate
35
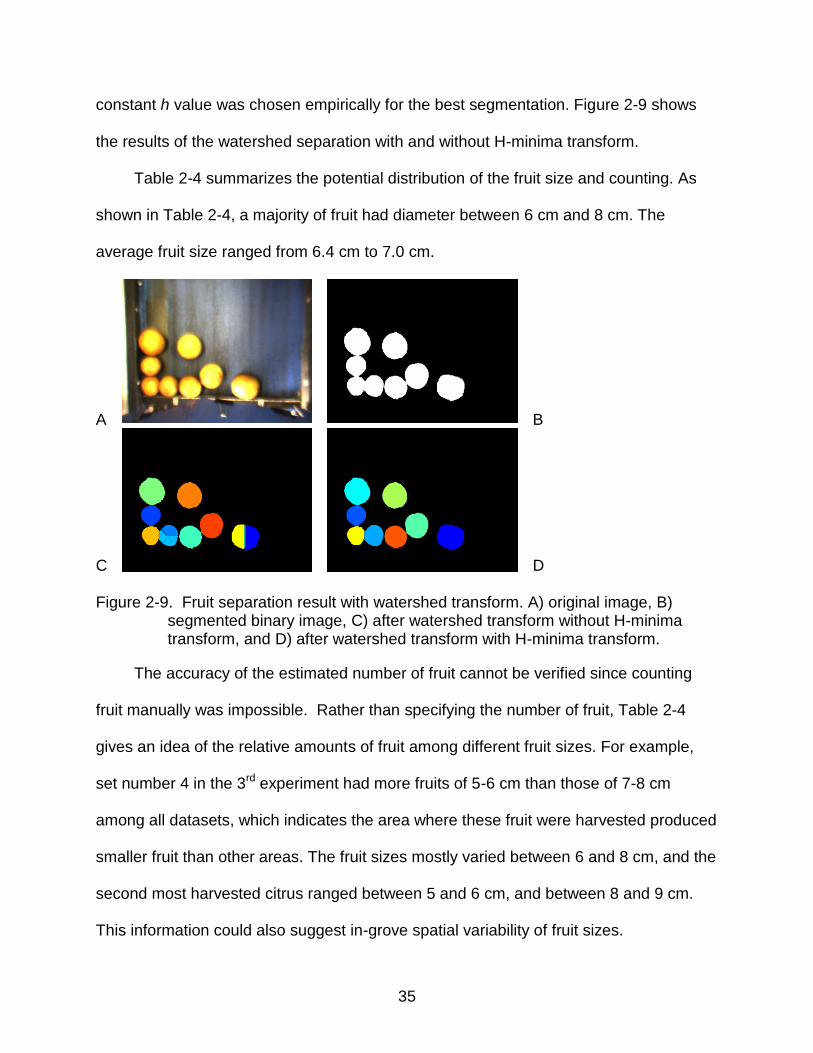
constant h value was chosen empirically for the best segmentation. Figure 2-9 shows
the results of the watershed separation with and without H-minima transform.
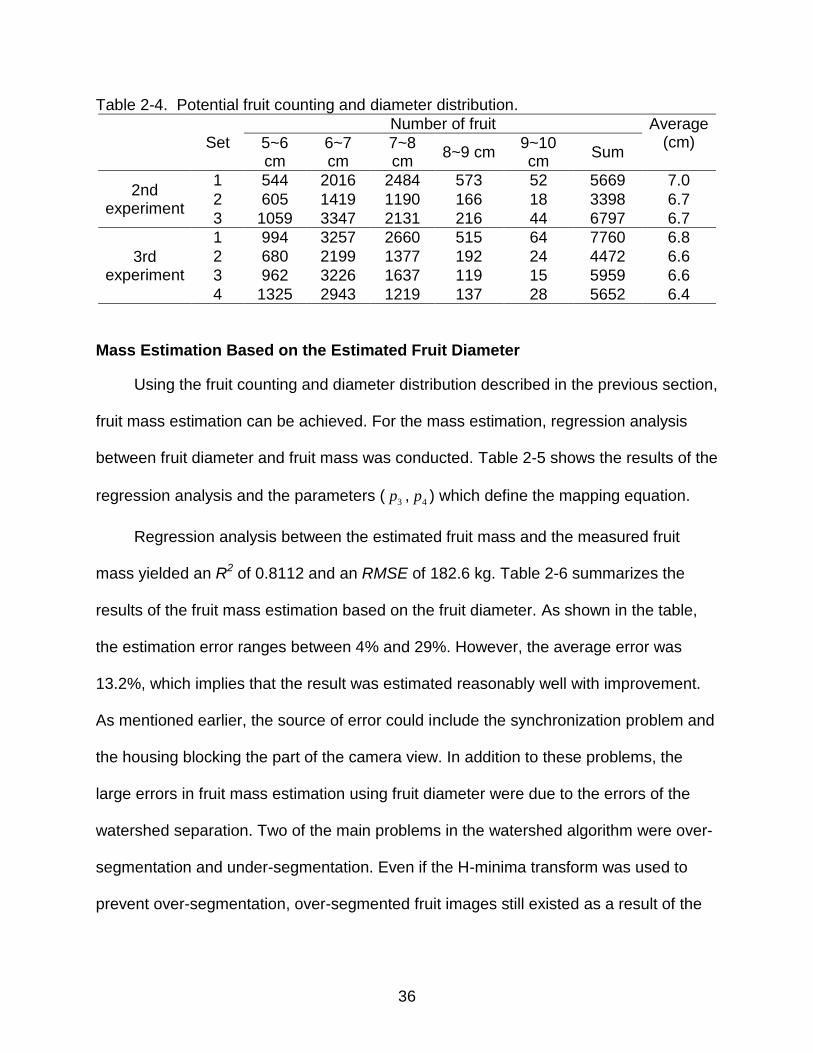
Table 2-4 summarizes the potential distribution of the fruit size and counting. As
shown in Table 2-4, a majority of fruit had diameter between 6 cm and 8 cm. The
average fruit size ranged from 6.4 cm to 7.0 cm.
A B
C D Figure 2-9. Fruit separation result with watershed transform. A) original image, B)
segmented binary image, C) after watershed transform without H-minima transform, and D) after watershed transform with H-minima transform.
The accuracy of the estimated number of fruit cannot be verified since counting
fruit manually was impossible. Rather than specifying the number of fruit, Table 2-4
gives an idea of the relative amounts of fruit among different fruit sizes. For example,
set number 4 in the 3rd experiment had more fruits of 5-6 cm than those of 7-8 cm
among all datasets, which indicates the area where these fruit were harvested produced
smaller fruit than other areas. The fruit sizes mostly varied between 6 and 8 cm, and the
second most harvested citrus ranged between 5 and 6 cm, and between 8 and 9 cm.
This information could also suggest in-grove spatial variability of fruit sizes.
36
Table 2-4. Potential fruit counting and diameter distribution.
Set Number of fruit Average
(cm) 5~6 cm
6~7 cm
7~8 cm
8~9 cm 9~10 cm
Sum
2nd experiment
1 544 2016 2484 573 52 5669 7.0
2 605 1419 1190 166 18 3398 6.7
3 1059 3347 2131 216 44 6797 6.7
3rd experiment
1 994 3257 2660 515 64 7760 6.8
2 680 2199 1377 192 24 4472 6.6
3 962 3226 1637 119 15 5959 6.6
4 1325 2943 1219 137 28 5652 6.4
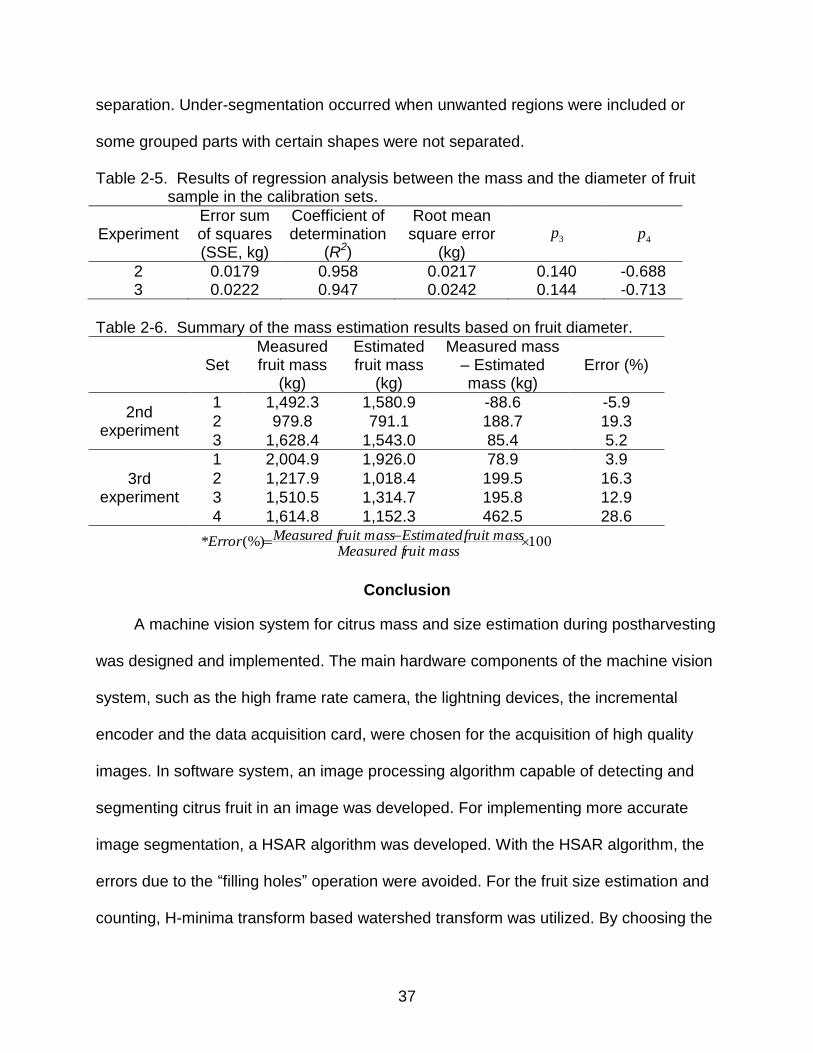
Mass Estimation Based on the Estimated Fruit Diameter
Using the fruit counting and diameter distribution described in the previous section,
fruit mass estimation can be achieved. For the mass estimation, regression analysis
between fruit diameter and fruit mass was conducted. Table 2-5 shows the results of the
regression analysis and the parameters ( 3p , 4p ) which define the mapping equation.
Regression analysis between the estimated fruit mass and the measured fruit
mass yielded an R2 of 0.8112 and an RMSE of 182.6 kg. Table 2-6 summarizes the
results of the fruit mass estimation based on the fruit diameter. As shown in the table,
the estimation error ranges between 4% and 29%. However, the average error was
13.2%, which implies that the result was estimated reasonably well with improvement.
As mentioned earlier, the source of error could include the synchronization problem and
the housing blocking the part of the camera view. In addition to these problems, the
large errors in fruit mass estimation using fruit diameter were due to the errors of the
watershed separation. Two of the main problems in the watershed algorithm were over-
segmentation and under-segmentation. Even if the H-minima transform was used to
prevent over-segmentation, over-segmented fruit images still existed as a result of the
37
separation. Under-segmentation occurred when unwanted regions were included or
some grouped parts with certain shapes were not separated.
Table 2-5. Results of regression analysis between the mass and the diameter of fruit sample in the calibration sets.
Experiment Error sum of squares (SSE, kg)
Coefficient of determination
(R2)
Root mean square error
(kg) 3p
4p
2 0.0179 0.958 0.0217 0.140 -0.688 3 0.0222 0.947 0.0242 0.144 -0.713
Table 2-6. Summary of the mass estimation results based on fruit diameter.
Set Measured fruit mass
(kg)
Estimated fruit mass
(kg)
Measured mass – Estimated mass (kg)
Error (%)
2nd experiment
1 1,492.3 1,580.9 -88.6 -5.9
2 979.8 791.1 188.7 19.3
3 1,628.4 1,543.0 85.4 5.2
3rd experiment
1 2,004.9 1,926.0 78.9 3.9
2 1,217.9 1,018.4 199.5 16.3
3 1,510.5 1,314.7 195.8 12.9
4 1,614.8 1,152.3 462.5 28.6
100(%)* ruit massMeasured f
fruit massEstimated ruit massMeasured fError
Conclusion
A machine vision system for citrus mass and size estimation during postharvesting
was designed and implemented. The main hardware components of the machine vision
system, such as the high frame rate camera, the lightning devices, the incremental
encoder and the data acquisition card, were chosen for the acquisition of high quality
images. In software system, an image processing algorithm capable of detecting and
segmenting citrus fruit in an image was developed. For implementing more accurate
image segmentation, a HSAR algorithm was developed. With the HSAR algorithm, the
errors due to the “filling holes” operation were avoided. For the fruit size estimation and
counting, H-minima transform based watershed transform was utilized. By choosing the
38
appropriate constant h-value, the watershed separation minimized over-segmentation.
Finally, the equations mapping the pixel area to the estimated mass were established
using the calibration sets obtained from the field experiments.
The system was tested on a citrus debris cleaning machine at a commercial citrus
grove. Images taken during the field experiments were converted to binary images
using the developed image processing algorithm. The fruit mass, the number of fruit and
the fruit diameter were estimated based on the output binary images generated from the
image processing algorithms.
The mass estimation was conducted in two ways: pixel area based estimation and
diameter based estimation. The pixel area based method yielded more reasonable
result than the diameter based method. When using the pixel area based method, the
highest coefficient of determination (R2) between the measured fruit mass and the
estimated fruit mass was 0.945. Also, root mean square error (RMSE) was 116.2 kg.
The RMSE was 8.2% of the average measured fruit mass. On the other hand, the
diameter based method yielded an R2 of 0.811 and an RMSE of 182.6 kg.
The research described in this study was conducted as a preliminary test towards
an ultimate goal of developing an advanced real-time yield-mapping system. Although
the proposed system does not provide very site-specific yield information such as tree
by tree yield based on GPS coordinates, yield information for different sections of tree
rows is available under the current system configuration.
The system needs further improvements. In this study, the pixel based
segmentation was used to detect the fruit area in an image. Since this method makes
use of only color information of a pixel, it is vulnerable to illumination change due to the

39
outdoor condition and shadow between touching or occluded objects. Hence, a region
based algorithm should be studied to ease such vulnerability. Incorporation of both pixel
based and region based algorithms may perform better than the individual use of both
algorithms.
40
CHAPTER 3 SPECTRAL ANALYSIS AND IDENTIFICATION OF HLB INFECTED CITRUS FRUIT
Introduction
Citrus is the most important fruit crops in Florida as it is the primary citrus
producing state in the United States, supplying over 63% of the total citrus produced in
the country (NASS, 2012). Citrus industry remains a major part of Florida’s agricultural
economy. The citrus industry generates more than $9 billion in economic activity in
Florida. However, recently it has been adversely affected by citrus greening disease
also known as Huanglongbing (HLB). Huanglongbing is a serious disease of citrus and
some citrus relatives. The diseased tree will decline in its health and life time. Fruit from
the infected trees are small and lopsided in shape and taste abnormally bitter. Hence,
the disease unfavorably affects the quality of juice. Since there is no cure once a tree
becomes infected, the spread of HLB is prevented only by removing the infected trees.
The citrus growers do not remove HLB infected trees, but try to manage fruit quality
without eliminating those infected trees. It is significantly valuable for the growers to
detect HLB disease at early stage. Since symptoms of HLB disease resemble those of
nutrient deficiencies such as iron or zinc deficiency, the identification of HLB infected
trees and fruit is a difficult task only depending on field observations.
Current methods for detection of HLB disease in citrus plants include visual
inspection by trained personnel and DNA test using Polymerase Chain Reaction (PCR)
methods (Jagoueix et al., 1996). Visual inspection is highly subject to human error and
the disease may be present for up to several years before symptoms are visible. PCR
has proven to be the best method available for detection of HLB disease. It is the only
determinant method of detecting the disease. However, it is costly and time-consuming.
41
Recently, spectroscopy and imaging techniques have been widely used in
agricultural applications such as food quality inspection and plant disease detection.
Their popularity is due to the fact that the spectroscopy and imaging techniques are fast
and inexpensive. Also, the techniques provide a non-destructive way of sensing the
change inside the object and it is because spectral reflectance varies when the
chemical components in the surface or subsurface of crop canopy change. For this
reason, there have been many efforts to detect HLB infected citrus plant using
spectroscopy and imaging techniques. For example, Li et al. (2012) and Kumar et al.
(2010) used multispectral and hyperspectral airborne images of citrus groves to detect
HLB infected trees. Airborne spectral features obtained from the multispectral and
hyperspectral images of the citrus greening were analyzed and further utilized to
distinguish HLB infected trees from healthy ones. Pereira et al. (2011) investigated the
potential use of laser-induced fluorescence imaging technique to monitor HLB disease
in citrus plants. They used a diode-pumped solid-state blue laser at 473 nm for
fluorescence excitation of citrus leaf samples. The fluorescence images were recorded
with a CCD digital camera. Ten color descriptors from fluorescence images were
evaluated using a paired Student’s t-test. They reported that the descriptors yielded
promising results to diagnose HLB disease.
The applicability of mid-infrared spectroscopy for detecting HLB disease in citrus
leaves was explored (Sankaran et al., 2010). In their study, spectral signature in the
range 5.15-10.72 µm was acquired from processed leaf samples using a portable mid-
infrared spectrometer. It was shown that the spectra of HLB infected citrus leaves could
be distinguished from the spectra of healthy and nutrient-deficient leaves using mid-
42
infrared spectroscopy. Mishra et al. (2012) applied visible-near infrared spectroscopy
identifying HLB infected citrus trees. Spectral reflectance data of healthy and HLB
infected citrus trees in the wavelength range from 350 to 2500 nm were measured using
a visible-near infrared spectroradiometer. Three techniques, such as k-nearest
neighbors, logistic regression and support vector machines, were used for the
classification. They found out that using only one spectral measurement per tree
resulted in poor classification performance because of large variability in spectral
reflectance of citrus canopy. They suggested that multiple measurements per tree
increased the classification accuracy.
Previous studies on HLB detection using spectroscopy and imaging technique
have been focused on detection of HLB in citrus trees or leaves. They have a benefit of
detecting HLB at early stages of development in citrus groves and assisting citrus
growers to manage and control the disease.
In addition to the HLB detection in citrus trees and leaves, it is also beneficial to
identify HLB infected citrus fruit. Identification of HLB disease in citrus fruit could have a
significantly positive impact in managing fruit quality. In-field detection of HLB disease in
early stage of fruit development could bring a valuable tool that helps citrus growers
manage the fruit quality. Such in-field detection combined with GPS data could be used
to build an infection map.
Objective
The goal of this research was to investigate the possibility of identifying HLB
disease in citrus fruit using visible-near infrared spectroscopy. The specific objectives
were to determine optimal wavelengths that are most responsive to HLB infected fruit
and to develop a spectral method for HLB detection. This study was conducted as a
43
preliminary research with a laboratory setup before implementing an in-field system with
outdoor setup.
Materials and Methods
HLB Associated Characteristics of Citrus Peel
Citrus peel is mainly comprised of two layers. The outermost layer is called flavedo,
whereas the inner layer of citrus peel is called albedo. The flavedo is mostly composed
of cellulosic material but also contains other components, such as essential oils, paraffin
waxes, fatty acids, pigments (carotenoids, chlorophylls, flavonoids), enzymes and etc.
Liao and Burns (2012) evaluated global gene expression in HLB-infected fruit
tissues using microarray containing flavedo, vascular tissue and juice vesicles from
symptomatic, asymptomatic and healthy fruit. They reported that flavedo carbohydrate
content was substantially reduced in symptomatic fruit. Also, it was shown that
symptomatic fruit flavedo had higher chlorophyll content and significantly lower
carotenoid content than healthy fruit flavedo.
Rosales and Burns (2011) investigated carbohydrate and phytohormone
alterations in HLB infected fruit. They demonstrated that starch and sucrose contents
were numerically higher in immature flavedo of healthy fruit as compared with that of
symptomatic fruit. However, mature fruit flavedo of symptomatic fruit had significantly
lower starch and sucrose contents than that of healthy fruit.
These chemical changes in citrus peel due to HLB infection could be identified by
spectroscopy technique since the peel is part of the light path which can affect the
spectrum.
44
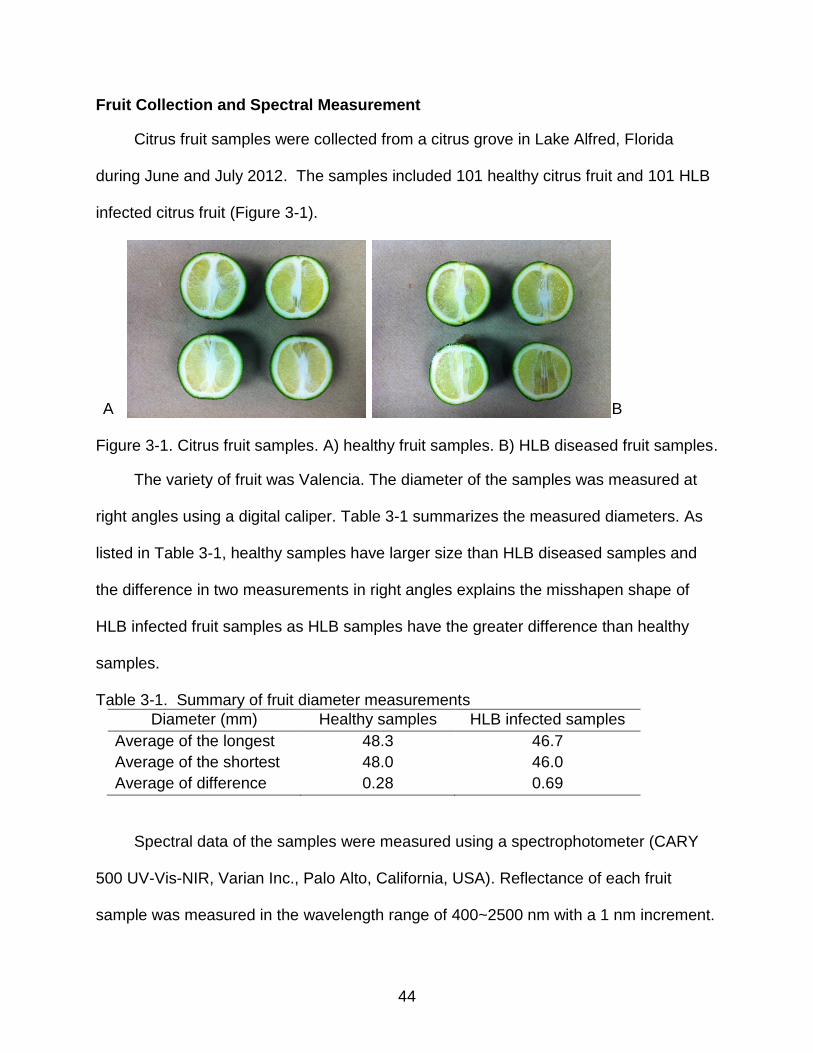
Fruit Collection and Spectral Measurement
Citrus fruit samples were collected from a citrus grove in Lake Alfred, Florida
during June and July 2012. The samples included 101 healthy citrus fruit and 101 HLB
infected citrus fruit (Figure 3-1).
A B Figure 3-1. Citrus fruit samples. A) healthy fruit samples. B) HLB diseased fruit samples.
The variety of fruit was Valencia. The diameter of the samples was measured at
right angles using a digital caliper. Table 3-1 summarizes the measured diameters. As
listed in Table 3-1, healthy samples have larger size than HLB diseased samples and
the difference in two measurements in right angles explains the misshapen shape of
HLB infected fruit samples as HLB samples have the greater difference than healthy
samples.
Table 3-1. Summary of fruit diameter measurements
Diameter (mm) Healthy samples HLB infected samples
Average of the longest 48.3 46.7
Average of the shortest 48.0 46.0
Average of difference 0.28 0.69
Spectral data of the samples were measured using a spectrophotometer (CARY
500 UV-Vis-NIR, Varian Inc., Palo Alto, California, USA). Reflectance of each fruit
sample was measured in the wavelength range of 400~2500 nm with a 1 nm increment.
45
Two spectral datasets acquired from fruit samples were preprocessed before further
analysis. For the preprocessing, moving average filter was applied to the datasets in
order to remove the short-term fluctuations.
Data Analysis and Feature Selection
Spectral derivative analysis
Derivative analysis is very useful in spectral data analysis since the spectral
derivative could lead to the extraction of useful features from spectral data. Although
high order derivative techniques have been utilized in some of previous studies (Wettle
et al., Wilson et al., Hochberg and Atkinson), first and second order derivatives have
been the most commonly used. In this research, the first order derivative of the original
spectral data was employed. It provides information on the rate of change in reflectance
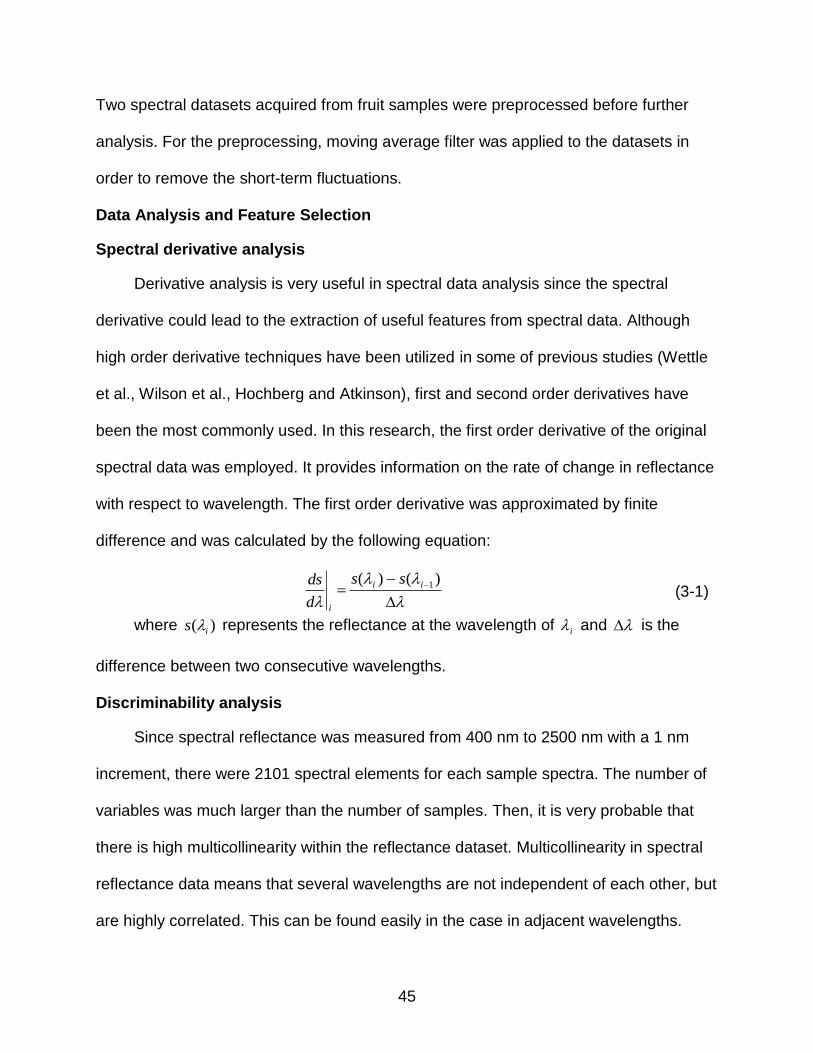
with respect to wavelength. The first order derivative was approximated by finite
difference and was calculated by the following equation:
)()( 1ii
i
ss
d
ds (3-1)
where )( is represents the reflectance at the wavelength of i and is the
difference between two consecutive wavelengths.
Discriminability analysis
Since spectral reflectance was measured from 400 nm to 2500 nm with a 1 nm
increment, there were 2101 spectral elements for each sample spectra. The number of
variables was much larger than the number of samples. Then, it is very probable that
there is high multicollinearity within the reflectance dataset. Multicollinearity in spectral
reflectance data means that several wavelengths are not independent of each other, but
are highly correlated. This can be found easily in the case in adjacent wavelengths.
46
Many of modeling methods are not straightforwardly applicable to high dimensional data
with high multicollinearity. This leads to the necessity of reducing multicollinearity in the
spectral data.
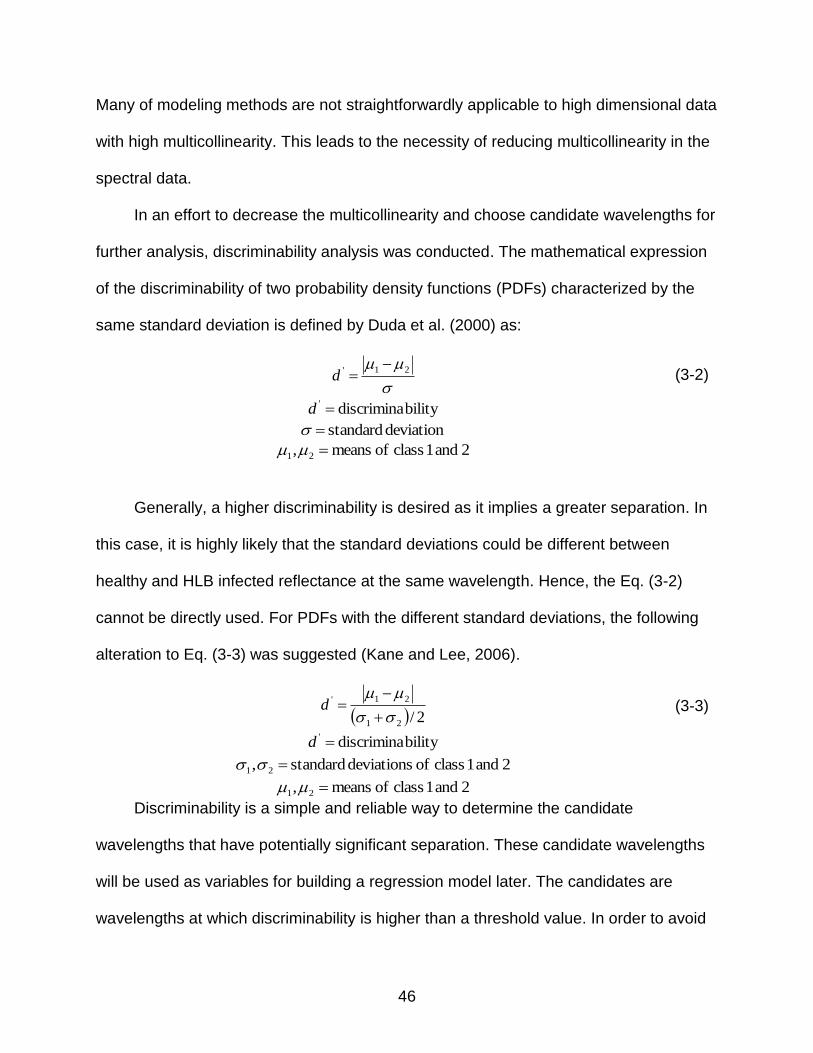
In an effort to decrease the multicollinearity and choose candidate wavelengths for
further analysis, discriminability analysis was conducted. The mathematical expression
of the discriminability of two probability density functions (PDFs) characterized by the
same standard deviation is defined by Duda et al. (2000) as:
21'
d (3-2)
bilitydiscrimina' d
deviation standard
2 and 1 class of means, 21
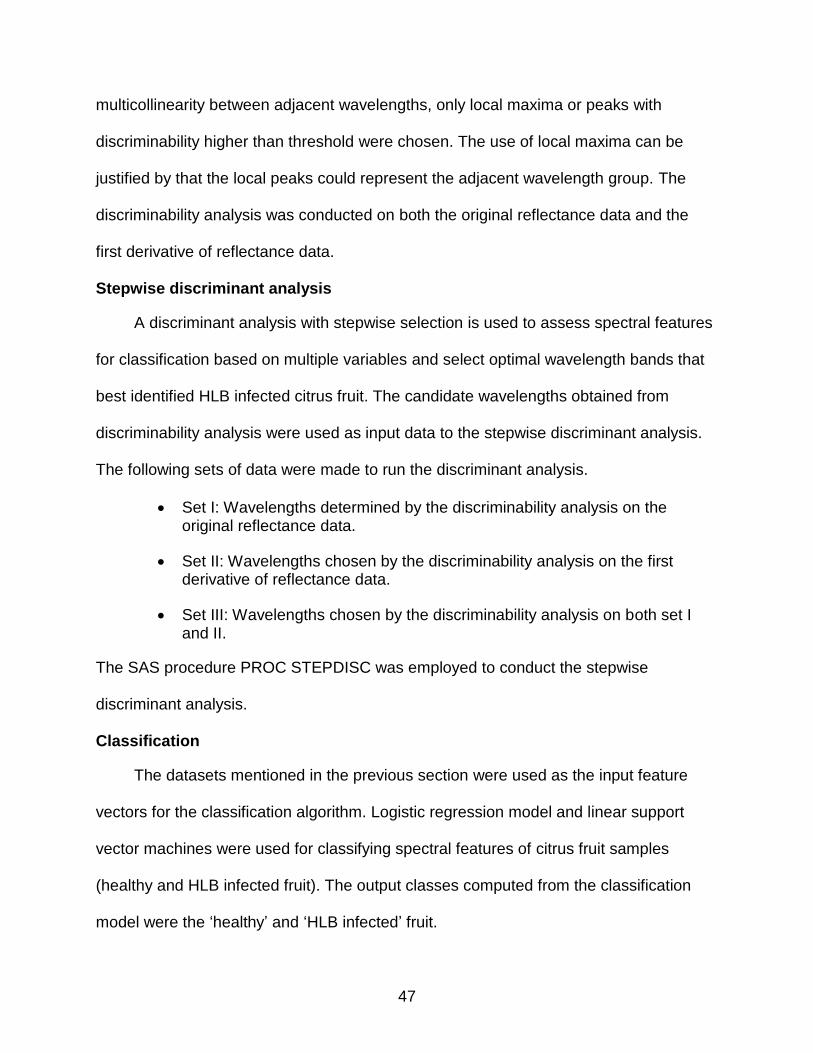
Generally, a higher discriminability is desired as it implies a greater separation. In
this case, it is highly likely that the standard deviations could be different between
healthy and HLB infected reflectance at the same wavelength. Hence, the Eq. (3-2)
cannot be directly used. For PDFs with the different standard deviations, the following
alteration to Eq. (3-3) was suggested (Kane and Lee, 2006).
2/21
21'
d (3-3)
bilitydiscrimina' d
2 and 1 class of deviations standard, 21
2 and 1 class of means, 21
Discriminability is a simple and reliable way to determine the candidate
wavelengths that have potentially significant separation. These candidate wavelengths
will be used as variables for building a regression model later. The candidates are
wavelengths at which discriminability is higher than a threshold value. In order to avoid
47
multicollinearity between adjacent wavelengths, only local maxima or peaks with
discriminability higher than threshold were chosen. The use of local maxima can be
justified by that the local peaks could represent the adjacent wavelength group. The
discriminability analysis was conducted on both the original reflectance data and the
first derivative of reflectance data.
Stepwise discriminant analysis
A discriminant analysis with stepwise selection is used to assess spectral features
for classification based on multiple variables and select optimal wavelength bands that
best identified HLB infected citrus fruit. The candidate wavelengths obtained from
discriminability analysis were used as input data to the stepwise discriminant analysis.
The following sets of data were made to run the discriminant analysis.
Set I: Wavelengths determined by the discriminability analysis on the original reflectance data.
Set II: Wavelengths chosen by the discriminability analysis on the first derivative of reflectance data.
Set III: Wavelengths chosen by the discriminability analysis on both set I and II.
The SAS procedure PROC STEPDISC was employed to conduct the stepwise
discriminant analysis.
Classification
The datasets mentioned in the previous section were used as the input feature
vectors for the classification algorithm. Logistic regression model and linear support
vector machines were used for classifying spectral features of citrus fruit samples
(healthy and HLB infected fruit). The output classes computed from the classification
model were the ‘healthy’ and ‘HLB infected’ fruit.
48
Logistic regression
Identification of citrus fruit as healthy or HLB infected can be defined as a binary
classification problem. For the binary classification, logistic regression model is utilized.
Logistic regression is quick to train and easy to implement. The logistic regression
model is defined by Eq. 3-4.
1,0 ,1
1)(
y
exwgy
xw
TT
(3-4)
where
zezg
1
1)( (3-5)
A function )(zg in Eq. 3-5 is the logistic sigmoid function (Bishop, 2006). The
variable in Eq. 3-4 represents the feature vector. A weight vector represented by the
variable w is determined by the gradient ascent rule satisfying maximum likelihood
condition. The outcome of this classification is a binary number that indicates whether
healthy or HLB infected. The value zero (0) indicates a healthy fruit, and the value one
(1) represents a HLB diseased fruit.
Linear Support Vector Machines
Support vector machine (SVM) was first introduced by Vapnik (1995) and originally
intended to solve pattern recognition problems. Basic idea of support vector machines is
to build a classification model by mapping the data into a higher dimensional input
space and constructing optimal hyperplane for linearly separable patterns. Basically,
SVM model was designed to solve binary classification problem in which the input data
and the output classes are defined as ix and 1,1iy , respectively. The hyperplane
separates the positive from the negative examples in the training set. The points x
49
which lie on the hyperplane satisfy 0 bxw T , where x is normal to the hyperplane.
Then, wb / is the perpendicular distance from the hyperplane to the origin, and w is
the Euclidean norm of w . This can be formulated as follows:
1yfor 1 i bwxi
1yfor 1 i bwxi (3-6)
Two equations in Eq. (3-6) are combined into a set of inequalities as follows:
ibyi 0 1wxi (3-7)
The points for which the equality in Eq. (3-6) holds lie on both hyperplane
1 bwxi and 1 bwxi . Hence, the margin between the two data sets pertaining
to each hyperplane is simply w/2 . The margin can be maximized by minimizing 2/2
w
subject to the constraint of Eq. (3-7).
For the maximization, positive Lagrange multipliers i for each of the inequality
constraints in Eq. (3-7) are introduced. The objective now is to minimize pL given by Eq.
(3-8) with respect to the weight vector w and maximize it with respect to the
undetermined multipliers 0i .
i i
i
T
iip byL wxw i
2
2
1 (3-8)
The optimization problem can be formulated as follows:
pb
L0,
maxminw
(3-9)
This problem can be solved by standard quadratic programming techniques. Once
the optimization is completed, it is determined on which side of the hyperplane a given
test vector x lies. In other words, it is classified to one class (“1”) or to the other (“-1”).
The decision function is given by following equation.
)sgn()( bf T wxx (3-10)
50
Results and Discussion
Spectral Reflectance and its First Derivative
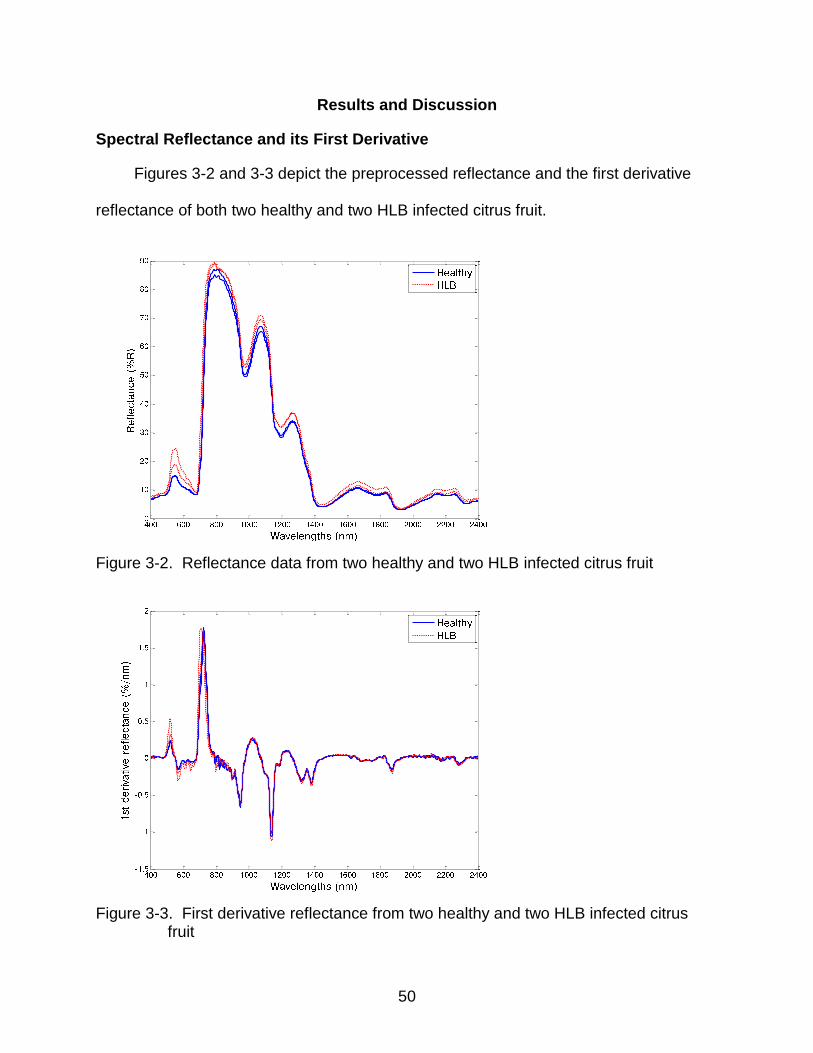
Figures 3-2 and 3-3 depict the preprocessed reflectance and the first derivative
reflectance of both two healthy and two HLB infected citrus fruit.
Figure 3-2. Reflectance data from two healthy and two HLB infected citrus fruit
Figure 3-3. First derivative reflectance from two healthy and two HLB infected citrus
fruit
51
Data Analysis and Feature Selection
A whole dataset consisted of the original reflectance and the first derivatives
computed from 202 citrus fruit spectra (101 healthy, 101 HLB infected). The dataset
was randomly divided into two sets: training and validation sets. The training set
included 67 healthy and 67 HLB infected, whereas the validation set contained 34
healthy and 34 HLB infected.
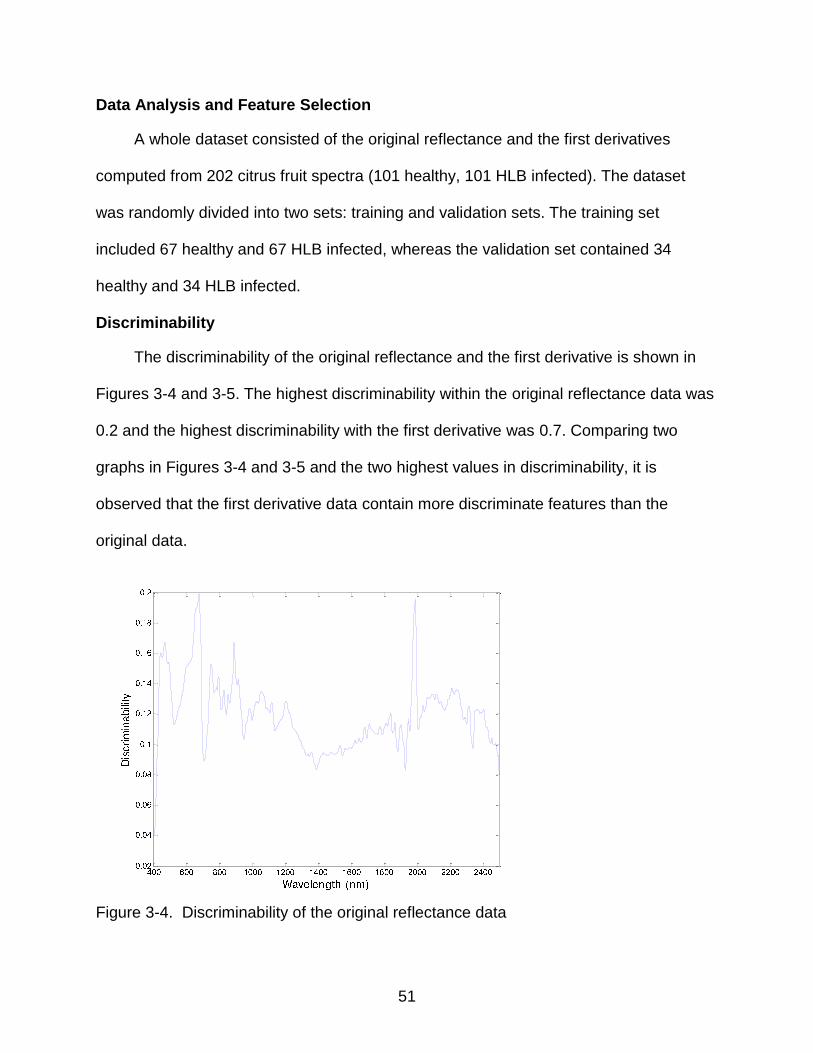
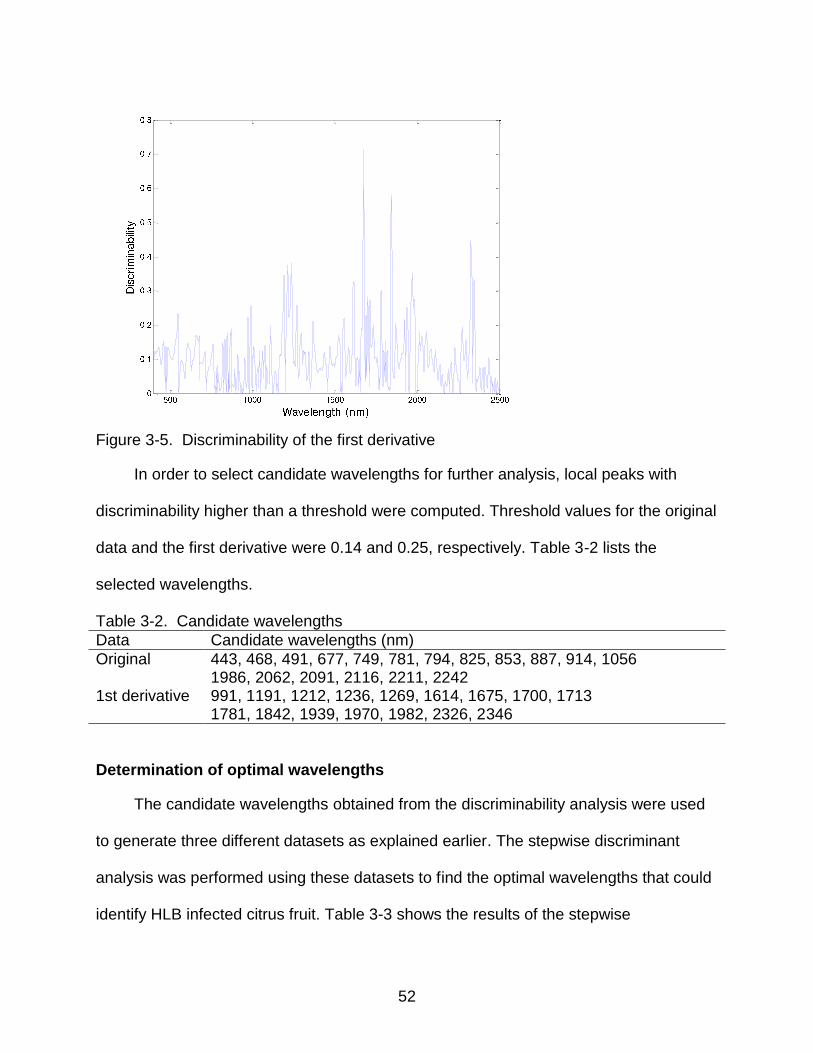
Discriminability
The discriminability of the original reflectance and the first derivative is shown in
Figures 3-4 and 3-5. The highest discriminability within the original reflectance data was
0.2 and the highest discriminability with the first derivative was 0.7. Comparing two
graphs in Figures 3-4 and 3-5 and the two highest values in discriminability, it is
observed that the first derivative data contain more discriminate features than the
original data.
Figure 3-4. Discriminability of the original reflectance data
52
Figure 3-5. Discriminability of the first derivative
In order to select candidate wavelengths for further analysis, local peaks with
discriminability higher than a threshold were computed. Threshold values for the original
data and the first derivative were 0.14 and 0.25, respectively. Table 3-2 lists the
selected wavelengths.
Table 3-2. Candidate wavelengths
Data Candidate wavelengths (nm)
Original 443, 468, 491, 677, 749, 781, 794, 825, 853, 887, 914, 1056 1986, 2062, 2091, 2116, 2211, 2242
1st derivative 991, 1191, 1212, 1236, 1269, 1614, 1675, 1700, 1713 1781, 1842, 1939, 1970, 1982, 2326, 2346
Determination of optimal wavelengths
The candidate wavelengths obtained from the discriminability analysis were used
to generate three different datasets as explained earlier. The stepwise discriminant
analysis was performed using these datasets to find the optimal wavelengths that could
identify HLB infected citrus fruit. Table 3-3 shows the results of the stepwise
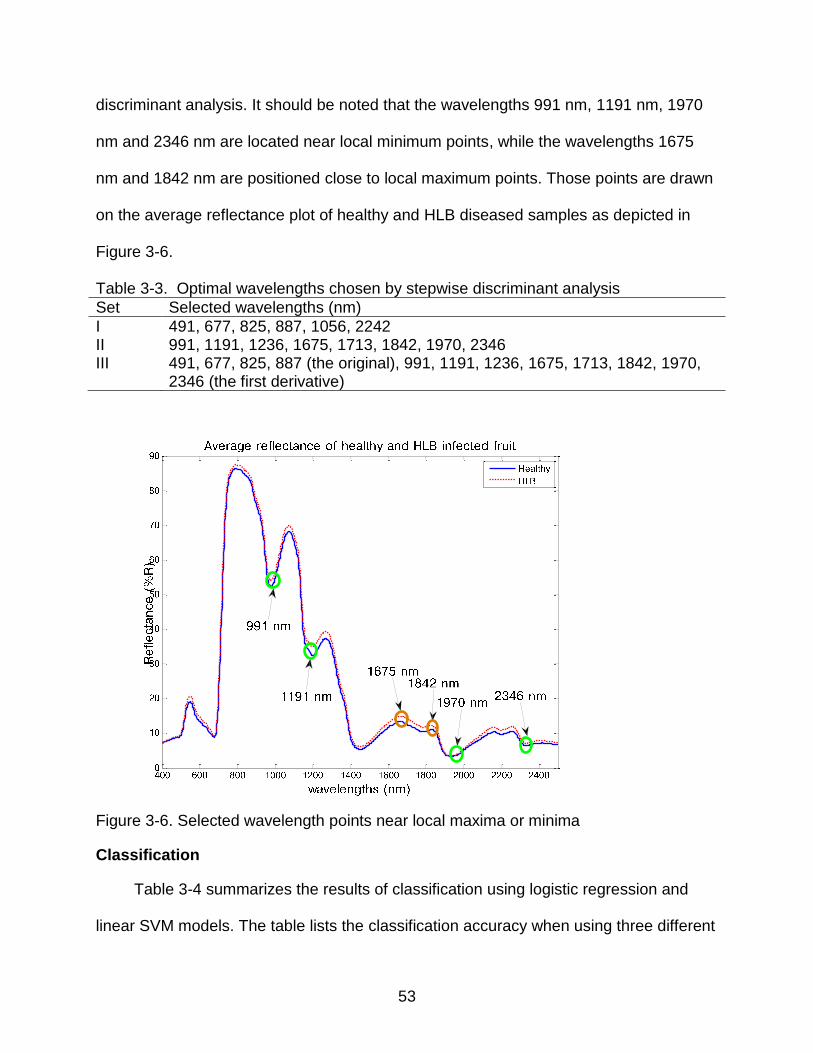
53
discriminant analysis. It should be noted that the wavelengths 991 nm, 1191 nm, 1970
nm and 2346 nm are located near local minimum points, while the wavelengths 1675
nm and 1842 nm are positioned close to local maximum points. Those points are drawn
on the average reflectance plot of healthy and HLB diseased samples as depicted in
Figure 3-6.
Table 3-3. Optimal wavelengths chosen by stepwise discriminant analysis
Set Selected wavelengths (nm)
I 491, 677, 825, 887, 1056, 2242 II 991, 1191, 1236, 1675, 1713, 1842, 1970, 2346 III 491, 677, 825, 887 (the original), 991, 1191, 1236, 1675, 1713, 1842, 1970,
2346 (the first derivative)
Figure 3-6. Selected wavelength points near local maxima or minima
Classification
Table 3-4 summarizes the results of classification using logistic regression and
linear SVM models. The table lists the classification accuracy when using three different
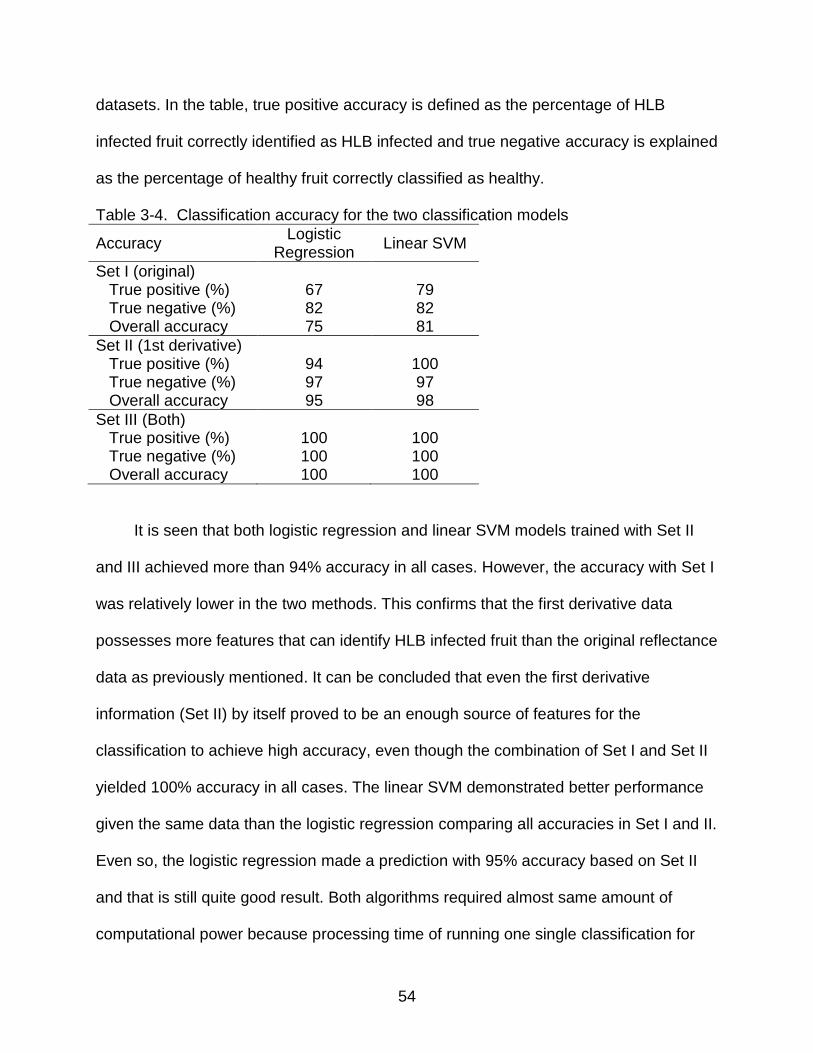
54
datasets. In the table, true positive accuracy is defined as the percentage of HLB
infected fruit correctly identified as HLB infected and true negative accuracy is explained
as the percentage of healthy fruit correctly classified as healthy.
Table 3-4. Classification accuracy for the two classification models
Accuracy Logistic
Regression Linear SVM
Set I (original) True positive (%) 67 79 True negative (%) 82 82 Overall accuracy 75 81
Set II (1st derivative) True positive (%) 94 100 True negative (%) 97 97 Overall accuracy 95 98
Set III (Both) True positive (%) 100 100 True negative (%) 100 100 Overall accuracy 100 100
It is seen that both logistic regression and linear SVM models trained with Set II
and III achieved more than 94% accuracy in all cases. However, the accuracy with Set I
was relatively lower in the two methods. This confirms that the first derivative data
possesses more features that can identify HLB infected fruit than the original reflectance
data as previously mentioned. It can be concluded that even the first derivative
information (Set II) by itself proved to be an enough source of features for the
classification to achieve high accuracy, even though the combination of Set I and Set II
yielded 100% accuracy in all cases. The linear SVM demonstrated better performance
given the same data than the logistic regression comparing all accuracies in Set I and II.
Even so, the logistic regression made a prediction with 95% accuracy based on Set II
and that is still quite good result. Both algorithms required almost same amount of
computational power because processing time of running one single classification for
55
both algorithms was less than 4 msec. Hence, the linear SVM is preferable model for
classifying HLB infected citrus fruit, because it performed better classification accuracy
than the logistic regression model.
Conclusion
As a preliminary research, the feasibility of identifying HLB disease in citrus fruit
using visible-near infrared spectroscopy was investigated in a laboratory setup. For this
study, citrus fruit samples (101 healthy and 101 HLB infected) were collected from a
citrus grove in Lake Alfred, Florida during June and July 2012. Spectral reflectance (400
to 2500 nm) of the fruit samples were measured using a spectrophotometer. The
reflectance and its first derivative were analyzed using discriminability analysis and the
candidate wavelengths were selected as a result of the analysis. Wavelength features
for classification were chosen by stepwise discriminant analysis. Logistic regress model
and linear support vector machines were used to classify HLB infected citrus fruit.
Surprisingly, both models achieved more than 95% overall accuracy when trained with
the first derivative. The classification results indicated that the first derivative data
contained more discriminate features than the original reflectance.
56
CHAPER 4 SUMMARY AND FUTURE WORKS
The main goal of the research presented in this paper was to investigate new
postharvest techniques that could be beneficial to citrus industry. The research is
divided into two major parts. The first part discussed in Chapter 2 describes a machine
vision based citrus mass and size estimation during post-harvesting. The goal of this
study was to develop a real-time machine vision system for citrus mass and size
estimation in the postharvest citrus debris cleaning machine. To achieve fruit detection,
a supervised learning algorithm was developed, and a modified version of the
watershed algorithm was proposed. The system was tested on a citrus debris cleaning
machine at a commercial citrus grove. Images taken during the field experiments were
converted to binary images using the developed image processing algorithm. The fruit
mass, the number of fruit and the fruit diameter were estimated based on the output
binary images generated from the image processing algorithms.
The second part explained in Chapter 3 investigated the application of
spectroscopy technique for identifying HLB infected citrus fruit. The goal of this study
was to explore the possibility of detecting HLB disease in citrus fruit using visible-near
infrared spectroscopy. In order to find the optimal wavelengths that best distinguish HLB
infected fruit from healthy ones, the discriminability analysis and the stepwise
discriminant analysis were utilized. Two machine learning algorithms (logistic regression
and linear support vector machines) were used to classify HLB infected fruit. The results
suggested that the classification was very accurate when using the first derivative data.
The mass estimation conducted in Chapter 2 was based on two-dimensional
information as it only relied on only fruit on image plane. When performing machine
57
vision based mass estimation, volumetric information along with fruit density could
increase the estimation accuracy. It could be the possible case that even two fruit with
the same size have different weight. It is suggested that stereo vision could achieve
better estimation since it enables us to extract depth information out of images.
In order to improve the machine vision based mass estimation, more efforts need
to be made on resolving problems, such as heating, light source control, juice extraction
and citrus debris. In the field experiment, heating decreased the performance of the
machine vision system. It was significantly important to maintain consistent light
condition and it will enhance the output of a machine vision application. Juice and citrus
debris were the factors that made the fruit detection more difficult. Solving those
problems would augment the result of the mass estimation.
In Chapter 3, the identification of HLB infected citrus fruit using spectroscopy was
implemented in a laboratory setup. This study showed a potential use of spectral
information for identifying HLB infected citrus fruit. It is not hard to predict that future
research will be to implement an in-field system capable of identifying HLB diseased
citrus fruit using spectral measurement system such as hyperspectral or multispectral
camera. Under field conditions in a citrus grove, sunlight variation and other
environmental factors could be obstacles to be overcome unlike the laboratory
conditions.
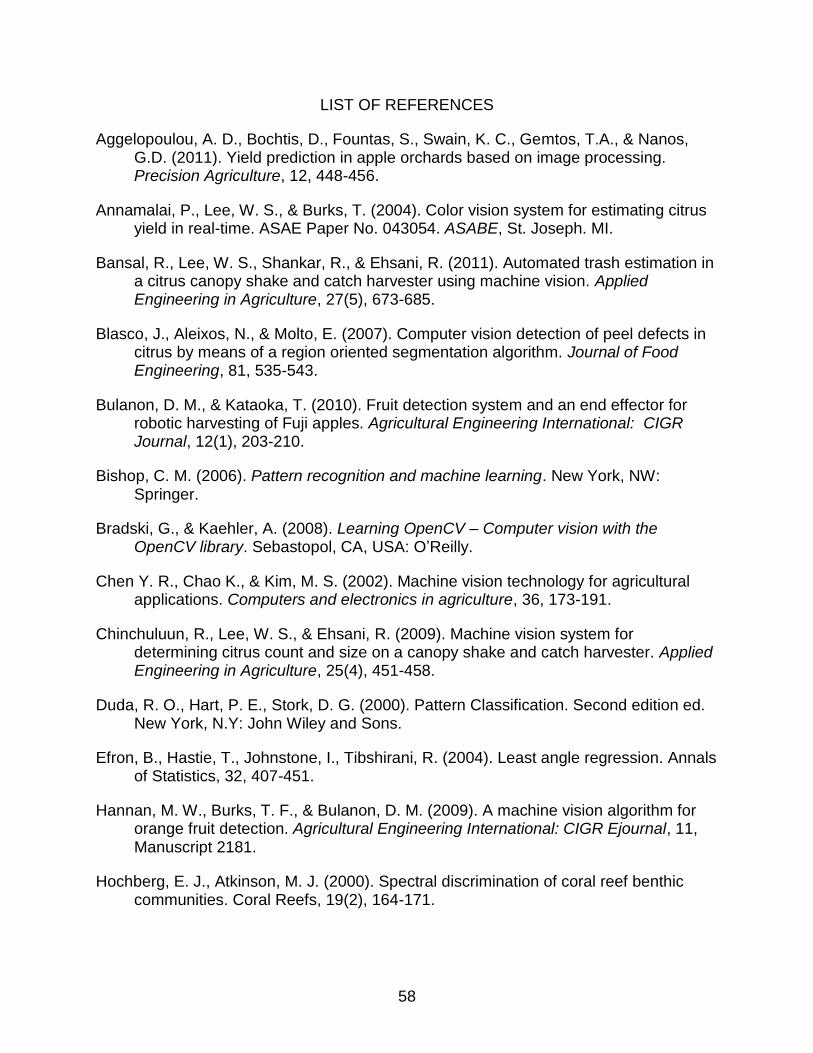
58
LIST OF REFERENCES
Aggelopoulou, A. D., Bochtis, D., Fountas, S., Swain, K. C., Gemtos, T.A., & Nanos, G.D. (2011). Yield prediction in apple orchards based on image processing. Precision Agriculture, 12, 448-456.
Annamalai, P., Lee, W. S., & Burks, T. (2004). Color vision system for estimating citrus yield in real-time. ASAE Paper No. 043054. ASABE, St. Joseph. MI.
Bansal, R., Lee, W. S., Shankar, R., & Ehsani, R. (2011). Automated trash estimation in a citrus canopy shake and catch harvester using machine vision. Applied Engineering in Agriculture, 27(5), 673-685.
Blasco, J., Aleixos, N., & Molto, E. (2007). Computer vision detection of peel defects in citrus by means of a region oriented segmentation algorithm. Journal of Food Engineering, 81, 535-543.
Bulanon, D. M., & Kataoka, T. (2010). Fruit detection system and an end effector for robotic harvesting of Fuji apples. Agricultural Engineering International: CIGR Journal, 12(1), 203-210.
Bishop, C. M. (2006). Pattern recognition and machine learning. New York, NW: Springer.
Bradski, G., & Kaehler, A. (2008). Learning OpenCV – Computer vision with the OpenCV library. Sebastopol, CA, USA: O’Reilly.
Chen Y. R., Chao K., & Kim, M. S. (2002). Machine vision technology for agricultural applications. Computers and electronics in agriculture, 36, 173-191.
Chinchuluun, R., Lee, W. S., & Ehsani, R. (2009). Machine vision system for determining citrus count and size on a canopy shake and catch harvester. Applied Engineering in Agriculture, 25(4), 451-458.
Duda, R. O., Hart, P. E., Stork, D. G. (2000). Pattern Classification. Second edition ed. New York, N.Y: John Wiley and Sons.
Efron, B., Hastie, T., Johnstone, I., Tibshirani, R. (2004). Least angle regression. Annals of Statistics, 32, 407-451.
Hannan, M. W., Burks, T. F., & Bulanon, D. M. (2009). A machine vision algorithm for orange fruit detection. Agricultural Engineering International: CIGR Ejournal, 11, Manuscript 2181.
Hochberg, E. J., Atkinson, M. J. (2000). Spectral discrimination of coral reef benthic communities. Coral Reefs, 19(2), 164-171.
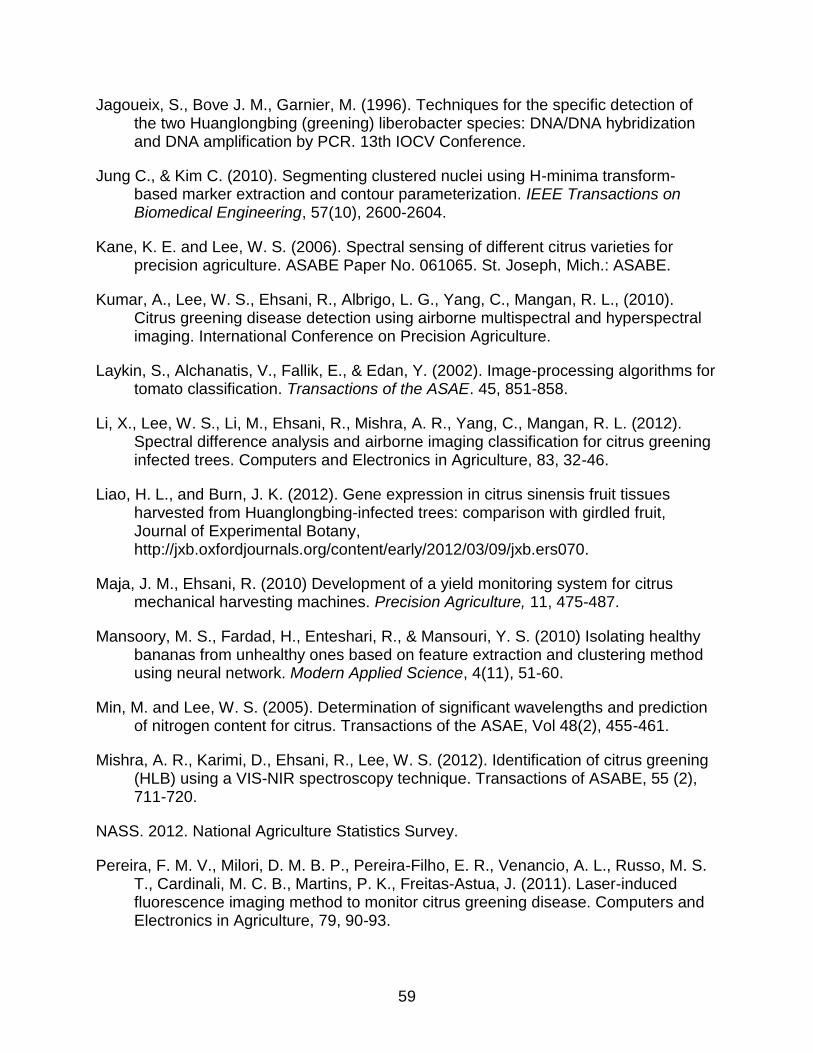
59
Jagoueix, S., Bove J. M., Garnier, M. (1996). Techniques for the specific detection of the two Huanglongbing (greening) liberobacter species: DNA/DNA hybridization and DNA amplification by PCR. 13th IOCV Conference.
Jung C., & Kim C. (2010). Segmenting clustered nuclei using H-minima transform-based marker extraction and contour parameterization. IEEE Transactions on Biomedical Engineering, 57(10), 2600-2604.
Kane, K. E. and Lee, W. S. (2006). Spectral sensing of different citrus varieties for precision agriculture. ASABE Paper No. 061065. St. Joseph, Mich.: ASABE.
Kumar, A., Lee, W. S., Ehsani, R., Albrigo, L. G., Yang, C., Mangan, R. L., (2010). Citrus greening disease detection using airborne multispectral and hyperspectral imaging. International Conference on Precision Agriculture.
Laykin, S., Alchanatis, V., Fallik, E., & Edan, Y. (2002). Image-processing algorithms for tomato classification. Transactions of the ASAE. 45, 851-858.
Li, X., Lee, W. S., Li, M., Ehsani, R., Mishra, A. R., Yang, C., Mangan, R. L. (2012). Spectral difference analysis and airborne imaging classification for citrus greening infected trees. Computers and Electronics in Agriculture, 83, 32-46.
Liao, H. L., and Burn, J. K. (2012). Gene expression in citrus sinensis fruit tissues harvested from Huanglongbing-infected trees: comparison with girdled fruit, Journal of Experimental Botany, http://jxb.oxfordjournals.org/content/early/2012/03/09/jxb.ers070.
Maja, J. M., Ehsani, R. (2010) Development of a yield monitoring system for citrus mechanical harvesting machines. Precision Agriculture, 11, 475-487.
Mansoory, M. S., Fardad, H., Enteshari, R., & Mansouri, Y. S. (2010) Isolating healthy bananas from unhealthy ones based on feature extraction and clustering method using neural network. Modern Applied Science, 4(11), 51-60.
Min, M. and Lee, W. S. (2005). Determination of significant wavelengths and prediction of nitrogen content for citrus. Transactions of the ASAE, Vol 48(2), 455-461.
Mishra, A. R., Karimi, D., Ehsani, R., Lee, W. S. (2012). Identification of citrus greening (HLB) using a VIS-NIR spectroscopy technique. Transactions of ASABE, 55 (2), 711-720.
NASS. 2012. National Agriculture Statistics Survey.
Pereira, F. M. V., Milori, D. M. B. P., Pereira-Filho, E. R., Venancio, A. L., Russo, M. S. T., Cardinali, M. C. B., Martins, P. K., Freitas-Astua, J. (2011). Laser-induced fluorescence imaging method to monitor citrus greening disease. Computers and Electronics in Agriculture, 79, 90-93.
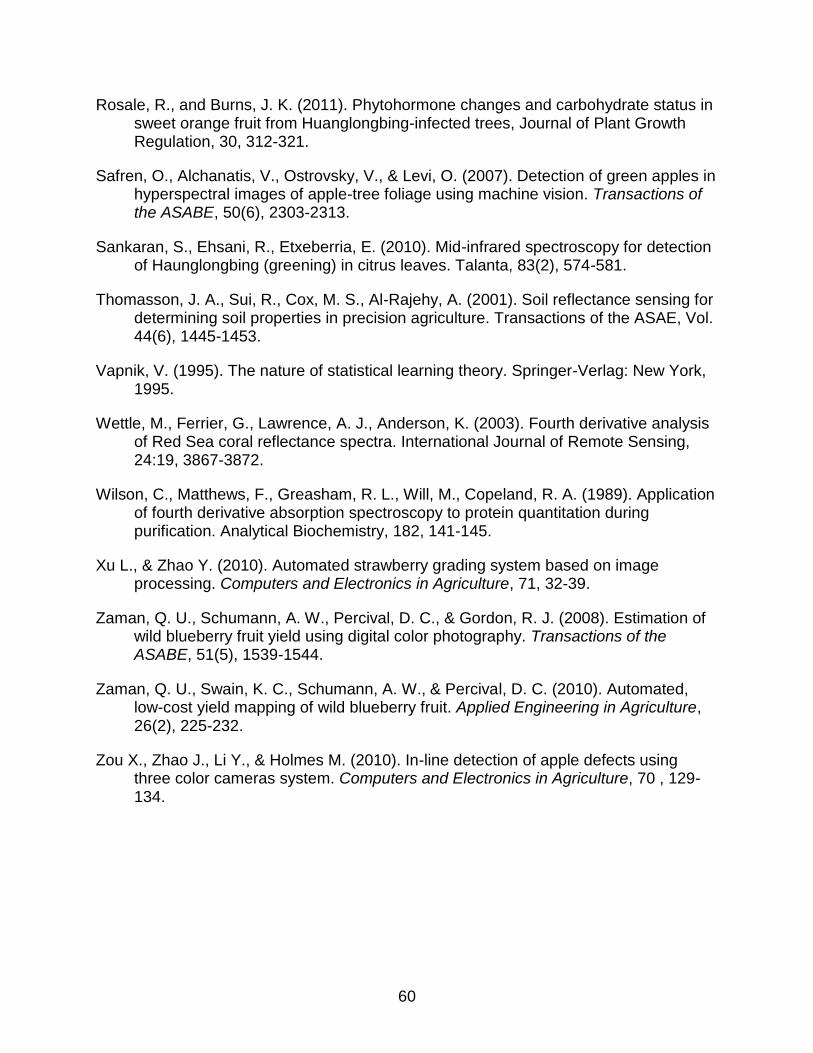
60
Rosale, R., and Burns, J. K. (2011). Phytohormone changes and carbohydrate status in sweet orange fruit from Huanglongbing-infected trees, Journal of Plant Growth Regulation, 30, 312-321.
Safren, O., Alchanatis, V., Ostrovsky, V., & Levi, O. (2007). Detection of green apples in hyperspectral images of apple-tree foliage using machine vision. Transactions of the ASABE, 50(6), 2303-2313.
Sankaran, S., Ehsani, R., Etxeberria, E. (2010). Mid-infrared spectroscopy for detection of Haunglongbing (greening) in citrus leaves. Talanta, 83(2), 574-581.
Thomasson, J. A., Sui, R., Cox, M. S., Al-Rajehy, A. (2001). Soil reflectance sensing for determining soil properties in precision agriculture. Transactions of the ASAE, Vol. 44(6), 1445-1453.
Vapnik, V. (1995). The nature of statistical learning theory. Springer-Verlag: New York, 1995.
Wettle, M., Ferrier, G., Lawrence, A. J., Anderson, K. (2003). Fourth derivative analysis of Red Sea coral reflectance spectra. International Journal of Remote Sensing, 24:19, 3867-3872.
Wilson, C., Matthews, F., Greasham, R. L., Will, M., Copeland, R. A. (1989). Application of fourth derivative absorption spectroscopy to protein quantitation during purification. Analytical Biochemistry, 182, 141-145.
Xu L., & Zhao Y. (2010). Automated strawberry grading system based on image processing. Computers and Electronics in Agriculture, 71, 32-39.
Zaman, Q. U., Schumann, A. W., Percival, D. C., & Gordon, R. J. (2008). Estimation of wild blueberry fruit yield using digital color photography. Transactions of the ASABE, 51(5), 1539-1544.
Zaman, Q. U., Swain, K. C., Schumann, A. W., & Percival, D. C. (2010). Automated, low-cost yield mapping of wild blueberry fruit. Applied Engineering in Agriculture, 26(2), 225-232.
Zou X., Zhao J., Li Y., & Holmes M. (2010). In-line detection of apple defects using three color cameras system. Computers and Electronics in Agriculture, 70 , 129-134.

61
BIOGRAPHICAL SKETCH
Junsu Shin received his bachelor’s degree in automotive engineering from the
Kookmin University , Seoul, Repulic of Korea in 1999. Then, he worked as a software
engineer for several years. He moved to the University of Florida, Gainesville, Florida,
the United States to pursue his graduate studies. He completed his Master of
Engineering degree in agricultural and biological engineering in 2012.


![EU Import of main citrus varieties [tonnes] Citrus fruit](https://img.pdfslide.net/doc/110x75/619169f3fec5567b3a417793/eu-import-of-main-citrus-varieties-tonnes-citrus-fruit-.jpg)