Embed Size (px)
Citation preview
MASTERARBEIT
Titel der Masterarbeit
„The Effect of Institutional Factors on Firm Performance:
A System Dynamics Analysis of Technology Based
Start-Ups in China and Indonesia“
verfasst von
Julia Andrea Grabner, BA BA BSc (WU)
angestrebter akademischer Grad
Master of Arts (MA)
Wien, 2015
Studienkennzahl lt. Studienblatt: A 066 864
Studienrichtung lt. Studienblatt: Masterstudium Wirtschaft und Gesellschaft Ostasiens
Betreut von: Mag. Dr. Alfred Gerstl, MIR
Contents
1. Introduction .................................................................................................................................. 1
1.1. Research Questions ................................................................................................................ 2
1.2. Significance ............................................................................................................................ 3
1.3. Research Design ..................................................................................................................... 4
1.4. State of the Art ....................................................................................................................... 5
2. Theory and Method ...................................................................................................................... 8
2.1. Strategic Management in Emerging Markets .......................................................................... 8
2.1.1. The Resource-Based View............................................................................................ 10
2.1.2. The Industry-Based View ............................................................................................. 19
2.1.3. The Institution-Based View .......................................................................................... 24
2.2. Entrepreneurship and Institutions ......................................................................................... 27
2.2.1. Formal Institutions ........................................................................................................ 28
2.2.2. Informal Institutions ..................................................................................................... 39
2.3. System Theory ...................................................................................................................... 43
2.3.1. Cybernetics, Complexity and Management .................................................................. 44
2.3.2. System Dynamics ......................................................................................................... 46
3. The Start-Up Model ................................................................................................................... 50
3.1. The Basic Model .................................................................................................................. 50
3.1.1. Product Innovation and Value Proposition ................................................................... 51
3.1.2. Customer Relationship.................................................................................................. 53
3.1.3. Infrastructure Management ........................................................................................... 56
3.1.4. Financial Aspects .......................................................................................................... 58
3.2. Institutional Factors .............................................................................................................. 60
3.2.1. Formal Institutions ........................................................................................................ 61
3.2.2. Informal Institutions ..................................................................................................... 68
4. Model Results and Analysis ....................................................................................................... 73
4.1. Country-specific Results ....................................................................................................... 73
4.1.1. China ............................................................................................................................ 73
4.1.2. Indonesia ...................................................................................................................... 80
4.2. Comparative Analysis........................................................................................................... 88
4.2.1. Production Innovation and Value Proposition .............................................................. 88
4.2.2. Customer Relationship.................................................................................................. 90
4.2.3. Infrastructure Management ........................................................................................... 93
4.2.4. Financial Aspects .......................................................................................................... 95
4.3. Sensitivity Analysis .............................................................................................................. 98
4.3.1. Formal Institutions ........................................................................................................ 98
4.3.2. Informal Institutions ................................................................................................... 104
4.4. Discussion of Findings ....................................................................................................... 109
5. Conclusion ................................................................................................................................. 116
Bibliography ..................................................................................................................................... 120
List of Figures .................................................................................................................................... 132
List of Tables ..................................................................................................................................... 133
Appendix I – Model Documentation .................................................................................................. 134
Appendix II – Abstract ....................................................................................................................... 141
Appendix III – Zusammenfassung ..................................................................................................... 142
Appendix IV – Curriculum Vitae ....................................................................................................... 144
1
1. Introduction The recent global economic crisis has caused many countries to rethink their economic
policies and their main ways of income generation. Global economic growth slowed down,
even in economies like China, which experienced two-digit growth rates over many years.
Policy makers are seeking new sources of income that can provide stability for their national
economies, reduce dependencies on other countries and certain business sectors and endure
future economic crises. Among the most favoured new economic strategies are the promotion
of entrepreneurship, technology and innovation.
Indeed, entrepreneurship is an important driver of economic growth (Acs 2007).
Entrepreneurial firms are one of the most important forces in shaping changes in a country’s
economic landscape (Baumol 1968). Individuals create new businesses and new businesses in
turn create jobs, promote competition, increase national productivity and can even advance
technological change. The latter is especially the case for technology based start-up
businesses. Technology based start-ups promote technological innovation which is a central
driver of economic growth (Pathek et al. 2013, p. 2098). They are the prime examples of
Schumpeterian innovative destruction as they develop new technologies, advance current ones
and, by doing so, disrupt established industries and create new ones (Schumpeter 1934).
However, the extraordinary international success of a small number of technology based start-
ups distracts from the fact that failure is very common in the technology industry. Many start-
ups have difficulties to stay in the market (Quatraro & Vivarelli 2014, p. 3), be it in Silicon
Valley (USA), Beijing (China) or Bandung (Indonesia). Much research has focused on the
entrepreneurial characteristics and abilities of start-up founders as keys to explaining venture
success and failure (Tolbert et al. 2011). However, since firms operate in and interact with a
specific political, economic and social environment, the study of personal traits alone does not
provide a complete picture of firm performance. The success or failure of entrepreneurial
firms is also influenced by the environment they are embedded in. This environment is
determined by political, economic and social institutions that define the “rules of the game in
the society” and govern human interaction (North 1990, p. 3). Among these institutions are
laws, rules and regulations, the country’s political situation, the availability of education,
financial markets, culture, etc.
The influence of institutional factors on the performance of start-ups and established firms
is even more important in emerging and developing economies. In these economies, markets
and institutional infrastructure tend to be less developed creating an adverse business
2
environment that might affect not only the performance of single firms but the efficiency and
dynamism of the entire business sector. Underdeveloped and unstable institutions can cause
misallocation of resources and market distortions that can eventually lead to substantial
productivity losses in the entire economy. Understanding the institutional constraints that
firms and in particular technology based start-ups are facing in these economies can create
awareness among policy makers and help create a more favourable environment in which
technology based start-ups are more likely to succeed.
1.1. Research Questions This thesis investigates the institutional environment of technology based start-ups in two
emerging economies: China and Indonesia. It discusses the institutional factors that have
significant impact on the performance of technology based start-ups in these two economies.
The research questions this thesis will try to answer are:
Given the same business model, is a start-up more likely to succeed in China or
Indonesia?
Which are the most critical institutional factors influencing the performance of a
technology based start-up in China and Indonesia?
This thesis is therefore a comparative entrepreneurship study with a special focus on emerging
economies. China and Indonesia have been chosen because the author of this thesis is very
familiar with both countries through personal ties, exchange semesters, internships and
extensive travels. China and Indonesia are different in many aspects but also share remarkable
similarities which makes a comparative study of these two countries feasible and interesting.
China and Indonesia are the largest nations in East Asia with a population of 1.34 billion and
252 million, respectively (The World Bank 2015a; The World Bank 2015b). They have both
experienced major political and economic changes in the past decades. In 1949, China’s civil
war ended and Mao Zedong proclaimed the People’s Republic of China. In the same year, the
Indonesian war of independence was settled when the Netherlands recognised Indonesia’s
sovereignty and Indonesia officially became an independent country. After these new
beginnings, both countries were dominated by charismatic political leaders: Mao Zedong in
China, and Sukarno and Suharto (from 1967) in Indonesia. Until the year 1998, both countries
shared various similarities in their political and economic development (Kong 2010). The
Asian financial crisis in 1997/1998 changed Indonesia’s political and economic situation
abruptly while China was less affected. Today, China and Indonesia share similar
3
development issues such as rapid urbanisation, social-economic disparities and inequality,
limited social welfare, corruption and red tape. They can both be defined as emerging
economies as they are “low-income, rapid-growth countries using economic liberalization as
their primary engine of growth” (Hoskisson et al. 2000, p. 249).
However, China and Indonesia also differ in many aspects. Since the Asian financial crisis,
they have been following different political paths. While China is still a socialist republic run
by one party, the Communist Party of China, Indonesia has become one of the only
democracies in East Asia with a multi-party system. In addition, both countries differ in terms
of culture and religion which probably translates into different attitudes about
entrepreneurship. Busenitz et al. (2000, p. 1001) argue that some countries tend to have an
advantage in developing businesses within a specific industry or with a specific organisational
form. For example, small family businesses may be more successful in countries with a
certain political, economic and social environment but technology based firms may succeed in
countries with a different profile (ibid). This master thesis explores which of the two countries
(China or Indonesia) has the ‘better’ profile to develop profitable technology based start-ups.
1.2. Significance As stated previously, technology based start-ups contribute to economic growth and promote
technological change and innovation. However, many start-ups fail and do not have the
chance to provide value to their environment. Examining the factors which influence start-up
success and failure therefore represents an interesting research area from which the following
stakeholders could benefit:
Scholars and researchers: Most research in this area focuses on developed countries,
so this thesis contributes to research by examining the institutional environment of
technology based start-ups in China and Indonesia. The thesis’ findings may be
applicable to other emerging economies as well. In addition, the combination of
strategic management, institutional theory and systems theory as the thesis’ theoretical
framework contributes to the promotion of interdisciplinary research.
Policy makers: This thesis helps to identify the institutional factors which constrain
entrepreneurs and their start-up’s success. The findings may be used to inspire policies
addressing these obstacles and providing a fertile ground for technological change and
innovation in the country. The focus on China and Indonesia provides insights to the
4
situation of technology based start-ups in two emerging economies and therefore
appeals especially to policy makers in these economies.
Entrepreneurs: This thesis can help entrepreneurs become aware of the institutional
factors which could impede their success. It allows them to consider these factors in
their planning, better estimate risks and find possible solutions to problems and
obstacles.
1.3. Research Design This thesis is divided into three main chapters. The following chapter (2) discusses the
theoretical framework and the method applied in this thesis. The theoretical framework draws
on research from the areas of strategic management, entrepreneurship, new institutional
economics and system theory. It starts by examining start-ups from a business-level
perspective, continues by examining the characteristics of the information technology industry
before discussing the role of institutions in regard to start-up performance. At the end of
chapter 2, system theory introduces the method applied in this thesis.
Chapter 3 develops an analytical model based on the theoretical framework introduced in
chapter 2. The model represents a generic technology based start-up in its institutional
environment. Chapter 3 describes the model in detail and discusses the most important
variables and institutional factors represented in the model. The model simulates a generic
technology based start-up in the Chinese and Indonesian institutional environment over a
period of 60 months.
Chapter 4 analyses the results of the model simulation in both institutional environments
and examines the differences between the effects of institutional factors on start-up
performance in China and Indonesia. First, the country-specific results of China and Indonesia
are discussed separately. Differences in start-up performance in the Chinese and Indonesian
institutional environment are examined through comparative analysis before the most critical
institutional factors influencing start-up performance are identified through sensitivity
analysis. On the basis of the obtained results, strategy recommendations for start-ups and
policy recommendations are given.
Chapter 5 summarizes the major findings, answers the research questions and draws
conclusions.
5
1.4. State of the Art In the past decades, extensive research has been carried out on the key drivers of firm success
and the effects of firm-specific, industry-specific and external factors on the performance of
firms in various countries. However, there is neither consensus on the key factors of firm
success nor a universally accepted theoretical framework to examine firm performance. A
great number of researchers focus on the business-level perspective of firms and attribute
superior performance mainly to firm-specific characteristics such as resources, capabilities
and organisational structure. For example, the theories of Grant (1991, 1996), Barney (1991,
2001) and Prahalad & Hamel (1990) have strongly influenced this view. They provide a
general framework for determining key success factors and are applicable to firms of all sizes,
large multi-national corporations as well as one-person start-ups. External factors such as
industry- and country-specific characteristics are only partially taken into account in these
frameworks. Other scholars have gone beyond the business-level view of firm performance
and developed theories which emphasize the effect of external factors on firm success.
Porter’s (1980, 1985) five forces model which provides a framework for exploring the effect
of industry characteristics on firms is one important example. By including not only industry-
specific characteristics but also other external factors, Peng et al. (2008; 2009) and
Castrogiovanni (1991) have created a holistic theoretical framework to examine firms in their
specific environment. They argue that a firm’s success does not only depend on its own
resources and capabilities, but also on the industry and institutional environment in which it
operates. By considering factors which are beyond the firm’s control, these theoretical
frameworks borrow concepts from disciplines other than strategic management, such as
economics and sociology. In particular, concepts from new institutional economics (North
1990, 2005; Scott 1995) are integrated in the before mentioned holistic frameworks of firm
performance.
While there is extensive research on the performance and key success factors of firms in
general, theories which focus specifically on start-ups and on firms operating in the
information technology industry are less numerous. Amit & Zott (2001), Osterwalder &
Pigneur (2004) and Baron & Hannan (2002) examine success drivers of start-ups in the high
tech industry from a business-level perspective. In addition, many concepts on the business-
level perspective focus on the impact of the founder’s personality, attitudes (e.g.
entrepreneurial orientation) and human capital on start-up success (e.g. Kreiser et al. 2013;
Hechavarria et al. 2012). As for the industry-level perspective, Porter (2001), Shapiro &
Varian (1999) and Varian (2001) examine the characteristics of the information technology
6
industry and include micro and macro-economic concepts in their theories to describe
potential start-up success factors. In addition, as with more general theories on the impact of
external factors on firm performance, new institutional economics is an important perspective
in exploring the connection between start-ups and their environment beyond the industry they
operate in (e.g. Bruton et al. 2010; Van de Ven 1993). In particular, institutional theory is
used by many scholars to study the institutional factors which have an impact on the
entrepreneur’s decision to establish a new business and determine market-entry conditions. It
is less frequently applied in studies on post market-entry performance of start-ups, particularly
technology based start-ups.
Latest research on the key success factors of (technology based) start-ups applies mostly
business-level concepts or institutional theory to examine very specific aspects of start-ups
and their environment. For example, the role of external funding such as venture capital, angel
investors and bank loans is a recurring topic in examining start-up performance (e.g. Colombo
& Grilli 2006; Revest & Sapio 2012; Alexy et al. 2012). Furthermore, the effects of locating
in clusters or incubators and knowledge spillovers are discussed by many scholars (e.g. Belso-
Martinez et al. 2013; Plummer & Acs 2014; Pe’er & Keil 2013; Liu et al. 2010). Popular
topics on the business-level perspective of start-up performance are, for instance, personality
traits and human capital of start-up founders and the start-up’s learning process (e.g. Sommer
et al. 2009; Millán et al. 2014; Colombo & Piva 2012). The start-ups discussed in these
studies are usually based in the United States of America, the European Union or other
developed regions or countries. However, there is a growing number of researchers studying
start-ups in emerging economies, too (e.g. Quatraro & Vivarelli 2014; Wright et al. 2005).
The performance of technology based start-ups in China and Indonesia is not yet very well
studied. Most research on the key success factors of firms in China and Indonesia is focused
on multi-national corporations expanding their business to these countries or small enterprises
operating on an informal basis. In the case of China, some scholars have studied the high
technology industry (including the information technology industry) and special technological
zones (e.g. Wright et al. 2008) and are slowly starting to explore different aspects of
technology based start-ups (e.g. Guo & Jiang 2013; Lau & Bruton 2011). In the case of
Indonesia, there is a growing number of national studies on technology based start-ups, the
information technology industry in general and the impact of external factors such as
institutions on start-up performance. These studies are mainly produced by national research
institutions such as the School of Business and Management (SBM) and the Institut
Teknologi Bandung (ITB) which also publish the Asian Journal of Technology Management.
7
Research on technology based start-ups is also promoted at the yearly Indonesia International
Conference on Innovation, Entrepreneurship, and Small Business (IICIES) that was initiated
by ITB in 2009. However, international research on technology based start-ups and the
information technology industry in Indonesia is very sparse.
Consequently, extensive research has yet to be made on technology based start-ups and the
effect of institutional factors on start-up performance in both China and Indonesia. This thesis
aims to make a contribution to research on technology based start-ups in China and Indonesia
from an institutional perspective and inspire further research in this area.
8
2. Theory and Method This chapter introduces the three most important theoretical concepts used in this thesis. The
first section (chapter 2.1.) discusses the strategy tripod, a theoretical framework within the
field of strategic management (Peng et al. 2008; Peng et al. 2009). The strategy tripod
examines the factors that affect the performance of firms and represents the connection
between managerial decisions and the environment. It consists of three perspectives. The
firm-level perspective examines firm-specific characteristics of successful technology based
start-ups. The industry-level perspective looks at the specifics of the information technology
industry while the institutional perspective introduces the influence of the institutional
environment on firm performance. The second section (chapter 2.2.) elaborates on the
institutional environment of technology based start-ups and discusses the most important
formal and informal institutions affecting their performance. The last section (chapter 2.3.)
introduces system theory. System theory is essential for the understanding of the model that is
developed in the empirical part of this thesis. The model incorporates views from all three
theoretical concepts.
2.1. Strategic Management in Emerging Markets Strategic management is a very diverse and interdisciplinary research area and “lacks a
coherent identity” (Nag et al. 2007, p. 935). In general, strategic management is defined as the
process of aligning the resources and capabilities of a firm to its external environment in order
to create value for its customers, shareholders and society and to achieve competitive
advantage over other firms (Nag et al. 2007, p. 946). Thus strategic management is about
creating a connection between the firm and its environment. This basic definition can also be
found in the special subfield of strategic management in emerging economies. In this subfield,
most research has been done on one of the following four areas (Wright et al. 2005, pp. 3-4):
1. Foreign firms from developed economies entering emerging markets
2. Emerging economy firms competing with each other in their home market
3. Firms from emerging economies entering other emerging markets
4. Firms from emerging economies seeking to enter developed economies
The first area dealing with strategy of foreign firms from developed economies entering
emerging markets has received most attention in research while the last two strategies have
been less researched (ibid). This paper explores the second strategy of emerging economy
firms competing in their home market, and focuses on a specific type of firm in a specific
9
industry: technology based start-ups operating in the information technology industry. Firms
from emerging economies competing within their domestic market do not only face a very
dynamic environment of rapid economic, political and social changes but also have to deal
with relatively underdeveloped or rather ‘idiosyncratic’ product and factor markets such as
high stocks of human capital and low stocks of financial capital (ibid, p. 7). Even though
strategic management research has long focused solely on firms’ resources and capabilities
(resource-based theory) or on industry conditions, a growing number of scholars have started
to emphasize the importance of external factors such as the economic, political and social
environment of firms (Peng et al. 2008, pp. 931-932). Such external factors are often named
‘institutional’ factors as they represent formal and informal constraints which firms are
confronted with. Peng et al. (2008) developed a theoretical framework which allows
examining and structuring the factors that influence a firm’s strategic choices and therefore
helps explain its performance and profitability. This theoretical framework includes the
resources and capabilities of the firm, the industry conditions the firm is faced with as well as
the institutional setting it is embedded in. The resource-based as well as the industry-based
view of the firm have both been criticised for not taking into account the firm’s context (Peng
et al. 2009, p. 65). By including a third perspective, the “strategy tripod” (Peng et al. 2008)
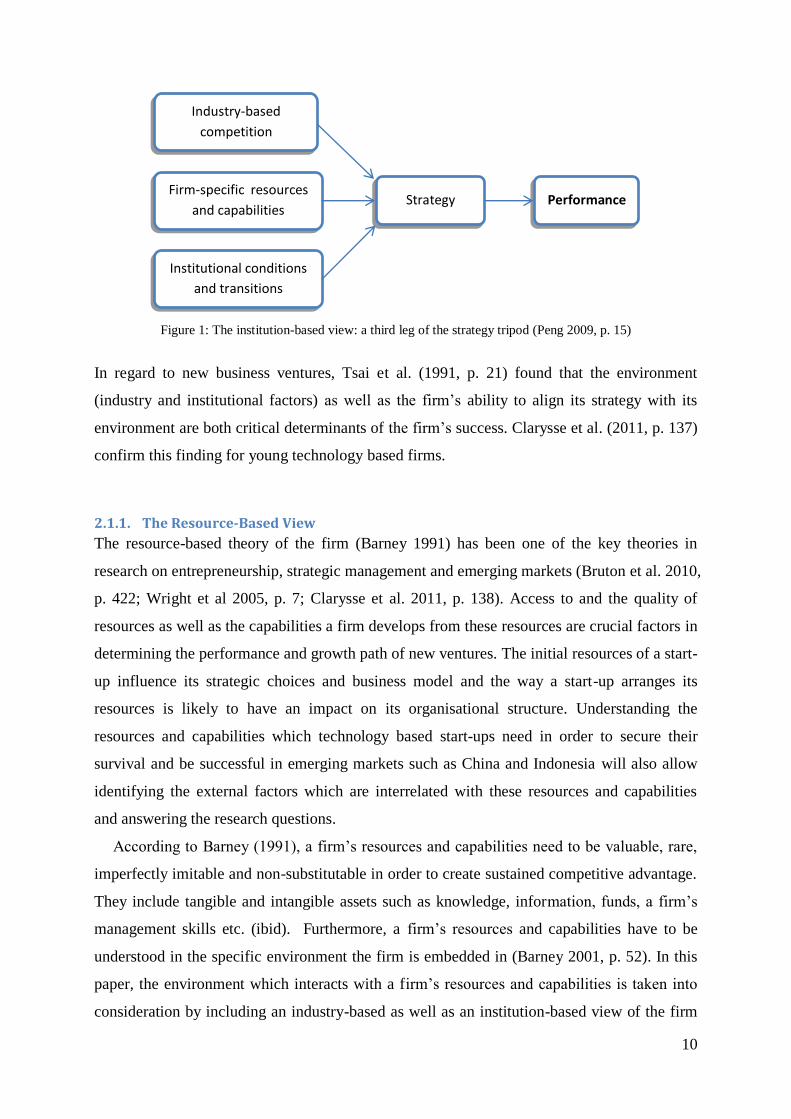
allows for a holistic way to examine a firm’s performance. The strategy tripod includes (Peng
et al. 2009, pp. 71-72):
The resource-based view which argues that firm-specific resources and capabilities
create competitive advantage (Barney 1991)
The industry-based view which suggests that the firm’s performance is influenced by
the degree of competitiveness of the industry it operates in (Porter 1980)
The institution-based view which emphasizes the impact formal and informal
institutions have on firm performance (Peng et al. 2008; Peng et al. 2009)
The final performance of the firm is probably a combination of factors from all of these three
perspectives (Peng et al. 2009, p. 72).
10
Figure 1: The institution-based view: a third leg of the strategy tripod (Peng 2009, p. 15)
In regard to new business ventures, Tsai et al. (1991, p. 21) found that the environment
(industry and institutional factors) as well as the firm’s ability to align its strategy with its
environment are both critical determinants of the firm’s success. Clarysse et al. (2011, p. 137)
confirm this finding for young technology based firms.
2.1.1. The Resource-Based View
The resource-based theory of the firm (Barney 1991) has been one of the key theories in
research on entrepreneurship, strategic management and emerging markets (Bruton et al. 2010,
p. 422; Wright et al 2005, p. 7; Clarysse et al. 2011, p. 138). Access to and the quality of
resources as well as the capabilities a firm develops from these resources are crucial factors in
determining the performance and growth path of new ventures. The initial resources of a start-
up influence its strategic choices and business model and the way a start-up arranges its
resources is likely to have an impact on its organisational structure. Understanding the
resources and capabilities which technology based start-ups need in order to secure their
survival and be successful in emerging markets such as China and Indonesia will also allow
identifying the external factors which are interrelated with these resources and capabilities
and answering the research questions.
According to Barney (1991), a firm’s resources and capabilities need to be valuable, rare,
imperfectly imitable and non-substitutable in order to create sustained competitive advantage.
They include tangible and intangible assets such as knowledge, information, funds, a firm’s
management skills etc. (ibid). Furthermore, a firm’s resources and capabilities have to be
understood in the specific environment the firm is embedded in (Barney 2001, p. 52). In this
paper, the environment which interacts with a firm’s resources and capabilities is taken into
consideration by including an industry-based as well as an institution-based view of the firm
Industry-based
competition
Firm-specific resources
and capabilities
Institutional conditions
and transitions
Strategy Performance
11
(see following sections of this chapter). This section discusses the most important resources
and capabilities of technology based start-ups.
Resources of Technology Based Start-Ups
In general, a start-up refers to a newly established business operating in any industry. A
technology based start-up is a small firm “whose products or services depend largely on the
application of scientific or technological knowledge” (Allen 1992 as cited in Revest & Sapio
2012, p. 179). The most crucial resources for the success of technology based start-ups in
emerging markets are human capital, financial capital and social capital (Chorev & Anderson
2006; Clarysse et al. 2011; Colombo & Grilli 2010; Kiss et al. 2012; Lee et al. 2001; Martens
et al. 2011; Peng 2001).
Human Capital
The primary role of the firm is to combine knowledge in order to create goods and services
and the primary actor in this value creation process is the individual (Grant 1996, p. 112). In
technology based start-ups, the individuals who create goods and services are mainly the
founders of the start-up (at least in the early stage). Scholars of entrepreneurship generally
agree that the human capital of the founders is a key driver for the success of technology
based start-ups (Colombo & Grilli 2010, p. 610). The higher the human capital of the
founders, the more likely a start-up is to follow a positive growth path (ibid). In particular,
studies on entrepreneurial finance suggest that technology based start-ups founded by
individuals with higher human capital attract venture capital financing more easily than other
firms (ibid). Furthermore, founders with human capital in the form of extensive professional
experience have distinctive capabilities which cannot be replicated easily by competitors (ibid,
p. 614). In addition, Kiss et al. (2012, p. 277) emphasize the importance of entrepreneurial
characteristics such as self-commitment, self-efficacy, dynamism, leadership desire and the
entrepreneurs’ ability to overcome constraints and obstacles when founding and managing
firms in emerging markets.
Besides the knowledge and experience of founders, another important resource for
technology based start-ups in terms of human capital is the knowledge of employees. Core
team expertise and diversified knowledge are essential for the success of start-ups (Chorev &
Anderson 2006, p. 168). Hiring and training highly educated employees with expertise in
diverse areas will increase the likelihood that these employees will generate new knowledge
for the firm (Smith et al. 2005, p. 355) which can in turn become a source of competitive
12
advantage (Baron & Hannan 2002, p. 30). Furthermore, start-ups are generally built on a thin
(financial) resource base and must therefore compete on the ability to do more with less (Peng
2001, p. 103). Consequently, making the most of their human capital as in hiring, training and
investing in the best talents as well as retaining such valuable human capital becomes critical
for success (ibid). Baron & Hannan (2002, pp. 30-32) even suggest start-ups to build a brand
in the labour market in order to attract high potentials and win the “war for talent”. In order to
sustain the competitive advantage gained from the founders’ and employees’ knowledge,
start-ups are advised to adopt knowledge creating and sharing practices within their
organization (Martens et al. 2011, p. 5799). This becomes even more critical in dynamic and
complex environments such as emerging economies where change is frequent (ibid).
Financial Capital
Financial resources are another key resource for technology based start-ups (Clarysse et al.
2011, p. 139; Colombo & Grilli 2010, p. 610). Financial resources can be generated by the
start-up itself, borrowed from banks or similar financial institutions (e.g. factoring companies),
or obtained from external investors such as venture capitalists and angel investors. Most
technology based start-ups rely on internal financing, i.e. equity brought into the firm by the
founders (Colombo & Grilli 2007; Revest & Sapio 2012). Only a minority of new technology
based ventures obtains outside financing like bank loans (Colombo & Grilli 2007, p. 25). This
may be explained by the fact that technology based start-ups lack tangible assets which can be
collateralised (Revest & Sapio 2012, p. 179). In addition, their track record is short (ibid).
Venture capital is also difficult to obtain but may become critical for the start-up’s long term
success (Clarysse et al. 2011, p. 139). Venture capital investors do not only provide start-ups
with financial resources but also with additional resources such as management skills and
industry expertise (Colombo & Grilli 2010, p. 611; Lee et al. 2001, p. 634). As venture
capitalists invest equity in start-ups, they have a strong incentive to help the venture succeed
and therefore provide them with additional resources and capabilities (Lee et al. 2001, p. 634).
This might be critical for the start-up’s growth since the founders often come from a science
or technology background and lack management expertise.
Social Capital
Lee et al. (2001, p. 633) consider the relationship to venture capital investors as part of the
start-up’s social capital and found that, for Korean technology based start-ups, the linkage to
these investors is the only significant predictor of performance. Other social capital indicators
13
such as linkages to universities, government and venture networks were not found to have
significant influence on venture performance (ibid). However, this is different in emerging
economies. Social networks are more important for new business activities in emerging than
in developed economies since they substitute for the lack of institutional infrastructure (Danis
et al. 2011, p. 394; Hoskisson et al. 2000, pp. 256-257). When institutions are weak and
uncertain and access to information is limited, entrepreneurs in emerging economies build
relationships with other actors in their environment in order to gain access to knowledge and
experience (Danis et al. 2011, p. 402). Network relationships may even become a source of
competitive advantage for firms in emerging economies (Hoskisson et al. 2000, p. 257). For
technology based start-ups, relationships to key customers prove to be of particular
significance (Yli-Renko et al. 2001, pp. 607-609). Key customers can help in knowledge
acquisition by providing valuable information and introduction to other customers (ibid). By
leveraging this knowledge start-ups can develop greater technological distinctiveness and
improve their product operations which are both potential sources of competitive advantage
(ibid).
Even though all of the above mentioned resources are key drivers of a start-up’s success in
emerging economies, their real values lie in their combination and the specific environment
which the start-up operates in. Furthermore, the lack of resources does not prevent a start-up
from being successful (Clarysse 2011, p. 151). Start-ups can compensate for resource
constraints by developing superior capabilities from other resources (ibid, p. 152). Wu (2007,
p. 553) found that this applies even more to start-ups in an unstable environment.
Dynamic Capabilities, Core Competencies & Organisational Structure
Resources represent the basis of a firm’s capabilities, competencies and products. Capabilities
are built by combining and enhancing resources and used to develop core competencies in
specific areas as well as products. Zahra et al. (2006, pp. 923-935) distinguish between
substantive capabilities (the ability to create new products) and dynamic capabilities (the
ability to change the way new products are created within the firm). Dynamic capabilities are
especially valuable when the external environment is changing frequently and/or rapidly such
as high technology industries and emerging markets. They ensure that the firm successfully
adapts to growth. Dynamic capabilities are created when the firm deals with the challenges of
reconfiguring, developing and enhancing its substantive capabilities. In addition, dynamic
capabilities also evolve when the firm acquires new internal and external knowledge.
14
Dynamic capabilities are the basis for core competencies which are difficult for competitors to
imitate. Non-imitable core competencies are “the collective learning in the organization,
especially how to coordinate diverse production skills and integrate multiple streams of
technologies” (Prahalad & Hamel 1990, p. 81) and spawn competitive products (ibid).
Technology based start-ups in emerging markets do not only operate in a high velocity
industry but also in a rapidly changing and uncertain political, economic and social
environment which makes their ability to develop dynamic capabilities and unique core
competencies even more critical for venture success. They need to be able to build, at lower
cost and more quickly than their competitors, dynamic capabilities and core competencies
necessary to create competitive products and/or services (ibid; Wu 2007, p. 553). In addition,
these dynamic capabilities and core competencies need to be continuously updated and
extended to ensure venture growth (Peng 2001, p. 103; Wright et al. 2005, p. 7).
Building capabilities and core competencies is closely related to the firm’s organisational
structure (Prahalad & Hamel 1990, p. 81; Grant 1991, p. 122). The ability of the firm to
achieve cooperation and coordination within its team and establish smooth-functioning
organisational routines are key ingredients in developing capabilities and core competencies
(Grant 1991, p. 122). Start-ups are business organisations of small size and informal structure
with no or only a few organisational boundaries. As a result, cooperation and coordination can
be achieved more easily in start-ups than medium-sized or large enterprises. Baron and
Hannan (2002, pp. 18-19) studied the organisational structure of Silicon Valley companies
over several years and found that it greatly influenced their performance. Despite the fast-
paced nature of the high technology industry the start-up’s organisational structure is path
dependent even when it faces dramatic events such as an IPO, merger or rapid growth (ibid).
Its early organisation-building activities have significant influence on firm performance and
changes in its organisational blueprint are very destabilising and adversely affect labour
turnover, financial performance and even survival (ibid).
Business Model
A firm’s business model is the translation of resources, capabilities, competencies and
organisational structure into operational and physical form and describes the blueprint of how
a firm does business (Osterwalder et al. 2005, p. 2). It is about how a firm works as a system
to create and deliver value to its customers as emphasized in the following definition:
“A business model is a conceptual tool that contains a set of elements and their relationships and allows
expressing the business logic of a specific firm. It is a description of the value a company offers to one
or several segments of customers and of the architecture of the firm and its network of partners for
15
creating, marketing, and delivering this value and relationship capital, to generate profitable and
sustainable revenue streams.” (Osterwalder et al. 2005, p. 10)
Business models can be described in a very abstract and general way in order to capture a
large number of firms across countries and industries but they can also be focused on a small
number of firms or even on one specific firm (e.g. the “Dell” business model) (ibid). This
thesis uses the framework for e-business (electronic business) models developed by
Osterwalder and Pigneur (2004) in order to describe how technology based start-ups create
and deliver value to their customers. The e-business model is situated somewhere in between
abstract and specific business models since it describes firms operating in the information
technology industry. It is based on four blocks: product innovation and value proposition,
customer relationship, infrastructure management and financial aspects (Osterwalder &
Pigneur 2004, pp. 71-80). These four blocks also serve as the basis of the start-up model
which is developed in the empirical part of this paper.
Product Innovation and Value Proposition
This block gives an overview on what a firm has to offer, i.e. its bundle of products and
services. It describes how the firm provides value to a specific segment of customers and
differentiates itself from its competitors (ibid. pp. 71-72). The firm’s offering of products and
services is for example characterised by: life cycle, value level, price level, etc. These
characteristics may help the firm position its products and services in the market (ibid).
Customer Relationship
This block describes who the firm targets with its value proposition and product offerings,
how it gets in touch with customers and what kind of relationship it wants to establish with
them (ibid, pp. 74-78). Effective customer segmentation allows the firm to choose a specific
group of customers and enables it to allocate its investment resources to the customers that
will be most attracted by the firm’s value proposition. For technology based firms, the most
general distinction of target customers is between business and individual customers (B2B
and B2C) (ibid). The distribution channel describes how these target customers are reached,
either directly (for example through a website or sales force) or indirectly (through
intermediaries such as brokers, resellers, etc.) (ibid). Furthermore, the firm must carefully
define what kind of relationship it wants to establish with its customers in order to maximize
customer equity (i.e. profits from customer relationships). Customer equity may be increased
by acquiring new customers (acquisition), enhancing the profitability of existing customers
16
(add-on selling) and extending the duration of existing customer relationships (retention)
(ibid).
Infrastructure Management
Infrastructure management is about how the firm creates value and manages its customer
relationships (ibid, p. 82). Thus it describes the abilities necessary to provide value and create
product offerings. It includes the firm’s resources as well as its capabilities and core
competencies and specifies the activities necessary to deliver the value proposition. This
block also takes into account outside activities which the firm may perform in collaboration
with or outsource to partners or other businesses (ibid). The inside and outside activities
combined form the value configuration process.
Financial Aspects
This block describes how the firm generates profits through the former three blocks. It
includes the revenue flow and pricing mechanism of a firm (ibid, p. 70). Common revenue
models of technology based firms are transaction and commission based models,
subscription/membership models, advertising, and licensing (ibid, p. 66). In addition, this
block also takes into account the firm’s costs in the value configuration process. In technology
based firms, major costs are R&D expenses, operating and marketing expenses (ibid).
Product innovation and value proposition, customer relationship, infrastructure management
and financial aspects describe how a technology based start-up does business. It draws on
start-up’s resources, capabilities and core competencies and includes the critical elements of
the start-up’s business operations. As mentioned previously, these four blocks form the basis
of the system dynamics start-up model that is developed in the empirical part of this thesis.
Differences between Start-Ups and Traditional Companies
The previous paragraphs discussed characteristics which are specific to technology based
start-ups. Many of these characteristics distinguish technology based start-ups from traditional
companies. Even though traditional company is a very vaguely defined term, this thesis refers
to a traditional company as an established, profit-oriented company of at least five years of
age that either employs more than 10 people or does not solely operate in the information
technology industry. Taking into account this definition, a technology based start-up differs
from a traditional company in at least one of the following aspects:
17
Resources: In terms of resources, technology based start-ups rely mostly on the human capital
of their founders and employees (Chorev & Anderson 2006, p. 168; Colombo & Grilli 2010, p.
610). Start-up founders and employees do not only provide knowledge and expertise but also
entrepreneurial characteristics such as self-commitment, self-efficacy, dynamism and
leadership desire (Kiss et al. 2012, p. 277). Even though human capital is also important to
traditional companies, the ratio of tangible and intangible resources (e.g. human capital) in
traditional companies is likely to be different. Established companies which have been in
business for more than five years and do not operate in the technology industry might place
greater importance on tangible assets such as machines, land, buildings, inventory, etc. This
applies especially to companies in capital-intensive industries (e.g. manufacturing companies).
On the other hand, service based businesses and established companies in the information
technology industry rely on intangible resources to a similar extent as start-ups.
Products: Different kinds of resources and capabilities result in different kinds of products.
Technology based start-ups offer intangible, non-physical products and services such as
software programs, mobile applications, network services, etc. Many technology based start-
ups enter the market with a ‘minimum viable product’, that is a product developed cost-
efficiently and lacking certain features which will be added in a later phase. The purpose of a
minimum viable product is to test the market response and wait for customer feedback before
integrating new product features. In contrast, traditional companies in the information
technology or another industry generally spend a significant amount of time researching and
developing a product that is already sophisticated and comes with a certain amount of product
features.
Funding: Technology based start-ups rely mostly on internal funding and only rarely obtain
outside financing (Colombo & Grilli 2007; Revest & Sapio 2012). Due to their young age,
they lack a track record which makes it difficult to obtain bank loans (Revest & Sapio 2012, p.
179). What is more, they do not possess tangible assets that could be collateralised (ibid). This
distinguishes them from established companies in the information technology industry and
from established companies in other industries. Established companies generally have a
proven business model and a longer track record than start-ups. In addition, they have tangible
assets such as buildings, machines and land which they can use as collateral security to obtain
bank loans. Due to their track record and reputation, they can also attract outside investors
(e.g. private equity and venture capital companies) more easily than start-ups.
18
Size: Due to financial constraints, technology based start-ups generally cannot afford to
employ a lot of personnel. The start-up founder(s) oftentimes take on different functional
roles in the start-up to compensate for the lack of employees. As a result, their organisational
structure tends to be simple and non-hierarchical which enables them to make decisions and
take action quickly. Traditional companies generally can afford to employ more personnel and
tend to have clear definitions of the roles of their employees. This may result in a more
hierarchical organisational structure as compared to start-ups.
Risk: Technology based start-ups are businesses in an early stage of development. Their
products and business models have not yet been thoroughly validated and their market
potential can only be estimated. Furthermore, they may lack operational, managerial or
technological experience and have a short track record (Revest & Sapio 2012, p. 179). This
results in start-ups being high risk ventures. In contrast, traditional companies have been in
business for a longer period of time and therefore have been able to grow a substantial
customer base. They have more business and industry experience as start-ups and oftentimes a
better understanding of the market. Thus they are considered less risky than start-up ventures.
However, established companies can still carry a considerable level of risk by operating in
risk-prone industries or making high-risk investments.
Summary
Resources, capabilities and core competencies are central considerations in formulating a
firm’s strategy (Grant 1991, p. 133). As they place constraints upon the firm's operation (upon
what the firm is able to produce and sell), they determine, to some extent, the firm’s overall
profitability (ibid). Consequently, it is important that firms have access to valuable resources
and develop unique, non-imitable capabilities and core competencies. For a technology based
start-up, the most important resources are human resources as it heavily depends on
technological knowledge to create unique capabilities and competitive products. As a result,
the start-up's performance is closely linked to the quality of its human resources. Managing its
human resources efficiently and getting the most value out of them is equally crucial and may
even substitute for a lack of resources in other areas. The start-up’s organisational structure
plays an important role in this regard as it affects cooperation and coordination within teams
which are both crucial for developing capabilities and core competencies. Finally, the start-
up’s resources, capabilities, core competencies and organisational structure need to be
translated into tangible business operations, i.e. a business model. The start-up’s business
model describes how it does business and which actors are involved in delivering its value
19
proposition. However, a firm does not do business in a vacuum, so its resource, capabilities
and business operations need to be understood in the specific industry and the political,
economic and social environment it operates in. The following chapters are dedicated to
discussing these topics.
2.1.2. The Industry-Based View
The focus of this thesis is on technology based start-ups operating in the information
technology industry, e.g. start-ups selling software products and services, developing internet
based networks, etc. The previous section described the firm-specific characteristics of
technology based start-ups. This section will discuss the industry-specific characteristics of
the information technology market. It is the second pillar in the strategy tripod developed by
Peng et al. (2008; 2009).
The industry-based view argues that the firm’s performance is influenced by the degree of
competitiveness of the industry it operates in (Porter 1980). The information technology
industry is subject to the same market forces as other industries (Varian 2001, p. 3). However,
some market forces are particularly strong in the information technology industry (ibid).
Firms operating in high technology industries face intense rivalries, constantly changing
technologies, instant imitators and low barriers to entry (Almeida & Fernando 2008, p. 162).
Gardner et al. (2000, p. 1074) identify the following characteristics of the high technology
market environment: earlier stage of the industry life cycle, greater degree of turbulence,
higher product differentiation, higher market growth rate, shorter expected life cycle, easier
entry to the market, more diverse suppliers, more visible future for technology, and higher
level of consumer involvement in purchase decisions. Since information technology is
considered a segment of the high technology industry, information technology based start-ups
face similar challenges. The following sections discuss these challenges in greater detail.
Competition
Competition within a particular industry is heightened when the number of firms operating in
this industry increases. Since firms require resources to grow and survive and resources are
limited, every industry has a carrying capacity of firms it can support (Woolley 2014, p. 724).
In a new industry, firms are created until the carrying capacity is reached (ibid). At this point,
resources become scarce, firm mortality rates increase and the number of newly founded
ventures decreases (ibid). The time until the carrying capacity is reached depends on the
barriers of entry to the industry. Entry barriers to the information technology industry are
20
relatively low (Porter 2001, p. 5). This is due to several reasons. First, the fixed costs of
developing information technology products (e.g. software) are declining since information
available on the internet, advances in software architecture and development tools make it
easier to create information technology products (Porter 2001, p. 11). Second, the internet
facilitates distribution and mitigates the need for an established sales force and access to
existing channels (ibid, p. 5). Third, the number of information technology professionals such
as software engineers and programmers is rising which results in a greater pool of skilled
labour.
In addition to low barriers of entry, the global expansion of information technology
increases competition as well (ibid). Information technology products may be offered across
geographic markets. This does not only increase potential market size but also brings many
more firms into competition with one another. The information technology industry is
considered a high growth industry which increases market attractiveness (Li 2001, p. 186).
New firms may enter the market hoping to achieve above average returns on investment. This
increases competition within the industry and reduces the average profit of firms (Tsai et al.
1991).
Product Life Cycle & Intellectual Property
Firms operating in the information technology industry face rapidly changing and instable
environments. The life cycle of technology is continually shortened and competing
technologies appear frequently (Wu 2007, p. 551). As a result, product development is
increasingly accelerated and the life cycle of products is significantly shortened (ibid).
Furthermore, information technology products have a higher degree of mobility because they
are built from information-based resources and capabilities. They are therefore prone to
increased value migration and reduced sustainability (Amit & Zott 2001, p. 497).
Product value may be further reduced due to copycats. If information technology products
can be produced cheaply (see next section), they can be copied or imitated cheaply, even in
markets with extensive regulations on intellectual property rights (Shapiro & Varian 1999, p.
4). Patents may provide some protection from imitators. However, competitive firms may
attempt to invent around a patent and create similar products (Varian 2001, p. 14). Some firms
give (parts of) their products away for free in order to counter copycats and imitators (Shapiro
& Varian 1999, p. 86).
21
Cost Structures
The production of information goods involves high fixed costs but low or even zero marginal
costs (Shapiro & Varian 1999, p. 3). Accordingly, information is expensive to produce but
cheap to reproduce (ibid). This is not only true for pure information based products but also
for a number of physical high technology goods such as chips (Varian 2001, p. 4). Setting up
a fabrication plant (fixed costs) can be very expensive but producing an incremental chip is
cheap (marginal costs). High fixed costs and low/zero marginal costs are typical for high
technology industries (ibid). In addition, there are no natural capacity limits for information
products and distribution mostly takes places online which reduces distribution costs (Shapiro
& Varian 1999, pp. 22, 84). This kind of cost structure (high fixed cost and low marginal cost)
can lead to significant market power and even create natural monopolies (Varian 2001, p. 13).
Differentiation of Prices and Products
Since marginal costs are low or (close to) zero, information technology products are priced
according to customer value and not according to production cost (Shapiro & Varian 1999, p.
3). In addition, information technology allows for a close observation and analysis of
customer behaviour. This permits various kinds of pricing and marketing strategies which
were previously rather difficult to carry out.
First Degree Price Discrimination
First degree price discrimination is also known as ‘personalisation’ or ‘mass customisation’
and refers to selling to each customer at a different price. Firms will charge the highest price
possible to each customer, thereby capturing the entire customer surplus. Knowing the
customer’s willingness to pay is essential for personalized pricing. In information technology
businesses, the customer’s willingness to pay may be estimated by learning about customer
demographics, interests, and purchase history and by analysing click stream and search
behaviour (Shapiro & Varian 1999, p. 43). In internet based commerce, fine-tuning prices is
relatively easy (ibid, p. 34). For example, the US online retailer Amazon was accused of
offering different prices on its DVDs to different customers depending on their behaviour
(Varian 2001, p. 5). However, Amazon abandoned this practice after short time due to a
customer backlash.
There are two possible economic effects of first degree price discrimination: the enhanced
surplus extraction effect as mentioned above and the intensified competition effect (ibid, p. 6).
The enhanced surplus extraction effect translates to higher prices for customers but still
22
according to what customers are willing to pay. The intensified competition effect describes
an increase in competition within the industry as more firms will enter the market. When
customer tastes are not very different, the intensified competition effect is found to dominate
the surplus extraction effect (ibid). Consequently, customers will benefit and firms will suffer
as competition increases.
Second Degree Price Discrimination
Second degree price discrimination is also known as ‘versioning’. It is about offering a
product line and let customers choose the version of the product which best accommodates
their needs. This form of price discrimination is not only widely used in the information
technology industry, but also in physical product markets (Varian 2001, p. 7). For example,
books may be offered in different versions: as hardback, paperback, e-book, library rental, etc.
Software is often available in different versions as well: online and offline versions, higher
priced versions with better features, etc. The objective of versioning is to accommodate as
many customers as possible and maximise the total value of the product (Shapiro & Varian
1999, p. 54). A potential drawback for firms offering different versions of their products may
arise when customers with high willingness to pay are attracted by lower-priced versions
which are targeted towards customers with lower willingness to pay (Varian 2001, p. 8).
A special type of second degree price discrimination is bundling. It refers to the practice of
selling two or more products (a ‘bundle’) together for a single price. Bundling reduces
dispersion in customers’ willingness to pay. It is a particular attractive pricing structure for
information technology products since the marginal cost of including additional products in a
bundle is negligible (ibid, p. 10). In general, firms benefit from bundling in terms of increased
profits and efficiency while customer surplus is reduced (ibid). Bundling may even reduce
competition within the industry as it raises the barrier to entry (ibid).
Third Degree Price Discrimination
Third degree price discrimination is referred to as group pricing and means setting different
prices for different groups of customers. Student and senior citizen discounts are an example
of group pricing. The concept of group pricing is based on differences in price sensitivity
among customers. Group pricing is a common pricing strategy for information technology
products which are sold internationally (Shapiro & Varian 1999, p. 45). However, the internet
can be a threat to differential international pricing since customers can easily access and
compare information on products and prices (ibid). A possible solution is to localise
23
information technology products so that different versions of a product are targeted to
different countries (see the previous section on second degree price discrimination for more
details) (ibid).
Network Effects
While cost structures are also called supply side economies (average cost decreases with
scale), network effects are referred to as demand side economies with the average revenue
(demand) increasing with scale. A product exhibits network effects when the demand for the
product depends on how many other people purchase it. In other words, customer utility
increases with the number of people using the same product. An example for a product with
network effects is the telephone. Economists distinguish between direct network effects (as in
the telephone example) and indirect network effects. Apple’s iTunes app store is an example
for a product with indirect network effects: as the number of users of the iTunes app store
increases, more applications become available which increases customer utility and will
attract even more users. Indirect network effects are common in information technology and
high technology industries (Varian 2001, pp. 16-18). In addition, as the number of users
increases, the general willingness to pay for the products also increases (ibid). When network
effects are significant, they can even raise the barriers to entry (Porter 2001, p. 8). However,
in the information technology industry, it is difficult for a single firm to control and capture
the benefits of network effects (ibid). Large investments are required to create network effects
which may offset future benefits (ibid).
Switching Costs
Switching costs are negative costs that consumers incur when changing products. They affect
customer relationship by increasing customer retention. For some information technology
products such as software environments switching costs can be very high (Varian 2001, p. 11).
For some products, they can even be so high that customers find themselves in a lock-in
situation where switching suppliers is unthinkable (ibid). Lock-in situations may be a burden
for firms as well since they may make it difficult for them to change their pricing strategy. For
example, a firm would like to sell at a high price to its current customers (the locked-in
customers) but it would also like to sell at competitive (lower) prices to new customers (ibid,
p. 12). When switching costs are high, customers’ bargaining power decreases and the
barriers of entry to the industry rise (Porter 2001, p. 7). However, Porter (ibid, p. 7) argues
that for internet based products, switching costs are likely to be lower than for traditional
24
ways of doing business. This may be due to the fact that the internet increases customers’
bargaining power by providing easy access to information about products and suppliers (ibid,
p. 5).
Summary
Industry structure is a determinant of firm profitability (Porter 2001, p. 5). This chapter
examined the industry-based view of firm profitability and discussed the characteristics of the
information technology industry. Firms operating in the information technology industry face
intense competition and significant uncertainty. The life cycle of information technology
products is short and technologies change rapidly. Due to easy access to information,
customers’ bargaining power is increasing and barriers of entry are decreasing. Information
technology products have high fixed costs but very low marginal costs which makes first time
production expensive but reproduction comparatively cheap. As a result, the imitation and
copying of information technology products are easy as well which can lead to infringement
of intellectual property. The cost structure of information technology products facilitates
different pricing strategies: personalized pricing, versioning and bundling as well as group
pricing. Besides pricing strategies, network effects and switching costs may also affect
demand for a specific information technology product. Network effects and switching costs
may be very advantageous for firms but they are difficult to create.
All of the above mentioned characteristics of the information technology industry may be
opportunities and threats for firms. Firms respond to these opportunities and threats by
creating competitive strategies. Their final success will not only depend on the quality of their
strategies (their specific resources and capabilities) but also on the institutional environment
that they are part of.
2.1.3. The Institution-Based View
This chapter discusses the relationship between firms and their political, economic and social
environment. The influence of the environment on firms has long been acknowledged by
scholars (Peng et al. 2009, p. 65). However, most research has favoured a task environment
view which focuses mainly on objective economic factors such as market demand (ibid). In
contrast, the institution-based view does not focus solely on economic factors, but tries to
provide a holistic picture by including political and social factors as well. It calls these factors
‘institutions’ and draws on institutional theory as outlined by North (1990) and Scott (1995).
North (1990, p. 3) defines institutions as “the rules of the game in a society or, more formally,
25
[…] the humanly devised constraints that shape human interaction” and states that
institutional theory focuses on the role of the political, economic and social systems in
shaping the behaviour of firms. The sociologist W. Richard Scott (1995, p. 33) defines
institutions as “regulative, normative, and cognitive structures and activities that provide
stability and meaning to social behaviour”. They provide a complementary view on
institutions which includes both formal and informal components.
The Role of Institutions
North (1990) classifies institutions as formal and informal constraints. Formal constraints
refer to constitutions, laws, regulations, property rights, etc. of a specific country or region.
Informal constraints can be customs, traditions, codes of conduct and sanctions. In
comparison, Scott (1995) distinguishes between three types of institutions: regulatory,
cognitive and normative. Regulatory institutions are what North defines as formal institutions:
laws, regulations, property rights etc. Cognitive institutions refer to the knowledge of the
people in a specific country while normative institutions describe their values and norms.
Cognitive and normative institutions are considered informal institutions. The main role of
institutions is to reduce uncertainty and transaction costs by establishing a stable structure that
facilitates interactions (North 1990; Scott 1995). The existence of stable formal and informal
institutions discourages opportunistic behaviour. In economic terms, stable institutions
promote economic activity by providing a clear structure for business transactions, reducing
information asymmetry and laying out the consequences of opportunistic behaviour such as
fraud. What is more, the institution-based view of the firm argues that institutions also affect
the strategy and performance of firms (Peng et al. 2008, p. 929).
Firm Strategy and Institutions
Firms interact dynamically with institutions. Peng (2010, p. 37) argues that firm behaviour is
often a reflection of the formal and informal constraints of the institutional framework the
firm is embedded in. Firms therefore need to take into account the influences of these formal
and informal ‘rules of the game’ in addition to firm-level and industry-level conditions when
defining their strategy (Peng et al. 2009, p. 70). In fact, the competitiveness of firm strategy
highly depends on its institutional environment (Martens et al. 2011, p. 5795). For example, a
firm might possess resources and capabilities which are favoured in a certain institutional
environment while in another institutional environment they would be of no value.
26
Consequently, firms need to align their resources and capabilities and their overall strategy
with the institutional environment they are operating in (ibid).
Institutions in Emerging Economies
Some scholars have argued that institutional theory is the most applicable theory for
explaining firm behaviour in emerging economies (Hoskisson et al. 2000, p. 253). However, a
stable institutional framework has long been taken for granted and formal and informal
institutions have been considered only as ‘background’ (Peng et al. 2009, p. 66). In developed
economies where institutions generally work smoothly and are almost invisible, assuming
away institutions as background may be reasonable in some cases (ibid). By contrast, in
emerging economies as well as in developing economies institutions are often unstable and
underdeveloped and may have greater influence on various forms of economic activities
(Tracey & Phillips 2011, p. 26). For example, formal as well as informal institutions may
have significant impact on strategic choices of managers in existing emerging economy firms
and influence the creation of new business ventures (ibid, p. 36). Furthermore the degree of
influence of formal and informal institutions in emerging economies differs from developed
economies. Emerging economies rely more heavily on informal institutions to facilitate
transactions and combat opportunism than developed economies because their formal
institutions are often underdeveloped (Peng et al. 2009, p. 69). In addition, there are variations
between emerging economies in terms of institutional environment. Firms within one
institutional environment tend to be similar but firms differ across institutional environments
(Peng et al. 2009, p. 69). Consequently, technology based start-ups might be similar within
China and within Indonesia but there might be significant differences between Chinese
technology based start-ups and Indonesian technology based start-ups due to their different
institutional environment. The differences and similarities between institutions in two or more
countries, regions or economies are summarized as ‘institutional distance’ (Phillips et al. 2009,
p. 339). Institutional distance is commonly measured by comparing the institutional profiles
of countries, regions or economies (ibid, p. 342). This thesis tries to investigate the
consequences of institutional distance between China and Indonesia for the performance of
technology based start-ups. It seeks to determine which institutional environment (China or
Indonesia) is more favourable to the success of technology based start-ups.
27
Summary
This chapter introduced the institution-based view of the firm, defined institutions and
discussed why institutions matter for firm performance. The institution-based view argues that
there is dynamic interaction between firms and their institutional environment. The
institutional environment puts constraints on the behaviour of the firm and has influence on
firm strategy and performance. It defines the ‘rules of the game’. In emerging economies,
institutions are often weak and unstable. Formal institutions can be underdeveloped so
informal institutions play a more significant role in reducing transactions costs and
opportunism. However, not all emerging economies are the same and the structure and
significance of institutions may vary significantly.
2.2. Entrepreneurship and Institutions This chapter goes into greater details on the institution-based view of the firm introduced in
the previous section and discusses why and how institutions matter for newly founded firms.
The two subchapters investigate the formal and informal institutions which are likely to affect
technology based start-ups and describe them in detail. Institutional theory has proven to be
very helpful not only in strategic management and international business research (see
previous chapters) but also in entrepreneurship literature (Bruton et al. 2010, p. 421). First,
institutions may encourage or discourage entrepreneurs to found new firms and can therefore
impact the rate of new venture creation. They provide the setting for founding new firms.
Second, institutions influence the choices entrepreneurs make to build and grow their
businesses and have impact on the outcome of these choices.
If somebody becomes an entrepreneur and decides to establish a new business depends on
the institutional environment which can be facilitative or detrimental (Fogel et al. 2006, pp.
540-541). It determines not only the setting but also the legitimacy of entrepreneurship (Thai
& Turkina 2014, p. 505). Among the institutions determining the creation of new ventures are,
for instance, rules and regulations, the quality of government, the availability of education and
the ambient culture (Fogel et al. 2006, p. 544). If these institutions impede information flow,
raise transaction costs and fail to combat opportunism, entrepreneurial activity will be limited
(ibid). Specific examples for institutional features limiting entrepreneurial activities are weak
property rights, inefficient judiciary and ambient corruption (ibid). In addition, the
institutional environment can also have indirect effects on new business creation. For example,
detrimental institutions can retard capital market development which dampens entrepreneurial
activities (ibid).
28
The institutional environment imposes constraints on the actions of entrepreneurs. Prevailing
institutions have considerable influence on decisions about appropriate structures, practices
and behaviours of entrepreneurial ventures (Tolbert et al. 2011, p. 1336). They also impact
entrepreneurial outcomes, i.e. if a venture is successful. Initial entrepreneurship research has
focused much on the role of personal traits and dispositions of founders as keys to explaining
entrepreneurial outcomes (ibid, p. 1332). In recent years, the focus has slightly shifted to
institutions as one of the key determinants of venture performance (ibid). However, most
research in this field has been conducted in developed economies and may not readily apply
to the relationship of entrepreneurship and institutions in emerging economies. Wright et al.
(2005, p. 9) state that there “is little IT [institutional theory] research on local startups in
emerging economies”, even though institutional theory has been identified as a useful way of
conceptualising emerging economies and institutions have been found to impact
entrepreneurship in emerging economies (Tracey & Phillips 2011, p. 25). Entrepreneurial
choices and outcomes in emerging economies are not only affected by the absence of certain
institutions but also by existing institutions which are not deeply institutionalised (ibid, p. 28).
These institutions lack self-reinforcing mechanisms which encourage predictable patterns of
behaviour and reduce risk and uncertainty (ibid). Risk and uncertainty can be even higher for
entrepreneurial activities in rapidly changing industries such as the information technology
industry. The information technology industry is a comparatively new industry in emerging
economies and lacks cohesive institutional structures and legitimacy (Woolley 2014, p. 722).
However, Tracey & Phillips (2011) argue that institutional uncertainty can also provide
significant opportunities for entrepreneurs in emerging economies. Entrepreneurs can
capitalise on institutional uncertainty and create value in different ways. Furthermore, they
also act to shape their institutional environment (Bruton et al. 2008, p. 11). For example,
entrepreneurs have been able to create substitutes for weak legal structures and insubstantial
capital markets in markets with underdeveloped legal systems and financial markets (ibid).
Their challenge is to continue working within the systems as it is and, at the same time, to act
as institutional entrepreneurs and encourage institutions to facilitate entrepreneurial activities
(ibid). The following sections discuss which institutions have the greatest significance for
entrepreneurial activities in emerging economies and in the information technology industry.
2.2.1. Formal Institutions
Formal institutions form the regulatory dimension of the institutional environment. They
include, for example, laws, regulations and government policies which provide support for
29
new and existing firms, reduce the risks of starting and operating a business, and facilitate the
efforts of entrepreneurs to acquire resources (Busenitz et al. 2000, p. 995). Busenitz et al.
(2000, p. 1001) suggest to couple several institutions of the regulatory dimension in order to
gain a more thorough understanding of a country’s or a region’s institutional environment for
entrepreneurship. This thesis tries to follow their suggestion by investigating several formal
(and informal) institutions. This section discusses the most significant formal institutions for
entrepreneurship in emerging markets and the information technology industry according to
literature. The empirical part of this paper then combines them to see how they interact and
affect the performance of technology based start-ups in China and Indonesia.
Property Rights, Regulations and the Legal System
Property rights, rules, regulations and their enforcement are important determinants of
entrepreneurial activities (Fogel et al. 2006, p. 541). They affect transactional trust which is
defined as “the degree of trust the parties to a business transaction place in each other” (ibid).
Transactional trust is crucial for entrepreneurial activities as they entail long term transactions
such as employees investing their time and investors investing their money now for rewards
in the future (ibid). Well enforced property rights, rules and regulations reduce uncertainty
and strengthen transactional trust. They facilitate the detection and punishment of
opportunistic behaviour and let people commit to “verifiable honesty” (ibid, p. 548).
Examples of these rules and regulations include legal contracts, disclosure requirements,
specified investor and creditor rights, definitions for performance clauses in trade contracts,
etc. (ibid). Johnson et al. (2002) investigated entrepreneurship in transition economies and
found that weak property rights discourage entrepreneurs not only from creating new firms
but also from reinvesting their profits in the firm even if potentially profitable reinvestment
opportunities exist. Ineffective courts and lack of faith in the courts have the same adverse
impact on entrepreneurial activities (ibid). Interestingly, not only the quality but also the type
of legal system affects entrepreneurship. Stephen et al. (2005, pp. 415-417) investigated the
influence of five broad legal ‘families’ (English Common Law, French Civil Law, German
Civil Law, Scandinavian Civil Law and Socialist Legal Systems) on entrepreneurship and
found that countries within the English legal family have higher levels of entrepreneurship,
ceteris paribus, than countries within other legal families. They argue that a possible
explanation could be the extent to which these legal systems protect property rights in general
and investor and creditor rights in particular. In high technology industries, efficacy of legal
30
protection mechanisms is considered a factor which provides stability in a highly dynamic and
rapidly changing environment (Clarysse et al. 2011, p. 140).
Government, Corruption & Bureaucracy
The government of the country or region a firm is operating in matters because it creates and
enforces property rights, rules and regulations. An efficient and ‘good’ government increases
transactional trust and thus facilitates entrepreneurship (Fogel et al. 2006, p. 541). In contrast,
an inefficient and insufficient government fails to protect property rights and discourages
entrepreneurship. The government can also interfere in the market by, for instance, setting
prices and imposing price controls. Direct government interference with market price
mechanisms is found to discourage entrepreneurship (ibid, p. 568). Frye and Shleifer (1997, p.
354) divided governments into three different groups and characterized them by an invisible
hand, a helping hand or a grabbing hand. In the invisible hand model, they describe the
government as benevolent, efficient and uncorrupted. It limits itself to providing basic public
goods and services, such as contract enforcement and law and order while it leaves most
decisions in regard to market allocation to the private sector. In the helping hand model, the
government actively promotes economic activities and pursues industrial policy. It supports
some firms and impedes others. Corruption exists but it is relatively limited and organised.
Bureaucrats often have close economic and family ties to entrepreneurs. The government is
also interventionist in the grabbing hands model. However, it is less organised and consists of
a large number of bureaucrats who act rather independently and pursue their own agendas,
including taking bribes (ibid). Entrepreneurial activity depends on how well property rights
are protected from the ‘grabbing hands’ of the government and other influential agents with
political power (Fogel et al. 2006, p. 548). An efficient and ‘good’ government which protects
entrepreneurs’ property rights is found to encourage formal entrepreneurship while
discouraging informal entrepreneurship (Thai & Turkina 2014). Not only the absence of laws
and regulations and/or their weak enforcement can raise the risks and costs of founding and
operating a business. Excessive laws and burdensome regulations are also found to discourage
entrepreneurship (Fogel et al. 2006, p. 550). For example, the number and complexity of
regulatory procedures on the path to establish a new firm seem to be critical in the decision to
start a new, officially registered firm (Stephen et al. 2005, p. 414). Djankov et al. (2002, pp. 1,
35) document the number of regulatory procedures to start a small business in 85 countries
and find that entry regulations are particularly burdensome in countries with high corruption
and large unofficial economies. This may be one of the reasons why entrepreneurs in such
31
countries tend to establish informal firms, i.e. firms that are not officially registered (Van Stel
et al. 2007, p.183). In emerging economies, informal firms are found to have limited access to
important resources such as technology investments and entrepreneur’s higher education
(Siqueira & Bruton 2010, p. 48). They also tend to have lower levels of productivity than
formal firms (ibid). Thus the firm’s short term benefits from avoiding burdensome registration
procedures might limit their growth potential in the future. In addition, burdensome
regulations create growth bottlenecks for small firms (Aterido et al. 2009, p. 22). Since the
management time dealing with authorities and bureaucracy increases significantly with firm
size, small firms prefer to remain small to keep below the radar of officials (ibid, pp. 4, 29).
What is more, Aidis (2005, p. 314) finds that burdensome, ambiguous and frequently
changing tax policies are significant institutional barriers to the development of small- and
medium-sized enterprises.
Macroeconomic Conditions
Macroeconomic conditions such as inflation rates, interest rates, government budgets, GDP
growth, and economic sectors can affect entrepreneurship. A stable macroeconomic
environment reduces risk and uncertainty which promotes future and long term transactions
such as investments in new ventures (Fogel et al. 2006). Stable macroeconomic conditions as
well as high levels of economic development are also found to encourage formal
entrepreneurship (Thai & Turkina 2014, p. 490). Entrepreneurship is also influenced by global
and national business cycles (Koellinger & Thurik 2012, p. 1151). Entrepreneurial activity is
higher during a national recession because start-up costs for qualified human resources and
borrowing financial resources tend to be lower during recessions (ibid). Entrepreneurship
might also be an alternative for people who were dismissed during a recession. They become
entrepreneurs out of necessity. However, this paper does not consider necessity
entrepreneurship since technology based firms are usually the result of opportunity
entrepreneurship. What is more, during national recessions new firms innovate more
vigorously than established firms (ibid, p. 1153). Global business opportunities such as newly
invented technologies, geopolitical developments and changes in commodity prices are found
to increase opportunity entrepreneurship (ibid, p. 1151). The macroeconomic environment
does not only impact the creation of new firms but also their performance over time. New
firms are part of an economic system and exposed to the same economic changes as
established firms. Kiss et al. (2012, p. 278) argue that macroeconomic differences dominate
explanations of new venture growth. As entry and exit rates of firms are positively correlated
32
(Quatraro & Vivarelli 2014, p. 4), an economic recession does not only cause many new firms
to enter but also to exit the market. During times of low macroeconomic growth the survival
ability of firms, in particular of small firms decreases (Box 2008, p. 390). The influence of
other macroeconomic factors on firm performance depends on firm characteristics and the
industry it is operating in. For example, the impact of inflation rates on firm performance
might be different for firms that operate domestically or internationally. What is more, the
impact of the interest rate level depends on the type of the firm’s financial resources. The
interest rate level might especially affect firms which rely on external capital.
Financial Markets
Financial markets are an essential element of a market based economic system and provide a
variety of financial services to individuals and firms seeking investments or financing. In
theory, start-up ventures can obtain external funds from financial markets to invest in their
operations and accelerate growth. However, in practice, newly created small firms and
technology based start-ups in particular, suffer from credit constraints and a lack of financial
capital (Quatraro & Vivarelli 2014, p. 10; Revest & Sapio 2012, p. 181). Credit constraints
and a lack of financial capital limit not only the entry rate of new firms but also their
likelihood of survival and growth (Quatraro & Vivarelli 2014, p. 10). There are several
reasons why technology based start-ups have difficulties in obtaining external funds. First,
their default probability is relatively high and they mostly possess only intangible assets
which cannot be collateralised and are difficult to redeploy in case of default (Revest & Sapio
2012, p. 181). Second, transaction costs related to debt and equity financing of technology
based start-ups are considered to be higher than those of large and mature firms (ibid). Third,
there are substantial information asymmetries between the start-up founders and outside
investors (ibid). This is due to the short track record and early growth stage of the start-up. In
addition, investors and lending institutions often have limited understanding of technically
complex and innovative projects (ibid). How these credit constraints can be softened depends
on the country’s type of financial system. Market-based financial systems (e.g. USA, UK)
may offset information asymmetries responsible for credit constraints by improving
information flow and strengthening investor rights (ibid, p. 184). In bank-based financial
systems (e.g. Germany) credit constraints may be softened by start-up’s greater reliance on
social networks and long term relationship with creditors (ibid). As these findings are based
on financial systems in developed economies, it is unclear if they are applicable to emerging
economies in the same way. Social capital of start-up founders has been found to be a
33
powerful tool to overcome financial constraints (ibid). This might be even more so in
emerging economies that rely more heavily on informal than on formal institutions and where
financial markets are not well-developed. What is more, some studies have found that the role
of credit constraints in new firm growth has been overemphasised (Quatraro & Vivarelli 2014,
p. 10). In fact, the majority of technology based start-ups and new firms in emerging
economies rely on internal financing such as entrepreneurial saving plans and funds from
family members (ibid; Revest & Sapio 2012, p. 184). If technology based start-ups resort to
external financing such as bank loans, the sum obtained is generally small (Colombo & Grilli
2007, p. 25). Furthermore, increased access to external finance has a larger positive effect on
firm growth in economies with more developed financial systems and/or better rule of law
(Aterido et al. 2009, p. 29).
A special institution providing technology based start-ups with funds are venture capital
investors. They are specialised in high risk investments and can give start-ups access to funds
when banks loans and stock market flotation are unattainable. Venture capital represents only
a minority of the capital in developed economies and it plays an even smaller role in emerging
economies (Bruton et al. 2008, p. 4). However, the number of venture capital investments in
emerging economies has been growing significantly in recent years (The Economist 2012).
Venture capital investors in emerging economies have the same goals of substantial annual
return on investment as in developed markets (e.g. Silicon Valley) but their actions to achieve
these goals are different (Ahlstrom & Bruton 2006, p. 314). Since formal institutions are not
yet well established in many emerging economies, venture capital investors generally use
informal institutions such as personal relationships and networks with entrepreneurs and
government officials to substitute for formal institutions (ibid, pp. 312-313). In the future,
however, institutions in emerging economies are expected to become more formal and venture
capital practices are expected to change as well, albeit at varying speeds (ibid).
The Labour Market
The labour market represents a country’s pool of available human resources from which firms
can appoint managers and employees. The characteristics of a country’s labour market depend,
for instance, on national labour laws and regulations such as hiring and firing practices,
minimum wages and working hour restrictions. In addition, the educational system (see next
section) also has significant influence on the country’s labour market. Constraints due to strict
employment laws are found to hinder entrepreneurship (Fogel et al. 2006, p. 566). This
applies particularly to unskilled labour. Firms are more likely to sustain competitive
34
advantage and remain profitable when labour laws permit to reduce their workforce quickly
(Chacar 2010, pp. 1126, 1135). Consequently, institutions which give firms greater power
over their workforce are likely to contribute positively to firm growth (ibid) and thus let more
firms survive (Kılıçaslan & Taymaz 2008, p. 221). However, this might have an adverse
effect on national productivity levels since less productive firms are more likely to survive as
well (ibid, pp. 220-221). What is more, in countries with very restrictive employment laws
industries that are more volatile tend to be less developed (Aterido et al. 2009, p. 6). Strict
labour laws and regulations might therefore have negative impact on the information
technology industry as it is inherently volatile. Another factor affecting a country’s labour
market is unemployment. High unemployment can reflect low economic growth rates which
may affect small firms in a positive or negative way (Fritsch et al. 2004, p. 8). On one hand,
when unemployment is high, firms can choose from a larger pool of available human
resources when appointing new managers and employees. In addition, labour costs might be
lower during times of low or negative economic growth. On the other hand, as high
unemployment often indicates times of economic downturns, new firms’ risk for death
increases (Box 2008, p. 382). Unemployment can also lead to a large share of new ventures
out of unemployment, i.e. entrepreneurship out of necessity (Fritsch et al. 2004, p. 8).
Not only the quantity but also the quality of available labour characterises a country’s
labour market and can impact the performance of firms. Firms in new technology industries
such as the information technology industry rely on competent labour (Woolley 2014, p. 725).
However, when the number of skilled workers in the labour market is high, knowledge might
move more easily across firms (Chacar 2010, p. 1126). As stocks of skilled workers increase,
their knowledge becomes less distinctive and they can be replaced by outside talent more
easily. Firms which rely heavily on unique knowledge-based capabilities for superior
performance might lose competitive advantage because knowledge becomes available to their
competitors (ibid). Information technology based start-ups rely on the knowledge of skilled
labour to generate profits and grow but if knowledge becomes widely available, their
competitive advantage might dissipate. A possible strategy for start-ups could be creating an
employer brand in the labour market in order to attract the best talent with rare abilities and
knowledge.
Education & Innovation
Human capital plays an important role in increasing the likelihood of firm survival and
growth, especially in technology industries (Quatraro & Vivarelli 2014, p. 11). The
35
entrepreneur’s human capital is a key driver of growth of technology based start-ups (ibid).
Entrepreneurs with higher levels of education, both (upper) secondary and tertiary, are not
only more likely to survive as business owners but they also have higher earnings compared
to those with only primary education (Millán et al. 2014, p. 621). If entrepreneurs with tertiary
education are more likely to succeed than those with secondary education depends on the
country’s stage of development. Quatraro and Vivarelli (2014, p. 12) argue that there is a
country-specific threshold effect of education. For example, small firms founded by
secondary school graduates in African countries might grow faster than their counterparts in
Latin America. In Latin America, the threshold effect is at the university level. If small firms
in Latin America are to experience the same growth rate as African small firms, their founders
need to have a university degree. In addition to the founder’s human capital, the education
level of employees also affects firm performance (Millán et al. 2014, p. 627). Employees with
a higher level of education tend to be more productive (ibid). Stocks of employee knowledge
are related to the process of knowledge creation within the firm and thus play an important
role in establishing and sustaining competitive advantage (Smith et al. 2005, p. 355).
Technology based firms are advised to hire and train well-educated employees with varying
functional expertise, in particular scientists and engineers, as they are more likely to combine
and exchange their ideas to create new knowledge and innovative products (ibid). What is
more, the education levels of consumers also impact the performance of an entrepreneurial
firm by shaping the demand function for its products (Millán et al. 2014, p. 612). Higher
educated consumers increase the demand for more differentiated and innovative products and
services (ibid, p. 613). As a consequence, new (niche) business opportunities may emerge
from which entrepreneurial firms are likely to benefit (ibid). Since technology based firms
tend to be more innovative than firms in traditional industries, they may benefit more from a
large number of highly educated consumers.
Education is also closely linked to innovation. It provides the foundation from which
technological invention and innovation can occur (Woolley 2014, p. 725). Innovation is
generally a growth driver for firms and a positive predictor of survival (Quatraro & Vivarelli
2014, p. 13). If the underlying motivation to start a new firm is linked to innovative products,
firm performance tends to be above-average (ibid). Furthermore, early investments in R&D
increase the growth rates of technology based firms (Stam & Wennberg 2009, p. 86). The
information technology industry is at the frontier of innovativeness and technological
development and firms operating in this industry often enjoy an ‘innovation premium’ in
survival time (Quatraro & Vivarelli 2014, p. 13). However, the positive impact of innovation
36
on firm performance is strictly related to the differential patterns of specialisation of countries
(ibid). Emerging economies are not necessarily specialised in innovation-driven industries and
can therefore be far from the technological frontier. In addition, technology based firms in
emerging economies often face greater resource constraints and have higher levels of
informality than their counterparts in developed economies (Siqueira & Bruton 2010, p. 39).
These two factors probably mitigate any positive effect of innovation and R&D investments
on firm performance (Quatraro & Vivarelli 2014, p. 13).
Infrastructure & Technology
Infrastructure includes the development of transportation systems, sanitation, electricity as
well as information technology services such as telecommunication networks and internet
access. A lack of infrastructure often represents a major constraint for entrepreneurs in
emerging economies (Tracey & Phillips 2011, p. 26). It prevents entrepreneurs from entering
the market and also hinders small and young firms from growing (Quatraro & Vivarelli 2014,
p. 5). A lack of infrastructure hits especially technology based start-ups since their products
are based on the use of computers, mobile devices and the internet. They do not only need
basic infrastructure such as electricity but also access to technological infrastructure. In fact,
technology based start-ups are likely to have higher earnings the greater information
technology diffusion in the country since they will be able to reach more customers. Emerging
economies vary in their digitalisation levels, i.e. adoption of information and communication
technology. A key driver of digitalisation in emerging economies is the availability of basic
infrastructure as well as economic growth (Billon et al. 2010, p. 65). In addition, a country’s
technology adoption also rises with education levels, in particular as concerns internet
adoption (Corrales & Westhoff 2006, p. 915). A barrier to technology adoption can be
restrictions of political liberties such as internet censorship (ibid, p. 930). Authoritarian
regimes tend to develop restrictive policies on internet usage. They may promote information
technologies only as long as they can control content (ibid). Even though higher levels of
income can enable citizens to overcome barriers to connectivity imposed by authoritarian
states (ibid), technology entrepreneurs might still have difficulties in becoming aware of
recent technological developments and accessing knowledge. As a consequence, they are
hindered in identifying and realising new business opportunities or perceive the net gains
from new technologies to be lower than they actually are and decide not to seize new
opportunities (Pathak et al. 2013, p. 2093).
37
Business Groups & Clusters
Large business groups are ubiquitous in emerging markets. They usually consist of legally
independent firms which operate in multiple, sometimes unrelated industries and are
oftentimes family-owned. Their role and impact on business in emerging economies is
controversial. On one hand, business groups substitute for weak institutions and missing
markets for resources such as capital and labour (Bhaumik & Zhou 2014, p. 15). They often
enjoy close ties to the government and may even help the government with the development
of several industry sectors (Khanna & Yafeh 2007, p. 359). On the other hand, they can use
their political influence to lobby for their interests and manifest their position in the market. In
fact, business groups often enjoy considerable market power and may, under some
circumstances, drive their competitors out of markets (ibid, p. 361). Business groups often
outperform independent firms because they can obtain rare human and financial resources
from group affiliated firms. In terms of innovation and technological change, groups provide
infrastructure needed to support innovation and technological development when market
based institutions are weak (Mahmood & Mitchell 2004, p. 1361). This may result in greater
innovation and higher productivity in group affiliated firms (Bhaumik & Zhou 2014, p. 3). At
the same time, groups tend to converge in their technological variety and therefore restrict
possible innovations in their industries (Mahmood & Mitchell 2004, p. 1361). Independent
firms can expand the range of possible innovations with their ideas and products. However,
the entry barriers for independent firms tend to be high in industries dominated by large
business groups (ibid). The final trade-off in terms of innovation will vary depending on
development and availability of market based innovation institutions in the country. If
institutions are weak, business groups can provide infrastructure and promote innovation in
their industries. However, if institutions are available and/or a variety of technological
opportunities arise, business groups tend to inhibit innovation by creating entry barriers for
independent firms (ibid). As a consequence, technology based start-ups in emerging
economies may profit from infrastructure and the innovation threshold created by business
groups as long as market based innovation institutions are weak. When institutions improve,
innovation variety increases and a greater number of technological opportunities arise,
technology based start-ups will be limited in exploiting these business opportunities as large
business groups dominating the industry create high entry barriers.
Market based innovation institutions are, for instance, economic clusters. Clusters are
specific geographic locations where economic activity tends to be concentrated. Information
technology or high technology clusters in general are often created by universities and
38
research foundations locating in a few specific areas. They attract highly skilled employees,
financial investors (e.g. venture capitalists) and new technology based start-ups. Start-ups
located in clusters may not only benefit from a larger pool of available talent but also from a
larger number of specialised suppliers to work with (Pe’er & Keil 2013, p. 354). In addition, a
larger number of customers may be attracted to clusters and thereby making it easier for start-
ups to form customer relationships (ibid). Start-ups with below average resources tend to
benefit more from clusters than their competitors as the improved access to labour, suppliers
and customers may compensate their lack of internal resources (ibid). Accordingly,
technology based start-ups in emerging economies which often suffer from a lack of resources
may improve their chances of success by locating in clusters, especially if they operate
internationally and face global competition.
Summary
This section discussed the most relevant formal institutions to technology based start-ups in
emerging economies. Previous research in the area of entrepreneurship in high technology
industries has focused on opportunity creation and recognition and taken the institutional
context for granted (Woolley 2014, p. 741). It has been assumed that once an entrepreneur
finds an opportunity, the institutional context will be supportive. By looking at the formal
institutional context of technology entrepreneurship in emerging economies we can see that
the institutional context is not always supportive and can affect the survival and performance
of start-ups in various ways. Technology entrepreneurs in emerging economies often have to
deal with weak enforcement of property rights, laws and regulations. They may come across
corruption and bureaucratic hurdles and face financial constraints due to underdeveloped
financial markets. Highly skilled labour can be difficult to find and technological
infrastructure is still underdeveloped or even restricted by authoritative governments in some
countries. Business groups can provide infrastructure for innovation while at the same time
increasing entry barriers. Clusters may help start-ups compensate for a lack of internal
resources by providing easier access to highly skilled labour, suppliers and customers. Which
formal institutional factors have the most significant impact on the performance of technology
based start-ups depends on the country’s stage of development (Fogel et al. 2006, p. 546). The
empirical part of this thesis will analyse the most critical formal (and informal) institutional
factors influencing technology based start-ups in China and Indonesia.
39
2.2.2. Informal Institutions
The previous chapter investigated the most significant formal institutional constraints that
technology based start-ups face in emerging economies. This chapter discusses the most
significant informal institutional constraints. In terms of entrepreneurship, informal
institutions refer to the general knowledge about establishing and operating a new business
and the societal attitude towards entrepreneurial activities in a certain country or region
(Busenitz et al. 2000, p. 995). Informal institutions can be described by certain cultural
factors which impact entrepreneurship and the performance of new firms (Salimath & Cullen
2010, p. 365). Among these factors are, for instance, fear of business failure, social status
associated with entrepreneurship, individualism and collectivism, innovativeness and
performance orientation. There is evidence for central characteristics of entrepreneurial
behaviour that apply across cultural contexts (Autio et al. 2013, p. 337). This provides an
important precondition for studying cultural influences and hence informal institutional
constraints on entrepreneurship (ibid). However, most research in terms of informal
institutions and cultural influences on entrepreneurship focuses on their impact on nascent
entrepreneurship, i.e. the entry rates of new firms and the decision of entrepreneurs to start a
new business venture. The impact of culture and informal institutions on post-entry
entrepreneurial decisions and firm performance has been largely ignored (ibid, p. 335). The
following sections discuss the few cultural factors which have been found to have significant
impact on the post-entry firm performance of technology based start-ups.
Uncertainty Avoidance & Fear of Failure
Establishing a new firm bears a great number of risks and uncertainties. The entrepreneur
needs to invest resources and effort before the outcomes of his or her entrepreneurial
decisions are known. He or she often needs to disrupt established and predictable ways of
doing business in order to achieve firm growth. These ambiguous situations can be
threatening to the individual who avoids uncertainty and seeks security. Uncertainty
avoidance is a personal trait of individuals which is likely to be influenced by culture (Autio
et al. 2013, p. 337). Thus uncertainty avoidance is also a cultural factor reflecting the level of
tolerance for ambiguity within a society (Roxas & Chadee 2012, p. 328). Societies with high
levels of uncertainty avoidance tend to have less entrepreneurial ventures compared to
societies with low levels of uncertainty avoidance (ibid, pp. 338-339). Entrepreneurship and
the pursuit of growth are likely to be seen as abnormal behaviour in high uncertainty
avoidance societies (Autio et al. 2013, p. 341). As a consequence, entrepreneurs may be
40
prevented from taking the risks necessary to grow their business ventures. Establishing and
growing their ventures also carry a higher social cost for the entrepreneur in high uncertainty
avoidance societies, especially in the case of failure. As occupation is a visible characteristic
that presents the individual in society, business failure shames the entrepreneur and can mean
a loss of face (Begley & Tan 2001, pp. 538-539). The entrepreneur might lose social status
and even have a sense of having let down the family and his or her supporters (ibid). While
fear of failure can drive entrepreneurs to strive hard (ibid, p. 540), its effect of preventing
entrepreneurs to try out new and untested business approaches and to exploit high growth
opportunities is likely to be more dominant (Autio et al. 2013, p. 341). In regard to technology
industries, the negative effects of uncertainty avoidance and fear of failure are likely to be
even more significant. As discussed in the previous chapter on the industry-based view of the
firm, technology industries are characterised by instability, rapid change, high risk and high
growth. As a result, technology based start-ups of risk-adverse entrepreneurs who are afraid to
fail are likely to experience less growth than those of risk tolerant entrepreneurs.
Performance Orientation
Entrepreneurship is also fundamentally ambitious and competitive behaviour. Entrepreneurs
typically need to strive hard to create new products and services. As soon as they enter the
market, they need to mobilise resources and overcome competition from established market
players. These aspects resonate closely with the cultural concept of performance orientation
(Autio et al. 2013, p. 337). Performance orientation reflects the extent to which a society
values ambition, hard work and competition (Javidan 2004, p. 239). Performance oriented
societies tend to demand high levels of competitiveness and high performance standards from
firms and place major rewards on performance improvements (Autio et al. 2013, pp. 341-342;
Roxas & Chadee 2012, pp. 326-327). As a result, entrepreneurs are encouraged (or pressured)
to have ambitious goals and work hard to achieve them. What is more, performance oriented
societies consider time non-renewable and subject to high depletion (Roxas & Chadee 2012,
pp. 326-327). They thereby promote a strong sense of urgency in making decisions and
meeting challenges which encourages entrepreneurs to aspire for rapid growth. This may
have positive implications for the growth of technology based start-ups. As technology
industries change rapidly and product life cycles are short, entrepreneurs need to work hard to
keep up with changes and constantly develop new and better products and services. Rapid
growth ambitions may also enable technology entrepreneurs to capture network effects.
41
Individualism and Collectivism
Entrepreneurship is considered fundamentally individual-level behaviour and therefore
resonates closely with the individualism-collectivism dimension of culture (Autio et al. 2013,
p. 337). Researchers have traditionally associated entrepreneurship with individualism
arguing that individualistic societies have higher rates of firm creation than collectivist
societies (Pinillos & Reyes 2011, p. 23). Collectivism involves the subordination of individual
interests to the good of society and emphasises sharing, cooperation, solidarity and harmony
within the society. Thus it is believed that entrepreneurship being individual-centred
behaviour is not supported by collectivist societies and thereby the entrepreneurship rate is
lower in collectivist societies. Recent studies indicate that the relationship between the
individualism-collectivism dimension and a country’s entrepreneurship rate depends on the
country’s stage of development (ibid). In fact, the entrepreneurship rate is negatively related
to individualism in countries at medium or low levels of economic development (ibid). Thus
individualism does not necessarily promote entrepreneurship. What is more, collectivism may
even be positively related to firm performance (Autio et al. 2013, p. 357). Once entrepreneurs
made the ‘individualistic’ decision to pursue their own business venture and entered the
market, they generate benefits for the broader society, for instance by providing jobs. This
creates legitimacy for entrepreneurs in society and encourages them to pursue firm growth
(ibid, p. 340). Seeing that their venture’s success and the benefit of the broader society are
aligned may motivate entrepreneurs to work even harder to grow their ventures (ibid). In the
case of technology based start-ups, benefits of the broader society that can legitimate
entrepreneurs’ growth aspirations do not only include the creation of jobs but also the
development of new technologies and innovation.
Media Attention
Media attention is a cultural factor of different dimension compared to those discussed
previously and an informal institution which can have significant impact on the performance
of technology based start-ups. The media function as information intermediaries and affect
what information becomes available and to what extent by selecting a small subset of issues,
events, developments and organisations to focus public attention on (Petkova et al. 2013, p.
866). In regard to business ventures, the media represents a form of external relationship and
has significant legitimating power (Tolbert et al. 2011, p. 1336). In fact, attracting attention is
an important step in the legitimation process of start-ups (Petkova et al. 2013, p. 866).
Customers, investors, suppliers and other stakeholders need to notice and recognise a new
42
business venture as a participant in the market in order to consider it as a potential transaction
partner (ibid, p. 867). Since new firms and technology based start-ups in particular tend to be
of small size and have limited resources, they can only reach a rather limited number of
stakeholders and have difficulties in attracting broader market attention. Media institutions
can help solve this problem by exposing new firms to a greater number of stakeholders. New
firms gain legitimacy by displaying ties to established institutions in their environment and
are therefore more likely to be seen as proper transaction partners by stakeholders (Tolbert et
al. 2011, p. 1336). What is more, the media can also place constraints on certain behaviour
and expose opportunism (Fogel et al. 2006, pp. 568-569). Uncensored, free media can expose
misbehaviour of governments and firms and thereby create social transparency and reduce
corruption (ibid). This creates a better political environment for entrepreneurs from which
technology based start-ups are likely to benefit (ibid).
Summary
Besides formal institutions, North (1990) also describes informal institutions which place
constraints on the behaviour of individuals and organisations. Unlike formal institutions,
informal institutional constraints are oftentimes not readily identifiable because they are
deeply embedded in society. A nation’s culture has been found to embody informal
institutional constraints. In regard to entrepreneurship, the informal institutional constraints
most prominent in research are cultural factors such as uncertainty avoidance, fear of failure,
performance orientation, individualism and collectivism (Salimath & Cullen 2010). High
levels of uncertainty avoidance and fear of failure tend to restrict the creation of new
businesses and the exploitation of growth opportunities and is thus assumed to have negative
impact on firm performance of technology based start-ups in emerging economies. In contrast,
performance orientation affects firm performance in a positive way as it spurs entrepreneurs
to work hard. Even though collectivism is seen to discourage entrepreneurs from starting their
own firm, it may have a positive influence on the post-entry performance of firms. Media
attention is another important informal institutional constraint affecting firm performance,
albeit in a different way. New firms can gain legitimacy by attracting media attention and
benefit from social transparency stimulated by the media. Finally, informal institutions need
to be seen together with formal institutions in order to explain firm performance and cross-
national differences in entrepreneurship (Busenitz et al. 2000, p. 995). It is a broader set of
institutions that guide and constraint business behaviour in emerging economies.
43
2.3. System Theory This chapter discusses system theory and its relevance for management and entrepreneurship.
System theory is the third main theoretical pillar of this thesis and forms the basis for the
methodology of the empirical part. According to Heylighen and Joslyn (1992), system theory
can be defined as “the transdisciplinary study of the abstract organization of phenomena,
independent of their substance, type, or spatial or temporal scale of existence. It investigates
both the principles common to all complex entities, and the (usually mathematical) models
which can be used to describe them”. It was first proposed by biologist Ludwig von
Bertalanffy in the 1940s and has since then been expanded to other disciplines (e.g.
mathematics, computer science, sociology, etc.) and developed a number of different research
streams. Chen and Stroup (1993, pp. 448-449) identified the following notions which lie at the
core of system theory:
A system is a combination of interacting parts while the sum of these parts exhibits
special behaviour which is not inherent in its single, constituent parts. That is, “the
whole is more than the sum of its parts” as Aristotle put it.
A system can be physical, biological, social and/or symbolic.
Change, such as growth or decay, is defined as the transformation of the system in
time, though conserving the system’s identity.
The changes observed in the system are characterised by goal directed behaviour. A
system is actively organized in terms of its goal(s).
The mechanism which mediates between the system and its goal(s) is feedback.
Time is a central variable in system theory and adds dynamics to the system.
A system may contain subsystems and/or be a part of a greater system itself. The
boundary serves to delineate it from its environment and subsystems.
A system interacts with its environment. These interactions can be defined as the input
and output of material, information and energy. The system can be open, closed or
semi-permeable to its environment.
Proposing a holistic view and emphasizing synthesis system theory stands in contrast to
Descartes’ scientific reductionism. Instead of reducing an entity to the properties of its parts,
system theory focuses on the relations between and the arrangement of the parts which create
a whole. While reducing complex phenomena to elementary particles and processes is very
helpful in understanding processes which can readily be broken down to simple causal chains,
the description of multivariable systems can be problematic within this framework (Chen &
44
Stroup 1993, p. 449). For examining the influence of institutional factors on technology based
start-ups in emerging markets, system theory is helpful as it allows the inclusion of several
variables in consideration of time.
2.3.1. Cybernetics, Complexity and Management
Natural systems like cells, plants and humans are self-regulating. They possess control
mechanisms which regulate their interactions and keep important variables (e.g. body
temperature) within certain limits. Systems which are created by humans, such as machines,
software programs, and firms, lack the ability to control and regulate themselves naturally.
Consequently, control and regulation mechanism have to be found and included into these
‘artificial’ systems to guarantee their proper functioning. This is what the science of
cybernetics is about: it examines the control, regulation and steering mechanism of systems
(Malik 2013, p. 51). A system that can be controlled is called cybernetic. Cybernetics was
first introduced by mathematician Norbert Wiener in 1948 and provides the foundation to
understanding, explaining and using information (ibid). In cybernetics, information is
considered to be one of three main parameters in the world, with material and energy being
the other two (ibid). Material and energy forms the basis of the system while information
organises, arranges and regulates material and energy (ibid). For example, humans are
composed of the same materials as chimpanzees but the way these materials are organised in
humans is different. This results in humans being different from chimpanzees. Thus it is the
way systems are organised, regulated and controlled which contributes most to their
characteristics and abilities (ibid, p. 52).
For systems which are not naturally self-regulating, this raises the question of how their
materials and energy should be organised, regulated and controlled in order to function
properly and to their fullest potential. How should the materials of a pair of scissors be
arranged so that it fulfils its purpose of cutting paper when in use? How should an electronic
calculator be programmed to produce correct results? How should a start-up design its
processes in order to survive in tough market environments and provide the most value to its
customers? Beer (1967, pp. 27-34) classifies systems according to their complexity and the
probability of their behaviour. According to his classification, a pair of scissors is a simple
and determinate system because it is easy to understand and its behaviour is easy to predict. In
comparison, an electronic calculator is a more complex system but the number of possibilities
of how it behaves to input is still determinate. This is different for start-ups. Firms are very
complex and probabilistic systems (ibid, p. 33). Consequently, it is difficult to predict how the
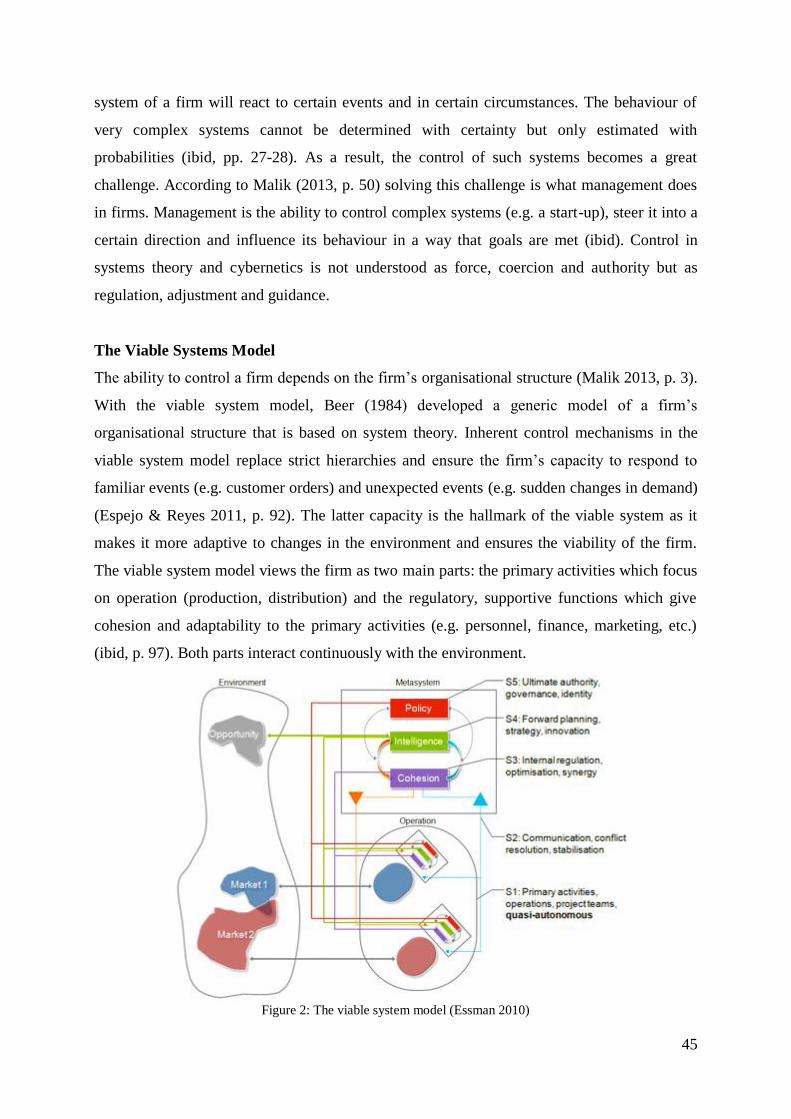
45
system of a firm will react to certain events and in certain circumstances. The behaviour of
very complex systems cannot be determined with certainty but only estimated with
probabilities (ibid, pp. 27-28). As a result, the control of such systems becomes a great
challenge. According to Malik (2013, p. 50) solving this challenge is what management does
in firms. Management is the ability to control complex systems (e.g. a start-up), steer it into a
certain direction and influence its behaviour in a way that goals are met (ibid). Control in
systems theory and cybernetics is not understood as force, coercion and authority but as
regulation, adjustment and guidance.
The Viable Systems Model
The ability to control a firm depends on the firm’s organisational structure (Malik 2013, p. 3).
With the viable system model, Beer (1984) developed a generic model of a firm’s
organisational structure that is based on system theory. Inherent control mechanisms in the
viable system model replace strict hierarchies and ensure the firm’s capacity to respond to
familiar events (e.g. customer orders) and unexpected events (e.g. sudden changes in demand)
(Espejo & Reyes 2011, p. 92). The latter capacity is the hallmark of the viable system as it
makes it more adaptive to changes in the environment and ensures the viability of the firm.
The viable system model views the firm as two main parts: the primary activities which focus
on operation (production, distribution) and the regulatory, supportive functions which give
cohesion and adaptability to the primary activities (e.g. personnel, finance, marketing, etc.)
(ibid, p. 97). Both parts interact continuously with the environment.
Figure 2: The viable system model (Essman 2010)
46
Part one (operational units) also corresponds to system 1 (S1) whose elements are themselves
small viable systems (Beer 1984, p. 14). Part two consists of the following systems which are
designed to create balance between the environment and system 1 (Walker 2006):
System 2 (S2) is charged with the coordination between operational units (systems 1),
similar to an air traffic controller coordinating departing and arriving planes at an
airport.
System 3 (S3) creates cohesion and has to do with management processes which build
the primary activities into a greater whole, e.g. financial control, personnel. It provides
resources to and oversees the operational units.
System 4 (S4) is responsible for future planning in the context of the environment. It
ensures the firm’s ability to change by looking outside the organisation and into the
future. Disciplines are for example financial planning, training, product development.
System 5 (S5) is the ultimate authority, the top management, and oversees the entire
organisation.
The original version of the viable systems model by Beer (1984) has served as the basis for
similar models in research and practice (the St. Gallener Management Model being one
important example) most of which focus on large organisations. Since small firms such as
technology based start-ups tend to be less complex than large firms and have innately flat
hierarchies, all functions (systems) might be done by one person or shared between managers
and employees. However, they too are required to create value for their customers and react
quickly to feedback from their environment if they are to remain viable. A study by Sommer
et al. (2009, p. 119) shows that start-ups are best advised to pursue trial-and-error learning if
their environment is highly uncertain. Trial-and-error learning is based on recognising and
interpreting feedback and adjusting activities and targets according to information from
feedback (ibid). The concept of feedback is essential in system thinking and in methods based
on system theory. The following section discusses one of these methods, system dynamics,
which is used by researchers and businesses to understand and interpret feedback
relationships in their organisation and environment.
2.3.2. System Dynamics
System dynamics is a methodology based on system theory and allows studying systems of
complex nature such as organisations operating in a specific environment. It was first
proposed by Jay Forrester in the 1950s as an alternative to linear and static methods used in
social science (Bloodgood et al. 2015, p. 4). It is fundamentally interdisciplinary and draws on
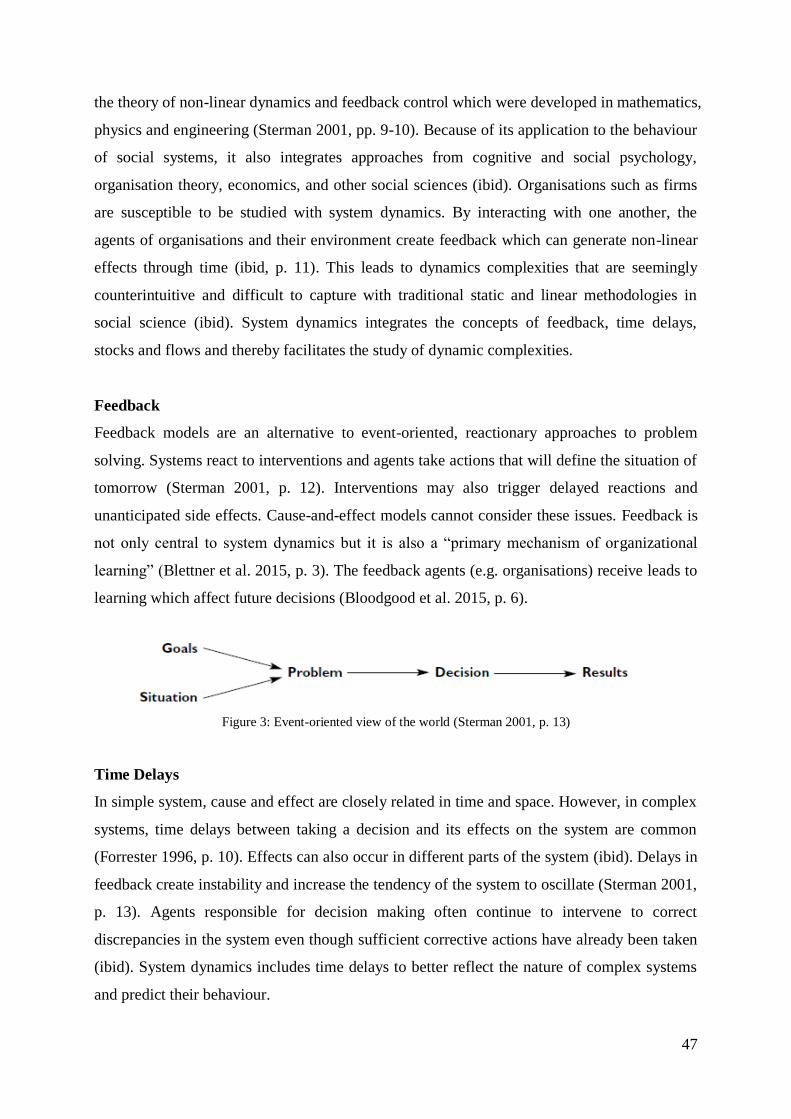
47
the theory of non-linear dynamics and feedback control which were developed in mathematics,
physics and engineering (Sterman 2001, pp. 9-10). Because of its application to the behaviour
of social systems, it also integrates approaches from cognitive and social psychology,
organisation theory, economics, and other social sciences (ibid). Organisations such as firms
are susceptible to be studied with system dynamics. By interacting with one another, the
agents of organisations and their environment create feedback which can generate non-linear
effects through time (ibid, p. 11). This leads to dynamics complexities that are seemingly
counterintuitive and difficult to capture with traditional static and linear methodologies in
social science (ibid). System dynamics integrates the concepts of feedback, time delays,
stocks and flows and thereby facilitates the study of dynamic complexities.
Feedback
Feedback models are an alternative to event-oriented, reactionary approaches to problem
solving. Systems react to interventions and agents take actions that will define the situation of
tomorrow (Sterman 2001, p. 12). Interventions may also trigger delayed reactions and
unanticipated side effects. Cause-and-effect models cannot consider these issues. Feedback is
not only central to system dynamics but it is also a “primary mechanism of organizational
learning” (Blettner et al. 2015, p. 3). The feedback agents (e.g. organisations) receive leads to
learning which affect future decisions (Bloodgood et al. 2015, p. 6).
Figure 3: Event-oriented view of the world (Sterman 2001, p. 13)
Time Delays
In simple system, cause and effect are closely related in time and space. However, in complex
systems, time delays between taking a decision and its effects on the system are common
(Forrester 1996, p. 10). Effects can also occur in different parts of the system (ibid). Delays in
feedback create instability and increase the tendency of the system to oscillate (Sterman 2001,
p. 13). Agents responsible for decision making often continue to intervene to correct
discrepancies in the system even though sufficient corrective actions have already been taken
(ibid). System dynamics includes time delays to better reflect the nature of complex systems
and predict their behaviour.
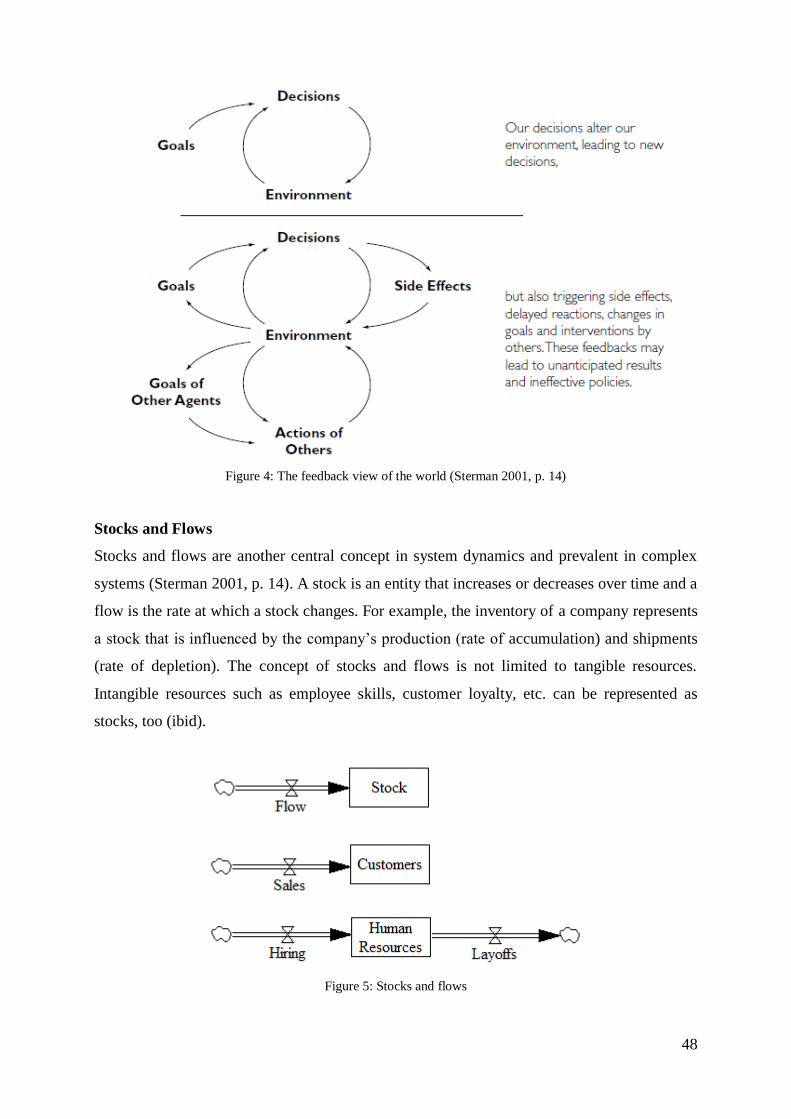
48
Figure 4: The feedback view of the world (Sterman 2001, p. 14)
Stocks and Flows
Stocks and flows are another central concept in system dynamics and prevalent in complex
systems (Sterman 2001, p. 14). A stock is an entity that increases or decreases over time and a
flow is the rate at which a stock changes. For example, the inventory of a company represents
a stock that is influenced by the company’s production (rate of accumulation) and shipments
(rate of depletion). The concept of stocks and flows is not limited to tangible resources.
Intangible resources such as employee skills, customer loyalty, etc. can be represented as
stocks, too (ibid).
Figure 5: Stocks and flows
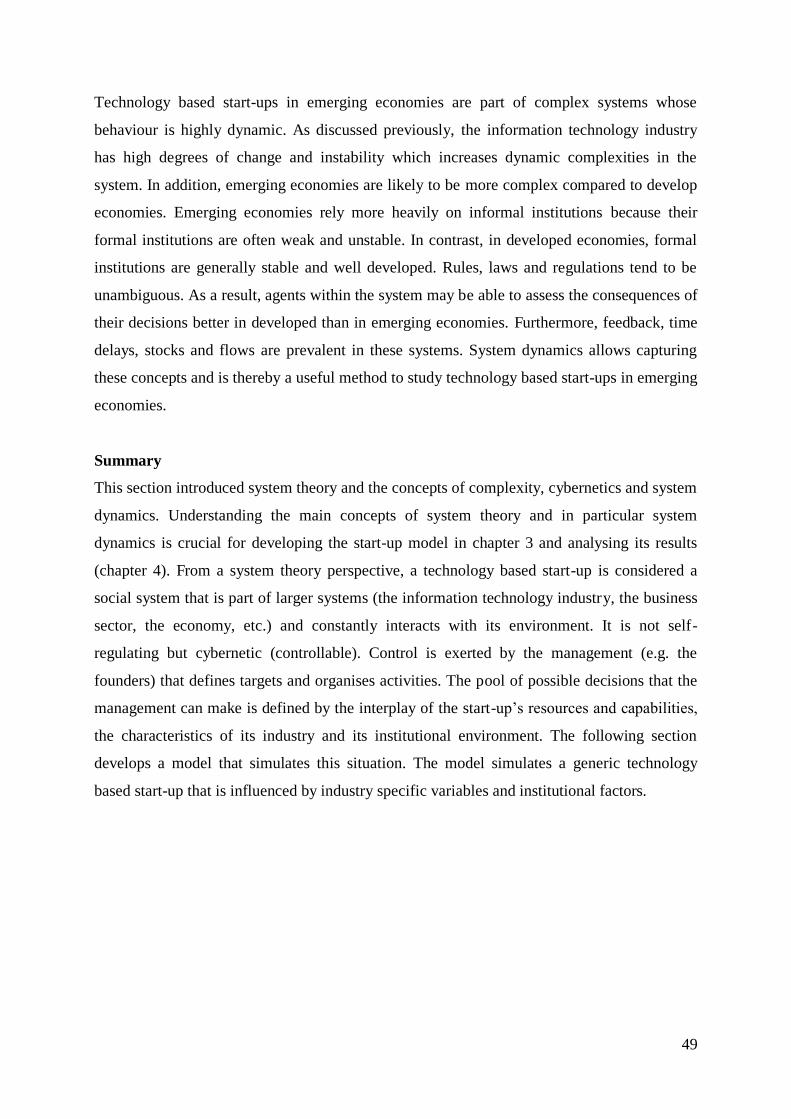
49
Technology based start-ups in emerging economies are part of complex systems whose
behaviour is highly dynamic. As discussed previously, the information technology industry
has high degrees of change and instability which increases dynamic complexities in the
system. In addition, emerging economies are likely to be more complex compared to develop
economies. Emerging economies rely more heavily on informal institutions because their
formal institutions are often weak and unstable. In contrast, in developed economies, formal
institutions are generally stable and well developed. Rules, laws and regulations tend to be
unambiguous. As a result, agents within the system may be able to assess the consequences of
their decisions better in developed than in emerging economies. Furthermore, feedback, time
delays, stocks and flows are prevalent in these systems. System dynamics allows capturing
these concepts and is thereby a useful method to study technology based start-ups in emerging
economies.
Summary
This section introduced system theory and the concepts of complexity, cybernetics and system
dynamics. Understanding the main concepts of system theory and in particular system
dynamics is crucial for developing the start-up model in chapter 3 and analysing its results
(chapter 4). From a system theory perspective, a technology based start-up is considered a
social system that is part of larger systems (the information technology industry, the business
sector, the economy, etc.) and constantly interacts with its environment. It is not self-
regulating but cybernetic (controllable). Control is exerted by the management (e.g. the
founders) that defines targets and organises activities. The pool of possible decisions that the
management can make is defined by the interplay of the start-up’s resources and capabilities,
the characteristics of its industry and its institutional environment. The following section
develops a model that simulates this situation. The model simulates a generic technology
based start-up that is influenced by industry specific variables and institutional factors.
50
3. The Start-Up Model The theoretical framework developed in the previous chapter provides the theoretical basis
for the creation of the system dynamics model. The strategy tripod explained the three main
perspectives on a start-up operating in the information technology business: the start-up
business with its resources, capabilities and organisational structure, the start-up’s industry
and its institutional environment. The latter pillar, the start-up’s institutional environment,
was described in greater detail by institutional theory as it is the main topic of this thesis.
System theory was discussed to connect the three perspectives and introduce the method used
to develop the start-up model in this chapter.
The practical basis for the creation of the model is the work of Hsueh (2011), Miller (2007)
and in particular Saad (2013). They developed similar system dynamics models from which
this thesis draws a number of insights. The system dynamics model is built using Vensim, a
software program that allows developing and simulating system dynamics models. The
model’s variables are represented by stocks, flows, auxiliaries and exogenous constants.
Consequently, behind every variable is either a function (e.g. an integral, linear function, etc.)
or a constant number. Variables are connected to each other allowing the simulation of
complex relationships, feedback and time delays. The model simulates the first sixty months
of the start-up’s operation which allows observing significant changes in key variables and
performance indicators (e.g. revenues, net profit, human resources, etc.). The model is split
into two parts, the basic model and institutional factors, which are both discussed in the
following sections.
3.1. The Basic Model The basic model simulates the basic structure of a technology based start-up and does not take
into account institutional factors. It incorporates theoretical insights from the resource-based
and industry-based view of the firm as well as from system theory (e.g. the viable systems
model). It represents a generic start-up which could operate in any country (as institutional
factors are still left out in the basic model). The generic start-up is assumed to have already
identified a potentially profitable business opportunity and found at least one customer. This
assumption is important as it allow omitting discussions about personal traits and abilities that
enable entrepreneurs to identify business opportunities. Furthermore, the start-up is assumed
to operate under a legal form as it pursues a high growth strategy and a rapid expansion of its
customer base and plans to obtain external funding.
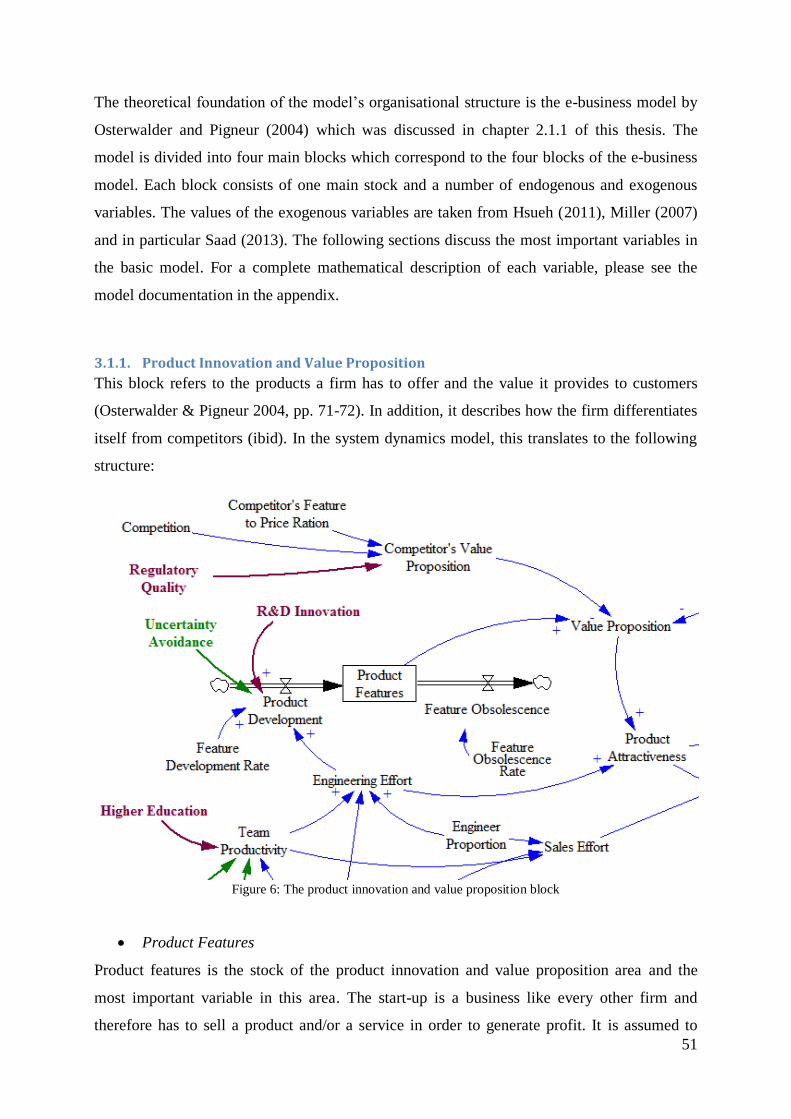
51
The theoretical foundation of the model’s organisational structure is the e-business model by
Osterwalder and Pigneur (2004) which was discussed in chapter 2.1.1 of this thesis. The
model is divided into four main blocks which correspond to the four blocks of the e-business
model. Each block consists of one main stock and a number of endogenous and exogenous
variables. The values of the exogenous variables are taken from Hsueh (2011), Miller (2007)
and in particular Saad (2013). The following sections discuss the most important variables in
the basic model. For a complete mathematical description of each variable, please see the
model documentation in the appendix.
3.1.1. Product Innovation and Value Proposition
This block refers to the products a firm has to offer and the value it provides to customers
(Osterwalder & Pigneur 2004, pp. 71-72). In addition, it describes how the firm differentiates
itself from competitors (ibid). In the system dynamics model, this translates to the following
structure:
Figure 6: The product innovation and value proposition block
Product Features
Product features is the stock of the product innovation and value proposition area and the
most important variable in this area. The start-up is a business like every other firm and
therefore has to sell a product and/or a service in order to generate profit. It is assumed to
52
have one product (e.g. a software program) which can have certain product features. The more
features a product has, the more sophisticated it is and the more value it provides to customers.
Consequently, the start-up’s objective should be the constant development of new product
features. The number of product features is increased when new features are developed
(represented by Product Development) and decreased when features become obsolete
(Feature Obsolescence) (Hsueh 2011, p. 53; Miller 2007, pp. 89-97; Saad 2013, p. 34). The
initial number of product features is one, i.e. the start-up already has a product with one
product feature at the start of the simulation in month zero. The maximum number of product
features is 100.
Product Development
Product development is a rate which increases the stock of product features and one of the
most important variables in the product area of the model. It is measured in features per
month and determined by the variables Feature Development Rate, R&D Innovation (Saad
2013, p. 42) and Engineering Effort (Miller 2007, p. 102). The feature development rate
indicates the number of new features which can theoretically be developed in a certain time
frame. It is assumed that one new feature can be developed every eight months. However, the
final rate is influenced by the engineering effort and the institutional factor R&D innovation.
Engineering Effort
This variable refers to the amount of engineering work which goes into the development of
new product features (Miller 2007, pp. 102/225; Saad 2013, p. 55). It is measured in hours per
month and influenced by the stock of Human Resources (i.e. the number of people working in
the start-up), Engineer Proportion (i.e. the share of engineers in relation total human
resources) and Team Productivity. A higher number of human resources, engineer proportion
and team productivity increase the engineering effort and, as a result, may even increase
product development. However, if engineer proportion is high, Sales Effort decreases as less
staff is available for selling the product. Consequently, a start-up that employs only engineers
will have a very sophisticated product (i.e. a product with many features) but few sales due to
the lack of sales personnel.
Feature Obsolescence
Product features phase out over time which is simulated by the feature obsolescence rate
(Hsueh 2011, p. 53; Miller 2007, pp. 89-97; Saad 2013, p. 34). Feature obsolescence
53
represents the short life cycles common in the information technology industry and thus refers
to the industry-based view of the firm discussed in the theoretical framework. It is assumed
that the theoretical feature obsolescence rate is equal to the initial product development rate
which is set at one feature every eight months. In other words, every eight months, one
product feature becomes obsolete and reduces the stock of product features.
Value Proposition
The start-up’s value proposition indicates the value customers receive in relation to the
number of product features, the value proposition of competing firms and the price they pay
for the product (Saad 2013, p. 42). The higher the number of offered product features, the
higher the value proposition. The Competitor’s Value Proposition as well as Pricing are
negatively related to the start-up’s value proposition. This means that an increase in the
competitor’s value proposition reduces the start-up’s value proposition. The same is true for
pricing: the higher the product’s price, the lower the value proposition as price sensitive
customers will be discouraged from purchasing the product.
Competitor’s Value Proposition
This variable represents the aspect of competition of the industry-based view of the firm in the
system dynamics model. It simulates the intense level of competition and the low barriers of
entry within the information technology industry. The competitor’s value proposition (Saad
2013, p. 74) describes the value customers get when purchasing the competitor’s product. It is
influenced by Competition (the level of competition within the industry) (ibid, p. 42),
Regulatory Quality (an institutional factor), and the Competitor’s Feature to Price Ratio (ibid,
pp. 42/74) which represents the pricing of the competitor’s product. The level of competition
is assumed to be high, i.e. on a scale between 0 and 10, it is assumed to be at 8 (ibid, p. 74).
3.1.2. Customer Relationship
This area describes the customers that the start-up targets with its product offering and value
proposition and the relationship it wants to establish with them (Osterwalder & Pigneur 2004,
pp. 74-78). In the system dynamics model, the start-up is assumed to focus on acquiring new
customers and give less attention to add-on selling and customer retention. The customer
segment the start-up wants to sell to is described as market size in the model. The overall
structure of the customer relationship area looks as follows:
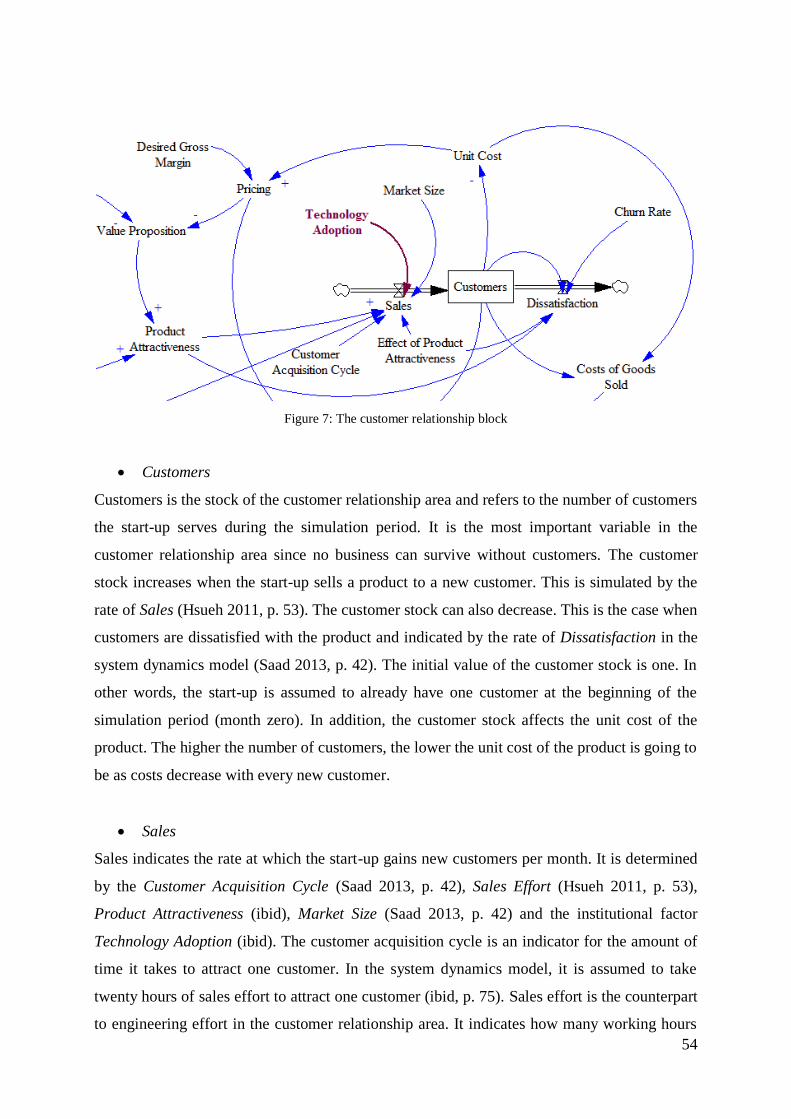
54
Figure 7: The customer relationship block
Customers
Customers is the stock of the customer relationship area and refers to the number of customers
the start-up serves during the simulation period. It is the most important variable in the
customer relationship area since no business can survive without customers. The customer
stock increases when the start-up sells a product to a new customer. This is simulated by the
rate of Sales (Hsueh 2011, p. 53). The customer stock can also decrease. This is the case when
customers are dissatisfied with the product and indicated by the rate of Dissatisfaction in the
system dynamics model (Saad 2013, p. 42). The initial value of the customer stock is one. In
other words, the start-up is assumed to already have one customer at the beginning of the
simulation period (month zero). In addition, the customer stock affects the unit cost of the
product. The higher the number of customers, the lower the unit cost of the product is going to
be as costs decrease with every new customer.
Sales
Sales indicates the rate at which the start-up gains new customers per month. It is determined
by the Customer Acquisition Cycle (Saad 2013, p. 42), Sales Effort (Hsueh 2011, p. 53),
Product Attractiveness (ibid), Market Size (Saad 2013, p. 42) and the institutional factor
Technology Adoption (ibid). The customer acquisition cycle is an indicator for the amount of
time it takes to attract one customer. In the system dynamics model, it is assumed to take
twenty hours of sales effort to attract one customer (ibid, p. 75). Sales effort is the counterpart
to engineering effort in the customer relationship area. It indicates how many working hours
55
go into actively selling the product and is affected by team productivity and engineer
proportion (Hsueh 2011, p. 53).
Product Attractiveness
In addition to the effect of customer acquisition cycle and sales effort, the sales rate is also
influenced by product attractiveness. The more attractive the product is to customers, the
easier it is for the start-up to sell it and increase its customer stock. Product attractiveness is
determined by the value proposition and engineering effort. Engineering effort does not only
make the product more sophisticated but it also shows the start-up’s expertise towards
customers. Thus, if the start-up increases its engineering effort, the product will be more
sophisticated and more attractive to customers. Similarly, a high value position increases
product attractiveness. The more value (potential) customers get for the money they pay, the
more attractive the product is going to be.
Market Size
Market size is a constant in the system dynamics model and refers to the number of potential
customers in the market that the start-up chose to operate in (Saad 2013, p. 41). As
Osterwalder and Pigneur (2004, pp. 74-78) state in the customer relationship block of their e-
business model, it is important for the firm to define its target market and perform customer
segmentation. The firm will be able to better estimate the number and characteristics of
potential customers and use this information as a base for budget planning and marketing
activities. In the system dynamics model, target customers are assumed to be individuals (as
opposed to firms). Market size is usually determined by the national population and would be
different for China and Indonesia since China’s population is significantly larger than
Indonesia’s population. However, this model assumes the same market size for both countries
in order to isolate the effect of the institutional environment on the start-up. Further research
and modelling would need to differentiate between the information technology market in
China and in Indonesia and include the differences (such as market size) in the simulation.
Dissatisfaction
Dissatisfaction is the rate that reduces the stock of customers. It is negatively related to
product attractiveness (Saad 2013, p. 42). Consequently, if product attractiveness is high,
dissatisfaction will be low as the product is generally viewed desirable and customers are
satisfied. Dissatisfaction is also affected by the Churn Rate (ibid, p. 74). It describes the rate
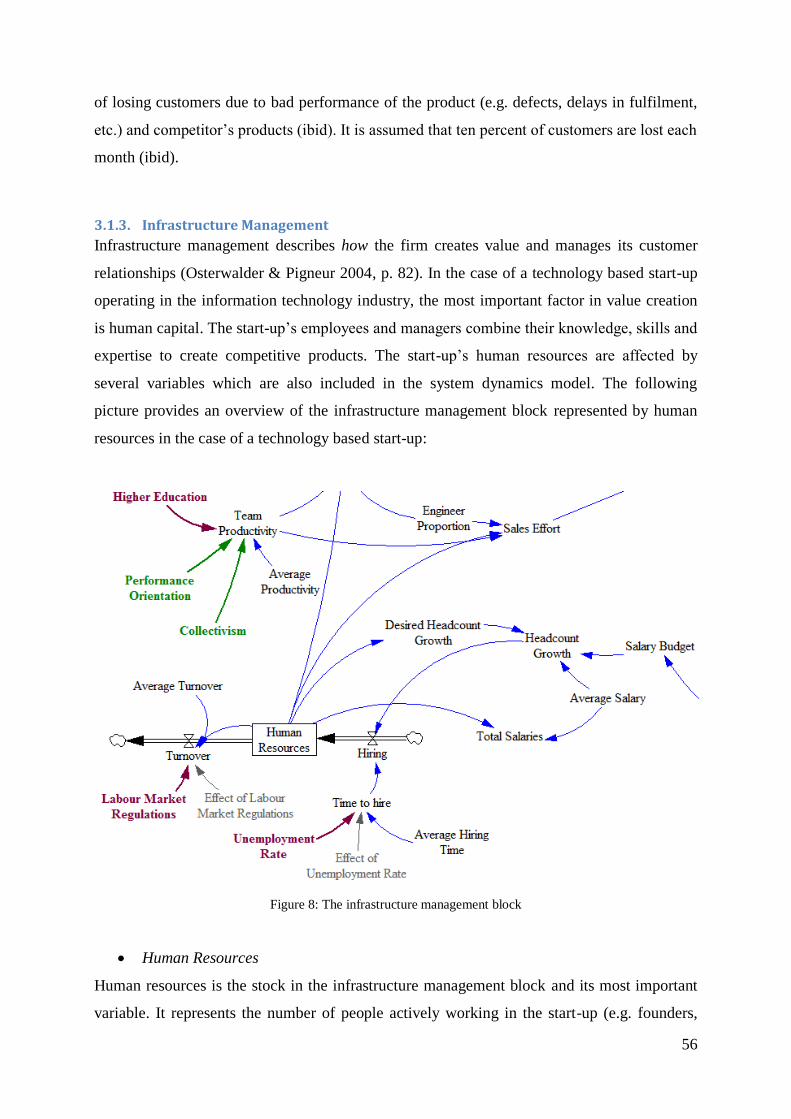
56
of losing customers due to bad performance of the product (e.g. defects, delays in fulfilment,
etc.) and competitor’s products (ibid). It is assumed that ten percent of customers are lost each
month (ibid).
3.1.3. Infrastructure Management
Infrastructure management describes how the firm creates value and manages its customer
relationships (Osterwalder & Pigneur 2004, p. 82). In the case of a technology based start-up
operating in the information technology industry, the most important factor in value creation
is human capital. The start-up’s employees and managers combine their knowledge, skills and
expertise to create competitive products. The start-up’s human resources are affected by
several variables which are also included in the system dynamics model. The following
picture provides an overview of the infrastructure management block represented by human
resources in the case of a technology based start-up:
Figure 8: The infrastructure management block
Human Resources
Human resources is the stock in the infrastructure management block and its most important
variable. It represents the number of people actively working in the start-up (e.g. founders,
57
managers, employees). Human resources are increased by the Hiring rate and decreased by
the Turnover rate (Hsueh 2011, p. 53). The initial value of the human resources stock at the
start of the simulation period (month zero) is set at one. In other words, the start-up starts its
official operation with one staff (the founder).
Hiring
The human resources stock is increased by the hiring rate. The hiring rate is measured in
person per month and determined by two variables: Time to Hire and Headcount Growth
(Hsueh 2011, p. 53). The time to hire measures the time it takes to find and employ new staff.
It depends on the Average Hiring Time which is assumed to be two months (Saad 2013, p. 73)
and the Unemployment Rate (an institutional factor). Headcount growth indicates the number
of new employees the start-up can afford and wants to hire (Hsueh 2011, p. 53). It depends on
the Salary Budget, the Average Salary per employee and the Desired Headcount Growth
(Saad 2013, pp. 42/73/75). The desired headcount growth is assumed to be twenty percent of
current human resources stock every six months until the end of the simulation period (ibid, p.
75). In other words, the start-up plans to increase its human resources stock by twenty percent
every six months. However, the final headcount growth also depends on the financial
resources (i.e. salary budget) available to hire new staff.
Team Productivity
Team productivity indicates how efficient the start-up team does its work. It is measured in
hours per month and person and based on the Average Productivity variable with a value of
140 hours per month per person (Saad 2013, pp. 42, 73). Each employee is theoretically
expected to work 50 hours per week at a productivity level of 70 percent (ibid). In the model,
productivity levels do not only depend on the theoretical average productivity but also on
institutional factors. First, productivity is affected by Higher Education. The more educated a
person, the more efficient he/she is expected to work as he/she possesses a high level of
knowledge and expertise and is a fast learner. A high value of higher education therefore
increases team productivity. Second, performance oriented employees tend to work harder
which is represented in the Performance Orientation variable. Third, higher levels of
Collectivism increase team productivity as well. These three institutional factors are rescaled
and weighted so that they have equal influence on team productivity. Chapter 3.2 provides a
more thorough description of these three institutional factors.
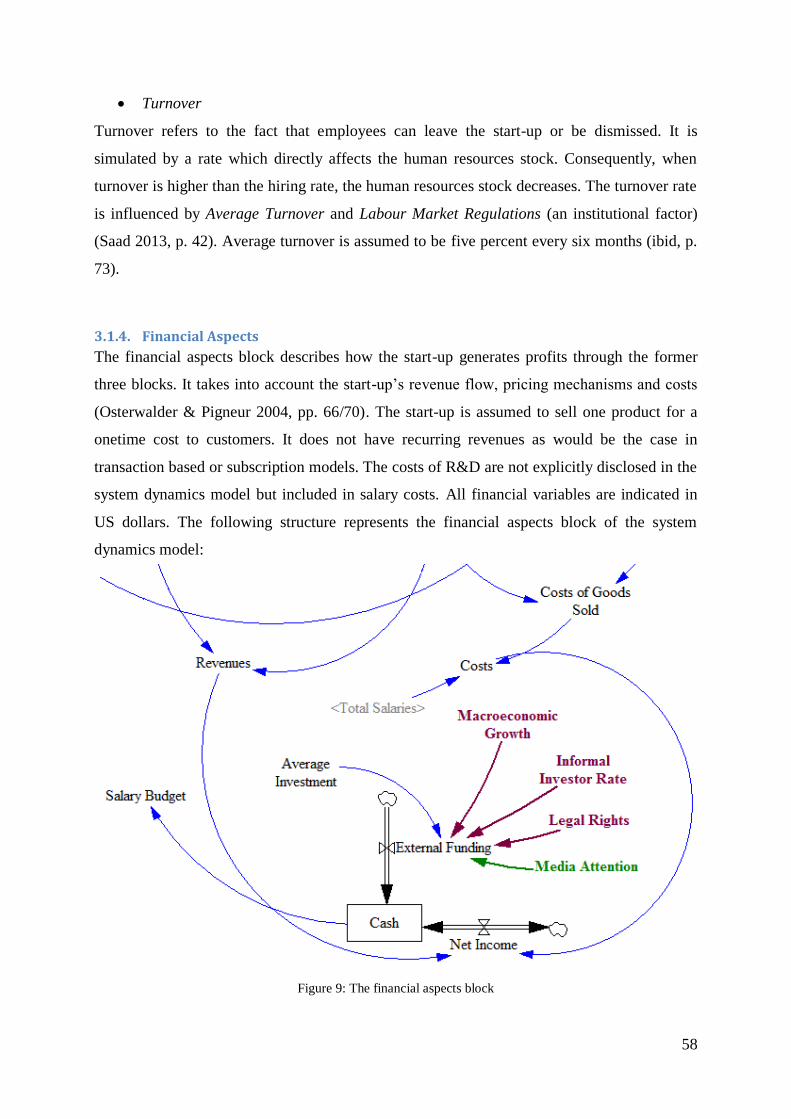
58
Turnover
Turnover refers to the fact that employees can leave the start-up or be dismissed. It is
simulated by a rate which directly affects the human resources stock. Consequently, when
turnover is higher than the hiring rate, the human resources stock decreases. The turnover rate
is influenced by Average Turnover and Labour Market Regulations (an institutional factor)
(Saad 2013, p. 42). Average turnover is assumed to be five percent every six months (ibid, p.
73).
3.1.4. Financial Aspects
The financial aspects block describes how the start-up generates profits through the former
three blocks. It takes into account the start-up’s revenue flow, pricing mechanisms and costs
(Osterwalder & Pigneur 2004, pp. 66/70). The start-up is assumed to sell one product for a
onetime cost to customers. It does not have recurring revenues as would be the case in
transaction based or subscription models. The costs of R&D are not explicitly disclosed in the
system dynamics model but included in salary costs. All financial variables are indicated in
US dollars. The following structure represents the financial aspects block of the system
dynamics model:
Figure 9: The financial aspects block
59
Cash
Cash is the stock of the financial aspects block. It is determined by Net Income (Hsueh 2011,
p. 53) and External Funding (Saad 2013, p. 42). The availability of cash is crucial for the
start-up’s survival and growth. The initial value of the cash stock is assumed at US$20,000
which are provided by the founder. The initial cash is used to pay for product costs and
salaries in case the start-up is not yet generating positive cash flow (e.g. in the first months of
operation) or incurs financial difficulties during the simulation period.
Net Income
The net income rate directly affects the cash stock. It is determined by Revenues minus Costs
and can there increase (revenues > costs) or decrease (revenues < costs) the cash stock (Hsueh
2011, p. 53). Revenues are calculated by multiplying Pricing with the number of customers
while costs consist of Total Salaries and Costs of Goods Sold (ibid). As a result, net income
may only be improved by increasing revenues (e.g. raising the desired gross margin) or
decreasing costs. Since human capital is the start-up’s major resource and unit costs of
information technology products tend to be low, costs can be cut by lowering salaries or
employing less staff.
Pricing
Pricing refers to the amount of money customers pay when purchasing the product. It is
determined by the cost per one unit of product, the gross margin the start-up adds to the unit
cost and competition (Saad 2013, p. 42). The Unit Cost and Desired Gross Margin both
increase pricing. Desired gross margin is assumed to be at 70 percent. As discussed in the
industry-based view of the firm, product margins in the information technology industry tend
to be high since variable costs are comparatively low. The unit cost therefore depends on the
number of customers. If customers are numerous, the unit cost decreases.
External Funding
External funding indicates a rate which can increase (but not decrease) the cash stock (Hsueh
2011, p. 53; Saad 2013, p. 42). It includes all kinds of funds that the start-up obtains from
external sources, e.g. bank loans, venture capital, donations, etc. External funding is largely
determined by institutional factors. These are the Macroeconomic Environment, Informal
Investor Rate, Legal System and Media Attention (see the next section for a detailed
60
discussion). In addition, Average Investment (Saad 2013, p. 73) estimates the average sum
start-ups generally obtain from outside investors. It is assumed at US$ 10,000 per month.
Depending on the institutional factors mentioned previously, the final sum of external funding
may be higher or lower.
Summary
This section described the basic system dynamics model with its internal (resource-based) and
industry-based variables. Its structure is based on the four blocks of Osterwalder and
Pigneur’s (2004) e-business model and its variables are largely derived from the works of
Miller (2007), Hsueh (2011) and Saad (2013). Insights from the industry-based view of the
firm have been included in the model as well. For example, short product (feature) life cycles,
high levels of competition, high fixed costs and low variable costs are either represented by
single variables (e.g. Competition) or have been integrated in other variables of the model (e.g.
Product Development). However, some characteristics of the information technology industry
such as switching costs and network effects have not been directly addressed in the model.
This is due to the fact that, as stated previously, the creation of switching costs and network
effects is comparatively difficult and unlikely for start-ups with limited financial resources. In
addition, an inclusion of these characteristics would significantly reduce the model’s
simplicity and therefore make it more difficult to understand and control.
Many variables in the basic model are dependent and hence will change when the
exogenous constants are altered to simulate different conditions. They are affected not only by
other internal variables but also by institutional factors. The following section describes how
these institutional factors are included in the model. The model is then applied to a fictitious
start-up in China and Indonesia.
3.2. Institutional Factors The theoretical foundation for the inclusion of institutional factors in the system dynamics
model is North’s (1990) institutional theory as discussed in a previous chapter. The
institutional factors included in the model are grouped into formal and informal institutions
according to North’s (1990) definition. Saad (2013) provides practical insights to selecting
variables and determining their values for the system dynamics model. All institutional factors
in the model are exogenous variables and remain constant during the simulation period. Their
values are taken from databases of international organisations such as the World Bank,
organisations affiliated with the World Bank, the United Nations Organization, the Global
61
Entrepreneurship Monitor (GEM) and from the GLOBE study (Gelfand et al. 2004; Javidan
2004; Sully de Luque & Javidan 2004). Even though the use of primary data would be
preferred, it is beyond the scope of this thesis to collect and evaluate primary data on the
institutional environment in China and Indonesia. Consequently, the institutional factors in the
system dynamics model of a start-up are based on secondary data by international
organisations and studies. The use of international databases ensures the data’s comparability.
National databases may use different calculation methods and define indicators differently
which can limit the validity of cross-national comparisons. The following pages describe the
variables and their values for the two countries of this thesis’ comparison – China and
Indonesia.
3.2.1. Formal Institutions
Formal institutions describe the regulatory dimension of a country’s institutional environment.
They include, for example, laws, rules, regulations and government policies and provide a
formal framework for the start-up’s operation. They may affect the start-up in a direct (e.g.
labour laws) and indirect way (e.g. education policies). Following the suggestion of Busenitz
et al. (2000, p. 1001), some institutional factors are coupled in the system dynamics model
and combined into one variable. This does not only keep the model simple but also allows
gaining a more thorough understanding of the start-up’s institutional environment as a greater
number of indicators can be included in the model.
Regulatory Quality
The first institutional variable which is based on several indicators is regulatory quality.
Regulatory quality is calculated by the Worldwide Governance Indicators (WGI) project
group which is affiliated with the World Bank. It is defined as an indicator “capturing
perceptions of the ability of the government to formulate and implement sound policies and
regulations that permit and promote private sector development” (Kaufman et al. 2014a).
Among the factors which constitute the regulatory quality indicator are for example: price
controls, discriminatory taxes, burden of government regulations, ease of starting a business,
effectiveness of anti-trust policy, government subsidiaries of commodity prices, entry barriers
related to administration (e.g. red tape), entry barriers related to already established
competitors, etc. (ibid). Thus, the regulatory quality indicator does not only represent
burdensome regulations and bureaucracy but also describes if the government has an invisible
hand, a helping hand or a grabbing hand. In addition, it indicates if the presence of large
business groups hinders firms from entering and operating in the market. A drawback of using
62
this indicator in the system dynamics model is the impossibility to distinguish between the
effects of the above mentioned factors. For example, government subsidies of commodity
prices might have a minor impact on the success of a technology based start-up while red tape
might affect the start-up’s performance significantly. The regulatory quality variable does not
take into account such differences. Further research and modelling could reduce this
drawback by including separate variables for regulatory quality related factors.
In the system dynamics model, regulatory quality is represented by a constant variable
which affects the start-up and its competition. If regulatory quality is high, the power of
competition is reduced. There will not be one single powerful competitor or an oligopoly of
companies that claim the market for themselves and/or are favoured by or affiliated with the
government. The start-up will face equal market conditions and regulations as its competitors.
If regulatory quality is low, the market is not free and assumed to be controlled by the
government and/or powerful business groups. This limits the start-up’s chances of success. A
country has perfect regulatory quality if the indicator is at 100 percent. In the case of China,
the value of regulatory quality is at 42.6 percent in the year 2013 (latest available data)
(Kaufman et al. 2014b). For Indonesia, it is at 46.4 percent in 2013 (ibid). These values are
slightly below the average (47 percent in 2013) in East Asia and Pacific and about forty points
below the average of OECD countries (88 percent in 2013) (ibid).
Legal Rights
In high technology industries such as the information technology industry, the existence and
protection of legal rights are considered an important factor that provides stability in a highly
dynamic and rapidly changing environment (Clarysse et al. 2011, p. 140). Besides property
rights which are included in the Regulatory Quality variable, investor and creditor rights are
of great importance for a technology based start-up, too. They are crucial for a proper
functioning of financial markets from which the start-up can obtain external funds to grow its
business.
In the system dynamics model, the legal rights variable is based on the strength of legal
rights index by the World Bank Group (World Bank Group 2015a). The strength of legal
rights index “measures the degree to which collateral and bankruptcy laws protect the rights
of borrowers and lenders and thus facilitate lending” (ibid). It combines the degree of efficacy
of a country’s legal system with information on the country’s financial markets. As a result, it
describes not only the country’s legal but also financial institutions. It is measured on a scale
from zero (lowest possible rank) to twelve (highest possible rank) (ibid). Both China and
63
Indonesia achieved a value of 4 in the year 2014 (World Bank Group 2015b; World Bank
Group 2015c). The average value in East Asia and Pacific as well as of OECD countries was
6 in the same year (World Bank Group 2015d). The values of the year 2014 have been chosen
over those of 2013 because the strength of legal rights index has been redefined to include
more data and information from 2014 (World Bank Group 2015a). Furthermore, for the years
prior to 2014 data is only available for the cities of Shanghai and Jakarta but not on national
level (World Bank Group 2015b; World Bank Group 2015c). In the system dynamics model,
the values of the strength of legal rights index for China and Indonesia are rescaled and
expressed in percentage points. They are represented in the legal rights variable which affects
the rate of External Funding together with Average Investment, Macroeconomic Environment,
Informal Investor Rate, Social Capital and Media Attention. If the number of the legal rights
variable is high, ceteris paribus, external funding will increase as lending is facilitated and the
start-up is more likely to obtain external funds from investors (e.g. banks, venture capitalists,
etc.).
Macroeconomic Growth
Start-ups are part of an economic system and therefore exposed to economic cycles and
changes in the market. For example, the survival ability of firms, in particular of small firms
such as start-ups decreases during recessions. It even decreases during times of positive but
low macroeconomic growth (Box 2008, p. 390). In the system dynamics model, the variable
representing the start-up’s macroeconomic environment (Saad 2013, p. 40) is annual GDP
growth. Annual GDP growth is a general economic indicator that captures the overall
economic atmosphere in the country. A limitation of using annual GDP growth to describe the
macroeconomic environment is the fact that not all economic sectors and industries grow
equally. The information technology industry might grow faster (or slower) than other
industries and its annual growth rate might be higher (or lower) than the country’s average
annual GDP growth rate. However, some characteristics of the information technology
industry are included in variables of the basic model (e.g. Customer Acquisition Cycle,
Competition, etc.) which can capture industry specific scenarios. Macroeconomic growth as
represented by annual GDP growth rate affects the rate of External Funding in the model.
High GDP growth indicates a growing economic environment in which investors are
optimistic and looking for riskier investment options and are therefore more likely to invest in
technology based start-ups.
64
The data used in the system dynamics model for the macroeconomic growth variables of
China and Indonesia is GDP growth (in percent) as calculated by the World Bank. The World
Bank defines GDP as “the sum of gross value added by all resident producers in the economy
plus any product taxes and minus any subsidies not included in the value of the products”
(The World Bank 2015c). The annual percentage growth rate of GDP indicates the change of
GDP compared to the previous year and is based on constant local currency (ibid). In 2013,
China had a GDP growth rate of 7.7 percent while Indonesia’s economy grew by 5.8 percent
(The World Bank 2015c). It is unlikely that China and Indonesia will sustain the same growth
rates over the next five years (simulation period of the model). For example, China’s annual
GDP growth rate slowed down to 7.4 percent in 2014 and is expected to decrease even more
in 2015 (Yao & Sweeney 2015). Macroeconomic growth as represented by GDP growth is
rescaled and weighted in the system dynamics model in order to account for a potential
decrease in growth rates and reduce the impact of minor changes (less than 1 percent).
Informal Investor Rate
The Legal Rights variable primarily refers to obtaining external funds through official
financial institutions like banks and stock markets. In contrast, the informal investor rate
variable describes financing through private investors and less institutionalised organisations
such as “business angel investors” and family members and friends of the start-up founders.
They are named informal investors as they do not necessarily operate on a professional basis
and are oftentimes not officially registered. They are listed under formal institutions as part of
the financial market since they do not completely fit the definition of informal institutions by
North (1990). In the system dynamics model, the informal investor rate variable is based on
data by the Global Entrepreneurship Monitor (2015). It is defined as the percentage of the
population aged between 18 and 64 years who have personally provided funds for a new
business, started by somebody else, in the past three years (ibid). China had an informal
investor rate of 4.5 percent in 2014, while Indonesia’s informal investor rate was slightly
higher at 5.4 percent in the same year (ibid). The informal investor rate variable is a constant
and affects the rate of external funding in the start-up model. If it is high, external funding is
increased and as a consequence, the start-up’s cash stock rises. If the informal investor rate is
zero, there will be no effect on the rate of external funding.
65
Unemployment Rate
As discussed in the chapter on institutional theory, the effect of unemployment on the
performance of small firms is ambiguous (Fritsch et al. 2004, p. 8). A high unemployment
rate can result in a larger pool of available labour and lower labour costs. However, it can also
lead to necessity entrepreneurship and increase competition in the market (ibid).
Consequently, in the system dynamics model, unemployment does not have a direct effect on
firm performance. It affects the Time to Hire, i.e. the time it takes to find and employ new
staff. If the country’s unemployment rate is high, the start-up can find new employees more
easily and quickly because labour supply is large. The values of the unemployment rate
variable in the system dynamics model are based on data from the World Bank. It is total
unemployment in percent of total labour force and refers to the proportion of the labour force
that is without employment but available and looking for work (The World Bank 2015d).
According to this definition, China’s unemployment rate was 4.6 percent in 2013 while it was
6.3 percent in Indonesia (ibid). In the system dynamics model, an unemployment rate of five
percent will reduce the time to hire new employees by two weeks. If unemployment is at 10
percent, time to hire is reduced by four weeks and so on.
Labour Market Regulations
When labour laws permit firms to reduce their workforce quickly (e.g. during times of
economic recession), firms are more likely to remain profitable and grow (Chacar 2010, pp.
1126, 1135). In addition, highly volatile industries such as the information technology
industry are more developed in countries with less strict labour laws (Aterido et al. 2009, p. 6).
As a result, not only single technology based start-ups but the information technology
industry as a whole profit from less strict labour laws. In the system dynamics model, labour
laws are represented by the labour market regulations variable (Saad 2013, p. 40). The labour
market regulations variable affects the labour turnover rate of the start-up. Tight labour
market regulations slow down the turnover rate and make it difficult for the start-up to dismiss
employees. In the start-up model, the indicator measuring the difficulty to dismiss employees
is severance pay for redundancy dismissal for an employee with one year of tenure (World
Bank Group 2015e). It is expressed in weeks of salary and includes severance payments and
penalties that the start-ups incurs when dismissing a redundant employee (ibid). In China,
severance pay for redundancy dismissal for an employee of with one year of tenure was 4.3
weeks in 2013 (ibid). In Indonesia, it was with 17.3 weeks in 2013 significantly more than in
China (ibid). The labour market regulations variable is like the unemployment rate variable a
66
look-up function. For example, if labour market regulations are less strict and severance pay
for redundancy dismissal amounts to only four weeks, the average turnover rate of 5 percent
will only be reduced by 0.5 percent which results in a new turnover rate of 4.5 percent.
However, if labour market regulations are tight and severance pay equals sixteen weeks,
turnover rate will be reduced by 2 percent. The new turnover rate would then be 3 percent.
Severance pay for redundancy dismissal only covers one kind of labour market regulation
which is a limitation to this variable. Other labour market regulations which could affect
technology based start-ups are for instance restrictions of working hours and excessive
ancillary labour costs. They are only indirectly included in the model as part of the Team
Productivity variable and the Average Salary variable.
Higher Education
The start-up’s founders’ and employees’ human capital in form of education has significant
impact on start-up performance (Millán et al. 2014, p. 627). Employees with a high level of
education tend to be more productive (ibid) and contribute valuable knowledge to the
development of the start-up’s competitive advantage (Smith et al. 2005, p. 355). The country-
specific threshold effect of education determines what level of education has to be attained in
order to leverage these benefits (Quatraro & Vivarelli 2014, p. 12). Since China and Indonesia
are middle-income emerging economies, the threshold effect of education in regard to
technology based businesses is assumed to be at university level. Consequently, the variable
representing education in the system dynamics model is based on data about tertiary education.
It indicates the cumulative educational attainment of the population aged 25 years and older in
relation to the total population (UNESCO & UIS 2015a). In China, 8.8 percent of the total
population aged 25 years and older completed at least short-cycle tertiary education (ISCED 5
to 8; minimum two years of tertiary education) (ibid). In Indonesia the percentage of the
population above 25 years who attained at least short-cycle tertiary education amounted to 7.9
percent of the total population (ibid). Although dating back to 2010 (China) and 2011
(Indonesia), these numbers are the latest available. The higher education variable directly
affects Team Productivity in the system dynamics model (Saad 2013, p. 42). The greater the
number of tertiary education graduates in the country, the higher the start-up’s productivity
level. A higher productivity level then results in a higher rate of product development. It
should be noted that the higher education variable can only have a positive (or zero) but no
negative effect on productivity. It can only increase but not actively decrease productivity.
67
R&D Innovation
Innovation is a growth driver for firms and a positive predictor of survival, especially for
technology based firms (Quatraro & Vivarelli 2014, p. 13). Investments in R&D can increase
their growth rates significantly (Stam & Wennberg 2009, p. 86). However, the positive effect
of R&D on firm performance is generally smaller in emerging economies than in developed
economies. This is due to the fact that emerging economy businesses are not specialised in
innovation-driven industries and are therefore not at the ‘technological frontier’ (Quatraro &
Vivarelli 2014, p. 13). Since R&D and innovation are of great importance in the information
technology industry, this thesis assumes a positive effect of investments in R&D and
innovation on the performance of technology based start-ups in China and Indonesia. In the
start-up model, these investments are represented by the R&D innovation variable (Saad 2013,
pp. 41-42). The underlying indicator is the gross domestic expenditure on R&D (GERD) in
percentage of GDP. It includes private and public expenditure on basic research, applied
research and experimental development (UNESCO & UIS 2015b). China’s gross domestic
expenditure on R&D was 1.98 percent of GDP in 2012 (ibid). In Indonesia, it was 0.08
percent of GDP in 2009 (ibid). These are the latest statistics from international organisations’
databases. There is no data available for the years 2013-2014 (and later than 2009 in the case
of Indonesia). This is a limitation that has to be taken into account when analysing the impact
of R&D innovation on other variables and final start-up performance in the system dynamics
model. The R&D innovation variable directly affects the product development rate (Saad
2013, pp. 41-42). The more the country spends on R&D, the more and better product features
the start-up is able to develop. A R&D innovation variable of zero will have no impact on
product development.
Technology Adoption
The availability of technological infrastructure is essential for technology based start-ups.
Their products are based on the use of computers, mobile phones and/or other technological
devices and distributed mainly on the internet. Thus, the greater information technology
diffusion in the country, the more customers the start-up is able to reach. In the system
dynamics model, the availability of technological infrastructure is represented by the
technology adoption variable (Saad 2013, pp. 41-42). It is a constant and indicates the number
of internet users per 100 people. Internet users are defined as individuals who have used the
internet, from any location, in the past twelve months via a computer, mobile phone or other
digital device (The World Bank 2015e). In China, 45.8 out of 100 people had access to the
68
internet in 2013 (ibid). In Indonesia, this number is significantly lower. Only 15.8 out of 100
people used the internet in 2013 (ibid). These numbers directly impact the Sales rate in the
start-up model (Saad 2013, pp. 41-42). If the technology adoption variable is low, fewer
potential customers can be reached as they do not have access to the internet. If it is zero, the
sales rate will be zero as well. Besides internet access, the technology adoption rate also
implies the availability of basic infrastructure such as electricity. Thus, infrastructure is not
included as a separate variable in the model. Technology adoption does not measure how
technology and computer savvy internet users are. However, it is assumed that the start-up’s
product is easy to use by people who are able to navigate the internet.
3.2.2. Informal Institutions
Informal institutions describe the cognitive and normative dimension of a country and include
culture, values, norms, customs, etc. (North 1990; Scott 1995). In regard to entrepreneurship
and the post-entry performance of start-ups, the most important informal institutions are
culture-related factors (Salimath & Cullen 2010, p. 365). The theoretical part highlighted
especially the following cultural institutions: fear of failure and uncertainty avoidance,
performance orientation, individualism and collectivism. Another informal institution
discussed in the theoretical part is media attention. Media attention is not so much of a
cultural factor itself but a channel that conveys values, views and attitudes on certain topics.
The three cultural factors and media attention are all included in the system dynamics model
as informal institutional factors that affect the start-up in different ways.
Uncertainty Avoidance
Uncertainty avoidance can prevent entrepreneurs from trying out new and untested business
approaches. New and untested business approaches may turn out to be failures but at the same
time, they can bear high growth opportunities. Fast and high growth is important for
technology based start-ups as they face high levels of competition and resource constraints
which threaten their survival. As a result, technology based start-ups of risk-adverse
entrepreneurs who avoid uncertainties and are afraid to fail are likely to experience less
growth than those of risk tolerant entrepreneurs. Uncertainty avoidance tends to inhibit new
product development (Sully de Luque & Javidan 2004, p. 618). Consequently, high values of
uncertainty avoidance have a negative effect on the rate of Product Development in the start-
up model. Start-up founders and employees are afraid to pursue new and unusual product
development opportunities which results in a lower product development rate.
69
In the start-up model, uncertainty avoidance is represented by a constant variable that is based
on data from the GLOBE study (Sully de Luque & Javidan 2004). GLOBE is an abbreviation
for “Global Leadership and Organizational Behavior Effectiveness” and refers to a study
about cultural values and practices in business which was conducted in 62 nations over a
period of eleven years. It is based on surveys from about 17,300 managers and measures nine
cultural dimensions (e.g. uncertainty avoidance) in different segments (country, industry,
organization). In order to simulate a general institutional environment, only country-level data
is chosen for the start-up model. On a scale from 1 to 7 (higher scores indicating greater
uncertainty avoidance), the values for China and Indonesia are 4.94 and 4.17, respectively
(ibid, p. 622). Thus, China practices a significantly higher degree of uncertainty avoidance
than Indonesia. The final effect of this difference will depend on the other variables in the
model and is analysed in chapter 4. A drawback of using the GLOBE study as informal
institutional factors in the start-up model is the fact that its study results date back to the early
2000s and are therefore comparatively old. However, informal institutions such as cultural
dimensions do not experience very rapid changes over short periods of time (Scott 1995) so
that the GLOBE data on cultural values and practices can still be used.
Performance Orientation
Performance orientation reflects the extent to which a society values ambition, hard work and
competition (Javidan 2004, p. 239). In performance oriented societies, firms tend to face high
levels of competitiveness and performance standards and are rewarded for performance
improvements (Autio et al. 2013, pp. 341-342; Roxas & Chadee 2012, pp. 326-327). In those
societies, technology based start-ups are encouraged to have ambitious goals and work hard to
achieve them. In the system dynamics model, performance orientation is indicated by a
variable based on data from the GLOBE study (Javidan 2004). It measures performance
orientation practice in different societies including China and Indonesia (ibid). On a scale
from 1 to 7 (7 indicating the strongest performance orientation practice), China scores a value
of 4.45 while Indonesia is slightly below at 4.41 (ibid, p. 250). The performance orientation
variable in the start-up model is a constant and directly affects Team Productivity. The more
performance oriented the society is, the harder start-up employees will work and the more
productive they will be. Subsequently, the rate of Product Development will be higher too as
increased productivity results in more efficient development of new product features. Low
performance orientation (i.e. a score of less than 4) has a negative effect and limits
productivity.
70
Collectivism
Collectivism refers to the subordination of individual interests to the good of society and
promotes values such as cooperation, solidarity and harmony within the society. Even though
entrepreneurship has long been believed to thrive better in individualist than in collectivist
societies, recent studies indicate that this is not necessarily the case: In countries at medium to
low levels of economic development (e.g. emerging economies), entrepreneurship is
negatively related to individualism (Pinillos & Reyes 2011, p. 23). In addition, some studies
found that collectivism is positively related to firm performance (Autio et al. 2013, p. 357).
Consequently, a positive relationship between collectivism and Team Productivity is assumed
in the system dynamics model. Seeing that their start-up’s success and the benefit of the
broader society are aligned are assumed to motivate start-up founders and employees to work
even harder to grow their business. The collectivism variable in the start-up model is a
constant and draws on data from the GLOBE study (Gelfand et al. 2004). The GLOBE study
measures the level of societal institutional collectivism practices in different societies
(including China and Indonesia) on a scale from 1 to 7, with 7 being the highest value of
collectivism (ibid, p. 463). China’s score of societal institutional collectivism ranks among
the highest of all societies under study with 4.77 points (ibid, p. 468). It is statistically
different from Indonesia’s score of 4.54 points (ibid). Since the relationship between
collectivism, individualism and post-entry firm performance is controversial, the collectivism
variable in the system dynamics model can only have a positive or zero effect on productivity.
In other words, it can only increase but never decrease productivity even if the society tends
to be more individualist than collectivist (i.e. values significantly lower than 4).
Media Attention
The media are information intermediaries and play a significant role in affecting what
information becomes available in a country and to what extent (Petkova et al. 2013, p. 866).
In regard to technology based start-ups, the media represents a form of external relationship
and has significant legitimating power (Tolbert et al. 2011, p. 1336). They can help start-ups
get noticed by customers and investors and generally affect the society’s attitude towards
entrepreneurship. In the system dynamics model, the media and their influence is represented
by the media attention variable (Saad 2013, p. 42). It is based on data from the Global
Entrepreneurship Monitor (GEM) and defined as the percentage of the population aged
between 18-64 years who agree with the statement that in their country, the public media
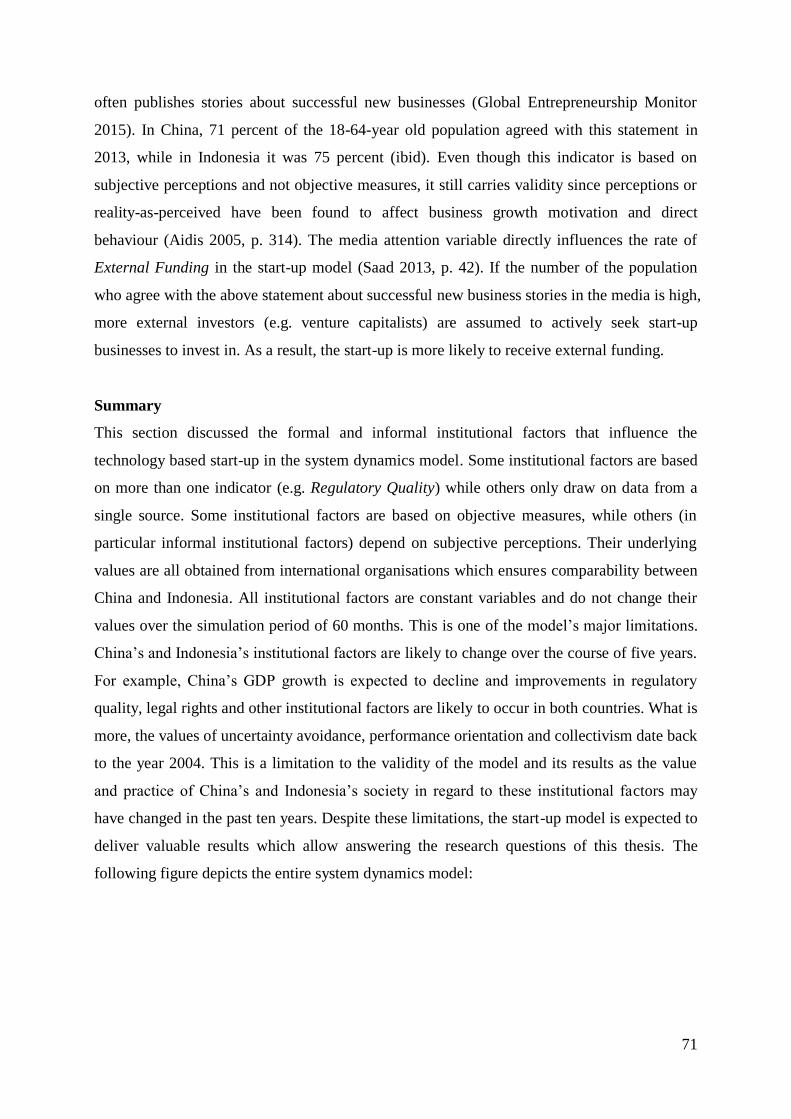
71
often publishes stories about successful new businesses (Global Entrepreneurship Monitor
2015). In China, 71 percent of the 18-64-year old population agreed with this statement in
2013, while in Indonesia it was 75 percent (ibid). Even though this indicator is based on
subjective perceptions and not objective measures, it still carries validity since perceptions or
reality-as-perceived have been found to affect business growth motivation and direct
behaviour (Aidis 2005, p. 314). The media attention variable directly influences the rate of
External Funding in the start-up model (Saad 2013, p. 42). If the number of the population
who agree with the above statement about successful new business stories in the media is high,
more external investors (e.g. venture capitalists) are assumed to actively seek start-up
businesses to invest in. As a result, the start-up is more likely to receive external funding.
Summary
This section discussed the formal and informal institutional factors that influence the
technology based start-up in the system dynamics model. Some institutional factors are based
on more than one indicator (e.g. Regulatory Quality) while others only draw on data from a
single source. Some institutional factors are based on objective measures, while others (in
particular informal institutional factors) depend on subjective perceptions. Their underlying
values are all obtained from international organisations which ensures comparability between
China and Indonesia. All institutional factors are constant variables and do not change their
values over the simulation period of 60 months. This is one of the model’s major limitations.
China’s and Indonesia’s institutional factors are likely to change over the course of five years.
For example, China’s GDP growth is expected to decline and improvements in regulatory
quality, legal rights and other institutional factors are likely to occur in both countries. What is
more, the values of uncertainty avoidance, performance orientation and collectivism date back
to the year 2004. This is a limitation to the validity of the model and its results as the value
and practice of China’s and Indonesia’s society in regard to these institutional factors may
have changed in the past ten years. Despite these limitations, the start-up model is expected to
deliver valuable results which allow answering the research questions of this thesis. The
following figure depicts the entire system dynamics model:
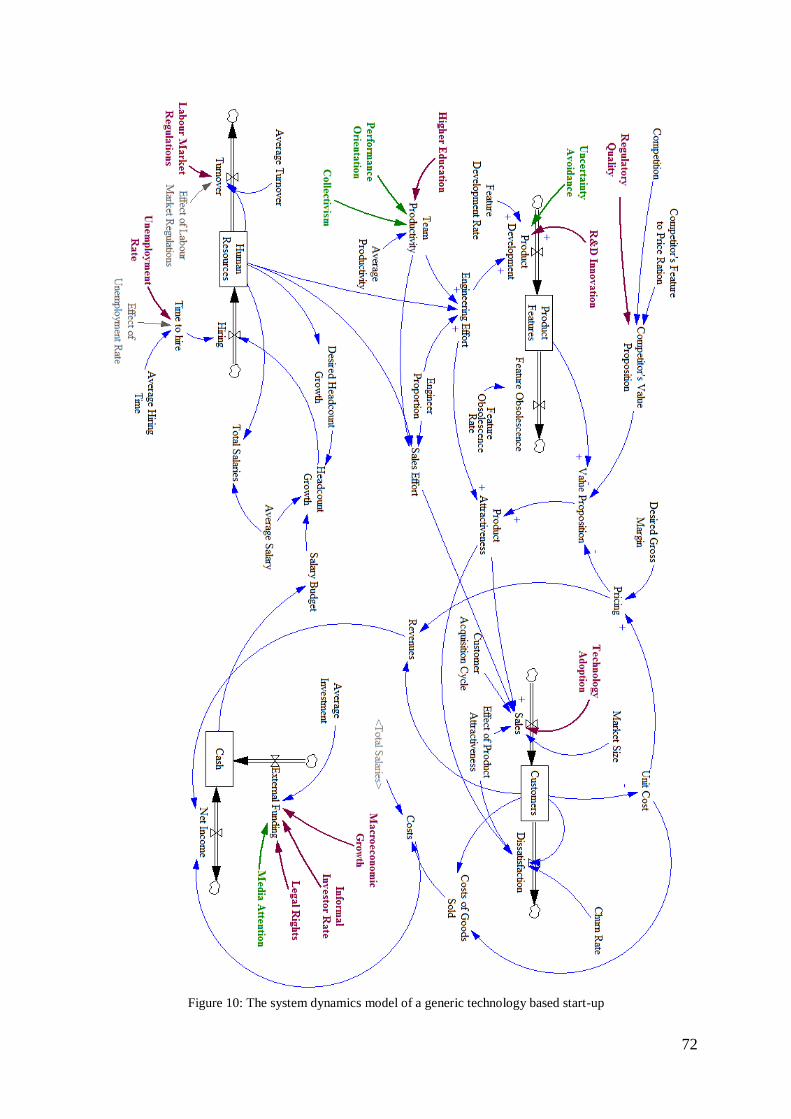
72
Figure 10: The system dynamics model of a generic technology based start-up
73
4. Model Results and Analysis This chapter discusses the results of the system dynamics simulation of a start-up for the
countries under study, China and Indonesia. The initial firm-specific conditions of the start-up
are the same for both country simulations but the institutional factors are different. This
allows monitoring and comparing the effect of the institutional environment. The country-
specific results of the simulation are discussed separately for China and Indonesia after an
introduction to the technology based start-up landscape in both countries. They are grouped
according to the four blocks of the start-up model with particular emphasis on the firm
performance indicators. In the later sections of this chapter, China’s and Indonesia’s results
are compared and the most significant institutional factors are identified through sensitivity
analysis.
4.1. Country-specific Results
4.1.1. China
This section first gives an overview of the general technology based start-up landscape in
China before discussing the results of the start-up model for China. Understanding the general
situation of technology based start-ups in China allows seeing the model results in a broader
context and drawing more profound conclusions about the effect of institutional factors on
start-up performance in China.
General Start-Up Landscape
The start-up landscape in China is relatively young compared to the ones in the United States
of America, Western Europe and Japan as the distribution of the internet and related
innovative technologies in China happened later and, at least in the beginning, more slowly.
However, China is catching up at a very fast rate. Today, the Chinese information technology
industry and start-up ecosystem are characterised by very intense competition and rapid
changes which makes it difficult for local technology based start-ups and established foreign
companies to succeed (Yuan 2015). A great number of large foreign technology companies
failed in China, among them are Google, Facebook, Amazon, Ebay. While some of these
failures can be attributed to tight government regulations and censorship (e.g. Google,
Facebook), many foreign tech companies failed at understanding the Chinese information
technology industry and adapt their products, services and business models to the Chinese
market. Instead of large foreign companies, the Chinese market is dominated by local tech
giants known as “BATS”. BATS is an acronym for the companies Baidu (search engine),
74
Alibaba (e-commerce), Tencent (games, social media) and Sina (social media). Founded in
the late 1990s or early 2000s, they rapidly grew into large corporations that are today listed on
the stock exchange. Among other successful Chinese tech companies are Youku (video
streaming), 360buy (e-commerce) and Xiaomi (mobile phones). With the exception of
Alibaba and Xiaomi, these Chinese tech companies are almost exclusively operating in China.
The major technology hubs in China where the above mentioned established tech
companies and many small start-ups are located are Beijing (especially中关村 Zhōngguāncūn
which is also referred to as the Silicon Valley of China), Shanghai and Shenzhen. In addition,
technology communities in other regions such as Sichuan, Zhejiang and Jiangsu and in second
tier cities (e.g. Chengdu) are becoming more popular since these regions are expected to
experience a significant growth in internet usage, mobile penetration and income levels (Chen
2013; ZhenFund 2013, p. 10). They also set the trend in mobile application development. For
example, Android has a market share of about 90 percent in tier 2-5 cities and rural China. In
order to serve the population living in these regions, technology based start-ups developing
mobile applications will have to focus on Android. Apple’s iOS is more common in the top
tier 1 cities Beijing, Shanghai, Guangzhou and Shenzhen where competition is higher than in
smaller cities (Zhenfund 2013, p. 10). An ongoing trend in regard to start-up business models
is freemium. Freemium has been common in China since many years and continues to be an
important business model for technology based start-ups in China (Evdemon 2013).
China’s start-up ecosystem also faces a number of challenges. Start-ups have difficulties in
assembling a complete and complementary team and hiring top talent because many skilled
university graduates prefer working for established technology companies (ibid). In addition,
the Chinese education system tends to promote discipline and obedience over leadership and
risk-taking which might inhibit entrepreneurship (Chen 2013). Consequently, a career as
entrepreneur or working for a newly founded business is less attractive to young Chinese
graduates. In regard to start-up funding, China is seeing constant growth in investments from
venture capital companies and angel investors. However, there is limited attention of venture
capitalists to start-ups in early stages as VCs often lack technical, product or market
understanding to evaluate early-stage opportunities (Evdemon 2013). Among other challenges
that Chinese start-ups are facing are weak property rights (Gai 2011, p. 9), slow internet speed
and a lack of start-up service companies (ZhenFund 2013, pp. 30-31).
The Chinese government has announced a number of policies to promote technology
entrepreneurship and innovation and ease some of the difficulties Chinese start-ups are facing.
In 2013, the Chinese Premier Li Keqiang introduced the “Internet plus” policy, an action plan
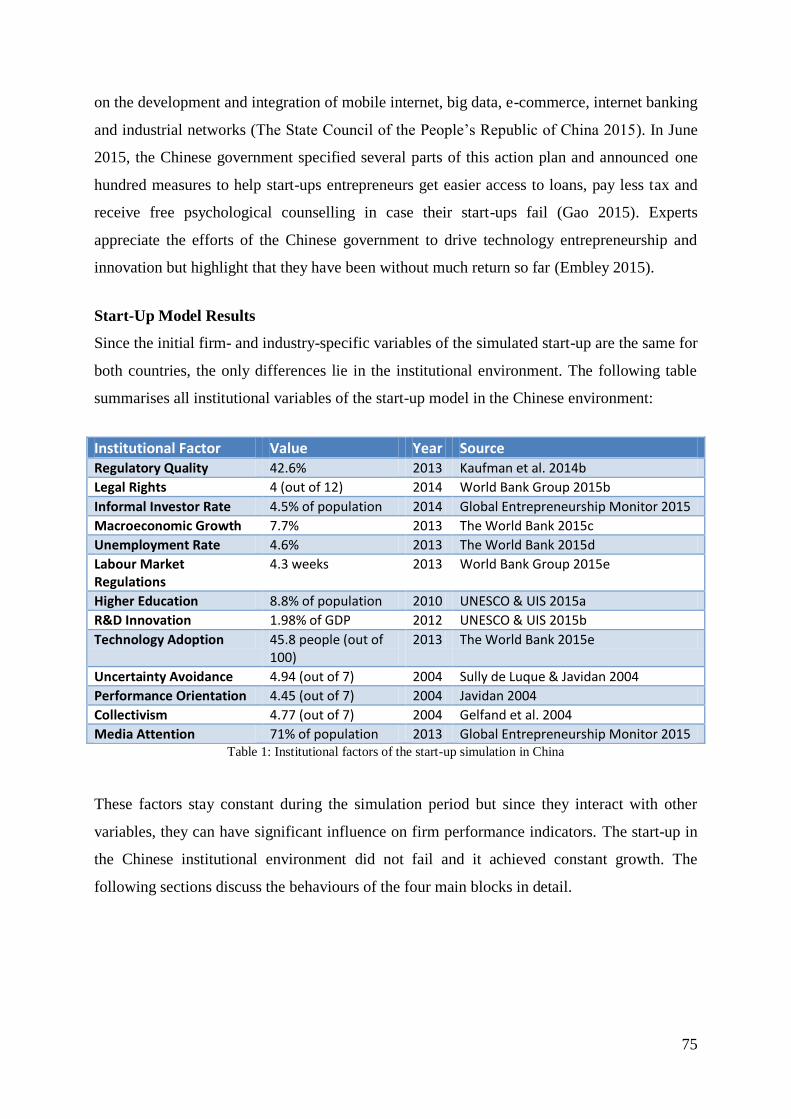
75
on the development and integration of mobile internet, big data, e-commerce, internet banking
and industrial networks (The State Council of the People’s Republic of China 2015). In June
2015, the Chinese government specified several parts of this action plan and announced one
hundred measures to help start-ups entrepreneurs get easier access to loans, pay less tax and
receive free psychological counselling in case their start-ups fail (Gao 2015). Experts
appreciate the efforts of the Chinese government to drive technology entrepreneurship and
innovation but highlight that they have been without much return so far (Embley 2015).
Start-Up Model Results
Since the initial firm- and industry-specific variables of the simulated start-up are the same for
both countries, the only differences lie in the institutional environment. The following table
summarises all institutional variables of the start-up model in the Chinese environment:
Institutional Factor Value Year Source Regulatory Quality 42.6% 2013 Kaufman et al. 2014b
Legal Rights 4 (out of 12) 2014 World Bank Group 2015b
Informal Investor Rate 4.5% of population 2014 Global Entrepreneurship Monitor 2015
Macroeconomic Growth 7.7% 2013 The World Bank 2015c
Unemployment Rate 4.6% 2013 The World Bank 2015d
Labour Market Regulations
4.3 weeks 2013 World Bank Group 2015e
Higher Education 8.8% of population 2010 UNESCO & UIS 2015a
R&D Innovation 1.98% of GDP 2012 UNESCO & UIS 2015b
Technology Adoption 45.8 people (out of 100)
2013 The World Bank 2015e
Uncertainty Avoidance 4.94 (out of 7) 2004 Sully de Luque & Javidan 2004
Performance Orientation 4.45 (out of 7) 2004 Javidan 2004
Collectivism 4.77 (out of 7) 2004 Gelfand et al. 2004
Media Attention 71% of population 2013 Global Entrepreneurship Monitor 2015 Table 1: Institutional factors of the start-up simulation in China
These factors stay constant during the simulation period but since they interact with other
variables, they can have significant influence on firm performance indicators. The start-up in
the Chinese institutional environment did not fail and it achieved constant growth. The
following sections discuss the behaviours of the four main blocks in detail.
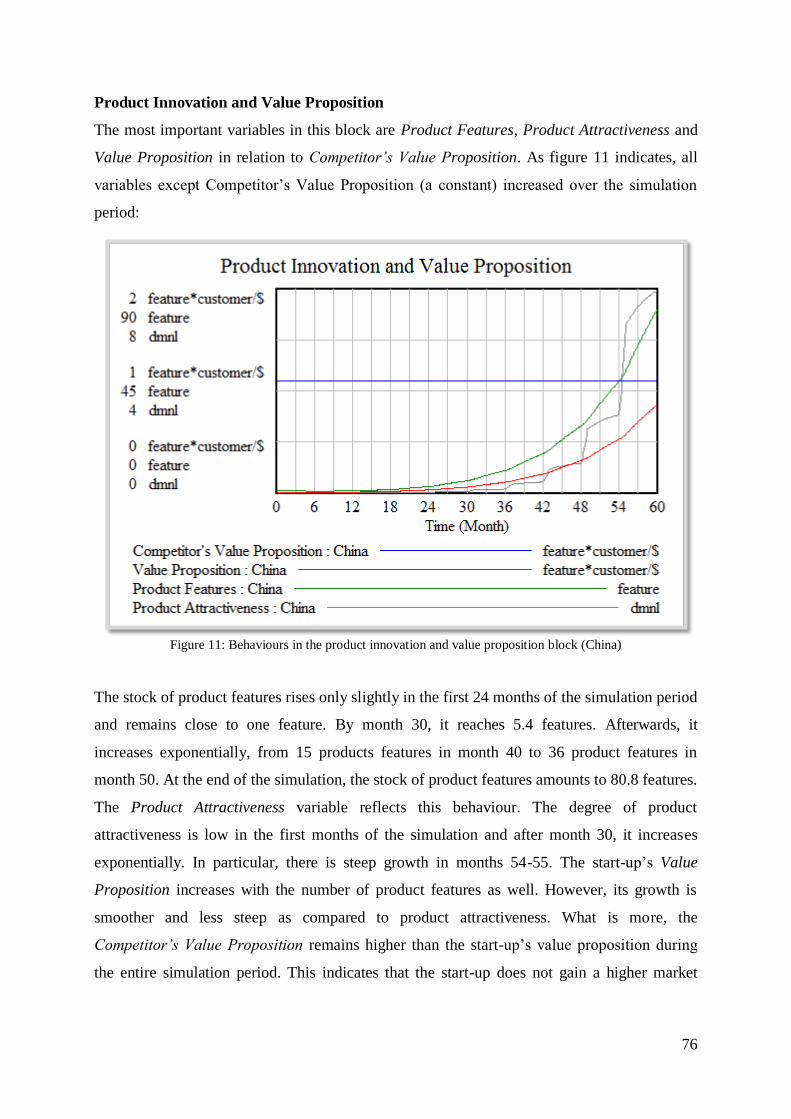
76
Product Innovation and Value Proposition
The most important variables in this block are Product Features, Product Attractiveness and
Value Proposition in relation to Competitor’s Value Proposition. As figure 11 indicates, all
variables except Competitor’s Value Proposition (a constant) increased over the simulation
period:
Figure 11: Behaviours in the product innovation and value proposition block (China)
The stock of product features rises only slightly in the first 24 months of the simulation period
and remains close to one feature. By month 30, it reaches 5.4 features. Afterwards, it
increases exponentially, from 15 products features in month 40 to 36 product features in
month 50. At the end of the simulation, the stock of product features amounts to 80.8 features.
The Product Attractiveness variable reflects this behaviour. The degree of product
attractiveness is low in the first months of the simulation and after month 30, it increases
exponentially. In particular, there is steep growth in months 54-55. The start-up’s Value
Proposition increases with the number of product features as well. However, its growth is
smoother and less steep as compared to product attractiveness. What is more, the
Competitor’s Value Proposition remains higher than the start-up’s value proposition during
the entire simulation period. This indicates that the start-up does not gain a higher market
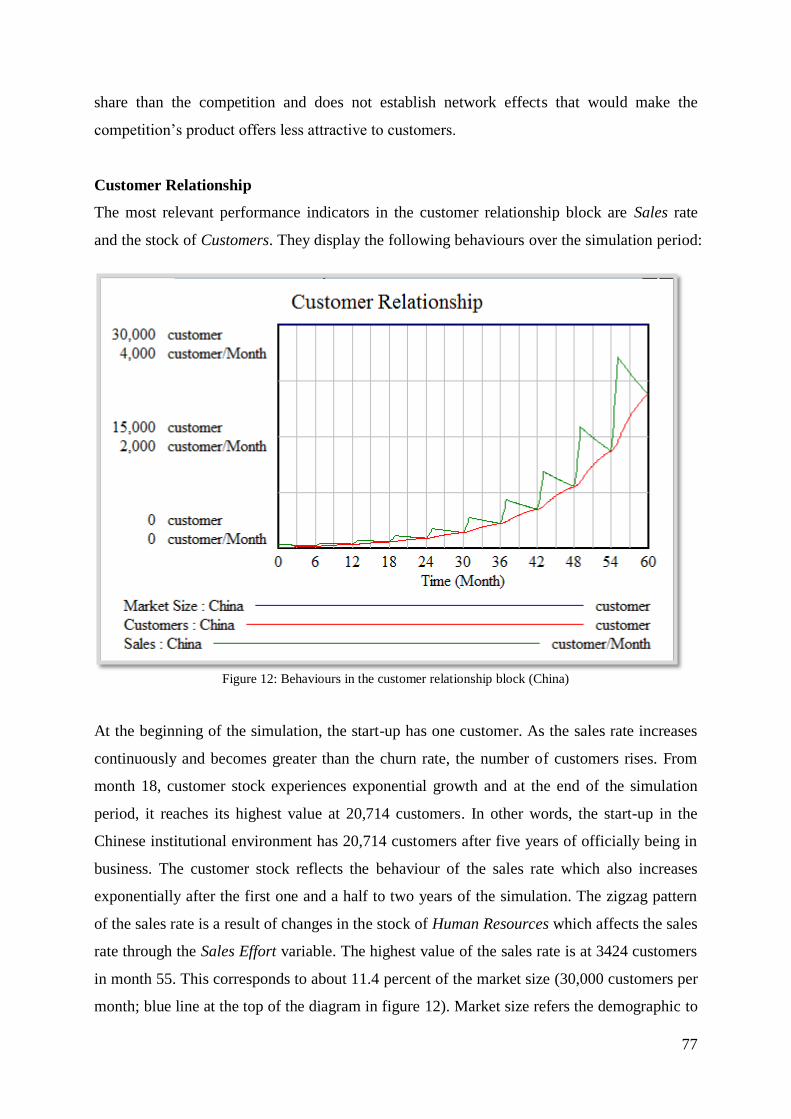
77
share than the competition and does not establish network effects that would make the
competition’s product offers less attractive to customers.
Customer Relationship
The most relevant performance indicators in the customer relationship block are Sales rate
and the stock of Customers. They display the following behaviours over the simulation period:
Figure 12: Behaviours in the customer relationship block (China)
At the beginning of the simulation, the start-up has one customer. As the sales rate increases
continuously and becomes greater than the churn rate, the number of customers rises. From
month 18, customer stock experiences exponential growth and at the end of the simulation
period, it reaches its highest value at 20,714 customers. In other words, the start-up in the
Chinese institutional environment has 20,714 customers after five years of officially being in
business. The customer stock reflects the behaviour of the sales rate which also increases
exponentially after the first one and a half to two years of the simulation. The zigzag pattern
of the sales rate is a result of changes in the stock of Human Resources which affects the sales
rate through the Sales Effort variable. The highest value of the sales rate is at 3424 customers
in month 55. This corresponds to about 11.4 percent of the market size (30,000 customers per
month; blue line at the top of the diagram in figure 12). Market size refers the demographic to
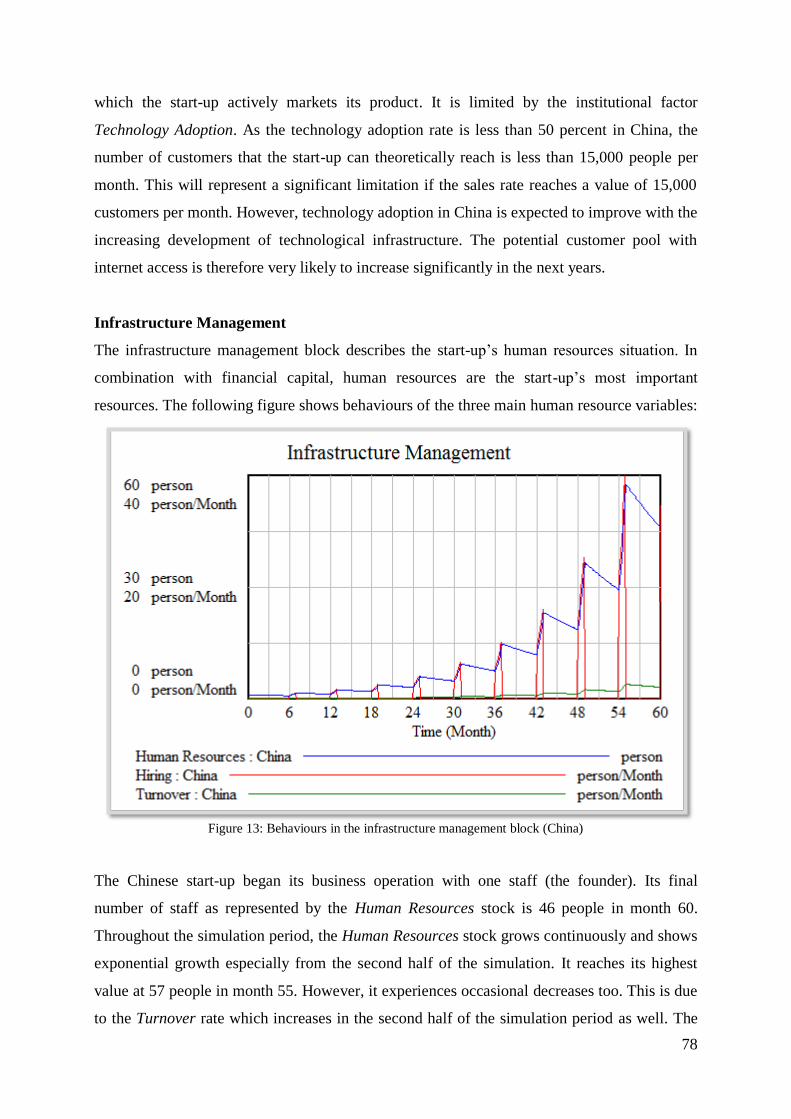
78
which the start-up actively markets its product. It is limited by the institutional factor
Technology Adoption. As the technology adoption rate is less than 50 percent in China, the
number of customers that the start-up can theoretically reach is less than 15,000 people per
month. This will represent a significant limitation if the sales rate reaches a value of 15,000
customers per month. However, technology adoption in China is expected to improve with the
increasing development of technological infrastructure. The potential customer pool with
internet access is therefore very likely to increase significantly in the next years.
Infrastructure Management
The infrastructure management block describes the start-up’s human resources situation. In
combination with financial capital, human resources are the start-up’s most important
resources. The following figure shows behaviours of the three main human resource variables:
Figure 13: Behaviours in the infrastructure management block (China)
The Chinese start-up began its business operation with one staff (the founder). Its final
number of staff as represented by the Human Resources stock is 46 people in month 60.
Throughout the simulation period, the Human Resources stock grows continuously and shows
exponential growth especially from the second half of the simulation. It reaches its highest
value at 57 people in month 55. However, it experiences occasional decreases too. This is due
to the Turnover rate which increases in the second half of the simulation period as well. The
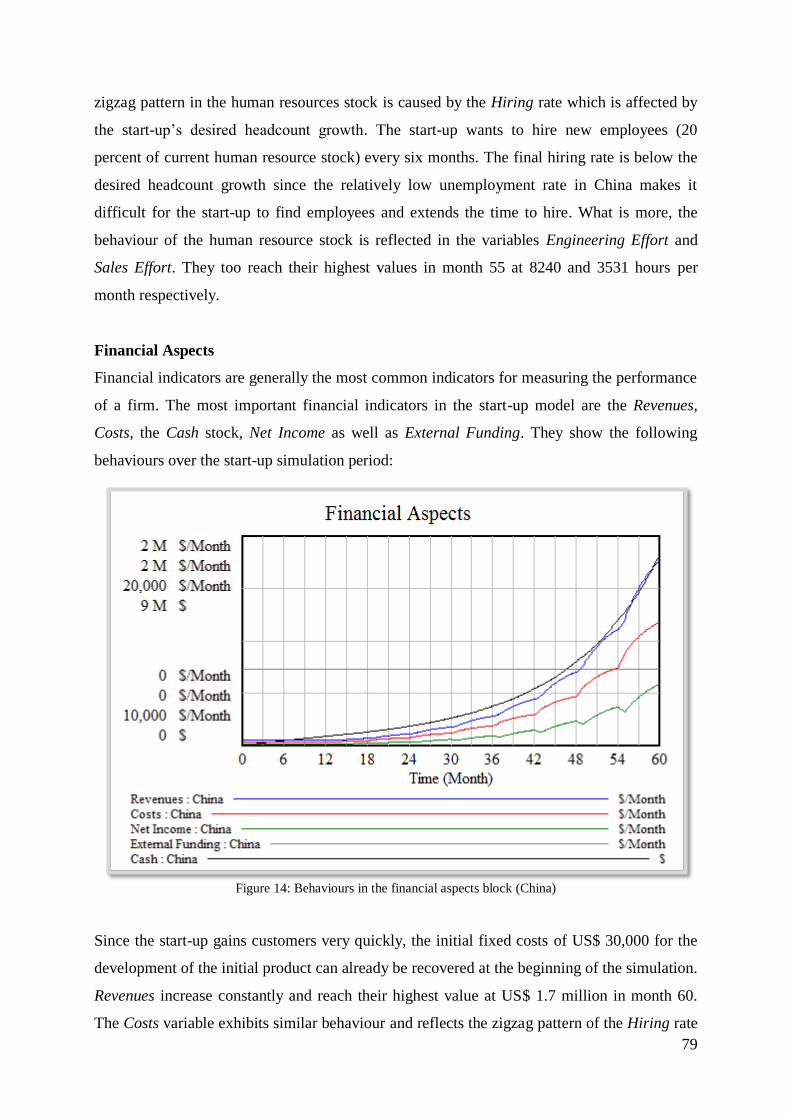
79
zigzag pattern in the human resources stock is caused by the Hiring rate which is affected by
the start-up’s desired headcount growth. The start-up wants to hire new employees (20
percent of current human resource stock) every six months. The final hiring rate is below the
desired headcount growth since the relatively low unemployment rate in China makes it
difficult for the start-up to find employees and extends the time to hire. What is more, the
behaviour of the human resource stock is reflected in the variables Engineering Effort and
Sales Effort. They too reach their highest values in month 55 at 8240 and 3531 hours per
month respectively.
Financial Aspects
Financial indicators are generally the most common indicators for measuring the performance
of a firm. The most important financial indicators in the start-up model are the Revenues,
Costs, the Cash stock, Net Income as well as External Funding. They show the following
behaviours over the start-up simulation period:
Figure 14: Behaviours in the financial aspects block (China)
Since the start-up gains customers very quickly, the initial fixed costs of US$ 30,000 for the
development of the initial product can already be recovered at the beginning of the simulation.
Revenues increase constantly and reach their highest value at US$ 1.7 million in month 60.
The Costs variable exhibits similar behaviour and reflects the zigzag pattern of the Hiring rate
80
through the influence of the Total Salaries variable. The salary expenses constitute between 9
and 17 percent of the total costs, with the Costs of Goods Sold making up the remaining part.
This is contrary to theoretical findings on the cost structure of start-ups in the information
technology industry (see chapter 2.1.2). Human resource expenses are generally higher than
product costs in information technology firms, in particular if the initial fixed costs of product
development have already been recovered. However, the situation is likely to be different in
emerging economies like China. In these economies, the wage level tends to be considerably
lower than in developed economies.
Revenues and costs constitute the start-up’s Net Income which is positive throughout the
simulation period. From month 30, it grows significantly and reaches its highest value at
US$ 586,951 at the end of the simulation period. Net income directly affects the start-up’s
Cash stock. Consequently, the cash stock displays a growth pattern which is very similar to
the net income rate. The initial value of the cash stock is US$ 5,000 which are savings
invested by the founder. In the first few months of the simulation, a significant part of the
cash stock is provided by External Funding. The rate of external funding has a value of
US$ 13,657.8 per month and stays constant during the entire simulation period. As soon as
the customer stock of the start-up increases, the profits it generates from product sales become
greater than the external funds. With the increase in sales and profits, the start-up’s cash stock
rises significantly and reaches its maximum in month 60 at a value of US$ 8,148,210.
4.1.2. Indonesia
This section gives a brief overview of the general tech start-up landscape in Indonesia before
discussing the results of the start-up model for Indonesia. As stated in the previous chapter on
China, understanding the general situation of technology based start-ups in Indonesia is
crucial for connecting the model results with reality and drawing more profound conclusions
about the effect of institutional factors on start-up performance in Indonesia.
General Start-Up Landscape
Like in China, the start-up landscape in Indonesia is relatively young compared to the ones in
the United States, Western Europe and other developed regions. Only a small percentage of
Indonesia’s population uses the internet regularly and less than 10 percent of Indonesians own
a PC or laptop (Zain 2013). Thus the technology based start-up landscape in Indonesia is still
immature but very diverse (Kusuma 2012). Even though technology adoption is relatively low
compared to other emerging economies, the products and services of foreign technology
81
based companies such Facebook, Twitter and Instagram are very popular in Indonesia. The
number of Indonesian Facebook users surpasses those of the UK and France (Zain 2013).
Another important foreign technology based company is Rocket Internet. Originally from
Germany, Rocket Internet implements technology based business models from the USA or
Europe in Southeast Asian countries and also operates as a venture capital firm. In Indonesia,
it operates several ecommerce websites such as Zalora (fashion), Lazada (consumer goods)
and FoodPanda (food delivery). Besides foreign tech companies, there are also several local
technology based firms which started out as small businesses and grew into popular tech
companies with a large customer/user base. Among them are Tokopedia, Berniaga, Bhinneka
(all ecommerce) and Traveloka (travel). Tokopedia, an online marketplace connecting buyers
and sellers, recently raised US$ 100 million financing from Japanese conglomerate SoftBank
and the American venture capital firm Sequoia Capital (Cosseboom 2014). Similarly, the
online wedding marketplace Bridestory and food delivery service Berry Kitchen received
mid-range funding in a US$ single-digit million amount from foreign investors (Freischlad
2015; Shu 2015). Indonesian business groups and conglomerates are investing in technology
based start-ups too. Some (e.g. Djarum, Kompas Gramedia, Sinar Mas, Salim) are doing so
through established venture capitalists or their own venture capital firms while others place
direct investments into local start-up businesses (e.g. Bakrie, Emtek) or offer support and
mentoring programs to entrepreneurs (e.g. Ciputra Group) (Boediman 2015). Boediman (2015)
concludes that “there’s enough funding for the tech industry and the trend is growing at a
rapid pace even without government support”.
The major start-up hubs in Indonesia are Jakarta, Bandung, Yogyakarta and Bali. Jakarta is
the political and economic capital of Indonesia and with a population of more than 10 million
a large market by itself (The World Bank 2015f). Bandung is well-known for its engineering
institutes and, together with Yogyakarta, has become home to various developer communities
and attracted production teams of international companies (Boediman 2015). Bali has a
rapidly growing start-up scene, too, and is especially popular with foreign entrepreneurs (ibid).
The businesses that entrepreneurs are working on in those cities are for instance localised
clones of successful start-ups in other countries (mainly USA), mobile applications, (mobile)
games, news and content portals, ecommerce platforms and advertisement platforms (Kusuma
2012). Another major trend in the Indonesian start-up scene is fintech (financial technology).
Only 36 percent of the Indonesian population over the age of 15 has a bank account in the
formal financial sector (The World Bank 2014). In addition, the number of credit card users in
Indonesia is only about 8 million unique users (Boediman 2015). Paired with the thriving
82
smart phone sector in Indonesia, this can be an opportunity for start-ups creating alternative
banking infrastructure that is able to offer accessible, simple and affordable financial services
even in remote areas (ibid). A key driver for online financial services and digital money is the
Indonesian government. After terminating fuel subsidies in 2014, the Indonesian government
created BLNT, a direct cash subsidy system to support underprivileged citizens (ibid). It is
distributed through electronic money in order to reduce distribution cost and educate citizens
about digital financial services (ibid).
Indonesia’s start-up ecosystem also faces a number of challenges. Start-ups have
difficulties in finding experienced talents, in particular engineers (Davis 2014). As a result,
some Indonesian tech companies work with foreign talents. For example, Tokopedia
announced to hire engineers in China, Vietnam and India (ibid). Furthermore, the
development of internet infrastructure and internet adoption in Indonesia are significantly
lacking behind other emerging economies in Southeast Asia (Boediman 2015). This limits the
potential market size for products and services of start-ups in Indonesia. What is more, the
administrative procedures for starting and operating start-ups, general bureaucracy and
corruption are still major problems in Indonesia which inhibit technology entrepreneurship
and investments in start-up businesses (Kusuma 2012).
The Indonesian government has announced various measures to address these issues. For
example, investments in infrastructure aim at accelerating internet penetration and improving
the general transportation network which is crucial for ecommerce businesses (Boediman
2015). In addition, Indonesia’s minister of communication and information technology
Rudiantara wants to raise US$ 1 billion from national and international conglomerates and
established companies in 2015 (Widiartanto 2015). He plans to place the funds in a privately
managed venture capital firm which then invests in local technology based start-ups (ibid).
What is more, Indonesia’s President Joko Widodo pushed through a one-stop national office
for business permits which is expected to facilitate the process of registering new businesses
and obtaining business licences (Davis 2014).
Start-Up Model Results
The Indonesian start-up begins its business operation with the same firm- and industry-
specific conditions but in a different institutional environment than the Chinese start-up. The
following table provides an overview of the institutional variables and their values for the
Indonesian start-up environment:
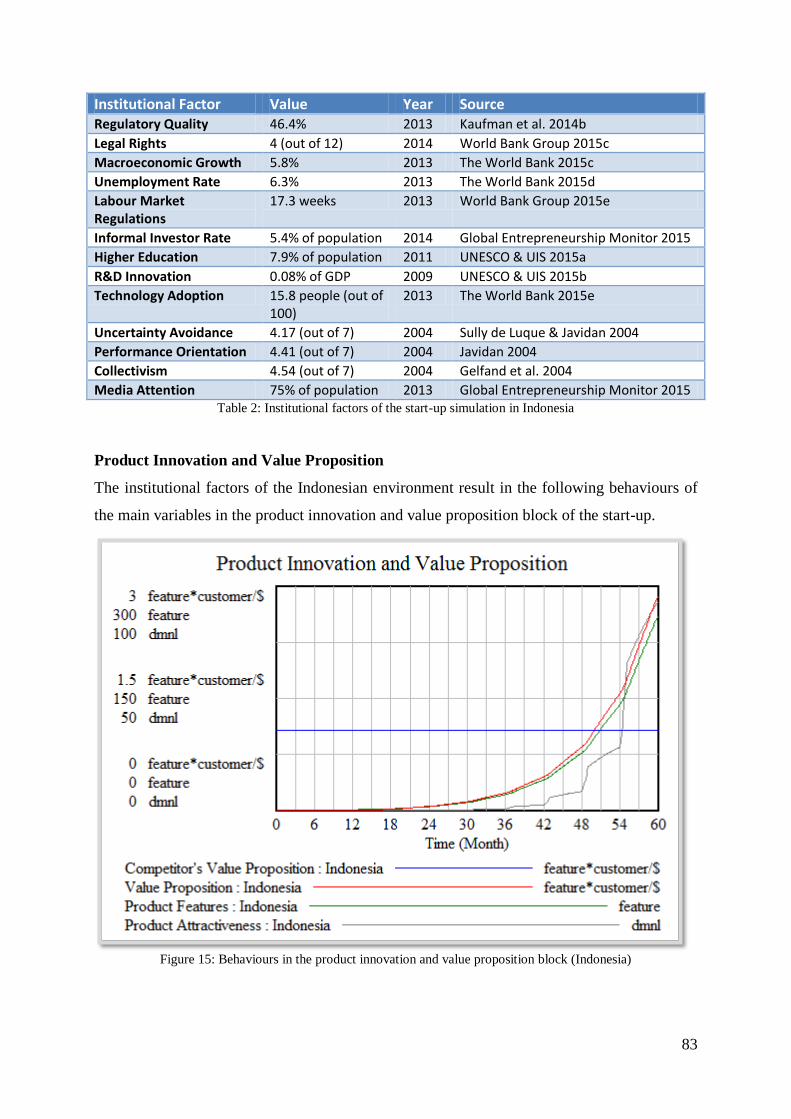
83
Institutional Factor Value Year Source Regulatory Quality 46.4% 2013 Kaufman et al. 2014b
Legal Rights 4 (out of 12) 2014 World Bank Group 2015c
Macroeconomic Growth 5.8% 2013 The World Bank 2015c
Unemployment Rate 6.3% 2013 The World Bank 2015d
Labour Market Regulations
17.3 weeks 2013 World Bank Group 2015e
Informal Investor Rate 5.4% of population 2014 Global Entrepreneurship Monitor 2015
Higher Education 7.9% of population 2011 UNESCO & UIS 2015a
R&D Innovation 0.08% of GDP 2009 UNESCO & UIS 2015b
Technology Adoption 15.8 people (out of 100)
2013 The World Bank 2015e
Uncertainty Avoidance 4.17 (out of 7) 2004 Sully de Luque & Javidan 2004
Performance Orientation 4.41 (out of 7) 2004 Javidan 2004
Collectivism 4.54 (out of 7) 2004 Gelfand et al. 2004
Media Attention 75% of population 2013 Global Entrepreneurship Monitor 2015 Table 2: Institutional factors of the start-up simulation in Indonesia
Product Innovation and Value Proposition
The institutional factors of the Indonesian environment result in the following behaviours of
the main variables in the product innovation and value proposition block of the start-up.
Figure 15: Behaviours in the product innovation and value proposition block (Indonesia)
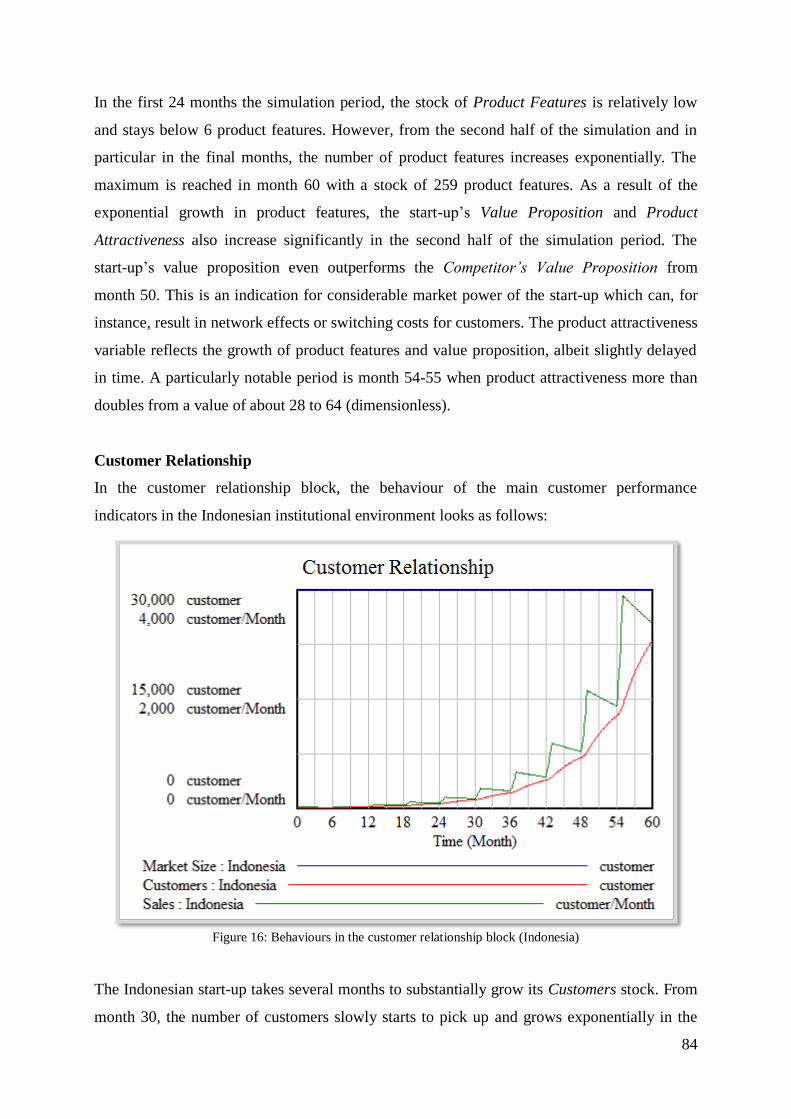
84
In the first 24 months the simulation period, the stock of Product Features is relatively low
and stays below 6 product features. However, from the second half of the simulation and in
particular in the final months, the number of product features increases exponentially. The
maximum is reached in month 60 with a stock of 259 product features. As a result of the
exponential growth in product features, the start-up’s Value Proposition and Product
Attractiveness also increase significantly in the second half of the simulation period. The
start-up’s value proposition even outperforms the Competitor’s Value Proposition from
month 50. This is an indication for considerable market power of the start-up which can, for
instance, result in network effects or switching costs for customers. The product attractiveness
variable reflects the growth of product features and value proposition, albeit slightly delayed
in time. A particularly notable period is month 54-55 when product attractiveness more than
doubles from a value of about 28 to 64 (dimensionless).
Customer Relationship
In the customer relationship block, the behaviour of the main customer performance
indicators in the Indonesian institutional environment looks as follows:
Figure 16: Behaviours in the customer relationship block (Indonesia)
The Indonesian start-up takes several months to substantially grow its Customers stock. From
month 30, the number of customers slowly starts to pick up and grows exponentially in the
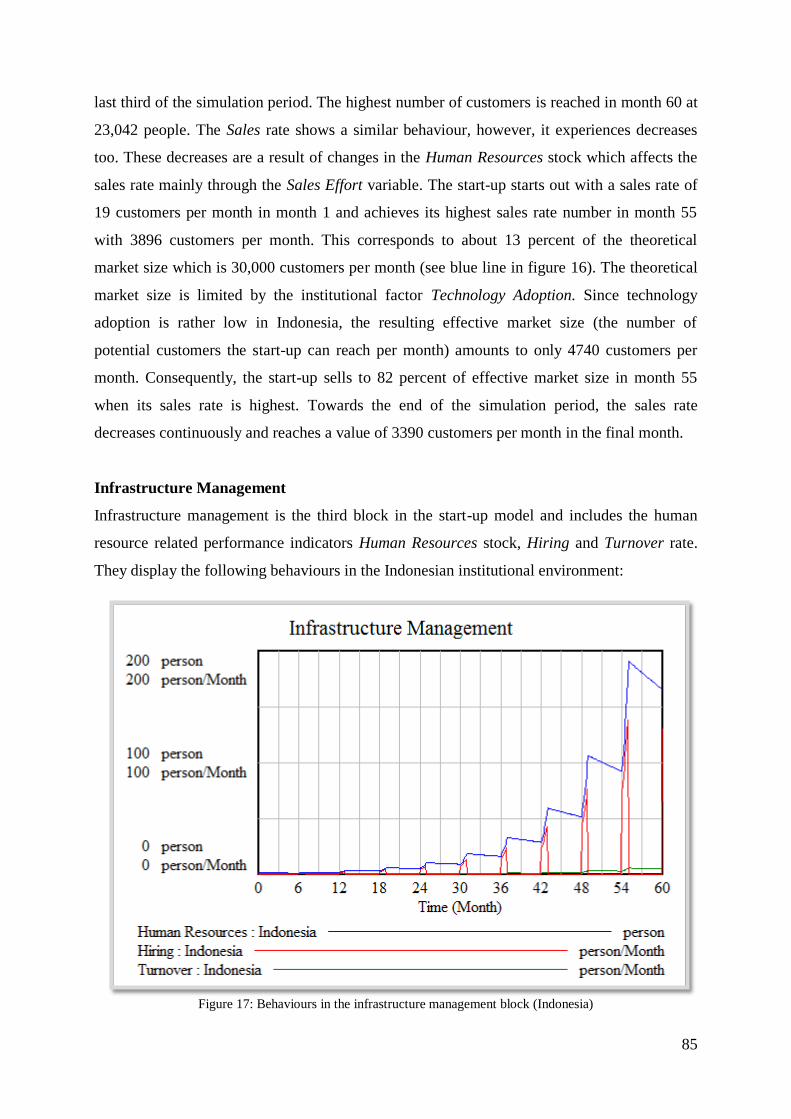
85
last third of the simulation period. The highest number of customers is reached in month 60 at
23,042 people. The Sales rate shows a similar behaviour, however, it experiences decreases
too. These decreases are a result of changes in the Human Resources stock which affects the
sales rate mainly through the Sales Effort variable. The start-up starts out with a sales rate of
19 customers per month in month 1 and achieves its highest sales rate number in month 55
with 3896 customers per month. This corresponds to about 13 percent of the theoretical
market size which is 30,000 customers per month (see blue line in figure 16). The theoretical
market size is limited by the institutional factor Technology Adoption. Since technology
adoption is rather low in Indonesia, the resulting effective market size (the number of
potential customers the start-up can reach per month) amounts to only 4740 customers per
month. Consequently, the start-up sells to 82 percent of effective market size in month 55
when its sales rate is highest. Towards the end of the simulation period, the sales rate
decreases continuously and reaches a value of 3390 customers per month in the final month.
Infrastructure Management
Infrastructure management is the third block in the start-up model and includes the human
resource related performance indicators Human Resources stock, Hiring and Turnover rate.
They display the following behaviours in the Indonesian institutional environment:
Figure 17: Behaviours in the infrastructure management block (Indonesia)
86
The start-up begins its business operation in month 0 with one staff (the founder) and hires its
first employee only after one year of being in business, i.e. in month 12.5. Afterwards, growth
in the human resources stock happens mainly in 6 month intervals as determined by the hiring
rate. In the last third of the simulation period, the human resources stock increases
significantly and reaches its maximum of 190 people in month 55. In the last month of the
simulation, the start-up has a total of 165 employees. Decreases in human resources are due to
dismissal of employees as reflected in the turnover rate. The turnover rate of the Indonesian
start-up is rather low, especially during the first half of the simulation period. This is due to
the institutional factor Labour Market Regulations whose value of 17.3 weeks of severance
pay for redundancy dismissal is relatively high and discourages the start-up from dismissing
employees. What is more, the hiring rate increases continuously throughout the 60 months of
simulation and contributes to the growth of the human resources stock. The hiring rate’s
growth pattern and intervals of 6 months are determined by the variables Desired Headcount
Growth, Headcount Growth and Time to Hire. The time to hire is about 9.5 days below the
average time to hire of 2 months due to the Unemployment Rate of 6.3 percent in the
Indonesian institutional environment.
Financial Aspects
The financial aspects block measure the value created by the other three blocks in financial
terms. In the Indonesian institutional environment, the main financial variables of the start-up
develop as follows during the simulation period:
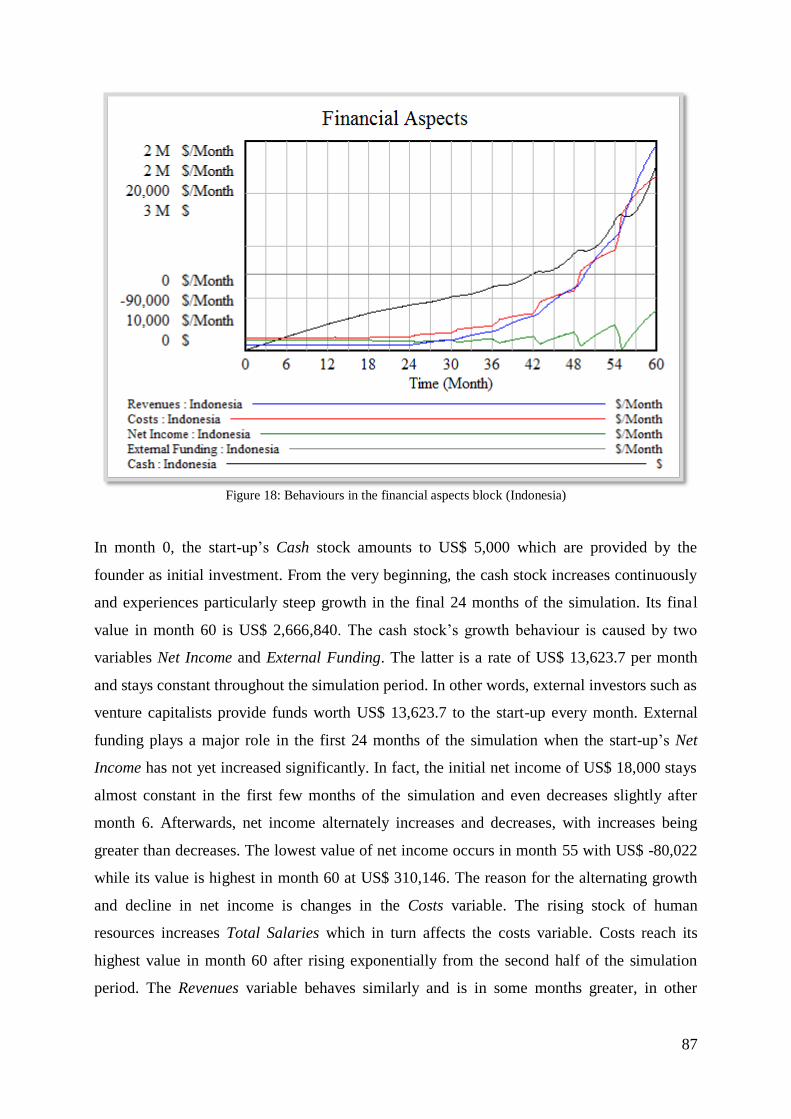
87
Figure 18: Behaviours in the financial aspects block (Indonesia)
In month 0, the start-up’s Cash stock amounts to US$ 5,000 which are provided by the
founder as initial investment. From the very beginning, the cash stock increases continuously
and experiences particularly steep growth in the final 24 months of the simulation. Its final
value in month 60 is US$ 2,666,840. The cash stock’s growth behaviour is caused by two
variables Net Income and External Funding. The latter is a rate of US$ 13,623.7 per month
and stays constant throughout the simulation period. In other words, external investors such as
venture capitalists provide funds worth US$ 13,623.7 to the start-up every month. External
funding plays a major role in the first 24 months of the simulation when the start-up’s Net
Income has not yet increased significantly. In fact, the initial net income of US$ 18,000 stays
almost constant in the first few months of the simulation and even decreases slightly after
month 6. Afterwards, net income alternately increases and decreases, with increases being
greater than decreases. The lowest value of net income occurs in month 55 with US$ -80,022
while its value is highest in month 60 at US$ 310,146. The reason for the alternating growth
and decline in net income is changes in the Costs variable. The rising stock of human
resources increases Total Salaries which in turn affects the costs variable. Costs reach its
highest value in month 60 after rising exponentially from the second half of the simulation
period. The Revenues variable behaves similarly and is in some months greater, in other
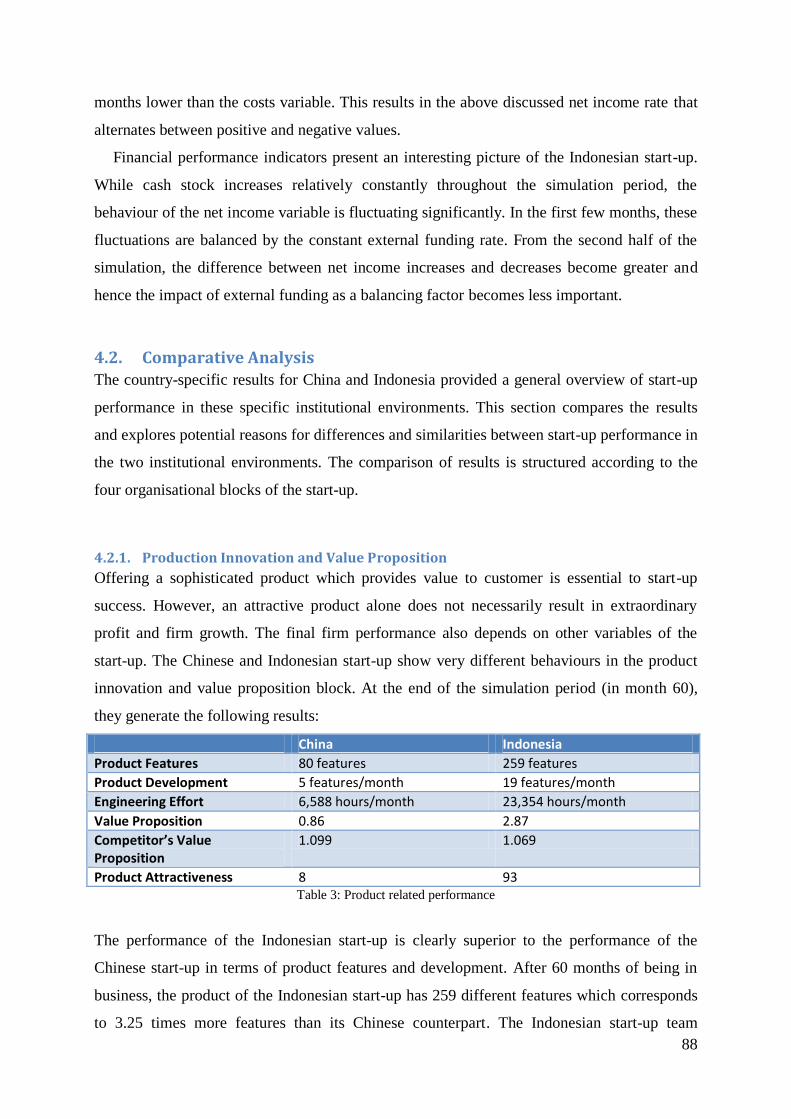
88
months lower than the costs variable. This results in the above discussed net income rate that
alternates between positive and negative values.
Financial performance indicators present an interesting picture of the Indonesian start-up.
While cash stock increases relatively constantly throughout the simulation period, the
behaviour of the net income variable is fluctuating significantly. In the first few months, these
fluctuations are balanced by the constant external funding rate. From the second half of the
simulation, the difference between net income increases and decreases become greater and
hence the impact of external funding as a balancing factor becomes less important.
4.2. Comparative Analysis The country-specific results for China and Indonesia provided a general overview of start-up
performance in these specific institutional environments. This section compares the results
and explores potential reasons for differences and similarities between start-up performance in
the two institutional environments. The comparison of results is structured according to the
four organisational blocks of the start-up.
4.2.1. Production Innovation and Value Proposition
Offering a sophisticated product which provides value to customer is essential to start-up
success. However, an attractive product alone does not necessarily result in extraordinary
profit and firm growth. The final firm performance also depends on other variables of the
start-up. The Chinese and Indonesian start-up show very different behaviours in the product
innovation and value proposition block. At the end of the simulation period (in month 60),
they generate the following results:
China Indonesia
Product Features 80 features 259 features
Product Development 5 features/month 19 features/month
Engineering Effort 6,588 hours/month 23,354 hours/month
Value Proposition 0.86 2.87
Competitor’s Value Proposition
1.099 1.069
Product Attractiveness 8 93 Table 3: Product related performance
The performance of the Indonesian start-up is clearly superior to the performance of the
Chinese start-up in terms of product features and development. After 60 months of being in
business, the product of the Indonesian start-up has 259 different features which corresponds
to 3.25 times more features than its Chinese counterpart. The Indonesian start-up team
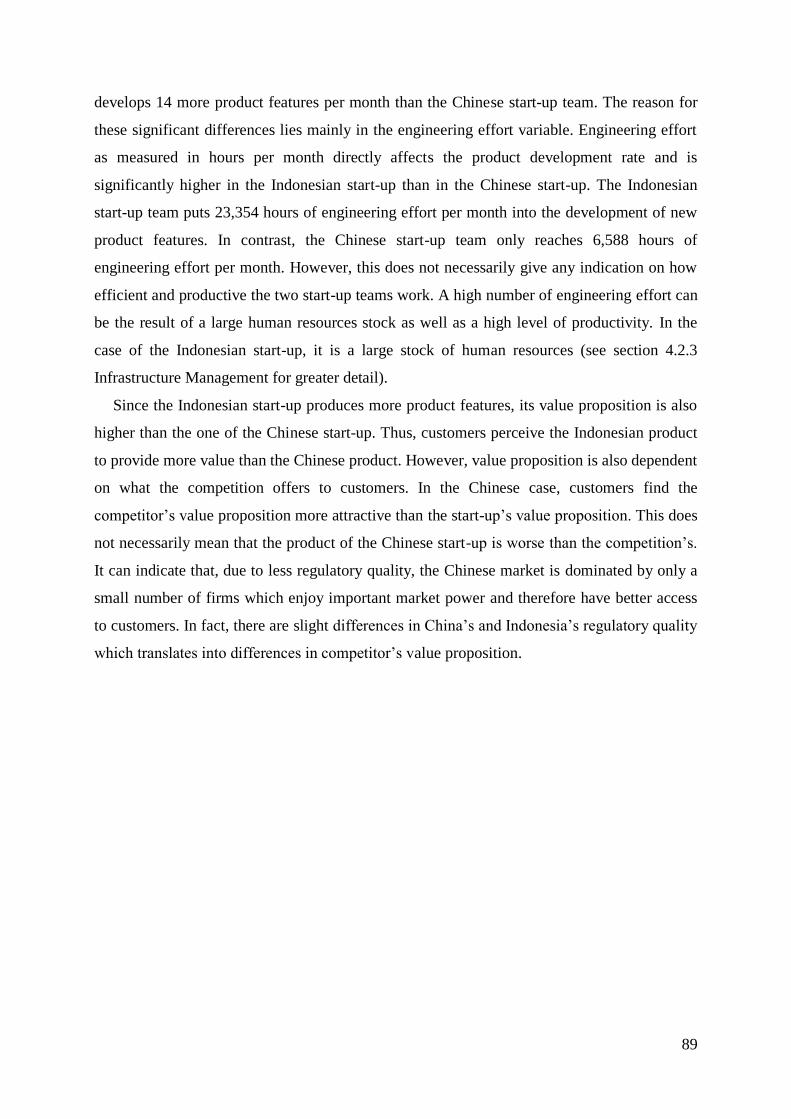
89
develops 14 more product features per month than the Chinese start-up team. The reason for
these significant differences lies mainly in the engineering effort variable. Engineering effort
as measured in hours per month directly affects the product development rate and is
significantly higher in the Indonesian start-up than in the Chinese start-up. The Indonesian
start-up team puts 23,354 hours of engineering effort per month into the development of new
product features. In contrast, the Chinese start-up team only reaches 6,588 hours of
engineering effort per month. However, this does not necessarily give any indication on how
efficient and productive the two start-up teams work. A high number of engineering effort can
be the result of a large human resources stock as well as a high level of productivity. In the
case of the Indonesian start-up, it is a large stock of human resources (see section 4.2.3
Infrastructure Management for greater detail).
Since the Indonesian start-up produces more product features, its value proposition is also
higher than the one of the Chinese start-up. Thus, customers perceive the Indonesian product
to provide more value than the Chinese product. However, value proposition is also dependent
on what the competition offers to customers. In the Chinese case, customers find the
competitor’s value proposition more attractive than the start-up’s value proposition. This does
not necessarily mean that the product of the Chinese start-up is worse than the competition’s.
It can indicate that, due to less regulatory quality, the Chinese market is dominated by only a
small number of firms which enjoy important market power and therefore have better access
to customers. In fact, there are slight differences in China’s and Indonesia’s regulatory quality
which translates into differences in competitor’s value proposition.
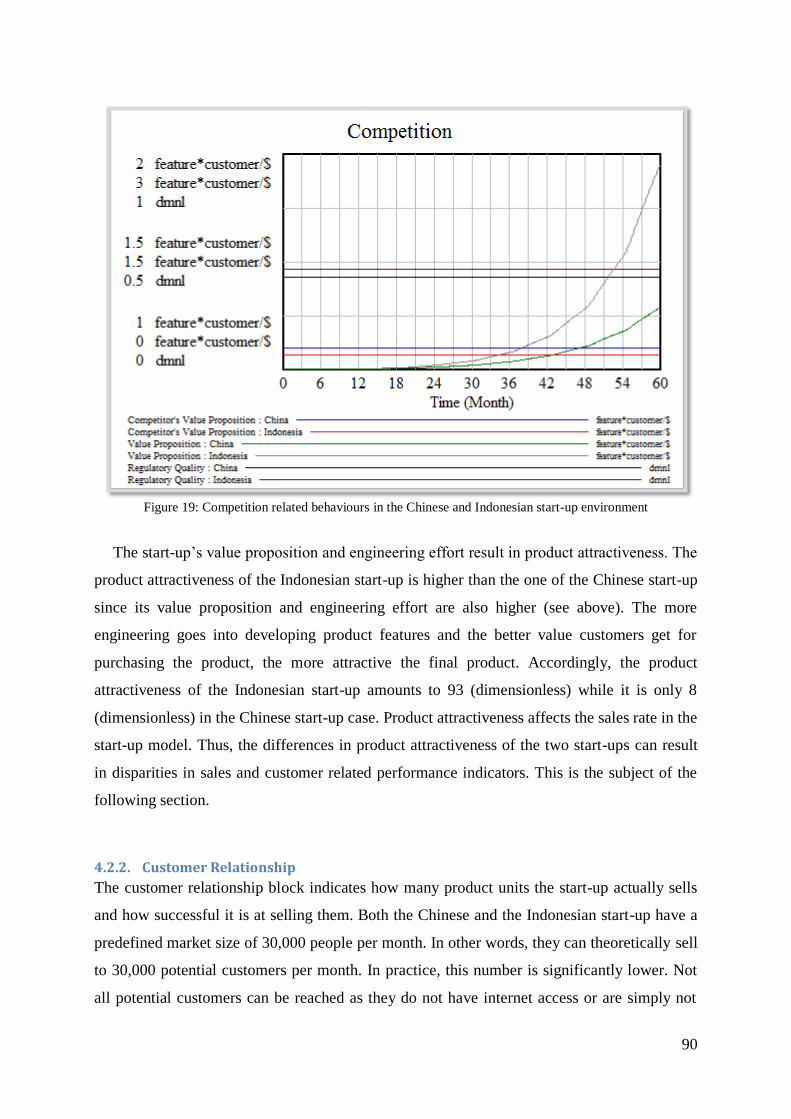
90
Figure 19: Competition related behaviours in the Chinese and Indonesian start-up environment
The start-up’s value proposition and engineering effort result in product attractiveness. The
product attractiveness of the Indonesian start-up is higher than the one of the Chinese start-up
since its value proposition and engineering effort are also higher (see above). The more
engineering goes into developing product features and the better value customers get for
purchasing the product, the more attractive the final product. Accordingly, the product
attractiveness of the Indonesian start-up amounts to 93 (dimensionless) while it is only 8
(dimensionless) in the Chinese start-up case. Product attractiveness affects the sales rate in the
start-up model. Thus, the differences in product attractiveness of the two start-ups can result
in disparities in sales and customer related performance indicators. This is the subject of the
following section.
4.2.2. Customer Relationship
The customer relationship block indicates how many product units the start-up actually sells
and how successful it is at selling them. Both the Chinese and the Indonesian start-up have a
predefined market size of 30,000 people per month. In other words, they can theoretically sell
to 30,000 potential customers per month. In practice, this number is significantly lower. Not
all potential customers can be reached as they do not have internet access or are simply not
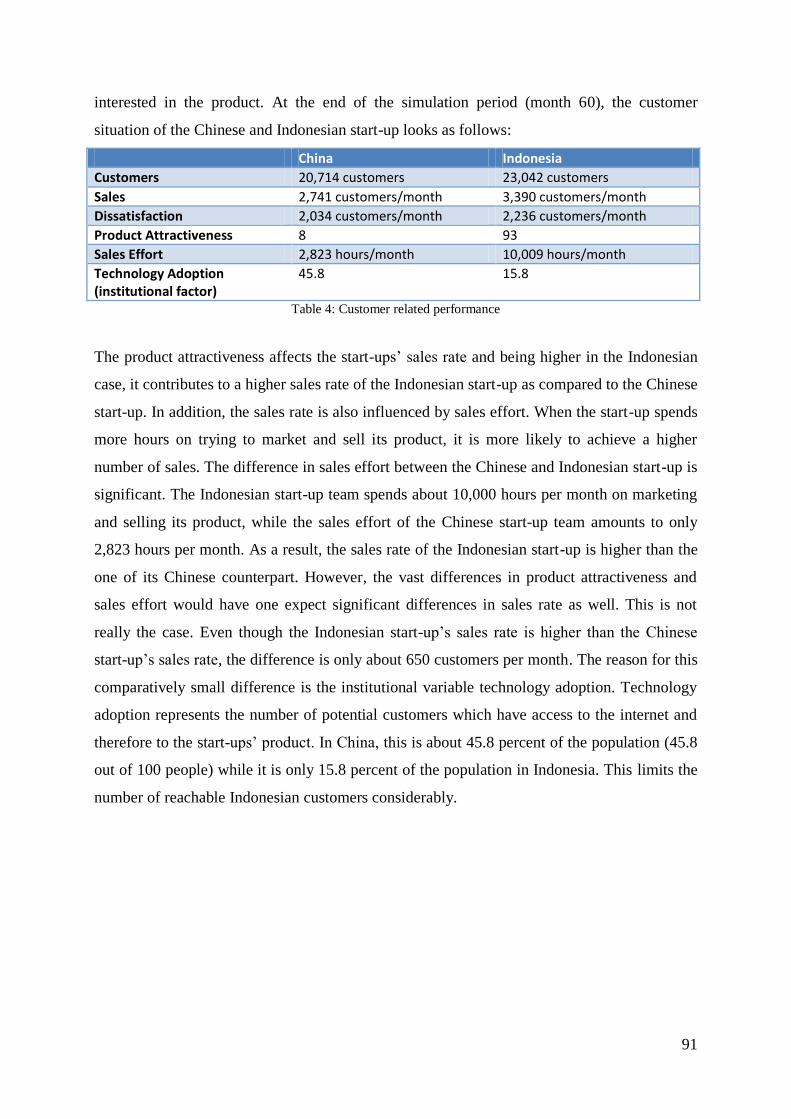
91
interested in the product. At the end of the simulation period (month 60), the customer
situation of the Chinese and Indonesian start-up looks as follows:
China Indonesia
Customers 20,714 customers 23,042 customers
Sales 2,741 customers/month 3,390 customers/month
Dissatisfaction 2,034 customers/month 2,236 customers/month
Product Attractiveness 8 93
Sales Effort 2,823 hours/month 10,009 hours/month
Technology Adoption (institutional factor)
45.8 15.8
Table 4: Customer related performance
The product attractiveness affects the start-ups’ sales rate and being higher in the Indonesian
case, it contributes to a higher sales rate of the Indonesian start-up as compared to the Chinese
start-up. In addition, the sales rate is also influenced by sales effort. When the start-up spends
more hours on trying to market and sell its product, it is more likely to achieve a higher
number of sales. The difference in sales effort between the Chinese and Indonesian start-up is
significant. The Indonesian start-up team spends about 10,000 hours per month on marketing
and selling its product, while the sales effort of the Chinese start-up team amounts to only
2,823 hours per month. As a result, the sales rate of the Indonesian start-up is higher than the
one of its Chinese counterpart. However, the vast differences in product attractiveness and
sales effort would have one expect significant differences in sales rate as well. This is not
really the case. Even though the Indonesian start-up’s sales rate is higher than the Chinese
start-up’s sales rate, the difference is only about 650 customers per month. The reason for this
comparatively small difference is the institutional variable technology adoption. Technology
adoption represents the number of potential customers which have access to the internet and
therefore to the start-ups’ product. In China, this is about 45.8 percent of the population (45.8
out of 100 people) while it is only 15.8 percent of the population in Indonesia. This limits the
number of reachable Indonesian customers considerably.
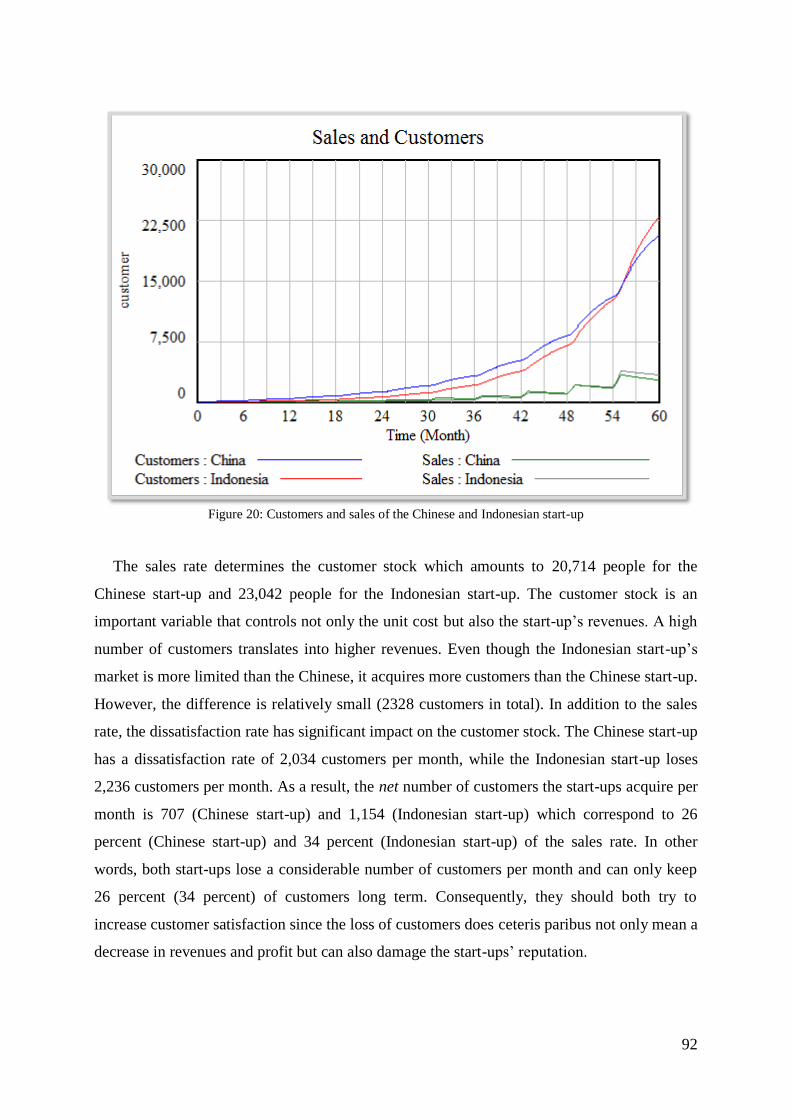
92
Figure 20: Customers and sales of the Chinese and Indonesian start-up
The sales rate determines the customer stock which amounts to 20,714 people for the
Chinese start-up and 23,042 people for the Indonesian start-up. The customer stock is an
important variable that controls not only the unit cost but also the start-up’s revenues. A high
number of customers translates into higher revenues. Even though the Indonesian start-up’s
market is more limited than the Chinese, it acquires more customers than the Chinese start-up.
However, the difference is relatively small (2328 customers in total). In addition to the sales
rate, the dissatisfaction rate has significant impact on the customer stock. The Chinese start-up
has a dissatisfaction rate of 2,034 customers per month, while the Indonesian start-up loses
2,236 customers per month. As a result, the net number of customers the start-ups acquire per
month is 707 (Chinese start-up) and 1,154 (Indonesian start-up) which correspond to 26
percent (Chinese start-up) and 34 percent (Indonesian start-up) of the sales rate. In other
words, both start-ups lose a considerable number of customers per month and can only keep
26 percent (34 percent) of customers long term. Consequently, they should both try to
increase customer satisfaction since the loss of customers does ceteris paribus not only mean a
decrease in revenues and profit but can also damage the start-ups’ reputation.
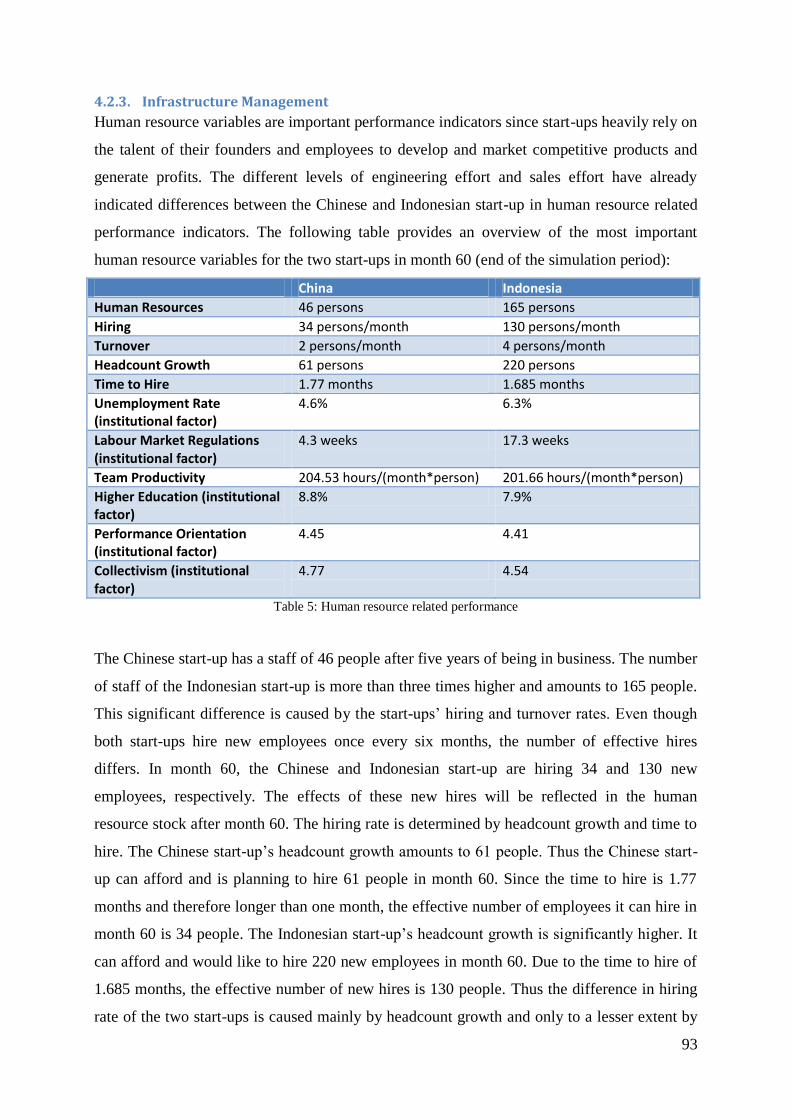
93
4.2.3. Infrastructure Management
Human resource variables are important performance indicators since start-ups heavily rely on
the talent of their founders and employees to develop and market competitive products and
generate profits. The different levels of engineering effort and sales effort have already
indicated differences between the Chinese and Indonesian start-up in human resource related
performance indicators. The following table provides an overview of the most important
human resource variables for the two start-ups in month 60 (end of the simulation period):
China Indonesia
Human Resources 46 persons 165 persons
Hiring 34 persons/month 130 persons/month
Turnover 2 persons/month 4 persons/month
Headcount Growth 61 persons 220 persons
Time to Hire 1.77 months 1.685 months
Unemployment Rate (institutional factor)
4.6% 6.3%
Labour Market Regulations (institutional factor)
4.3 weeks 17.3 weeks
Team Productivity 204.53 hours/(month*person) 201.66 hours/(month*person)
Higher Education (institutional factor)
8.8% 7.9%
Performance Orientation (institutional factor)
4.45 4.41
Collectivism (institutional factor)
4.77 4.54
Table 5: Human resource related performance
The Chinese start-up has a staff of 46 people after five years of being in business. The number
of staff of the Indonesian start-up is more than three times higher and amounts to 165 people.
This significant difference is caused by the start-ups’ hiring and turnover rates. Even though
both start-ups hire new employees once every six months, the number of effective hires
differs. In month 60, the Chinese and Indonesian start-up are hiring 34 and 130 new
employees, respectively. The effects of these new hires will be reflected in the human
resource stock after month 60. The hiring rate is determined by headcount growth and time to
hire. The Chinese start-up’s headcount growth amounts to 61 people. Thus the Chinese start-
up can afford and is planning to hire 61 people in month 60. Since the time to hire is 1.77
months and therefore longer than one month, the effective number of employees it can hire in
month 60 is 34 people. The Indonesian start-up’s headcount growth is significantly higher. It
can afford and would like to hire 220 new employees in month 60. Due to the time to hire of
1.685 months, the effective number of new hires is 130 people. Thus the difference in hiring
rate of the two start-ups is caused mainly by headcount growth and only to a lesser extent by
94
the time to hire variable. Since China and Indonesia have similar unemployment rates, the
time to hire new staff for the two start-ups is only marginally different.
Greater difference lies in the turnover rate of the two start-ups. The Indonesian start-up’s
turnover rate of four people per month is twice higher than the Chinese start-up’s turnover
rate of 2 people per month. However, the human resource stocks and hiring rates of both start-
ups have to be taken into account when evaluating the turnover rate. Compared to its
relatively high hiring rate and the average turnover rate of 5 percent of the human resource
stock, the Indonesian start-up’s turnover rate is low. Only few staff leaves the start-up. This is
due to Indonesia’s strict labour market regulations. The severance pay for redundancy
dismissal is 17.3 weeks in Indonesia which slows down the start-up’s turnover process
considerably. As a result, the Indonesian start-up keeps more staff than it actually needs. In
contrast, China’s labour market regulations are less strict and severance pay for redundancy
dismissal amounts to only 4.3 weeks. The Chinese start-up can dismiss staff more easily and
therefore has a high turnover rate in relation to its hiring rate and human resource stock.
Another important variable and human resource related performance indicator in the
infrastructure management block is productivity. It measures the hours per month in which
employees work productively and contribute to the creation of new product features. In the
Chinese start-up, the productivity level per month and staff member is 204.53 hours while it is
201.66 hours in the Indonesian start-up. The productivity level of both start-ups is
significantly higher than the average productivity of 140 hours per person and month which is
due to the three institutional factors higher education, performance orientation and
collectivism. The Chinese start-up’s productivity level is marginally higher compared to the
one of the Indonesian start-up since all three institutional factors are all slightly better in the
Chinese than the Indonesian context. Productivity directly affects the variables engineering
effort and sales effort and can therefore impact the product development rate and sales rate.
Since productivity levels of the two start-ups are very similar, they do not explain the major
differences in product feature and customer stock. As mentioned previously, the Indonesian
start-up’s product feature stock is three times the Chinese start-up’s product feature stock. In
addition, its sales rate and customer stock are higher than the ones of the Chinese start-up,
despite the limitation in its market. The differences in product feature stock, sales rate and
customer stock are caused by the human resource stock which is significantly larger in case of
the Indonesian start-up. The Indonesian start-up has more employees and can therefore invest
more time into engineering and sales efforts. As a result, it can develop more product features
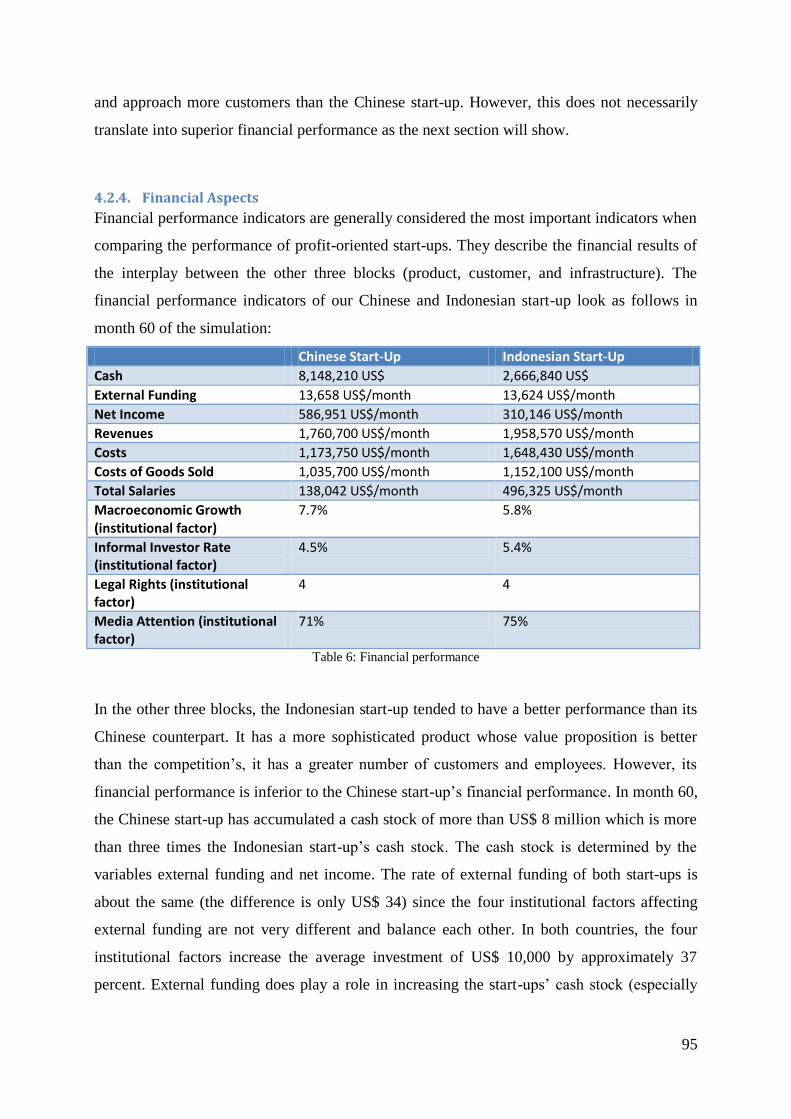
95
and approach more customers than the Chinese start-up. However, this does not necessarily
translate into superior financial performance as the next section will show.
4.2.4. Financial Aspects
Financial performance indicators are generally considered the most important indicators when
comparing the performance of profit-oriented start-ups. They describe the financial results of
the interplay between the other three blocks (product, customer, and infrastructure). The
financial performance indicators of our Chinese and Indonesian start-up look as follows in
month 60 of the simulation:
Chinese Start-Up Indonesian Start-Up
Cash 8,148,210 US$ 2,666,840 US$
External Funding 13,658 US$/month 13,624 US$/month
Net Income 586,951 US$/month 310,146 US$/month
Revenues 1,760,700 US$/month 1,958,570 US$/month
Costs 1,173,750 US$/month 1,648,430 US$/month
Costs of Goods Sold 1,035,700 US$/month 1,152,100 US$/month
Total Salaries 138,042 US$/month 496,325 US$/month
Macroeconomic Growth (institutional factor)
7.7% 5.8%
Informal Investor Rate (institutional factor)
4.5% 5.4%
Legal Rights (institutional factor)
4 4
Media Attention (institutional factor)
71% 75%
Table 6: Financial performance
In the other three blocks, the Indonesian start-up tended to have a better performance than its
Chinese counterpart. It has a more sophisticated product whose value proposition is better
than the competition’s, it has a greater number of customers and employees. However, its
financial performance is inferior to the Chinese start-up’s financial performance. In month 60,
the Chinese start-up has accumulated a cash stock of more than US$ 8 million which is more
than three times the Indonesian start-up’s cash stock. The cash stock is determined by the
variables external funding and net income. The rate of external funding of both start-ups is
about the same (the difference is only US$ 34) since the four institutional factors affecting
external funding are not very different and balance each other. In both countries, the four
institutional factors increase the average investment of US$ 10,000 by approximately 37
percent. External funding does play a role in increasing the start-ups’ cash stock (especially
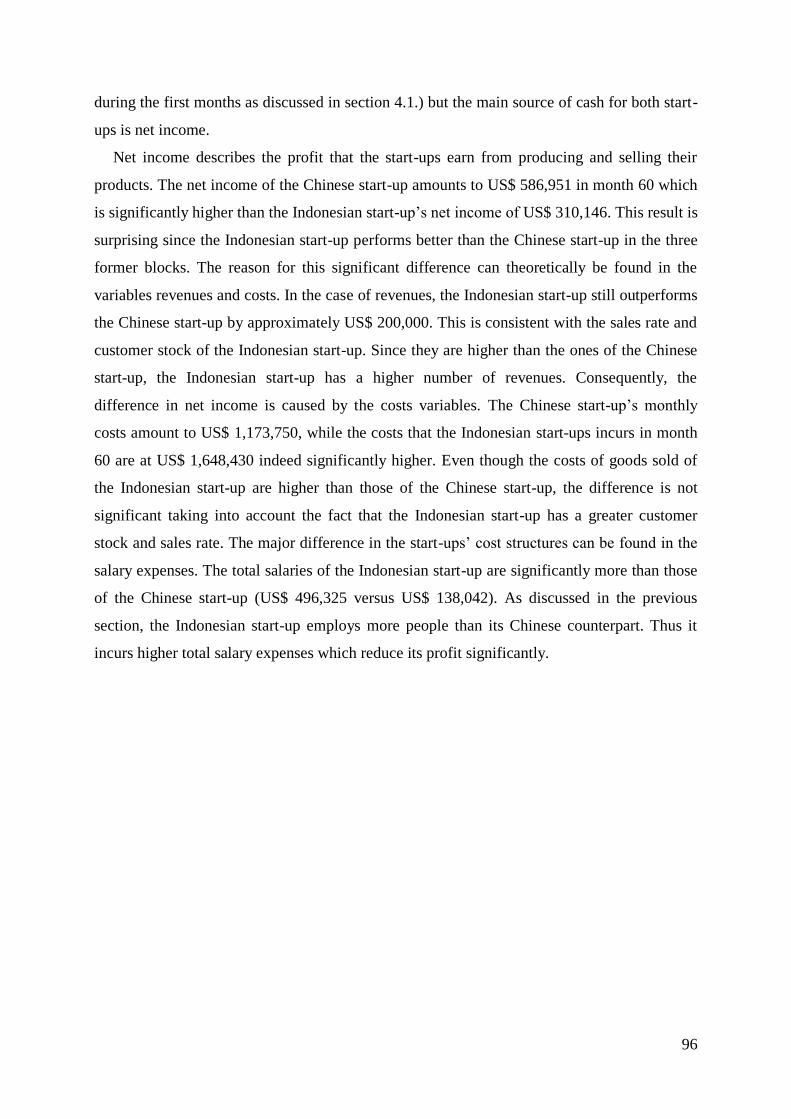
96
during the first months as discussed in section 4.1.) but the main source of cash for both start-
ups is net income.
Net income describes the profit that the start-ups earn from producing and selling their
products. The net income of the Chinese start-up amounts to US$ 586,951 in month 60 which
is significantly higher than the Indonesian start-up’s net income of US$ 310,146. This result is
surprising since the Indonesian start-up performs better than the Chinese start-up in the three
former blocks. The reason for this significant difference can theoretically be found in the
variables revenues and costs. In the case of revenues, the Indonesian start-up still outperforms
the Chinese start-up by approximately US$ 200,000. This is consistent with the sales rate and
customer stock of the Indonesian start-up. Since they are higher than the ones of the Chinese
start-up, the Indonesian start-up has a higher number of revenues. Consequently, the
difference in net income is caused by the costs variables. The Chinese start-up’s monthly
costs amount to US$ 1,173,750, while the costs that the Indonesian start-ups incurs in month
60 are at US$ 1,648,430 indeed significantly higher. Even though the costs of goods sold of
the Indonesian start-up are higher than those of the Chinese start-up, the difference is not
significant taking into account the fact that the Indonesian start-up has a greater customer
stock and sales rate. The major difference in the start-ups’ cost structures can be found in the
salary expenses. The total salaries of the Indonesian start-up are significantly more than those
of the Chinese start-up (US$ 496,325 versus US$ 138,042). As discussed in the previous
section, the Indonesian start-up employs more people than its Chinese counterpart. Thus it
incurs higher total salary expenses which reduce its profit significantly.
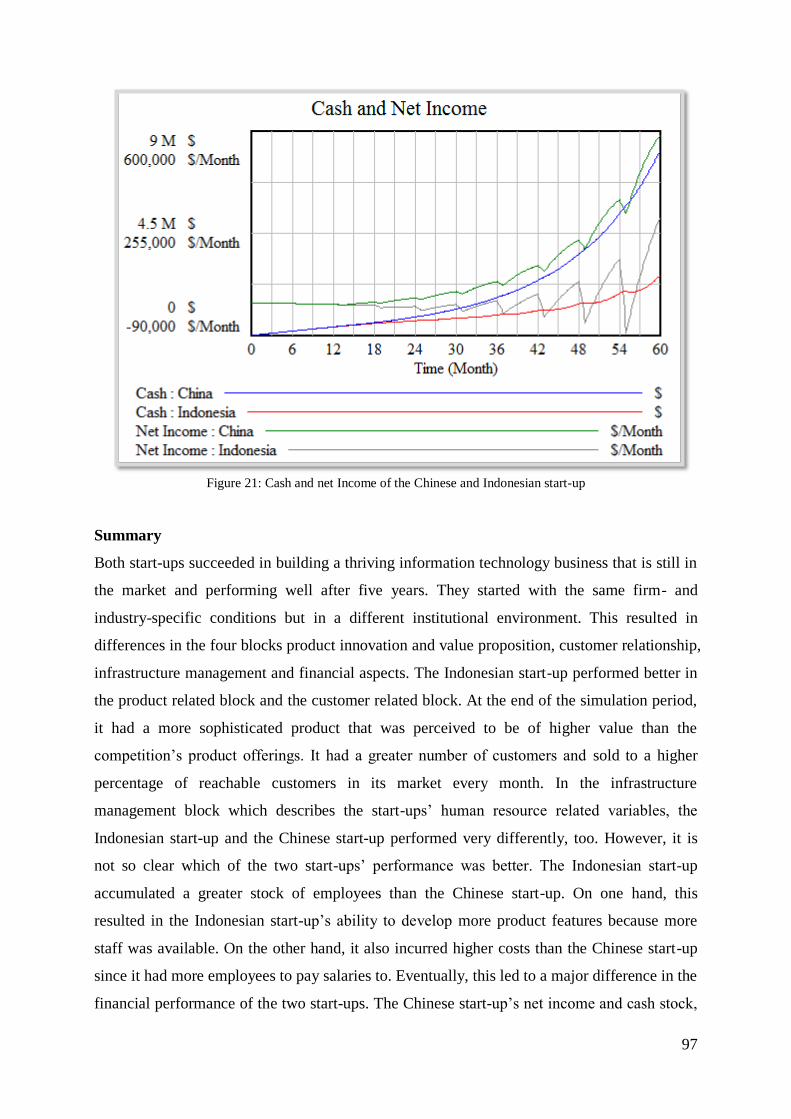
97
Figure 21: Cash and net Income of the Chinese and Indonesian start-up
Summary
Both start-ups succeeded in building a thriving information technology business that is still in
the market and performing well after five years. They started with the same firm- and
industry-specific conditions but in a different institutional environment. This resulted in
differences in the four blocks product innovation and value proposition, customer relationship,
infrastructure management and financial aspects. The Indonesian start-up performed better in
the product related block and the customer related block. At the end of the simulation period,
it had a more sophisticated product that was perceived to be of higher value than the
competition’s product offerings. It had a greater number of customers and sold to a higher
percentage of reachable customers in its market every month. In the infrastructure
management block which describes the start-ups’ human resource related variables, the
Indonesian start-up and the Chinese start-up performed very differently, too. However, it is
not so clear which of the two start-ups’ performance was better. The Indonesian start-up
accumulated a greater stock of employees than the Chinese start-up. On one hand, this
resulted in the Indonesian start-up’s ability to develop more product features because more
staff was available. On the other hand, it also incurred higher costs than the Chinese start-up
since it had more employees to pay salaries to. Eventually, this led to a major difference in the
financial performance of the two start-ups. The Chinese start-up’s net income and cash stock,
98
the two most important financial performance indicators, were both higher than those of the
Indonesian start-up. Even though the Chinese start-up had a less sophisticated product and a
smaller number of customers, it outperformed the Indonesian start-up in financial terms. It
had a leaner and more efficient human resource structure that was apparently a result of less
strict labour market regulations. This is a subject of the following chapter that analyses the
effect of labour market regulations and the other institutional factors on the basis of sensitivity
analysis.
4.3. Sensitivity Analysis The comparative analysis in the previous chapter revealed differences in the performance of
the two start-ups and discussed the variables that are directly involved in producing these
differences. System dynamics is a method to depict complex structures with variables that
affect other variables in an indirect and oftentimes counterintuitive way. Sensitivity analysis
helps to uncover these effects. In light of this thesis’ start-up model and research questions,
the following sensitivity analysis is focused on institutional factors and their effect on start-up
performance. This does not only help explain differences in the performance of the Chinese
and Indonesian start-up but also allows identifying the most critical institutional factors
influencing start-up performance.
4.3.1. Formal Institutions
Formal institutional factors affect variables in all four blocks of the system dynamics start-up
model. In order to analyse their effect, each institutional factor is tested separately by
changing its value to a (near) maximum and (near) minimum that can also be negative.
Results are compared through the financial performance indicators cash stock and external
funding and the non-financial performance indicator customers stock. Both the Chinese and
the Indonesian start-up models are used as base models for testing maximum and minimum
levels. The base month is the last month of the simulation period (month 60).
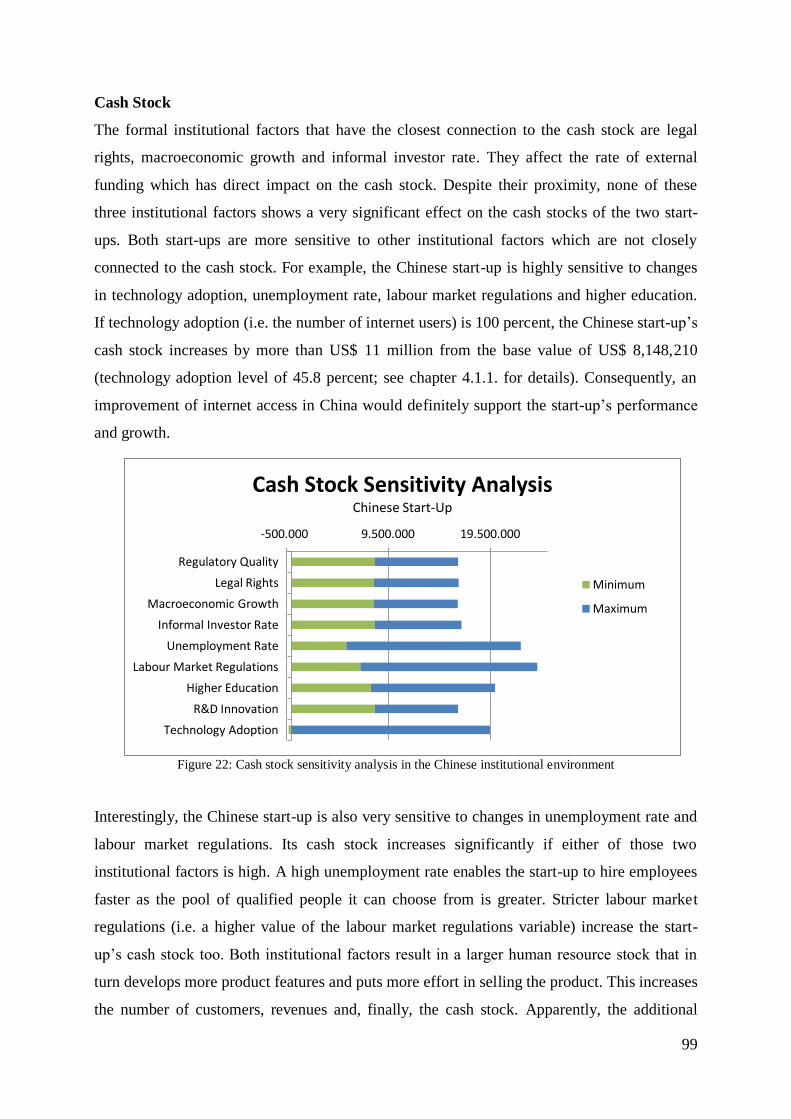
99
-500.000 9.500.000 19.500.000
Regulatory Quality
Legal Rights
Macroeconomic Growth
Informal Investor Rate
Unemployment Rate
Labour Market Regulations
Higher Education
R&D Innovation
Technology Adoption
Cash Stock Sensitivity Analysis Chinese Start-Up
Minimum
Maximum
Cash Stock
The formal institutional factors that have the closest connection to the cash stock are legal
rights, macroeconomic growth and informal investor rate. They affect the rate of external
funding which has direct impact on the cash stock. Despite their proximity, none of these
three institutional factors shows a very significant effect on the cash stocks of the two start-
ups. Both start-ups are more sensitive to other institutional factors which are not closely
connected to the cash stock. For example, the Chinese start-up is highly sensitive to changes
in technology adoption, unemployment rate, labour market regulations and higher education.
If technology adoption (i.e. the number of internet users) is 100 percent, the Chinese start-up’s
cash stock increases by more than US$ 11 million from the base value of US$ 8,148,210
(technology adoption level of 45.8 percent; see chapter 4.1.1. for details). Consequently, an
improvement of internet access in China would definitely support the start-up’s performance
and growth.
Figure 22: Cash stock sensitivity analysis in the Chinese institutional environment
Interestingly, the Chinese start-up is also very sensitive to changes in unemployment rate and
labour market regulations. Its cash stock increases significantly if either of those two
institutional factors is high. A high unemployment rate enables the start-up to hire employees
faster as the pool of qualified people it can choose from is greater. Stricter labour market
regulations (i.e. a higher value of the labour market regulations variable) increase the start-
up’s cash stock too. Both institutional factors result in a larger human resource stock that in
turn develops more product features and puts more effort in selling the product. This increases
the number of customers, revenues and, finally, the cash stock. Apparently, the additional
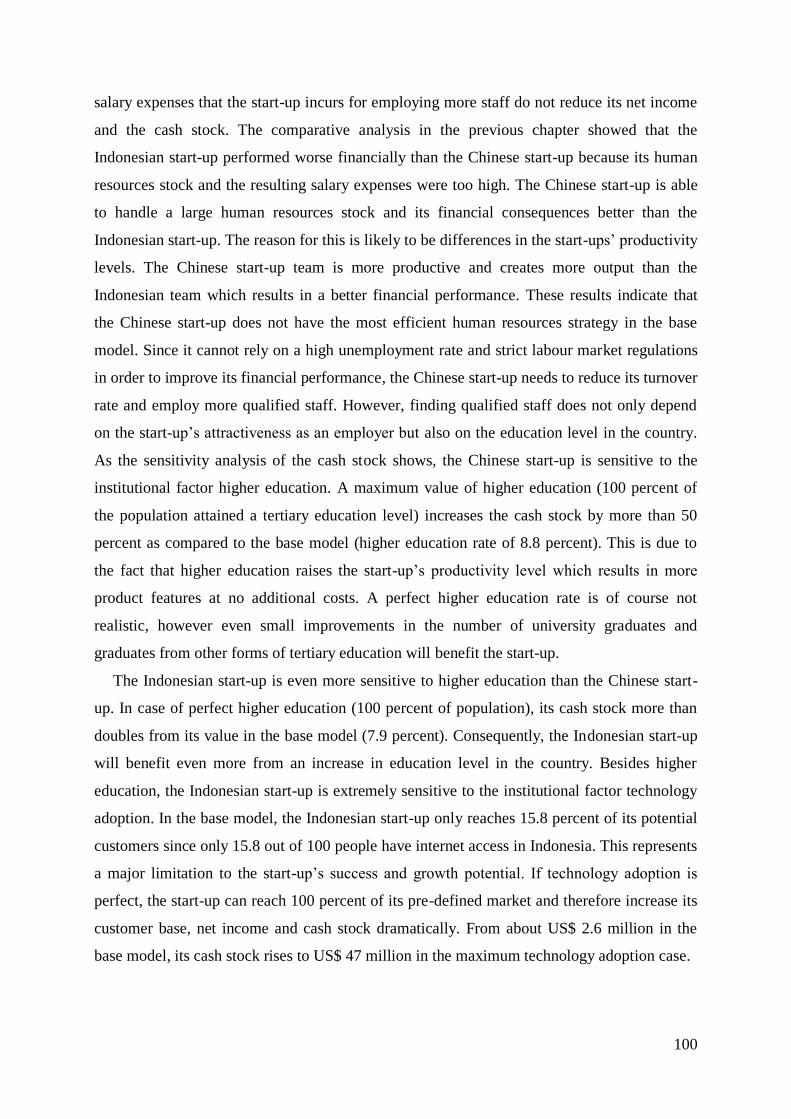
100
salary expenses that the start-up incurs for employing more staff do not reduce its net income
and the cash stock. The comparative analysis in the previous chapter showed that the
Indonesian start-up performed worse financially than the Chinese start-up because its human
resources stock and the resulting salary expenses were too high. The Chinese start-up is able
to handle a large human resources stock and its financial consequences better than the
Indonesian start-up. The reason for this is likely to be differences in the start-ups’ productivity
levels. The Chinese start-up team is more productive and creates more output than the
Indonesian team which results in a better financial performance. These results indicate that
the Chinese start-up does not have the most efficient human resources strategy in the base
model. Since it cannot rely on a high unemployment rate and strict labour market regulations
in order to improve its financial performance, the Chinese start-up needs to reduce its turnover
rate and employ more qualified staff. However, finding qualified staff does not only depend
on the start-up’s attractiveness as an employer but also on the education level in the country.
As the sensitivity analysis of the cash stock shows, the Chinese start-up is sensitive to the
institutional factor higher education. A maximum value of higher education (100 percent of
the population attained a tertiary education level) increases the cash stock by more than 50
percent as compared to the base model (higher education rate of 8.8 percent). This is due to
the fact that higher education raises the start-up’s productivity level which results in more
product features at no additional costs. A perfect higher education rate is of course not
realistic, however even small improvements in the number of university graduates and
graduates from other forms of tertiary education will benefit the start-up.
The Indonesian start-up is even more sensitive to higher education than the Chinese start-
up. In case of perfect higher education (100 percent of population), its cash stock more than
doubles from its value in the base model (7.9 percent). Consequently, the Indonesian start-up
will benefit even more from an increase in education level in the country. Besides higher
education, the Indonesian start-up is extremely sensitive to the institutional factor technology
adoption. In the base model, the Indonesian start-up only reaches 15.8 percent of its potential
customers since only 15.8 out of 100 people have internet access in Indonesia. This represents
a major limitation to the start-up’s success and growth potential. If technology adoption is
perfect, the start-up can reach 100 percent of its pre-defined market and therefore increase its
customer base, net income and cash stock dramatically. From about US$ 2.6 million in the
base model, its cash stock rises to US$ 47 million in the maximum technology adoption case.
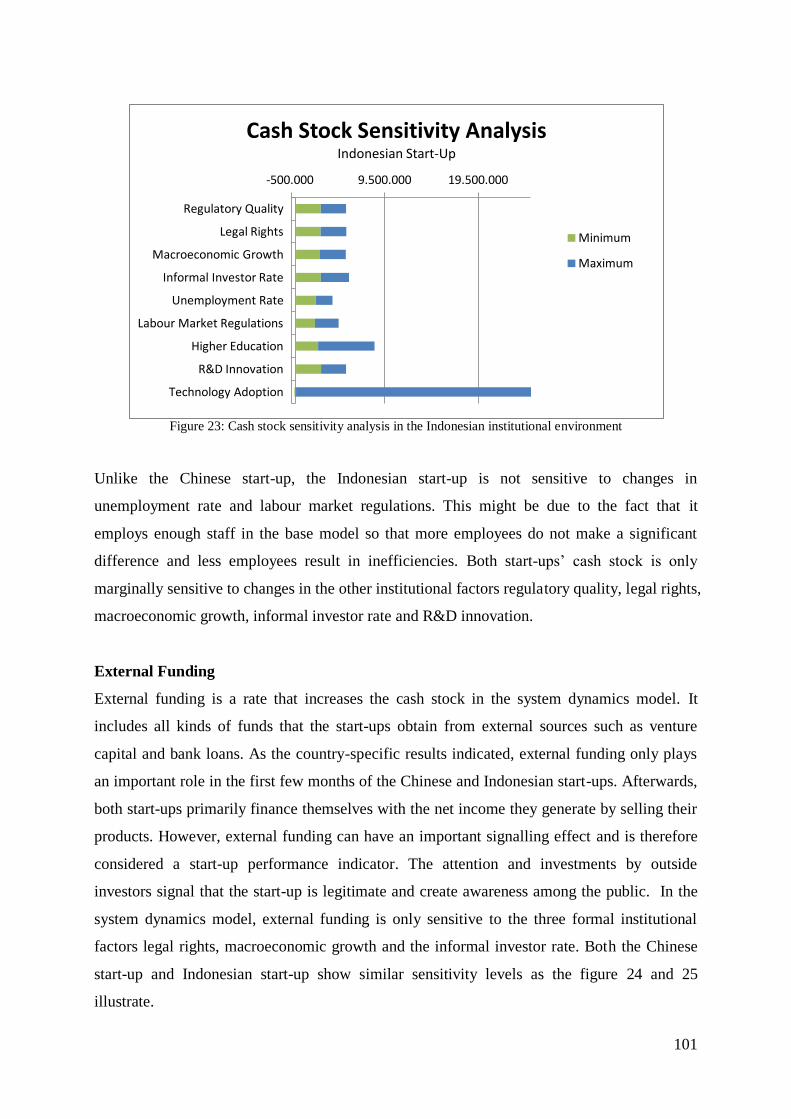
101
Figure 23: Cash stock sensitivity analysis in the Indonesian institutional environment
Unlike the Chinese start-up, the Indonesian start-up is not sensitive to changes in
unemployment rate and labour market regulations. This might be due to the fact that it
employs enough staff in the base model so that more employees do not make a significant
difference and less employees result in inefficiencies. Both start-ups’ cash stock is only
marginally sensitive to changes in the other institutional factors regulatory quality, legal rights,
macroeconomic growth, informal investor rate and R&D innovation.
External Funding
External funding is a rate that increases the cash stock in the system dynamics model. It
includes all kinds of funds that the start-ups obtain from external sources such as venture
capital and bank loans. As the country-specific results indicated, external funding only plays
an important role in the first few months of the Chinese and Indonesian start-ups. Afterwards,
both start-ups primarily finance themselves with the net income they generate by selling their
products. However, external funding can have an important signalling effect and is therefore
considered a start-up performance indicator. The attention and investments by outside
investors signal that the start-up is legitimate and create awareness among the public. In the
system dynamics model, external funding is only sensitive to the three formal institutional
factors legal rights, macroeconomic growth and the informal investor rate. Both the Chinese
start-up and Indonesian start-up show similar sensitivity levels as the figure 24 and 25
illustrate.
-500.000 9.500.000 19.500.000
Regulatory Quality
Legal Rights
Macroeconomic Growth
Informal Investor Rate
Unemployment Rate
Labour Market Regulations
Higher Education
R&D Innovation
Technology Adoption
Cash Stock Sensitivity Analysis Indonesian Start-Up
Minimum
Maximum
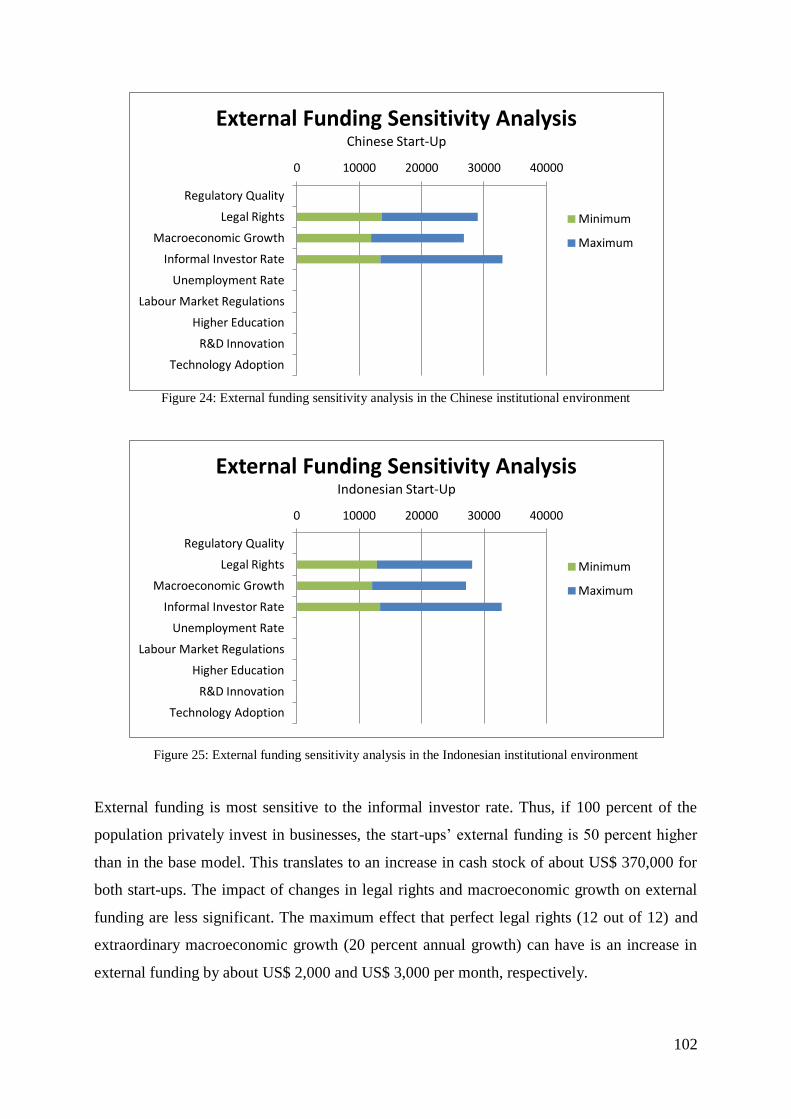
102
Figure 24: External funding sensitivity analysis in the Chinese institutional environment
Figure 25: External funding sensitivity analysis in the Indonesian institutional environment
External funding is most sensitive to the informal investor rate. Thus, if 100 percent of the
population privately invest in businesses, the start-ups’ external funding is 50 percent higher
than in the base model. This translates to an increase in cash stock of about US$ 370,000 for
both start-ups. The impact of changes in legal rights and macroeconomic growth on external
funding are less significant. The maximum effect that perfect legal rights (12 out of 12) and
extraordinary macroeconomic growth (20 percent annual growth) can have is an increase in
external funding by about US$ 2,000 and US$ 3,000 per month, respectively.
0 10000 20000 30000 40000
Regulatory Quality
Legal Rights
Macroeconomic Growth
Informal Investor Rate
Unemployment Rate
Labour Market Regulations
Higher Education
R&D Innovation
Technology Adoption
External Funding Sensitivity Analysis Indonesian Start-Up
Minimum
Maximum
0 10000 20000 30000 40000
Regulatory Quality
Legal Rights
Macroeconomic Growth
Informal Investor Rate
Unemployment Rate
Labour Market Regulations
Higher Education
R&D Innovation
Technology Adoption
External Funding Sensitivity Analysis Chinese Start-Up
Minimum
Maximum
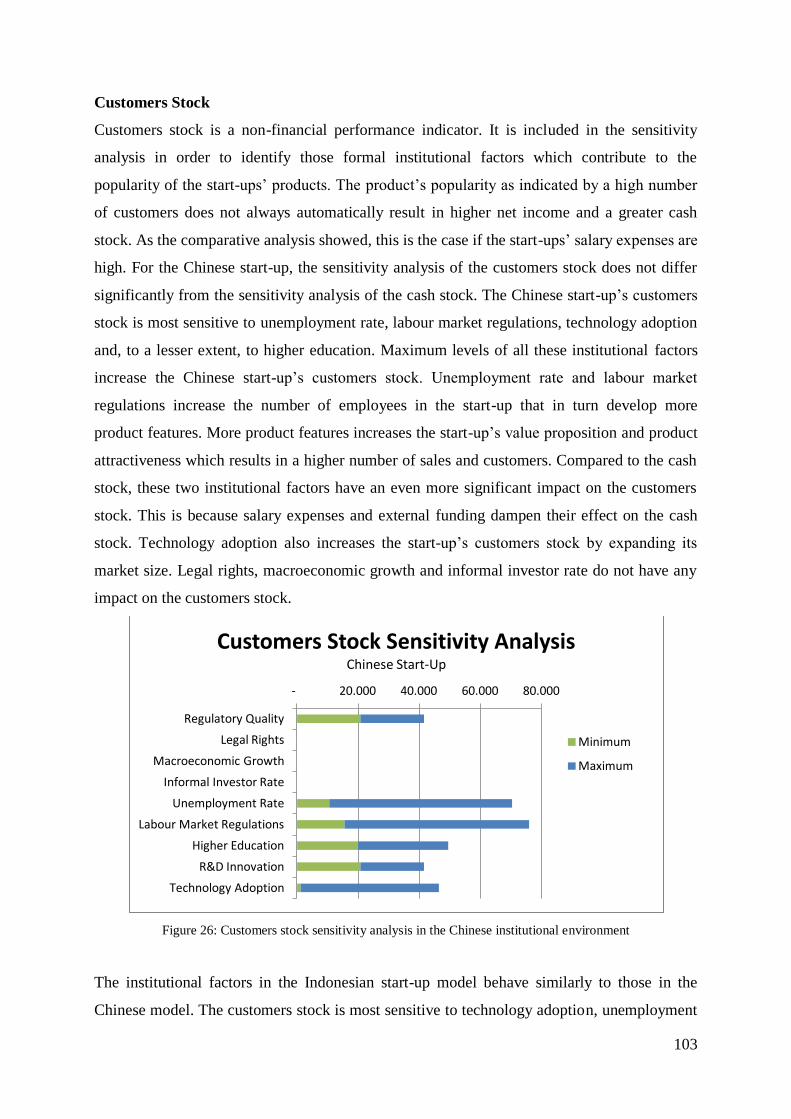
103
Customers Stock
Customers stock is a non-financial performance indicator. It is included in the sensitivity
analysis in order to identify those formal institutional factors which contribute to the
popularity of the start-ups’ products. The product’s popularity as indicated by a high number
of customers does not always automatically result in higher net income and a greater cash
stock. As the comparative analysis showed, this is the case if the start-ups’ salary expenses are
high. For the Chinese start-up, the sensitivity analysis of the customers stock does not differ
significantly from the sensitivity analysis of the cash stock. The Chinese start-up’s customers
stock is most sensitive to unemployment rate, labour market regulations, technology adoption
and, to a lesser extent, to higher education. Maximum levels of all these institutional factors
increase the Chinese start-up’s customers stock. Unemployment rate and labour market
regulations increase the number of employees in the start-up that in turn develop more
product features. More product features increases the start-up’s value proposition and product
attractiveness which results in a higher number of sales and customers. Compared to the cash
stock, these two institutional factors have an even more significant impact on the customers
stock. This is because salary expenses and external funding dampen their effect on the cash
stock. Technology adoption also increases the start-up’s customers stock by expanding its
market size. Legal rights, macroeconomic growth and informal investor rate do not have any
impact on the customers stock.
Figure 26: Customers stock sensitivity analysis in the Chinese institutional environment
The institutional factors in the Indonesian start-up model behave similarly to those in the
Chinese model. The customers stock is most sensitive to technology adoption, unemployment
- 20.000 40.000 60.000 80.000
Regulatory Quality
Legal Rights
Macroeconomic Growth
Informal Investor Rate
Unemployment Rate
Labour Market Regulations
Higher Education
R&D Innovation
Technology Adoption
Customers Stock Sensitivity Analysis Chinese Start-Up
Minimum
Maximum
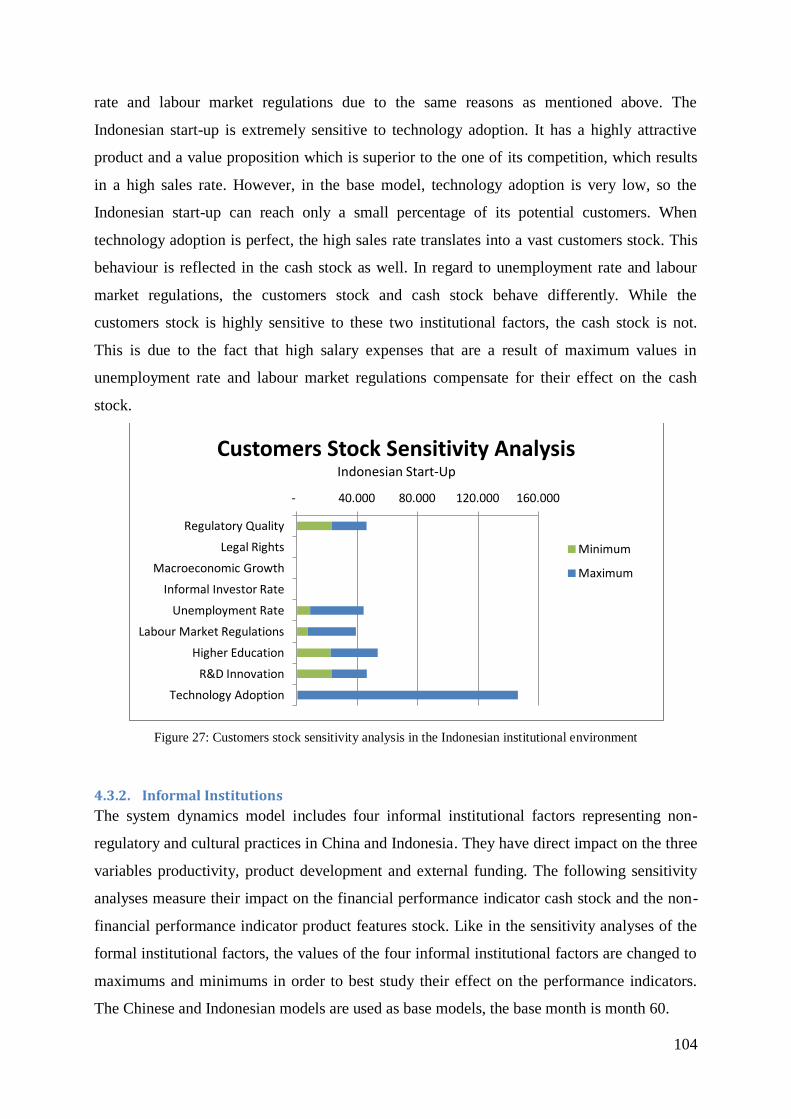
104
rate and labour market regulations due to the same reasons as mentioned above. The
Indonesian start-up is extremely sensitive to technology adoption. It has a highly attractive
product and a value proposition which is superior to the one of its competition, which results
in a high sales rate. However, in the base model, technology adoption is very low, so the
Indonesian start-up can reach only a small percentage of its potential customers. When
technology adoption is perfect, the high sales rate translates into a vast customers stock. This
behaviour is reflected in the cash stock as well. In regard to unemployment rate and labour
market regulations, the customers stock and cash stock behave differently. While the
customers stock is highly sensitive to these two institutional factors, the cash stock is not.
This is due to the fact that high salary expenses that are a result of maximum values in
unemployment rate and labour market regulations compensate for their effect on the cash
stock.
Figure 27: Customers stock sensitivity analysis in the Indonesian institutional environment
4.3.2. Informal Institutions
The system dynamics model includes four informal institutional factors representing non-
regulatory and cultural practices in China and Indonesia. They have direct impact on the three
variables productivity, product development and external funding. The following sensitivity
analyses measure their impact on the financial performance indicator cash stock and the non-
financial performance indicator product features stock. Like in the sensitivity analyses of the
formal institutional factors, the values of the four informal institutional factors are changed to
maximums and minimums in order to best study their effect on the performance indicators.
The Chinese and Indonesian models are used as base models, the base month is month 60.
- 40.000 80.000 120.000 160.000
Regulatory Quality
Legal Rights
Macroeconomic Growth
Informal Investor Rate
Unemployment Rate
Labour Market Regulations
Higher Education
R&D Innovation
Technology Adoption
Customers Stock Sensitivity Analysis Indonesian Start-Up
Minimum
Maximum
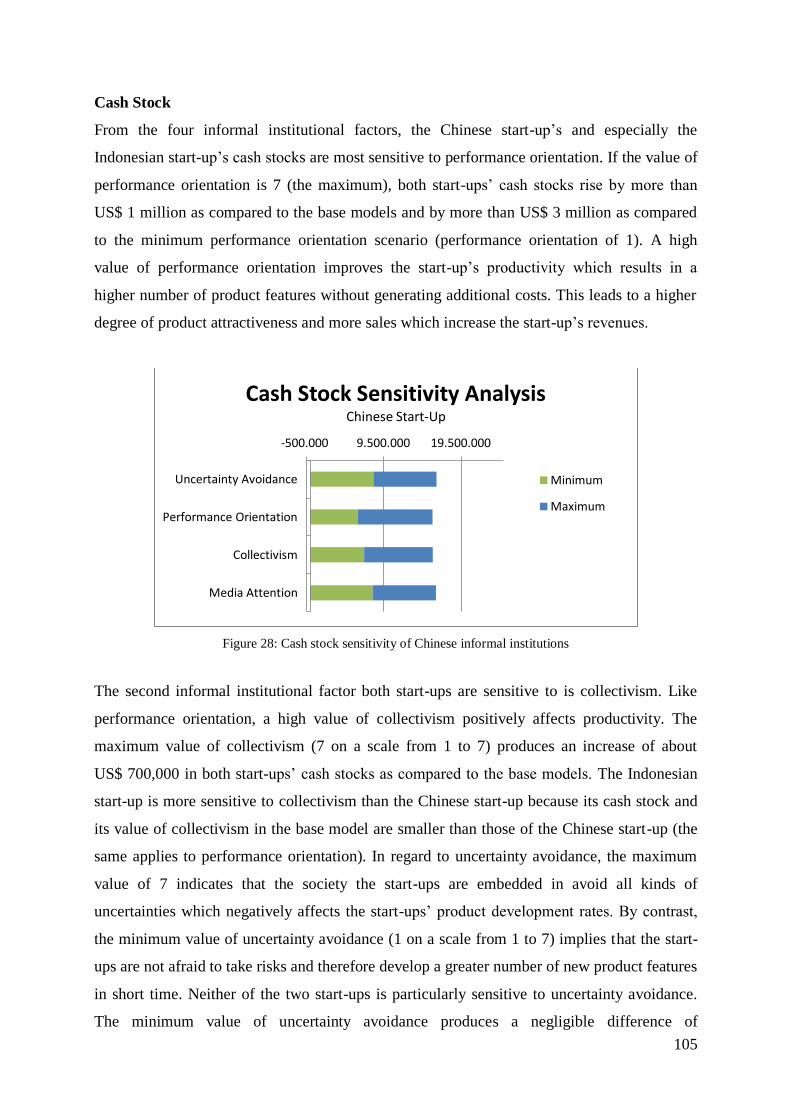
105
Cash Stock
From the four informal institutional factors, the Chinese start-up’s and especially the
Indonesian start-up’s cash stocks are most sensitive to performance orientation. If the value of
performance orientation is 7 (the maximum), both start-ups’ cash stocks rise by more than
US$ 1 million as compared to the base models and by more than US$ 3 million as compared
to the minimum performance orientation scenario (performance orientation of 1). A high
value of performance orientation improves the start-up’s productivity which results in a
higher number of product features without generating additional costs. This leads to a higher
degree of product attractiveness and more sales which increase the start-up’s revenues.
Figure 28: Cash stock sensitivity of Chinese informal institutions
The second informal institutional factor both start-ups are sensitive to is collectivism. Like
performance orientation, a high value of collectivism positively affects productivity. The
maximum value of collectivism (7 on a scale from 1 to 7) produces an increase of about
US$ 700,000 in both start-ups’ cash stocks as compared to the base models. The Indonesian
start-up is more sensitive to collectivism than the Chinese start-up because its cash stock and
its value of collectivism in the base model are smaller than those of the Chinese start-up (the
same applies to performance orientation). In regard to uncertainty avoidance, the maximum
value of 7 indicates that the society the start-ups are embedded in avoid all kinds of
uncertainties which negatively affects the start-ups’ product development rates. By contrast,
the minimum value of uncertainty avoidance (1 on a scale from 1 to 7) implies that the start-
ups are not afraid to take risks and therefore develop a greater number of new product features
in short time. Neither of the two start-ups is particularly sensitive to uncertainty avoidance.
The minimum value of uncertainty avoidance produces a negligible difference of
-500.000 9.500.000 19.500.000
Uncertainty Avoidance
Performance Orientation
Collectivism
Media Attention
Cash Stock Sensitivity Analysis Chinese Start-Up
Minimum
Maximum
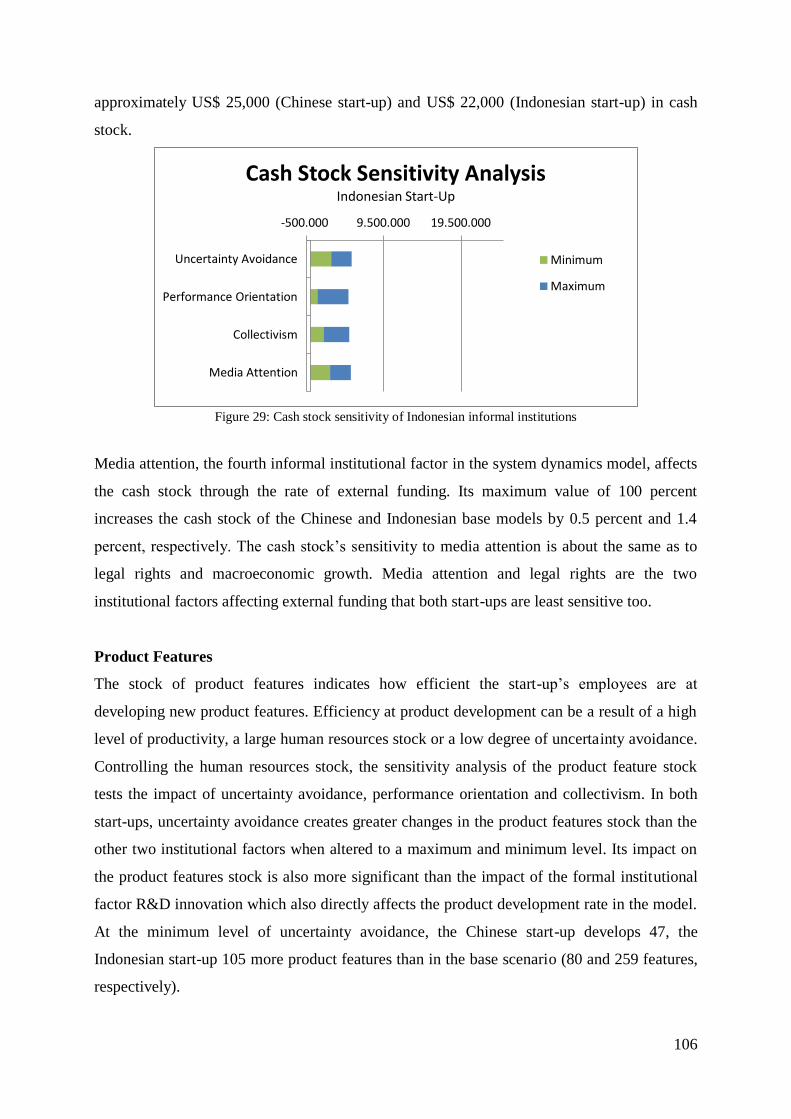
106
approximately US$ 25,000 (Chinese start-up) and US$ 22,000 (Indonesian start-up) in cash
stock.
Figure 29: Cash stock sensitivity of Indonesian informal institutions
Media attention, the fourth informal institutional factor in the system dynamics model, affects
the cash stock through the rate of external funding. Its maximum value of 100 percent
increases the cash stock of the Chinese and Indonesian base models by 0.5 percent and 1.4
percent, respectively. The cash stock’s sensitivity to media attention is about the same as to
legal rights and macroeconomic growth. Media attention and legal rights are the two
institutional factors affecting external funding that both start-ups are least sensitive too.
Product Features
The stock of product features indicates how efficient the start-up’s employees are at
developing new product features. Efficiency at product development can be a result of a high
level of productivity, a large human resources stock or a low degree of uncertainty avoidance.
Controlling the human resources stock, the sensitivity analysis of the product feature stock
tests the impact of uncertainty avoidance, performance orientation and collectivism. In both
start-ups, uncertainty avoidance creates greater changes in the product features stock than the
other two institutional factors when altered to a maximum and minimum level. Its impact on
the product features stock is also more significant than the impact of the formal institutional
factor R&D innovation which also directly affects the product development rate in the model.
At the minimum level of uncertainty avoidance, the Chinese start-up develops 47, the
Indonesian start-up 105 more product features than in the base scenario (80 and 259 features,
respectively).
-500.000 9.500.000 19.500.000
Uncertainty Avoidance
Performance Orientation
Collectivism
Media Attention
Cash Stock Sensitivity Analysis Indonesian Start-Up
Minimum
Maximum
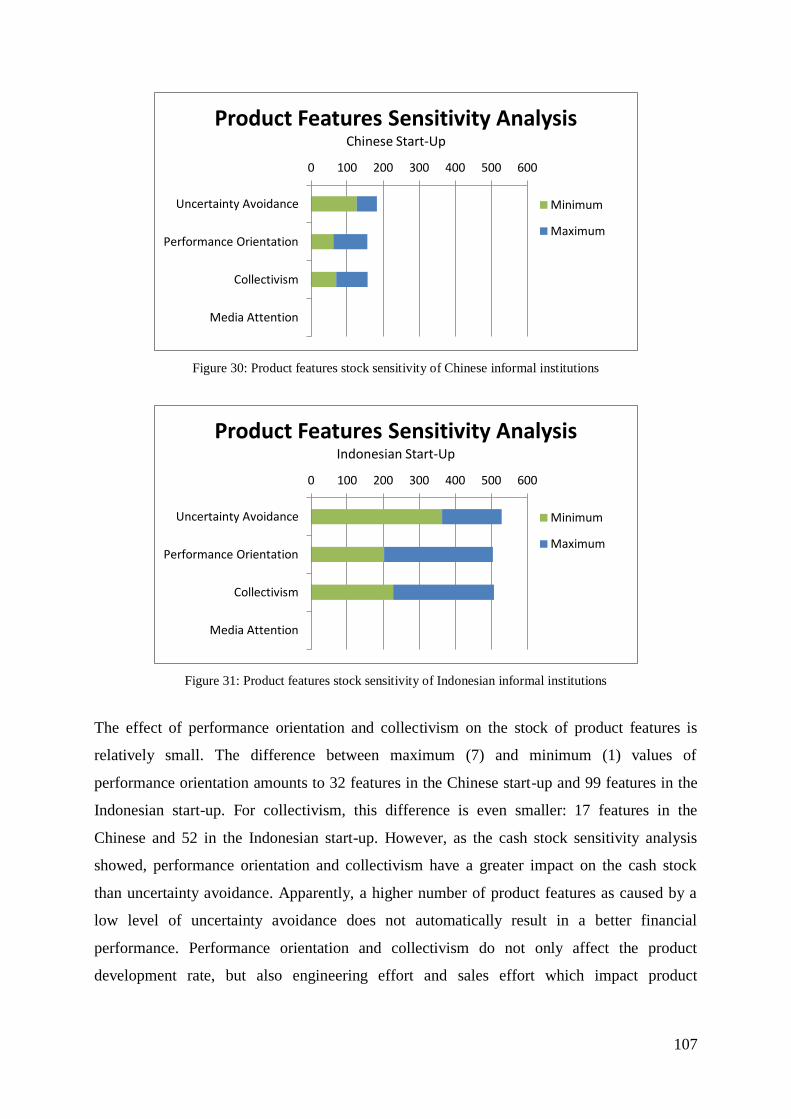
107
Figure 30: Product features stock sensitivity of Chinese informal institutions
Figure 31: Product features stock sensitivity of Indonesian informal institutions
The effect of performance orientation and collectivism on the stock of product features is
relatively small. The difference between maximum (7) and minimum (1) values of
performance orientation amounts to 32 features in the Chinese start-up and 99 features in the
Indonesian start-up. For collectivism, this difference is even smaller: 17 features in the
Chinese and 52 in the Indonesian start-up. However, as the cash stock sensitivity analysis
showed, performance orientation and collectivism have a greater impact on the cash stock
than uncertainty avoidance. Apparently, a higher number of product features as caused by a
low level of uncertainty avoidance does not automatically result in a better financial
performance. Performance orientation and collectivism do not only affect the product
development rate, but also engineering effort and sales effort which impact product
0 100 200 300 400 500 600
Uncertainty Avoidance
Performance Orientation
Collectivism
Media Attention
Product Features Sensitivity Analysis Chinese Start-Up
Minimum
Maximum
0 100 200 300 400 500 600
Uncertainty Avoidance
Performance Orientation
Collectivism
Media Attention
Product Features Sensitivity Analysis Indonesian Start-Up
Minimum
Maximum
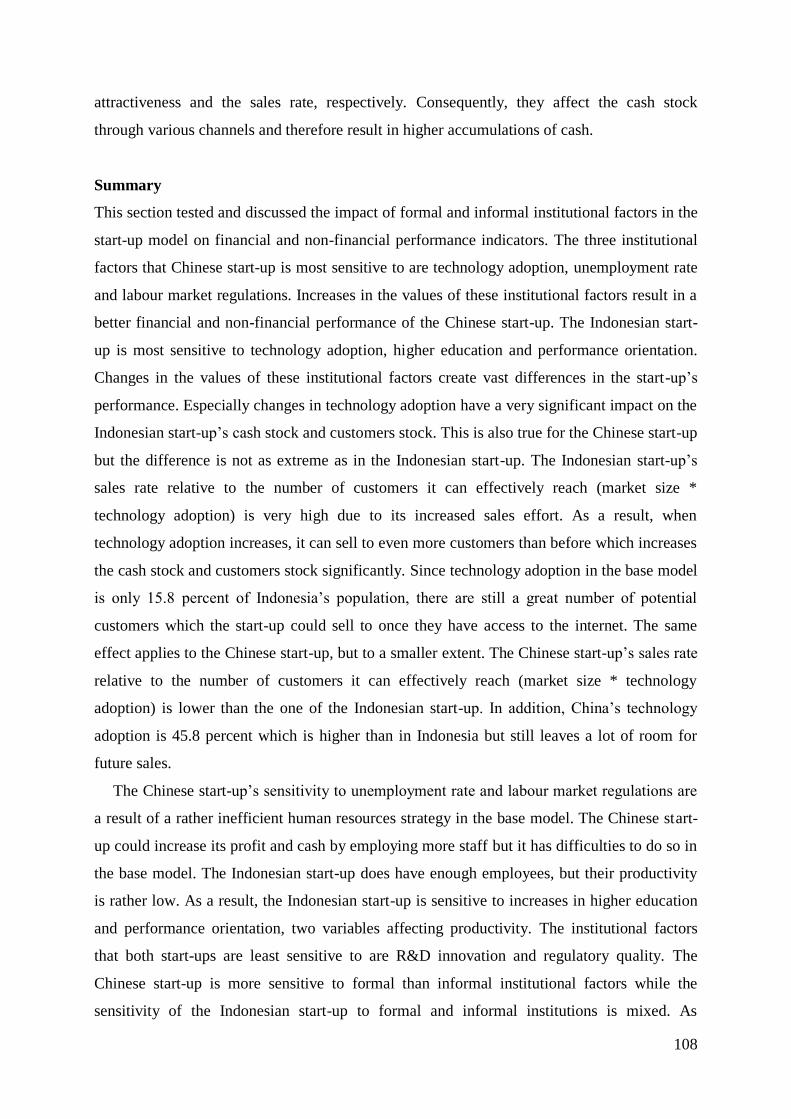
108
attractiveness and the sales rate, respectively. Consequently, they affect the cash stock
through various channels and therefore result in higher accumulations of cash.
Summary
This section tested and discussed the impact of formal and informal institutional factors in the
start-up model on financial and non-financial performance indicators. The three institutional
factors that Chinese start-up is most sensitive to are technology adoption, unemployment rate
and labour market regulations. Increases in the values of these institutional factors result in a
better financial and non-financial performance of the Chinese start-up. The Indonesian start-
up is most sensitive to technology adoption, higher education and performance orientation.
Changes in the values of these institutional factors create vast differences in the start-up’s
performance. Especially changes in technology adoption have a very significant impact on the
Indonesian start-up’s cash stock and customers stock. This is also true for the Chinese start-up
but the difference is not as extreme as in the Indonesian start-up. The Indonesian start-up’s
sales rate relative to the number of customers it can effectively reach (market size *
technology adoption) is very high due to its increased sales effort. As a result, when
technology adoption increases, it can sell to even more customers than before which increases
the cash stock and customers stock significantly. Since technology adoption in the base model
is only 15.8 percent of Indonesia’s population, there are still a great number of potential
customers which the start-up could sell to once they have access to the internet. The same
effect applies to the Chinese start-up, but to a smaller extent. The Chinese start-up’s sales rate
relative to the number of customers it can effectively reach (market size * technology
adoption) is lower than the one of the Indonesian start-up. In addition, China’s technology
adoption is 45.8 percent which is higher than in Indonesia but still leaves a lot of room for
future sales.
The Chinese start-up’s sensitivity to unemployment rate and labour market regulations are
a result of a rather inefficient human resources strategy in the base model. The Chinese start-
up could increase its profit and cash by employing more staff but it has difficulties to do so in
the base model. The Indonesian start-up does have enough employees, but their productivity
is rather low. As a result, the Indonesian start-up is sensitive to increases in higher education
and performance orientation, two variables affecting productivity. The institutional factors
that both start-ups are least sensitive to are R&D innovation and regulatory quality. The
Chinese start-up is more sensitive to formal than informal institutional factors while the
sensitivity of the Indonesian start-up to formal and informal institutions is mixed. As
109
mentioned above, the Indonesian start-up is quite sensitive to performance orientation and, to
a lesser extent, to collectivism. These results again show differences between the Chinese and
Indonesian start-up and support the theory on the influence of the institutional environment on
start-up performance.
4.4. Discussion of Findings This chapter discusses the findings of this thesis and makes connections between the results of
the analysis, the theoretical framework and the two research questions. The discussion is
presented in five sections. First, the performance of technology based start-ups in China and
Indonesia is discussed and compared. This will allow to subsequently answer the first
research question. The findings on institutional factors affecting the performance of
technology based start-ups in China and Indonesia will follow. These findings constitute the
basis for answering the second research question. Next, a strategy recommendation for start-
ups in China and Indonesia will be given. Similarly, policy recommendations with the
objective of improving the situation of start-ups in both countries are then presented. Finally,
the limitations of this thesis are discussed.
The Performance of Technology Based Start-Ups in China and Indonesia
According to the strategy tripod by Peng et al. (2008; 2009) discussed in the theoretical
framework of this thesis, the performance of a start-up is a result of firm-specific, industry-
specific and institutional factors. The system dynamics start-up model developed in the
empirical part of this thesis integrates all three kinds of factors. Its basis is the business model
of an information technology start-up whose most important resources are its employees. The
system dynamics model also integrates characteristics of the information technology industry
such as short product (feature) life cycles, intense competition, high fixed and low variable
costs and high margins. Institutional factors in the system dynamics model describe the
relevant institutional environment the start-up is embedded in. Formal institutions represent
regulatory, oftentimes government influenced factors while informal institutional factors
describe normative, cultural factors. Among the formal institutional factors included are
regulatory quality, legal rights, macroeconomic growth, informal investor rate, unemployment
rate, labour market regulations, higher education and technology adoption. Informal
institutions are represented by uncertainty avoidance, performance orientation, collectivism
and media attention. The system dynamics model controls firm- and industry-specific factors
in order to determine in which institutional environment, the Chinese or Indonesian
110
environment, a technology based start-up is more likely to succeed. The duration of the
simulations is 60 months.
The country-specific results and comparative analysis showed that both start-ups survive
the first five years of being in business and are profitable throughout the simulation period. In
financial terms, the start-up in the Chinese institutional environment performs better than the
start-up in the Indonesian context. It achieves a higher net income and accumulates more cash
over the simulation period. According to non-financial performance indicators, the Indonesian
start-up performs better than the Chinese start-up. Its product is more sophisticated and it has
more customers and employees than the Chinese start-up. Furthermore, its value proposition
is better than the competition’s value proposition. This is mainly due to the fact that the
Indonesian start-up employs more staff than the Chinese start-up. A closer look on the reasons
for the superior performance of the Indonesian start-up in terms of non-financial indicators
reveals that the Indonesian start-up only has a more sophisticated product and more customers
because its number of employees is higher than the one of the Chinese start-up. Its
productivity level which also affects product sophistication is not higher than the Chinese
start-up’s productivity level. Similarly, its larger customer base is only a result of an increased
sales effort due to a higher number of sales employees. Consequently, the Indonesian start-up
incurs higher costs than the Chinese start-up due to its high number of employees. The
additional revenues it generates from selling to more customers than the Chinese start-up are
significantly reduced by its salary expenses. As a result, its financial performance is inferior
to the financial performance of the Chinese start-up. The Chinese start-up is therefore
considered to be more successful than the Indonesian start-up even though its product has less
product features and its customer stock is smaller. The Chinese start-up is more of a “lean
start-up” than its Indonesian counterpart and achieves a better financial performance by being
economical with its resources.
Institutional Factors Affecting Start-Up Performance in China and Indonesia
The institutional theory by North (1990) was used as the basis for describing and modelling
the institutional environment with system dynamics. The impact of formal and informal
institutions on start-up performance was then tested with a sensitivity analysis. The
institutional factor which has the most significant impact on the performance of technology
based start-ups in China and Indonesia is technology adoption. In the system dynamics model,
technology adoption is represented by the percentage of the population who have internet
access and affects the effective market size of the start-up. The initial market size of both the
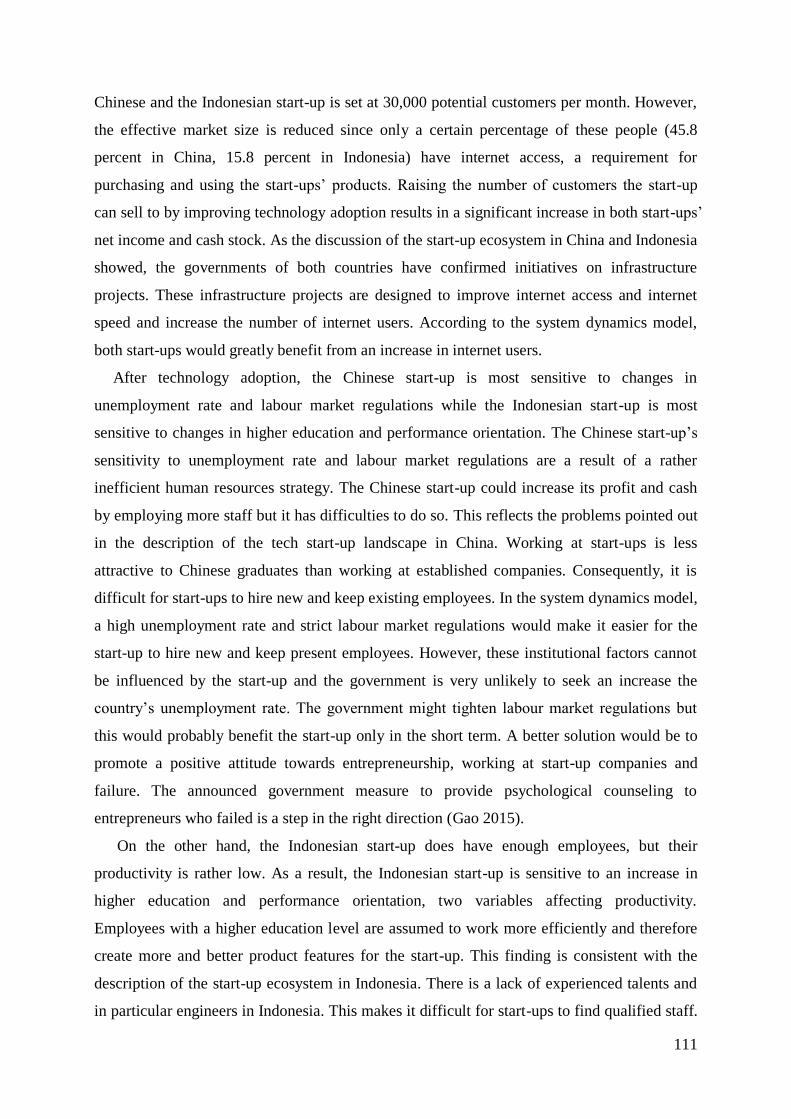
111
Chinese and the Indonesian start-up is set at 30,000 potential customers per month. However,
the effective market size is reduced since only a certain percentage of these people (45.8
percent in China, 15.8 percent in Indonesia) have internet access, a requirement for
purchasing and using the start-ups’ products. Raising the number of customers the start-up
can sell to by improving technology adoption results in a significant increase in both start-ups’
net income and cash stock. As the discussion of the start-up ecosystem in China and Indonesia
showed, the governments of both countries have confirmed initiatives on infrastructure
projects. These infrastructure projects are designed to improve internet access and internet
speed and increase the number of internet users. According to the system dynamics model,
both start-ups would greatly benefit from an increase in internet users.
After technology adoption, the Chinese start-up is most sensitive to changes in
unemployment rate and labour market regulations while the Indonesian start-up is most
sensitive to changes in higher education and performance orientation. The Chinese start-up’s
sensitivity to unemployment rate and labour market regulations are a result of a rather
inefficient human resources strategy. The Chinese start-up could increase its profit and cash
by employing more staff but it has difficulties to do so. This reflects the problems pointed out
in the description of the tech start-up landscape in China. Working at start-ups is less
attractive to Chinese graduates than working at established companies. Consequently, it is
difficult for start-ups to hire new and keep existing employees. In the system dynamics model,
a high unemployment rate and strict labour market regulations would make it easier for the
start-up to hire new and keep present employees. However, these institutional factors cannot
be influenced by the start-up and the government is very unlikely to seek an increase the
country’s unemployment rate. The government might tighten labour market regulations but
this would probably benefit the start-up only in the short term. A better solution would be to
promote a positive attitude towards entrepreneurship, working at start-up companies and
failure. The announced government measure to provide psychological counseling to
entrepreneurs who failed is a step in the right direction (Gao 2015).
On the other hand, the Indonesian start-up does have enough employees, but their
productivity is rather low. As a result, the Indonesian start-up is sensitive to an increase in
higher education and performance orientation, two variables affecting productivity.
Employees with a higher education level are assumed to work more efficiently and therefore
create more and better product features for the start-up. This finding is consistent with the
description of the start-up ecosystem in Indonesia. There is a lack of experienced talents and
in particular engineers in Indonesia. This makes it difficult for start-ups to find qualified staff.
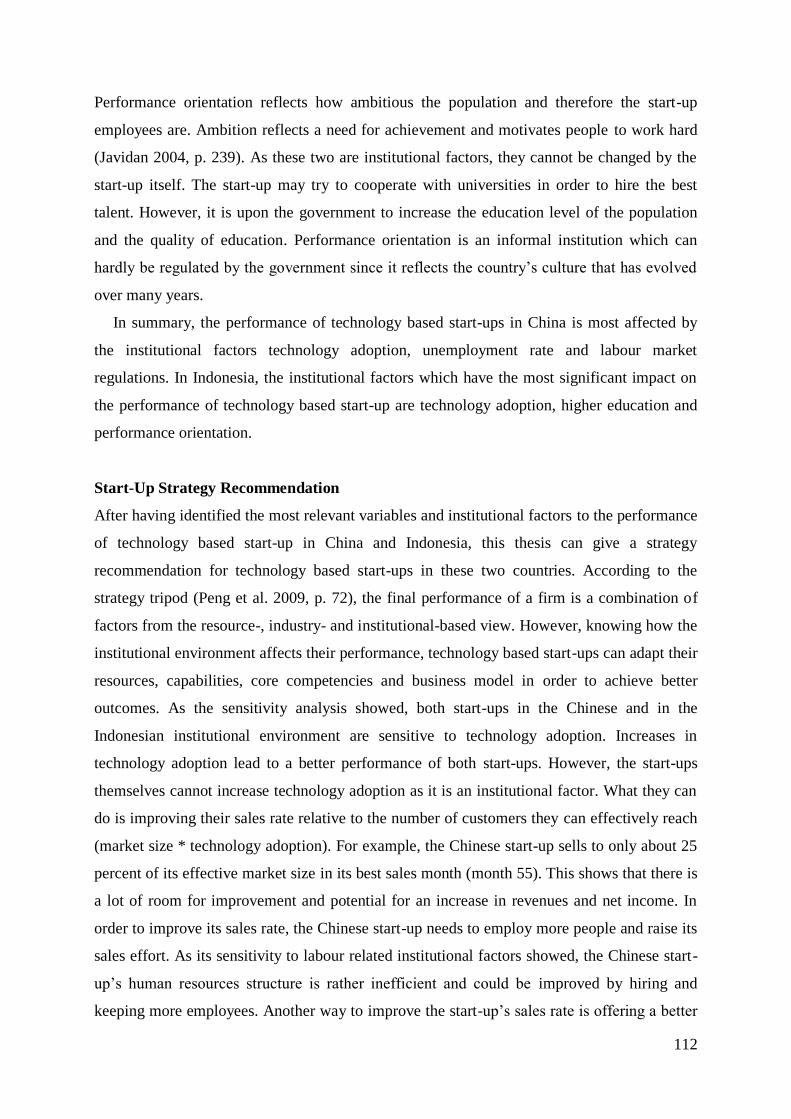
112
Performance orientation reflects how ambitious the population and therefore the start-up
employees are. Ambition reflects a need for achievement and motivates people to work hard
(Javidan 2004, p. 239). As these two are institutional factors, they cannot be changed by the
start-up itself. The start-up may try to cooperate with universities in order to hire the best
talent. However, it is upon the government to increase the education level of the population
and the quality of education. Performance orientation is an informal institution which can
hardly be regulated by the government since it reflects the country’s culture that has evolved
over many years.
In summary, the performance of technology based start-ups in China is most affected by
the institutional factors technology adoption, unemployment rate and labour market
regulations. In Indonesia, the institutional factors which have the most significant impact on
the performance of technology based start-up are technology adoption, higher education and
performance orientation.
Start-Up Strategy Recommendation
After having identified the most relevant variables and institutional factors to the performance
of technology based start-up in China and Indonesia, this thesis can give a strategy
recommendation for technology based start-ups in these two countries. According to the
strategy tripod (Peng et al. 2009, p. 72), the final performance of a firm is a combination of
factors from the resource-, industry- and institutional-based view. However, knowing how the
institutional environment affects their performance, technology based start-ups can adapt their
resources, capabilities, core competencies and business model in order to achieve better
outcomes. As the sensitivity analysis showed, both start-ups in the Chinese and in the
Indonesian institutional environment are sensitive to technology adoption. Increases in
technology adoption lead to a better performance of both start-ups. However, the start-ups
themselves cannot increase technology adoption as it is an institutional factor. What they can
do is improving their sales rate relative to the number of customers they can effectively reach
(market size * technology adoption). For example, the Chinese start-up sells to only about 25
percent of its effective market size in its best sales month (month 55). This shows that there is
a lot of room for improvement and potential for an increase in revenues and net income. In
order to improve its sales rate, the Chinese start-up needs to employ more people and raise its
sales effort. As its sensitivity to labour related institutional factors showed, the Chinese start-
up’s human resources structure is rather inefficient and could be improved by hiring and
keeping more employees. Another way to improve the start-up’s sales rate is offering a better
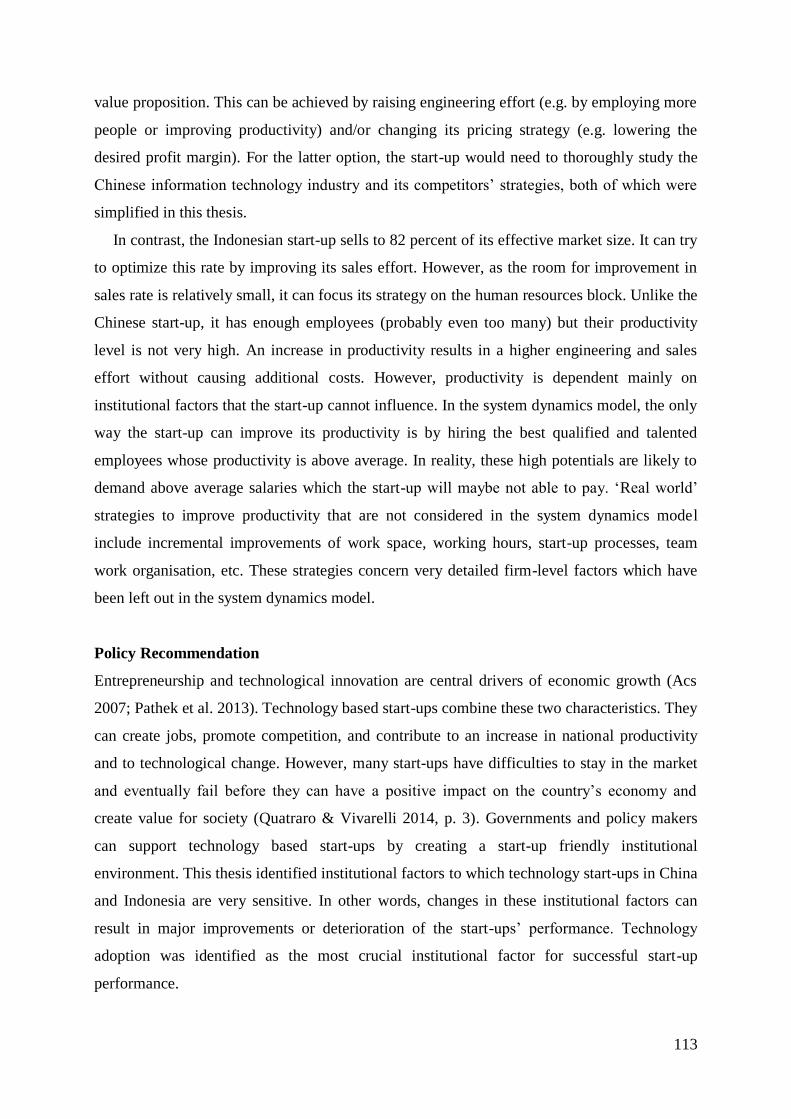
113
value proposition. This can be achieved by raising engineering effort (e.g. by employing more
people or improving productivity) and/or changing its pricing strategy (e.g. lowering the
desired profit margin). For the latter option, the start-up would need to thoroughly study the
Chinese information technology industry and its competitors’ strategies, both of which were
simplified in this thesis.
In contrast, the Indonesian start-up sells to 82 percent of its effective market size. It can try
to optimize this rate by improving its sales effort. However, as the room for improvement in
sales rate is relatively small, it can focus its strategy on the human resources block. Unlike the
Chinese start-up, it has enough employees (probably even too many) but their productivity
level is not very high. An increase in productivity results in a higher engineering and sales
effort without causing additional costs. However, productivity is dependent mainly on
institutional factors that the start-up cannot influence. In the system dynamics model, the only
way the start-up can improve its productivity is by hiring the best qualified and talented
employees whose productivity is above average. In reality, these high potentials are likely to
demand above average salaries which the start-up will maybe not able to pay. ‘Real world’
strategies to improve productivity that are not considered in the system dynamics model
include incremental improvements of work space, working hours, start-up processes, team
work organisation, etc. These strategies concern very detailed firm-level factors which have
been left out in the system dynamics model.
Policy Recommendation
Entrepreneurship and technological innovation are central drivers of economic growth (Acs
2007; Pathek et al. 2013). Technology based start-ups combine these two characteristics. They
can create jobs, promote competition, and contribute to an increase in national productivity
and to technological change. However, many start-ups have difficulties to stay in the market
and eventually fail before they can have a positive impact on the country’s economy and
create value for society (Quatraro & Vivarelli 2014, p. 3). Governments and policy makers
can support technology based start-ups by creating a start-up friendly institutional
environment. This thesis identified institutional factors to which technology start-ups in China
and Indonesia are very sensitive. In other words, changes in these institutional factors can
result in major improvements or deterioration of the start-ups’ performance. Technology
adoption was identified as the most crucial institutional factor for successful start-up
performance.
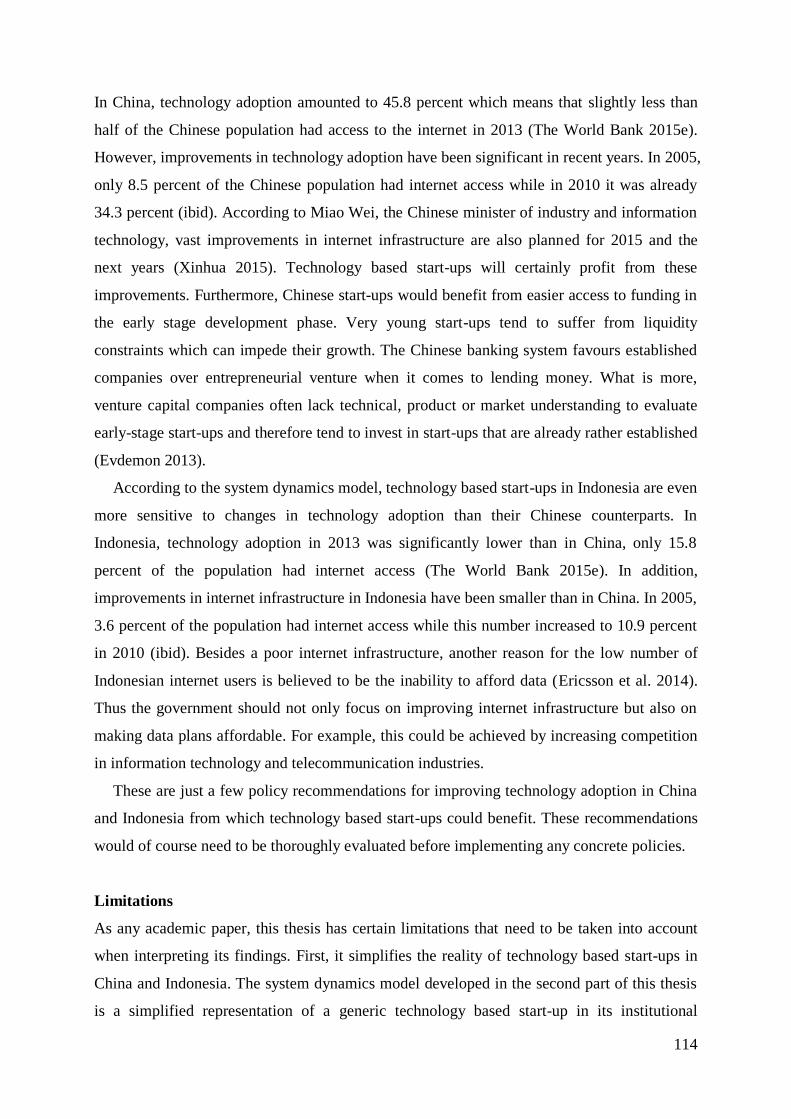
114
In China, technology adoption amounted to 45.8 percent which means that slightly less than
half of the Chinese population had access to the internet in 2013 (The World Bank 2015e).
However, improvements in technology adoption have been significant in recent years. In 2005,
only 8.5 percent of the Chinese population had internet access while in 2010 it was already
34.3 percent (ibid). According to Miao Wei, the Chinese minister of industry and information
technology, vast improvements in internet infrastructure are also planned for 2015 and the
next years (Xinhua 2015). Technology based start-ups will certainly profit from these
improvements. Furthermore, Chinese start-ups would benefit from easier access to funding in
the early stage development phase. Very young start-ups tend to suffer from liquidity
constraints which can impede their growth. The Chinese banking system favours established
companies over entrepreneurial venture when it comes to lending money. What is more,
venture capital companies often lack technical, product or market understanding to evaluate
early-stage start-ups and therefore tend to invest in start-ups that are already rather established
(Evdemon 2013).
According to the system dynamics model, technology based start-ups in Indonesia are even
more sensitive to changes in technology adoption than their Chinese counterparts. In
Indonesia, technology adoption in 2013 was significantly lower than in China, only 15.8
percent of the population had internet access (The World Bank 2015e). In addition,
improvements in internet infrastructure in Indonesia have been smaller than in China. In 2005,
3.6 percent of the population had internet access while this number increased to 10.9 percent
in 2010 (ibid). Besides a poor internet infrastructure, another reason for the low number of
Indonesian internet users is believed to be the inability to afford data (Ericsson et al. 2014).
Thus the government should not only focus on improving internet infrastructure but also on
making data plans affordable. For example, this could be achieved by increasing competition
in information technology and telecommunication industries.
These are just a few policy recommendations for improving technology adoption in China
and Indonesia from which technology based start-ups could benefit. These recommendations
would of course need to be thoroughly evaluated before implementing any concrete policies.
Limitations
As any academic paper, this thesis has certain limitations that need to be taken into account
when interpreting its findings. First, it simplifies the reality of technology based start-ups in
China and Indonesia. The system dynamics model developed in the second part of this thesis
is a simplified representation of a generic technology based start-up in its institutional
115
environment and does not include all firm- and industry-specific characteristics and
institutional factors which might influence the start-up’s performance. In addition, the
relationships between these factors are simplified as well. In reality, they are likely to be
much more complex. Second, firm- and industry-specific factors have the same values for the
Chinese and Indonesian start-up in the system dynamics model. In reality, these factors are
likely to differ between start-ups in two different countries. As the start-up founders have
different cultural backgrounds, values and education, they might organise their start-ups
differently. The structure and characteristics of the information technology industry in China
and Indonesia are also very likely to be different from each other. In the system dynamics
model, they have been heavily simplified and assumed to be the same in both countries. Third,
there are likely to be local differences too. China and Indonesia are both very large countries
with numerous regions, some of which even have different ethnicities, cultures and languages.
Thus firm- and industry-specific and even institutional factors might differ across these
regions. Furthermore, secondary data has been used for the values of institutional factors in
the system dynamics model. Even though the data and indicators used have been carefully
examined and selected, the lack of primary data still represents a limitation to this thesis.
What is more, the start-up model has not been tested with real start-ups. Case studies with
examples of real start-ups would have significantly strengthened the significance of this thesis’
results. However, collecting sensitive business data from start-ups and conducting in-depth
case studies would have gone beyond the scope of this thesis. A PhD thesis could draw on
these aspects as it offers much scope for extensive data collection and detailed analyses.
116
5. Conclusion This thesis discussed the effect of institutional factors on the performance of technology based
start-ups in China and Indonesia. It started out with a theoretical framework on firm strategy
in emerging economies, the influence of institutions on firm performance in emerging
economies, and on firms as systems. The strategy tripod by Peng et al. (2008; 2009) was the
basis of the theoretical framework of this thesis. It is a holistic theory on the strategic
management of firms and combines the resource-based view, industry based-view and
institution-based view of the firm.
In regard to technology based start-ups, the resource-based view revealed that their most
important resources are human resources since technology based start-ups depend heavily on
technological knowledge and skills to create unique firm capabilities and competitive
products. Managing their human resources efficiently may even substitute for a lack of
resources in other areas. The start-ups’ organisational structure plays an important role in this
regard as it affects cooperation and coordination within teams which are both crucial for
developing synergies and creating competitive products. Finally, the start-up’s resources,
capabilities, core competencies and organisational structure need to be translated into a
business model. The theory on e-business models by Osterwalder & Pigneur (2004) has been
chosen to describe the simplified business model of a technology based start-up. It is based on
four pillars (product innovation and value proposition, customer relationship, infrastructure
management, financial aspects) which have been implemented in the system dynamics model
of a start-up in chapter 3.
The industry-based view of technology based start-ups described the main characteristics
of the information technology industry. Companies, including start-ups, operating in the
information technology industry face intense competition and significant uncertainty as the
life cycle of information technology products is short and technologies change rapidly. Due to
easy access to information, entry barriers are decreasing and the imitation and copying of
information technology products are easy which can result in violations of intellectual
property rights. In regard to costs and pricing, information technology products have high
fixed costs but low marginal costs. First time production is expensive but reproduction is
comparatively cheap.
The third pillar of the strategy tripod, the institution-based view, was discussed more
thoroughly as it represents the main topic of this thesis. The discussion was primarily based
on North’s (1990) institutional theory. Previous research on technology based start-ups has
often taken the institutional context for granted and assumed that once an entrepreneur finds
117
an opportunity, the institutional context will be supportive (Woolley 2014, p. 741). However,
the institutional context of technology entrepreneurship in emerging economies is not always
supportive and can affect start-ups in various ways. Technology based start-ups in emerging
economies often face challenges in regard to the enforcement of (intellectual) property rights,
laws and regulations, corruption and bureaucracy and financial possibilities. In addition, it can
be difficult for technology based start-ups in emerging economies to find and keep qualified
labour as employees with higher education are rare. What is more, the technological
infrastructure is still underdeveloped or even restricted by authoritative governments in some
emerging economies. Besides these formal institutional factors, the performance of
technology based start-ups can also be affected by informal institutional factors such as the
country’s culture, customs and values. In regard to technology entrepreneurship, the informal
institutional factors most prominent in research are cultural aspects such as uncertainty
avoidance, fear of failure, performance orientation, individualism and collectivism (Salimath
& Cullen 2010). Uncertainty avoidance and fear of failure were found to impede
entrepreneurship and restrict post-entry growth of start-up businesses. In contrast,
performance orientation affects start-up performance in a positive way as it spurs
entrepreneurs to strive hard. Contrary to common belief, collectivism does not necessarily
have a negative effect on entrepreneurship. It may even affect the performance of start-ups in
a positive way. Media attention was the fourth informal institutional factors discussed in this
thesis. It affects the performance of start-ups by providing start-ups with legitimacy and
increasing social transparency. As Busenitz et al. (2000, p. 995) put it, formal and informal
institutions need to be seen together in order to explain firm performance and cross-national
differences in entrepreneurship.
The last pillar of this thesis’ theoretical framework was system theory. The discussion of
system theory provided the basis for understanding the start-up model developed in chapter 3.
From a system theory perspective, a technology based start-up is seen as a system that is part
of larger systems such as the information technology industry, the business sector, the
economy, etc. It constantly interacts with its environment and is controlled by the
management that sets targets and organises activities. The concept of system dynamics, a
methodology based on system theory, allows simulating this situation.
Based on this framework, this thesis proceeded to develop a model of a generic start-up in
its institutional environment using system dynamics. The model simulated a technology based
start-up that is influenced by industry specific variables and institutional factors over a period
of five years. It included nine formal and four informal institutional factors. Two simulations
118
were conducted. First, the generic start-up was simulated in the Chinese institutional
environment and then the same generic start-up was simulated in the Indonesian institutional
environment. The start-up specific variables such as initial number of product features,
desired profit margin, average salary, etc. have been kept equal for both simulations in order
to examine differences in the effect of institutional factors on start-up performance. The
research questions this thesis sought to answer based on the theoretical framework and the
start-up model are:
Given the same business model, is a technology based start-up more likely to succeed
in China or Indonesia?
Which are the most critical institutional factors influencing the performance of a
technology based start-up in China and Indonesia?
The analyses of the start-up simulation results in chapter 4 provided valuable findings which
answer the first research question as follows: Given the same business model, a technology
based start-up is likely to succeed in both China and Indonesia. At the same time, it is likely
be more financially successful in China than in Indonesia. The discussion of the country-
specific results in chapter 4.1 and the comparative analyses in chapter 4.2 showed that the
start-up in the Indonesian institutional environment performed better than the start-up in the
Chinese institutional environment in regard to non-financial indicators. The Indonesian start-
up had a more sophisticated product and a larger customer base but due to its excessive
number of staff, it incurred high costs which dampened its financial performance. The
Chinese start-up resembled a “lean start-up” as it had fewer employees than the Indonesian
start-up but at the same time a slightly higher level of productivity. This resulted in superior
financial performance despite its lower number of customers and product features.
Chapter 4.3 analysed both start-ups’ sensitivity to the nine formal and four informal
institutional factors of the model and sought to identify the most critical institutional factors
influencing start-up performance. Its findings provide an answer to the second research
question: The performance of technology based start-ups in China is most affected by the
institutional factors technology adoption, unemployment rate and labour market regulations.
In Indonesia, the institutional factors which have the most significant impact on the
performance of technology based start-ups are technology adoption, higher education and
performance orientation. On the basis of these findings, strategy recommendations for start-
ups and policy recommendations were given.
119
This thesis has some implications for linking institutional theory with the analysis of
technology based start-ups in future research. Its approach to analyse technology based start-
ups in the institutional environment of two emerging economies by building a model in
system dynamics was the first of its kind. As discussed in chapter 1.4 on the state of the art,
research on technology entrepreneurship tends to take a supportive institutional environment
for granted. This is probably due to the fact that most research on technology entrepreneurship
is conducted by scholars in the USA, Europe or other developed countries and focused on
start-ups in these countries. Since their institutional environment is generally supportive of
technology based start-ups, research focuses on other aspects of technology entrepreneurship
such as personality traits, attitudes, human and social capital, etc. In emerging and developing
economies, technology based start-ups tend to face a less benevolent institutional environment
which can significantly affect their performance. This thesis provides valuable findings on the
effect of institutional factors on the performance of technology based start-ups in the two
emerging economies China and Indonesia. Furthermore, it used an innovative methodology to
examine its research topic. Although system dynamics was developed many years ago, it is
not widely used outside the system theory and cybernetics community. This may be due to the
fact that developing models with system dynamics is a time-consuming and very challenging
task that is also prone to simplifications and errors in reasoning. However, system dynamics is
a very useful method to examine social systems such as companies. It allows the inclusion of
a great number of variables, feedback loops and time delays. By using system dynamics to
develop a model of a start-up, this thesis makes a valuable contribution to interdisciplinary
research and innovative research methodology in social sciences.
120
Bibliography Acs, Zoltan J. 2007. How is entrepreneurship good for economic growth? Zurich: Progress
Foundation.
Ahlstrom, David/Bruton, Gary D. 2006. Venture capital in emerging economies: Networks and
institutional change. Entrepreneurship Theory and Practice 30 (2), pp. 299-320.
Aidis, Ruta. 2005. Institutional barriers to small- and medium-sized enterprise operations in transition
countries. Small Business Economics 25 (4), pp. 305-318.
Alexy, Oliver T./Block, Joern H./Sandner, Philipp/Ter Wal, Anne L.J. 2012. Social capital of venture
capitalists and start-ups funding. Small Business Economics 39 (4), pp. 835-851.
Allen, John C. 1992. Starting a technology business. London: Pitman.
Almeida, Shamika/Fernando, Mario. 2008. Survival strategies and characteristics of start-ups: An
empirical study from the New Zealand IT industry. Technovation 28 (3), pp. 161-169.
Amit, Raphael/Zott, Christoph. 2001. Value creation in e-business. Strategic Management Journal 22
(6/7), pp. 493-520.
Ardichvili, Alexander/Cardozo, Richard/Ray, Sourav. 2003. A theory of entrepreneurial opportunity
identification and development. Journal of Business Venturing 18 (1), pp. 105–123.
Aterido, Reyes/Hallward-Driemeier, Mary/Pagés, Carmen. 2009. Big constraints to small firms’
growth? Business environment and employment growth across firms. Policy Research
Working Paper 5032. Washington DC: World Bank, Policy Research Department.
Autio, Erkko/Pathak, Saurav/Wennberg, Karl. 2013. Consequences of cultural practices for
entrepreneurial behaviors. Journal of International Business Studies 44 (4), pp. 334-362.
Barney, Jay B. 1991. Firm resources and sustainable competitive advantage. Journal of Management
17 (1), pp. 99-120.
Barney, Jay B. 2001. Is the resource-based “view” a useful perspective for strategic management
research? Yes. Academy of Management Review 26 (1), pp. 41–56.
Baron, James N./Hannan, Michael T. 2002. Organizational blueprints for success in high-tech start-
ups: Lessons from the Stanford project on emerging companies. California Management
Review 44 (3), pp. 8-36.
Baumol, William J. 1968. Entrepreneurship in economic theory. American Economic Review 58 (2),
pp. 64-71.
Beer, Stafford. 1967. Kybernetik und Management. Frankfurt: S. Fischer Verlag.
Beer, Stafford. 1984. The Viable System Model: Its Provenance, Development, Methodology and
Pathology. The Journal of the Operational Research Society 35 (1), pp. 7-25.
121
Begley, Thomas M./Tan, Wee-Liang. 2001. The socio-cultural environment for entrepreneurship: A
comparison between East Asian and Anglo-Saxon countries. Journal of International Business
Studies 32 (3), pp. 537-553.
Belso-Martinez, Jose A./Molina-Morales, F. Xavier/Mas-Verdu, Francisco. 2013. Combining effects
of internal resources, entrepreneur characteristics and KIS on new firms. Journal of Business
Research 66 (10), pp. 2079-2089.
Bhaumik, Sumon Kumar/Zhou, Ying. 2014. Do business groups help or hinder technological progress
in emerging markets? Evidence from India. IZA Discussion Paper No. 7885.
Billon, Margarita/Lera-Lopez, Fernando/Marco, Rocío. 2010. Differences in digitalization levels: A
multivariate analysis studying the global digital divide. Review of World Economics 146 (1),
pp. 39-73.
Blettner, Daniela P./He, Zi-Lin/Hu, Songcui/Bettis, Richard A. 2015. Adaptive aspirations and
performance heterogeneity: Attention allocation among multiple reference points. Strategic
Management Journal, article in press.
Bloodgood, James M./Hornsby, Jeffrey S./Burkemper, Andrew C./Sarooghi, Hessam. 2015. A system
dynamics perspective of corporate entrepreneurship. Small Business Economics, article in
press.
Boediman, Andi S. 2015. 7 building blocks to foster Indonesia’s startup ecosystem. Tech in Asia, 1
March 2015. Retrieved from: https://www.techinasia.com/7-building-blocks-indonesia-
startup-ecosystem on 3 July 2015.
Box, Marcus. 2008. The death of firms: Exploring the effects of environment and birth cohort on firm
survival in Sweden. Small Business Economics 31 (4), pp. 379-393.
Bruton, Garry D./Ahlstrom, David/Li, Han-Lin. 2010. Institutional theory and entrepreneurship:
Where are we now and where do we need to move in the future? Entrepreneurship Theory and
Practice 34 (3), pp. 421-440.
Bruton, Garry D./Ahlstrom, David/Obloj, Krzysztof. 2008. Entrepreneurship in emerging economies:
Where are we today and where should the research go in the future. Entrepreneurship Theory
and Practice 32 (1), pp. 1-14.
Busenitz, Lowell W./Gómez, Carolina/Spencer, Jennifer W. 2000. Country institutional profiles:
Unlocking entrepreneurial phenomena. Academy of Management Journal 43 (5), pp. 994-1003.
Castrogiovanni, Gary J. 1991. Environmental munificence: A theoretical assessment. The Academy of
Management Review 16 (3), pp. 542-565.
Chacar, Aya S./Newburry, William/Vissa, Balagopal. 2010. Bringing institutions into performance
persistence research: Exploring the impact of product, financial, and labor market institutions.
Journal of International Business Studies 41 (7), pp. 1119-1140.
122
Chen, David/Stroup, Walter. 1993. General system theory: Toward a conceptual framework for
science and technology education for all. Journal of Science Education and Technology 2 (3),
pp. 447-459.
Chen, Kevin I. 2013. The web behind the wall explains China’s complicated startup industry.
Techcrunch, 29 October 2013. Retrieved from: http://techcrunch.com/2013/10/29/the-web-
behind-the-wall-explains-chinas-complicated-startup-industry on 1 July 2015.
Chorev, Schaul/Anderson, Alistair R. 2006. Success in Israeli high-tech start-ups; Critical factors and
process. Technovation 26 (2), pp. 162-174.
Clarysse, Bart/Bruneel, Johan/Wright, Mike. 2011. Explaining growth paths of young technology-
based firms: Structuring resource portfolios in different competitive environments. Strategic
Entrepreneurship Journal 5 (2), pp. 137-157.
Colombo, Massimo G./Grilli, Luca. 2007. Funding gaps? Access to bank loans by high-tech start-ups.
Small Business Economics 29 (1/2), pp. 25-46.
Colombo, Massimo G./Grilli, Luca. 2010. On growth drivers of high-tech start-ups: Exploring the role
of founders’ human capital and venture capital. Journal of Business Venturing 25 (6), pp. 610-
626.
Colombo, Massimo G./Piva, Evila. 2012. Firms’ genetic characteristics and competence-enlarging
strategies: A comparison between academic and non-academic high-tech start-ups. Research
Policy 41 (1), pp. 79-92.
Corrales, Javier/Westhoff, Frank. 2006. Information technology adoption and political regimes.
International Studies Quarterly 50 (4), pp. 911-933.
Cosseboom, Leighton. 2014. Indonesian online marketplace Tokopedia raises $100M from SoftBank
and Sequoia. Tech in Asia, 22 October 2014. Retrieved from:
https://www.techinasia.com/tokopedia-softbank-sequoia-capital-funding-news on 7 July 2015.
Danis, Wade M./De Clercq, Dirk/Petricevic, Olga. 2011. Are social networks more important for new
business activity in emerging than developed economies? An empirical extension.
International Business Review 20 (4), pp. 394-408.
Davis, Kurt. 2014. Why Silicon Valley should be investing more in Indonesia. Tech in Asia, 23
December 2014. Retrieved from: https://www.techinasia.com/why-silicon-valley-should-
invest-more-indonesia on 2 July 2015.
Djankov, Simeon/La Porta, Rafael/Lopez-de-Silanes, Florencio/Shleifer, Andrei. 2002. The regulation
of entry. Quarterly Journal of Economics 67 (1), pp. 1-37.
Embley, Todd. 2015. Startup empire on the rise: What’s happening behind the Great Wall of China?
Seed Stars World, 27 January 2015. Retrieved from:
http://www.seedstarsworld.com/blog/2015/01/startup-empire-china/ on 1 July 2015.
123
Ericsson/Facebook/XL Axiata. 2014. Measuring and improving network performance. An analysis of
network and application research, testing and optimization. Retrieved from:
https://www.internet.org/press/improving-app-and-network-performance-in-indonesia on 5
May 2015.
Espejo, Raul/Reyes, Alfonso. 2011. Organizational systems. Managing complexity with the Viable
System Model. Berlin/Heidelberg: Springer.
Essman, Heinz. 2010. Structuring companies for innovation and operations. Innovation
Management.se, 6 October 2010. Retrieved from:
http://www.innovationmanagement.se/2010/10/06/from-conflict-to-synergy-structuring-
companies-for-innovation on 1 April 2015.
Evdemon, Chris. 2013. Technopreneurship and the early stage ecosystem in China. Tech in Asia, 16
October 2013. Retrieved from: https://www.techinasia.com/overview-chinas-tech-startup-
ecosystem-20-slides on 28 June 2015.
Fogel, Kathy/Hawk, Ashton/Morck, Randall/Yeung, Bernard. 2006. Institutional obstacles to
entrepreneurship. In: Casson, Mark/Yeung, Bernard/Basu, Anuradha/Wadeson, Nigel (eds.)
Oxford handbook of entrepreneurship. Oxford: Oxford University Press, pp. 540-579.
Forrester, Jay. 1996. System dynamics and K-12 teachers. A Lecture at the University of Virginia
School of Education. Retrieved from: http://ocw.mit.edu/courses/sloan-school-of-
management/15-988-system-dynamics-self-study-fall-1998-spring-1999/readings/teachers.pdf
on 1 March 2015.
Freischlad, Nadine. 2015. Rocket Internet enters holy matrimony with Indonesia’s Bridestory, leads
series A funding. Tech in Asia, 5 March 2015. Retrieved from:
http://www.techinasia.com/indonesia-bridestory-funding-rocket-internet on 10 July 2015.
Fritsch, Michael/Brixy, Udo/Falck, Oliver. 2004. The effect of industry, region and time on new
business survival – A multi-dimensional analysis. University of Passau: Passauer
Diskussionspapiere, Volkswirtschaftliche Reihe. Retrieved from:
http://www.diw.de/sixcms/detail.php/42059 on 25 January 2015.
Frye, Timothy/Shleifer, Andrei. 1997. The Invisible Hand and the Grabbing Hand. American
Economic Review 87 (2), pp. 354-358.
Gai, Bowei. 2011. The China startup report. Retrieved from: http://de.slideshare.net/bowei/the-china-
startup-report-a-15min-crash-course-by-bowei-gai on 1 July 2015.
Gao, Yuan. 2015. A host of new measures will aid startups. China Daily, 6 June 2015. Retrieved from:
http://www.chinadaily.com.cn/china/2015-06/06/content_20924794.htm on 30 June 2015.
Gardner, David M./ Johnson, Frank/ Lee, Moonkyu/ Wilkinson, Ian. 2000. A contingency approach to
marketing high technology products. European Journal of Marketing 34 (9/10), pp. 1053-1077.
124
Gelfand, Michele J./Bhawuk, Dharm P. S./Nishii, Lisa Hisae/Bechtold, David J. 2004. Individualism
and collectivism. In: House, Robert J./Hanges, Paul J./Javidan, Mansour/Dorfman, Peter
W./Gupta, Vipin (eds). Culture, leadership, and organizations. The GLOBE study of 62
societies. Thousand Oaks: Sage, pp. 437-512.
Global Entrepreneurship Monitor. 2015. Data. Key Indicators. London: Global Entrepreneurship
Research Association. Retrieved from: http://www.gemconsortium.org/key-indicators on 7
April 2015.
Grant, Robert M. 1991. The resource-based theory of competitive advantage: Implications for strategy
formulation. California Management Review 33 (3), pp. 114-135.
Grant, Robert M. 1996. Toward a knowledge-based theory of the firm. Strategic Management Journal
17 (S2), pp. 109-122.
Guo Di/Jiang Kan. 2013. Venture capital investment and the performance of entrepreneurial firms:
Evidence from China. Journal of Corporate Finance 22, pp. 375-395.
Hechavarria, Diana M./Renko, Maija/Matthews, Charles H. 2012. The nascent entrepreneurship hub:
Goals, entrepreneurial self-efficacy and start-up outcomes. Small Business Economics 39 (3),
pp. 685-701.
Heylighen, Francis/Joslyn, Cliff. 1992. What is systems theory? In: Heylighen, Francis/Joslyn,
Cliff/Turchin, Valentin (eds) Principia Cybernetica Web. Brussels: Principia Cybernetica.
Retrieved from: http://pespmc1.vub.ac.be/systheor.html on 28 February 2015.
Hoskisson, Robert E./Eden, Lorraine/Lau, Chung Ming/Wright, Mike. 2000. Strategy in emerging
economies. Academy of Management Journal 43 (3), pp. 249-267.
House, Robert J./Hanges, Paul J./Javidan, Mansour/Dorfman, Peter W./Gupta, Vipin (eds). Culture,
leadership, and organizations. The GLOBE study of 62 societies. Thousand Oaks: Sage.
Hsueh, Joe C. 2011. Dynamics of shared capitalism policies in a startup company. Massachusetts
Institute of Technology: PhD Thesis.
Javidan, Mansour. 2004. Performance orientation. In: House, Robert J./Hanges, Paul J./Javidan,
Mansour/Dorfman, Peter W./Gupta, Vipin (eds). Culture, leadership, and organizations. The
GLOBE study of 62 societies. Thousand Oaks: Sage, pp. 239-281.
Johnson, Simon/McMillan, John/Woodruff, Christopher. 2002. Property rights and finance. Working
Paper 8852, National Bureau of Economic Research. Retrieved from:
http://www.nber.org/papers/w8852 on 1 February 2015.
Kaufman, Daniel/Kraay, Aart/Mastruzzi, Massimo. 2014a. Worldwide Governance Indicators
Documentation. The World Bank Group. Retrieved from:
http://info.worldbank.org/governance/wgi/index.aspx#doc (Last accesses 25 March 2015.
125
Kaufman, Daniel/Kraay, Aart/Mastruzzi, Massimo. 2014b. Worldwide Governance Indicators
Country Data Reports. The World Bank Group. Retrieved from:
http://info.worldbank.org/governance/wgi/index.aspx#countryReports (Last accesses 25
March 2015.
Khanna, Tarun/Yafeh, Yishay. 2007. Business groups in emerging markets: Paragons or parasites?
Journal of Economic Literature 45 (2), pp. 331-372.
Kılıçaslan, Yılmaz/Taymaz, Εrol. Labor market institutions and industrial performance: An
evolutionary study. In: Cantner, Uwe/Gaffard, Jean-Luc/Nesta, Lionel (eds) 2008.
Schumpeterian perspectives on innovation, competition and growth. Berlin/Heidelberg:
Springer.
Kiss, Andreea N./Danis, Wade M./Cavusgil, S. Tamer. 2012. International entrepreneurship research
in emerging economies: A critical review and research agenda. Journal of Business Venturing
27 (2), pp. 266-290.
Koellinger, Philipp D./Thurik A. Roy. 2012. Entrepreneurship and the business cycle. The Review of
Economics and Statistics 94 (4), pp. 1143-1156.
Kong, Sherry Tao. 2010. Economic and political transition in China and Indonesia. East Asian Forum,
4 August 2010. Retrieved from: http://www.eastasiaforum.org/2010/08/04/economic-and-
political-transition-in-china-and-indonesia on 20 July 2015.
Kostova, Tatiana. 1997. Country institutional profiles: Concept and measurement. Academy of
Management Proceedings, pp. 180–184.
Kreiser, Patrick M./Marino, Louis D./Kuratko, Donald F./Weaver, K. Mark. 2013. Disaggregating
entrepreneurial orientation: the non-linear impact of innovativeness, proactiveness and risk-
taking on SME performance. Small Business Economics 40 (2), pp. 273-291.
Kusuma, Derianto. 2012. How is the tech startup scene in Indonesia? Retrieved from:
http://www.quora.com/How-is-the-tech-startup-scene-in-Indonesia on 1 July 2015.
Lau, Chung Ming/Bruton, Garry D. 2011. Strategic orientations and strategies of high technology
ventures in two transition economies. Journal of World Business 46 (3), pp. 371-380.
Lee, Choonwoo/Lee, Kyungmook/Pennings, Johannes M. 2001. Internal capabilities, external
networks, and performance: A study on technology-based ventures. Strategic Management
Journal 22 (6/7), pp. 615-640.
Li, Haiyang. 2001. How does new venture strategy matter in the environment-performance
relationship? Journal of High Technology Management Research 12 (2), pp. 183-204.
Liu, Xiaohui/Lu, Jiangyong/Filatotchev, Igor/Buck, Trevor/Wright, Mike. 2010. Returnee
entrepreneurs, knowledge spillovers and innovation in high-tech firms in emerging economies.
Journal of International Business Studies 41 (7), pp. 1183-1197.
126
Mahmood, Ishtiaq P./Mitchell, Will. 2004. Two faces: Effects of business groups on innovation in
emerging economies. Management Science 50 (10), pp. 1348-1365.
Malik, Fredmund. 2013. Management. Das A und O des Handwerks. Frankfurt/New York: Campus
Verlag.
Martens, David/Vanhoutte, Christine/De Winne, Sophie/Baesens, Bart/Sels, Luc/Mues, Christophe.
2011. Identifying financially successful start-up profiles with data mining. Expert Systems
with Applications 38 (5), pp. 5794-5800.
McKelvey, Bill. 2004. Toward a complexity science of entrepreneurship. Journal of Business
Venturing 19 (3), pp. 313-341.
Millán, José María/Congregado, Emilio/Román, Concepción/Van Praag, Mirjam/Van Stel, André.
2014. The value of an educated population for an individual’s entrepreneurship success.
Journal of Business Venturing 29 (5), pp. 612-632.
Miller, David S. 2007. New venture commercialization of clean energy technologies. Massachusetts
Institute of Technology: PhD Thesis.
Nag, Rajiv/Hambrick, Donald C./Chen, Ming-Jer. 2007. What is strategic management, really?
Inductive derivation of a consensus definition of the field. Strategic Management Journal 28
(9), pp. 935–955.
North, Douglass C. 1990. Institutions, institutional change, and economic performance. New York:
Cambridge University Press.
North, Douglass C. 2005. Understanding the process of economic change. Princeton/Oxford:
Princeton University Press.
Osterwalder, Alexander/Pigneur, Yves. 2004. An ontology for e-business models. In: Currie, Wendy
(Ed.) Value creation from e-business models. Oxford: Elsevier Butterworth-Heineman.
Osterwalder, Alexander/Pigneur, Yves/Tucci, Christopher L. 2005. Clarifying business models:
origins, present, and future of the concept. Communications of the Association for Information
Systems 15 (1), pp. 1-25.
Pathak, Saurav/Xavier-Oliveira, Emanuel/Laplume, André O. 2013. Influence of intellectual property,
foreign investment, and technological adoption on technology entrepreneurship. Journal of
Business Research 66 (10), pp. 2090-2101.
Pe’er, Aviad/Keil, Thomas. 2013. Are all startups affected similarly by clusters? Agglomeration,
competition, firm heterogeneity, and survival. Journal of Business Venturing 28 (3), pp. 354-
372.
Peng, Mike W. 2001. How entrepreneurs create wealth in transition economies. Academy of
Management Journal 15 (1), pp. 95-110.
127
Peng, Mike W. 2009. Global strategy. Cincinnati: South-Western Cengage Learning.
Peng, Mike W./Sun, Sunny Li/Pinkham, Brian/Chen, Hao. 2009. The institution-based view as a third
leg for a strategy tripod. Academy of Management Perspectives 23 (3), pp. 63-81.
Peng, Mike W./Wang, Denis Y.L./Jiang, Yi. 2008. An institution-based view of international business
strategy: A focus on emerging economies. Journal of International Business Studies 39 (5), pp.
920-936.
Petkova, Antoaneta P./Rindova, Violina P./Gupta, Anil K. 2013. No news is bad news: Sensegiving
activities, media attention, and venture capital funding of new technology organizations.
Organization Science 24(3), pp. 865-888.
Phillips, Nelson/Tracey, Paul. 2007. Opportunity recognition, entrepreneurial capabilities and
bricolage: Connecting institutional theory and entrepreneurship in strategic organization.
Strategic Organization 5 (3), pp. 313-320.
Phillips, Nelson/Tracey, Paul/Karra, Neri. 2009. Rethinking institutional distance: Strengthening the
tie between new institutional theory and international management. Strategic Organization 7
(3), pp. 339-348.
Pinillos, María-José/Reyes, Luisa. 2011. Relationship between individualist-collectivist culture and
entrepreneurial activity: Evidence from Global Entrepreneurship Monitor data. Small Business
Economics 37 (1), pp. 23-37.
Plummer, Lawrence A./Acs, Zoltan J. 2014. Localized competition in the knowledge spillover theory
of entrepreneurship. Journal of Business Venturing 29 (1), pp. 121-136.
Porter, Michael E. 1980. Competitive strategy. New York: Free Press.
Porter, Michael E. 1985. Competitive Advantage. New York: Free Press.
Porter, Michael E. 2001. Strategy and the internet. Harvard Business Review 79 (3), pp. 62–79.
Prahalad, C. K./Hamel, Gary. 1990. The core competence of the corporation. Harvard Business
Review 68 (3), pp. 79-91.
Quatraro, Francesco/Vivarelli, Marco. 2014. Drivers of entrepreneurship and post-entry performance
of newborn firms in developing countries. The World Bank Research Observer.
Revest, Valérie/Sapio, Alessandro. 2012. Financing technology-based small firms in Europe: What do
we know? Small Business Economics 39 (1), pp. 179-205.
Roxas, Banjo/Chadee, Doren. 2012. Effects of informal institutions on the performance of
microenterprises in the Philippines: The mediating role of entrepreneurial orientation. Journal
of Asia-Pacific Business 13 (4), pp. 320-348.
128
Saad, Fady M. 2013. Modeling and comparing a startup dynamics in the US and Egypt. Massachusetts
Institute of Technology: MA Thesis.
Salimath, Manjula S./Cullen, John B. 2010. Formal and informal institutional effects on
entrepreneurship: A synthesis of nation-level research. International Journal of
Organizational Analysis 18 (3), pp. 358-385.
Schumpeter, Joseph A. 1934. The theory of economic development. Cambridge: Harvard University
Press.
Scott, W. Richard. 1995. Institutions and organizations. Ideas, interests and identities. Thousand Oaks:
Sage.
Shapiro, Carl/Varian, Hal R. 1999. Information rules. A strategic guide to the network economy.
Boston: Harvard Business School Press.
Shu, Catherine. 2015. Indonesian lunchbox startup Berry Kitchen raises $1.25M series A. Tech
Crunch, 13 July 2015. Retrieved from: http://techcrunch.com/2015/07/13/indonesian-
lunchbox-startup-berry-kitchen-raises-1-25m-series-a on 26 July 2015.
Siqueira, Ana Cristina O./Bruton, Garry D. 2010. High-technology entrepreneurship in emerging
economies: Firm informality and contextualization of resource-based theory. IEEE
Transactions on Engineering Management 57 (1), pp. 39-50.
Smith, Ken G./Collins, Christopher J./Clark, Kevin D. 2005. Existing knowledge, knowledge creation
capability, and the rate of new product introduction in high-technology firms. The Academy of
Management Journal 48 (2), pp. 346-357.
Sommer, Svenja C./Loch, Christoph H./Dong, Jing. 2009. Managing complexity and unforeseeable
uncertainty in startup companies: An empirical study. Organization Science 20 (1), pp. 118-
133.
Stam, Erik/Wennberg, Karl. 2009. The roles of R&D in new firm growth. Small Business Economics
33 (1), pp. 77-89.
Stephen, Frank H./Urbano, David/van Hemmen, Stefan. 2005. The impact of institutions on
entrepreneurial activity. Managerial and Decision Economics 26 (7), pp. 413-419.
Sterman, John D. 2001. System Dynamics modeling: Tools for learning in a complex world.
California Management Review 43 (4), pp. 8-25.
Sully de Luque, Mary F./Javidan, Mansour. 2004. Uncertainty avoidance. In: House, Robert J./Hanges,
Paul J./Javidan, Mansour/Dorfman, Peter W./Gupta, Vipin (eds). Culture, leadership, and
organizations. The GLOBE study of 62 societies. Thousand Oaks: Sage, pp. 602-653.
Thai, Mai Thi Thanh/Turkina, Ekaterina. 2014. Macro-level determinants of formal entrepreneurship
versus informal entrepreneurship. Journal of Business Venturing 29 (4), pp. 490-510.
129
The Economist. 2012. VC clone home. Making money by bringing ideas to new markets. The
Economist, 2 June 2012. Retrieved from: http://www.economist.com/node/21556269 on 10
February 2015.
The State Council of the People’s Republic of China. 2015. ‘Internet plus’: Premier Li’s new tech tool.
Retrieved from: http://english.gov.cn/premier/news/2015/03/13/content_28147507
0887811.htm on 15 July 2015.
The World Bank. 2014. Financial inclusion data / Global Findex – Indonesia. Retrieved from:
http://datatopics.worldbank.org/financialinclusion/country/indonesia on 3 July 2015.
The World Bank. 2015a. Data – China. Retrieved from: http://data.worldbank.org/country/china (Last
accessed 25 July 2015.
The World Bank. 2015b. Data – Indonesia. Retrieved from:
http://data.worldbank.org/country/indonesia on 25 July 2015.
The World Bank. 2015c. Data – GDP growth (annual %). Retrieved from:
http://data.worldbank.org/indicator/NY.GDP.MKTP.KD.ZG on 1 April 2015.
The World Bank. 2015d. Data – Unemployment, total (% of total labor force) (modeled ILO estimate).
Retrieved from: http://data.worldbank.org/indicator/SL.UEM.TOTL.ZS on 1 April 2015.
The World Bank. 2015e. Data – Internet users (per 100 people). Retrieved from:
http://data.worldbank.org/indicator/IT.NET.USER.P2 on 7 April 2015.
The World Bank. 2015f. Urban expansion in East Asia – Indonesia. Retrieved from:
http://www.worldbank.org/en/news/feature/2015/01/26/urban-expansion-in-east-asia-
indonesia on 10 July 2015.
Tolbert, Pamela S./David, Robert J./Sine, Wesley D. 2011. Studying choice and change: The
intersection of institutional theory and entrepreneurship research. Organization Science 22 (5),
pp. 1332-1344.
Tracey, Paul/Phillips, Nelson. 2011. Entrepreneurship in emerging markets. Strategies for new venture
creation in uncertain institutional contexts. Management International Review 51 (1), pp. 23-
39.
Tsai, William Ming-Hone/MacMillan, Ian C./Low, Murray B. 1991. Effects of strategy and
environment on corporate venture success in industrial markets. Journal of Business Venturing
6 (1), pp. 9-28.
UNESCO (United Nations Educational, Scientific and Cultural Organization)/UIS (UNESCO Institute
for Statistics). 2015a. Education – Educational attainment – Cumulative educational
attainment of the population aged 25 years and older / Latest available year. Retrieved from:
http://www.uis.unesco.org/DataCentre/Excel/LITEA/2015_Cumulative_educational_attainme
nt_by_ISCED_level_-_Niveau_de_scolarisation_cumulative_par_niveau_de_la_CITE.xlsx on
14 April 2015.
130
UNESCO (United Nations Educational, Scientific and Cultural Organization)/UIS (UNESCO Institute
for Statistics). 2015b. Science, technology and innovation: Gross domestic expenditure on
R&D (GERD). Retrieved from: data.uis.unesco.org/?queryid=74 on 7 April 2015.
Van de Ven, Andrew H. 1993. The development of an infrastructure for entrepreneurship. Journal of
Business Venturing 8 (3), pp. 211-230.
Van Stel, André/Storey, David J./Thurik, A. Roy. 2007. The effect of business regulations on nascent
and young business entrepreneurship. Small Business Economics 28 (2/3), pp. 171-186.
Varian, Hal R. 2001. High-technology industries and market structure. Retrieved from:
http://people.ischool.berkeley.edu/~hal/Papers/structure.pdf on 8 February 2015.
Walker, Jon. 2006. The VSM Guide. An introduction to the Viable System Model as a diagnostic &
design tool for co-operatives & federations. Retrieved from:
http://www.esrad.org.uk/resources/vsmg_3/screen.php?page=home on 16 January 2015.
Widiartanto, Yoga Hastyadi. 2015. Menkominfo ingin kumpulkan Rp 12 triliun untuk startup
[Minister of Communication and Information Technology aims to raise IDR 12 trillion for
start-ups]. Kompas.com, 12 February 2015. Retrieved from:
http://tekno.kompas.com/read/2015/02/12/18092567/Menkominfo.Ingin.Kumpulkan.Rp.12.Tr
iliun.untuk.Startup on 3 July 2015.
Woolley, Jennifer L. 2014. The creation and configuration of infrastructure for entrepreneurship in
emerging domains of activity. Entrepreneurship Theory and Practice 38 (4), pp. 721-747.
World Bank Group. 2015a. Doing Business – Getting Credit Methodology. Retrieved from:
http://www.doingbusiness.org/Methodology/getting-credit#legalRights on 30 March 2015.
World Bank Group. 2015b. Doing Business - Historical Data - China. Retrieved from:
http://www.doingbusiness.org/Custom-Query/china on 30 March 2015.
World Bank Group. 2015c. Doing Business - Historical Data - Indonesia. Retrieved from:
http://www.doingbusiness.org/Custom-Query/indonesia on 30 March 2015.
World Bank Group. 2015d. Doing Business – The Ease of Doing Business in China. Retrieved from:
http://www.doingbusiness.org/data/exploreeconomies/china#getting-credit on 30 March 2015.
World Bank Group. 2015e. Doing Business – Labour Market Regulation. Retrieved from:
http://www.doingbusiness.org/data/exploretopics/labor-market-regulation#firingCost on 1
April 2015.
Wright, Mike/Filatotchev, Igor/Hoskisson, Robert E./Peng, Mike W. 2005. Strategy research in
emerging economies: Challenging the conventional wisdom. Journal of Management Studies
42 (1), pp. 1-33.
Wright, Mike/Liu, Xiaohui/Buck, Trevor/Filatotchev, Igor. 2008. Returnee entrepreneurs, science park
location choice and performance: An analysis of high technology SMEs in China.
Entrepreneurship Theory and Practice 32 (1), pp. 131-155.
131
Wu, Lei-Yu. 2007. Entrepreneurial resources, dynamic capabilities and start-up performance of
Taiwan’s high-tech firms. Journal of Business Research 60 (5), pp. 549-555.
Xinhua. 2015. China to improve internet structure. Xinhua, 26 February 2015. Retrieved from:
http://news.xinhuanet.com/english/2015-02/26/c_134021340.htm on 1 May 2015.
Yao, Kevin/Sweeney, Pete. 2015. China’s 2014 economic growth misses target, hits 24-year low.
Reuters, 20 January 2015. Retrieved from: http://www.reuters.com/article/2015/01/20/us-
china-economy-idUSKBN0KT04920150120 on 1 April 2015.
Yli-Renko, Helena/Autio, Erkko/Sapienza, Harry J. 2001. Social capital, knowledge acquisition, and
knowledge exploitation in young technology-based firms. Strategic Management Journal 22
(6/7), pp. 587-613.
Yuan, Xin. 2015. China’s tech start-up sector is big on cash but short on experience. China Economic
Review, 16 July 2015. Retrieved from: http://www.chinaeconomicreview.com/chinas-tech-
start-sector-big-cash-short-experience on 20 July 2015.
Zahra, Shaker A./Sapienza, Harry J./Davidsson, Per. 2006. Entrepreneurship and dynamic capabilities:
A review, model and research agenda. Journal of Management Studies 43 (4), pp. 917-955.
Zain, Andi. 2013. Sharing session: An introduction to Indonesia’s startup ecosystem (live blog). Tech
in Asia, 5 April 2013. Retrieved from: https://www.techinasia.com/sharing-session-
introduction-indonesias-startup-ecosystem-live-blog on 3 July 2015.
ZhenFund. 2013. Opportunities in China’s startup ecosystem. Retrieved from:
http://de.slideshare.net/ZhenFund/opportunities-in-chinas-startup-ecosystem-23150783 on 25
June 2015.
132
List of Figures Figure 1: The institution-based view: a third leg of the strategy tripod……………………....10
Figure 2: The viable system model…………………………………………………………...45
Figure 3: Event-oriented view of the world…………………………………………………..47
Figure 4: The feedback view of the world……………………………………………………48
Figure 5: Stocks and flows……………………………………………………………………48
Figure 6: The product innovation and value proposition block……...……..………..….……51
Figure 7: The customer relationship block…………………………………..…….…………54
Figure 8: The infrastructure management block………………………….………..…………56
Figure 9: The financial aspects block……………………………………..………………….58
Figure 10: The system dynamics model of a generic technology based start-up...…………..72
Figure 11: Behaviours in the product innovation and value proposition block
(China)………………………………………………………………………………..………76
Figure 12: Behaviours in the customer relationship block (China)…………………..………77
Figure 13: Behaviours in the infrastructure management block (China)……………..………78
Figure 14: Behaviours in the financial aspects block (China)………………………………..79
Figure 15: Behaviours in the product innovation and value proposition block
(Indonesia)……………………………………………………………………………………83
Figure 16: Behaviours in the customer relationship block (Indonesia)…………..…………..84
Figure 17: Behaviours in the infrastructure management block (Indonesia)…………………85
Figure 18: Behaviours in the financial aspects block (Indonesia)……………………………87
Figure 19: Competition related behaviours in the Chinese and Indonesian start-up
environment……………………………………………………………………………..……90
Figure 20: Customers and sales of the Chinese and Indonesian start-up……………...….…..92
Figure 21: Cash and net income of the Chinese and Indonesian start-up………………....….97
Figure 22: Cash stock sensitivity analysis in the Chinese institutional environment…..…….99
Figure 23: Cash stock sensitivity analysis in the Indonesian institutional environment….101
Figure 24: External funding sensitivity analysis in the Chinese institutional
environment………………………………………………………………………………....102
Figure 25: External funding sensitivity analysis in the Indonesian institutional
environment…………..……………………………………………………………………..102
Figure 26: Customers stock sensitivity analysis in the Chinese institutional
environment……………………………………..…………………………………………..103
Figure 27: Customers stock sensitivity analysis in the Indonesian institutional
environment………………………………………………...……………………………….103
Figure 28: Cash stock sensitivity of Chinese informal institutions…………………………105
Figure 29: Cash stock sensitivity of Indonesian informal institutions…...…………………106
Figure 30: Product features stock sensitivity of Chinese informal institutions…..…………107
Figure 31: Product features stock sensitivity of Indonesian informal institutions………….107
133
List of Tables Table 1: Institutional factors of the start-up simulation in China…………………………..75
Table 2: Institutional factors of the start-up simulation in Indonesia……………………...83
Table 3: Product related performance………………………………………………………...88
Table 4: Customer related performance………………………………………………………91
Table 5: Human resource related performance……………………………………………….93
Table 6: Financial performance………………………………………………………………95
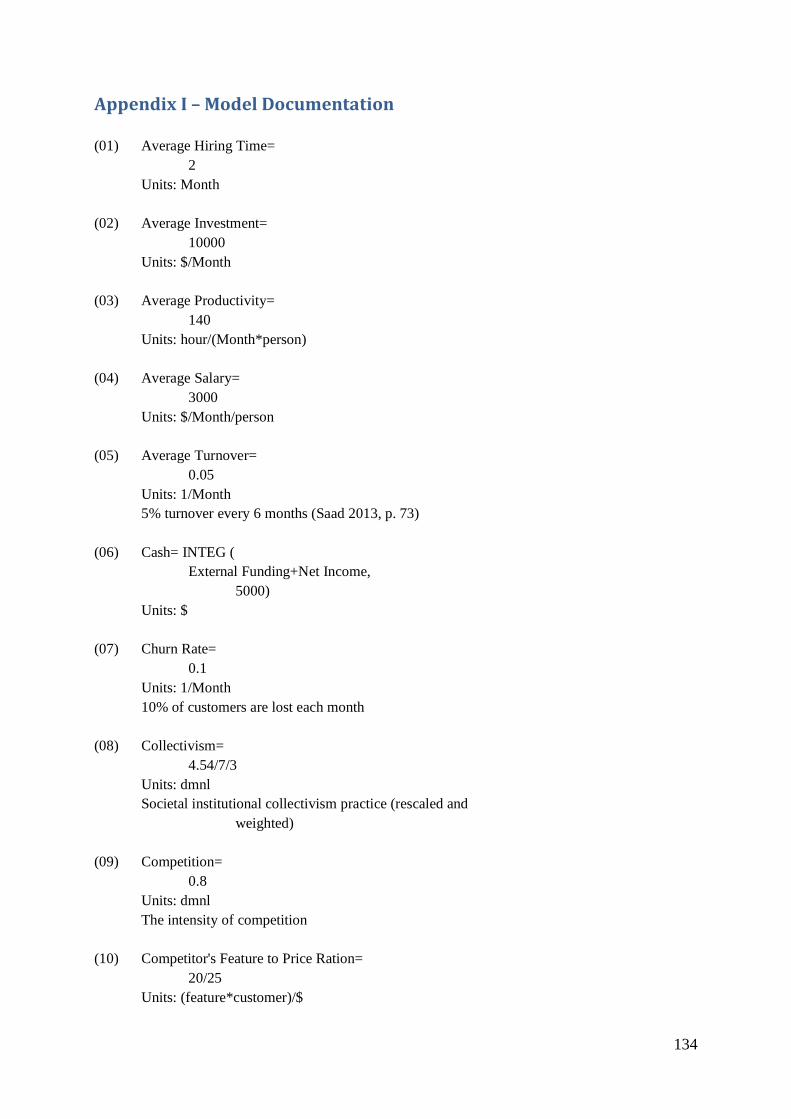
134
Appendix I – Model Documentation
(01) Average Hiring Time=
2
Units: Month
(02) Average Investment=
10000
Units: $/Month
(03) Average Productivity=
140
Units: hour/(Month*person)
(04) Average Salary=
3000
Units: $/Month/person
(05) Average Turnover=
0.05
Units: 1/Month
5% turnover every 6 months (Saad 2013, p. 73)
(06) Cash= INTEG (
External Funding+Net Income,
5000)
Units: $
(07) Churn Rate=
0.1
Units: 1/Month
10% of customers are lost each month
(08) Collectivism=
4.54/7/3
Units: dmnl
Societal institutional collectivism practice (rescaled and
weighted)
(09) Competition=
0.8
Units: dmnl
The intensity of competition
(10) Competitor's Feature to Price Ration=
20/25
Units: (feature*customer)/$
135
(11) Competitor's Value Proposition=
Competitor's Feature to Price Ration*(1+(MAX(Competition-Regulatory Quality
, 0)))
Units: (feature*customer)/$
(12) Costs=
Costs of Goods Sold+Total Salaries
Units: $/Month
(13) Costs of Goods Sold=
Customers*Unit Cost
Units: $/Month
(14) Customer Acquisition Cycle=
0.05
Units: 1/hour
It takes 20 hours to attract 1 customer
(15) Customers= INTEG (
Sales-Dissatisfaction,
1)
Units: customer
(16) Desired Gross Margin=
0.7
Units: dmnl
(17) Desired Headcount Growth=
(0.2*Human Resources)*PULSE TRAIN(6, 1, 6, 60)
Units: person
Desired monthly headcount growth is assumed at 20% of current human resources (10%
growth and 10% to compensate for turnover). This behaviour starts in month 6, every 6 months until
month 60. (Saad 2013, pp. 75-76)
(18) Dissatisfaction=
Churn Rate*Customers*(1-Effect of Product Attractiveness(Product Attractiveness
))
Units: customer/Month
(19) Effect of Labour Market Regulations(
[(0,0)-(20,10)],(0,0),(4,0.005),(8,0.01),(12,0.015),(16,0.02),(20,0.025))
Units: 1/Month
(20) Effect of Product Attractiveness(
[(0,0)-(10000,0.06)],(0,0),(1,0.01),(10,0.02),(100,0.03),(1000,0.04),(10000
,0.0560526))
Units: dmnl
136
(21) Effect of Unemployment Rate(
[(0,0)-(10,10)],(0,0),(0.05,0.25),(0.1,0.5),(0.15,0.75),(0.2,1),(0.25,1.25
),(0.3,1.5))
Units: Month
(22) Engineer Proportion=
0.7
Units: dmnl
Percentage of engineers from total human resources
(23) Engineering Effort=
Human Resources*Engineer Proportion*Team Productivity
Units: hour/Month
(24) External Funding=
Average Investment*(1+Macroeconomic Growth+Informal Investor Rate+Legal
Rights
+Media Attention)
Units: $/Month
(25) Feature Development Rate=
0.000625
Units: feature/hour
Number of new features that can be developed per hour based on
the assumption that one complete feature can be developed every
8 months.
(26) Feature Obsolescence=
Feature Obsolescence Rate
Units: feature/Month
(27) Feature Obsolescence Rate=
0.125
Units: feature/Month
(28) FINAL TIME = 60
Units: Month
The final time for the simulation.
(29) Headcount Growth=
ZIDZ((Salary Budget*Desired Headcount Growth), Average Salary)
Units: person
(30) Higher Education=
7.9/50/3
Units: dmnl
Percentage of the population above 25 years who attained at
least short-cycle tertiary education (rescaled and weighted)
137
(31) Hiring=
Headcount Growth/Time to hire
Units: person/Month
(32) Human Resources= INTEG (
Hiring-Turnover,
1)
Units: person
(33) Informal Investor Rate=
(5.4/100+5.4/25.2)/2/4
Units: dmnl
Informal investor rate in % of population (rescaled and weighted)
(34) INITIAL TIME = 0
Units: Month
The initial time for the simulation.
(35) Labour Market Regulations=
17.3
Units: dmnl
Severance pay in weeks for redundancy dismissal for a worker
with 1 year of tenure. 4 weeks of severance pay reduce turnover
rate by 0.5 percent.
(36) Legal Rights=
4/12/4
Units: dmnl
Strength of legal rights index (weighted)
(37) Macroeconomic Growth=
0.058
Units: dmnl
GDP growth rate
(38) Market Size=
30000
Units: customer
(39) Media Attention=
75/100/4
Units: dmnl
Media attention of entrepreneurship (weighted)
(40) Net Income=
Revenues-Costs
Units: $/Month
138
(41) Performance Orientation=
((((4.41-4)/(7-4)+4.41/4.94)/2)/3)
Units: dmnl
Performance orientation practice (rescaled and weighted)
(42) Pricing=
Unit Cost*(1+Desired Gross Margin)
Units: $/customer
(43) Product Attractiveness=
Value Proposition*(Engineering Effort/720)
Units: dmnl
(44) Product Development=
Engineering Effort*Feature Development Rate*(1+"R&D Innovation"+(1-Uncertainty
Avoidance
))
Units: feature/Month
(45) Product Features= INTEG (
MIN(Product Development-Feature Obsolescence, 100),
1)
Units: feature
(46) "R&D Innovation"=
0.0008
Units: dmnl
The impact of national R&D expenditure (% of GDP)
(47) Regulatory Quality=
0.464
Units: dmnl
(48) Revenues=
Pricing*Customers
Units: $/Month
(49) Salary Budget=
MIN(Cash, 20000)
Units: $/(Month*person)
Salary budget available for new hires per month
(50) Sales=
MIN(Market Size*Technology Adoption, Market Size*Technology
Adoption*Customer Acquisition Cycle
*(1+Effect of Product Attractiveness(Product Attractiveness))*(Sales Effort
/720))
139
Units: customer/Month
(51) Sales Effort=
Human Resources*(1-Engineer Proportion)*Team Productivity
Units: hour/Month
(52) SAVEPER =
TIME STEP
Units: Month [0,?]
The frequency with which output is stored.
(53) Team Productivity=
Average Productivity*(1+Higher Education+Performance Orientation+Collectivism
)
Units: hour/(Month*person)
(54) Technology Adoption=
0.158
Units: dmnl
Percentage of internet users in the market
(55) TIME STEP = 0.125
Units: Month [0,?]
The time step for the simulation.
(56) Time to hire=
Average Hiring Time-Effect of Unemployment Rate(Unemployment Rate)
Units: Month
(57) Total Salaries=
Average Salary*Human Resources
Units: $/Month
(58) Turnover=
Human Resources*(Average Turnover-Effect of Labour Market Regulations(Labour
Market Regulations
))
Units: person/Month
(59) Uncertainty Avoidance=
(4.17/7+4.17/5.37)/2
Units: dmnl
Uncertainty avoidance practice (weighted)
(60) Unemployment Rate=
0.063
Units: dmnl
(61) Unit Cost=
140
MAX(30000/Customers, 50)
Units: $/customer
(62) Value Proposition=
ZIDZ(Product Features, Pricing)/Competitor's Value Proposition
Units: (feature*customer)/$
141
Appendix II – Abstract This thesis examines the effect of institutional factors on the performance of technology based
start-ups in China and Indonesia. Research on technology based start-ups has focused almost
exclusively on the entrepreneurial characteristics and abilities of start-up founders as keys to
explaining venture success and failure. However, since firms operate in and interact with a
specific political, economic and social environment, the study of personal traits alone does not
provide a complete picture of their performance. The success or failure of entrepreneurial
firms is also influenced by the environment they are embedded in. This environment is
determined by political, economic and social institutions that define the “rules of the game in
the society” and govern human interaction (North 1990, p. 3). This thesis investigates the
institutional environment of technology based start-ups in China and Indonesia. It is
motivated by two research questions (1) Given the same business model, is a technology
based start-up more likely to succeed in China or Indonesia? (2) Which are the most critical
institutional factors influencing the performance of technology based start-ups in China and
Indonesia? To examine these questions, the thesis first develops a theoretical framework on
the basis of the strategy tripod (Peng et al. 2008, 2009), institutional theory (North 1990) and
system theory (Sterman 2001; Beer 1967, 1984). This theoretical framework is then used for
modelling a generic technology based start-up with system dynamics. Institutional factors are
included in the model to simulate the start-up’s institutional environment. The start-up model
is then applied to the Chinese and Indonesian institutional context to examine the effect of
institutional factors on the performance of technology based start-ups in these two countries.
Comparative analysis and sensitivity analysis are used to discuss the results of the simulation.
The findings of this thesis show that a technology based start-up in the Chinese institutional
context achieves a better financial performance than a technology based start-up in the
Indonesian context. Furthermore, the performance of a technology based start-up in China is
most affected by the institutional factors technology adoption, unemployment rate and labour
market regulations. In Indonesia, the institutional factors which have the most significant
impact on the performance of a technology based start-up are technology adoption, higher
education and performance orientation. On the basis of these findings, strategy
recommendations for start-ups and policy recommendations are given.
Key words: technology based start-up, entrepreneurship, strategic management, institutional
theory, system theory, system dynamics, China, Indonesia
142
Appendix III – Zusammenfassung Die vorliegende Arbeit untersucht den Einfluss von institutionellen Faktoren auf den
Unternehmenserfolg von Technologie-Startups in China und Indonesien. Bisherige Forschung
zu Technologie-Startups behandelt den Unternehmenserfolg oder –misserfolg von Startups
fast ausschließlich aus der Perspektive von unternehmerischen Persönlichkeitseigenschaften
und Fähigkeiten der Startup-GründerInnen. Da jedoch Unternehmen immer in ein politisches,
wirtschaftliches und soziales Umfeld eingebettet sind und mit diesem interagieren, bildet die
ausschließliche Untersuchung von Persönlichkeitseigenschaften und Fähigkeiten der Startup-
GründerInnen den Erfolg von Technologie-Startups nur unzureichend ab. Der Erfolg oder
Misserfolg von jungen Unternehmen wird von dem Umfeld, in dem sie eingebettet sind,
beeinflusst. Dieses Umfeld wird von politischen, wirtschaftlichen und sozialen Institutionen
bestimmt, die die „Spielregeln der Gesellschaft“ bestimmen und menschliche Interaktionen
steuern (North 1990, S. 3). Die vorliegende Arbeit untersucht das institutionelle Umfeld von
Technologie-Startups in China und Indonesien und versucht, folgende zwei Forschungsfragen
zu beantworten: (1) Unter der Voraussetzung eines identischen Geschäftsmodells, ist ein
Technologie-Startup eher in China oder in Indonesien erfolgreich? (2) Welche institutionellen
Faktoren haben den größten Einfluss auf den Unternehmenserfolg von Technologie-Startups
in China und Indonesien? Um diese Fragen zu beantworten wird zuerst ein theoretisches
Grundgerüst auf Basis des ‚Strategy Tripods‘ (Peng et al. 2008, 2009), der Neuen
Institutionenökonomik (North 1990) und der Systemtheorie (Sterman 2001; Beer 1967, 1984)
entwickelt. Anhand dieses theoretischen Grundgerüsts wird dann ein generisches
Technologie-Startup mit System Dynamics modelliert. Institutionelle Faktoren werden in
diesem Modell miteingebaut, um das institutionelle Umfeld von Startups zu simulieren.
Dieses Startup-Modell wird dann auf den chinesischen und indonesischen institutionellen
Kontext angewendet, um den Einfluss von institutionellen Faktoren auf den
Unternehmenserfolg von Technologie-Startups in diesen beiden Ländern zu bestimmen.
Anhand einer Vergleichs- und Sensitivitätsanalyse werden die Ergebnisse der
Modellsimulationen besprochen. Die Ergebnisse dieser Analysen zeigen, dass ein
Technologie-Startup im chinesischen institutionellen Kontext finanziell erfolgreicher ist als
ein Technologie-Startup im indonesischen institutionellen Kontext. Darüber hinaus wird der
Unternehmenserfolg von Technologie-Startups in China am meisten von den institutionellen
Faktoren Technologie-Verbreitung, Arbeitslosenrate und Arbeitsmarktregulationen bestimmt.
Die institutionellen Faktoren, die den größten Einfluss auf den Unternehmenserfolg von
Technologie-Startups in Indonesien haben, sind Technologie-Verbreitung, höhere Bildung
143
und Leistungsorientierung. Auf Basis dieser Ergebnisse werden eine Strategieempfehlung für
Technologie-Startups sowie eine Politikempfehlung gegeben.
Schlagwörter: Technologie-Startup, Unternehmertum, Strategisches Management, Neue
Institutionenökonomik, Systemtheorie, System Dynamics, China, Indonesien
144
Appendix IV – Curriculum Vitae
Julia Andrea Grabner [email protected]
EDUCATION
University of Vienna Vienna, Austria
Master of Arts in East Asian Economy and Society since October 2012
Vienna University of Economics and Business Vienna, Austria
Bachelor of Science in International Business Administration October 2011 - November 2014
Exchange semester in Singapore (Singapore Management University)
University of Vienna Vienna, Austria
Bachelor of Arts in Translation Studies and Intercultural Communication October 2008 - June 2012
Double Degree Programme
Exchange semesters in China (Xiamen University, PR China) and France (Institut Catholique de
Paris, France)
WORK EXPERIENCE
Unicredit Bank Austria Vienna, Austria
Working student, Corporate & Investment Banking March - June 2013, October - December 2013
Deutsche Bank Frankfurt am Main, Germany
Intern, Global Transaction Banking (Summer Internship Program) July - August 2013
Unicredit Bank Austria Vienna, Austria
Intern, Vienna International Centre (‘UNO-City’) Branch August 2012
Erste Sparinvest Asset Management Vienna, Austria
Intern, Finance & Accounting July 2012
SKILLS, ACTIVITIES & INTERESTS
Languages: Fluent in German, English, French; Conversational Proficiency in Italian, Chinese; Basic
skills in Indonesian
Technical Skills: MS Office (Word, Excel, Powerpoint), Wordpress, HTML
Activities: Member of the Austrian Academic Forum of Foreign Affairs (AFA), Advisor to high
school students in Vienna, Lower Austria and Burgenland (Studienberatung) from 2011 to 2013