Embed Size (px)
Citation preview
Magisteruppsats
Master’s thesis − one year
Företagsekonomi
Business Administration
Title
E-Service Quality and Customer Satisfaction: A
Study of Online Customers in Bangladesh
Md. Mostafizur Rahman
Md. Hossen Miazee
2
Mid Sweden University Department of Social Science
Supervisor: Christer Strandberg Masters Programme: Marketing and Management
Date: 2010-10-10
3
Abstract
In twentieth century we have witnessed an extensive growth of internet based services,
from small merchant to multi-organizations that are developing online services. Online
delivery channel performing the e-service quality is the prime challenging concern that
is the significant for customer satisfaction and their purchasing decision. In this study,
service quality is to be explored as the most important influential service quality factors
of online purchasing that affects consumer satisfaction and makes their purchasing
decision. The study begins with the earlier literature review to identify the influential
service quality factors that affect customer satisfaction and to focus on other study
area. Five e-service quality dimension were investigated the online shopping or
purchasing in order to explore the influential factors of service quality and customer
satisfaction. Quantitative research approach was applied to get better understanding of
the present issue. Moreover, a small quantitative online survey was conducted on the
random sample respondents. Data presentation and analysis were done by using the
SPSS windows software. Finally, the discussion and conclusion were illustrated by
finding of research question’s answers. Hence, the e-service quality factors i.e.,
efficiency, fulfilment, reliability, privacy and responsiveness was found to be the core
service quality factors in online purchasing.
Keywords: E-Commerce, Internet or online purchasing, Online shopping, Customer
satisfaction, E-retailer, Website retailer, E-service quality (Electronic Service Quality)
and Purchasing decision in online.

4
Acknowledgements
We put a lot of effort to do this research and we learned many different
things during thesis. We thank all people who helped us to accomplish this
research.
We would like to express our gratitude to our supervisor Christer
Strandberg for his helpful guideline, support and contribution. He helped
us a lot during different phases of thesis and showed us research direction.
Also, we really thank our friends who helped us appropriately.
Finally, we would like to express our greatest appreciation to our
respected parents who always supported us in all aspect of life and
encouraged us to progress, cautiously.
Md. Mostafizur Rahman
Md. Hossen Miazee
2010-10-10
5
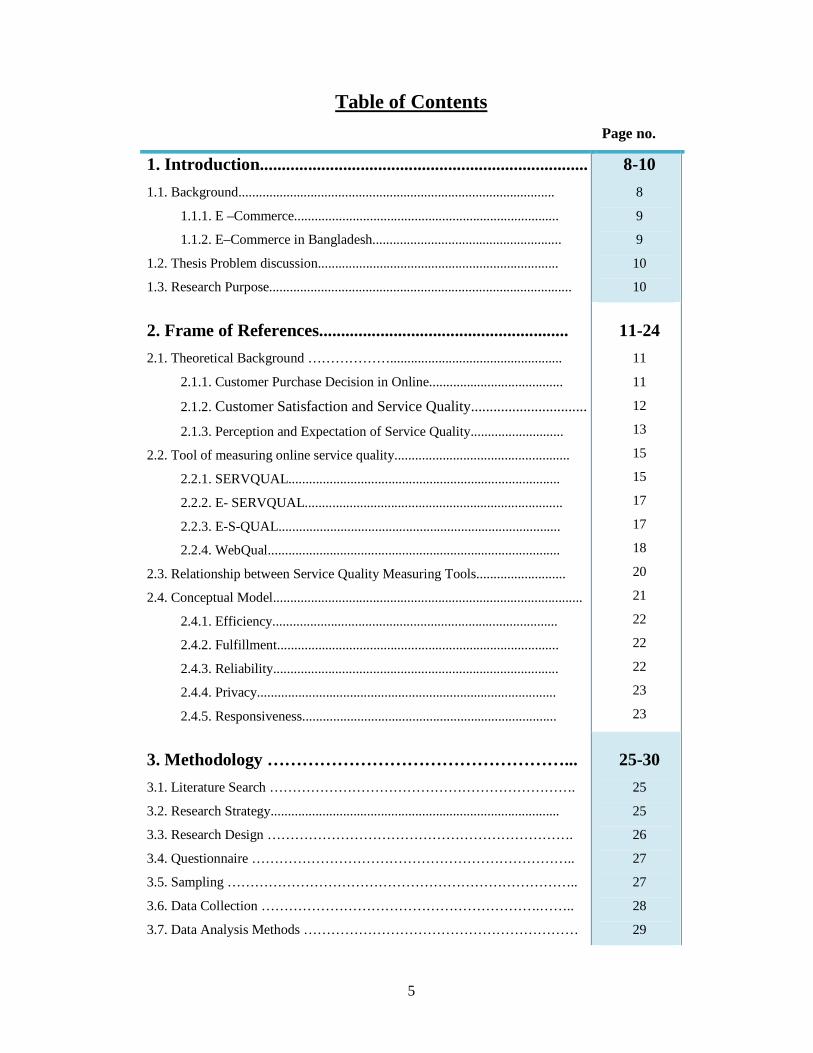
Table of Contents
Page no.
1. Introduction...........................................................................
1.1. Background............................................................................................
1.1.1. E –Commerce.............................................................................
1.1.2. E–Commerce in Bangladesh.......................................................
1.2. Thesis Problem discussion......................................................................
1.3. Research Purpose........................................................................................
8-10
8
9
9
10
10
2. Frame of References.........................................................
2.1. Theoretical Background ………………..................................................
2.1.1. Customer Purchase Decision in Online.......................................
2.1.2. Customer Satisfaction and Service Quality...............................
2.1.3. Perception and Expectation of Service Quality...........................
2.2. Tool of measuring online service quality...................................................
2.2.1. SERVQUAL...............................................................................
2.2.2. E- SERVQUAL...........................................................................
2.2.3. E-S-QUAL..................................................................................
2.2.4. WebQual.....................................................................................
2.3. Relationship between Service Quality Measuring Tools..........................
2.4. Conceptual Model..........................................................................................
2.4.1. Efficiency...................................................................................
2.4.2. Fulfillment..................................................................................
2.4.3. Reliability...................................................................................
2.4.4. Privacy.......................................................................................
2.4.5. Responsiveness..........................................................................
11-24
11
11
12
13
15
15
17
17
18
20
21
22
22
22
23
23
3. Methodology ……………………………………………...
3.1. Literature Search ………………………………………………………….
3.2. Research Strategy....................................................................................
3.3. Research Design ………………………………………………………….
3.4. Questionnaire ……………………………………………………………..
3.5. Sampling …………………………………………………………………..
3.6. Data Collection …………………………………………………….……..
3.7. Data Analysis Methods ……………………………………………………
25-30
25
25
26
27
27
28
29
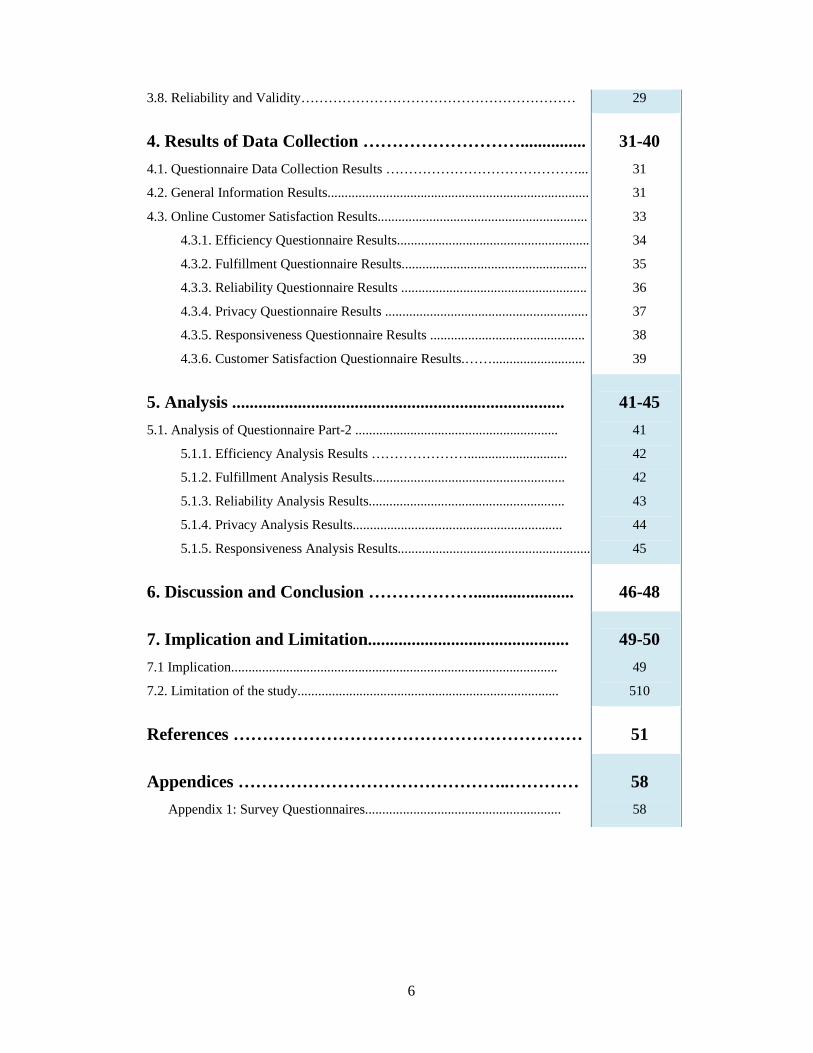
6
3.8. Reliability and Validity…………………………………………………… 29
4. Results of Data Collection ………………………...............
4.1. Questionnaire Data Collection Results ……………………………………...
4.2. General Information Results............................................................................
4.3. Online Customer Satisfaction Results.............................................................
4.3.1. Efficiency Questionnaire Results........................................................
4.3.2. Fulfillment Questionnaire Results......................................................
4.3.3. Reliability Questionnaire Results ......................................................
4.3.4. Privacy Questionnaire Results ...........................................................
4.3.5. Responsiveness Questionnaire Results .............................................
4.3.6. Customer Satisfaction Questionnaire Results.……...........................
31-40
31
31
33
34
35
36
37
38
39
5. Analysis ............................................................................
5.1. Analysis of Questionnaire Part-2 ...........................................................
5.1.1. Efficiency Analysis Results ………………….............................
5.1.2. Fulfillment Analysis Results........................................................
5.1.3. Reliability Analysis Results.........................................................
5.1.4. Privacy Analysis Results.............................................................
5.1.5. Responsiveness Analysis Results........................................................
41-45
41
42
42
43
44
45
6. Discussion and Conclusion ……………….......................
46-48
7. Implication and Limitation..............................................
7.1 Implication...............................................................................................
7.2. Limitation of the study............................................................................
49-50
49
510
References ……………………………………………………
51
Appendices ………………………………………..…………
Appendix 1: Survey Questionnaires.........................................................
58
58
7
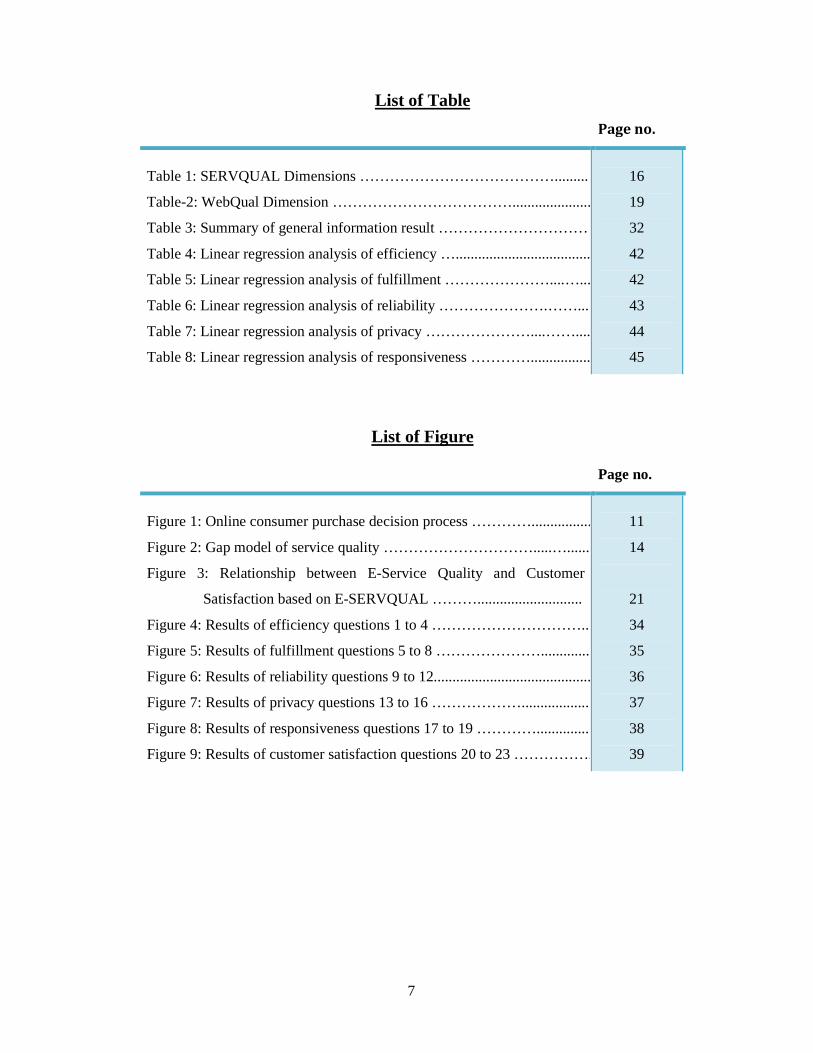
List of Table
Page no.
Table 1: SERVQUAL Dimensions ………………………………….........
Table-2: WebQual Dimension ……………………………….....................
Table 3: Summary of general information result …………………………
Table 4: Linear regression analysis of efficiency …....................................
Table 5: Linear regression analysis of fulfillment …………………....…...
Table 6: Linear regression analysis of reliability ………………….……...
Table 7: Linear regression analysis of privacy …………………....……....
Table 8: Linear regression analysis of responsiveness …………................
16
19
32
42
42
43
44
45
List of Figure
Page no.
Figure 1: Online consumer purchase decision process …………................
Figure 2: Gap model of service quality ………………………….....….......
Figure 3: Relationship between E-Service Quality and Customer
Satisfaction based on E-SERVQUAL ………............................
Figure 4: Results of efficiency questions 1 to 4 …………………………..
Figure 5: Results of fulfillment questions 5 to 8 ………………….............
Figure 6: Results of reliability questions 9 to 12..........................................
Figure 7: Results of privacy questions 13 to 16 ………………..................
Figure 8: Results of responsiveness questions 17 to 19 …………..............
Figure 9: Results of customer satisfaction questions 20 to 23 …………….
11
14
21
34
35
36
37
38
39
8
1. Introduction
1.1. Background
Internet usage has grown very rapidly over the last decades and opened up a new
horizon for trade and commerce, namely Electronic Commerce (E-Commerce).
Nowadays, e-commerce has trigger global trade boom and its activities spread
tremendous pace. E-commerce entails the exploit of the internet in the marketing,
identification, payment and delivery of goods and services. Electronic commerce has
become one of the essential characteristics in the internet era. According to UCLA
(University of California, Los Angeles) center for communication policy [2001], online
shopping has become the third most popular internet activity, immediately following e-
mail using or instant messaging and web browsing. It is even more popular than
seeking out entertainment information and news, two commonly thought of activities
when considering what internet users do when online.
E-commerce service quality plays a central role in customer’s satisfaction and purchase
decisions through the website [Loiacono et al., 2000; Parasuraman, 2000; Rust, 2001].
Low price and web presence were initially thought to be the divers of success for
Electronic Commerce (EC), service quality issues soon become essential quality factors
of any business pattern obviously set a base for potential customers to make decisions.
However, online purchases managed by self-service with little human interaction, many
traditional service quality factors are less relevant [Zeithmal et al., 2000]. The most
experienced and successful e-commerce companies are beginning to realize that key
determinants of success or failure are not merely web present or low price but
delivering high quality of e-service (E-SQ). Recent research shows that price and
promotion are no longer the main draws for customers to make a decision on a
purchase. More and more sophisticated online customers would rather pay a higher
price to e-retailers who provide high quality e-service (Schneider, 2002). Market
research has indicated that services quality has a significant impact on customer
satisfaction, loyalty, retention and purchase decisions and ever on company’s financial
performance (UNCTAD report: United Nations Conference on Trade and
Development)
In recent years, developing countries like Bangladesh have witnessed a phenomenal
development in the technology-dependent communication medium, which is internet.
In both developing and developed countries, Internet is growing rapidly as a strong and
popular medium of communication. Internet is not used only to meet the user’s
information needs. It has already been widened its scope in introducing many services.
Business activities are also considered to be operated through Internet, popularly
9
known as e-commerce. The Internet is revolutionizing every aspects of business
throughout the world. Although the quantum of business done through Internet is small,
it is growing exponentially [Khatibi and Thiagarajan, 2000].
Online shopping is a new way of shopping mode that’s getting popular day by day in
Bangladesh. Shopper’s can certainly shop online by using their bank account. Instead
of using credit/debit card people can easily shop online by using bank account that
would save time, money and energy. As a consequence, many chain stores are being
developed in Bangladesh nowadays which can offer online shopping.
1.1.1. E–Commerce Electronic Commerce (EC) has changed the ways organizations perform their activities
[Swatman, 1996]. This historic view of e-commerce has been further extended by
Zwass [1996] who stated that “Electronic commerce is the sharing of business
information, maintaining business relationships and conducting business transactions
by means of telecommunications network”. But, this term was first used by Kalakota
and Whinston [1996] “Eelectronic Commerce deals with the facilities of transactions
and selling of products and services online, i.e. via the internet or any other
telecommunication network”. This involves the electronic trading of physically and
digital goods, quite often encompassing all the trading steps such as online marketing,
online ordering and electronic payment and for digital goods, online distribution
[Jelassi, 2005]. According to the Hamburg market research firm (yStats.com), India,
Brazil, Thailand, Turkey and the USA, ever more people are using the internet to buy
goods online. But despite the size of the boom, many countries and regions remain far
behind in terms of internet shopping as the 25 current e-commerce reports. In spite of
the financial crisis, B2C e-commerce sales in Asia have increased greatly. In India,
internet trade increased by around 30 percent over the last year. There was also
significant growth in Japan, with a rise of 22 percent, and Thailand 76 percent; in
Eastern and Western Europe internet trade achieved solid growth.
1.1.2. E–Commerce in Bangladesh Bangladesh is a part of global village. The business environment of this global village
is changing, shaping and moulding at internet speed. To stay competitive in the global
market, it has become imperative for Bangladesh to keep pace with this speed by
implementing e-commerce. In Bangladesh, e-commerce is just evolving, but the ball
has been set rolling for an internet revolution. E-commerce is no longer a luxury but a
10
reality. Now, it is estimated that more than 300 ISP’s (Internet service Provider) are
working in our country and there are near about 1 million internet users in the country.
So, there is a vast chance for the expansion of e-commerce in Bangladesh. In the
banking sector, many of the banks are doing their transaction with internet banking
system. It has been seen that banking clients are getting flexible for their transaction.
Ready-Made Garments (RMG) has the lion’s share of the export earnings of
Bangladesh. The RMG sector has begun to use the internet and its dependency on e-
commerce is likely to grow in the coming years. The online retailer’s shops are
increasing day by day.
Here is some of Bangladeshi online retailers: www.webbangladesh.com,
www.haatbazar.com, www.number1shop.com, www.bdbazar.com,
www.bengalcommerce.com, www.sonarmarketplace.com, www.upoharbd.com,
www.bdgift.com, www.cellbazaar.com, www.adhuli.com.
1.2. Thesis Problem
E-commerce is a broad conceptual topic where lots of area is included. The use of
internet for purchasing goods or services is increasing day by day. Bangladesh is a
developing country where the online purchasing is now on the primary stage and it’s
growing rapidly. In this area, we are trying to find out the answers of the question about
what are the most significant factors of e-service quality in online purchasing in
Bangladesh perspective. Our special focus would be on the e-service quality factors that
affect the customer’s satisfaction in online purchasing and we will try to understand the
customer’s decision making in online purchasing. Bangladeshi online shoppers prefer
the website service quality factors to purchase online. We will focus in this arena in our
research. E-service quality factors of website are a vital component of customer
satisfaction. Website quality depends on lots of service quality factors that are creating
customer satisfaction; it’s the first look for the customers to choose product or service
online. So we are trying to identify the influential factors which influence customers to
purchase online.
1.3. Research Purpose
The main purpose of our study is to find the most important influential factors of e-
service quality that affect customer’s satisfaction in online purchasing in Bangladesh.
11
2. Frame of References 2.1. Theoretical Background
Many studies have been conducted on the customer satisfaction and purchasing
decision. Our effort has been made to present in brief, a review of literature on
customer satisfaction in general as well as on the customer satisfaction in online
purchasing. This chapter will give an overview of literature and conceptual model that
are related to the research problem presented in the previous chapter. This chapter will
give a clear idea about the research area.
2.1.1. Customer Purchase Decision in Online
Due to the rapid growth of e-commerce, customers purchase decisions is increasingly
being made in computer mediated environments. Online or web based stores offer
customers immense choice and great convenience. Yet, finding products that meet
customer needs is not an easy task in these online stores. This is because most webs
based store environments are characterized by the availability of many alternatives,
multiple decision criteria and a dynamic “flow” of information (e.g., real-time updates)
that can overwhelm consumers [Girish P. and Adam R. 2003]. Therefore, most web
based decision environments now make an electronic decision aid available to facilitate
information processing. As a result, we identify the online customer purchase decision
process as follows,
Figure 1: Online consumer purchase decision process
12
Next to the personal and external uncontrollable factors influencing the buying
behaviour, exposure of customers to the company’s marketing can affect the decision
making by providing inputs for the customer’s black box where information is
processed before the final customer’s decision is made [Kotler, 2003]. Online marketers
can influence the decision making process of the virtual customers by engaging
traditional, physical marketing tools but mainly by creating and delivering the proper
online experience. The web experience: a combination of online functionality,
information, emotions, cues, stimuli and products/ services, in other words a complex
mix of elements going beyond the 4Ps of the traditional marketing mix. The prime
medium of delivering the web experience is the corporate website, the interfacing
platform between the firm and its online clients [Constantinides, 2002].
Customer use of the internet is generally assumed to be more purposive and goal-
directed and therefore more “rational”, at least at this point in time [MacKenzie and
Lutz’s, 1989]. Moreover, online shoppers are far more likely to operate under
conditions of higher involvement presaging more active information seeking and
processing [Petty and Cacioppo, 1981, 1983]. In online shopping contexts, consumer’s
need for information is large because of the lack of real interaction with the product,
because such information is easily available on the Internet and the Internet also allows
direct purchase. Internet provides vast capacity of information storage, search and
retrieval, information customization and interactive communication makes it an
efficient medium for accessing, organizing, and communicating information [Peterson,
Balasubramanian, and Bronnenberg 1997]. Informational use of the Internet can
significantly reduce pre-purchase anxiety among consumers [Ghose and Dou 1998] and
pre-purchase sales information appears to be a major part of a web site’s value [Bruner,
1997]. Thus potential informational benefits include increased search efficiency, better
product evaluation and enhanced transaction convenience [Zeng and Reinartz 2003].
Therefore, some influential factors affect customer’s decision making such as trust,
security, reliability and price.
2.1.2. Customer Satisfaction and Service Quality The notion that enhancing the buyer-seller relationship and their mutual benefits like
satisfaction and performance through superior service quality dimensions has been
widely recognized [Zeithaml, 2000]. The service quality has been rightly treated as on
reliable vehicle for gaining sustainable competitive advantage, which means that
service quality aspects process a substantial strategic role for organizations. As an
online retailer grows, service quality has become an increasingly important factor in
determining the success or failure of online retail businesses by influencing consumer’s
13
online shopping experiences [Yang, 2001]. If an online company is to be successful, all
aspects of its service must be closely integrated in terms of systems, networks,
procurement, shipping and customer support. The key element of business achievement
is quality [Dale, 1999]. Without a quality management approach that guarantees quality
from its systems, staff and suppliers, a business will not be able to deliver the
appropriate level of service quality to satisfy its customers.
Service quality and customer satisfaction are inarguably the two core concepts that are
at the crux of the marketing theory and practice [Spreng and Mackoy, 1996]. In today’s
world of intense competition, the key to sustainable competitive advantage lies in
delivering high quality service that will in turn result in satisfied customers [Shemwell
et al., 1998]. The prominence of these two concepts is further manifested by the
cornucopia of theoretical and empirical studies on the topic that have emanated over the
past few years. Therefore, there is not even an iota of doubt concerning the importance
of service quality and customer satisfaction as the ultimate goals of service providers
[Sureshchandar, Chandrasekharan, Anantharaman, 2002]. Moreover, online service
quality is a crucial factor that can significantly contribute to customer satisfaction.
Service quality is defined as the customer’s subjective assessment of the expectations
with the actual service performance [Parasuraman et al., 1988]. Previous research that
examined online service quality measures include: e-service quality [Zeithaml et al.,
2000], SITEQUAL [Yoo and Donthu, 2001], WebQual [Barnes and Vidgen, 2000] and
e-TAILQ [Wolfinbarger and Gilly, 2003].
We believe that the above online service quality measuring tools were applied for
different contexts such as: online retailing, online travel services and portal site
services. However, it is apparent that very limited commonality exists among the
various service quality measures. Hence, these instruments have not been successful to
provide a comprehensive assessment of online customer satisfaction.
2.1.3. Perception and Expectation of Service Quality Parasuraman et al. [1985] presented a general model of service quality in the consumer
business. The central service gap originates from the difference between the perceived
and expected service quality from a consumer’s perspective (Figure: 2, Gap-5). The
extent to which services meet customer’s needs or expectations is one measure of
service quality. The fact that frequently little is known about customer expectations
makes it difficult to interpret the ratings produced by satisfaction surveys. SURVQUAL
is designed as a measurement instrument. We will go into the details of this measuring
part. What is interesting in this current context is the model that is behind the
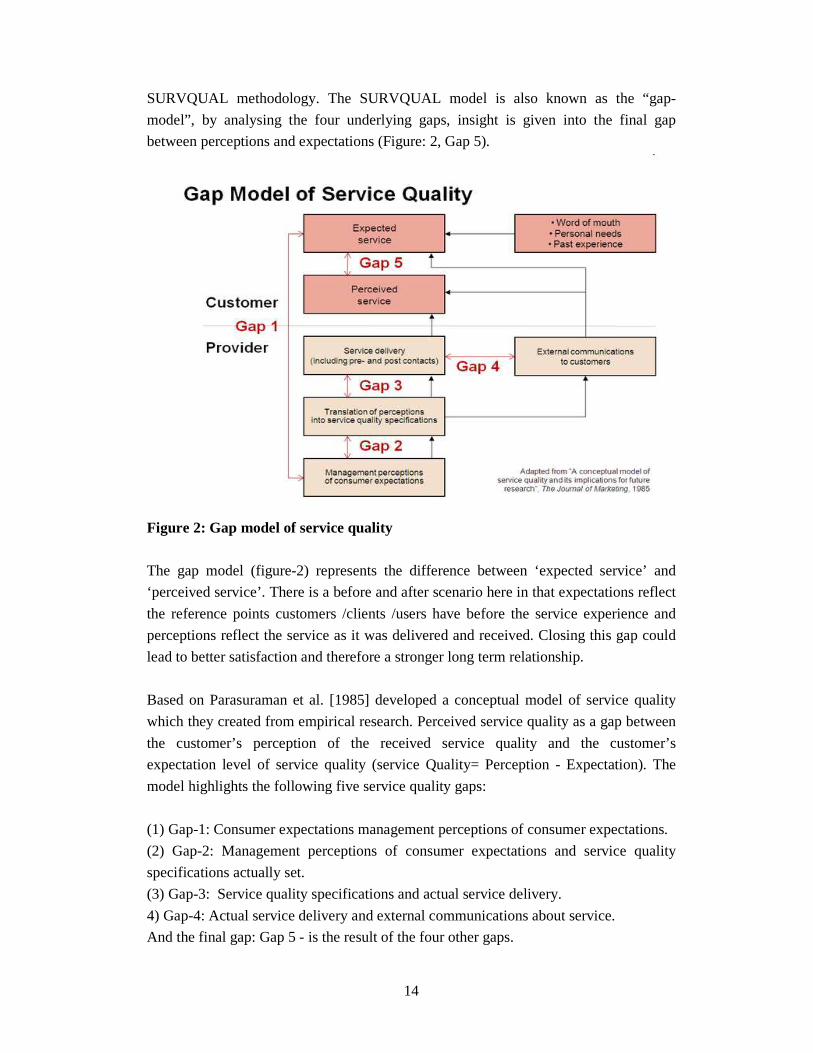
14
SURVQUAL methodology. The SURVQUAL model is also known as the “gap-
model”, by analysing the four underlying gaps, insight is given into the final gap
between perceptions and expectations (Figure: 2, Gap 5).
Figure 2: Gap model of service quality
The gap model (figure-2) represents the difference between ‘expected service’ and
‘perceived service’. There is a before and after scenario here in that expectations reflect
the reference points customers /clients /users have before the service experience and
perceptions reflect the service as it was delivered and received. Closing this gap could
lead to better satisfaction and therefore a stronger long term relationship.
Based on Parasuraman et al. [1985] developed a conceptual model of service quality
which they created from empirical research. Perceived service quality as a gap between
the customer’s perception of the received service quality and the customer’s
expectation level of service quality (service Quality= Perception - Expectation). The
model highlights the following five service quality gaps:
(1) Gap-1: Consumer expectations management perceptions of consumer expectations.
(2) Gap-2: Management perceptions of consumer expectations and service quality
specifications actually set.
(3) Gap-3: Service quality specifications and actual service delivery.
4) Gap-4: Actual service delivery and external communications about service.
And the final gap: Gap 5 - is the result of the four other gaps.
15
Authors Young and Varble [1997] focus on gap 5 can be calculated as the discrepancy
between the perceived and expected service quality. In the following, this gap will be
named performance gap from the internal customer’s perspective. The performance gap
from the customer’s perspective is a self-evaluation of purchaser’s service quality
perception in relation to their own expectations. The gap will be negative if these
expectations are not met by customers own performance. Since customer’s expectations
should be similar to their perceptions of their expectations, the performance gap from
the customer’s perspective largely corresponds to the sum of gaps 2 and 3 in the
Parasuraman et al. [1985] model. An aggregation of both gaps is appropriate in the case
of the internal performance measurement, as typically no formal specifications exist for
internal service quality. In contrast, Frost and Kumar [2000] define internal service
performance gap as the “difference between service quality specifications and the
service actually delivered”.
2.2. Tools of Measuring Online Service Quality
2.2.1. SERVQUAL
Satisfaction is one of the most important concepts in marketing and has attracted a great
deal of research interest in the past few decades. Existing customer satisfaction
literatures [Anderson and Sullivan, 1993] highlighted the importance of service quality
as an antecedent of customer satisfaction. Service quality is the customer’s subjective
assessment of the expectations with actual service performance (Parasuraman et al.
1985). The evaluation are not made solely on the outcome of a service, they also
involve evaluations of the process of service delivery.
SERVQUAL provides a technology for measuring and managing service quality (SQ).
Since 1985, when the technology article was first published, its innovators
Parasuraman, Zeithaml and Berry, have further developed, promulgated and promoted
the technology through a series of publications [Parasuraman et al., 1985; 1986; 1988;
1990; 1991a; 1991b; 1993; 1994; Zeithaml et al., 1990; 1991; 1992; 1993].
SERVQUAL is founded on the view that the customer’s assessment of service quality
is paramount. This assessment is conceptualized as a gap between what the customer
expects by way of service quality from a class of service providers (for instance, all
opticians) and their evaluations of the performance of a particular service provider (e.g.,
a single Specsavers store). Service quality is presented as a multidimensional construct.
In their original formulation Parasuraman et al. [1985] identified ten dimensions of
service quality: (1) Access (approachability and ease of contact), (2) communication
16
(informing and listening to customers), (3) competence (possession of required skills
and knowledge to perform the service), (4) courtesy (demeanour and attitude of contact
personnel), (5) credibility (trustworthiness and honesty), (6) reliability (consistency of
performance and dependability), (7) responsiveness (timeliness of service and
willingness of employees), (8) security (freedom from danger, risk or doubt), (9)
tangibles (physical evidence of service), and (10) understanding/knowing the customer.
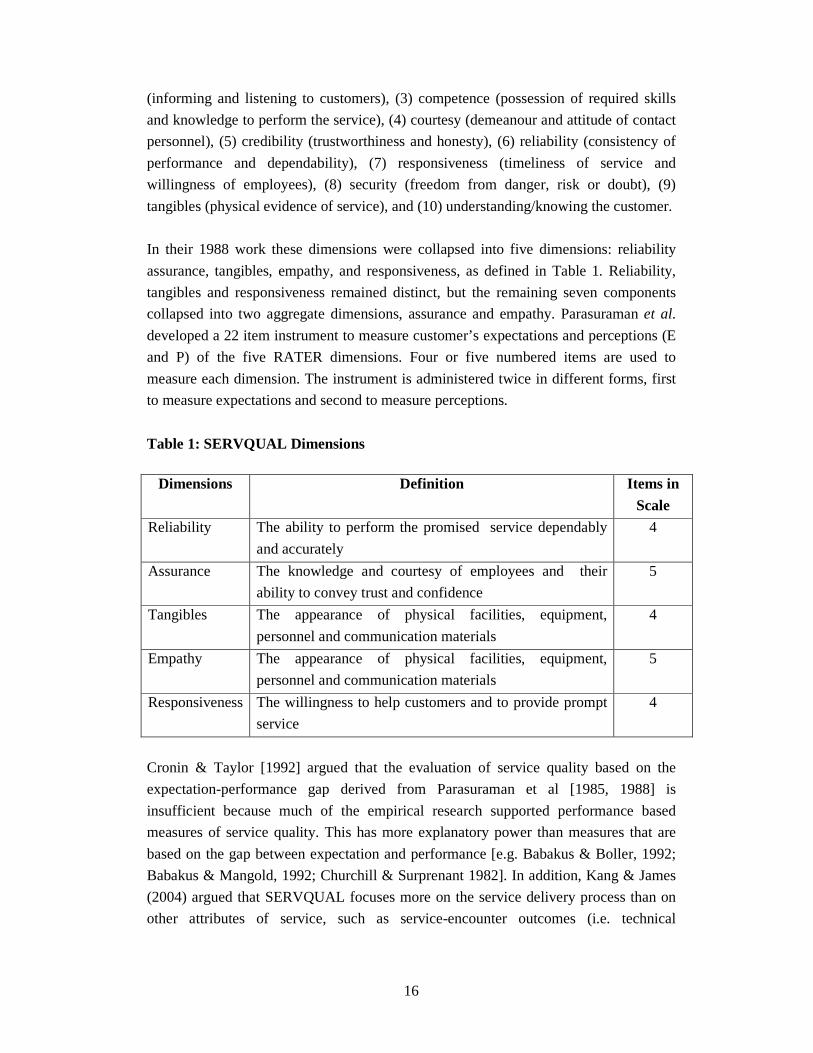
In their 1988 work these dimensions were collapsed into five dimensions: reliability
assurance, tangibles, empathy, and responsiveness, as defined in Table 1. Reliability,
tangibles and responsiveness remained distinct, but the remaining seven components
collapsed into two aggregate dimensions, assurance and empathy. Parasuraman et al.
developed a 22 item instrument to measure customer’s expectations and perceptions (E
and P) of the five RATER dimensions. Four or five numbered items are used to
measure each dimension. The instrument is administered twice in different forms, first
to measure expectations and second to measure perceptions.
Table 1: SERVQUAL Dimensions
Dimensions Definition Items in
Scale
Reliability The ability to perform the promised service dependably
and accurately
4
Assurance The knowledge and courtesy of employees and their
ability to convey trust and confidence
5
Tangibles The appearance of physical facilities, equipment,
personnel and communication materials
4
Empathy The appearance of physical facilities, equipment,
personnel and communication materials
5
Responsiveness The willingness to help customers and to provide prompt
service
4
Cronin & Taylor [1992] argued that the evaluation of service quality based on the
expectation-performance gap derived from Parasuraman et al [1985, 1988] is
insufficient because much of the empirical research supported performance based
measures of service quality. This has more explanatory power than measures that are
based on the gap between expectation and performance [e.g. Babakus & Boller, 1992;
Babakus & Mangold, 1992; Churchill & Surprenant 1982]. In addition, Kang & James
(2004) argued that SERVQUAL focuses more on the service delivery process than on
other attributes of service, such as service-encounter outcomes (i.e. technical
17
dimensions). In other words, the SERVQUAL measurement does not adequately
explain the technical attribute of service.
2.2.2. E- SERVQUAL Customer’s assessment of a website’s quality includes not only experiences during their
interactions with the site but also post-interaction service aspects (i.e., fulfilment,
returns) [Zeithaml, Parasuraman, and Malhotra’s; 2000]. The SERVQUAL scales
[Parasuraman et al, 1991] can evidently not be applied as such to e-service, but
dimensions that closely resemble them can be constructed. Nonetheless, additional
dimensions may be needed to fully capture the construct of e-service quality [Zeithaml
et al. 2002].
Kaynama and Balack (2000) and Zeithaml [2000] have recently proposed a number of
e-quality dimensions. In a first attempt to adapt SERVQUAL dimensions to e-services,
Kaynama and Balack [2000] subjectively evaluation the online services of 23 travel
agencies and seven dimensions derived from SERVQUAL: responsiveness, content and
purpose (derived from reliability), accessibility, navigation, design and presentation (all
derived from tangibles), background (assurance) and personalization and customization
(derived from empathy).
Recently, Zeithaml et al. [2000] developed e-SERVQUAL for measuring e-service
quality. Through the focus group interview they have indentified seven dimensions of
service quality: efficiency, reliability, fulfillment, privacy, responsiveness,
compensation and contract. They identified four dimensions: efficiency, reliability,
fulfillment and privacy, to form the core e-SERVQUAL scale that is used to measure
the customer’s perceptions of service quality delivery by online retailers. Zeithaml et al.
(2002) also found that three dimensions become salient only when the online customers
have questions or run into problems—responsiveness, compensation, and contact.
2.2.3. E-S-QUAL
One of the first definitions of e-service quality is conceptualized by Zeithaml,
Parasuraman, and Malhotra (2000). They state that internet service quality is the extent
to which a website facilitates efficient and effective shopping, purchasing and delivery
of products or services. Zeithaml et al. (2000, 2002) and Parasuraman et al. (2005)
carry out a study on internet service quality based on earlier research on service quality
in the traditional distribution channels and develop an E-S-QUAL scale based on the 7
dimensions proposed by Zeithaml (Zeithaml 2000, 2002; Parasuraman, 2005). Zeithaml
18
et al. (2002) conduct the comparison between SERVQUAL and E-S-QUAL
dimensions. Zeithaml (2002) state that some dimensions of the SERVQUAL can be
applied to e-service quality, but there are additional dimensions in e-service, many of
which are specifically related to technology. The E-S-QUAL scale comprises 11
dimensions in e-service quality and later Parasuraman et al. (2005) developed the E-S-
QUAL into to a seven dimensions scale. The seven dimensions are split into two
separated scales the core dimensions and the recovery dimensions. E-S-QUAL is the
name of the scale for the core dimensions: efficiency, system availability, fulfillment,
and privacy. The second scale is titled E-RecS-QUAL: responsiveness, compensation
and contact (Parasuraman et al., 2005). It offers the surface dimensions of e-service
quality based on customers experience and evaluation perspective, which are viewed
also as the antecedents to the adoption of e-service (Rowley, 2006). Both scales
demonstrate good psychometric properties based on findings from a variety of
reliability and validity tests and build on the research conducted on the topic.
2.2.4. WebQual
WebQual (Barnes and Vidgen, 2001), is based on the application of communication
theory to understand customer – e-commerce interaction. Its main instrument is an
online questionnaire which is applied to assess customer’s perceptions of the quality of
websites. The questionnaire contains a set of qualitative items, evaluated using a seven-
point scale, from 1 (strongly disagree) to 7 (strongly agree).
Website success has of late become the focus of great interest and attention. Recently,
Loiacono [2000] developed and validated the WebQual, a web site quality measure
with 12 core dimensions. These twelve components were empirically proved to be
distinct, well measured, to reflect overall web site effectiveness and to impact a
consumer’s intention to purchase or revisit. The instrument consists of 12 (Table 2)
dimensions: informational fit-to-task, tailored communications, trust; response time,
ease of understanding, intuitive operations, visual appeal, innovativeness,
flow/emotional appeal, consistent image, online completeness and relative advantage.
These 12 dimensions further collapse into 4 second order latent constructs: (1)
Usefulness, (2) Ease of use, (3) Entertainment, and (4) Complimentary relationship.
Scholar Loiacono et al. [2002] argue that the instrument is able to support a range of
important IS (Information System) and marketing studies as researchers attempt to
understand what contributes to success in the electronic market space. The second
objective of the study adopts a ‘drill-down’ approach [Finn and Kayande, 1997] into
the specific constructs of the “WebQual” instrument to explore whether any differences
exist between three websites. Additionally, it provides a preliminary understanding of
19
differences between websites from different industry settings. Although these websites
are not representative of the industries; however it does provide a basis for more in-
depth research. The Websites selected for the study were drawn from the 1) airline, 2)
e-retail and 3) computer industry.
As the development of Internet technology continues to grow at an exponential rate the
measurement of Website quality in the context of business-to-consumer (B2C)
electronic commerce has forced academics and practitioners to develop rigorous and
reliable methods [Zeithaml, Parasuraman and Malhotra 2002]. To increase the customer
base in B2C e-commerce it is important to implement and continuously review the
quality of e-services [Singh, 2002].
Table-2: WebQual Dimension
Initial Higher Level Category
Dimension Description
Ease of Use Ease of Understanding Easy to read and understand.
Intuitive Operation Easy to operate and navigate.
Usefulness Informational Fit-to-task The information provided meets task needs and
improves performance.
Tailored
Communication
Tailored communication between consumers
and the firm.
Trust Secure communication and observance of
information privacy.
Response Time Time to get a response after a request or an
interaction with a site.
Entertainment Visual Appeal The aesthetics of a Web site.
Innovativeness The creativity and uniqueness of site design.
Emotional Appeal The emotional effect of using the Web site and
intensity of involvement.
Complementary
Relationship
On-Line Completeness Allowing all or most necessary transactions to
be completed online (e.g., purchasing over the
Web site)
Relative Advantage Equivalent or better than other means of
interacting with the company.
Consistent Image The Web site image is compatible with the
image projected by the firm through other
media.
20
2.3. Relationship between Service Quality Measuring Tools
One of the first definitions of eservice quality is conceptualized by Zeithaml,
Parasuraman and Malhotra [2000]. They state that Internet service quality is the extent
to which a web site facilitates efficient and effective shopping, purchasing and delivery
of products or services. Zeithaml et al. [2000, 2002] and Parasuraman et al. [2005]
carry out a study on internet service quality based on earlier research on service quality
in the traditional distribution channels and develop an E-S-QUAL scale based on the 7
dimensions proposed by Zeithaml [Zeithaml 2000, 2002; Parasuraman et al., 2005].
Zeithaml et al. [2002] conduct the comparison between SERVQUAL and E-S-QUAL
dimensions. Zeithaml [2002] state that some dimensions of the SERVQUAL can be
applied to eservice quality, but there are additional dimensions in e-service, many of
which are specifically related to technology. The E-S-QUAL scale comprises 11
dimensions in e-service quality and later Parasuraman et al. [2005] developed the E-S-
QUAL into to a seven dimensions scale. The seven dimensions are split into two
separated scales the core dimensions and the recovery dimensions. E-S-QUAL is the
name of the scale for the core dimensions: efficiency, system availability, fulfillment
and privacy. The second scale is titled E-RecS-QUAL: responsiveness, compensation,
and contact [Parasuraman et al., 2005]. It offers the surface dimensions of eservice
quality based on customers experience and evaluation perspective, which are viewed
also as the antecedents to the adoption of e-service [Rowley, 2006].
In addition, the other framework’s coverage is focused on one or two of the stages of
the service encounter. WebQual and E-SERVQUAL emphasize the need for providing
service quality at different stages of the service encounter, illustrating the need for E-
Businesses to look beyond the Web site. However, E-SERVQUAL has a particular
focus towards the post-purchase stage while WebQual’s characteristics are more
concentrated in the pre-purchase stage. Zhang and Von Dran’s focus on the web design
and, hence, don’t provide any guidance for the post-purchase stage.
21
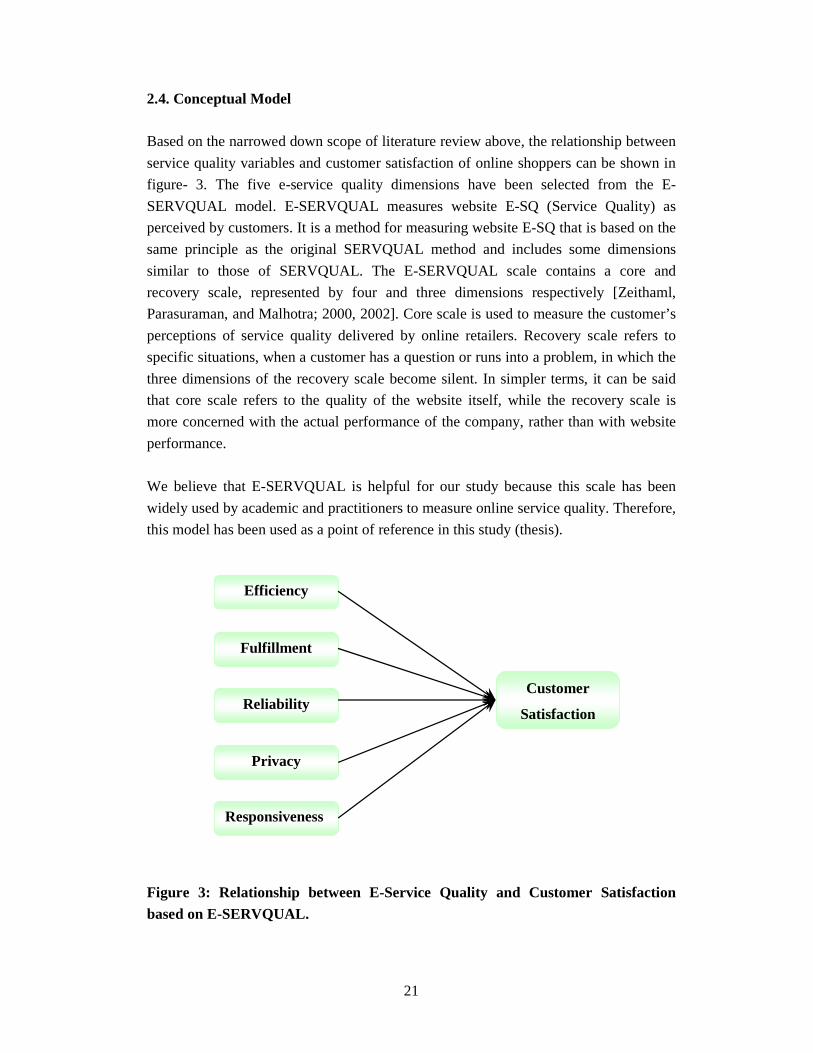
2.4. Conceptual Model Based on the narrowed down scope of literature review above, the relationship between
service quality variables and customer satisfaction of online shoppers can be shown in
figure- 3. The five e-service quality dimensions have been selected from the E-
SERVQUAL model. E-SERVQUAL measures website E-SQ (Service Quality) as
perceived by customers. It is a method for measuring website E-SQ that is based on the
same principle as the original SERVQUAL method and includes some dimensions
similar to those of SERVQUAL. The E-SERVQUAL scale contains a core and
recovery scale, represented by four and three dimensions respectively [Zeithaml,
Parasuraman, and Malhotra; 2000, 2002]. Core scale is used to measure the customer’s
perceptions of service quality delivered by online retailers. Recovery scale refers to
specific situations, when a customer has a question or runs into a problem, in which the
three dimensions of the recovery scale become silent. In simpler terms, it can be said
that core scale refers to the quality of the website itself, while the recovery scale is
more concerned with the actual performance of the company, rather than with website
performance.
We believe that E-SERVQUAL is helpful for our study because this scale has been
widely used by academic and practitioners to measure online service quality. Therefore,
this model has been used as a point of reference in this study (thesis).
Figure 3: Relationship between E-Service Quality and Customer Satisfaction based on E-SERVQUAL.
Efficiency
Reliability
Privacy
Responsiveness
Fulfillment
Customer
Satisfaction
22
2.4.1. Efficiency Efficiency defines as customer’s ability to effectively access the website, find their
desired product and related information and check it out with minimal effort [Zeithaml
et al. 2002]. Efficiency refers to the speed of downloading, searching and navigation
[Jessica, 2003]. There was complete agreement among respondents about the need for
efficient service that is, fast downloading, fast loading of page and images and speedy
search mechanisms. Although service providers often blame the specifications of the
hardware in the consumer’s possession for inefficiency, providers can increase
efficiency, even if consumers have low-speed PCs, by reducing the number of
complicated graphics (any given page contains few graphics and these are appropriate
to page content, graphics are not essential to site use. If graphics are turned off or a
text-only client is used, the site remain fully functional) and by using interlacing.
2.4.2. Fulfillment Fulfillment refers to a company’s actual performance in contrast with what is promised
through the website, and incorporates accuracy of service promises, such as having
products in stock and timely delivery [Cristian, & Iulian, 2007]. Online marketers can
use trust to lessen the effects of perceived performance risk and subsequent financial
risk through lack of fulfillment. Customers need to be able to trust that their order will
be fulfilled: that is, delivered in the case of physical goods or available to experience in
the case of services. As Siyal and Barkat [2002] put it, the risk is to pay for something
and get unexpected goods or nothing delivered. Financial risk is avoided if the product
is satisfactory and a customer’s financial details are not abused. Ha [2004] suggests that
marketers should give better information in their websites, rather than more. The result
should be that customers are better informed about when they can expect their order to
be processed and are given any other relevant information about the fulfillment of the
transaction, which helps to develop trust in fulfillment. Efficiency in fulfillment of the
order reduces the amount of time spent by the customer in chasing delivery or querying
the progress of the order. Likewise, if the right product is provided, it saves the
customer time in searching for an alternative elsewhere.
2.4.3. Reliability
Reliability is a technical function of the website such as the extent to which it is
available and functioning properly [Cristian, & Iulian, 2007]. Scholar [Jessica, 2003]
said “reliability refers to the ability to perform the promised service accuracy and
consistently, including frequency of updating the website, prompt reply to customer
23
enquiries and accuracy of online purchasing and billing”. This findings is consistent
with the view of Parasuraman et al [1998], he stated that reliability is the most
important dimension in all services. Focus group participants repeatedly emphasized
frustration that many websites do not update frequently. In contrast, websites providing
up-to-date information received high appraisals. Moreover, Reliability involves
consistency of performance and dependability. It means that the firm performs the
service right the first time. It also means the firm honors its promises. Especially it
involves: accuracy in billing, keeping records correctly, performing the service at the
designated time (Berry et al., 1985).
2.4.4. Privacy The privacy dimension includes assurance that shopping behaviour data are not shared
and that credit card information is secured [Zeithaml, 2002]. The construct of privacy
refers to companies not sharing information with third parties unless the customer gives
permission. It also includes the security of sensitive information between the customer
and the company [Hoffman, Novak, and Peralta 1999; Wolfinbarger and Gilly 2002]. In
addition, this includes providing visual symbols, so customers know a secure
connection is being achieved. Lessig [1999] mentioned that as the number of
consumer’s purchases through the internet increases, electronic vendors can
increasingly obtain online buyer’s private information such as demographic profiles or
consumer shopping behaviour which can be passed on to third parties. However,
Shapiro [2000] argued that many successful online service providers have customized
their services and redesigned the offered products to match individual customers needs
identified through the customer’s personal information. Shapiro also found that privacy
problems can be solved from the interaction of law, code of conduct and markets which
can strengthen the existing regulations about compliance of online service providers to
their own privacy policy as specified on their websites, letting consumers have control
over their personal information for their own benefits such as money, goods or services.
2.4.5. Responsiveness
Responsiveness measures the ability of a company to provide appropriate information
to customers when a problem occurs, have mechanism for handling returns and
providing online guarantees [Zeithaml, 2002]. The ability to prompt provides service;
examples of responsiveness include calling the customer back quickly, serving lunch
fast to someone who is in a hurry or mailing a transaction slip immediately [Lamb,
Hair, McDaniel, 2009]. Accordingly, Watson et al. (1998) referred to responsiveness as
24
willingness to help customers and it can be measured by the time taken before replying
to customer’s inquiries. As suggested by Dubbs (2001), responsiveness is enhanced
when the site provides flexible return and exchange policies that will encourage
customers to make online purchases since it reduces the perceived risk associated with
the purchase. Liao and Cheung (2002), customers expect online stores to respond to
their inquiries promptly. In sum, previous researchers found that responsiveness of
web-based services have highlighted the importance of perceived service quality and
customer satisfaction (Yang and Jun, 2002; Zhu et al., 2002).
25
3. Methodology 3.1. Literature Search
With the rapid growth of internet and globalization of retail marketing, online
retail/shopping becomes popular in the mid-1990s with the popularization of the World
Wide Web (WWW). Correspondingly, the subsequently years saw the appearance of
research studies conducted to develop an understanding of user’s online purchasing
satisfaction. Given the fact that it usually takes a year or two year to have a research
published, we decide to restrict our search or research articles to the periods of year
1996 to end of year 2009. The other two criteria for selection are (1) that the articles are
empirical in nature and (2) that the article measure at least one of the indentified factors
in our taxonomy. We searched the following eight secondary Information System (IS)
journals: Journal of Marketing; Journal of Electronic Commerce Research; Journal of
Service Research; Journal of Retailing; Journal of Electronic Commerce; International
Journal of Electronic Commerce; Journal of Business Research; Journal of the
Academy of Marketing Science. In addition, an extensive scientific articles search to be
carried out based on five scientific articles database: Science Direct, Emerald Insight,
Jstor.org, Harvard business review and INSPEC and use Google Scholar search engine
for searching relevant articles of our study.
The searching was conducted out using the below keywords and their combinations: e-
commerce, Internet or online shopping/purchasing, e-retailing, consumer satisfaction in
online purchasing, and e-commerce in Bangladesh. In addition, some research articles
to be searched in Mid Sweden University library (www.bib.miun.se) databases by using
both English and Swedish key words. Additional scientific article to be gathered from
the reference lists of our study.
3.2. Research Strategy
The study is attempt to understanding the service quality of e-retailers and website
service provider and the customer’s purchasing decision through the internet. We are
using scholar’s theoretical concept and idea that guides us to find out the right path-
deductive approach. According to Hussey and Hussey [1997:19] a conceptual and
theoretical structure is developed which is then tested by empirical observation; thus
particular instances are deducted from general influences. On the other hand, Inductive
approach is “developed from the observation of empirical reality, thus general
inferences are induced from particular instances, which is the reverse of the deductive
26
method since it involves moving from individual observation to statements of general
patterns or laws” [Hussey and Hussey, 1997:13].
According to Guba and Lincon [1994], two approaches or methods-quantitative and
qualitative approaches are available to researchers. In this study, we are using
quantitative approach that would be the best fit for our study; it’s helping us to design
the questionnaires and testing the survey required. The qualitative approach emphasizes
on process and meanings that are not measured in terms of quality, amount, and
intensity or frequently. The qualitative approach provides a deeper understanding of the
phenomenon within its contest [Guba and Lincoln, 1994; Ghanatabadi, 2005].
Moreover, qualitative researchers stress the socially constructed nature of reality that
states the relationship between the researcher and the phenomenon under investigation.
On the other hand, quantitative researchers emphasize the measurement and analysis of
causal relationship between variables.
According to Cooper and Schindler [2003], quantitative research method contains large
randomized samples, more application of statistical and few applications of cases
demonstrating findings. The target of quantitative research is to ascertain the
relationship between independent variables and dependent variable in a population.
Besides, oftentimes, quantitative methods are use within natural science and the aim to
explain causal relationship, to facilitate generalization and also to foresee the future. On
the other hand, qualitative approach concentrated on providing a complete picture of
the situation the aim of accretion the understanding of social processes and
interrelations. It is defined as a research to explore and understanding the opinion s and
strive for in-depth understanding of various kind of finding in library research [Cooper
and Schindler, 2003]. As a result, we believe that quantitative approach is suitable for
our study that’s why we make research in quantitative methods.
3.3. Research Design
The present study is based on cross-sectional or social survey design with the objective
of measuring the satisfaction level of Bangladeshi consumer’s of online shopping.
There are five different types of research design; Experimental, Cross-Sectional or
Social survey design, Longitudinal design, Case study design and Comparative design
[Bryman and Bell, 2007]. We follow the cross-sectional or social survey design as
suitable for our study. A cross-sectional, oftentimes called a sample survey, can be
thought of as snapshot of the marketplace taken at a particular point in time. In this
design, the selected group of respondents is measured only once [Malhotra and
Peterson, 2006]. Cross-sectional research design is a quantitative data collection
27
approach, which data are collected by questionnaire or by structured interview through
the survey participants. In addition, Survey research comprises a cross-sectional design
in relation to which data are collected predominately by questionnaire or by structured
interview on more than one case (usually quite a lot more than one) and at a single
point in time in order to collect a body of quantitative or quantifiable data in connection
with two or more variables, which are then examined to detect patterns of association
[Bryman & Bell, 2007].
3.4. Questionnaire
The questionnaire has been used to gather the data needed to achieve the objectives of
this study. The questionnaire consists of questions that relate to possible factors
affecting customer satisfaction of online purchasing. We collected questions about E-
SERVQUAL (Efficiency, Fulfillment, Reliability, Privacy and Responsiveness) five
dimensions and the online customer satisfaction measuring questions from Sunil and
Keyoor [2008], Godwin, Kallol, Peeter, [2008] and Joel, Collier and Carol [2006]
articles. Only the responsiveness dimensions questions were taken from Dina, Allard,
Veronica and Sandra’s [2004] article. By using those questions authors measured the e-
service quality and customer satisfaction. A preliminary survey questionnaire has been
developed based on the relevant literature review. Thus taking into account that
questionnaire construction can appear deceptively simple and that poorly designed
instrument can lead to erroneous conclusion [Synodinos, 2003]. The questionnaires
have two parts; first part of the questionnaire provides general information about the
respondents. And the second part of the questionnaire disclose the measuring the e-
service quality and the customer satisfaction. We used Likert scale ranging from
1=Strongly Disagree to 5 = Strongly Agree, measuring of the intensity of respondent
answers. The questionnaire has been conducted a survey on Bangladeshi online
shoppers. All of questionnaires are English language because both responders and
observers easily to understand the questions; other substitute language not mentioned.
3.5. Sampling
The basic idea of sampling is that by selecting some of the elements in a population,
researcher may draws conclusions about the entire population. There are several
compelling reasons for sampling, including: lower cost, greater accuracy of result,
greater speed of data collection and availability of population selection [Cooper &
Schindler, 2003]. According to Saunders et al. [2000], sampling technique can be
28
divided into two types: a) Probability or representative sampling and non-probability or
judgment sampling.
In probability sampling, sampling units are selected by chance or probability.
Probability sampling is most commonly associated with survey based research. This
method of sampling permits the research to make interface or projections about the
targeted population from which the sample was drawn. Non-probability Samples
provides a range of alternative technique based on researcher subjective judgment
[Saunders et al. 2007]. In non-probability sampling the selection of elements for the
sample is not necessarily made with the aim of being statistically representative of the
population. Rather the researcher uses the subjective methods such as personal
experience, convenience, expert judgment and so on to select the elements in the
sample. As a result the probability of any elements of the population being chosen is
not known [Saunders et al., 2007].
In the present study we are using the probability sampling and non-probability, because
questionnaire was send to randomly selected Bangladeshi respondents by using the
cluster sampling. We selected our target population who live in Dhaka (Bangladesh)
city and user of internet. The targeted sample size was approximately 250 respondent’s
population in Dhaka city. In our survey two universities (MIST & ICT of MBSTU)
students and some randomly selected general people (Residents of Dhaka) were
participated. We communicated with them through the Facebook, E-mail and Skype.
Respondents were instructed to answer the questions based on their most recent online
purchase experience with one of the web-retailer via the Internet
3.6. Data Collection
There were two types of data sources that we obtained from the data collection
approaches. These two types of data sources were primary data and secondary data.
There are two major approached for gathering information about a situation, person,
problem or phenomenon. Sometimes, information required is already available and
need only be extracted. However there are times when the information must be
collected based upon these broad approaches to information gathering data are
categorized as: primary and secondary data. Secondary data are collected from
secondary sources such as government records, publications, personal record, census
[Ranjit Kumer, 1996] and primary data are collected from though: observation,
interview and/or questionnaires [Hair et al, 2003].
Data collection refers to the way in which the data was captured in the field setting.
According to Martins et al. [1996:122], primary data is obtained through qualitative and
29
quantitative methods. Qualitative research methods intend to gather in-depth, detailed
information trough methods such as in-depth interview, projective technique and focus
group [Welman et al., 2005:188]. Quantitative research methods focus on gather large
amount of information through survey such as mail, telephone and personal interview.
Qualitative methods are more unstructured, flexible and diagnostic than quantitative
methods and aim to obtain information from respondents in an indirect manner. These
methods are useful in exploratory research and are appropriate for hypothesis
generation [Du Plessis & Rousseau, 2005:28].
This study contains a fresh primary data. This primary data collected through the online
survey. The survey was distributed in September 2010 to a group of randomly selected
online customers in Bangladesh. The targeted group of online consumer panel is
composed of nearly 250 and finally, 48 individuals responded to the survey.
Respondents received an e-mail invitation to participate in our questionnaires survey
with an attached URL linked to the web based survey form.
3.7. Data Analysis Methods After collecting all the data the process of analysis begins. To summarize and rearrange
the data several interrelated procedure are performed during the data analysis stage
(Zikmund 2000).
For quantitative data analysis, statistical tools of Microsoft Excel and SPSS 18.0v are
used for data input and analysis. The statistics results and linear regression analysis
results were presented by graphical form with detailed description.
3.8. Reliability and Validity
A good and fair measurement tool must always adhere to the criteria of being reliable
and valid. Reliability measures the accuracy and precision of the tool, thus an index that
registers the extent to which measured data is free from random error [Cooper and
Schindler, 2003:231]. Reliability refers to the ability of a scale to produce a consistent
result if repeated measurements are taken. Hence, reliability is a necessary condition for
quality measurement, but not sufficient if done alone. Before accepting and using any
measure, one must also ensure its validity. In addition, this study consists of two
university students and some general people of internet users in Dhaka city
(Bangladesh). We send them online customer satisfaction based quantitative
questionnaires, in this way it would be reliable study.
30
Validity refers to the accuracy of the tool actually measuring what it is supposed to
measure and to the extent to which a particular measure is free systematic and random
errors [Diamantopoulos and Schlegelmilch, 2000]. Besides Yin [2003, p.85] states, “no
single source has a complete advantage over all others”. The different sources are
highly complementary and a good case study should use as many source as possible.
The validity of scientific study increases by using various source of evidence [Yin,
2003]. This method allows a researcher to test the proposed structure of a model
entirely for the set of relationships simultaneously between dependent variables and
independent variables.
31
4. Results of Data Collection
4.1. Questionnaire Data Collection Results
Online survey has been conducted based on the Google Spreadsheet structured
questionnaires. The questionnaire has been developed based on the five variables of E-
SERVQUAL dimensions (Zeithamal et al., 2002, 2002). The purpose of the
questionnaire survey was to develop empirical evidence on the quality factors of
websites that are important to customers who are familiar with the online shopping and
frequent internet users. A small survey has been run with total 174 respondents out of
total 250 target population in Dhaka city (Bangladesh). Two university (ICT of
MBSTU & MIST) students helped us to collect information when running our survey.
The survey was done in a short time, i.e. between 18th September and 28th September.
In this period, only 48 respondents responded. We didn’t find any unfilled questions or
missing results out of 48 respondents. The questionnaire has 28 questions and divided
into two parts, the first part dealt with the general information questions about
respondent’s aspect and the second part dealt with customer’s online purchasing
satisfaction questions about five E-SERVQUAL dimensions aspect. For every aspect
we asked the respondents about their last online shopping experience and their
satisfaction level.
4.2. General Information Results
This part, consists of five general information about respondent’s; which is included
occupation, age, gender and two questions on shopper’s “experience of online
purchasing” and “shop in internet” their shopping mode choice. Name of respondent
was not compulsory question, it was asked to make the research more valid and
reliable. These items were investigated through the online survey, below are the survey
results based on the respondents answers,
32
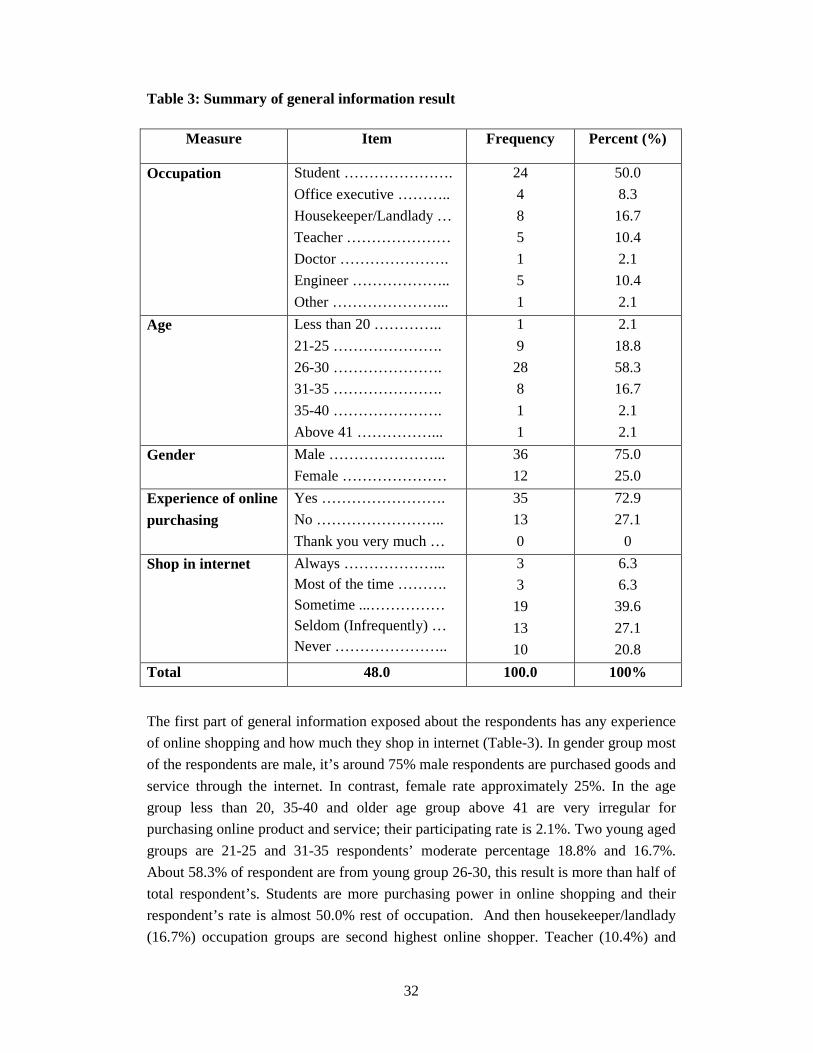
Table 3: Summary of general information result
The first part of general information exposed about the respondents has any experience
of online shopping and how much they shop in internet (Table-3). In gender group most
of the respondents are male, it’s around 75% male respondents are purchased goods and
service through the internet. In contrast, female rate approximately 25%. In the age
group less than 20, 35-40 and older age group above 41 are very irregular for
purchasing online product and service; their participating rate is 2.1%. Two young aged
groups are 21-25 and 31-35 respondents’ moderate percentage 18.8% and 16.7%.
About 58.3% of respondent are from young group 26-30, this result is more than half of
total respondent’s. Students are more purchasing power in online shopping and their
respondent’s rate is almost 50.0% rest of occupation. And then housekeeper/landlady
(16.7%) occupation groups are second highest online shopper. Teacher (10.4%) and
Measure Item Frequency Percent (%)
Occupation Student ………………….
Office executive ………..
Housekeeper/Landlady …
Teacher …………………
Doctor ………………….
Engineer ………………..
Other …………………...
24
4
8
5
1
5
1
50.0
8.3
16.7
10.4
2.1
10.4
2.1
Age Less than 20 …………..
21-25 ………………….
26-30 ………………….
31-35 ………………….
35-40 ………………….
Above 41 ……………...
1
9
28
8
1
1
2.1
18.8
58.3
16.7
2.1
2.1
Gender Male …………………...
Female …………………
36
12
75.0
25.0
Experience of online
purchasing
Yes …………………….
No ……………………..
Thank you very much …
35
13
0
72.9
27.1
0
Shop in internet Always ………………... Most of the time ………. Sometime ...…………… Seldom (Infrequently) … Never …………………..
3
3
19
13
10
6.3
6.3
39.6
27.1
20.8
Total 48.0 100.0 100%
33
engineer (10.4%) are pretty good for purchasing power in online shopping. Experience
of online purchasing (Yes, 72.9%) have experience in online shopping and, 27.1% (No)
have no shopping experience in online. moreover, 39.6 % respondents shop in internet
in sometimes, 20.8% respondents never shopping in internet. On the other hand,
approximately 27.1% respondents ‘infrequently’ shop in internet.
According to the result if we look at young people are more willing to buy products or
services in online and their age 26 between 30; and in age groups maximum of student
and some of housekeeper or landlady. Moreover, female respondents result is not good,
but also we can see (Table 3) 16.7% housekeeper are like to purchase in online, we
know that housekeeper are maximum female and they are shopping for their own
family and self. Teacher and Engineer profession respondents are moderate shoppers in
online shopping. From the frequency results we can compare between the occupation
group and aged groups that students and young people are more willing to purchase in
online.
4.3. Online Customer Satisfaction Results
The second part of the questionnaires represents the online purchasing decision and
customer satisfaction in terms of their last shopping experience. There are 23 questions
that were used to measure five independent variables i.e. efficiency, fulfillment,
reliability, privacy and responsiveness and one dependent variable that is customer
satisfaction. Using the Likert scale for measuring the questions level ranging from 1 to
5; according to the scale 1 is for “Strongly disagree” and 5 is for the top scale level
“Strongly agree”.
34
4.3.1. Efficiency Questionnaire Results Efficiency is the first independent variable of customer satisfaction of e-service quality.
We applied four basic questions of efficiency to measure the website quality, using by
Likert scale. The questions results are given below,
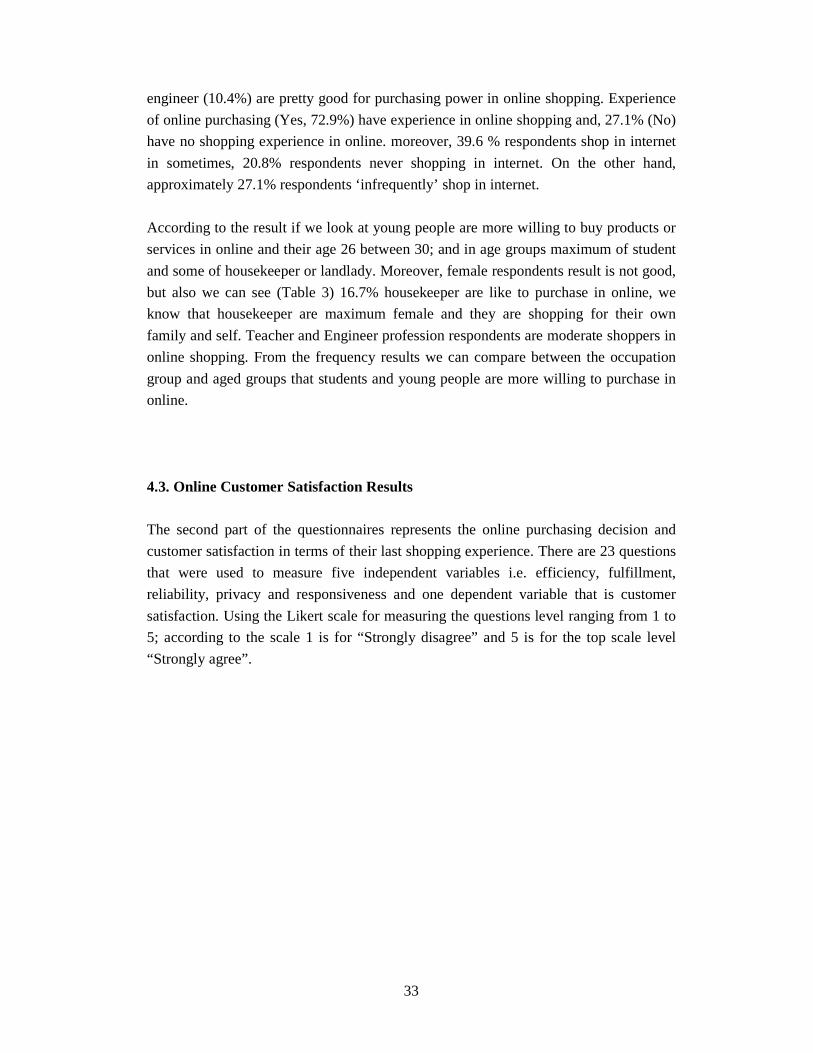
Figure 4: Results of efficiency questions 1 to 4 According to the figure 4, four questions of efficiency is related to easy to use of
website quality. In this section only 48 people responded the four questions. In question
1(website makes it easy to find what I need), we see that 19 respondents opted ‘agree’
that they can easily find their requirements where 14 respondents opted ‘strongly agree’
with this statement. And question 2 (makes it easy to get anywhere on the website) has
quite similar results. In addition, it has average scale results shown in question 3
(information at this website is well organized). But in question 4 (website is simple to
use), most of the respondents opted ‘strongly agree’ (24 respondents) that the website
quality is simple to use which is reverse picture of other three questions results.
1 0 2 04 5
55
10 9
15
5
19 22
15
14
14 12 11
24
0%
10%
20%
30%
40%
50%
60%
70%
80%
90%
100%
Strongly agree 14 12 11 24
Agree 19 22 15 14
Neither agree nor disagree 10 9 15 5
Disagree 4 5 5 5
Strongly disagree 1 0 2 0
1. This w ebsite makes it easy to find
w hat I need
2. It makes it easy to get anyw here on the
w ebsite
3. Information at this w ebsite is w ell
organised
4. The w ebsite is simple to use
35
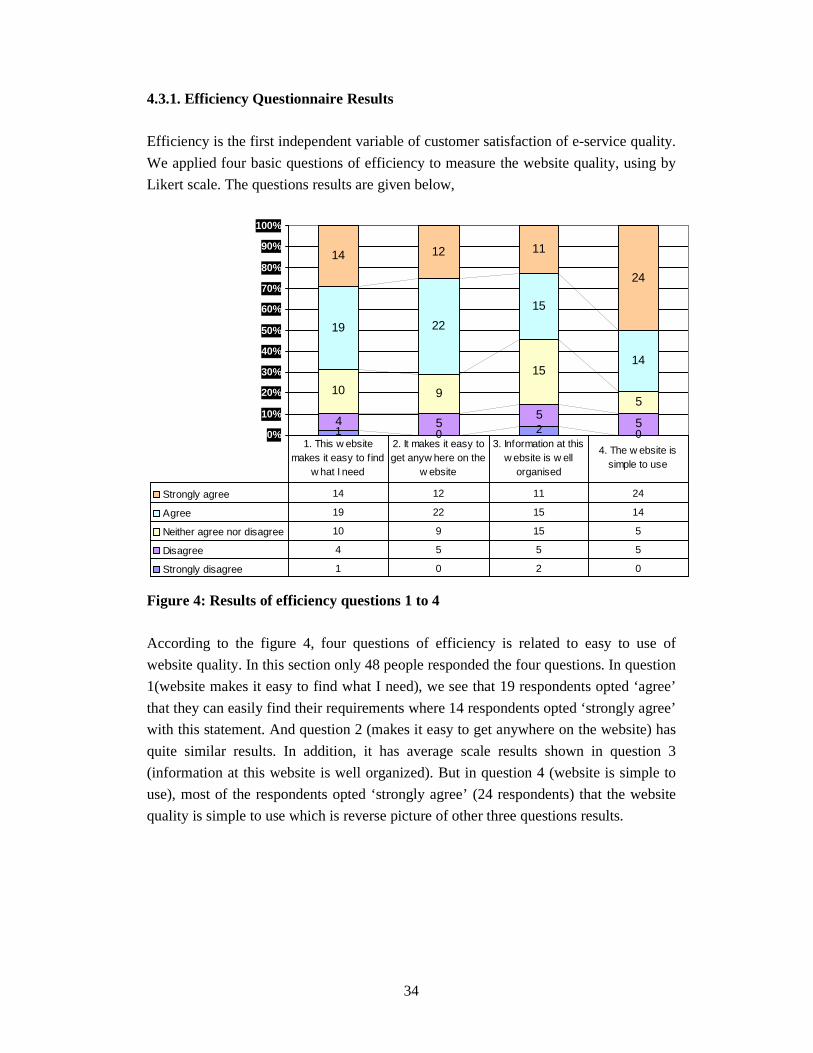
4.3.2. Fulfillment Questionnaire Results Fulfillment is the second independent variable for measuring customer satisfaction of
online shopping. It has four basic questions that are related to website product delivery
components. Results of these questions are expressed as below with graph,
Figure 5: Results of fulfillment questions 5 to 8
According to the figure-5, first questions refers to the most relevant results as specifed
(Questions 5). From this question, we get that most of the respondents picked ‘agree’
(18 respondents) whereas 16 respondents opted ‘neither agree nor disagree’. Questions
6 (quickly delivers the jobs search results), 7 (truthful about its service) and 8 (makes
accurate promises about the delivery service) shows almost the silmilar results, most of
the respondents choose ‘agree’ and ‘nither agree nor disagree’ for the above questions.
Most of the 48 respondents opted for ‘neither agree nor disgaree” scale results for all
the four questions. In addition, then the amount of ‘srongly disagre’ scale result is poor
within these four questions.
2 3 2 2
69 9 7
16
16 1716
1813 15
14
6 7 59
0%
10%
20%
30%
40%
50%
60%
70%
80%
90%
100%
Strongly agree 6 7 5 9
Agree 18 13 15 14
Neither agree nor disagree 16 16 17 16
Disagree 6 9 9 7
Strongly disagree 2 3 2 2
5. It delivers the most relevant results as
specified
6. It quickly delivers the job search
results
7. It is truthful about its services
8. It makes accurate promises about the delivery of services
36
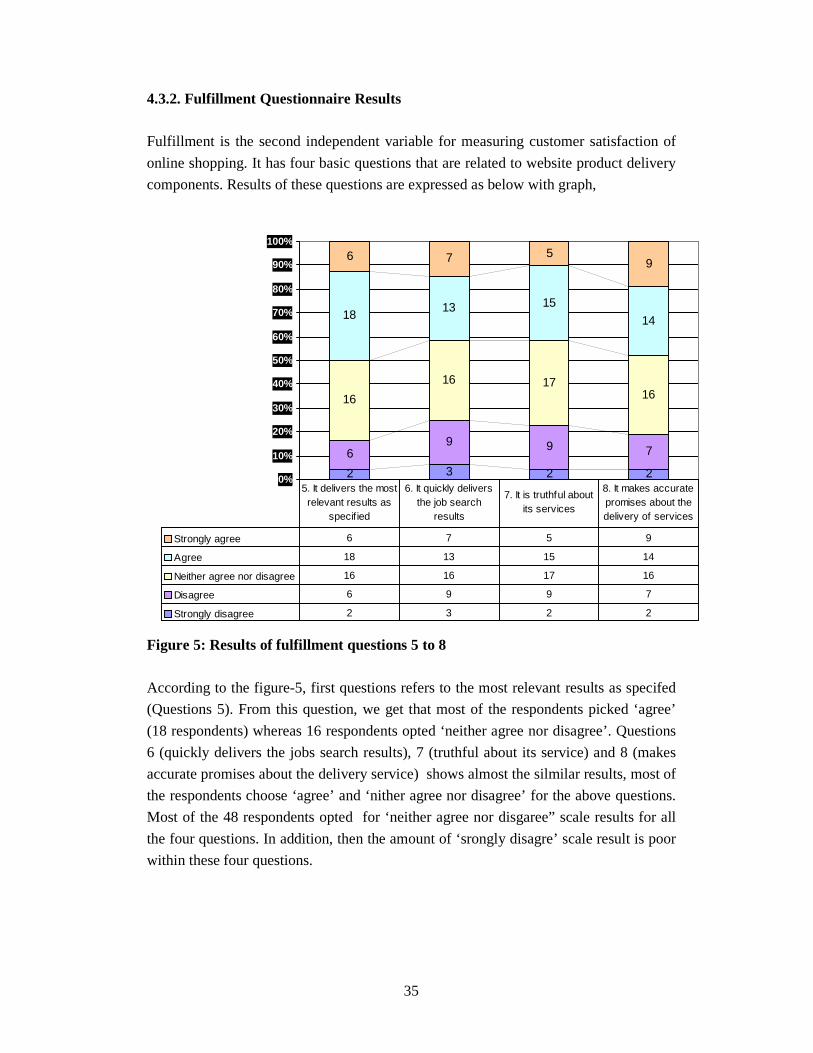
4.3.3. Reliability Questionnaire Results
Reliability is an important independent variable of e-service quality factor of customer
satisfaction. For measuring the reliability, we are using four basic questions of website
performance. Four questions have different motive of reliability that are given below
with results,
Figure 6: Results of reliability questions 9 to 12
The figure-6 represents the customer’s website purchase reliability variables. First three
questions 9 (security policy is accessible of this website), 10 (privacy policy is
accessible of this website), and 11 (website contains enough company details) have
different aspect but there is no big difference between the results, all the questions
almost have similar results where ’11’ respondents opted ‘agree’ with the first two
questions and 12 respondents opted ‘agreed’ with questions ‘11’ respectively. But the
result of question 12 is opposite; this question brings brand images are always
maintained by the website. Here, 14 respondents choose ‘agree’ and 17 people choose
‘neither agree nor disagree’ and 6 people ‘disagree’ with this statement which is the
lowest ‘disagree’ scale result out of four questions.
3 52 2
13 1114
6
14 12 11
17
1111 12 14
7 9 9 9
0%
10%
20%
30%
40%
50%
60%
70%
80%
90%
100%
Strongly agree 7 9 9 9
Agree 11 11 12 14
Neither agree nor disagree 14 12 11 17
Disagree 13 11 14 6
Strongly disagree 3 5 2 2
9. The security policy is accessible of this
w ebsite
10. The privacy policy is accessible of this
w ebsite
11. The w ebsite contains enough company details
12. The brand images are alw ays maintain
this w ebsite
37
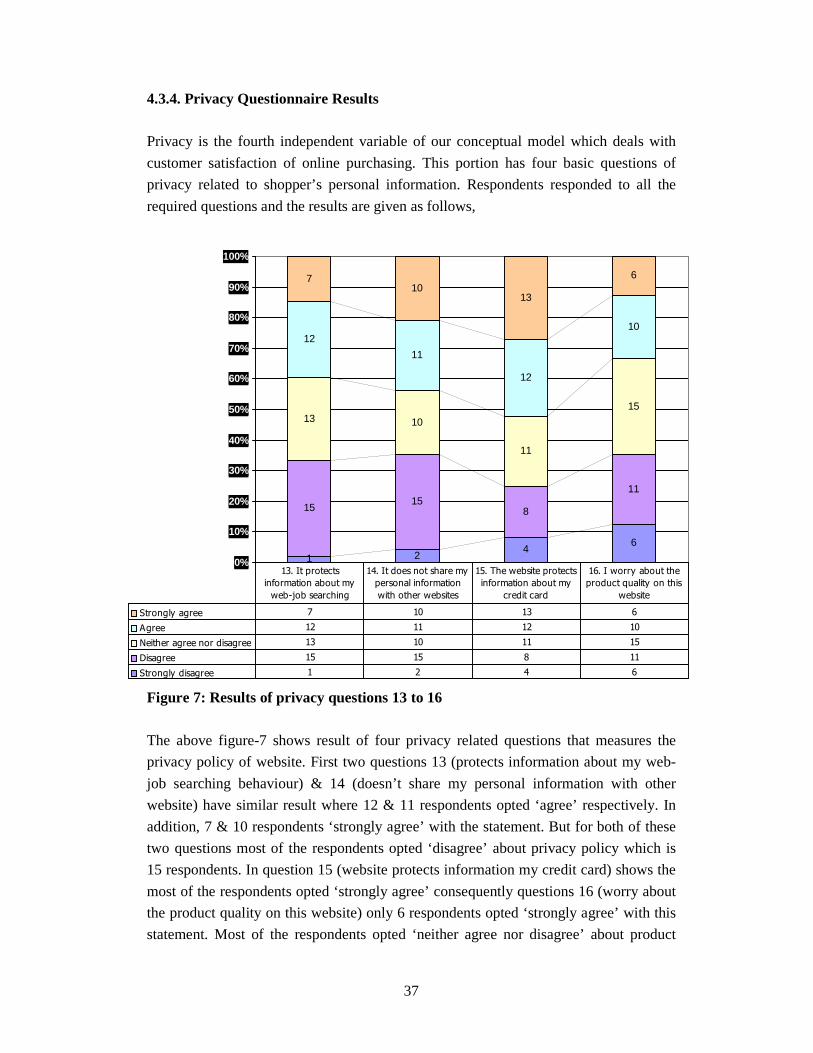
4.3.4. Privacy Questionnaire Results Privacy is the fourth independent variable of our conceptual model which deals with
customer satisfaction of online purchasing. This portion has four basic questions of
privacy related to shopper’s personal information. Respondents responded to all the
required questions and the results are given as follows,
Figure 7: Results of privacy questions 13 to 16 The above figure-7 shows result of four privacy related questions that measures the
privacy policy of website. First two questions 13 (protects information about my web-
job searching behaviour) & 14 (doesn’t share my personal information with other
website) have similar result where 12 & 11 respondents opted ‘agree’ respectively. In
addition, 7 & 10 respondents ‘strongly agree’ with the statement. But for both of these
two questions most of the respondents opted ‘disagree’ about privacy policy which is
15 respondents. In question 15 (website protects information my credit card) shows the
most of the respondents opted ‘strongly agree’ consequently questions 16 (worry about
the product quality on this website) only 6 respondents opted ‘strongly agree’ with this
statement. Most of the respondents opted ‘neither agree nor disagree’ about product
1 24
6
1515
8
11
13 10
11
15
12
11
12
10
710
13
6
0%
10%
20%
30%
40%
50%
60%
70%
80%
90%
100%
Strongly agree 7 10 13 6
Agree 12 11 12 10
Neither agree nor disagree 13 10 11 15
Disagree 15 15 8 11
Strongly disagree 1 2 4 6
13. It protects
information about my
web-job searching
14. It does not share my
personal information
with other websites
15. The website protects
information about my
credit card
16. I worry about the
product quality on this
website
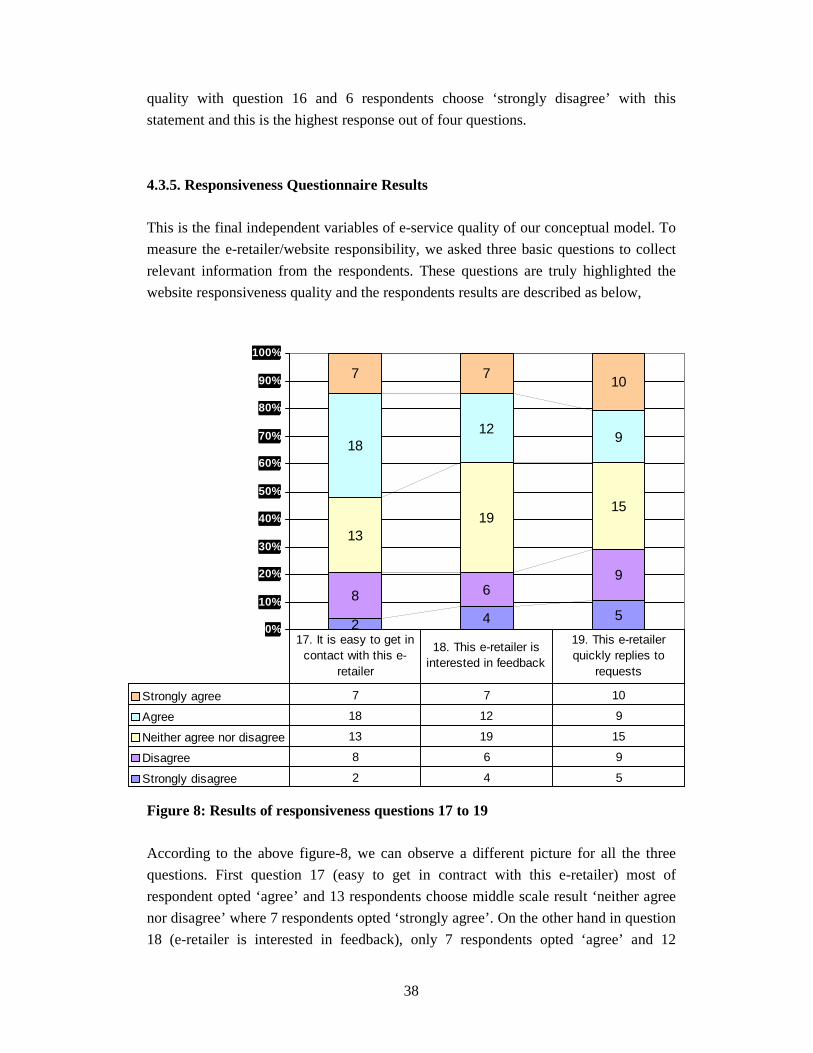
38
quality with question 16 and 6 respondents choose ‘strongly disagree’ with this
statement and this is the highest response out of four questions.
4.3.5. Responsiveness Questionnaire Results This is the final independent variables of e-service quality of our conceptual model. To
measure the e-retailer/website responsibility, we asked three basic questions to collect
relevant information from the respondents. These questions are truly highlighted the
website responsiveness quality and the respondents results are described as below,
Figure 8: Results of responsiveness questions 17 to 19 According to the above figure-8, we can observe a different picture for all the three
questions. First question 17 (easy to get in contract with this e-retailer) most of
respondent opted ‘agree’ and 13 respondents choose middle scale result ‘neither agree
nor disagree’ where 7 respondents opted ‘strongly agree’. On the other hand in question
18 (e-retailer is interested in feedback), only 7 respondents opted ‘agree’ and 12
2 4 58 6
9
1319
15
1812
9
7 710
0%
10%
20%
30%
40%
50%
60%
70%
80%
90%
100%
Strongly agree 7 7 10
Agree 18 12 9
Neither agree nor disagree 13 19 15
Disagree 8 6 9
Strongly disagree 2 4 5
17. It is easy to get in contact with this e-
retailer
18. This e-retailer is interested in feedback
19. This e-retailer quickly replies to
requests
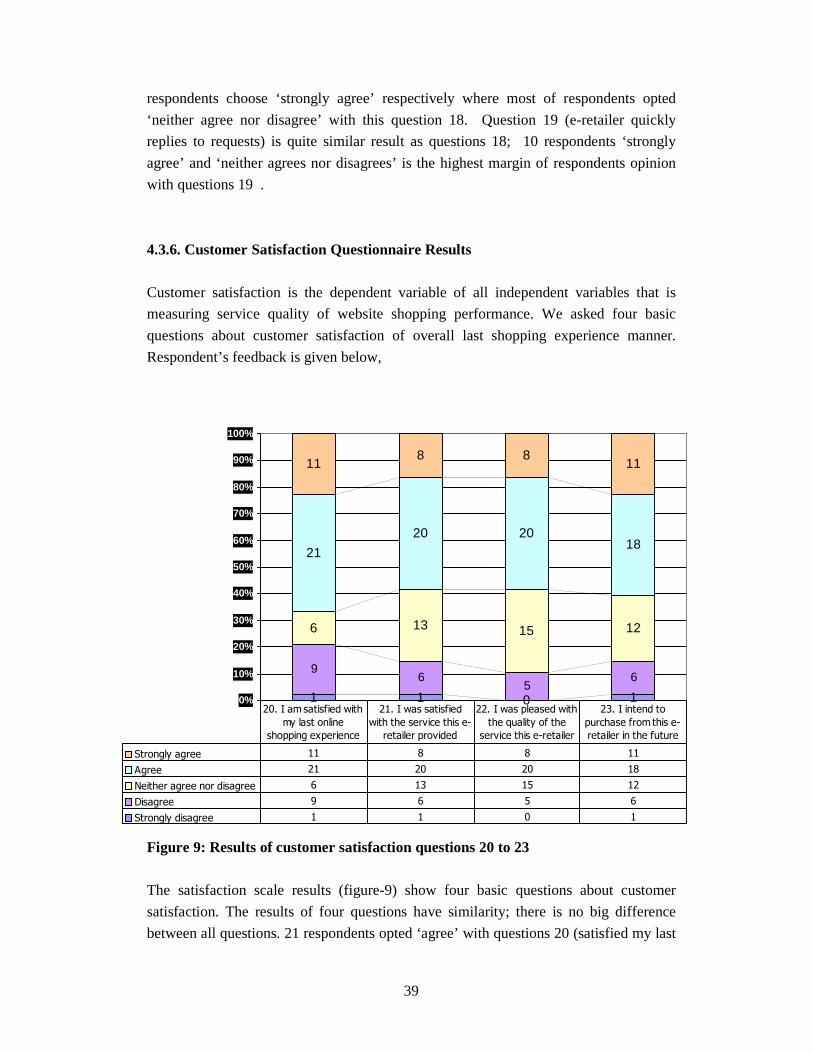
39
respondents choose ‘strongly agree’ respectively where most of respondents opted
‘neither agree nor disagree’ with this question 18. Question 19 (e-retailer quickly
replies to requests) is quite similar result as questions 18; 10 respondents ‘strongly
agree’ and ‘neither agrees nor disagrees’ is the highest margin of respondents opinion
with questions 19 .
4.3.6. Customer Satisfaction Questionnaire Results
Customer satisfaction is the dependent variable of all independent variables that is
measuring service quality of website shopping performance. We asked four basic
questions about customer satisfaction of overall last shopping experience manner.
Respondent’s feedback is given below,
Figure 9: Results of customer satisfaction questions 20 to 23 The satisfaction scale results (figure-9) show four basic questions about customer
satisfaction. The results of four questions have similarity; there is no big difference
between all questions. 21 respondents opted ‘agree’ with questions 20 (satisfied my last
1 1 0 1
96
56
6 13 15 12
21
20 2018
118 8
11
0%
10%
20%
30%
40%
50%
60%
70%
80%
90%
100%
Strongly agree 11 8 8 11
Agree 21 20 20 18
Neither agree nor disagree 6 13 15 12
Disagree 9 6 5 6
Strongly disagree 1 1 0 1
20. I am satisfied with
my last online
shopping experience
21. I was satisfied
with the service this e-
retailer provided
22. I was pleased with
the quality of the
service this e-retailer
23. I intend to
purchase from this e-
retailer in the future
40
online shopping experience) and only 6 respondents remained undecided as ‘neither
agree nor disagree’. Questions 21 (satisfied with the service this e-retailers provided)
and Questions 22 (pleased with the quality of the service this e-retailers provided) most
of respondents opted ‘agree’ with those statements (20 respondents). 11 respondents
‘strongly agree’ and 18 respondents ‘agree’ with question 23, as they are intend to
purchase from e-retailers in the future.
41
5. Analysis Analysing data variables are selected from the survey questionnaire results and the
study questionnaire based on Bangladeshi online shopper’s perspective. The variables
were selected on the basis of theoretical research framework and shopping experience
of Bangladeshi online shopper’s. The survey results data was input into SPSS data
sheet and Microsoft excel. We applied different analysing equation to find out our
relevant information, in this part only questionnaire part-2: online customer satisfaction
questionnaires were analyzed and following findings are demonstrated as below.
5.1. Analysis of Questionnaire Part-2
The second part questionnaires based on our conceptual model. Linear regression
analysis technique was applied to identify that how independent variables are affected
to the dependent variable. The linear regression model can be extended easily to
accommodate dichotomous predictors, including sets of dummy variables [Lewis-Back,
1980; Berry and Feldman, 1985]. The linear regression line is usually determined
quantitatively by a best-fit procedure such as least squares (i.e. the distance between the
regression line and every observation is minimized). In linear regression, one variable
is plotted on the X axis and the other on the Y. The X variable is said to be the
independent variable, and the Y is said to be the dependent variable. Due to the fact that
correlation coefficient between the variables that determine the coefficient. So the
regression analysis equation is Y= α +βX+ ε, to measuring the coefficient which we
used in our study analysis. Here, independent variables are e-service quality’s factors
and the dependent variable is satisfied with the service of e-retailers.
The linear regression analysis model is used to examine which independent variable is
important to determine the dependent variable and also the effectiveness of independent
variable. The analysis results are follows as below,
42
5.1.1. Efficiency Analysis Results
Coefficients Model Unstandardized
Coefficients Standardize
d Coefficients
t Sig.
B Std. Error Beta 1 (Constant) 3.161 .772 4.095 .000
Easy to find -.084 .176 -.086 -.478 .635
Easy to get -.066 .220 -.062 -.300 .765
Well organised .351 .241 .387 1.454 .153
Simple to use -.061 .219 -.062 -.278 .782
a. Dependent Variable: Satisfied with the service of e-retailers
Table 4: Linear regression analysis results of efficiency
According to the results of efficiency table 4, where ‘Beta’ is the coefficient beta of
independent variables. From the coefficient results (Beta=0.387) table, shows that the
‘well organised’ of website is the more important variable for developing service
quality of website. On the other hand, well organised variable shows only positive beta
results out of four efficiency independent variable. Moreover, easy to find, easy to get
and simple to use independent variables represent the negative ‘beta’ results. So, it’s
not measure the more important for efficiency of website quality required.
5.1.2. Fulfillment Analysis Results
Coefficients Model Unstandardized
Coefficients Standardized Coefficients
t Sig.
B Std. Error Beta 1 (Constant) 1.920 .494 3.887 .000
Delivery the most Relevant result
.111 .259 .113 .426 .672
Quickly delivers the job search
.162 .189 .184 .857 .396
43
Truthful about its services
.110 .206 .114 .532 .598
Accurate promises about the delivery
.117 .194 .130 .606 .548
a. Dependent Variable: Satisfied with the service of e-retailers
Table 5: Linear regression analysis results of fulfillment
The above table 5, shows that the quickly delivery the jobs search is the most important
independent variable in all independent variables. According to the coefficient beta
(Beta= 0.184) results shows that the ‘quickly delivery the jobs search ’is the highest
positive beta result from other three independent variable. Accurate promises about the
delivery (Beta=0.130) variable is the second highest margin positive beta results shows.
Last two variables ‘delivery the most relevant result’ and ‘truthful about its services’
represent also positive beta results. But it’s not quite important for fulfilment
independent variable as website quality perspective.
5.1.3. Reliability Analysis Results
Coefficients
Model Unstandardized Coefficients
Standardized Coefficients
t Sig.
B Std. Error
Beta
H1
(Constant) 1.672 .455 3.674
.001
Security policy is accessible .038 .194 .045 .197 .845
Privacy policy is accessible .083 .185 .108 .452 .654
Website contains enough company details
.238 .149 .288 1.595
.118
Brand image always maintain this website
.218 .152 .237 1.433
.159
a. Dependent Variable: Satisfied with the service of e-retailers
Table 6: Linear regression analysis results of reliability
44
According to the analysis results of reliability (Table 6), website contains enough
company details independent variable shows the higher coefficient beta (Beta=0.288)
result than other three variables of reliability. It measures the most important
independent variable of website service quality and its effectiveness is also higher than
other variables. Brand image always maintain website is the second highest coefficient
beta (Beta=0.237). From the results, we can see variable ‘security policy is accessible’
and ‘privacy policy is accessible’ show the lowest coefficient beta rate which is not
measure the quite important for service quality of reliability performance.
5.1.4. Privacy Analysis Results
Coefficients
Model Unstandardized Coefficients
Standardized Coefficients
t Sig.
B Std. Error
Beta
1 (Constant) 1.962 .468 4.195 .000
Protects information about web-job searching
-.076 .163 -.085 -.464 .645
Doesn’t Share personal information with other websites
.298 .157 .371 1.900 .064
Website Protect information about credit card
.092 .148 .120 .621 .538
Worry about the product quality
.193 .116 .238 1.664 .103
a. Dependent Variable: Satisfied with the service of e-retailers
Table 7: Linear regression analysis results of privacy
The above table 7, represents the privacy coefficient analysis results, retailers website
‘doesn’t share personal information with other websites’ is the most important
independent variable of service quality. For this variable coefficient, beta (Beta=0.371)
result is strongly highlighted. Second highest independent variable is ‘worry about the
product quality’ shows the positive coefficient variable results (Beta=0.238).
Moreover, for independent variable ‘website Protect information about credit card’
result of coefficient beta (0.120) is less significant and ‘Protects information about web-
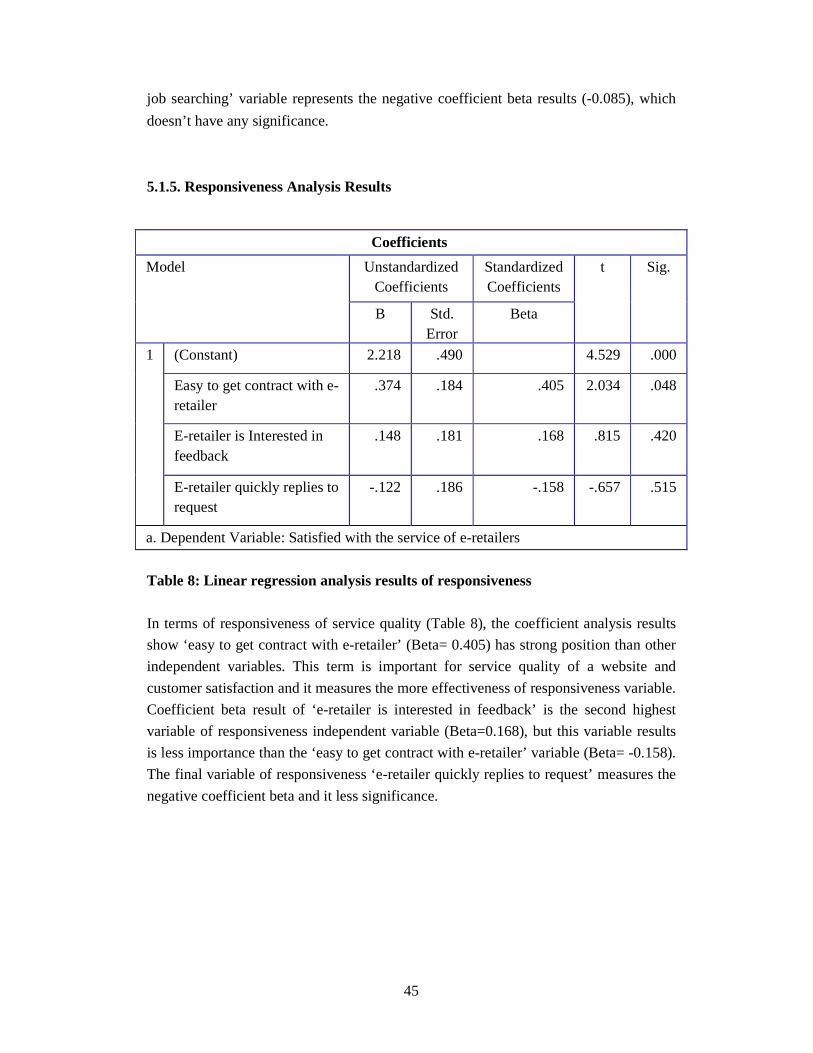
45
job searching’ variable represents the negative coefficient beta results (-0.085), which
doesn’t have any significance.
5.1.5. Responsiveness Analysis Results
Coefficients
Model Unstandardized Coefficients
Standardized Coefficients
t Sig.
B Std. Error
Beta
1 (Constant) 2.218 .490 4.529 .000
Easy to get contract with e-retailer
.374 .184 .405 2.034 .048
E-retailer is Interested in feedback
.148 .181 .168 .815 .420
E-retailer quickly replies to request
-.122 .186 -.158 -.657 .515
a. Dependent Variable: Satisfied with the service of e-retailers
Table 8: Linear regression analysis results of responsiveness
In terms of responsiveness of service quality (Table 8), the coefficient analysis results
show ‘easy to get contract with e-retailer’ (Beta= 0.405) has strong position than other
independent variables. This term is important for service quality of a website and
customer satisfaction and it measures the more effectiveness of responsiveness variable.
Coefficient beta result of ‘e-retailer is interested in feedback’ is the second highest
variable of responsiveness independent variable (Beta=0.168), but this variable results
is less importance than the ‘easy to get contract with e-retailer’ variable (Beta= -0.158).
The final variable of responsiveness ‘e-retailer quickly replies to request’ measures the
negative coefficient beta and it less significance.
46
6. Discussion and Conclusion At the end of the analysing part, the results show that the independent variables of e-
service quality are significant for customer’s satisfaction. We found five e-service
quality factors of online purchasing which is based on Bangladeshi online shopper’s
perspective. We should be assured that the conceptual model of e-service quality is
strongly consistent with our empirical results and illustrate the five important variables
of e-service quality that affect customer’s satisfaction.
According to the analysis finding results, the five independent variables of e-service
quality factors are important variable which influence customers to purchase online.
The first variable mentioned in the frame of reference is efficiency which refers to the
ability of the customers to get to the website, find their desire product and information
associated with it [Zeithamal, 2002]. This concept is similar to that found in empirical
data presentation regarding the issue of efficiency. The first finding of efficiency of e-
service quality of independent variable is well organized of website. If website is well
organised, customer’s are easily attracted to a website and willing to purchase from that
website. Well organised service quality variable not only measures the efficiency of
website but also it measures the performance of a website. Comparing our findings with
the previous research results we can say, if customers efficiently use the website and
understand the purchasing guideline and use the navigation key easily for finding
products, it becomes a well organised website and customers are happily shop through
the websites.
According to Zeithamal et al., [2002] fulfilment refers to the accuracy of service
promises and delivering the product in the promised time. This dimension is associated
with the empirical data that we found regarding the website performance. Our second
influential factor is quick delivery of jobs performance which is found in the survey
results analysis. This independent variable is related to the fulfilment of e-service
quality factors, this variable is highly dependent on product delivery in right time. If
customers purchasing order delivery in quick time or delivery in time as well as they
are pleased with service fulfilment.
Reliability is concerned with the technical functioning of the website, particularly the
extent to which it is available and functioning properly, ability to perform the service
dependably and accuracy, the degree of accuracy, accuracy in billing, keeping records
correctly, performing the services a designed time, dependability and consistency of the
information and accurate [Zeithaml et al, 2002, Parasuraman and Berry et al, 1985,
McKinny, 2002]. As far as the website contains enough company details concerned,
this is the third reliability independent variable of e-service quality which we found in
47
study period. The above finding is related with the previous research. Customer’s desire
that a website contains all kinds of information about a product such as a customer
wants to purchase a laptop in online or searching required product in online. If websites
have available company details (e.g., www.amazon.com, www.apple.com) like as the
product information, price, terms and condition, and transaction process then the
customer ready to purchase of that product otherwise they leave the website. As a
result, enough company detail of website is an important service quality factor of
customer reliability that influence to customers for buying products in online.
The findings of e-service quality variable is ‘does not share personal information with
other website’ as highest ranked of privacy manner. Customers are always sensitive
about their personal information in any way it doesn’t share with other websites. It is
very important of e-service quality factor that effect on customer satisfaction as well as
the customer purchase decision making. Both customers and the e-retailers are cautious
about sharp scrutiny on information sharing, if customers are realized that their
personal information is shared with other websites, they immediately leave this
websites. In contrast, e-retailers also careful about their customers personal information
and privacy manner. Privacy dimension includes data are not shared and credit card
information is secure [Zeithaml et al, 2002]. From this theory it’s clear that share of
personal information is important for privacy aspect but in our analysis results we
didn’t find the credit card privacy manner.
The final e-service quality’s independent variable refers to the easy to get contract with
e-retailers regarding with the responsiveness manner of e-retailers. This variable is
highly related to feedback results from the retailer’s of customer claim or request.
Watson et al. [1998] referred responsiveness as willingness to help customers, and it
can be measured by the time taken before replying to a customer’s inquires. Our
findings also related with the earlier research, for example, if website contains enough
customer services available option and customer contract easily with retailers and get
their required services. Online shopping is a very sensitive responsible market place so
retailers have always careful about their services and feedback of customer responses as
minimum time.
As a result the above findings are strongly related to the e-service quality factors which
influence the customer purchase online. If customers are satisfied with their entire
shopping experience, they will shop again in future from the same website.
In the final study part, we can conclude that the main purpose of our study is to find the
most important influential factors of e-service quality that affect customer’s satisfaction
in online purchasing in Bangladesh. The study began with in-depth exploration in
48
shopper’s views about internet shopping. The key factors identified from the previous
research report of online shoppers experience were used to guide examination of
website retailers and Bangladeshi e-retailers. These key factors are themes of E-
SERVQUAL (Efficiency, Fulfillment, Reliability, Privacy and Responsiveness) model
for measuring e-service quality developed by Zeithaml, Parasuraman and Malhotra
[2000, 2002]. Though the findings of the present studies questionnaires are concerned
with a short online survey, the study results have identified five basic important
independent variables that affect e-service quality.
The first finding of independent variables is the well organised website which measures
the efficiency of website. Second, quick delivery of job search, it fulfils the customers
product order and delivery that includes the fulfilment of e-service quality. Third,
customers rely on those websites that contain enough company details. Fourth,
customers are always careful about their privacy manner and they don’t want to share
personal information with other websites. And the final e-service quality factor is easy
to get contract with e-retailer, which is related to the responsiveness of retailers with the
customers.
Another inspiring result of our study is regarding the dependent variable satisfied with
the service of e-retailers. By analysing the conceptual model, we found that the
independent variables are key origin of the dependent variable that affects customer
satisfaction. We applied linear regression to find out the coefficient beta variables
which determines the important independent variables of e-service quality factors.
Moreover, the result also strongly supports the importance of considering the five
independent variables which is influenced customers to purchase online. In general, the
results support the theoretical norms and the conceptual model and the article review of
previous research. Finally, all evidence of our findings show that the independent
variable of e-service quality are the most significant factors that affect the customer’s
satisfaction and online purchasing. The purpose of this study is to use and refine E-
SERVQUAL model in order to find out the factors that influence online purchasing.
Hence, today’s customer satisfaction is the prime concern of each and every kind of
service oriented industry. Online shopping is not beyond this concern; our major factors
findings are also responsible for the satisfaction through e-service quality. So, findings
of the e-service quality factors are the key influential factors of customer’s satisfaction
and their purchasing decision online.
49
7. Implication and Limitation
7.1 Implication In the case of customer satisfaction, since customer satisfaction measuring scale ‘agree’
is the highest results shown in the survey. It can be inferred that from the customer
point of view, efficiency, fulfilment, reliability privacy and responsiveness are the
influential factors of e-service quality. From the results we found that customers are
satisfied but it doesn’t interpret the whole scenario of Bangladeshi customer shopping
mode choice.
Regarding the survey results most of customers are satisfied with their last shopping
experience. As well as customer are pleased of service quality which responsiveness
goes to the retailer’s website performance of services. The results show that a pretty
good number of customers are satisfied with the service quality of e-retailers and they
are willing to purchase again online in future. But we can say that even though the
customers are satisfied with their last shopping experience, it is a small portion result of
Bangladeshi online customers. It is difficult to say that the entire Bangladeshi
customers are satisfied with the online shopping. At this reason we don’t believe that
the whole countries picture is similar as like that the customer are satisfied. Because of
the survey held on only in Dhaka region, so we can’t say that the same picture of the
other part in Bangladesh. Finally, according to the finding results it’s clear that the
Bangladeshi customers are satisfied with their shopping experience; most probably the
similar picture of online customer’s in Bangladeshi concerning about our findings.
In our study we find out some results. These will be helpful for managerial implication
of the e-retailers. We think that e-retailers have to develop their website with
considering our following some research results concern. Website should be well
organized and it will help to customer easy to make purchasing decision. Manager has
to take more careful about quickly delivery of goods or services to the customer. For
taking purchasing decision in online, privacy policy is a vital factor on the basis of
customer view point. That’s why manager should maintain a good privacy policy for
the customer personal information. It is suggested that manager should make a good
communication with the customers that they can easily get contact with e-retailers for
any kind of information. It can be said that the results of the study will be helpful for
the organization to imply practical implication.
50
7.2. Limitation of the study
Every research has some limitation to find the perfect result, same as the present study
has some limitation and barriers. In the beginning we were add some world top e-
retailers website and their satisfaction score but we didn’t add this important concept
because the limitation of page margin. If we attach the concept in our study paper it
would be better comparison between the existing studies.
We face the big trouble in collecting data both primary and secondary because our
selected topic based on Bangladesh online shoppers perspective. The main reason is
that we are far away from our country that’s why we couldn’t observe the practical
field. We prepared an online questionnaires survey which is based on our conceptual
model for collecting primary data. In our study, we collect primary data through
sending email to the respondents. Our sample size was approximately 250 for survey
online; two universities (ICT of MBSTU & MIST) students were participated in the
survey and some general people. During the short survey time period only 48
respondents are response of our survey questionnaires. If we got the whole sample
replies form the respondents, it would be more reliable for our research and data
analysis would be stronger for present study. For collecting the secondary data, we tried
to contact with ISPAB (Internet Service Provider Association of Bangladesh) for
required information about Bangladeshi online customers, but they didn’t provide more
relevant data which is related to our research.
The restricted time frame also creates certain limitation in this study. The study is
limited by the scope and the expected resources requirements to do more than what is
proposed. We proposed that much research is needed to discover the effective of
different e-service quality dimensions of customers on e-shopping.
51
References
Anderson, E.W. and m. W. Sullivan (1993). “The antecedents and Consequences of Customer Satisfaction for Firms.” Marketing service, Vol-12(no.2):125-43
Babakus, E. and Boller, G.W. (1992), “An empirical assessment of the SERVQUAL
scale”, Journal of Business Research, Vol. 24, pp. 253-68 Balasubramanian, S., P. Konana, and N. M. Menon, ―Customer, Satisfaction in
Virtual Environments: A Study of Online Investing, Management Science, Vol.7: 871–889, July 2003.
Barber, B. (1983), The Logic and Limits of Trust, J.J. Rutgers University Press, New
Brunswick Barnes, S.J. and Vidgen, R.T., 2001. An Evaluation of Cyber-Bookshops: The
WebQual Method. International Journal of E-Commerce, Vol. 6, No. 1, pp 253-26. Berry, William D., and Stanley Feldman. 1985. Multiple Regression in Practice.
Beverly Hills, CA: Sage Publications. Bruner, Gordon (1997), "Cyberspace: The Marketing Frontier," Book Review in
Journal of Marketing, 61 (1), 112-113. Churchill, G.A. and Surprenant, C. (1982), “An investigation into the determinants of
customer satisfaction”, Journal of Marketing Research, Vol. 19, pp. 491-504. Constantinides, E. (2002), “The 4S Web-marketing mix model, e-commerce research
and applications”, Elsevier Science, Vol. 1 No. 1, pp. 57-76. Cooper, D. R. & Schindler, P. S. (2003). Business research methods (8th ed.) Boston:
McGraw-Hill Irwin Cristian V.Hapenciuc, Iulian Condratov, Theoretical Framework for Quality Evaluation
of Tourism-Related Websites Services, Econamy Infomatics, 1-4/2007. Crosby, L. and LeMay, S.A. (1998), “Empirical determination of shipper requirements
for motor carrier services: SERVQUAL, direct questioning, and policy-capturing methods”, Journal of Business Logistics, Vol. 19 No. 1, pp. 139-53
Dale, B.G. (Ed.) (1999), Managing Quality, 3rd ed., Basil Blackwell, Oxford. Diamantopoulos, A. & Schlegelmilch, B. B. (2000). Taking the fear out of data
analysis: A step-be-step approach. London: Business Press, Thomson Learning. Dubbs, D. (2001), “Many (ubhaooy) returns”, available at:
http://multichannelmerchant.com/psandfulfillment/warehouse/fulfillment_unhappy_return/indix.html (accessed June 23, 2006
52
Finn, A. and Kayande, U. (1997). Reliability Assessment and Optimization of Marketing Measurement. Journal of Marketing Research. 34(2): 262-275.
Fornell, C., Jonson, M.D., Anderson, E.W., Cha, J. and Bryant, B.E (1996) “The
American customer satisfaction index: nature, purpose and finding”, Journal of marketing, Vol. 60
Fram, E.H. & Grady, D.B. (1995) Internet buyers: Will the Surfers become Buyers
Direct Marketing, 58, 6, 63-65 Frost, F., Kumar, M., 2000.INTSERVQUAL—an internal adaptation of the gap model
in a large service organisation. Journal of Service Marketing14 (5), 358–377. Ghose, Sanjoy and Wenyu Dou (1998), "Interactive Functions and Their Impacts on the
Appeal of Internet Presence Sites," Journal of Advertising Research, (March-April), 29-43.
Ghosh, S., Surjadjaja, H., and Antony, J. (2004), “Optimization of the determinants of
eservice operation”, Business Process Management Journal, Vol. 10 No. 6, pp. 616636.
Girish N. Punj, Adam Rapp (2003), Influence of Electronic Decision Aids on Consumer
Shopping in Online Store, Department of Marketing, School of Business, University of Connecticut
Guba, E.G. and Lincoln, Y.S. "Competing paradigms in qualitative research," in
Handbook of Qualitative Research, N.K. Denzin and Y.S. Lincoln (eds.), Sage, Thousand Oaks, 1994, pp. 105-117.
Ha, H-Y. (2004), “Factors influencing consumer perceptions of brand trust online”,
Journal of Product & Brand Management, Vol. 13 No. 5, pp. 329-42. Hair, J. F. Jr., Babin, B., Money, A. H. and Samouel, P. (2003) Essentials of Business
Research Methods, The US: Leyh Publishing, LLC. Hamburg market research firm, yStats.com, GmbH & Co. KG. www.ystats.com. Hoffman, Donna L., Thomas P. Novak, and M. A. Peralta (1999), “Building Consumer
Trust Online,” Communications of the ACM, 42 (4), 80-5. Hua, G. (2009) an Experimental Investigation of Online Banking Adoption in China.
Journal of Internet Banking and Commerce, 14, 1, 1-12. Hussey, J., Hussey, R. (1997), Business Research: A Practical Guide for
Undergraduate and Postgraduate Students, Macmillan Press, London, Jessica Santos, E-service quality: model of virtual service quality dimensions Managing
Service Quality, Valume 13, Numeber 3, 2003, pp.233-246
53
Jelassi, T. and Ender. A. (2005) ‘Strategies for e-business’ England, Pearson Education. Kalakota, R., and Whinston A.B. (1996). ‘Frontiers of Electronic Commerce’ Reading,
MA: Addison-Wesley. Kaynama, S.A and Black, C.I. (2000) “A proposal to assess the service quality of
online travel agencies, an exploratory study”, Journal of Professional service marketing, Vol21/1, pp.63-68
Khatibi, Ali and Thiagarajan, V. 2000. E-commerce business opportunities for Telekom
Malaysia. Proceedings of the 2000 ETEC Conference, November, Kuala Lumpur, Malaysia.
Kotler, P. (2003) Marketing Management, PrenticeHall, New Jersey Kramer, R.M. (1999), “Trust and distrust in organizations: emerging perspectives,
enduring questions”, Annual Review of Psychology, available at: www.findarticles.com/cf0/m0961/ 1999 Annual/544423111 (accessed 13 June 2002)11.44.
Lamb, Hair, McDAniel, Marketing, South-Western Cengage Learning, 2009, pp 352-
355 Lessig, L. (1999) Code and Other Laws of Cyberspace. New York, Basic Books Lewis-Beck, Michael. 1980. Applied Regression. Beverly Hills, Sage Publications Liao, Z. and Cheung, M. (2002), “Internet based e-banking and consumer attitudes: an
empirical study”, Information and Management, Vol. 39 No. 4, pp. 283-95. Loiacono, E. T., R. T., Watson, and D. L. Goodhue, ―WebQual: A Website Quality
Instrument, Working Paper 2000-126-0, University of Georgia, 2000. Loiacono, E.T., Watson, R.T. and Goodhue, D.L. (2002). WebQual™: A Measure of
Website Quality. American Marketing Association Conference Proceedings: 432-438.
MacKenzie, Scott B. and Richard J. Lutz (1989), "An Empirical Examination of the
Structural Antecedents of Attitude Toward the Ad in an Advertising Pretesting Context," Journal of Marketing, 53 (April), 48-65.
McKinney, V., Yoon, K., and Zahedi, F.M. "The measurement of web-customer
satisfaction: An expectation and disconfirmation approach”, Information Systems Research (13:3) 2002, pp 296-315.
Malhotra, N.K., Peterson, M., 2006. Basic marketing research: A decision-making
approach. Pearson Education / Prentice Hall, Upper Saddle River. Martin, E., (1996), "Household Attachment and Survey Coverage," Proceedings of the
Survey Research Methods Section, American Statistical Association.
54
Nicolas E. Synodinos “The art of questionnaire construction: some important construction: some important considerations for manufacturing studies”; integrated manufacturing systems, 14/3, 2003, 221-237.
Parasuraman, A., Zeithaml, V. and Berry, L. (1985), “A conceptual model of service
quality and its implications for future research”, Journal of Marketing, Vol. 49 No. 4, pp. 41-50.
Parasuraman, A., Zeithaml, V. and Berry, L. (1988), “SERVQUAL: a multiple-item
scale for measuring consumer perceptions for service quality”, Journal of Retailing, Vol. 64 No. 1, pp. 12-40.
Parasuraman, A., Zeithaml, V. and Berry, L.L. (1991b), “Refinement and reassessment
of the SERVQUAL scale”, Journal of Retailing, Vol. 67 No. 4, pp. 420 50. Parasuraman, A., Zeithaml, V. and Malhorta, A. (2005), “E-S-QUAL: a multiple-item
scale for assessing electronic service quality”, Journal of Retailing, Vol. 64 No. 1, pp. 12-40.
Peterson, Robert, Sridhar Balasubramanian, and Bart J Bronnenberg (1997), "Exploring
the Implications of the Internet for Consumer Marketing," Journal of the Academy of Marketing Science, 25 (4), 329-346.
Ranjit Kumar (1996). “Research Methodology: A Step-by-step For Beginners.”
London: Sage Publications. 9,74. Rowley, J. (2006), An analysis of the eservice literature: Towards a research agenda.
Internet Research, Vol. 16 No. 3, pp. 339359. Rust, R. ―The Rise of E-Service, Journal of Service Research, Vol.3, No.4:283-284,
2001. Salisbury, W. D., Pearson, R. A., Pearson, A. W. & Miller, D. W. (2001) Perceived
security and World Wide Web purchase intention. Industrial Management & Data Systems, 101, 3-4, 165-176.
Saunders, M., Lewis, P. and Thornhill, A. (2000, 2007) Research Methods for Business
Students, 2nd & 4th ed, Prentice Hall: Hallow Schaupp, L.C. and Be´langer, F. (2005), “A conjoint analysis of online consumer
satisfaction”, Journal of Electronic Commerce Research, Vol. 6 No. 2, pp. 95-111. Schneider, G.P. and perry. J.T. (2002) Electronic Commerce, Cource Technology,
Third Edition. Shapiro, Carl. (2000) Will E-Commerce Erode Liberty? Harvard Business Review,
May-June, 189-196.
55
Sivadas, E., Baker-Prewitt, J. (2000), "An examination of the relationship between service quality, customer satisfaction, and store loyalty", International Journal of Retail & Distribution Management, Vol. 28 No.2, pp.73-82.
Siyal, M.Y. and Barkat, B. (2002), “A novel trust service provider for internet based
commerce applications”, Internet Research: Electronic Networking Applications and Policy, Vol. 12 No. 1, pp. 55-65.
Spreng, R.A., Mackoy, R.D. 1996. An Empirical Examination of a Model of Perceived
Service Quality and Satisfaction. Journal of Retailing 72 (2), 201-14. Sukpanich, N., and Chen, L. Antecedents of desirable consumer behaviors in electronic
commerce,. Proceedings of the 5th Americas Conference on Information Systems, 1999, pp. 550-552.
Sureshchandar G.S., and R.N. Anantharaman, 2002; The relationship between service
quality and customer satisfaction a factor specific approach; Journal of Services Marketing, Vol. 16, No. 4, pp. 363-379.
Swatman, P.M.C. (1996) "Electronic Commerce: Origins and Future Directions", 1st
Australian DAMA Conference, Melbourne, Victoria, December 2-3. Tsikriktsis, N., ―Does Culture Influence Web Site Quality Expectations? An Empirical
Study, Journal of Service Research, Vol.5, No.2:101-112, 2002 Watson, R.T., Pitt, L.F., and Kavan, C.B. "Information Systems Service Quality:
Lessons from Two Longitudinal Case Studies," MIS Quarterly (23:1) 1998, pp 61-79.
Wayne D. Hoyer D. & Deborah J. MacInnis, South-Western Cengage Learning, 5th
edition, pp 287-293. Welman, J.C. and Kruger, S.J. 2005. Research Methodology. SouthAfrica: Oxford
University Press. Wolfinbarger, Mary F. and Mary C. Gilly (2002), “.comQ: Dimensionalizing,
Measuring and Predicting Quality of the E-tail Experience,” Working Paper No. 02 100, Marketing Science Institute, Cambridge, MA.
Wolfinbarger, M. and Gilly, M. (2003), “eTailQ: dimensionalizing, measuring, and
predicting retail quality”, Journal of Retailing, Vol. 79, pp. 183-93. Yang, Z. (2001), “Consumer perceptions of service quality in internet-based electronic
commerce”, paper presented at the meeting of the 30th EMAC Conference, Bergen, pp. 8-11.
Yang, Z. (2001), “Consumer perceptions of service quality in Internet based electronic
commerce”, Proceedings of the EMAC Conference, 811 May 2001, Bergen
56
Yang, Z. & Jun, M. (2002) Consumer Perception of E-service Quality: From Internet Purchaser and Non-purchaser Perspectives. Journal of Business Strategies, 19, 1, 19-41.
Yin, R.K. (2003), Case Study Research: Design and Methods, Sage Publications, CA Yoo, B. and Donthu, N. (2001), “Developing a scale to measure perceived quality of an
internet shopping site (SITEQUAL)”, Quarterly Journal of Electronic Commerce, Vol. 2 No. 1, pp. 31-46.
Young, Y.A., Varble, D.L., 1997. Purchasing’s performance as seen by its internal
customers: a study in a service organization. International Journal of Purchasing and Materials Management 33 (3), 36–41.
Zeithaml, V. (2000), “Service quality, profitability, and the economic worth of
customers: what we know and what we need to learn”, Journal of the Academy of Marketing Science, Vol. 28 No. 1, pp. 67-85.
Zeithaml, V. A., A. Parasuraman, and A. Malhotra, ―A Conceptual Framework for
Understanding e-Service Quality: Implications for Future Research and Managerial Practice, Working Paper No.00-115, Marketing Science Institute, Cambridge, MA, 2000.
Zeithaml, V., Parasuraman, A. and Malhotra, A. (2002). Service Quality Delivery
Through Websites: A Critical Review of Extant Knowledge. Journal of the Academy of Marketing Science. 30(4): 362-375
Zeng, Ming and Werner Reinartz (2003), "Beyond Online Search: The Road to
Profitability," California Management Review, 00081256, Winter, 45 (2). Zikmund,W.G., (2000), Business research methods, sixth edition, Harcourt, Inc. 6277
Sea Harbor Drive, Olando, FL 32887-6777. Zhang, P. & von Dran, G.M. (2002). User Expectations and Rankings of Quality factors
in Different Web Site Domains, International Journal of Electronic Commerce. 6, 9-33.
Zhu, F., Wymer, W. and Chen, I. (2002), “IT-based services and service quality in
consumer banking”, International Journal of Service Industry Management, Vol. 13 No. 1, pp. 69-90.
Zwass, V. (1996) "Electronic Commerce: Structures and Issues", International Journal
of Electronic Commerce, Volume 1, Number 1, pp. 3 - 23. Books Bryman, A. and Bell, E., 2007, Business research methods. 2nd ed. Oxford: Oxford
University Press.
57
Robert K. Yin (2009), Case Study Research: Design and Methods, 4th edition, Sage
Publications. Wayne D. Hoyer and Deborah J. MacInnis, Consumer Behaviour, 5th edition, South
Western Cengage Learning, 2007. References of Questionnaires Dina R., Allard C.R. van Riel, Veronica L. and Sandra S., ‘Comfort your online
customer: quality, trust and loyalty on the internet’, Managing Service Quality, Volume 14 · Number 6 · 2004 · pp. 446-456
Godwin J. Udo, Kallol K. Bagchi, and Peeter J. Kirs, Assessing Web Service Quality
Dimensions: The E- Servperf Approach, VOL IX, No. 2, 2008 Joel E. Collier and Carol C. Bienstock, Measuring Service Quality in E-Retailing,
Journal of Service Research 2006 8: 260 Sunil Sahadev and Keyoor Purani, Modelling the consequences of e-service quality,
Marketing Intelligence & Planning, Vol. 26 No. 6, 2008 pp. 605-620 * ICT (Information & Communication Technology) of MBSTU (Mawlana Bhashani Science & Technology University), Dhaka, Bangladesh. *Military Institute of Science and Technology (MIST), Dhaka, Bangladesh.
58
Appendices Appendix 1: Survey Questionnaires
Questionnaire
Online Survey
Part- 1: General Information of Respondents The study is being conducted for academic purposes only. The purpose is to study the
factors of consumer online purchasing and regarding their various satisfaction issues.
[i.e. .Only [ ] tick for select answers]
Name: …………………………. E-mail: ………………………… Mark the most appropriate answer: 1. Please select your occupation?
� Student � Office executive � Housekeeper/ Landlady � Other. ............................
2. Please indicate your age?
� Less than 20 � 21-25 � 26-30
3. Please indicate your gender? � Male � Female
4. Do you have any experience of online purchasing?
� Yes � No � Thank You Very Much
� 31-35 � 36-40 � Above 41
� Doctor � Engineer � Advocate � Teacher
59
5. Do you shop on internet? � Always � Most of the time � Sometimes � Seldom (Infrequently) � Never
Part- 2: Online Customer Satisfaction The following statements ask your thoughts about the service provided to you by
Internet retailers, also known as e-retailers. Please think about the last e-retailer or
website that you purchased from. Please [] tick the number that best matches, how
much you agree or disagree with each statement. There are no right or wrong answers.
(Values range from 1, Strongly Disagree, to 5, Strongly Agree.)
Here, 1=Strongly Disagree, 2=Disagree, 3= Neither Agree nor Disagree, 4=Agree, and
5= Strongly Agree.
Efficiency 1 2 3 4 5 6. This website makes it easy to find what I need
7. It makes it easy to get anywhere on the website 8. Information at this website is well organised 9. The website is simple to use Fulfillment
10. It delivers the most relevant results as specified
11. It quickly delivers the job search results 12. It is truthful about its services
13. It makes accurate promises about the delivery of services
60
Reliability
14. The security policy is accessible of this website
15 The privacy policy is accessible of this website
16. The website contains enough company details 17. The brand images are always maintain this website
Privacy
18. It protects information about my web-job searching behaviour
19. It does not share my personal information with other websites 20. The website protects information about my credit card 21. I worry about the product quality on this website Responsiveness
22. It is easy to get in contact with this e-retailer 23. This e-retailer is interested in feedback
24. This e-retailer quickly replies to requests Customer Satisfaction
25. I am satisfied with my last online shopping experience 26. I was satisfied with the service this e-retailer provided
27. In general, I was pleased with the quality of the service this e-retailer provided.
28. I intend to purchase from this e-retailer in the future
****** ******