Embed Size (px)
Citation preview
No. 6, December 2016
Economics of Climate Adaptation (ECA) - Guidebook for Practitioners
A Climate Risk Assessment Approach Supporting Climate Adaptation Investments
Author: Dr Maxime Souvignet Co-Authors: Dr Florian Wieneke, Lea Mueller, Prof Dr David N. Bresch
KfW Development Bank
Materials on
Development Financing
Contents
Abstract ......................................................................................................................... 6
Introduction and scope .................................................................................................. 7
Why use the ECA Methodology? ................................................................................... 9
When should the ECA Assessment be applied? ....................................................... 9
Is the ECA methodology relevant for your project? ..................................................10
What professional skills are necessary? ..................................................................12
Who is the ECA Guidebook’s target audience? .......................................................13
How do you use the ECA Guidebook? .........................................................................14
How was the ECA Guidebook developed? ..............................................................14
How should the ECA Guidebook be used? ..............................................................14
An overview of the ECA Methodology ..........................................................................17
Conceptual Framework ............................................................................................17
The ECA Framework in eight (8) Phases .................................................................18
climada: An integrated tool for ECA .........................................................................20
How do you use climada? ........................................................................................21
PHASE 1: Defining Your Research Area ......................................................................23
Getting Started .........................................................................................................24
Step 1: Present the context of your CCA assessment .............................................25
Step 2: Define the objectives and outcomes ............................................................26
Step 3: Identify the scope of your analysis ...............................................................27
Step 4: Identify the main hazards to be considered .................................................29
Step 5: Develop an implementation plan ..................................................................31
PHASE 2: Data Acquisition and Management ..............................................................32
Getting Started .........................................................................................................33
Step 1: Identify what kind of data is needed .............................................................33
Step 2: Quality control ..............................................................................................39
Step 3: Data management .......................................................................................39
PHASE 3: Developing Scenarios ..................................................................................41
Getting Started .........................................................................................................42
Step 1: Analyse the current situation and develop scenarios ...................................42
Step 2: Define a time horizon ...................................................................................43
Step 3: Develop your climate scenarios ...................................................................46
PHASE 4: Modelling Hazards .......................................................................................47
Getting started ..........................................................................................................48
Step 1: Generate hazard set frequency and intensity ..............................................48
Step 2: Generate hazard probability maps ...............................................................49
Step 3: Export your hazard probability to climada ....................................................50
Step 4: Double check against historical events ........................................................51
PHASE 5: Valuating Assets ..........................................................................................52
Getting started ..........................................................................................................53
Step 1: Select assets categories fitting your scope ..................................................53
Step 2: Localise your assets ....................................................................................54
Step 3: Construction value for Housing, Schools and Hospitals ..............................56
Step 4: Export your asset values into climada format ..............................................59
Step 5: Validate your total asset value against existing observations ......................61
PHASE 6: Creating Damage Functions ........................................................................62
Getting Started .........................................................................................................62
Step 1: Constructing damage functions ...................................................................63
Step 2: Exporting damage function in climada .........................................................66
Step 3: Calibrate and validate your damage functions .............................................67
PHASE 7: Simulating CCA measures ..........................................................................68
Getting Started .........................................................................................................69
Step 1: List CCA measures per hazard and per assets (long list) including costs....69
Step 2: Select most promising CCA measures to be investigated in climada (short list) .................................................................................................................71
Step 3: Parameterise CCA measures into climada ..................................................71
Step 4: Simulate and validate results with historical observation for different scenarios ..................................................................................................................76
Step 5: From the short list to the feasibility analysis .................................................77
PHASE 8: Illustrating Your Results ...............................................................................81
Getting Started .........................................................................................................82
Step 1: Identify your audience ..................................................................................82
Step 2: Plan your CCA assessment report ...............................................................83
Step 3: Illustrate your findings ..................................................................................84
Glossary .......................................................................................................................92
Links, Literature ............................................................................................................97
ANNEXES ....................................................................................................................99
4 | KfW Development Bank – Materials on Development Financing, No. 6, 2016
Table of Figures
Figure 1 Criteria influencing the undertaking of a CCA Assessment using the ECA methodology ........................ 10
Figure 2 Project Decision Matrix for using the ECA Methodology and the ECA Guidebook .................................... 11
Figure 3 Project characteristics according to project type, including indicative budget .......................................... 12
Figure 4 The ECA Guidebook within the ECA Approach ......................................................................................... 15
Figure 5 Presentation of the ECA elements (modified from ECA Working Group) ................................................ 17
Figure 6 Diagram of every Phase and their interconnection .................................................................................. 19
Figure 7 Output figures from climada as displayed on MATLAB® for a case study in Florida ............................... 22
Figure 8 Timeline indication for the CCA assessment ........................................................................................... 31
Figure 9 Relationship between resolution and size of areas considered in the study ............................................ 35
Figure 10 Different types of scenario aggregations ............................................................................................... 46
Figure 11 Water depth for 100yr flood events in San Salvador (KfW, 2015a) ....................................................... 49
Figure 12 Comparison of 100yr and 50yr flood extend with “very high” inundation ............................................... 51
Figure 13 Location of assets in San Salvador (KfW (2015a) ................................................................................. 57
Figure 14 Population distributions for housing in unformal settlement. .................................................................. 59
Figure 15 Screenshot from climada input file for assets ........................................................................................ 60
Figure 16 Example of synthetic damage functions as used in climada .................................................................. 63
Figure 17 Illustration of a synthetic damage function developed for flood and housing in informal settlement in the
urban area of San Salvador ................................................................................................................................... 65
Figure 18 Screenshot of ERN-Vulnerabilidad ........................................................................................................ 65
Figure 19 Screenshot of damage function for flood hazard for different assets ..................................................... 66
Figure 20 Illustration of damage function sensitivity .............................................................................................. 67
Figure 21 Illustration of parameterization of CCA measures in climada ................................................................ 72
Figure 22 Adaptation Bar Chart for inundation (USD) for CCA measures in San Salvador ................................... 77
Figure 23 Example of waterfall histograms for the San Salvador Assessment study (Source: KfW (2015a)) ....... 86
Figure 24 Example of waterfall histogram for aggregated hazards in Barisal (Source KfW (2015b)) .................... 86
Figure 25 Adaptation Cost Curve for people in San Salvador over a period of 26 years (Source modified after KfW
(2016) .................................................................................................................................................................... 87
Figure 26 Adaptation Bar Chart for the San Salvador urban area (Source: KfW (2015a)) .................................... 88
Figure 27 spatial distribution of benefits in USD in San Salvador (KfW, 2015a) .................................................... 89
Figure 28 Expected damage for persons in Barisal for the time horizon 2030 (KfW, 2015b) ................................ 90
Figure 29 spatial location of CCA measures (KfW, 2015ª) .................................................................................... 90
Figure 30 Spatial location of monetary assets in San Salvador (KfW, 2015a) ....................................................... 91
Figure 31 Hazard map for flood risk in San Salvador for selected return periods (KfW, 2015a) ............................ 91

5 | KfW Development Bank – Materials on Development Financing, No. 6, 2016
Table 1 Level of skills needed by field of expertise ................................................................................................ 13
Table 2 Overview of the different Phase available in this ECA Guidebook .............................................................. 19
Table 3 Potential institutions and stakeholder to be considered for the inception workshop ................................. 26
Table 4 Example of criteria and scores for selected hazards ................................................................................ 30
Table 5 Overview of depreciated construction costs for different asset types in the San Salvador ....................... 56
Table 6 Detailed calculation of construction costs for roads in the case of inundation and landslide .................... 59
Table 7 Overview of aggregated value per asset category for San Salvador ........................................................ 61
Table 8 Example of parameters for CCA measures from the Barisal and San Salvador pilot studies ................... 73
Table 9 Example of feasibility summary table for measures implementation in San Salvador .............................. 80

6 | KfW Development Bank – Materials on Development Financing, No. 6, 2016
Abstract
There is a growing consensus that climate change impacts should be considered in
the development of adaptation strategies by decision makers at all levels. This
requires identifying cost-efficient adaptation measures, resulting from a structured
risk management approach. The Economics of Climate Adaptation (ECA) approach
offers a unique contribution, which combines risk assessment, adaptation
measures and risk transfer. Its results allow a flexible identification of cost-effective
climate adaptation measures for a variety of projects and sectors.
Recently, KfW decided to implement two pilot studies in Bangladesh and El
Salvador using the ECA methodology. The main objectives were to support
decision makers in developing their adaptation strategy and to develop a climate
adaptation measures investment portfolio. Following the evaluation of these two
pilot studies, the need to develop a document for practitioners has arisen.
The ECA Guidebook aims at filling this gap while complementing the already
existing ECA documentation and tools. This Guidebook is tailored for practitioners
of developing projects, which promote resilience in developing countries. It aims
also at 1) exploring whether ECA methodology is appropriate to the project’s goals
and 2) offering step-by-step guidance while using the ECA methodology.
The authors:
Maxime Souvignet is Project Coordinator for the Munich Climate Insurance
Initiative (MCII) at the United Nations University (UNU-EHS) in Bonn. Previously,
he worked as Climate Risk Modelling Expert within the KfW ECA Pilot Project in El
Salvador. Florian Wieneke is Senior Sector Economist Climate Change and initiator
of the ECA pilot projects at KfW, as he is responsible for climate change adaptation
methods, finance and research. Lea Mueller is a Natural Hazards Expert for the
Global Partnerships Unit at SwissRe. She is actively developing the ECA
Methodology and its tools in close collaboration with David Bresch. David Bresch is
a Professor for Weather and Climate Risks at the Swiss Federal Institute of
Technology, ETH Zürich and MeteoSwiss. He was a member of the official Swiss
delegation to the UNFCCC climate negotiations from 2009-2015.
7 | KfW Development Bank – Materials on Development Financing, No. 6, 2016
Introduction and scope
Promoting resilience through the assessment of weather and climate risks and the
integration of appropriate climate change adaptation (CCA) measures are essential
steps in project development. In the context of international financial and technical
cooperation, specific CCA measures are ensuring investments that are more
sustainable, while promoting assets and economic activities that are more resilient
to the impacts and consequences of current and projected future climatic
conditions.
Considering climate change adaptation early on in planning and policymaking sets
a clear context for interventions at project level. Climate change impacts should be
taken into account in the development of strategies, investment and national
adaptation plans (NAPs) by governments, local authorities, communities and
businesses. This requires identifying cost-efficient CCA measures, in a transparent
and structured manner, to identify which future investments would be sustainable
and what residual risk can be covered by risk transfer solutions1. Such an approach
calls for a comprehensive climate risk management system in order to ensure a
climate-resilient development. A plethora of approaches has already been designed
to respond to the complexity and the uncertainty of climate change related projects.
With regards to the implementation of climate change adaptation strategies, they
range from climate vulnerability assessments, risk assessments, economic and/or
sustainability impact assessments to decision-making support tools. Among these,
none has been fully integrating processes from risk assessment to a feasibility of
CCA measures.
The Economics of Climate Adaptation (ECA) approach bridges this gap and offers
a unique approach towards the flexible identification of cost-effective CCA
measures for a variety of projects and sectors. It addresses in particular the
following questions:
1) What is the potential climate-related damage2 over the coming
decades?
1 Please refer to KfW publication of September 2016 “Economics of Adaptation (ECA) in Development Cooperation: A Climate Risk Assessment Approach“ https://www.kfw-entwicklungsbank.de/PDF/Download-Center/Materialien/2016_No5_Economics-of-Adaptation_EN.pdf
2 It is essential to differentiate between loss and damage (for definition, please see Glossary in this Guidebook). Since most adaptation measures
as dealt with by the ECA Methodology are risk management ones, we shall refer to 'damage' wherever possible in the ECA context

8 | KfW Development Bank – Materials on Development Financing, No. 6, 2016
2) How much of that damage can be averted, using what type of CCA
measures?
3) What investments will be required to fund those measures - and will the
benefits of these investments outweigh the costs?
ECA offers a systematic and transparent approach that fosters trust and initiates in-
depth inter-sectoral stakeholder discussions. The methodology can be flexibly
applied from the national down to local level to different sectors and different
hazards3. It also gives guidance on what aspects to focus on during a feasibility
study. It provides key information for programme-based approaches, insurance
approaches and has potential to support National Adaption Plans’ (NAPs)
development.
Recently, KfW decided to implement two pilot studies in Bangladesh and El
Salvador using the ECA methodology. The main objectives were to support
decision makers in developing their adaptation strategy and to develop a CCA
measures investment portfolio. Based on the evaluation of these two pilot studies,
the need to develop a document for practitioners has arisen. Consequently, the
ECA Guidebook is designed for practitioners of developing projects that promote
resilience in developing countries. It also aims at supporting their efforts in deciding
whether the ECA Methodology is appropriate to their goals and while using the
ECA methodology, to offer guidance in their endeavours. More specifically, this
ECA Guidebook is tailored to two main groups: 1) Donors, with Project Managers
and Technical experts looking into the potential of ECA for new projects and 2)
Partners and Implementing Experts such as technical experts or consultants using
the ECA Methodology. As described in more details in sections “how to use the
ECA Guidebook” (p.14), the ECA Guidebook completes already existing tools,
manuals and case studies documenting the ECA Approach.
3 ECA has been applied in more than 20 case studies (see www.swissre.com/eca) and the methodology is described in “shaping climate resilient development – a framework for decision making” available at http://media.swissre.com/documents/rethinking_shaping_climate_resilent_development_en.pdf)
9 | KfW Development Bank – Materials on Development Financing, No. 6, 2016
Why use the ECA Methodology?
This opening section aims at helping practitioners, and in particular project
managers and technical experts developing new projects in deciding if the ECA
methodology is relevant for their objectives. We will describe when (and to what
purposes) the ECA methodology can be applied, and we will present the minimum
requirements for implementing an ECA Assessment. Finally, we will discuss the
target audience of this guidebook. So, if you decide to carry out a CCA
Assessment, you will have a broader perspective of the associated workload,
timespan of the assessment, costs and skills needed to build up your team.
When should the ECA Assessment be applied?
The ECA methodology, and therefore the ECA Guidebook, shall be of special
interest for practitioners looking into the following aspects of adaptation planning:
Estimating actual and future risks related to natural catastrophes and
climate change in a particular region (scale can vary greatly from local to
national)
Applying a multi-hazard approach
Estimating actual and future costs due to economic development,
climate variability and climate change
Identifying and ranking potential CCA measures
Defining potential CCA measures for investment purposes
Enabling multi-stakeholder collaboration and ensure local involvement
in order to create a long-term adaptation strategy
Structuring a transparent approach towards climate adaptation.
If these aspects are in line with your objectives, the ECA Methodology might be of
interest to you. In the next section, we will explore several criteria to determine
whether the ECA Methodology is relevant to your project. It is also important to
note that the ECA Methodology is open-source and consequently free of charge.
10 | KfW Development Bank – Materials on Development Financing, No. 6, 2016
Is the ECA methodology relevant for your project?
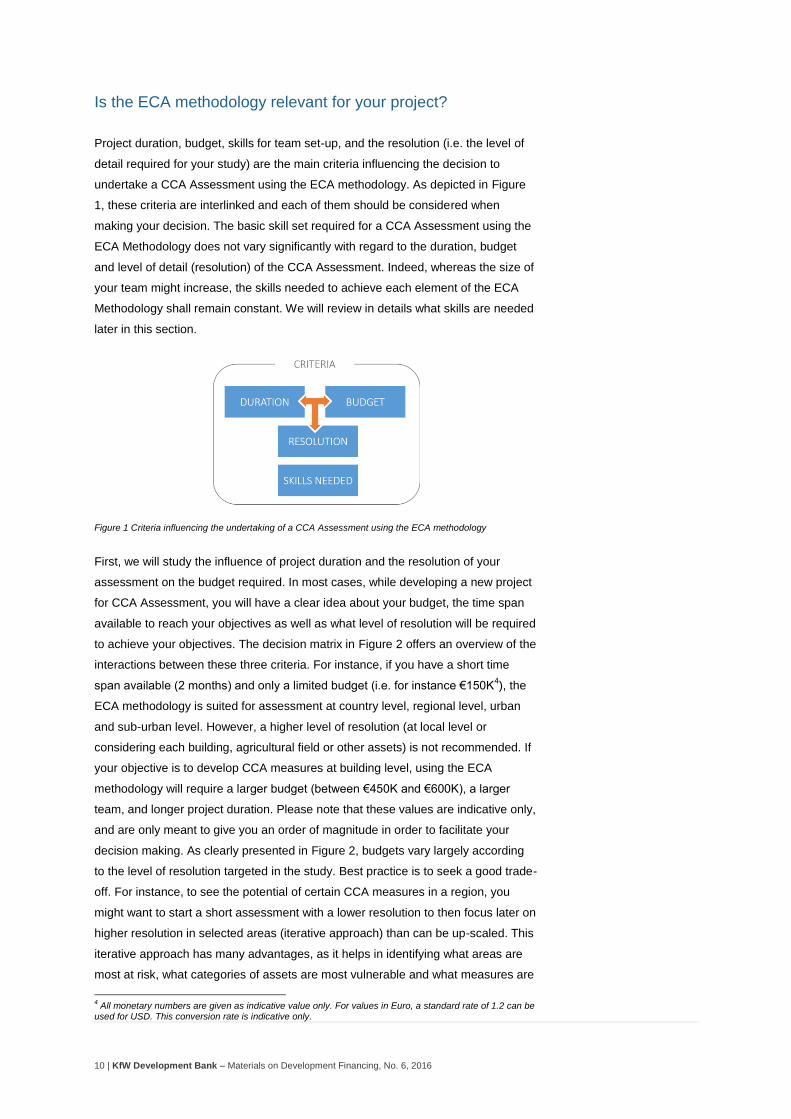
Project duration, budget, skills for team set-up, and the resolution (i.e. the level of
detail required for your study) are the main criteria influencing the decision to
undertake a CCA Assessment using the ECA methodology. As depicted in Figure
1, these criteria are interlinked and each of them should be considered when
making your decision. The basic skill set required for a CCA Assessment using the
ECA Methodology does not vary significantly with regard to the duration, budget
and level of detail (resolution) of the CCA Assessment. Indeed, whereas the size of
your team might increase, the skills needed to achieve each element of the ECA
Methodology shall remain constant. We will review in details what skills are needed
later in this section.
Figure 1 Criteria influencing the undertaking of a CCA Assessment using the ECA methodology
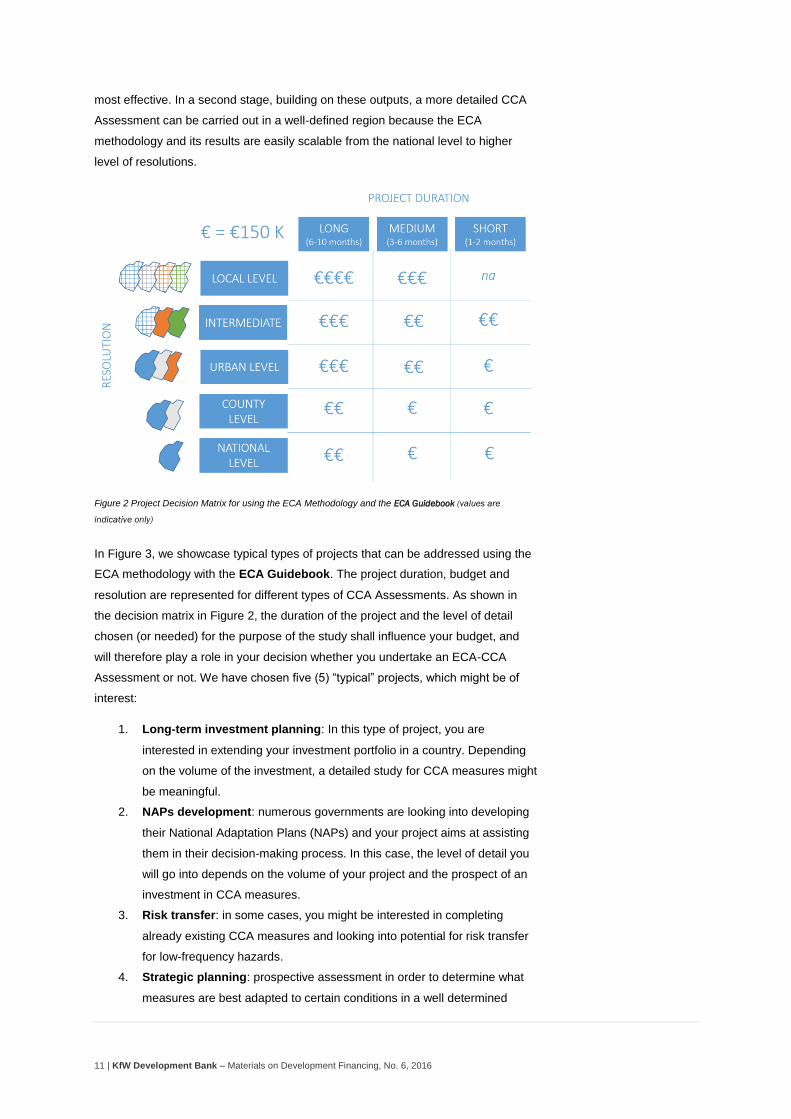
First, we will study the influence of project duration and the resolution of your
assessment on the budget required. In most cases, while developing a new project
for CCA Assessment, you will have a clear idea about your budget, the time span
available to reach your objectives as well as what level of resolution will be required
to achieve your objectives. The decision matrix in Figure 2 offers an overview of the
interactions between these three criteria. For instance, if you have a short time
span available (2 months) and only a limited budget (i.e. for instance €150K4), the
ECA methodology is suited for assessment at country level, regional level, urban
and sub-urban level. However, a higher level of resolution (at local level or
considering each building, agricultural field or other assets) is not recommended. If
your objective is to develop CCA measures at building level, using the ECA
methodology will require a larger budget (between €450K and €600K), a larger
team, and longer project duration. Please note that these values are indicative only,
and are only meant to give you an order of magnitude in order to facilitate your
decision making. As clearly presented in Figure 2, budgets vary largely according
to the level of resolution targeted in the study. Best practice is to seek a good trade-
off. For instance, to see the potential of certain CCA measures in a region, you
might want to start a short assessment with a lower resolution to then focus later on
higher resolution in selected areas (iterative approach) than can be up-scaled. This
iterative approach has many advantages, as it helps in identifying what areas are
most at risk, what categories of assets are most vulnerable and what measures are
4 All monetary numbers are given as indicative value only. For values in Euro, a standard rate of 1.2 can be
used for USD. This conversion rate is indicative only.
11 | KfW Development Bank – Materials on Development Financing, No. 6, 2016
most effective. In a second stage, building on these outputs, a more detailed CCA
Assessment can be carried out in a well-defined region because the ECA
methodology and its results are easily scalable from the national level to higher
level of resolutions.
Figure 2 Project Decision Matrix for using the ECA Methodology and the ECA Guidebook (values are
indicative only)
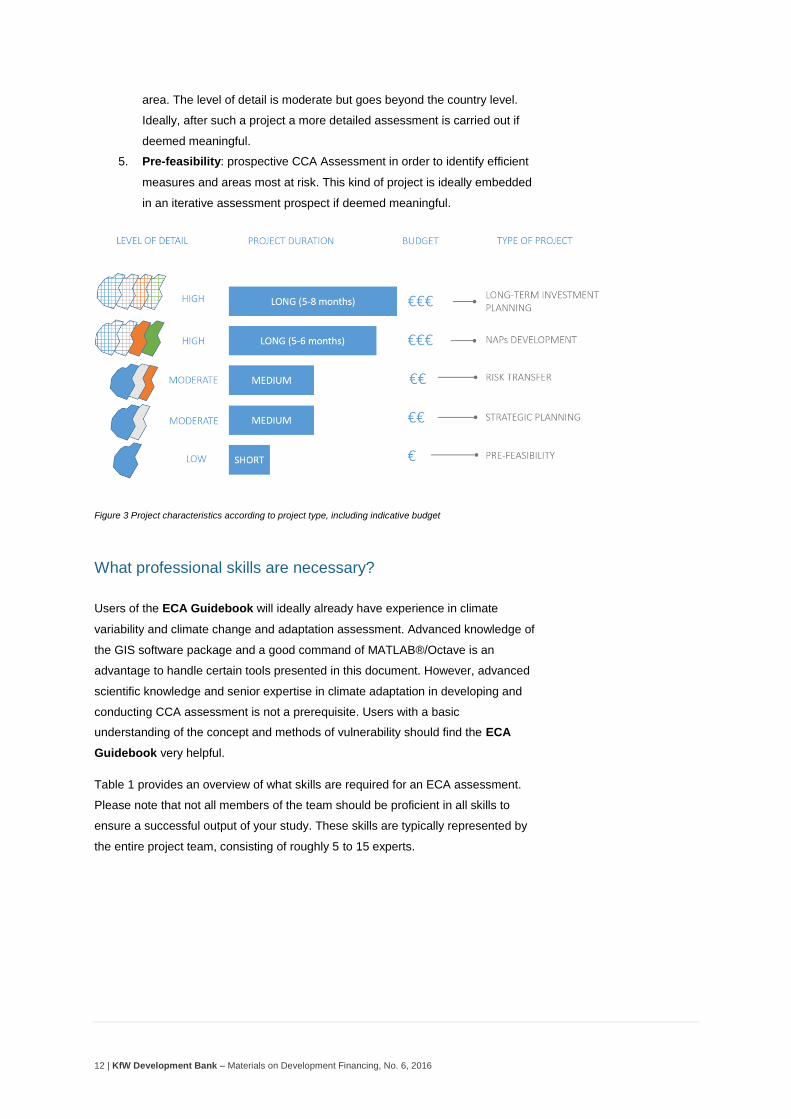
In Figure 3, we showcase typical types of projects that can be addressed using the
ECA methodology with the ECA Guidebook. The project duration, budget and
resolution are represented for different types of CCA Assessments. As shown in
the decision matrix in Figure 2, the duration of the project and the level of detail
chosen (or needed) for the purpose of the study shall influence your budget, and
will therefore play a role in your decision whether you undertake an ECA-CCA
Assessment or not. We have chosen five (5) “typical” projects, which might be of
interest:
1. Long-term investment planning: In this type of project, you are
interested in extending your investment portfolio in a country. Depending
on the volume of the investment, a detailed study for CCA measures might
be meaningful.
2. NAPs development: numerous governments are looking into developing
their National Adaptation Plans (NAPs) and your project aims at assisting
them in their decision-making process. In this case, the level of detail you
will go into depends on the volume of your project and the prospect of an
investment in CCA measures.
3. Risk transfer: in some cases, you might be interested in completing
already existing CCA measures and looking into potential for risk transfer
for low-frequency hazards.
4. Strategic planning: prospective assessment in order to determine what
measures are best adapted to certain conditions in a well determined
12 | KfW Development Bank – Materials on Development Financing, No. 6, 2016
area. The level of detail is moderate but goes beyond the country level.
Ideally, after such a project a more detailed assessment is carried out if
deemed meaningful.
5. Pre-feasibility: prospective CCA Assessment in order to identify efficient
measures and areas most at risk. This kind of project is ideally embedded
in an iterative assessment prospect if deemed meaningful.
Figure 3 Project characteristics according to project type, including indicative budget
What professional skills are necessary?
Users of the ECA Guidebook will ideally already have experience in climate
variability and climate change and adaptation assessment. Advanced knowledge of
the GIS software package and a good command of MATLAB®/Octave is an
advantage to handle certain tools presented in this document. However, advanced
scientific knowledge and senior expertise in climate adaptation in developing and
conducting CCA assessment is not a prerequisite. Users with a basic
understanding of the concept and methods of vulnerability should find the ECA
Guidebook very helpful.
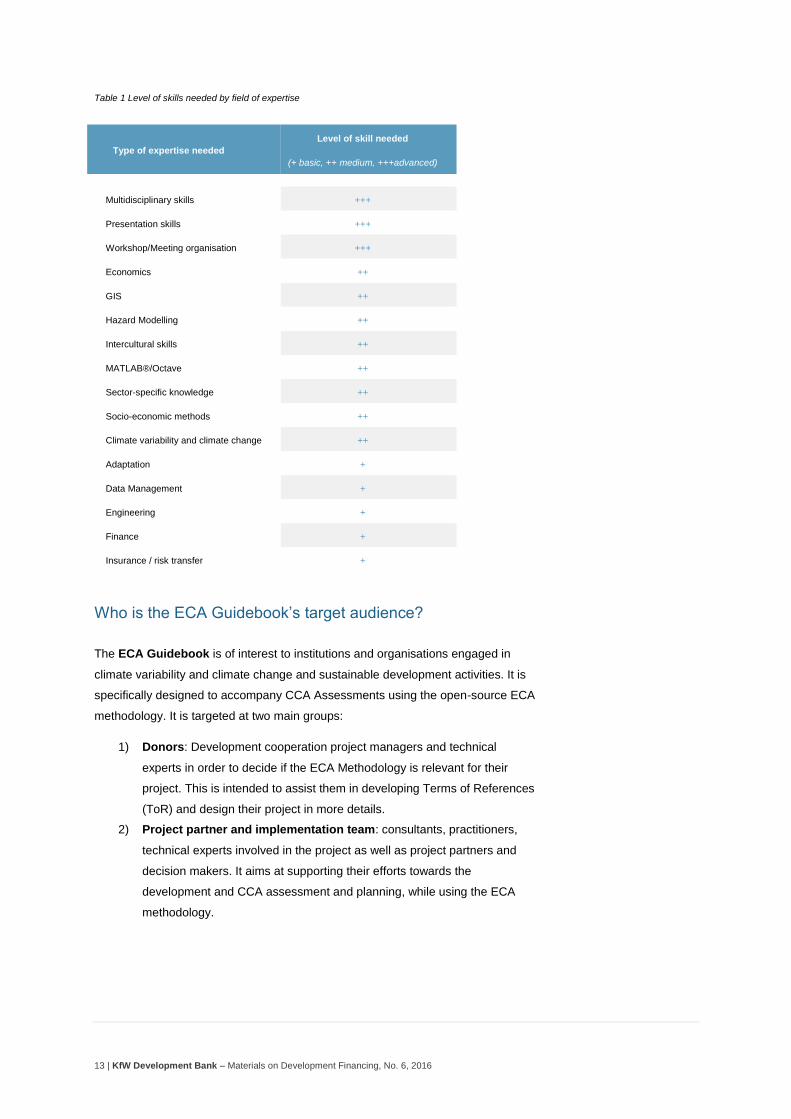
Table 1 provides an overview of what skills are required for an ECA assessment.
Please note that not all members of the team should be proficient in all skills to
ensure a successful output of your study. These skills are typically represented by
the entire project team, consisting of roughly 5 to 15 experts.
13 | KfW Development Bank – Materials on Development Financing, No. 6, 2016
Table 1 Level of skills needed by field of expertise
Type of expertise needed
Level of skill needed
(+ basic, ++ medium, +++advanced)
Multidisciplinary skills +++
Presentation skills +++
Workshop/Meeting organisation +++
Economics ++
GIS ++
Hazard Modelling ++
Intercultural skills ++
MATLAB®/Octave ++
Sector-specific knowledge ++
Socio-economic methods ++
Climate variability and climate change ++
Adaptation +
Data Management +
Engineering +
Finance +
Insurance / risk transfer +
Who is the ECA Guidebook’s target audience?
The ECA Guidebook is of interest to institutions and organisations engaged in
climate variability and climate change and sustainable development activities. It is
specifically designed to accompany CCA Assessments using the open-source ECA
methodology. It is targeted at two main groups:
1) Donors: Development cooperation project managers and technical
experts in order to decide if the ECA Methodology is relevant for their
project. This is intended to assist them in developing Terms of References
(ToR) and design their project in more details.
2) Project partner and implementation team: consultants, practitioners,
technical experts involved in the project as well as project partners and
decision makers. It aims at supporting their efforts towards the
development and CCA assessment and planning, while using the ECA
methodology.
14 | KfW Development Bank – Materials on Development Financing, No. 6, 2016
How do you use the ECA Guidebook?
The ECA Guidebook shall allow a project team (partner organisations, consultants
etc.) to carry out, with limited assistance, an ECA Assessment study, from risk
assessment to feasibility study of CCA measures. The ECA Guidebook shall also
provide technical and practical information about every step necessary in the
achievement of a CCA Assessment using the ECA methodology and its associated
tools (i.e. climada5).
How was the ECA Guidebook developed?
In 2013, KfW started to implement two pilot studies in Bangladesh (Barisal) and El
Salvador (San Salvador) testing the ECA approach to prepare CCA measures in
urban areas. KfW had identified the ECA methodology as a valuable approach to
(1) provide local decision makers with the fact base to develop their own adaptation
strategy, (2) foster the development of KfW’s CCA portfolio, including more loan
and programme-based finance as well as climate risk insurance approaches, not
least in the context of (3) the future challenge of National Adaptation Plans (NAPs),
and to (4) learn for its climate screening procedure, too6.
Following these two field studies, KfW identified the potential and limitations of the
ECA methodology in developing countries. Based on this evaluation, KfW
recognized the need to develop a document offering a hands-on approach to the
methodology, accompanying the user step by step through the ECA methodology
process.
How should the ECA Guidebook be used?
The ECA Guidebook is designed to accompany CCA Assessment using the open-
source ECA methodology and its associated tools (climada7, also open-source).
The ECA Guidebook is particularly helpful in cases which require an integrated
approach towards the development and planning of specific CCA measures.
5 climada is a tool dedicated to the ECA Methodology. It assists the users in many ways and is presented
later in this Guidebook. 6 https://www.kfw-entwicklungsbank.de/Internationale-Finanzierung/KfW-Entwicklungsbank/Wer-wir-
sind/News/News-Details_232192.html 7 https://github.com/davidnbresch/climada
15 | KfW Development Bank – Materials on Development Financing, No. 6, 2016
Thanks to its flexibility, it is applicable to a wide range of topics and the ECA
Guidebook is not limited to one sector or spatial level and can be used in various
contexts.
The ECA Guidebook is particularly helpful in guiding practitioners through the ECA
associated tool climada. This tool will be presented further in the following chapters.
The ECA Guidebook explains in detail, and using examples from field studies, how
the tool climada is used, calibrated and validated for the needs of your study.
Hence, in addition to the more technical manual of climada (presented in the next
chapter), the ECA Guidebook offers guidance on how to fully integrate this tool in
your CCA Assessment.
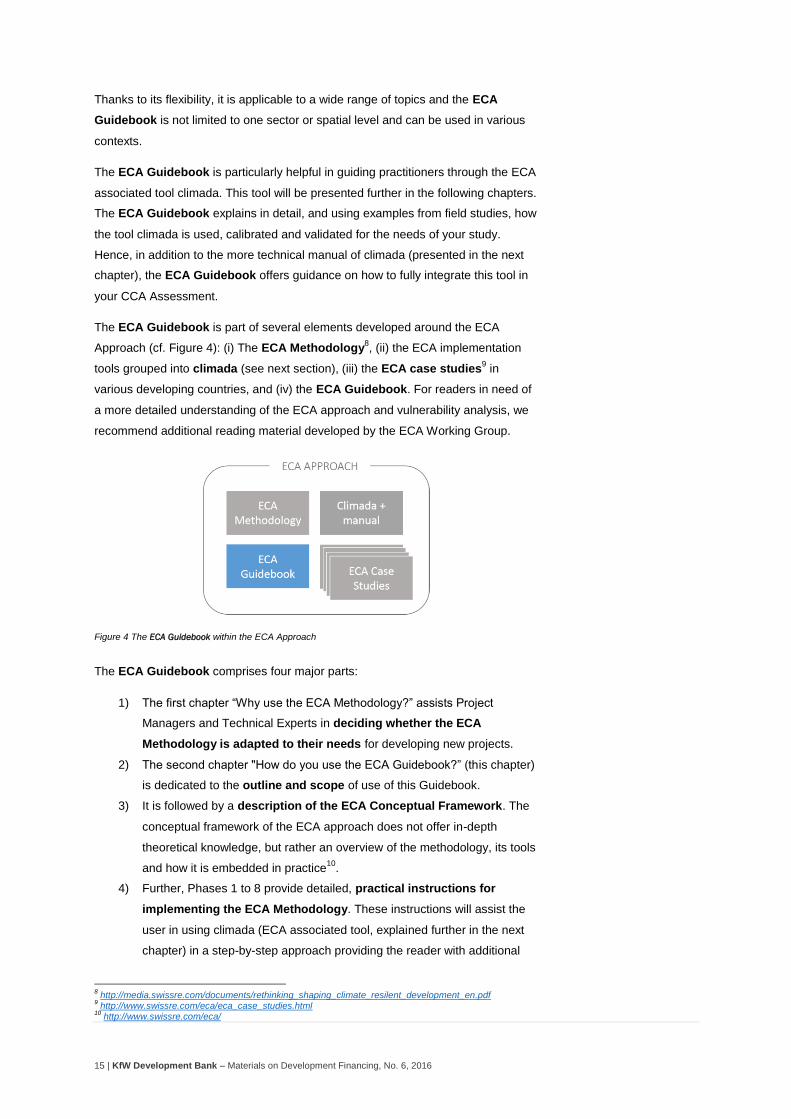
The ECA Guidebook is part of several elements developed around the ECA
Approach (cf. Figure 4): (i) The ECA Methodology8, (ii) the ECA implementation
tools grouped into climada (see next section), (iii) the ECA case studies9 in
various developing countries, and (iv) the ECA Guidebook. For readers in need of
a more detailed understanding of the ECA approach and vulnerability analysis, we
recommend additional reading material developed by the ECA Working Group.
Figure 4 The ECA Guidebook within the ECA Approach
The ECA Guidebook comprises four major parts:
1) The first chapter “Why use the ECA Methodology?” assists Project
Managers and Technical Experts in deciding whether the ECA
Methodology is adapted to their needs for developing new projects.
2) The second chapter "How do you use the ECA Guidebook?” (this chapter)
is dedicated to the outline and scope of use of this Guidebook.
3) It is followed by a description of the ECA Conceptual Framework. The
conceptual framework of the ECA approach does not offer in-depth
theoretical knowledge, but rather an overview of the methodology, its tools
and how it is embedded in practice10
.
4) Further, Phases 1 to 8 provide detailed, practical instructions for
implementing the ECA Methodology. These instructions will assist the
user in using climada (ECA associated tool, explained further in the next
chapter) in a step-by-step approach providing the reader with additional
8 http://media.swissre.com/documents/rethinking_shaping_climate_resilent_development_en.pdf
9 http://www.swissre.com/eca/eca_case_studies.html
10 http://www.swissre.com/eca/

16 | KfW Development Bank – Materials on Development Financing, No. 6, 2016
information on expected outcomes, necessary inputs and available tools.
Each Phase also identifies potential issues the user may encounter during
implementation.
In addition, each Phase provides a series of complementary information such as:
Boxes providing further theoretical background information or showcasing
practical examples from pilot studies
Tips informing the users on best practices and practical shortcuts
Glossary providing definitions of key terms used throughout the ECA
Guidebook
Bibliography of most relevant literature on the topic for further reading
Annexes providing the practitioners with additional useful information, e.g.
data resources and links.
The ECA Guidebook was developed, based on a modular structure, easily
allowing the addition of complementary Phases. This version constitutes the first
version of the ECA Guidebook and might be subject to amendments and benefit
from further contribution by upcoming assessments.
17 | KfW Development Bank – Materials on Development Financing, No. 6, 2016
An overview of the ECA Methodology
Conceptual Framework
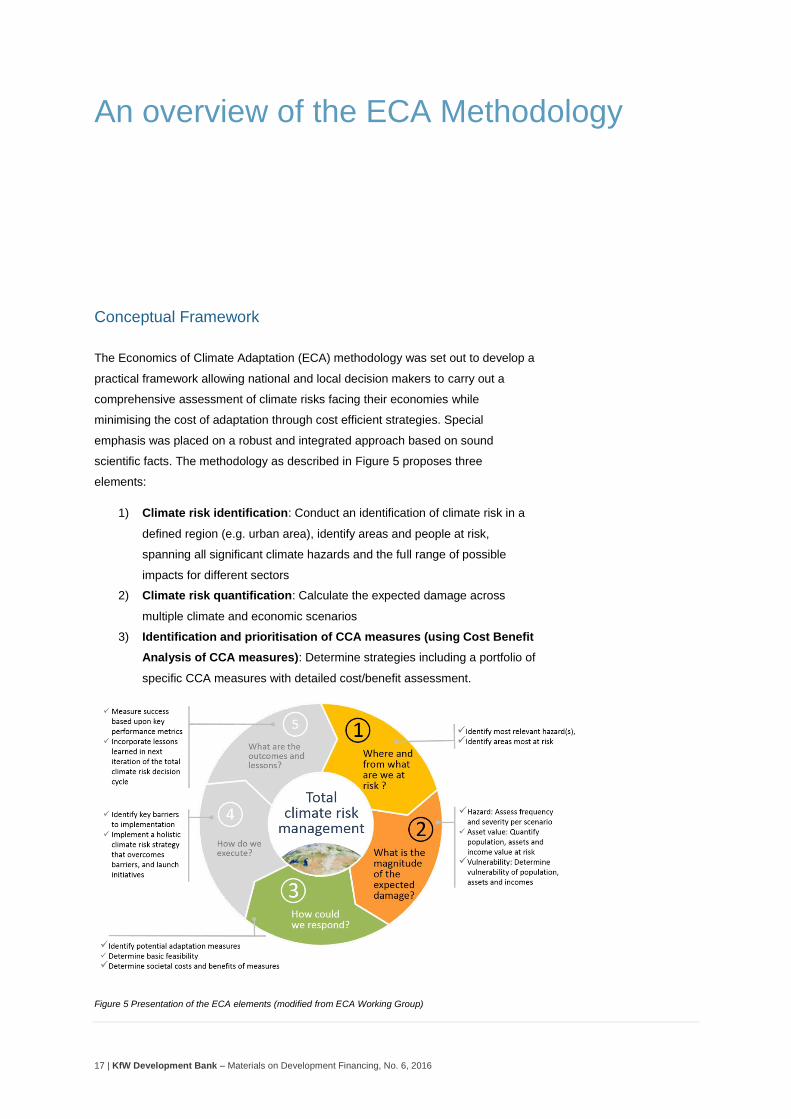
The Economics of Climate Adaptation (ECA) methodology was set out to develop a
practical framework allowing national and local decision makers to carry out a
comprehensive assessment of climate risks facing their economies while
minimising the cost of adaptation through cost efficient strategies. Special
emphasis was placed on a robust and integrated approach based on sound
scientific facts. The methodology as described in Figure 5 proposes three
elements:
1) Climate risk identification: Conduct an identification of climate risk in a
defined region (e.g. urban area), identify areas and people at risk,
spanning all significant climate hazards and the full range of possible
impacts for different sectors
2) Climate risk quantification: Calculate the expected damage across
multiple climate and economic scenarios
3) Identification and prioritisation of CCA measures (using Cost Benefit
Analysis of CCA measures): Determine strategies including a portfolio of
specific CCA measures with detailed cost/benefit assessment.
Figure 5 Presentation of the ECA elements (modified from ECA Working Group)
18 | KfW Development Bank – Materials on Development Financing, No. 6, 2016
Further elements in the methodology include the implementation of the portfolio of
CCA measures and the inclusion of best practices in the next climate risk decision.
In this ECA Guidebook, only step 1 to 3 shall be considered.
The ECA Framework in eight (8) Phases
This section describes different Phases (1-8), corresponding to each element of the
ECA Conceptual Framework. These Phases are concisely presented below. For
ease of reading, each Phase shows corresponding ECA colours (cf. Figure 6). The
eight (8) Phases described in the following chapters are presented in Figure 6. As
depicted below, each Phase builds on one another. Furthermore, recommended
tools are depicted such as for element 1 (Phase 1 and 2), mainly carried out using
expert knowledge during workshops. For element 2 (Phase 3-6) and element 3
(Phase 7-8), the tool “climada” (description in the next section) offers a fully
integrated approach.
Each Phase is constructed to include key questions to guide the user through the
implementation. Because of the interaction between Phases, they refer to relevant
steps and outcomes of previous Phases, if appropriate. Furthermore, to facilitate
the practical application, references are made to more detailed supplementary
information or practical tools in the Annex. At the beginning of each Phase, you will
find an overview of:
Description of the Phase: provides a concise description of the Phase,
its rationale and purpose.
Key steps: shows the main tasks to be undertaken guided by key
questions.
Input needed: reviews the necessary inputs needed to undertake each
step. This input might be outcomes from previous Phases. It lists all the
information needed before starting this Phase.
Expected outputs: the main outcomes from the Phase, often used as
input for the next Phases.
Tools and additional information: tools, templates, and additional
information related to the Phase are included.
19 | KfW Development Bank – Materials on Development Financing, No. 6, 2016
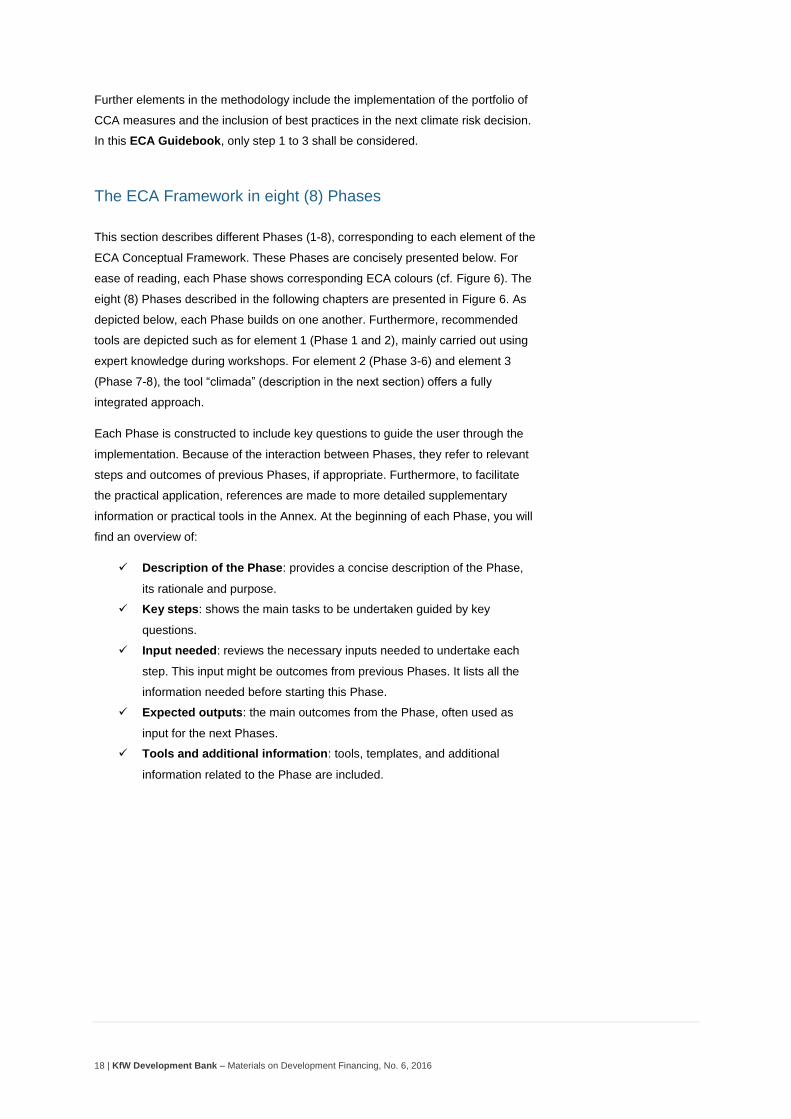
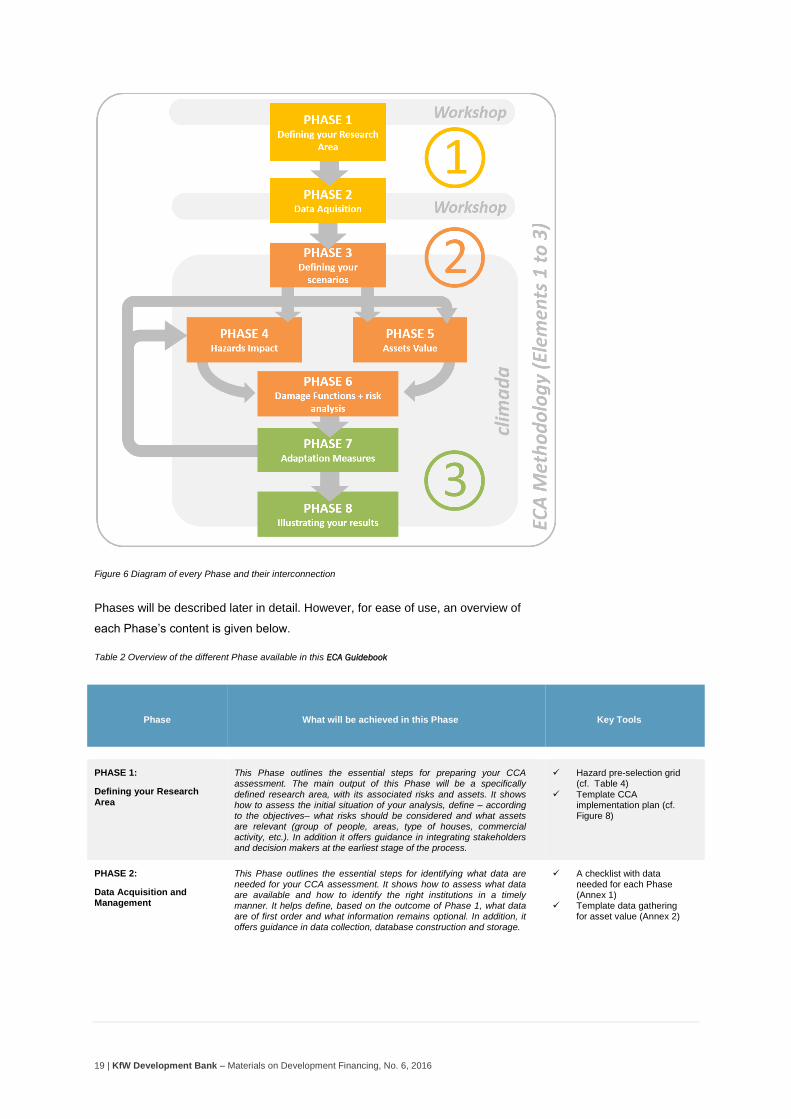
Figure 6 Diagram of every Phase and their interconnection
Phases will be described later in detail. However, for ease of use, an overview of
each Phase’s content is given below.
Table 2 Overview of the different Phase available in this ECA Guidebook
Phase What will be achieved in this Phase Key Tools
PHASE 1:
Defining your Research Area
This Phase outlines the essential steps for preparing your CCA assessment. The main output of this Phase will be a specifically
defined research area, with its associated risks and assets. It shows how to assess the initial situation of your analysis, define – according to the objectives– what risks should be considered and what assets are relevant (group of people, areas, type of houses, commercial activity, etc.). In addition it offers guidance in integrating stakeholders and decision makers at the earliest stage of the process.
Hazard pre-selection grid (cf. Table 4)
Template CCA implementation plan (cf. Figure 8)
PHASE 2:
Data Acquisition and Management
This Phase outlines the essential steps for identifying what data are needed for your CCA assessment. It shows how to assess what data are available and how to identify the right institutions in a timely manner. It helps define, based on the outcome of Phase 1, what data are of first order and what information remains optional. In addition, it offers guidance in data collection, database construction and storage.
A checklist with data needed for each Phase (Annex 1)
Template data gathering for asset value (Annex 2)

20 | KfW Development Bank – Materials on Development Financing, No. 6, 2016
PHASE 3:
Defining Scenarios
This Phase outlines the essential steps for defining your climate and socio-economic scenarios. It shows how to assess the current situation and decide what scenarios are relevant for your objectives. It assists you in defining a time horizon relevant for the CCA measures, hazards and financial/economic scenarios you have considered in Phase 1. In addition, it provides guidance in obtaining and developing scenario relevant information for hazards, assets and economic scenarios.
Criteria for time horizon selection
PHASE 4:
Modelling Hazards
This Phase outlines the essential steps for modelling hazards selected
in Phase 1. It will assist you in using the data gathered in Phase 2 and include scenarios developed in Phase 3. In addition, it will provide you with guidance on how to create hazard impact maps using climada for selected hazards.
climada Hazard Module (cf. climada manual)
GIS application for manipulation of hazard sets
PHASE 5:
Valuating Assets
This Phase outlines the essential steps towards a sound valuation of the asset categories selected in Phase 1. It will provide you with guidance on how to best value different categories of assets and how
to insert them into climada. In addition, it will provide you with tips on how to value assets without monetary values or assets with low monetary values. Particular emphasis will be placed on a pro-poor approach dedicated to developing and emerging countries/economies.
climada Asset Phase (cf. climada manual)
GIS application software
PHASE 6:
Creating Damage
Functions and Risk Analysis
This Phase outlines the essential steps for creating damage functions for the different classes of assets and for the different types of hazards. It will give you information and guidance in order to organize an expert workshop to gather information on past disasters in your region/country. In addition it provides guidance on how to develop damage functions from historical observations and insert them into climada. At the end of this phase, you will have performed your risk analysis.
climada manual and climada damage function generator (cf. climada manual)
ERN-Vulnerability damage function generator (cf. manual and download at http://www.ecapra.org/ern-vulnerability)
PHASE 7:
Simulating CCA measures
This Phase outlines the essential steps for selecting and simulating
your CCA measures. It will assist you in creating a long list of CCA measures and provide information on how to create a short list of CCA measures using a multi-criteria selection. It will assist you in parameterising your short list of CCA measures into climada and calibrating them in order to provide sound results.
Table of parameters for different CCA measures for selected hazards (see Annex 3 for flood risk)
climada CCA measure format table (cf. climada manual)
Stakeholder workshop, discuss with local experts to identify a long list of measures
PHASE 8: Illustrating Results
This Phase will show you how to summarise and present the findings of your analysis. For this task, it important to keep in mind whom these results are targeted at. According to your objectives, what was the target audience, who are the stakeholders and the beneficiaries of your CCA assessment? Which outcomes are important for subsequent tasks (for instance adaptation planning or strategy development)? What is the best format to convey your results?
Climada illustration tools
climada: An integrated tool for ECA
climada (from climate adaptation) implements the quantitative modelling and
simulation part of the ECA methodology. While the present ECA Guidebook
provides guidance on the application of the full ECA methodology, the climada
manual documents the modelling platform that underpins ECA. Unlike many
existing methodologies, ECA therefore provides a unique integrated approach
(Methodology, Tools, Manuals and Guidebooks in one package) to natural
catastrophes, climate variability and climate change adaptation.
21 | KfW Development Bank – Materials on Development Financing, No. 6, 2016
Hence, climada is conveniently embedded into the methodology and integrates all
steps of the ECA methodology in different phases. climada is a tool running either
on MATLAB® or Octave and can be downloaded free of charge11
. MATLAB®12
is a
basic and common computer language, Octave13
is its open-source and free of
charge surrogate. For more details about the damage calculation process, please
refer to the climada manual14
, and to the climada wiki15
.
Because of the physical base of climate risk (different physical magnitudes of a
climate event have different effects) and the resulting accumulated damage,
traditional approaches to cost benefit analysis proved cost intensive and
cumbersome. Consequently, a probabilistic model - climada - has been developed
to deliver efficiently (and automatically) verifiable results, which can be compared to
historical events. Because Phase 1 and Phase 2 are dedicated to gathering
information and raising ownership of the project, and Phase 3 to the development
of scenarios, climada (as a physically based model) provides assistance only to
Phases 4-8:
Phase 4: Hazards: the variables defining the hazards (e.g. wind, inundation,
landslides) are defined probabilistically for present and future conditions. Their
spatial distribution is also determined at this stage.
Phase 5: Assets: assets are defined according to different classes or categories
and are geographically distributed in order to estimate the expected damages from
climate variability and climate change impacts under different socio-economic
scenarios;
Phase 6: Damage functions: the damage function relates the intensity of a given
hazard to the damaged caused to a certain category of asset.
Phase 7: CCA measures: At this stage, a set of different CCA measures is
evaluated in terms of costs and benefits. Adaptation to a certain hazard or a set of
hazards can be achieved in either reducing the hazard or the damages. To do so,
different solutions exist such as: physical protection, structural modification,
planning and early warning or socioeconomic development.
Phase 8: Illustrating your results: Thanks to its MATLAB® /Octave based
interface, climada offers a large range of possibilities. In addition, raw data can be
easily exported to other software packages such as GIS.
How do you use climada?
Use and application of climada have been described in detail in the climada manual
which is available online, free of charge (cf. link above). The manual describes the
core routines and Phases available in climada and complements the ECA
11
Available at https://github.com/davidnbresch/climada 12
http://de.mathworks.com/products/MATLAB(r)/ 13
www.gnu.org/software/octave 14
https://github.com/davidnbresch/climada/blob/master/docs/climada_manual.pdf 15
https://github.com/davidnbresch/climada/wiki
22 | KfW Development Bank – Materials on Development Financing, No. 6, 2016
Guidebook. The use of climada requires a basic knowledge of the MATLAB®
programming language in order to avoid any black box16
use. climada consists of
the core Phase, providing the user with the key functionality to perform an
economics of climate adaptation assessment. Additional Phases implement global
coverage (automatic asset generation), a series of hazards (tropical cyclone, surge,
rain, European winter storms and even earthquake and meteorites) and further
functionality, such as Google Earth access and animations. Skills and expertise
needed for using the ECA Guidebook are listed above in Table 1.
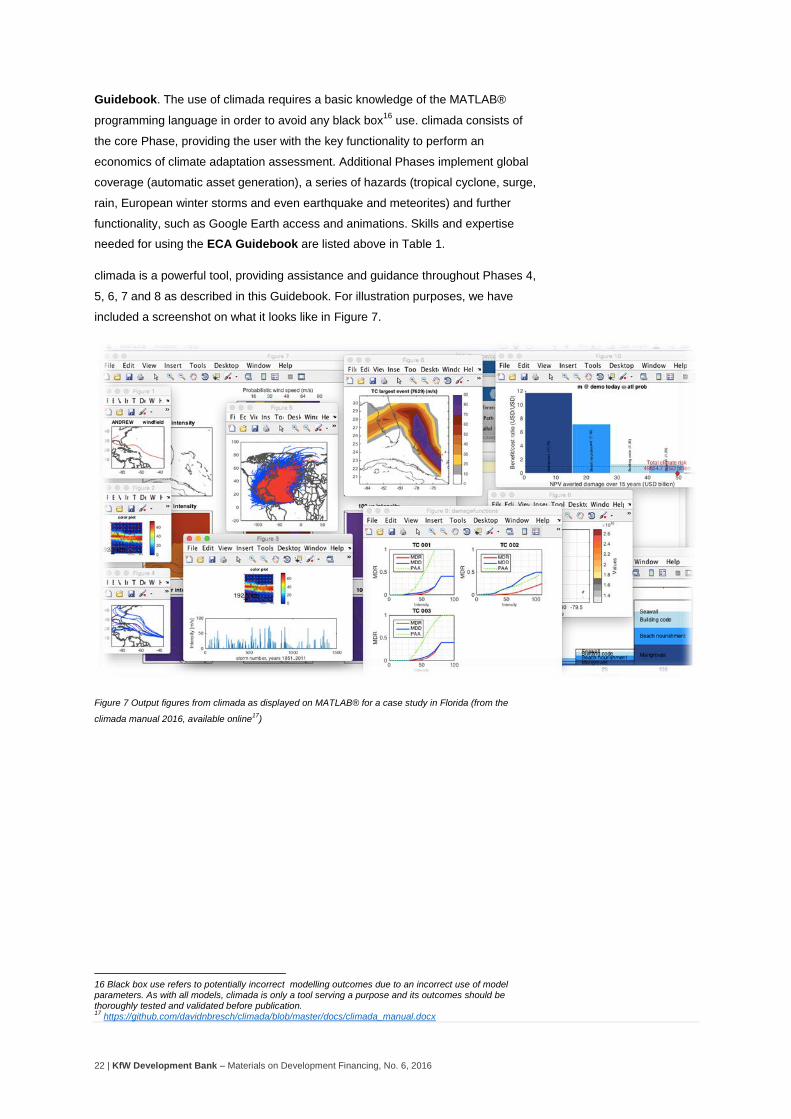
climada is a powerful tool, providing assistance and guidance throughout Phases 4,
5, 6, 7 and 8 as described in this Guidebook. For illustration purposes, we have
included a screenshot on what it looks like in Figure 7.
Figure 7 Output figures from climada as displayed on MATLAB® for a case study in Florida (from the
climada manual 2016, available online17
)
16 Black box use refers to potentially incorrect modelling outcomes due to an incorrect use of model parameters. As with all models, climada is only a tool serving a purpose and its outcomes should be thoroughly tested and validated before publication. 17
https://github.com/davidnbresch/climada/blob/master/docs/climada_manual.docx
23 | KfW Development Bank – Materials on Development Financing, No. 6, 2016
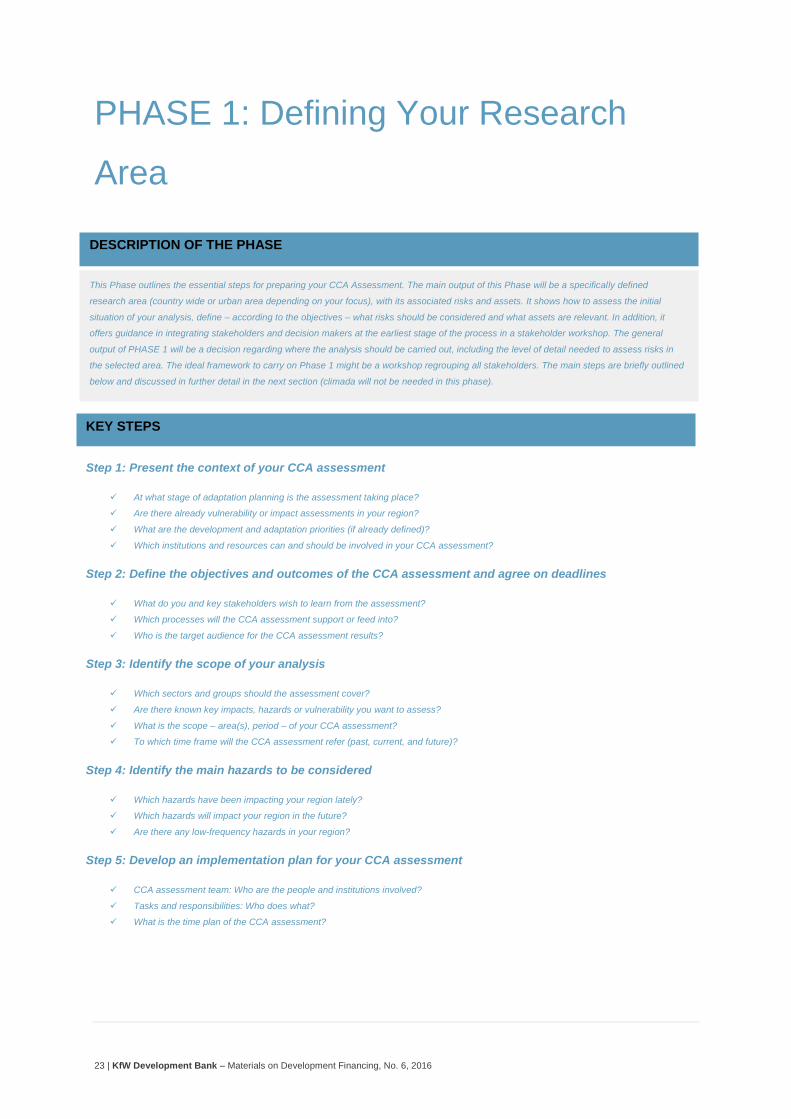
PHASE 1: Defining Your Research
Area
KEY STEPS
Step 1: Present the context of your CCA assessment
At what stage of adaptation planning is the assessment taking place?
Are there already vulnerability or impact assessments in your region?
What are the development and adaptation priorities (if already defined)?
Which institutions and resources can and should be involved in your CCA assessment?
Step 2: Define the objectives and outcomes of the CCA assessment and agree on deadlines
What do you and key stakeholders wish to learn from the assessment?
Which processes will the CCA assessment support or feed into?
Who is the target audience for the CCA assessment results?
Step 3: Identify the scope of your analysis
Which sectors and groups should the assessment cover?
Are there known key impacts, hazards or vulnerability you want to assess?
What is the scope – area(s), period – of your CCA assessment?
To which time frame will the CCA assessment refer (past, current, and future)?
Step 4: Identify the main hazards to be considered
Which hazards have been impacting your region lately?
Which hazards will impact your region in the future?
Are there any low-frequency hazards in your region?
Step 5: Develop an implementation plan for your CCA assessment
CCA assessment team: Who are the people and institutions involved?
Tasks and responsibilities: Who does what?
What is the time plan of the CCA assessment?
DESCRIPTION OF THE PHASE
This Phase outlines the essential steps for preparing your CCA Assessment. The main output of this Phase will be a specifically defined
research area (country wide or urban area depending on your focus), with its associated risks and assets. It shows how to assess the initial
situation of your analysis, define – according to the objectives – what risks should be considered and what assets are relevant. In addition, it
offers guidance in integrating stakeholders and decision makers at the earliest stage of the process in a stakeholder workshop. The general
output of PHASE 1 will be a decision regarding where the analysis should be carried out, including the level of detail needed to assess risks in
the selected area. The ideal framework to carry on Phase 1 might be a workshop regrouping all stakeholders. The main steps are briefly outlined
below and discussed in further detail in the next section (climada will not be needed in this phase).
24 | KfW Development Bank – Materials on Development Financing, No. 6, 2016
Getting Started
CCA assessments usually are unique in nature and serve specific purposes. So
you should make sure that: You understand the context in which the assessment is
taking place (Step 1), define clear objectives and outcomes for the assessment
(Step 2), determine the thematic, spatial and temporal scope of your CCA
assessment (Step 3), identify the main hazards you want to study (step 4), and
prepare an implementation plan that defines tasks and responsibilities for different
participants and stakeholders, as well as the schedule for the CCA assessment,
taking into account available resources (Step 5).
In practice, these five steps are closely interlinked and preparing a CCA
assessment is an iterative process balancing objectives, context, scope and
resources. Steps 1 to 5 result in important decisions which will influence the entire
CCA assessment, so it is essential that you document the results of this
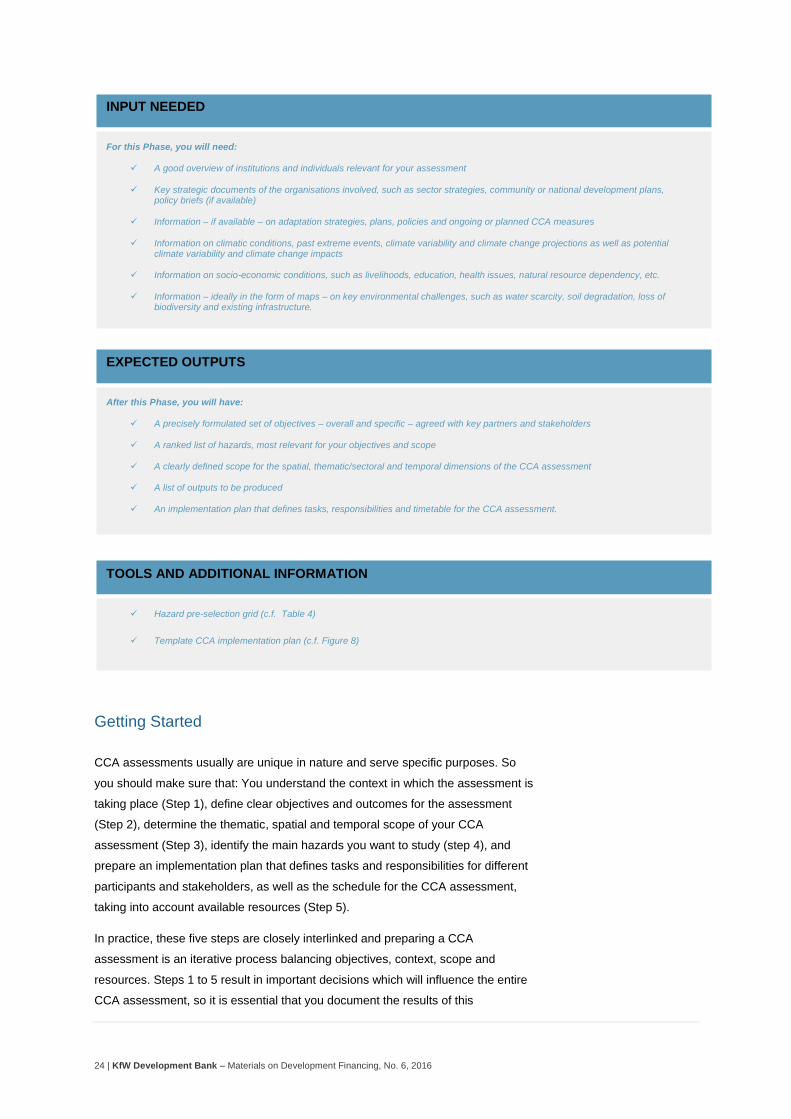
INPUT NEEDED
For this Phase, you will need:
A good overview of institutions and individuals relevant for your assessment
Key strategic documents of the organisations involved, such as sector strategies, community or national development plans, policy briefs (if available)
Information – if available – on adaptation strategies, plans, policies and ongoing or planned CCA measures
Information on climatic conditions, past extreme events, climate variability and climate change projections as well as potential climate variability and climate change impacts
Information on socio-economic conditions, such as livelihoods, education, health issues, natural resource dependency, etc.
Information – ideally in the form of maps – on key environmental challenges, such as water scarcity, soil degradation, loss of biodiversity and existing infrastructure.
EXPECTED OUTPUTS
After this Phase, you will have:
A precisely formulated set of objectives – overall and specific – agreed with key partners and stakeholders
A ranked list of hazards, most relevant for your objectives and scope
A clearly defined scope for the spatial, thematic/sectoral and temporal dimensions of the CCA assessment
A list of outputs to be produced
An implementation plan that defines tasks, responsibilities and timetable for the CCA assessment.
TOOLS AND ADDITIONAL INFORMATION
Hazard pre-selection grid (c.f. Table 4)
Template CCA implementation plan (c.f. Figure 8)
25 | KfW Development Bank – Materials on Development Financing, No. 6, 2016
preparatory phase well and share it with any actors who will be involved in your
assessment. This ensures transparency and provides substantiation for any
decisions as well as pending questions. There is a template hazard selection grid
(cf. Step 4) and a template implementation plan (Figure 8) for documenting the
results of Phase 1 (see Step 6); Make sure you include key institutions and
stakeholders while filling these documents and use it for further communication and
planning of the assessment.
Step 1: Present the context of your CCA assessment
Because every assessment takes place in a unique setting, it is important to
explore the context of this assessment. It will help you to specify the objectives and
the outcomes of your study and set the right balance of resources. To do so, keep
in mind the following guiding questions (BMZ, 2014):
Related Activities:
What are ongoing or planned activities related to adaptation?
Which (ongoing) activities should or could benefit from the CBA
Assessment?
Which activities could the CBA Assessment benefit from?
Knowledge Baseline
What is already known about climate variability and climate change and its
impacts?
Have there already been risk, vulnerability or impact assessments?
Which information gaps should be filled by the CCA Assessment?
Stakeholders
Which institutions or stakeholders will or should be involved in the CCA
Assessment?
What are their specific interests and objectives regarding the CCA
Assessment?
What and how can they contribute to the CCA Assessment?
Should you include the private sector?
Resources
Which (financial, human, technical, etc.) resources can be dedicated to
conducting the CCA Assessment?
How will the CCA measure be financed?
When are results from the CCA Assessment needed?
Which relevant information and data are available for the CCA
Assessment?
26 | KfW Development Bank – Materials on Development Financing, No. 6, 2016
External Factors
Are there important external factors that should be taken into account?
How do these external factors potentially influence the system under
review?
Are there any major threats to the realisation of this assessment?
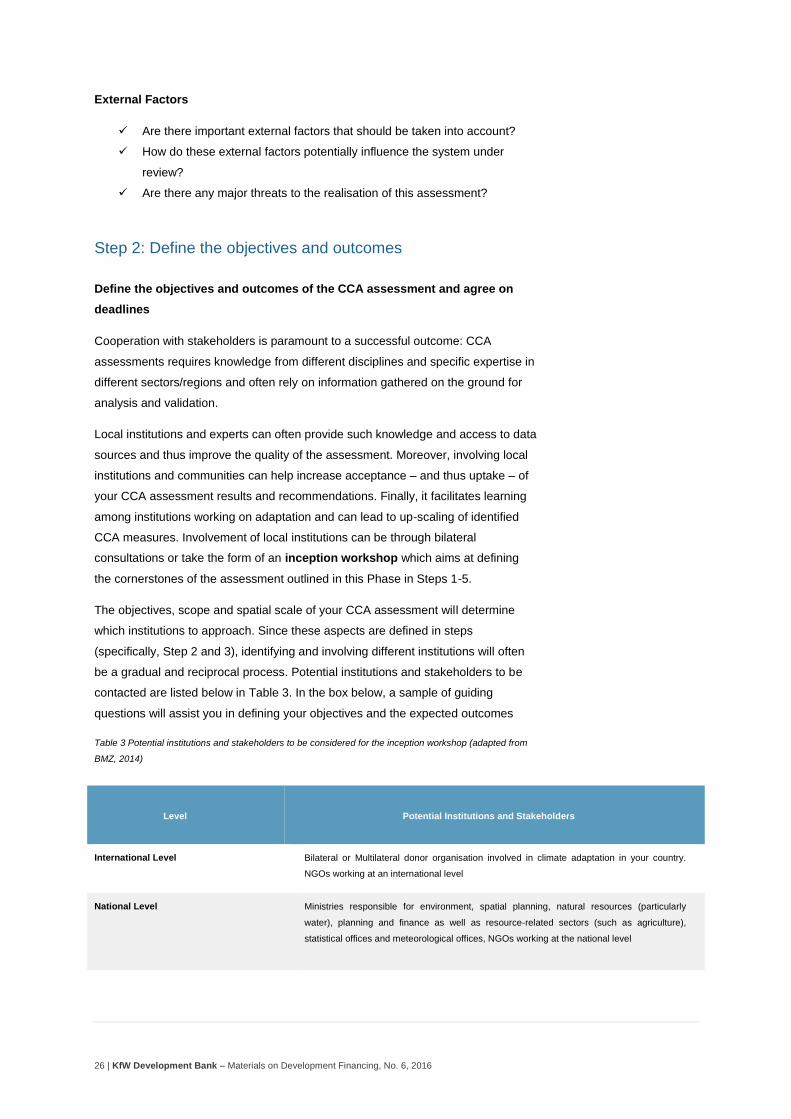
Step 2: Define the objectives and outcomes
Define the objectives and outcomes of the CCA assessment and agree on
deadlines
Cooperation with stakeholders is paramount to a successful outcome: CCA
assessments requires knowledge from different disciplines and specific expertise in
different sectors/regions and often rely on information gathered on the ground for
analysis and validation.
Local institutions and experts can often provide such knowledge and access to data
sources and thus improve the quality of the assessment. Moreover, involving local
institutions and communities can help increase acceptance – and thus uptake – of
your CCA assessment results and recommendations. Finally, it facilitates learning
among institutions working on adaptation and can lead to up-scaling of identified
CCA measures. Involvement of local institutions can be through bilateral
consultations or take the form of an inception workshop which aims at defining
the cornerstones of the assessment outlined in this Phase in Steps 1-5.
The objectives, scope and spatial scale of your CCA assessment will determine
which institutions to approach. Since these aspects are defined in steps
(specifically, Step 2 and 3), identifying and involving different institutions will often
be a gradual and reciprocal process. Potential institutions and stakeholders to be
contacted are listed below in Table 3. In the box below, a sample of guiding
questions will assist you in defining your objectives and the expected outcomes
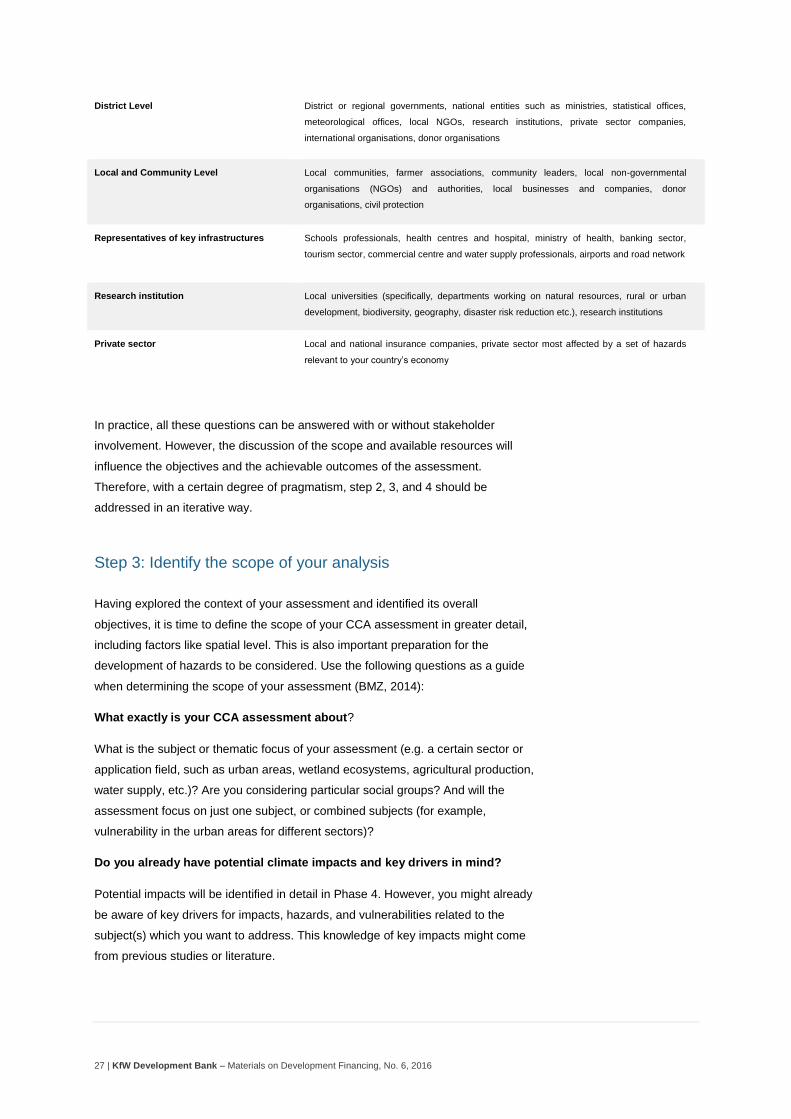
Table 3 Potential institutions and stakeholders to be considered for the inception workshop (adapted from
BMZ, 2014)
Level Potential Institutions and Stakeholders
International Level Bilateral or Multilateral donor organisation involved in climate adaptation in your country.
NGOs working at an international level
National Level Ministries responsible for environment, spatial planning, natural resources (particularly
water), planning and finance as well as resource-related sectors (such as agriculture),
statistical offices and meteorological offices, NGOs working at the national level
27 | KfW Development Bank – Materials on Development Financing, No. 6, 2016
District Level District or regional governments, national entities such as ministries, statistical offices,
meteorological offices, local NGOs, research institutions, private sector companies,
international organisations, donor organisations
Local and Community Level Local communities, farmer associations, community leaders, local non-governmental
organisations (NGOs) and authorities, local businesses and companies, donor
organisations, civil protection
Representatives of key infrastructures Schools professionals, health centres and hospital, ministry of health, banking sector,
tourism sector, commercial centre and water supply professionals, airports and road network
Research institution Local universities (specifically, departments working on natural resources, rural or urban
development, biodiversity, geography, disaster risk reduction etc.), research institutions
Private sector Local and national insurance companies, private sector most affected by a set of hazards
relevant to your country’s economy
In practice, all these questions can be answered with or without stakeholder
involvement. However, the discussion of the scope and available resources will
influence the objectives and the achievable outcomes of the assessment.
Therefore, with a certain degree of pragmatism, step 2, 3, and 4 should be
addressed in an iterative way.
Step 3: Identify the scope of your analysis
Having explored the context of your assessment and identified its overall
objectives, it is time to define the scope of your CCA assessment in greater detail,
including factors like spatial level. This is also important preparation for the
development of hazards to be considered. Use the following questions as a guide
when determining the scope of your assessment (BMZ, 2014):
What exactly is your CCA assessment about?
What is the subject or thematic focus of your assessment (e.g. a certain sector or
application field, such as urban areas, wetland ecosystems, agricultural production,
water supply, etc.)? Are you considering particular social groups? And will the
assessment focus on just one subject, or combined subjects (for example,
vulnerability in the urban areas for different sectors)?
Do you already have potential climate impacts and key drivers in mind?
Potential impacts will be identified in detail in Phase 4. However, you might already
be aware of key drivers for impacts, hazards, and vulnerabilities related to the
subject(s) which you want to address. This knowledge of key impacts might come
from previous studies or literature.
28 | KfW Development Bank – Materials on Development Financing, No. 6, 2016
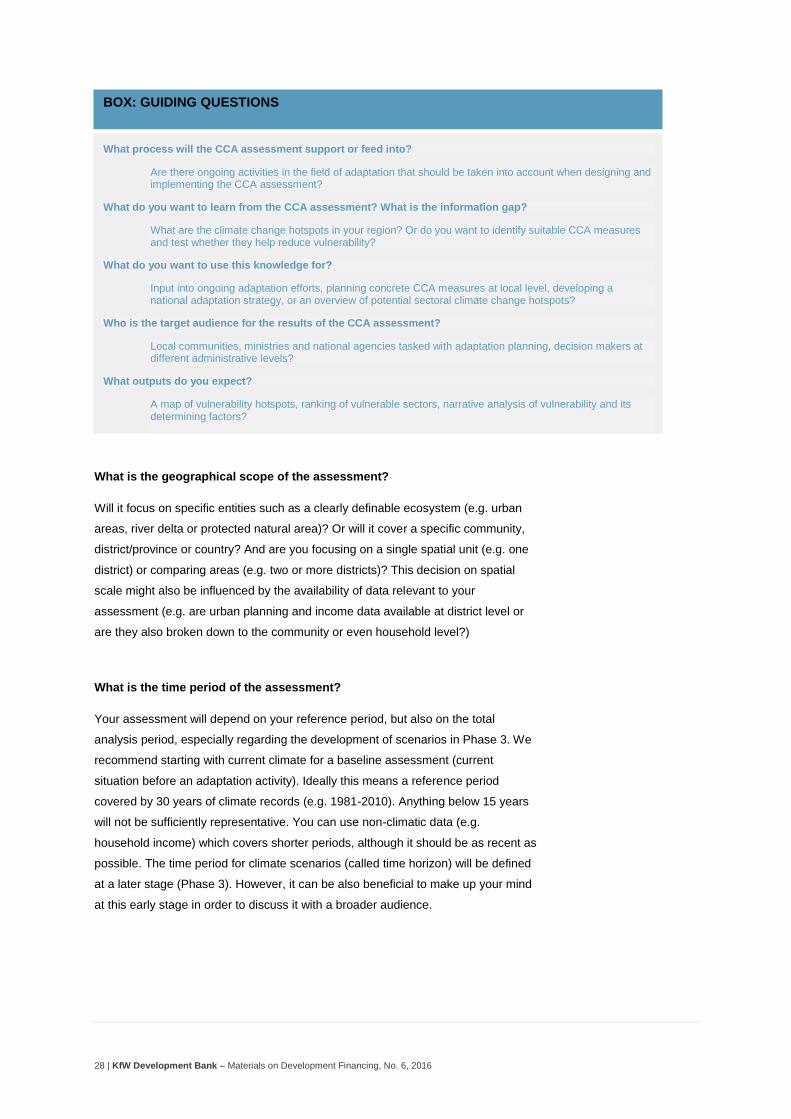
What is the geographical scope of the assessment?
Will it focus on specific entities such as a clearly definable ecosystem (e.g. urban
areas, river delta or protected natural area)? Or will it cover a specific community,
district/province or country? And are you focusing on a single spatial unit (e.g. one
district) or comparing areas (e.g. two or more districts)? This decision on spatial
scale might also be influenced by the availability of data relevant to your
assessment (e.g. are urban planning and income data available at district level or
are they also broken down to the community or even household level?)
What is the time period of the assessment?
Your assessment will depend on your reference period, but also on the total
analysis period, especially regarding the development of scenarios in Phase 3. We
recommend starting with current climate for a baseline assessment (current
situation before an adaptation activity). Ideally this means a reference period
covered by 30 years of climate records (e.g. 1981-2010). Anything below 15 years
will not be sufficiently representative. You can use non-climatic data (e.g.
household income) which covers shorter periods, although it should be as recent as
possible. The time period for climate scenarios (called time horizon) will be defined
at a later stage (Phase 3). However, it can be also beneficial to make up your mind
at this early stage in order to discuss it with a broader audience.
TIP: HAZARD VS DISASTER
A natural hazard may cause a disaster to a vulnerable society. However, one should be careful not to refer to
these as ‘natural disasters’ as in disaster risk literature a lot of emphasis is placed on the fact that disasters are
relationships between hazards and vulnerable societies (O'Keefe, Westgate & Wisner, 1976).
BOX: GUIDING QUESTIONS
What process will the CCA assessment support or feed into?
Are there ongoing activities in the field of adaptation that should be taken into account when designing and implementing the CCA assessment?
What do you want to learn from the CCA assessment? What is the information gap?
What are the climate change hotspots in your region? Or do you want to identify suitable CCA measures and test whether they help reduce vulnerability?
What do you want to use this knowledge for?
Input into ongoing adaptation efforts, planning concrete CCA measures at local level, developing a national adaptation strategy, or an overview of potential sectoral climate change hotspots?
Who is the target audience for the results of the CCA assessment?
Local communities, ministries and national agencies tasked with adaptation planning, decision makers at different administrative levels?
What outputs do you expect?
A map of vulnerability hotspots, ranking of vulnerable sectors, narrative analysis of vulnerability and its determining factors?
29 | KfW Development Bank – Materials on Development Financing, No. 6, 2016
Step 4: Identify the main hazards to be considered
Hazard Types
A hazard, and the disaster resulting from it, can have different origins: natural
(geological, hydro-meteorological and biological) or induced by human processes
(environmental degradation). Hazards can be single, sequential or combined in
their origin and effects. Each hazard is characterised by its location, intensity,
frequency, probability, duration, and area of extent, speed of onset, spatial
dispersion and temporal spacing. We will look at this in more detail in later
sessions. Hazards can be classified in several ways. A possible subdivision is
between:
Natural hazards are natural processes or phenomena within the earth's system
(lithosphere, hydrosphere, biosphere or atmosphere) that may constitute a
damaging event (such as earthquakes, volcanic eruptions, hurricanes);
Human-induced hazards are modifications of natural processes within the earth's
system (lithosphere, hydrosphere, biosphere or atmosphere) caused by human
activities which accelerate/aggravate damaging events (such as atmospheric
pollution, industrial chemical accidents, major armed conflicts, nuclear accidents, oil
spills);
Human-made hazards: dangers originating from technological or industrial
accidents, dangerous procedures, infrastructure failures or certain human activities,
which may cause the loss of life or injury, property damage, social and economic
disruption or environmental degradation (some examples: industrial pollution,
nuclear activities and radioactivity, toxic wastes, dam failures; transport, industrial
or technological accidents (explosions, fires, spills).
In climada/ECA, while focusing on climate variability and climate change induced
hazards, only natural and human-induced hazards will be considered. However,
other hazard types such as earthquake can be simulated within the model.
How do you prioritise between hazards?
In many situations, an area of interest is subject to numerous hazards. Depending
on the objectives of your study, it is often advisable to identify hazards which are
most relevant to these objectives (see Step 2). One or several hazards could be
chosen in the case of a multi-hazard approach. It is important to prioritise between
hazards
30 | KfW Development Bank – Materials on Development Financing, No. 6, 2016
In order to define relevant hazards, a methodology based on criteria selection is
described below. The following steps could be applied during a stakeholder
inception workshop, where experts and community are gathered.
1) A set of preselected relevant hazards are presented and discussed in
group. In order to ease the discussion, the group should be provided with
a clear definition of each pre-selected hazard. Pre-selection of hazards
could be done based on aggregated data base such as EM-Dat
(described in Phase 2).
2) A set of criteria is defined and discussed. The criteria are defined as
follow:
a) Impact level on the community
b) Intensity and frequency of hazard
c) Costs and period of recuperation after a disaster
d) Level of local knowledge for a hazard
e) Demand for adaptation from the community
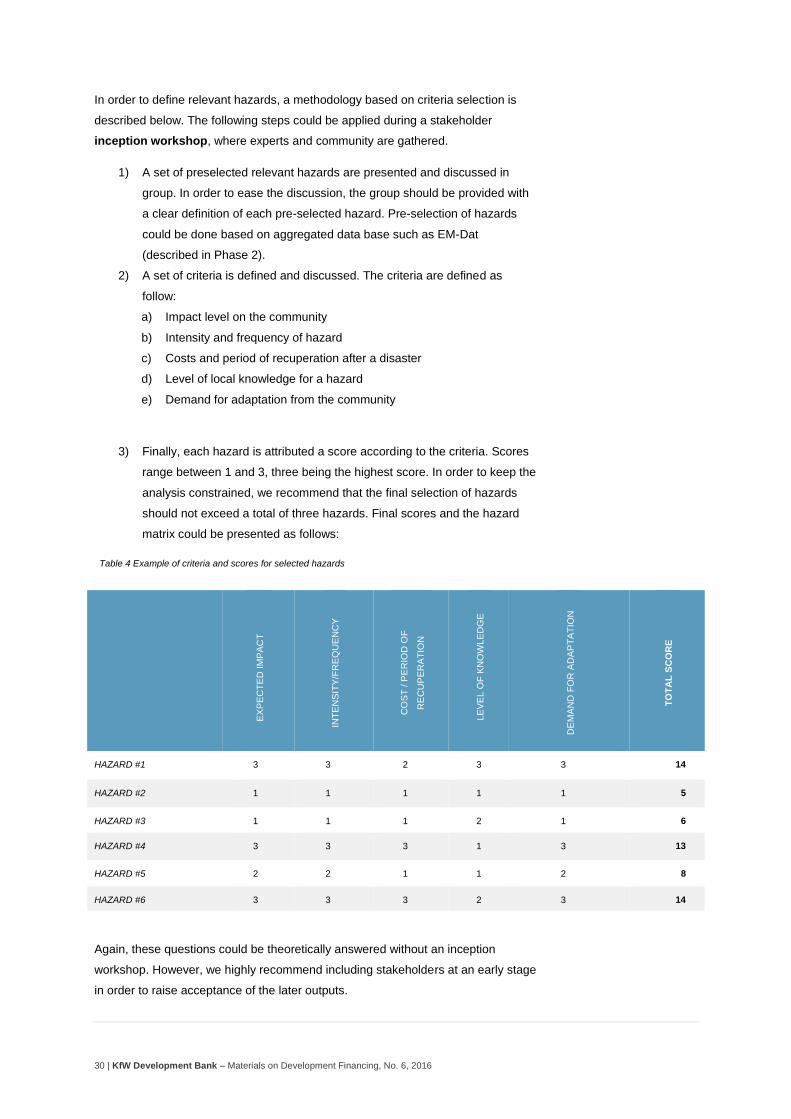
3) Finally, each hazard is attributed a score according to the criteria. Scores
range between 1 and 3, three being the highest score. In order to keep the
analysis constrained, we recommend that the final selection of hazards
should not exceed a total of three hazards. Final scores and the hazard
matrix could be presented as follows:
Table 4 Example of criteria and scores for selected hazards
EX
PE
CT
ED
IM
PA
CT
INT
EN
SIT
Y/F
RE
QU
EN
CY
CO
ST
/ P
ER
IOD
OF
RE
CU
PE
RA
TIO
N
LE
VE
L O
F K
NO
WLE
DG
E
DE
MA
ND
FO
R A
DA
PT
AT
ION
TO
TA
L S
CO
RE
HAZARD #1 3 3 2 3 3 14
HAZARD #2 1 1 1 1 1 5
HAZARD #3 1 1 1 2 1 6
HAZARD #4 3 3 3 1 3 13
HAZARD #5 2 2 1 1 2 8
HAZARD #6 3 3 3 2 3 14
Again, these questions could be theoretically answered without an inception
workshop. However, we highly recommend including stakeholders at an early stage
in order to raise acceptance of the later outputs.
31 | KfW Development Bank – Materials on Development Financing, No. 6, 2016
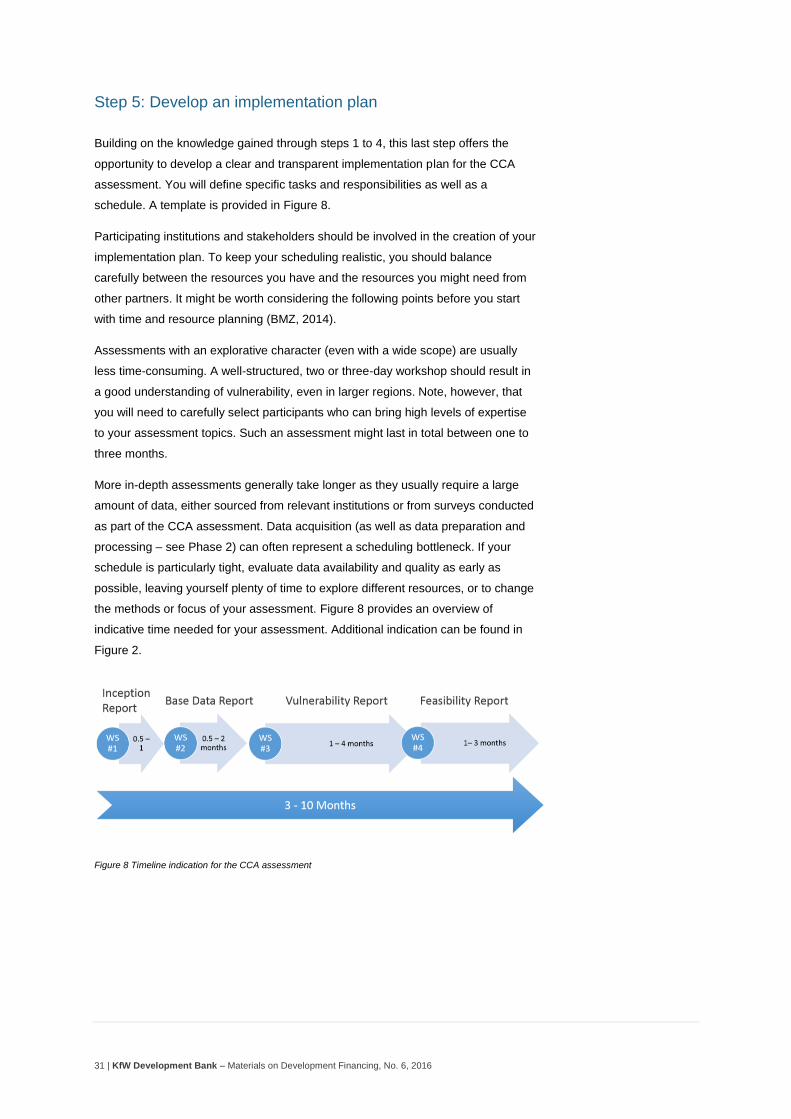
Step 5: Develop an implementation plan
Building on the knowledge gained through steps 1 to 4, this last step offers the
opportunity to develop a clear and transparent implementation plan for the CCA
assessment. You will define specific tasks and responsibilities as well as a
schedule. A template is provided in Figure 8.
Participating institutions and stakeholders should be involved in the creation of your
implementation plan. To keep your scheduling realistic, you should balance
carefully between the resources you have and the resources you might need from
other partners. It might be worth considering the following points before you start
with time and resource planning (BMZ, 2014).
Assessments with an explorative character (even with a wide scope) are usually
less time-consuming. A well-structured, two or three-day workshop should result in
a good understanding of vulnerability, even in larger regions. Note, however, that
you will need to carefully select participants who can bring high levels of expertise
to your assessment topics. Such an assessment might last in total between one to
three months.
More in-depth assessments generally take longer as they usually require a large
amount of data, either sourced from relevant institutions or from surveys conducted
as part of the CCA assessment. Data acquisition (as well as data preparation and
processing – see Phase 2) can often represent a scheduling bottleneck. If your
schedule is particularly tight, evaluate data availability and quality as early as
possible, leaving yourself plenty of time to explore different resources, or to change
the methods or focus of your assessment. Figure 8 provides an overview of
indicative time needed for your assessment. Additional indication can be found in
Figure 2.
Figure 8 Timeline indication for the CCA assessment
32 | KfW Development Bank – Materials on Development Financing, No. 6, 2016
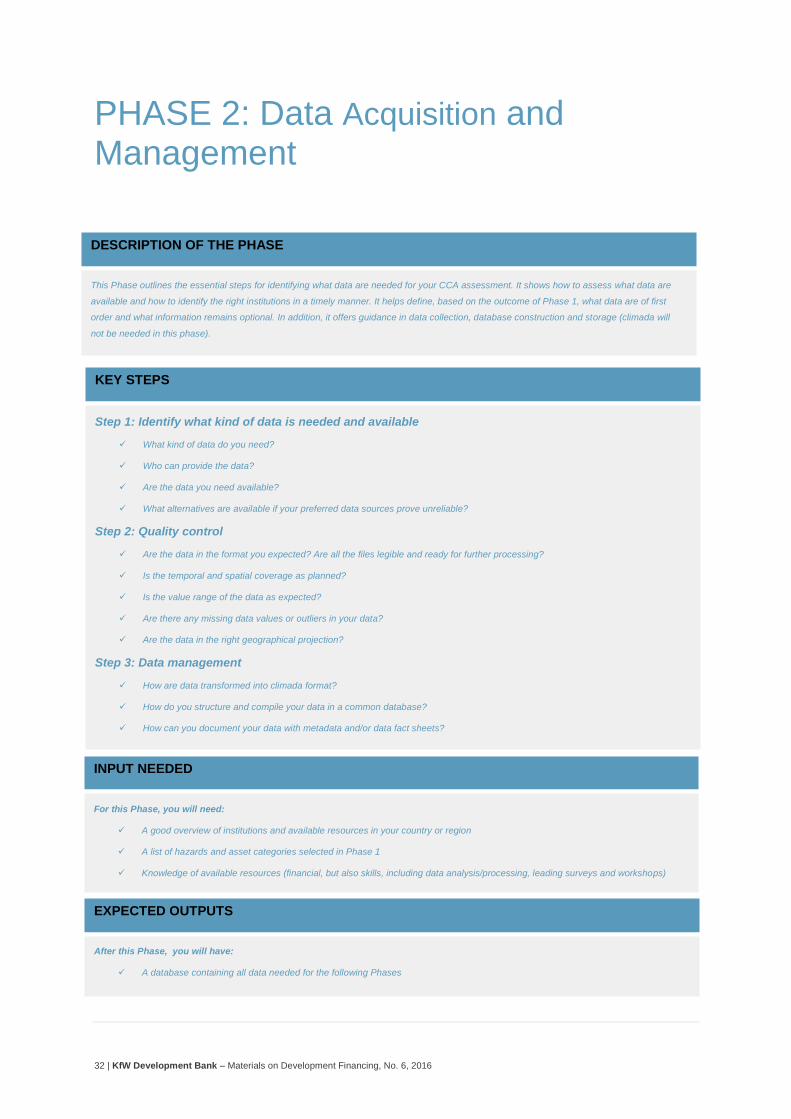
PHASE 2: Data Acquisition and Management
DESCRIPTION OF THE PHASE
This Phase outlines the essential steps for identifying what data are needed for your CCA assessment. It shows how to assess what data are
available and how to identify the right institutions in a timely manner. It helps define, based on the outcome of Phase 1, what data are of first
order and what information remains optional. In addition, it offers guidance in data collection, database construction and storage (climada will
not be needed in this phase).
INPUT NEEDED
For this Phase, you will need:
A good overview of institutions and available resources in your country or region
A list of hazards and asset categories selected in Phase 1
Knowledge of available resources (financial, but also skills, including data analysis/processing, leading surveys and workshops)
KEY STEPS
Step 1: Identify what kind of data is needed and available
What kind of data do you need?
Who can provide the data?
Are the data you need available?
What alternatives are available if your preferred data sources prove unreliable?
Step 2: Quality control
Are the data in the format you expected? Are all the files legible and ready for further processing?
Is the temporal and spatial coverage as planned?
Is the value range of the data as expected?
Are there any missing data values or outliers in your data?
Are the data in the right geographical projection?
Step 3: Data management
How are data transformed into climada format?
How do you structure and compile your data in a common database?
How can you document your data with metadata and/or data fact sheets?
EXPECTED OUTPUTS
After this Phase, you will have:
A database containing all data needed for the following Phases
33 | KfW Development Bank – Materials on Development Financing, No. 6, 2016
Getting Started
Because of the quantitative aspect of the ECA approach, data availability and data
collection play a central role in the setting up of the model. The quality, spatial and
temporal resolution of the data involved strongly influence the outcome of your
assessment. In the same vein, depending on the goal of your analysis, it is
important to determine what type and kind of data is needed to achieve these
objectives.
In this Phase, the different types of data needed for a standard assessment are
explored. Several recommendations will be made in order to prioritise between
different criteria related to data such as temporal and spatial resolution. In addition,
specialised websites shall be highlighted to facilitate access to open source
information (step1) and special attention will be given to quality control (Step 2) and
data management in order to make your data available for other Phases (Step 3).
Step 1: Identify what kind of data is needed
In order to address the different needs of the ECA methodology and the climada
model, different types of data are required. Each dataset is required by the different
components of climada or is used to develop these components. In the following
sections, we present different types of data and relate them to the components of
climada.
When considering different hazard types, it becomes clear why data types need to
be adjusted for risk assessment. Indeed, for different hazard types such as
earthquakes or hurricanes, different (i) spatial, (ii) spectral and (iii) temporal
resolution exist (van Westen et al., 2011):
(i) Spatial resolution. A hazard can be very local and spatially confined
(e.g. landslides), it can be very extensive (e.g. flooding or drought), or
there can be a large distance between the actual source of the hazard
and the area at stake. Examples of that can be the breaking of a dam
that may lead to flooding far downstream. One has to consider the
dimensions of the hazard: a dam or a hill slope is quite small in
extent, while an area possibly exposed to a hurricane or a storm
surge may be vast. The data chosen in the analysis need to reflect
those dimensions and the level of detail needed.
TOOLS AND ADDITIONAL INFORMATION
A checklist with data needed for each Phase (Annex 1)
Template data gathering for asset value (Annex 2)
34 | KfW Development Bank – Materials on Development Financing, No. 6, 2016
(ii) Spectral resolution. Spectral resolution is very effective in
differentiating between different surfaces. For example, a near
infrared band, common to most passive satellite sensors, is well
suited to map vegetation health or water. It is thus suitable, at times in
combination with other spectral bands, to track vegetation health (e.g.
to monitor drought hazard), or to map flood or other surface water. In
situations where there are clouds, smoke, or in night-time conditions
radar products can be used.
(iii) Temporal resolution. Hazard events can be sudden and of short
duration (e.g. landslides), sudden but of long duration (e.g. a dam
break leading to prolonged flooding), but can also show precursory
signs (e.g. hurricanes). Some effects may also be delayed, such as
disease outbreak after a flood or earthquake. This is also a good
example of one hazard type event leading to secondary effects. Other
examples of this phenomenon are slope or dam instability caused by
heavy rain.
Hence, depending on the hazard type, it is important to match the right temporal,
spectral or spatial resolution. However, there is a largely inverse relationship
between coverage and level of detail. Consequently, it is often advised to combine
several data sets to cover resolution requirements. In the next box, a checklist is
provided in order to help in making these decisions.
BOX: HOW TO DECIDE WHICH DATA ARE SUITABLE?
Depending on the specific hazard situation, types of assets at risk, or secondary hazards, it is important to determine the correct data to be gathered. The following checklist is designed to help practitioners in taking decisions in a timely manner:
1) Identify data types needed (e.g. thematic layers, images, maps)
Understanding the risk component and the assets at risks is a prerequisite to understanding what data might be needed.
2) Timeframe and coverage
The period for which the data is required is of high importance, for instance in order to create hazard frequency, or build scenario for a given area. In the same vein, one should consider the coverage need for the analysis. The coverage is intimately interlinked with resolution and the research area.
3) Cost
Cost of data is an important factor for decision making. Some data, especially secondary data (or data with added value) could be quite expensive. However, a list of data available free of charge can be found in the ECA Guidebook in Phase 7.
4) Availability
It is import to ensure that data needed are also available for the timeframe of the study. In case data are not available, the practitioner should reconsider the area of research or even the hazard or the asset included in the study.
5) Resolution
Resolution for data required in the analysis is a key parameter. As a general rule, the highest possible resolution for data is recommended. However, depending on the goal of the study, a lower resolution should be sufficient. It is also important to consider that higher resolution data will increase the overall duration of the analysis.
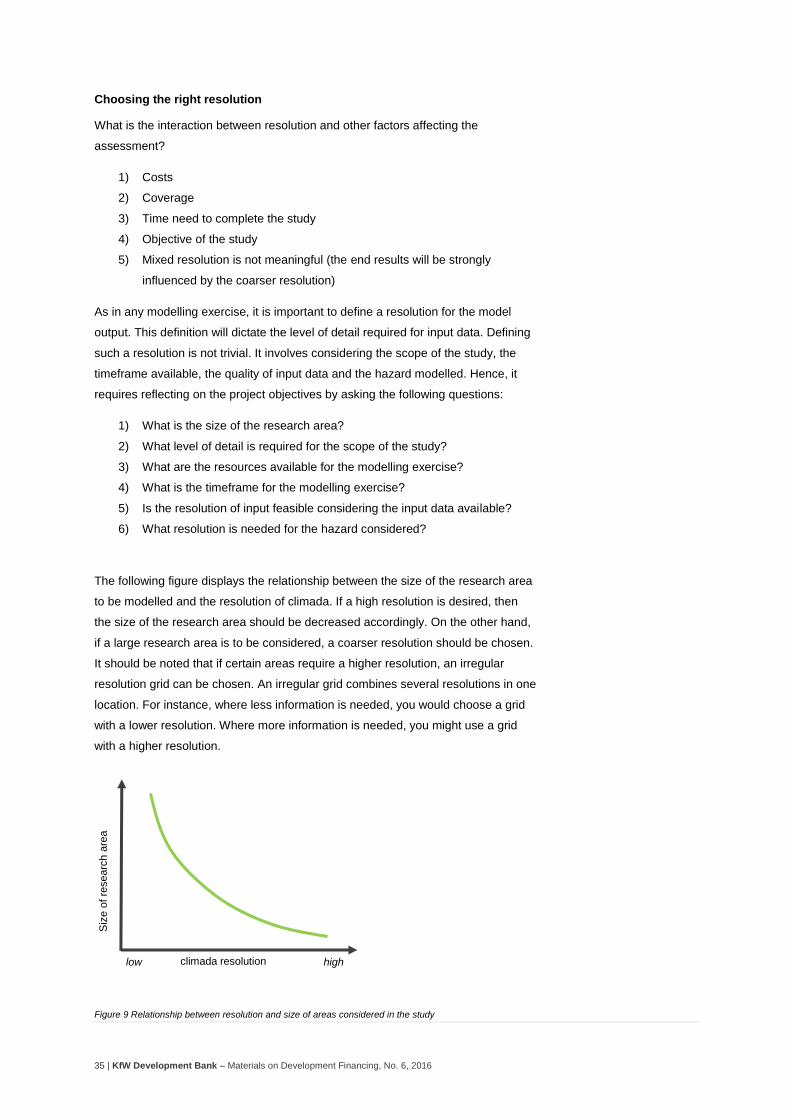
35 | KfW Development Bank – Materials on Development Financing, No. 6, 2016
Choosing the right resolution
What is the interaction between resolution and other factors affecting the
assessment?
1) Costs
2) Coverage
3) Time need to complete the study
4) Objective of the study
5) Mixed resolution is not meaningful (the end results will be strongly
influenced by the coarser resolution)
As in any modelling exercise, it is important to define a resolution for the model
output. This definition will dictate the level of detail required for input data. Defining
such a resolution is not trivial. It involves considering the scope of the study, the
timeframe available, the quality of input data and the hazard modelled. Hence, it
requires reflecting on the project objectives by asking the following questions:
1) What is the size of the research area?
2) What level of detail is required for the scope of the study?
3) What are the resources available for the modelling exercise?
4) What is the timeframe for the modelling exercise?
5) Is the resolution of input feasible considering the input data available?
6) What resolution is needed for the hazard considered?
The following figure displays the relationship between the size of the research area
to be modelled and the resolution of climada. If a high resolution is desired, then
the size of the research area should be decreased accordingly. On the other hand,
if a large research area is to be considered, a coarser resolution should be chosen.
It should be noted that if certain areas require a higher resolution, an irregular
resolution grid can be chosen. An irregular grid combines several resolutions in one
location. For instance, where less information is needed, you would choose a grid
with a lower resolution. Where more information is needed, you might use a grid
with a higher resolution.
Figure 9 Relationship between resolution and size of areas considered in the study
Siz
e o
f re
searc
h a
rea
climada resolution high low
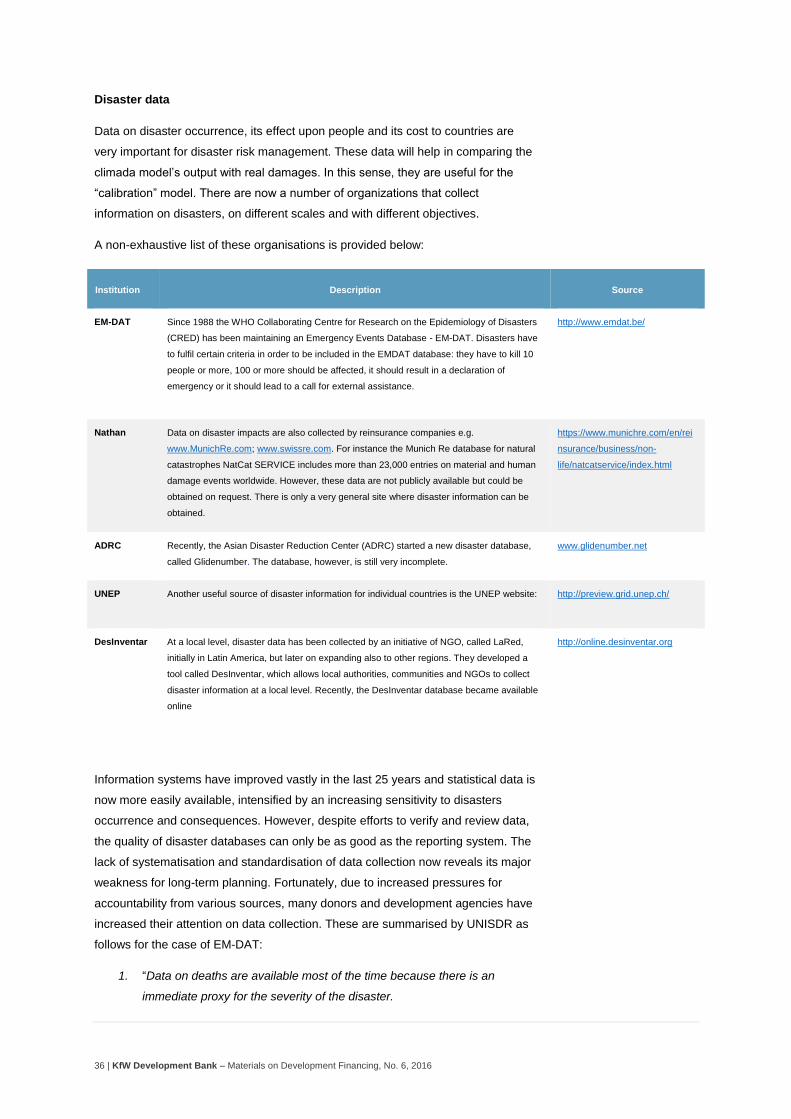
36 | KfW Development Bank – Materials on Development Financing, No. 6, 2016
Disaster data
Data on disaster occurrence, its effect upon people and its cost to countries are
very important for disaster risk management. These data will help in comparing the
climada model’s output with real damages. In this sense, they are useful for the
“calibration” model. There are now a number of organizations that collect
information on disasters, on different scales and with different objectives.
A non-exhaustive list of these organisations is provided below:
Institution Description Source
EM-DAT
Since 1988 the WHO Collaborating Centre for Research on the Epidemiology of Disasters
(CRED) has been maintaining an Emergency Events Database - EM-DAT. Disasters have
to fulfil certain criteria in order to be included in the EMDAT database: they have to kill 10
people or more, 100 or more should be affected, it should result in a declaration of
emergency or it should lead to a call for external assistance.
http://www.emdat.be/
Nathan
Data on disaster impacts are also collected by reinsurance companies e.g.
www.MunichRe.com; www.swissre.com. For instance the Munich Re database for natural
catastrophes NatCat SERVICE includes more than 23,000 entries on material and human
damage events worldwide. However, these data are not publicly available but could be
obtained on request. There is only a very general site where disaster information can be
obtained.
https://www.munichre.com/en/rei
nsurance/business/non-
life/natcatservice/index.html
ADRC
Recently, the Asian Disaster Reduction Center (ADRC) started a new disaster database,
called Glidenumber. The database, however, is still very incomplete.
www.glidenumber.net
UNEP
Another useful source of disaster information for individual countries is the UNEP website: http://preview.grid.unep.ch/
DesInventar
At a local level, disaster data has been collected by an initiative of NGO, called LaRed,
initially in Latin America, but later on expanding also to other regions. They developed a
tool called DesInventar, which allows local authorities, communities and NGOs to collect
disaster information at a local level. Recently, the DesInventar database became available
online
http://online.desinventar.org
Information systems have improved vastly in the last 25 years and statistical data is
now more easily available, intensified by an increasing sensitivity to disasters
occurrence and consequences. However, despite efforts to verify and review data,
the quality of disaster databases can only be as good as the reporting system. The
lack of systematisation and standardisation of data collection now reveals its major
weakness for long-term planning. Fortunately, due to increased pressures for
accountability from various sources, many donors and development agencies have
increased their attention on data collection. These are summarised by UNISDR as
follows for the case of EM-DAT:
1. “Data on deaths are available most of the time because there is an
immediate proxy for the severity of the disaster.
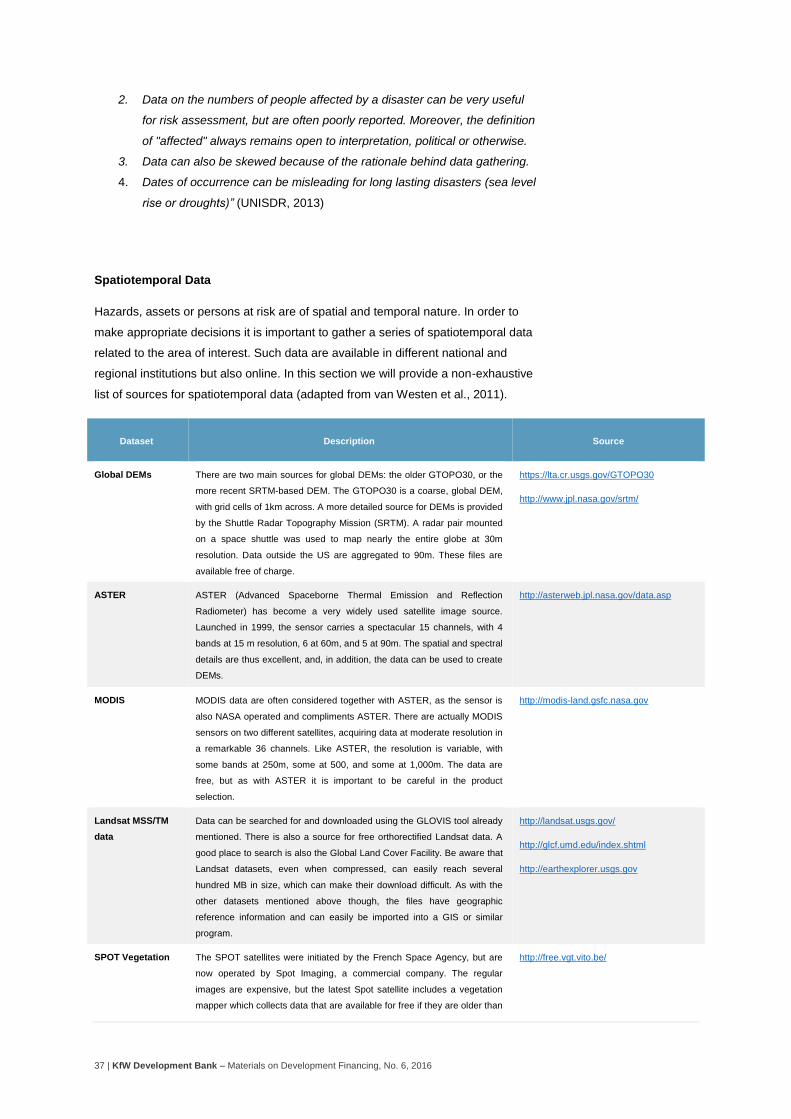
37 | KfW Development Bank – Materials on Development Financing, No. 6, 2016
2. Data on the numbers of people affected by a disaster can be very useful
for risk assessment, but are often poorly reported. Moreover, the definition
of "affected" always remains open to interpretation, political or otherwise.
3. Data can also be skewed because of the rationale behind data gathering.
4. Dates of occurrence can be misleading for long lasting disasters (sea level
rise or droughts)” (UNISDR, 2013)
Spatiotemporal Data
Hazards, assets or persons at risk are of spatial and temporal nature. In order to
make appropriate decisions it is important to gather a series of spatiotemporal data
related to the area of interest. Such data are available in different national and
regional institutions but also online. In this section we will provide a non-exhaustive
list of sources for spatiotemporal data (adapted from van Westen et al., 2011).
Dataset Description Source
Global DEMs
There are two main sources for global DEMs: the older GTOPO30, or the
more recent SRTM-based DEM. The GTOPO30 is a coarse, global DEM,
with grid cells of 1km across. A more detailed source for DEMs is provided
by the Shuttle Radar Topography Mission (SRTM). A radar pair mounted
on a space shuttle was used to map nearly the entire globe at 30m
resolution. Data outside the US are aggregated to 90m. These files are
available free of charge.
https://lta.cr.usgs.gov/GTOPO30
http://www.jpl.nasa.gov/srtm/
ASTER
ASTER (Advanced Spaceborne Thermal Emission and Reflection
Radiometer) has become a very widely used satellite image source.
Launched in 1999, the sensor carries a spectacular 15 channels, with 4
bands at 15 m resolution, 6 at 60m, and 5 at 90m. The spatial and spectral
details are thus excellent, and, in addition, the data can be used to create
DEMs.
http://asterweb.jpl.nasa.gov/data.asp
MODIS
MODIS data are often considered together with ASTER, as the sensor is
also NASA operated and compliments ASTER. There are actually MODIS
sensors on two different satellites, acquiring data at moderate resolution in
a remarkable 36 channels. Like ASTER, the resolution is variable, with
some bands at 250m, some at 500, and some at 1,000m. The data are
free, but as with ASTER it is important to be careful in the product
selection.
http://modis-land.gsfc.nasa.gov
Landsat MSS/TM
data
Data can be searched for and downloaded using the GLOVIS tool already
mentioned. There is also a source for free orthorectified Landsat data. A
good place to search is also the Global Land Cover Facility. Be aware that
Landsat datasets, even when compressed, can easily reach several
hundred MB in size, which can make their download difficult. As with the
other datasets mentioned above though, the files have geographic
reference information and can easily be imported into a GIS or similar
program.
http://landsat.usgs.gov/
http://glcf.umd.edu/index.shtml
http://earthexplorer.usgs.gov
SPOT Vegetation
The SPOT satellites were initiated by the French Space Agency, but are
now operated by Spot Imaging, a commercial company. The regular
images are expensive, but the latest Spot satellite includes a vegetation
mapper which collects data that are available for free if they are older than
http://free.vgt.vito.be/
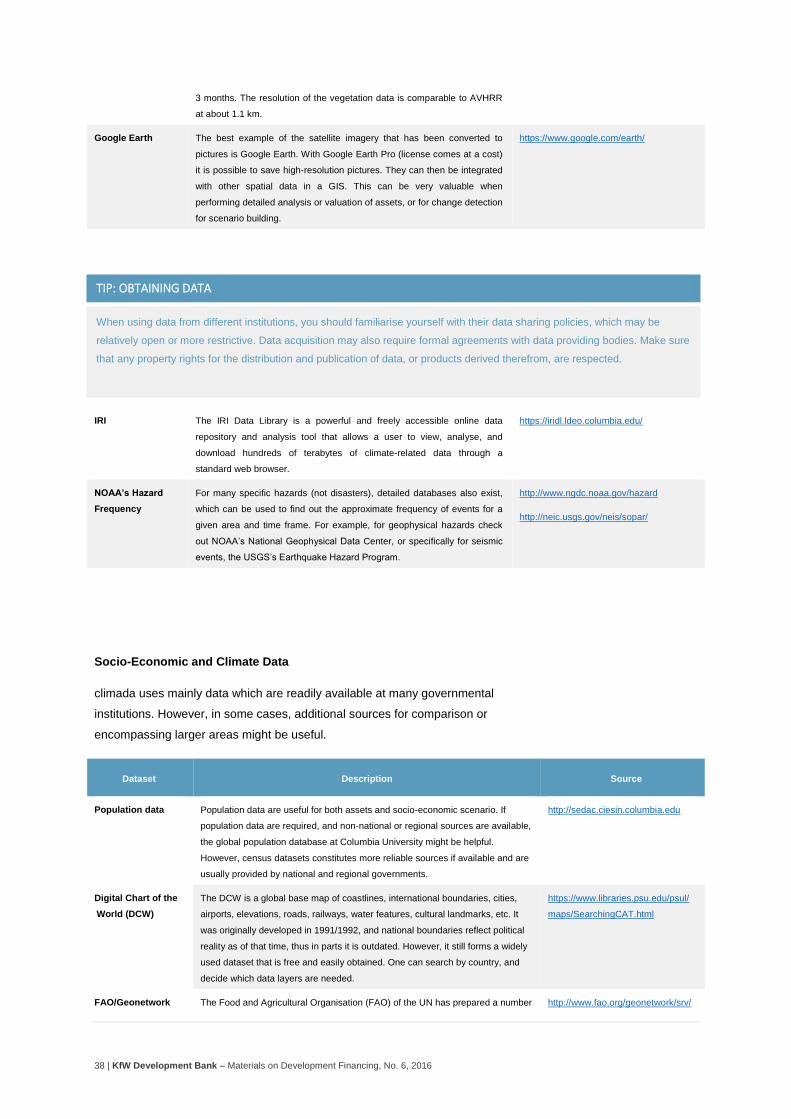
38 | KfW Development Bank – Materials on Development Financing, No. 6, 2016
3 months. The resolution of the vegetation data is comparable to AVHRR
at about 1.1 km.
Google Earth
The best example of the satellite imagery that has been converted to
pictures is Google Earth. With Google Earth Pro (license comes at a cost)
it is possible to save high-resolution pictures. They can then be integrated
with other spatial data in a GIS. This can be very valuable when
performing detailed analysis or valuation of assets, or for change detection
for scenario building.
https://www.google.com/earth/
IRI
The IRI Data Library is a powerful and freely accessible online data
repository and analysis tool that allows a user to view, analyse, and
download hundreds of terabytes of climate-related data through a
standard web browser.
https://iridl.ldeo.columbia.edu/
NOAA’s Hazard
Frequency
For many specific hazards (not disasters), detailed databases also exist,
which can be used to find out the approximate frequency of events for a
given area and time frame. For example, for geophysical hazards check
out NOAA’s National Geophysical Data Center, or specifically for seismic
events, the USGS’s Earthquake Hazard Program.
http://www.ngdc.noaa.gov/hazard
http://neic.usgs.gov/neis/sopar/
Socio-Economic and Climate Data
climada uses mainly data which are readily available at many governmental
institutions. However, in some cases, additional sources for comparison or
encompassing larger areas might be useful.
Dataset Description Source
Population data
Population data are useful for both assets and socio-economic scenario. If
population data are required, and non-national or regional sources are available,
the global population database at Columbia University might be helpful.
However, census datasets constitutes more reliable sources if available and are
usually provided by national and regional governments.
http://sedac.ciesin.columbia.edu
Digital Chart of the
World (DCW)
The DCW is a global base map of coastlines, international boundaries, cities,
airports, elevations, roads, railways, water features, cultural landmarks, etc. It
was originally developed in 1991/1992, and national boundaries reflect political
reality as of that time, thus in parts it is outdated. However, it still forms a widely
used dataset that is free and easily obtained. One can search by country, and
decide which data layers are needed.
https://www.libraries.psu.edu/psul/
maps/SearchingCAT.html
FAO/Geonetwork The Food and Agricultural Organisation (FAO) of the UN has prepared a number http://www.fao.org/geonetwork/srv/
TIP: OBTAINING DATA
When using data from different institutions, you should familiarise yourself with their data sharing policies, which may be
relatively open or more restrictive. Data acquisition may also require formal agreements with data providing bodies. Make sure
that any property rights for the distribution and publication of data, or products derived therefrom, are respected.
39 | KfW Development Bank – Materials on Development Financing, No. 6, 2016
of useful geotools, including the Geonetwork. Here you can search globally or by
region, use existing maps or customised ones. The available data comprise
base layers (e.g. boundaries, roads, rivers), thematic layers (e.g. protected
areas), or a backdrop image (e.g. World Forest 2000).
en/main.home
Climate Change
Data
This portal is intended to serve a community of GIS users interested in climate
change. The free datasets of climate change projections can be downloaded as
a shapefile, a text file, or as an image. Many 2D variables from modelled
projected climate are available for the atmosphere and land surface. These
climate change projections were generated by the NCAR Community Climate
System Model for the 4th Assessment Report (AR4) and for the 5th Assessment
Report (AR5) of the Intergovernmental Panel on Climate Change (IPCC).
https://gisclimatechange.ucar.edu/
Step 2: Quality control
Data are vital to any CCA assessment and the quality of the results depends to a
great extent on the quality of the data (or conversely, ‘garbage in, garbage out’).
Once you have gathered your data you will need to conduct a quality check. Ideally,
you keep the quality criteria below already in mind while collecting data. In practice,
however, you may first gather the data and then choose the most appropriate data
set. For that purpose, use these questions as a guide:
Are the data in an appropriate format?
Is the temporal or spatial coverage adequate for your purpose?
Do you have missing values or outliers in your data?
Are the data in the correct geographical projection?
If your datasets fail this quality check – and you are unable to apply any of the
remedies described above – you will need to consider another approach. This may
be an alternative data source, a proxy, or an alternative indicator (e.g. distance to
school instead of census data on education levels) or alternative means of data
acquisition such as expert input. As a last resort you may need to modify your
scope or the set of hazards selected. The following Phases are closely linked to
Phase 2 and depend heavily on the quality and availability of the data.
Step 3: Data management
Once datasets are collected (Step 1) and checked for quality (Step 2) they should
be stored in a common database to avoid the risk of redundancy and data loss.
This might range from a simple data collection in a structured set of folders to more
complex databases (e.g. Excel spread sheets, geo-databases, Access databases,
distributed web-based databases). You may need to transform different types of
data into a common data format (see climada manual). If you are working with
multiple partners and stakeholders, you should ensure that they can all access the
different datasets required for further analysis. Depending on the scope of your

40 | KfW Development Bank – Materials on Development Financing, No. 6, 2016
assessment you may also need to assign responsibilities for database
management and maintenance.
We recommend also the use of metadata as it is an important element in data
management. Metadata are, simply, data about data, functioning much like a
catalogue which provides data on the books in a library. It describes the content
and characteristics of the different datasets and instructions for interpreting values.
This includes where and when the data were obtained and analysed, the institution
responsible for it and instructions for searching and other functions. Although this is
a time-consuming exercise, experience has shown the importance of documenting
data, particularly when qualitative or quantitative questions regarding your data
arise. Documenting and organising your data properly might save time at a later
stage of the project or for further iterations.
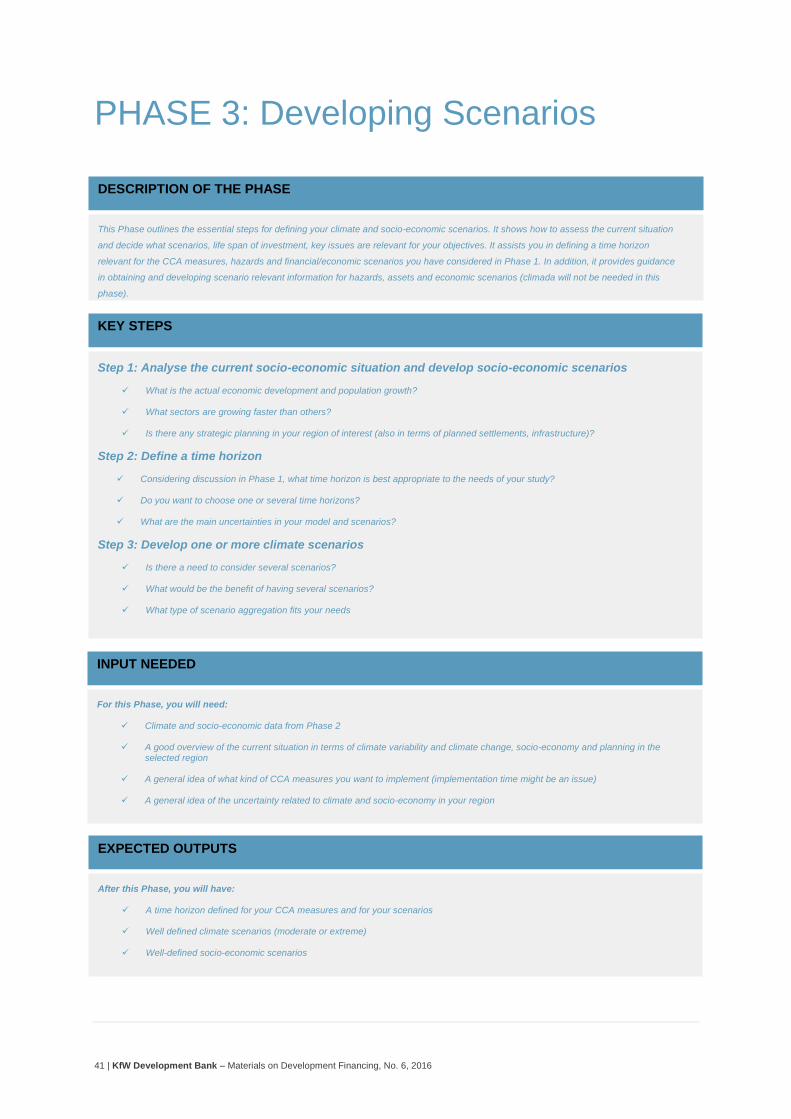
41 | KfW Development Bank – Materials on Development Financing, No. 6, 2016
PHASE 3: Developing Scenarios
DESCRIPTION OF THE PHASE
This Phase outlines the essential steps for defining your climate and socio-economic scenarios. It shows how to assess the current situation
and decide what scenarios, life span of investment, key issues are relevant for your objectives. It assists you in defining a time horizon
relevant for the CCA measures, hazards and financial/economic scenarios you have considered in Phase 1. In addition, it provides guidance
in obtaining and developing scenario relevant information for hazards, assets and economic scenarios (climada will not be needed in this
phase).
KEY STEPS
Step 1: Analyse the current socio-economic situation and develop socio-economic scenarios
What is the actual economic development and population growth?
What sectors are growing faster than others?
Is there any strategic planning in your region of interest (also in terms of planned settlements, infrastructure)?
Step 2: Define a time horizon
Considering discussion in Phase 1, what time horizon is best appropriate to the needs of your study?
Do you want to choose one or several time horizons?
What are the main uncertainties in your model and scenarios?
Step 3: Develop one or more climate scenarios
Is there a need to consider several scenarios?
What would be the benefit of having several scenarios?
What type of scenario aggregation fits your needs
INPUT NEEDED
For this Phase, you will need:
Climate and socio-economic data from Phase 2
A good overview of the current situation in terms of climate variability and climate change, socio-economy and planning in the selected region
A general idea of what kind of CCA measures you want to implement (implementation time might be an issue)
A general idea of the uncertainty related to climate and socio-economy in your region
EXPECTED OUTPUTS
After this Phase, you will have:
A time horizon defined for your CCA measures and for your scenarios
Well defined climate scenarios (moderate or extreme)
Well-defined socio-economic scenarios
42 | KfW Development Bank – Materials on Development Financing, No. 6, 2016
Getting Started
Scenarios are consistent stories describing possible futures. For your assessment,
scenarios can be relevant for evaluating impacts of climate variability and climate
change in your region and the consequences for potential CCA measures
regarding adaptation. The main idea is to develop realistic alternative development
paths for your region and see how population and assets at risks are affected by
climate risks.
This Phase summarises the design and development of baseline socio-economic
and climate scenarios for use in your assessment. Although scenario development
can be very time-consuming, it should not divert you from the main objective of
your assessment. The point of the exercise is to help understand how future
development paths can affect vulnerability to climate change. Several steps are
necessary to develop scenarios. In a first step, an analysis of the current situation
will provide you with a good overview of existing drivers. In a second step, you will
decide which time horizon(s) are most appropriate to your study. Although it is a
small step, it is very important for the rest for your assessment. In Step 3, you will
develop your climate scenarios and aggregate them into climada.
Step 1: Analyse the current situation and develop scenarios
In examining vulnerability and adaptation to climate variability and climate change,
it is important that the climate be projected to change over many decades. During
this time, it is reasonable to expect that socio-economic and natural conditions will
change, in some cases quite dramatically. As a result of these changes,
vulnerability to climate variability and climate change and effectiveness of
adaptations could also change.
In Phase 1 and Phase 2, data and discussion have been made about key drivers
relevant for the future magnitude and character of climate impacts in your region.
These key drivers have been prioritised with stakeholders for example during
different workshops.
Example of key drivers could be:
i) economic development and diversification
ii) the expected magnitude of climate variability and climate change
iii) population growth
iv) cultural and religious driver
v) technological driver
TOOLS AND ADDITIONAL INFORMATION
Criteria for time horizon selection
43 | KfW Development Bank – Materials on Development Financing, No. 6, 2016
You should make sure that your approach is consistent with existing development
plans in your study area. Economic growth is often linked to core determinants as
education and population growth. You can develop as many scenarios as you see
fit, however, considering that climate scenarios will add up, we recommend
restricting the number of socioeconomic scenario to a maximum of four (4). It is
important to note that your scenarios will influence the overall asset value (and your
future population).
Guiding Questions
Below, we suggest a series of guiding questions in order to better formulate your
socio-economic scenarios:
What is the actual economic growth?
What are the projections from different institutions for my country/regions?
Is there any existing report or development plan available?
What are the key drivers in my regions?
How many scenarios are sufficient to cover different (uncertain) future?
What are the main uncertainties linked with these scenarios/drivers?
What is the actual and expected discount rate?
It is also important to note that the discount rate is rather not a very sensitive
parameter in climada. It means that introducing different discount rates will not
significantly influence the outcome of your assessment and CCA measures will still
have the same ranking and effect.
Step 2: Define a time horizon
A time horizon generally represents the time when you want the projection to end.
Typically, one also speaks of short-term, long-term or middle-term scenarios.
Choosing the right time horizon is very important, as it will help you in projecting the
cost and benefits of the CCA measures you will select into the future. A time
horizon too far into the future might be perceived as unrealistic, whereas a time
horizon too close might diminish the positive effect of some CCA measures
(especially green CCA measures). Hence, an appropriate time horizon over which
climate change impacts are assessed should be established. This should match the
intended lifespan of the assets, systems or institutions being financed under the
project. In some cases, it may be appropriate to use observed data plus more than
one time horizon to understand shorter-term and longer-term climate change
implications, bearing in mind that the longer the time-span, the greater the
uncertainty. This should consider planning, construction, financing, operational and
design life cycles as well as decommissioning and/or removal or replacement. In
order to assess the climate change signal above observed climatic variability, the
characteristics of future climate should be assessed over a period of at least 20 to
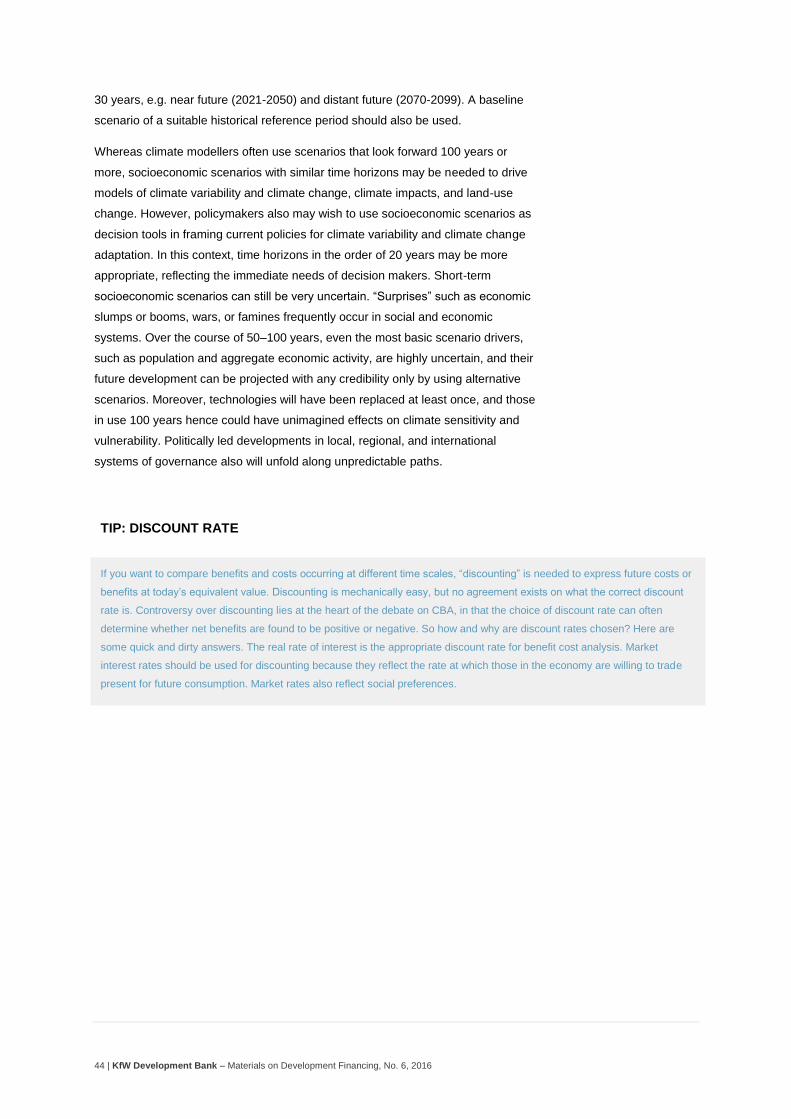
44 | KfW Development Bank – Materials on Development Financing, No. 6, 2016
30 years, e.g. near future (2021-2050) and distant future (2070-2099). A baseline
scenario of a suitable historical reference period should also be used.
Whereas climate modellers often use scenarios that look forward 100 years or
more, socioeconomic scenarios with similar time horizons may be needed to drive
models of climate variability and climate change, climate impacts, and land-use
change. However, policymakers also may wish to use socioeconomic scenarios as
decision tools in framing current policies for climate variability and climate change
adaptation. In this context, time horizons in the order of 20 years may be more
appropriate, reflecting the immediate needs of decision makers. Short-term
socioeconomic scenarios can still be very uncertain. “Surprises” such as economic
slumps or booms, wars, or famines frequently occur in social and economic
systems. Over the course of 50–100 years, even the most basic scenario drivers,
such as population and aggregate economic activity, are highly uncertain, and their
future development can be projected with any credibility only by using alternative
scenarios. Moreover, technologies will have been replaced at least once, and those
in use 100 years hence could have unimagined effects on climate sensitivity and
vulnerability. Politically led developments in local, regional, and international
systems of governance also will unfold along unpredictable paths.
TIP: DISCOUNT RATE
If you want to compare benefits and costs occurring at different time scales, “discounting” is needed to express future costs or
benefits at today’s equivalent value. Discounting is mechanically easy, but no agreement exists on what the correct discount
rate is. Controversy over discounting lies at the heart of the debate on CBA, in that the choice of discount rate can often
determine whether net benefits are found to be positive or negative. So how and why are discount rates chosen? Here are
some quick and dirty answers. The real rate of interest is the appropriate discount rate for benefit cost analysis. Market
interest rates should be used for discounting because they reflect the rate at which those in the economy are willing to trade
present for future consumption. Market rates also reflect social preferences.
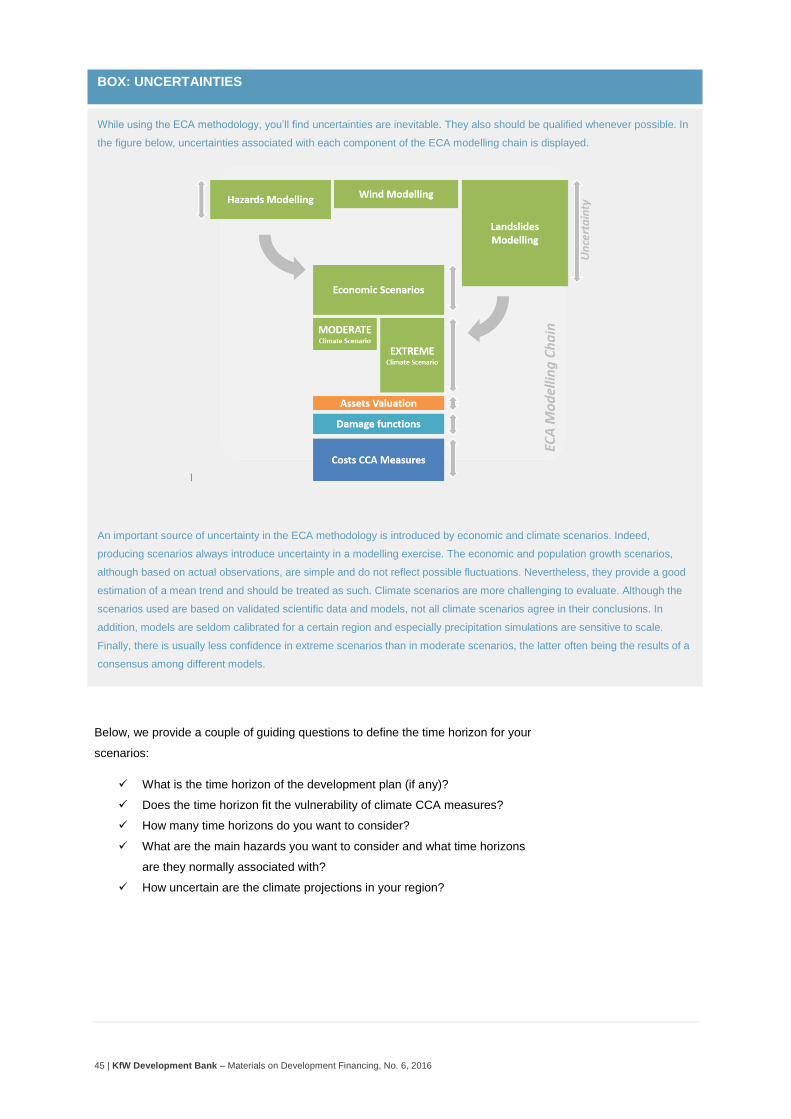
45 | KfW Development Bank – Materials on Development Financing, No. 6, 2016
Below, we provide a couple of guiding questions to define the time horizon for your
scenarios:
What is the time horizon of the development plan (if any)?
Does the time horizon fit the vulnerability of climate CCA measures?
How many time horizons do you want to consider?
What are the main hazards you want to consider and what time horizons
are they normally associated with?
How uncertain are the climate projections in your region?
BOX: UNCERTAINTIES
While using the ECA methodology, you’ll find uncertainties are inevitable. They also should be qualified whenever possible. In
the figure below, uncertainties associated with each component of the ECA modelling chain is displayed.
l
An important source of uncertainty in the ECA methodology is introduced by economic and climate scenarios. Indeed,
producing scenarios always introduce uncertainty in a modelling exercise. The economic and population growth scenarios,
although based on actual observations, are simple and do not reflect possible fluctuations. Nevertheless, they provide a good
estimation of a mean trend and should be treated as such. Climate scenarios are more challenging to evaluate. Although the
scenarios used are based on validated scientific data and models, not all climate scenarios agree in their conclusions. In
addition, models are seldom calibrated for a certain region and especially precipitation simulations are sensitive to scale.
Finally, there is usually less confidence in extreme scenarios than in moderate scenarios, the latter often being the results of a
consensus among different models.
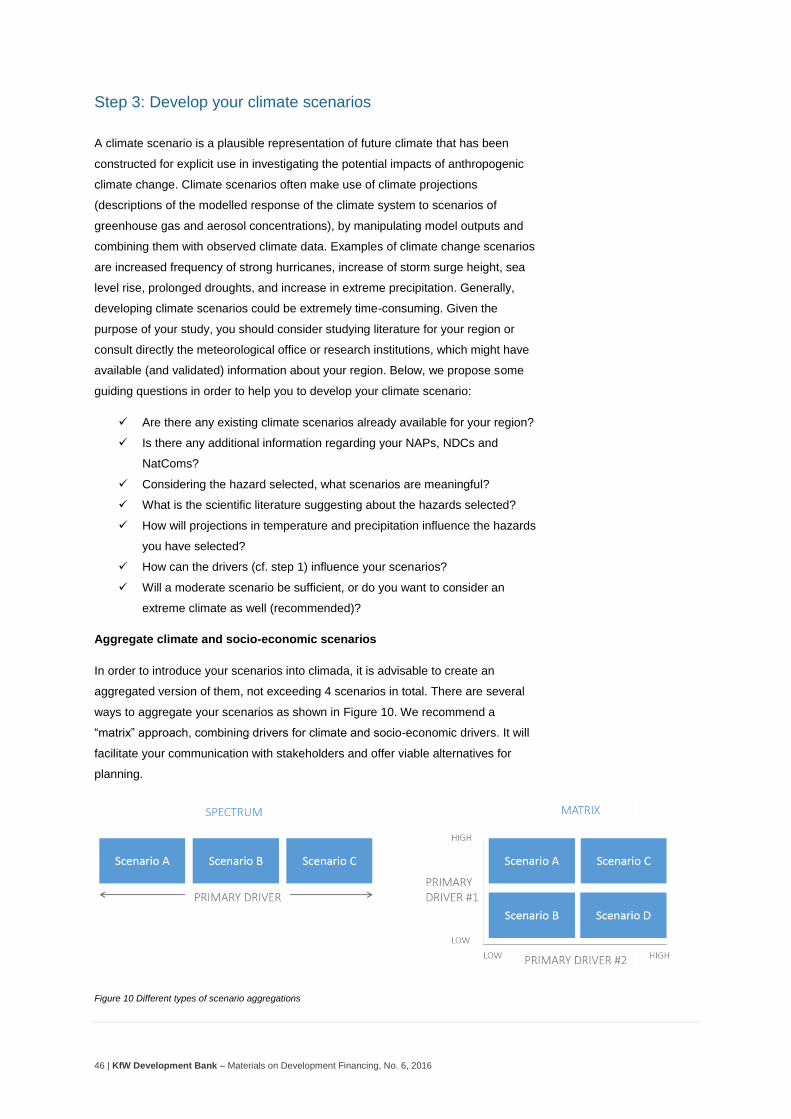
46 | KfW Development Bank – Materials on Development Financing, No. 6, 2016
Step 3: Develop your climate scenarios
A climate scenario is a plausible representation of future climate that has been
constructed for explicit use in investigating the potential impacts of anthropogenic
climate change. Climate scenarios often make use of climate projections
(descriptions of the modelled response of the climate system to scenarios of
greenhouse gas and aerosol concentrations), by manipulating model outputs and
combining them with observed climate data. Examples of climate change scenarios
are increased frequency of strong hurricanes, increase of storm surge height, sea
level rise, prolonged droughts, and increase in extreme precipitation. Generally,
developing climate scenarios could be extremely time-consuming. Given the
purpose of your study, you should consider studying literature for your region or
consult directly the meteorological office or research institutions, which might have
available (and validated) information about your region. Below, we propose some
guiding questions in order to help you to develop your climate scenario:
Are there any existing climate scenarios already available for your region?
Is there any additional information regarding your NAPs, NDCs and
NatComs?
Considering the hazard selected, what scenarios are meaningful?
What is the scientific literature suggesting about the hazards selected?
How will projections in temperature and precipitation influence the hazards
you have selected?
How can the drivers (cf. step 1) influence your scenarios?
Will a moderate scenario be sufficient, or do you want to consider an
extreme climate as well (recommended)?
Aggregate climate and socio-economic scenarios
In order to introduce your scenarios into climada, it is advisable to create an
aggregated version of them, not exceeding 4 scenarios in total. There are several
ways to aggregate your scenarios as shown in Figure 10. We recommend a
“matrix” approach, combining drivers for climate and socio-economic drivers. It will
facilitate your communication with stakeholders and offer viable alternatives for
planning.
Figure 10 Different types of scenario aggregations
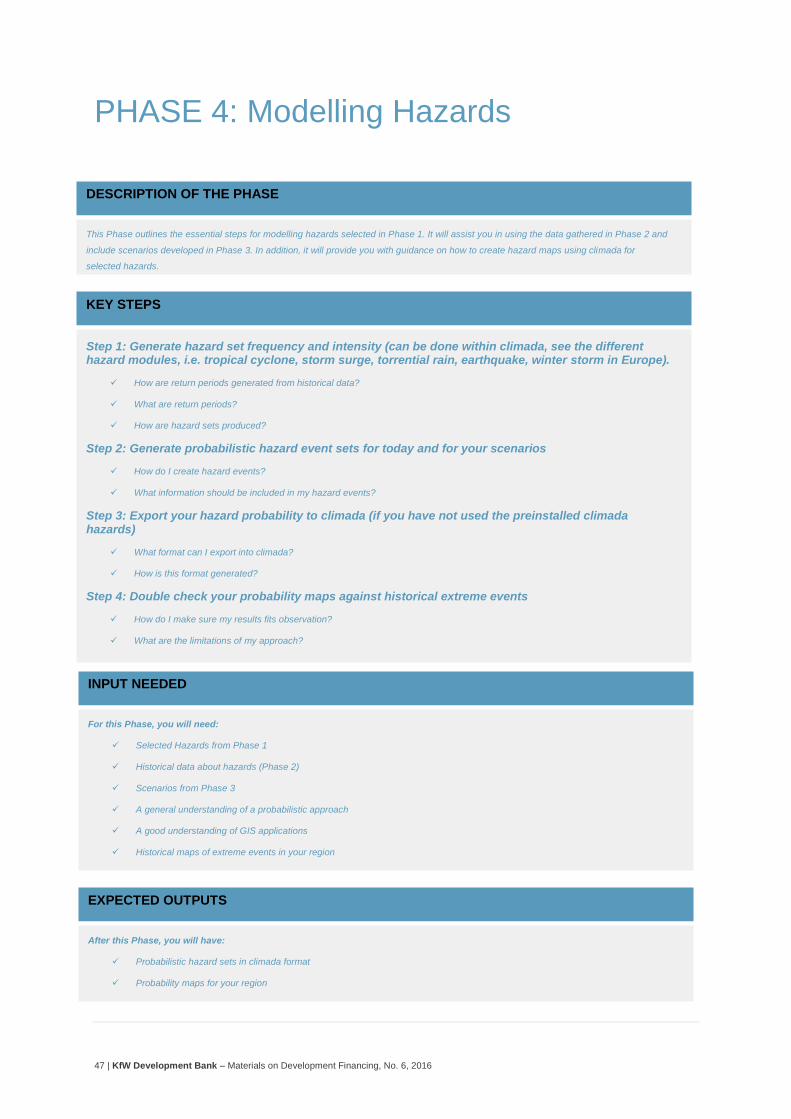
47 | KfW Development Bank – Materials on Development Financing, No. 6, 2016
PHASE 4: Modelling Hazards
DESCRIPTION OF THE PHASE
This Phase outlines the essential steps for modelling hazards selected in Phase 1. It will assist you in using the data gathered in Phase 2 and
include scenarios developed in Phase 3. In addition, it will provide you with guidance on how to create hazard maps using climada for
selected hazards.
KEY STEPS
Step 1: Generate hazard set frequency and intensity (can be done within climada, see the different hazard modules, i.e. tropical cyclone, storm surge, torrential rain, earthquake, winter storm in Europe).
How are return periods generated from historical data?
What are return periods?
How are hazard sets produced?
Step 2: Generate probabilistic hazard event sets for today and for your scenarios
How do I create hazard events?
What information should be included in my hazard events?
Step 3: Export your hazard probability to climada (if you have not used the preinstalled climada hazards)
What format can I export into climada?
How is this format generated?
Step 4: Double check your probability maps against historical extreme events
How do I make sure my results fits observation?
What are the limitations of my approach?
EXPECTED OUTPUTS
After this Phase, you will have:
Probabilistic hazard sets in climada format
Probability maps for your region
INPUT NEEDED
For this Phase, you will need:
Selected Hazards from Phase 1
Historical data about hazards (Phase 2)
Scenarios from Phase 3
A general understanding of a probabilistic approach
A good understanding of GIS applications
Historical maps of extreme events in your region
48 | KfW Development Bank – Materials on Development Financing, No. 6, 2016
Getting started
climada offers for some hazards an embedded approach to hazard modelling. In
this Phase, in order not to duplicate the climada manual, we will focus on how to
introduce hazards which are not included in climada. In principle, these steps follow
the concept offered with climada and will allow you full flexibility in modelling your
hazard “ex-situ”. You will learn how to generate probabilistic events from historical
values from historic data sets (step 1). Then we will show examples of hazard
probability maps and see how to generate them for current and future scenarios
(step 2). In step 3, we will review how to export these maps to climada, and how to
validate them against historical events (step 4).
Step 1: Generate hazard set frequency and intensity
Step 1 sets the basis of the overall hazard approach. Basically, it consists in
transforming historical observations you have gathered in Phase 2, such as rainfall
records, or water level records into statistical events. Rainfall and water level data
should be of high quality with few data gaps. In case no water level data are
available, they could be simulated using inundation models or extrapolated using
standard procedures and correlation between rainfall intensity and flood intensity.
It is important to adapt your approach to the data available in your region. And you
should make sure to choose the best data available for your assessment. In the
BOX below, we showcase an example of how to create hazard maps from
secondary data provided by the government in San Salvador.
Creating return periods
The damage frequency curve (DFC) is an annual per-occurrence damage
exceedance frequency curve, showing the return period of a certain damage level
to be reached or exceeded for a given return period. A DFC is constructed by
sorting a per-occurrence damage event set by descending damage amount and
assigning the corresponding return periods, as given by the temporal extent of the
damage event set. If the damage event set spans say 100 years and contains for
TOOLS AND ADDITIONAL INFORMATION
climada hazard module (cf. climada manual)
GIS application for manipulation of hazard sets (optional)
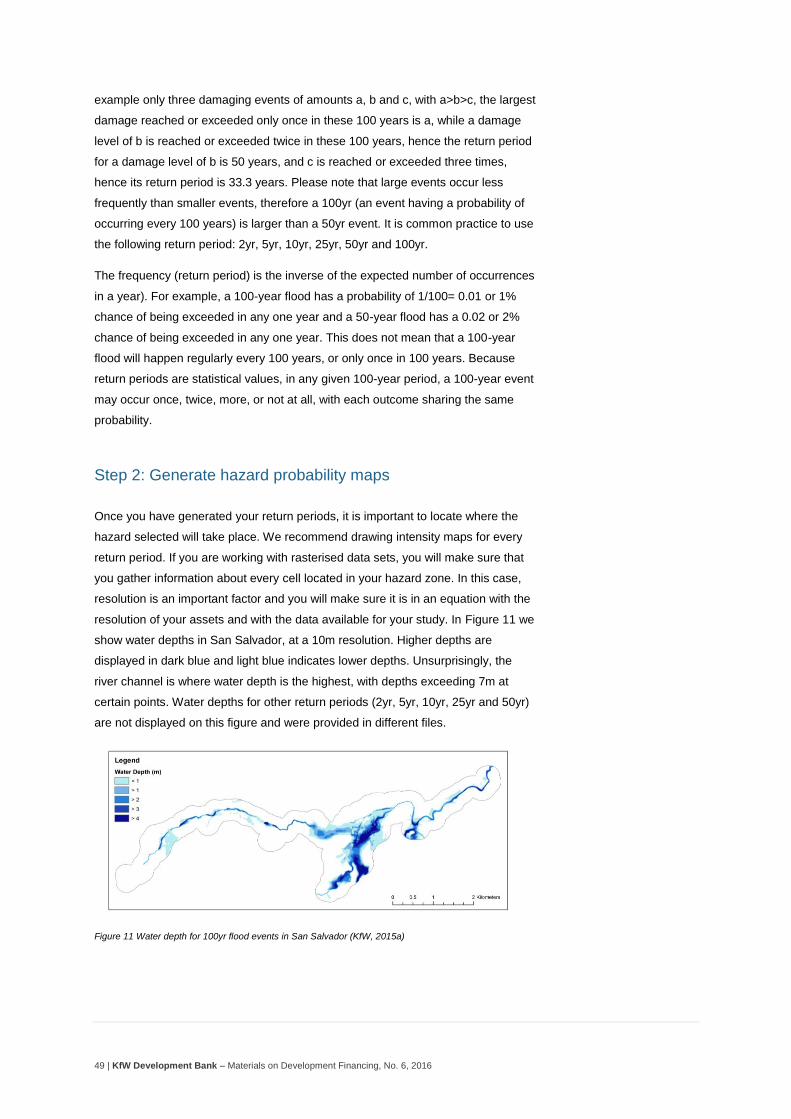
49 | KfW Development Bank – Materials on Development Financing, No. 6, 2016
example only three damaging events of amounts a, b and c, with a>b>c, the largest
damage reached or exceeded only once in these 100 years is a, while a damage
level of b is reached or exceeded twice in these 100 years, hence the return period
for a damage level of b is 50 years, and c is reached or exceeded three times,
hence its return period is 33.3 years. Please note that large events occur less
frequently than smaller events, therefore a 100yr (an event having a probability of
occurring every 100 years) is larger than a 50yr event. It is common practice to use
the following return period: 2yr, 5yr, 10yr, 25yr, 50yr and 100yr.
The frequency (return period) is the inverse of the expected number of occurrences
in a year). For example, a 100-year flood has a probability of 1/100= 0.01 or 1%
chance of being exceeded in any one year and a 50-year flood has a 0.02 or 2%
chance of being exceeded in any one year. This does not mean that a 100-year
flood will happen regularly every 100 years, or only once in 100 years. Because
return periods are statistical values, in any given 100-year period, a 100-year event
may occur once, twice, more, or not at all, with each outcome sharing the same
probability.
Step 2: Generate hazard probability maps
Once you have generated your return periods, it is important to locate where the
hazard selected will take place. We recommend drawing intensity maps for every
return period. If you are working with rasterised data sets, you will make sure that
you gather information about every cell located in your hazard zone. In this case,
resolution is an important factor and you will make sure it is in an equation with the
resolution of your assets and with the data available for your study. In Figure 11 we
show water depths in San Salvador, at a 10m resolution. Higher depths are
displayed in dark blue and light blue indicates lower depths. Unsurprisingly, the
river channel is where water depth is the highest, with depths exceeding 7m at
certain points. Water depths for other return periods (2yr, 5yr, 10yr, 25yr and 50yr)
are not displayed on this figure and were provided in different files.
Figure 11 Water depth for 100yr flood events in San Salvador (KfW, 2015a)
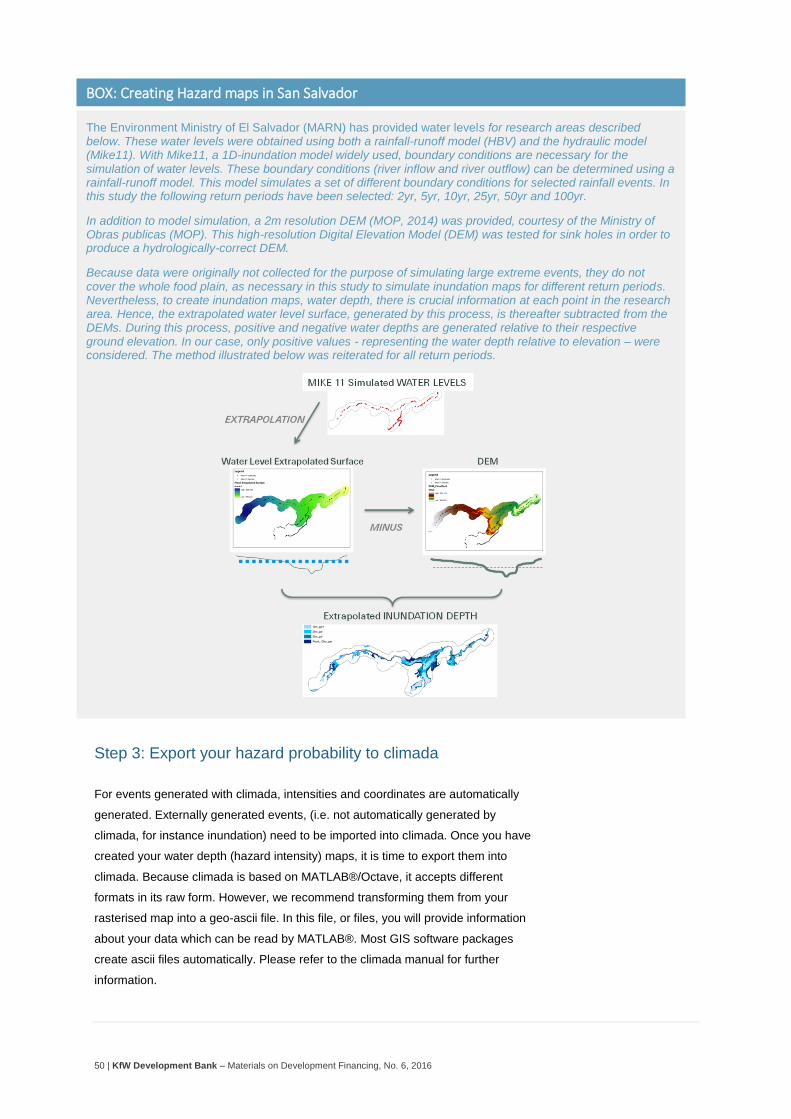
50 | KfW Development Bank – Materials on Development Financing, No. 6, 2016
Step 3: Export your hazard probability to climada
For events generated with climada, intensities and coordinates are automatically
generated. Externally generated events, (i.e. not automatically generated by
climada, for instance inundation) need to be imported into climada. Once you have
created your water depth (hazard intensity) maps, it is time to export them into
climada. Because climada is based on MATLAB®/Octave, it accepts different
formats in its raw form. However, we recommend transforming them from your
rasterised map into a geo-ascii file. In this file, or files, you will provide information
about your data which can be read by MATLAB®. Most GIS software packages
create ascii files automatically. Please refer to the climada manual for further
information.
BOX: Creating Hazard maps in San Salvador
The Environment Ministry of El Salvador (MARN) has provided water levels for research areas described below. These water levels were obtained using both a rainfall-runoff model (HBV) and the hydraulic model (Mike11). With Mike11, a 1D-inundation model widely used, boundary conditions are necessary for the simulation of water levels. These boundary conditions (river inflow and river outflow) can be determined using a rainfall-runoff model. This model simulates a set of different boundary conditions for selected rainfall events. In this study the following return periods have been selected: 2yr, 5yr, 10yr, 25yr, 50yr and 100yr.
In addition to model simulation, a 2m resolution DEM (MOP, 2014) was provided, courtesy of the Ministry of Obras publicas (MOP). This high-resolution Digital Elevation Model (DEM) was tested for sink holes in order to produce a hydrologically-correct DEM.
Because data were originally not collected for the purpose of simulating large extreme events, they do not cover the whole food plain, as necessary in this study to simulate inundation maps for different return periods. Nevertheless, to create inundation maps, water depth, there is crucial information at each point in the research area. Hence, the extrapolated water level surface, generated by this process, is thereafter subtracted from the DEMs. During this process, positive and negative water depths are generated relative to their respective ground elevation. In our case, only positive values - representing the water depth relative to elevation – were considered. The method illustrated below was reiterated for all return periods.
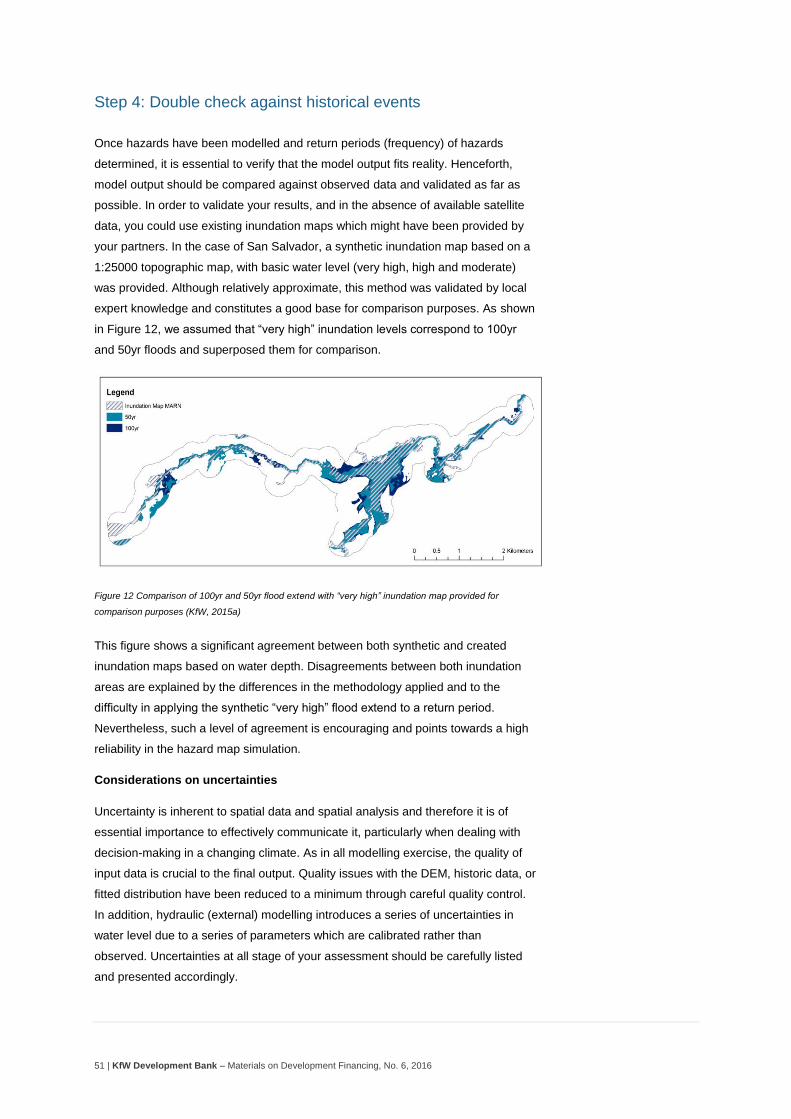
51 | KfW Development Bank – Materials on Development Financing, No. 6, 2016
Step 4: Double check against historical events
Once hazards have been modelled and return periods (frequency) of hazards
determined, it is essential to verify that the model output fits reality. Henceforth,
model output should be compared against observed data and validated as far as
possible. In order to validate your results, and in the absence of available satellite
data, you could use existing inundation maps which might have been provided by
your partners. In the case of San Salvador, a synthetic inundation map based on a
1:25000 topographic map, with basic water level (very high, high and moderate)
was provided. Although relatively approximate, this method was validated by local
expert knowledge and constitutes a good base for comparison purposes. As shown
in Figure 12, we assumed that “very high” inundation levels correspond to 100yr
and 50yr floods and superposed them for comparison.
Figure 12 Comparison of 100yr and 50yr flood extend with “very high” inundation map provided for
comparison purposes (KfW, 2015a)
This figure shows a significant agreement between both synthetic and created
inundation maps based on water depth. Disagreements between both inundation
areas are explained by the differences in the methodology applied and to the
difficulty in applying the synthetic “very high” flood extend to a return period.
Nevertheless, such a level of agreement is encouraging and points towards a high
reliability in the hazard map simulation.
Considerations on uncertainties
Uncertainty is inherent to spatial data and spatial analysis and therefore it is of
essential importance to effectively communicate it, particularly when dealing with
decision-making in a changing climate. As in all modelling exercise, the quality of
input data is crucial to the final output. Quality issues with the DEM, historic data, or
fitted distribution have been reduced to a minimum through careful quality control.
In addition, hydraulic (external) modelling introduces a series of uncertainties in
water level due to a series of parameters which are calibrated rather than
observed. Uncertainties at all stage of your assessment should be carefully listed
and presented accordingly.
52 | KfW Development Bank – Materials on Development Financing, No. 6, 2016
PHASE 5: Valuating Assets
DESCRIPTION OF THE PHASE
This Phase outlines the essential steps towards a sound valuation of the asset categories for hazards selected in Phase 1. It will provide you
with guidance on how to best value different categories of assets and how to insert them into climada. In addition, it will provide you with tips
on how to value assets without monetary values or assets with low monetary values. Particular emphasis will be placed on a pro-poor
approach dedicated to developing and emerging countries/economies.
KEY STEPS
Step 1: Select assets categories fitting your scope
How many assets categories are necessary?
How can I tailor categories to my scope and objectives?
Step 2: Localise your assets
What are the methods for localising my assets?
Which methods are adapted to my needs?
Step 3: Give a monetary value to your assets
What are the best practices to obtain monetary values for my assets?
How does monetary value change with hazards?
Step 4: Export your asset values into climada format
How can I import asset data into climada?
Where are the major pitfalls?
Step 5: Validate your total asset value
Why is it important to validate your results?
INPUT NEEDED
For this Phase, you will need:
Selected asset categories from Phase 1
Geographical data about asset locations from Phase 2
Scenarios from Phase 3
A field team/consultant for your field survey
A good overview of monetary values for structural assets
A good understanding of valuation techniques for environmental assets (if applicable)
A good command of GIS or Google Earth applications
53 | KfW Development Bank – Materials on Development Financing, No. 6, 2016
Getting started
climada offers the possibility to introduce asset value and location and align them
with probabilistic hazards. In this phase you will learn how to select different type of
assets according to the scope of your project (step 1). You will learn how to localise
your assets using different methods (step 2). Then we will show examples on how
to give a monetary value to your assets (step 3). In step 4, we will review how to
export this information to climada, and how to validate them against historical
events (step 5).
Step 1: Select assets categories fitting your scope
Selecting categories of assets is an important step in your CCA assessment.
Depending on the scope of your study and on your specific objectives, you might
choose different asset categories. Because assets will be valued, bias on efficiency
of CCA measures is introduced for assets with larger values. In practice it means
that assets with higher values (for instance hospitals, school or government
buildings) will receive damage with a higher total cost than assets with lower value
(such as informal settlements). In order to reduce this bias, it is essential to
differentiate between different categories. You will later be able to present your
results by assets, and therefore focus on your scope. Below, we provide a box
focusing on pro-poor approach in CCA assessments.
TIP: NUMBER OF ASSETS
It is best practice not to define more than 8 assets. By doing so, you reach a sufficient level of detail and you will keep your
study time efficient. Typical categories of assets can be: housing (in and outside of informal settlements), hospitals and
health centres, schools, road networks and large buildings, industry, agriculture and in addition persons.
Please note that it is important to attribute a unique number to each asset categories!
EXPECTED OUTPUTS
After this Phase, you will have:
A map of your assets with values (population) related to them
Your asset input ready for climada
A good understanding of your global asset value and population for different scenarios
TOOLS AND ADDITIONAL INFORMATION
climada Asset Phase (cf. climada manual)
GIS application software
54 | KfW Development Bank – Materials on Development Financing, No. 6, 2016
How do you define categories?
Asset selection is an essential step in the model development and we recommend
following the stages listed below:
1) First, define a maximum number of asset categories (see TIP below),
2) A long list of possible categories of asset is defined
3) Categories of asset are well defined
4) Selection criteria are defined
5) Scores are attributed to each category of asset. Scores range from 1 to 3,
3 being the highest score.
The following criteria can be selected
a) Focus of the study (for example: poverty);
b) The percentage of the total population represented by a category of asset.
The higher the percentage of population represented, the higher the
score;
c) Vulnerability of assets within a category. The higher the vulnerability, the
higher the score;
d) Accessibility to information. Defining asset where no information about
their value is available should be avoided;
e) In case of damage, what percentage of the population will be affected;
f) Do assets in a category have a societal value? For instance cultural
assets or social assets such as a hospital have a strong societal value for
a community;
g) The approximate contribution of the asset category to the total value of
assets in the area.
Step 2: Localise your assets
Once you have defined your asset categories, you should geo-localize your assets.
You will have to identify each asset in your categories and assign it latitude and
TIP: PRO-POOR FOCUS AND CHOICE OF ASSET SUBCATEGORIES
In the case of Barisal, available housing statistics differentiated housing into four subcategories of quality and value. This
provided the opportunity to spatially concentrate measures on those regions where hazard impacts in relation to household
income were most detrimental. Especially in the case of housing it can be insightful to differentiate assets which correspond
to different levels of household income.
55 | KfW Development Bank – Materials on Development Financing, No. 6, 2016
longitude values in order to export it into climada later. To obtain spatial information
about your asset, there are several options available:
Method 1: Google Earth
Using this method, you can pinpoint assets online and export
them directly into climada. However, using this method is
cumbersome and you will need prior knowledge of the region in
order to different between asset categories. On the other hand,
this method is very beneficial if you are interested in a rapid
appraisal study, rather than an in-depth analysis.
Method 2: GIS software packages
If GIS raster files and/or shape files are available in your region
(cf. Phase 2) you can use them to build your own asset portfolio.
This approach has the advantage that assets are readily geo-
located and you have the opportunity to reach a greater level of
detail, depending on the quality of your data set. If unavailable,
please refer to method 1.
Method 3: Field Survey
A field survey is the best solution to validate assets you might
have identified using one of the above-mentioned methods. The
main advantage is a direct validation of your asset value with
direct observation. In addition, it offers a greater recognition of
your results when presented to stakeholder and decision makers.
However, such field surveys can be resource intensive and
should be planned carefully. Sub-contracting teams of technical
field agents is possible and can also be done in parallel to other
tasks such as gathering geo-location data. Photography and field
sheets can be created for a sample of sites representative of a
given neighbourhood. Information gathered at each site was
thereafter analysed according to several structural criteria
relevant to the property value such as:
Frame structure (column, beam) of structural walls
Roof system
Overall finishes, external works
Doors and windows quality
These criteria were subsequently analysed and information
relating to construction costs (such the age of the building) or
construction quality and number of floors, are introduced in the
valuation exercise. A template of a field survey sheets is provided
in Annex 2.
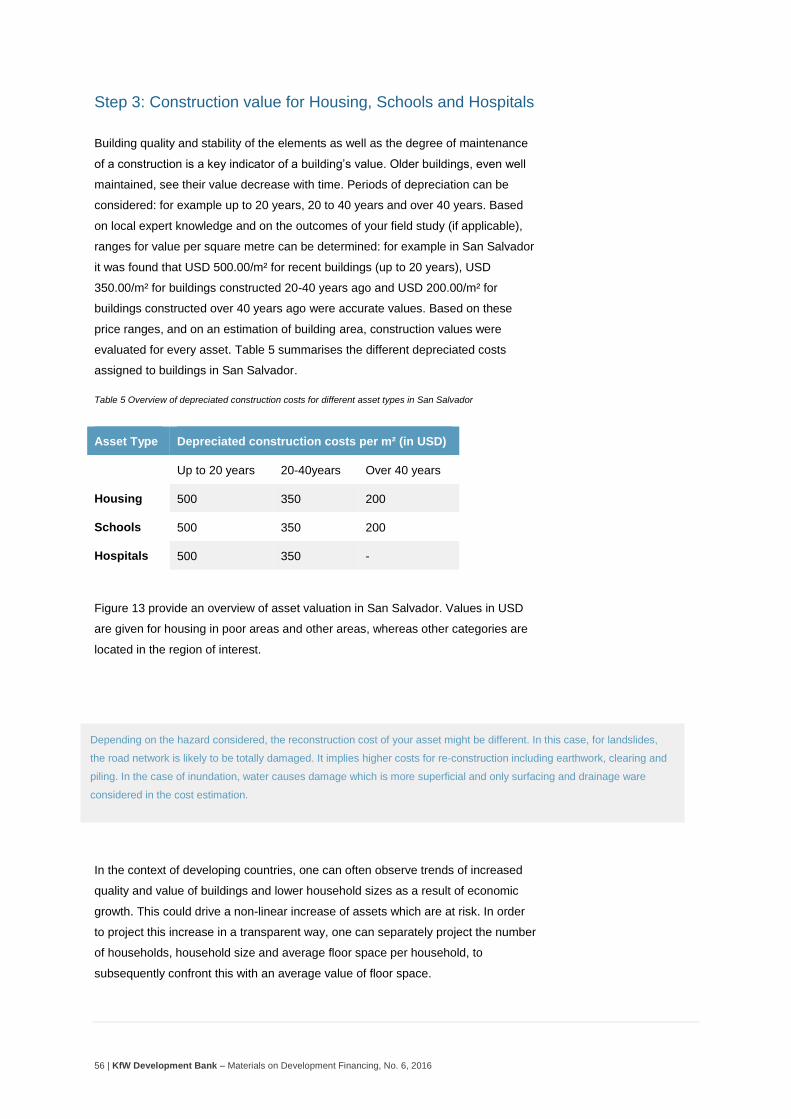
56 | KfW Development Bank – Materials on Development Financing, No. 6, 2016
Step 3: Construction value for Housing, Schools and Hospitals
Building quality and stability of the elements as well as the degree of maintenance
of a construction is a key indicator of a building’s value. Older buildings, even well
maintained, see their value decrease with time. Periods of depreciation can be
considered: for example up to 20 years, 20 to 40 years and over 40 years. Based
on local expert knowledge and on the outcomes of your field study (if applicable),
ranges for value per square metre can be determined: for example in San Salvador
it was found that USD 500.00/m² for recent buildings (up to 20 years), USD
350.00/m² for buildings constructed 20-40 years ago and USD 200.00/m² for
buildings constructed over 40 years ago were accurate values. Based on these
price ranges, and on an estimation of building area, construction values were
evaluated for every asset. Table 5 summarises the different depreciated costs
assigned to buildings in San Salvador.
Table 5 Overview of depreciated construction costs for different asset types in San Salvador
Asset Type Depreciated construction costs per m² (in USD)
Up to 20 years 20-40years Over 40 years
Housing 500 350 200
Schools 500 350 200
Hospitals 500 350 -
Figure 13 provide an overview of asset valuation in San Salvador. Values in USD
are given for housing in poor areas and other areas, whereas other categories are
located in the region of interest.
In the context of developing countries, one can often observe trends of increased
quality and value of buildings and lower household sizes as a result of economic
growth. This could drive a non-linear increase of assets which are at risk. In order
to project this increase in a transparent way, one can separately project the number
of households, household size and average floor space per household, to
subsequently confront this with an average value of floor space.
TIP: ASSET VALUE AND HAZARDS
Depending on the hazard considered, the reconstruction cost of your asset might be different. In this case, for landslides,
the road network is likely to be totally damaged. It implies higher costs for re-construction including earthwork, clearing and
piling. In the case of inundation, water causes damage which is more superficial and only surfacing and drainage ware
considered in the cost estimation.
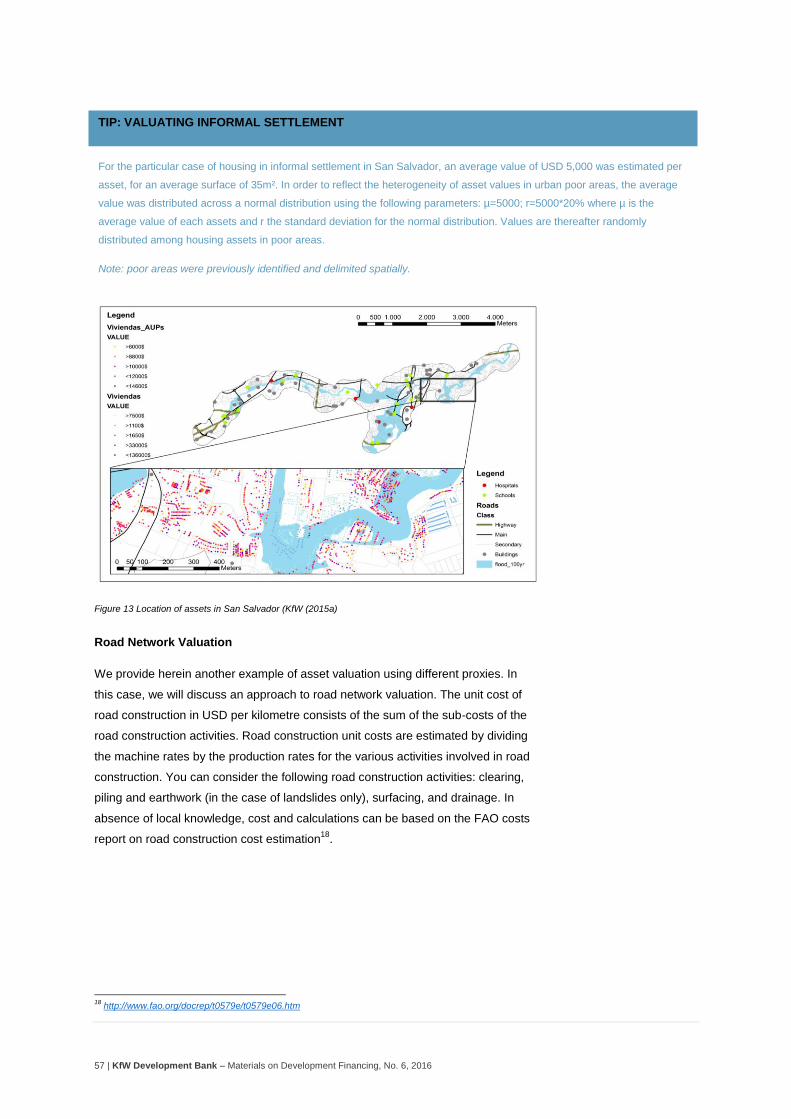
57 | KfW Development Bank – Materials on Development Financing, No. 6, 2016
Figure 13 Location of assets in San Salvador (KfW (2015a)
Road Network Valuation
We provide herein another example of asset valuation using different proxies. In
this case, we will discuss an approach to road network valuation. The unit cost of
road construction in USD per kilometre consists of the sum of the sub-costs of the
road construction activities. Road construction unit costs are estimated by dividing
the machine rates by the production rates for the various activities involved in road
construction. You can consider the following road construction activities: clearing,
piling and earthwork (in the case of landslides only), surfacing, and drainage. In
absence of local knowledge, cost and calculations can be based on the FAO costs
report on road construction cost estimation18
.
18
http://www.fao.org/docrep/t0579e/t0579e06.htm
TIP: VALUATING INFORMAL SETTLEMENT
For the particular case of housing in informal settlement in San Salvador, an average value of USD 5,000 was estimated per
asset, for an average surface of 35m². In order to reflect the heterogeneity of asset values in urban poor areas, the average
value was distributed across a normal distribution using the following parameters: µ=5000; r=5000*20% where µ is the
average value of each assets and r the standard deviation for the normal distribution. Values are thereafter randomly
distributed among housing assets in poor areas.
Note: poor areas were previously identified and delimited spatially.
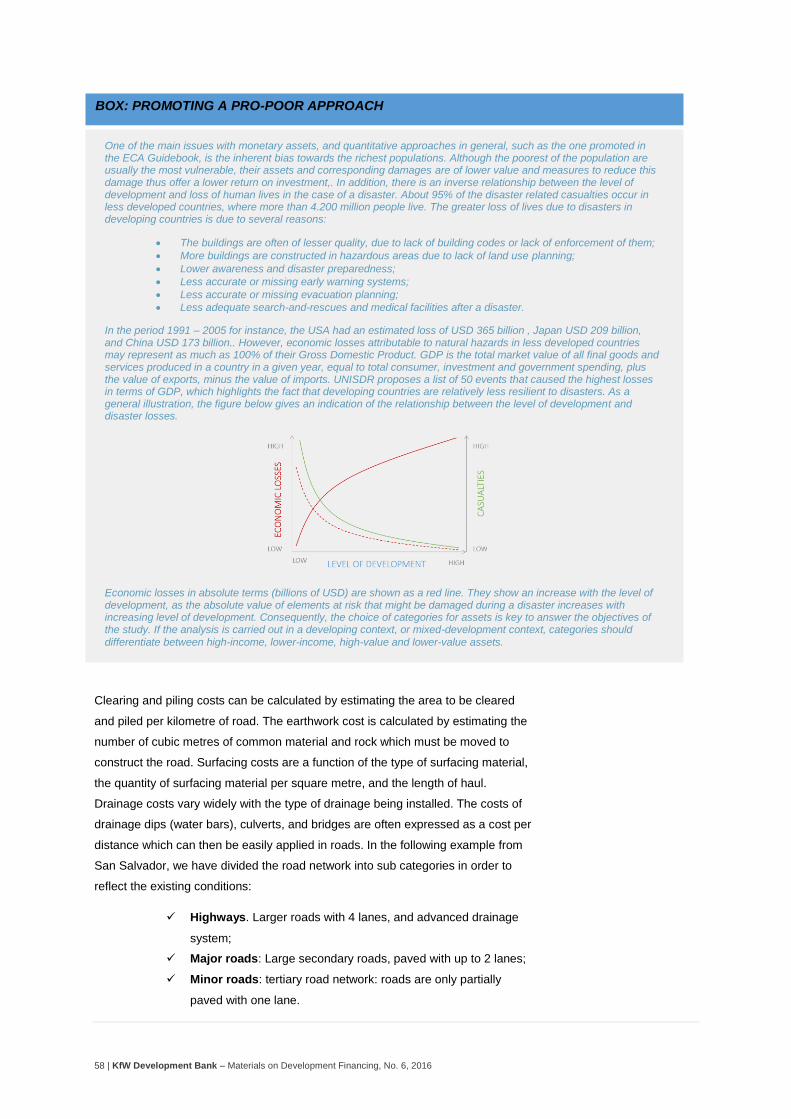
58 | KfW Development Bank – Materials on Development Financing, No. 6, 2016
Clearing and piling costs can be calculated by estimating the area to be cleared
and piled per kilometre of road. The earthwork cost is calculated by estimating the
number of cubic metres of common material and rock which must be moved to
construct the road. Surfacing costs are a function of the type of surfacing material,
the quantity of surfacing material per square metre, and the length of haul.
Drainage costs vary widely with the type of drainage being installed. The costs of
drainage dips (water bars), culverts, and bridges are often expressed as a cost per
distance which can then be easily applied in roads. In the following example from
San Salvador, we have divided the road network into sub categories in order to
reflect the existing conditions:
Highways. Larger roads with 4 lanes, and advanced drainage
system;
Major roads: Large secondary roads, paved with up to 2 lanes;
Minor roads: tertiary road network: roads are only partially
paved with one lane.
BOX: PROMOTING A PRO-POOR APPROACH
One of the main issues with monetary assets, and quantitative approaches in general, such as the one promoted in the ECA Guidebook, is the inherent bias towards the richest populations. Although the poorest of the population are usually the most vulnerable, their assets and corresponding damages are of lower value and measures to reduce this damage thus offer a lower return on investment,. In addition, there is an inverse relationship between the level of development and loss of human lives in the case of a disaster. About 95% of the disaster related casualties occur in less developed countries, where more than 4.200 million people live. The greater loss of lives due to disasters in developing countries is due to several reasons:
The buildings are often of lesser quality, due to lack of building codes or lack of enforcement of them;
More buildings are constructed in hazardous areas due to lack of land use planning;
Lower awareness and disaster preparedness;
Less accurate or missing early warning systems;
Less accurate or missing evacuation planning;
Less adequate search-and-rescues and medical facilities after a disaster.
In the period 1991 – 2005 for instance, the USA had an estimated loss of USD 365 billion , Japan USD 209 billion, and China USD 173 billion.. However, economic losses attributable to natural hazards in less developed countries may represent as much as 100% of their Gross Domestic Product. GDP is the total market value of all final goods and services produced in a country in a given year, equal to total consumer, investment and government spending, plus the value of exports, minus the value of imports. UNISDR proposes a list of 50 events that caused the highest losses in terms of GDP, which highlights the fact that developing countries are relatively less resilient to disasters. As a general illustration, the figure below gives an indication of the relationship between the level of development and disaster losses.
Economic losses in absolute terms (billions of USD) are shown as a red line. They show an increase with the level of development, as the absolute value of elements at risk that might be damaged during a disaster increases with increasing level of development. Consequently, the choice of categories for assets is key to answer the objectives of the study. If the analysis is carried out in a developing context, or mixed-development context, categories should
differentiate between high-income, lower-income, high-value and lower-value assets.
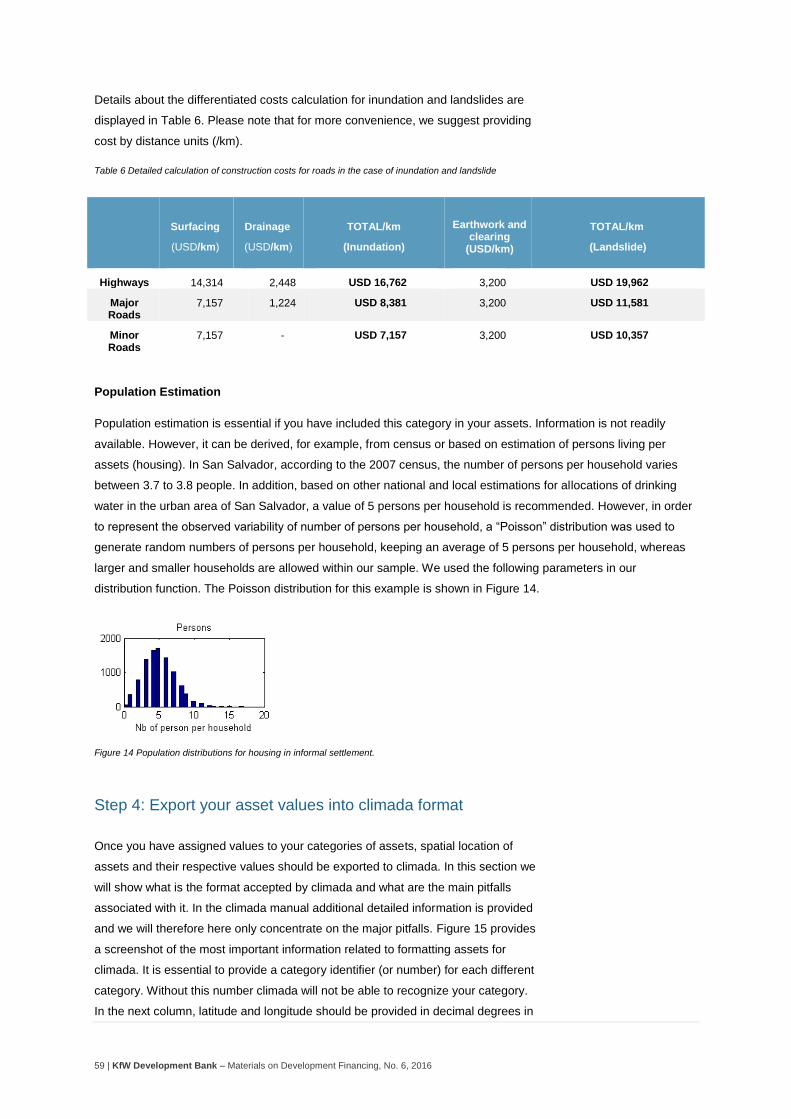
59 | KfW Development Bank – Materials on Development Financing, No. 6, 2016
Details about the differentiated costs calculation for inundation and landslides are
displayed in Table 6. Please note that for more convenience, we suggest providing
cost by distance units (/km).
Table 6 Detailed calculation of construction costs for roads in the case of inundation and landslide
Surfacing
(USD/km)
Drainage
(USD/km)
TOTAL/km
(Inundation)
Earthwork and clearing
(USD/km)
TOTAL/km
(Landslide)
Highways 14,314 2,448 USD 16,762 3,200 USD 19,962
Major Roads
7,157 1,224 USD 8,381 3,200 USD 11,581
Minor Roads
7,157 - USD 7,157 3,200 USD 10,357
Population Estimation
Population estimation is essential if you have included this category in your assets. Information is not readily
available. However, it can be derived, for example, from census or based on estimation of persons living per
assets (housing). In San Salvador, according to the 2007 census, the number of persons per household varies
between 3.7 to 3.8 people. In addition, based on other national and local estimations for allocations of drinking
water in the urban area of San Salvador, a value of 5 persons per household is recommended. However, in order
to represent the observed variability of number of persons per household, a “Poisson” distribution was used to
generate random numbers of persons per household, keeping an average of 5 persons per household, whereas
larger and smaller households are allowed within our sample. We used the following parameters in our
distribution function. The Poisson distribution for this example is shown in Figure 14.
Figure 14 Population distributions for housing in informal settlement.
Step 4: Export your asset values into climada format
Once you have assigned values to your categories of assets, spatial location of
assets and their respective values should be exported to climada. In this section we
will show what is the format accepted by climada and what are the main pitfalls
associated with it. In the climada manual additional detailed information is provided
and we will therefore here only concentrate on the major pitfalls. Figure 15 provides
a screenshot of the most important information related to formatting assets for
climada. It is essential to provide a category identifier (or number) for each different
category. Without this number climada will not be able to recognize your category.
In the next column, latitude and longitude should be provided in decimal degrees in
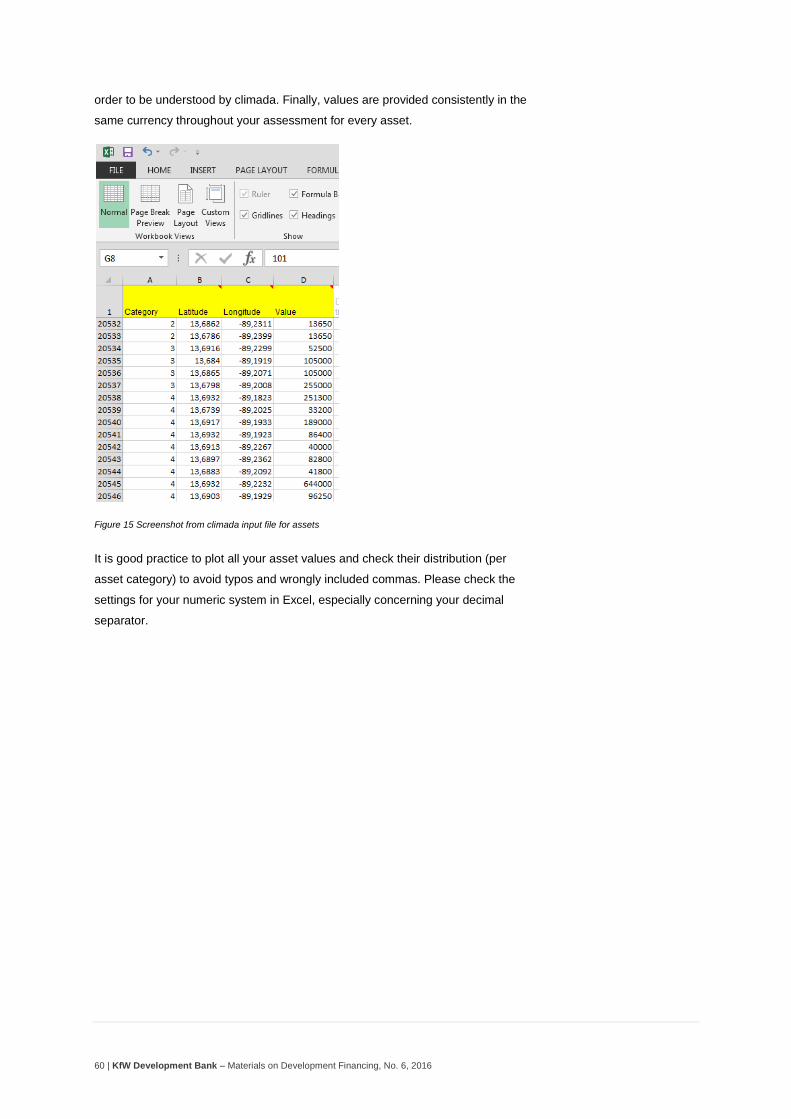
60 | KfW Development Bank – Materials on Development Financing, No. 6, 2016
order to be understood by climada. Finally, values are provided consistently in the
same currency throughout your assessment for every asset.
Figure 15 Screenshot from climada input file for assets
It is good practice to plot all your asset values and check their distribution (per
asset category) to avoid typos and wrongly included commas. Please check the
settings for your numeric system in Excel, especially concerning your decimal
separator.
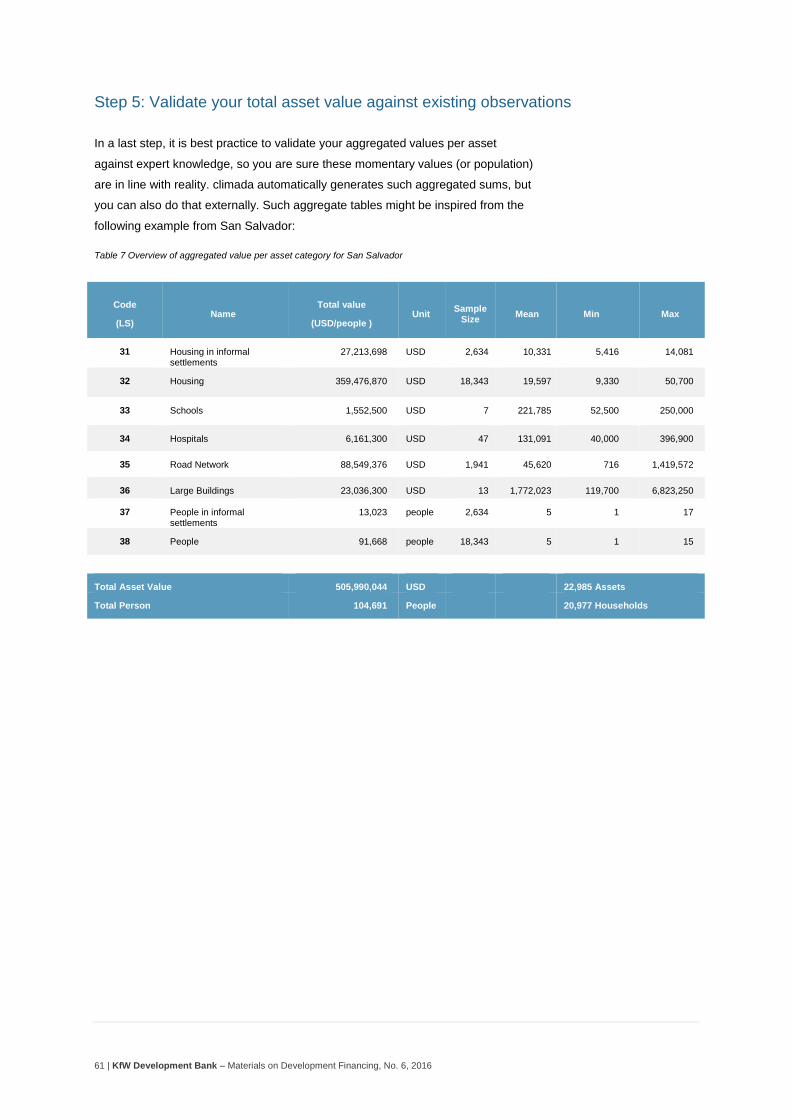
61 | KfW Development Bank – Materials on Development Financing, No. 6, 2016
Step 5: Validate your total asset value against existing observations
In a last step, it is best practice to validate your aggregated values per asset
against expert knowledge, so you are sure these momentary values (or population)
are in line with reality. climada automatically generates such aggregated sums, but
you can also do that externally. Such aggregate tables might be inspired from the
following example from San Salvador:
Table 7 Overview of aggregated value per asset category for San Salvador
Code
(LS) Name
Total value
(USD/people ) Unit
Sample Size
Mean Min Max
31 Housing in informal settlements
27,213,698 USD 2,634 10,331 5,416 14,081
32 Housing 359,476,870 USD 18,343 19,597 9,330 50,700
33 Schools 1,552,500 USD 7 221,785 52,500 250,000
34 Hospitals 6,161,300 USD 47 131,091 40,000 396,900
35 Road Network 88,549,376 USD 1,941 45,620 716 1,419,572
36 Large Buildings 23,036,300 USD 13 1,772,023 119,700 6,823,250
37 People in informal settlements
13,023 people 2,634 5 1 17
38 People 91,668 people 18,343 5 1 15
Total Asset Value 505,990,044 USD 22,985 Assets
Total Person 104,691 People 20,977 Households
62 | KfW Development Bank – Materials on Development Financing, No. 6, 2016
PHASE 6: Creating Damage Functions
Getting Started
Damage functions are cumulative distribution functions used to represent the
relation between hazard intensity and damages to a particular asset. They are
DESCRIPTION OF THE PHASE
This Phase outlines the essential steps for creating damage functions for the different classes of assets and for the different types of hazards.
It will give you information and guidance in order to organise an expert workshop to gather information on past disasters in your
region/country. In addition, it provides guidance on how to develop damage functions from historical observations and insert them into
climada.
KEY STEPS
Step 1: Creating damage functions
Step 2: Exporting damage function in climada
Step 3: Calibrating and validating your damage functions
INPUT NEEDED
For this Phase, you will need:
Data about historical damages (per hazard)
Construction details about your assets
Basic knowledge of polynomial functions
A general understanding on how your assets are affected by the selected hazards
EXPECTED OUTPUTS
After this Phase, you will have:
Damage functions per asset categories and per hazard
Calibrated results between assets and hazards
TOOLS AND ADDITIONAL INFORMATION
climada manual and climada damage function generator (cf. climada manual)
ERN vulnerability damage function generator (cf. manual and download at http://www.ecapra.org/ern-vulnerability)
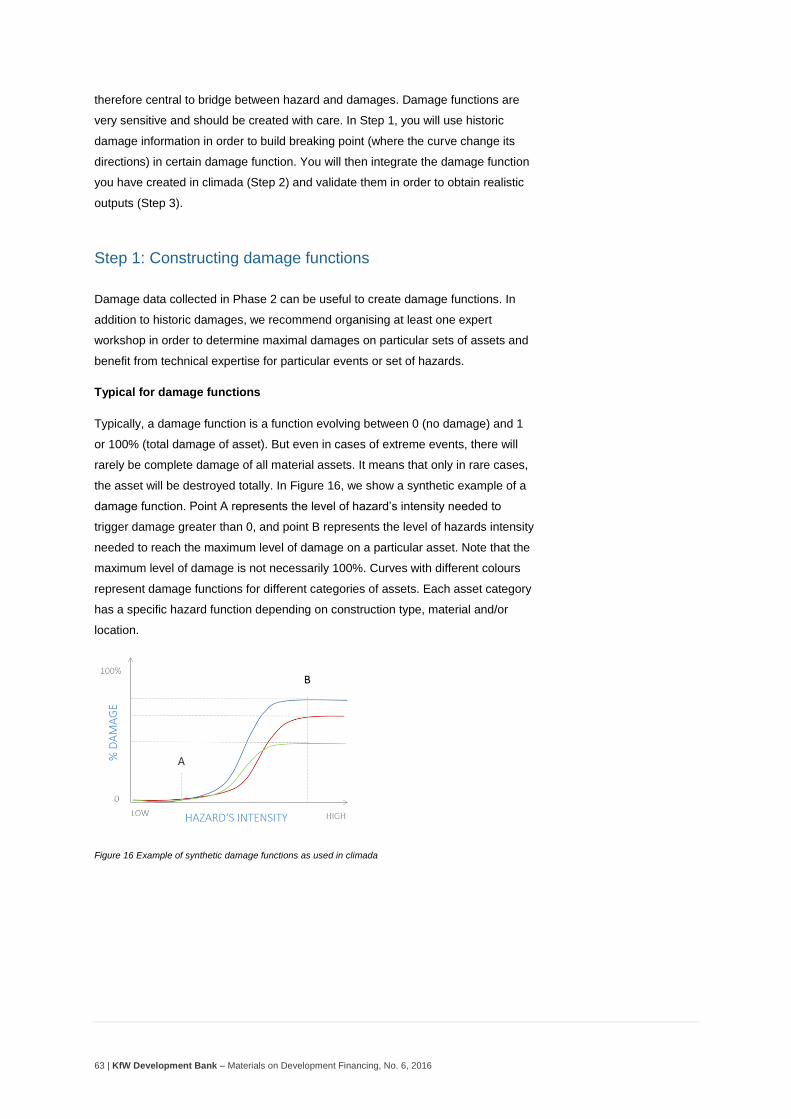
63 | KfW Development Bank – Materials on Development Financing, No. 6, 2016
therefore central to bridge between hazard and damages. Damage functions are
very sensitive and should be created with care. In Step 1, you will use historic
damage information in order to build breaking point (where the curve change its
directions) in certain damage function. You will then integrate the damage function
you have created in climada (Step 2) and validate them in order to obtain realistic
outputs (Step 3).
Step 1: Constructing damage functions
Damage data collected in Phase 2 can be useful to create damage functions. In
addition to historic damages, we recommend organising at least one expert
workshop in order to determine maximal damages on particular sets of assets and
benefit from technical expertise for particular events or set of hazards.
Typical for damage functions
Typically, a damage function is a function evolving between 0 (no damage) and 1
or 100% (total damage of asset). But even in cases of extreme events, there will
rarely be complete damage of all material assets. It means that only in rare cases,
the asset will be destroyed totally. In Figure 16, we show a synthetic example of a
damage function. Point A represents the level of hazard’s intensity needed to
trigger damage greater than 0, and point B represents the level of hazards intensity
needed to reach the maximum level of damage on a particular asset. Note that the
maximum level of damage is not necessarily 100%. Curves with different colours
represent damage functions for different categories of assets. Each asset category
has a specific hazard function depending on construction type, material and/or
location.
Figure 16 Example of synthetic damage functions as used in climada
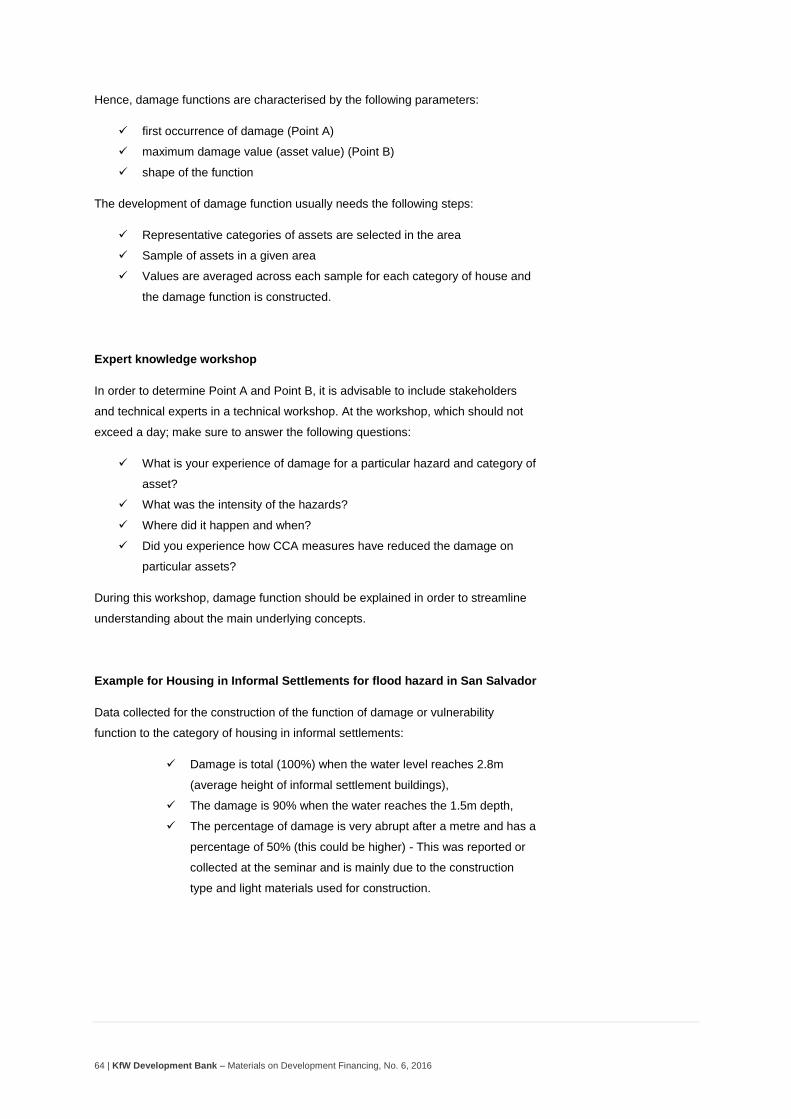
64 | KfW Development Bank – Materials on Development Financing, No. 6, 2016
Hence, damage functions are characterised by the following parameters:
first occurrence of damage (Point A)
maximum damage value (asset value) (Point B)
shape of the function
The development of damage function usually needs the following steps:
Representative categories of assets are selected in the area
Sample of assets in a given area
Values are averaged across each sample for each category of house and
the damage function is constructed.
Expert knowledge workshop
In order to determine Point A and Point B, it is advisable to include stakeholders
and technical experts in a technical workshop. At the workshop, which should not
exceed a day; make sure to answer the following questions:
What is your experience of damage for a particular hazard and category of
asset?
What was the intensity of the hazards?
Where did it happen and when?
Did you experience how CCA measures have reduced the damage on
particular assets?
During this workshop, damage function should be explained in order to streamline
understanding about the main underlying concepts.
Example for Housing in Informal Settlements for flood hazard in San Salvador
Data collected for the construction of the function of damage or vulnerability
function to the category of housing in informal settlements:
Damage is total (100%) when the water level reaches 2.8m
(average height of informal settlement buildings),
The damage is 90% when the water reaches the 1.5m depth,
The percentage of damage is very abrupt after a metre and has a
percentage of 50% (this could be higher) - This was reported or
collected at the seminar and is mainly due to the construction
type and light materials used for construction.
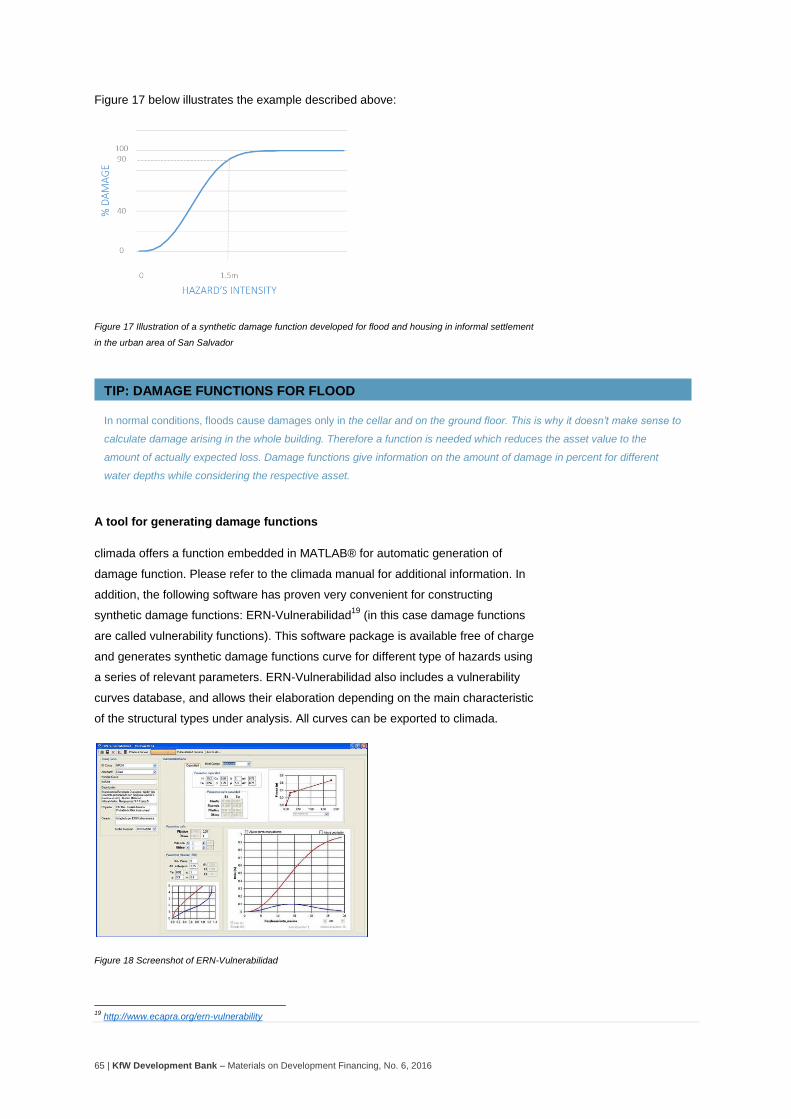
65 | KfW Development Bank – Materials on Development Financing, No. 6, 2016
Figure 17 below illustrates the example described above:
Figure 17 Illustration of a synthetic damage function developed for flood and housing in informal settlement
in the urban area of San Salvador
A tool for generating damage functions
climada offers a function embedded in MATLAB® for automatic generation of
damage function. Please refer to the climada manual for additional information. In
addition, the following software has proven very convenient for constructing
synthetic damage functions: ERN-Vulnerabilidad19
(in this case damage functions
are called vulnerability functions). This software package is available free of charge
and generates synthetic damage functions curve for different type of hazards using
a series of relevant parameters. ERN-Vulnerabilidad also includes a vulnerability
curves database, and allows their elaboration depending on the main characteristic
of the structural types under analysis. All curves can be exported to climada.
Figure 18 Screenshot of ERN-Vulnerabilidad
19
http://www.ecapra.org/ern-vulnerability
TIP: DAMAGE FUNCTIONS FOR FLOOD
In normal conditions, floods cause damages only in the cellar and on the ground floor. This is why it doesn’t make sense to
calculate damage arising in the whole building. Therefore a function is needed which reduces the asset value to the
amount of actually expected loss. Damage functions give information on the amount of damage in percent for different
water depths while considering the respective asset.
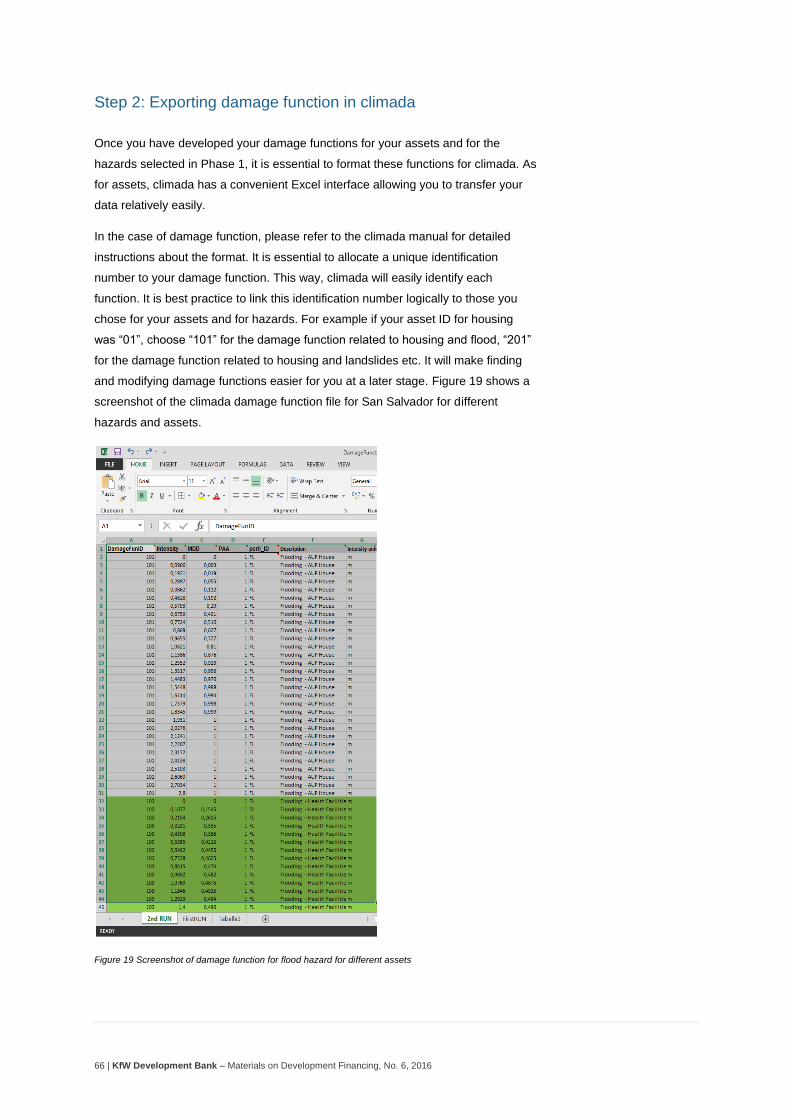
66 | KfW Development Bank – Materials on Development Financing, No. 6, 2016
Step 2: Exporting damage function in climada
Once you have developed your damage functions for your assets and for the
hazards selected in Phase 1, it is essential to format these functions for climada. As
for assets, climada has a convenient Excel interface allowing you to transfer your
data relatively easily.
In the case of damage function, please refer to the climada manual for detailed
instructions about the format. It is essential to allocate a unique identification
number to your damage function. This way, climada will easily identify each
function. It is best practice to link this identification number logically to those you
chose for your assets and for hazards. For example if your asset ID for housing
was “01”, choose “101” for the damage function related to housing and flood, “201”
for the damage function related to housing and landslides etc. It will make finding
and modifying damage functions easier for you at a later stage. Figure 19 shows a
screenshot of the climada damage function file for San Salvador for different
hazards and assets.
Figure 19 Screenshot of damage function for flood hazard for different assets
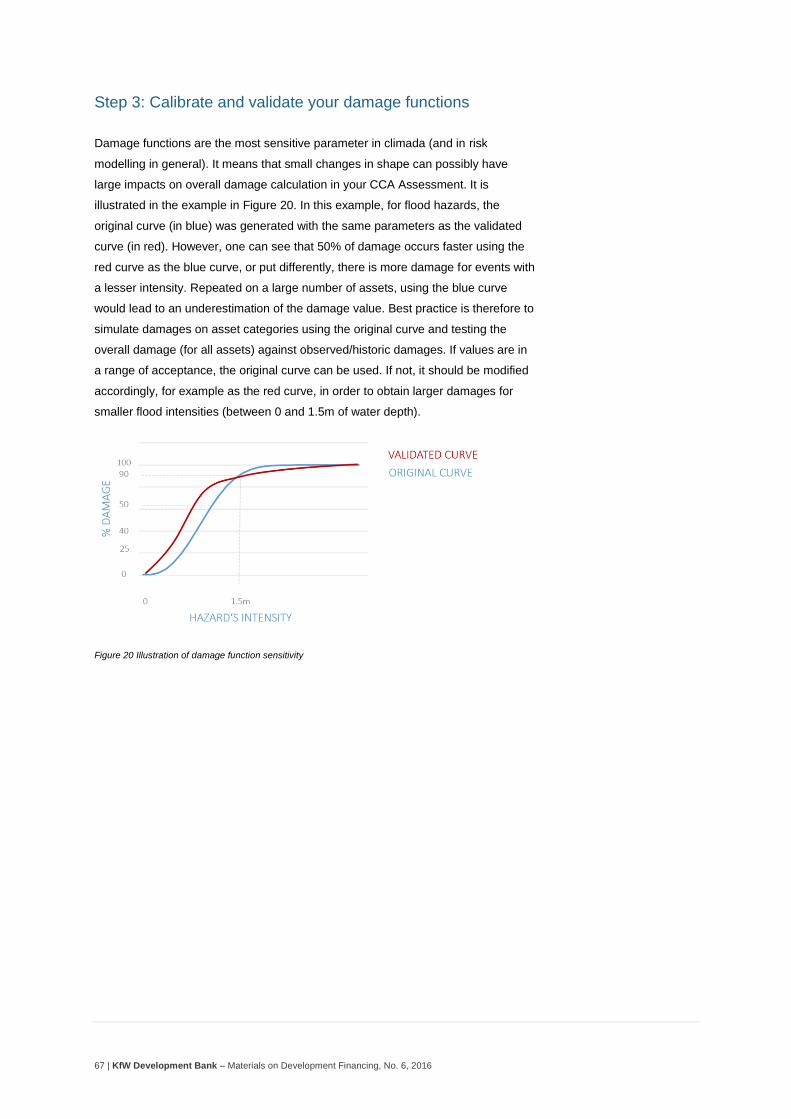
67 | KfW Development Bank – Materials on Development Financing, No. 6, 2016
Step 3: Calibrate and validate your damage functions
Damage functions are the most sensitive parameter in climada (and in risk
modelling in general). It means that small changes in shape can possibly have
large impacts on overall damage calculation in your CCA Assessment. It is
illustrated in the example in Figure 20. In this example, for flood hazards, the
original curve (in blue) was generated with the same parameters as the validated
curve (in red). However, one can see that 50% of damage occurs faster using the
red curve as the blue curve, or put differently, there is more damage for events with
a lesser intensity. Repeated on a large number of assets, using the blue curve
would lead to an underestimation of the damage value. Best practice is therefore to
simulate damages on asset categories using the original curve and testing the
overall damage (for all assets) against observed/historic damages. If values are in
a range of acceptance, the original curve can be used. If not, it should be modified
accordingly, for example as the red curve, in order to obtain larger damages for
smaller flood intensities (between 0 and 1.5m of water depth).
Figure 20 Illustration of damage function sensitivity
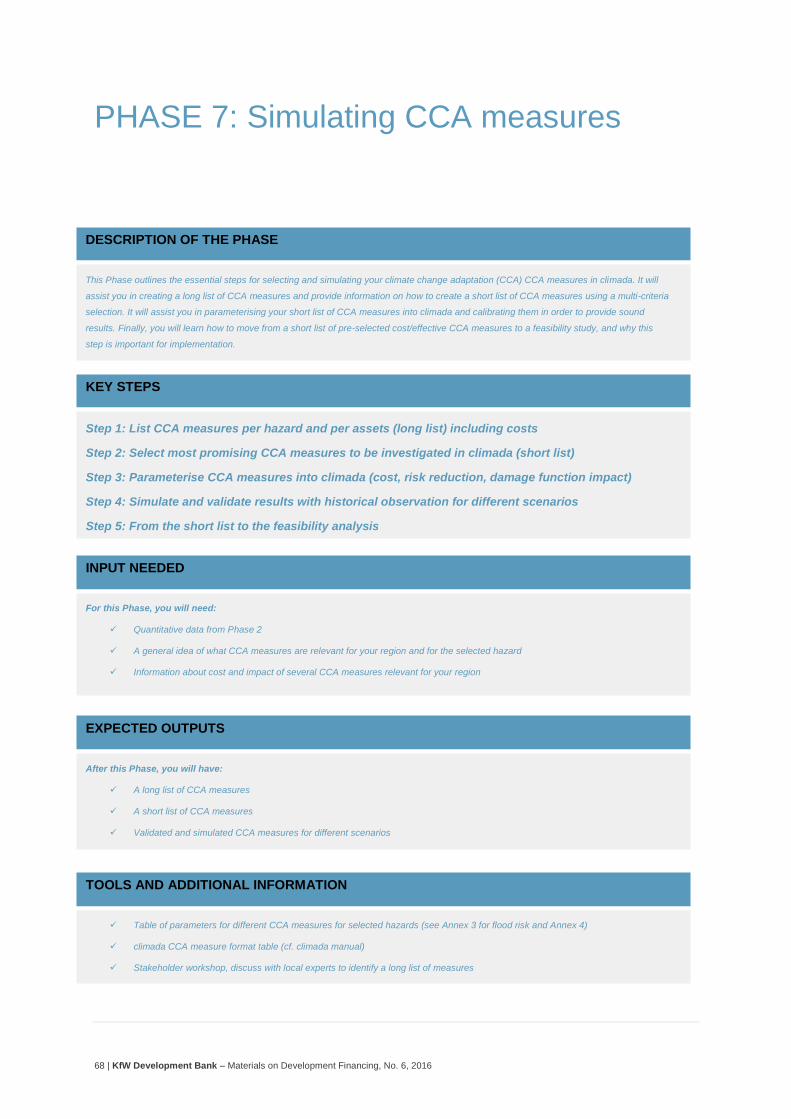
68 | KfW Development Bank – Materials on Development Financing, No. 6, 2016
PHASE 7: Simulating CCA measures
DESCRIPTION OF THE PHASE
This Phase outlines the essential steps for selecting and simulating your climate change adaptation (CCA) CCA measures in climada. It will
assist you in creating a long list of CCA measures and provide information on how to create a short list of CCA measures using a multi-criteria
selection. It will assist you in parameterising your short list of CCA measures into climada and calibrating them in order to provide sound
results. Finally, you will learn how to move from a short list of pre-selected cost/effective CCA measures to a feasibility study, and why this
step is important for implementation.
KEY STEPS
Step 1: List CCA measures per hazard and per assets (long list) including costs
Step 2: Select most promising CCA measures to be investigated in climada (short list)
Step 3: Parameterise CCA measures into climada (cost, risk reduction, damage function impact)
Step 4: Simulate and validate results with historical observation for different scenarios
Step 5: From the short list to the feasibility analysis
INPUT NEEDED
For this Phase, you will need:
Quantitative data from Phase 2
A general idea of what CCA measures are relevant for your region and for the selected hazard
Information about cost and impact of several CCA measures relevant for your region
EXPECTED OUTPUTS
After this Phase, you will have:
A long list of CCA measures
A short list of CCA measures
Validated and simulated CCA measures for different scenarios
TOOLS AND ADDITIONAL INFORMATION
Table of parameters for different CCA measures for selected hazards (see Annex 3 for flood risk and Annex 4)
climada CCA measure format table (cf. climada manual)
Stakeholder workshop, discuss with local experts to identify a long list of measures
69 | KfW Development Bank – Materials on Development Financing, No. 6, 2016
Getting Started
In previous Phases, risk and vulnerability has been quantified for pre-defined
research area. One of the major strength of the ECA methodology is the inclusion
of a cost benefit analysis (CBA) of CCA measures. This set of CCA measures are
tailored to the existing risk for the assets and population you have chosen to focus
on. Hence, introducing CCA measures is an essential instrument for your project
appraisal and will help to determine its economic viability and sustainability. You
will first select a long list of CCA measures that might be of interest for the region or
are already on the political agenda (Step 1). Following the pre-selection of this long
list of CCA measure, you will create a short list of CCA measures to be investigated
further with climada (Step 2). These CCA measures will need to be parameterised
within climada (Step 3). Thereafter, CCA measures will be simulated and validated
against observations (Step 4). Finally, during the feasibility study, you will
investigate further in greater detail which CCA measures are feasible, including a
detailed engineering and cost analysis (Step 5). The main objective is to reach
consensus and mutual understanding on key methodological concepts and
assumptions for the selection of CCA measures. It will also offer a more common
ground for the (investment) decision-making process for suitable adaption CCA
measures, which can contribute to increasing the climate resilience of your area. At
the end of the ECA methodology process, you will therefore have a proposal of
specific CCA measures including CBA and risk reduction potential.
Step 1: List CCA measures per hazard and per assets (long
list) including costs
In this first step, you will identify a list of CCA measures, ideally during a
stakeholder workshop including city planners, engineers, institutional experts and
economists. During this workshop you will address the following questions:
What CCA measures are already included in the existing master plan?
What CCA measures are already included in local and national climate
strategy and action plans?
What CCA measures are used for hazards similar to the region’s
conditions?
What positive experiences have been made in other regions or area with similar
conditions?
You should make sure that your long list include several types of CCA
measures such as:
Technical CCA measures (grey CCA measures);
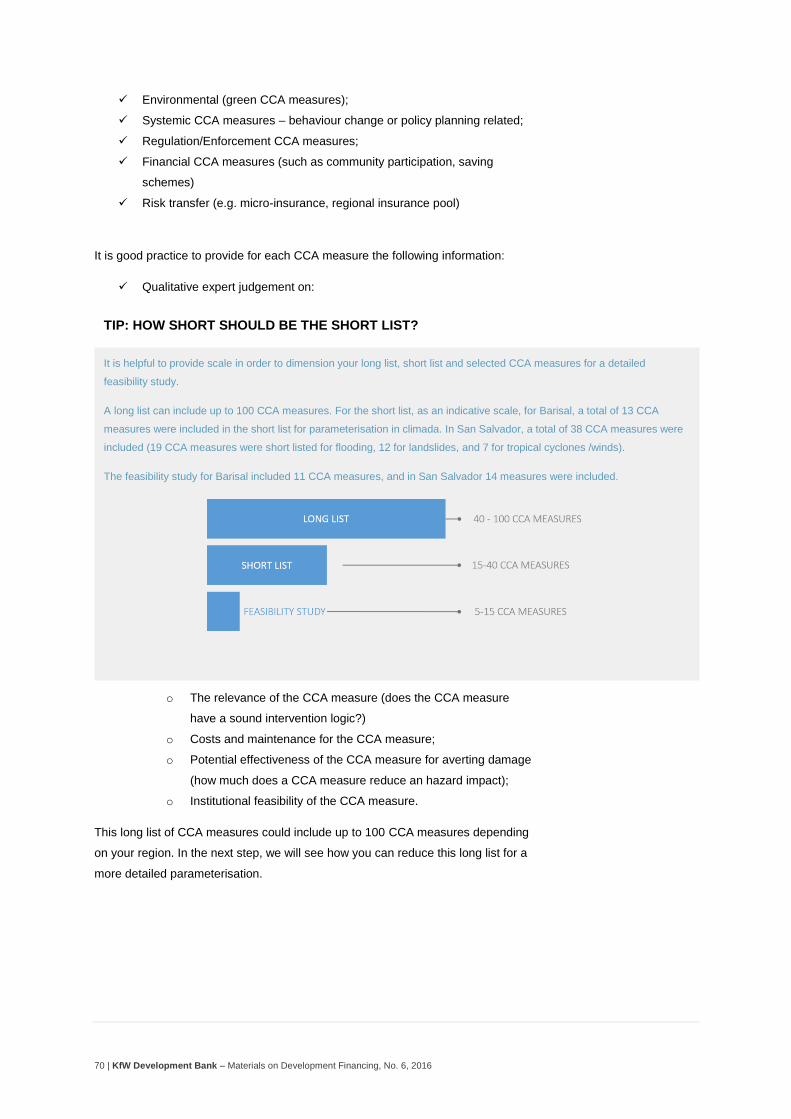
70 | KfW Development Bank – Materials on Development Financing, No. 6, 2016
Environmental (green CCA measures);
Systemic CCA measures – behaviour change or policy planning related;
Regulation/Enforcement CCA measures;
Financial CCA measures (such as community participation, saving
schemes)
Risk transfer (e.g. micro-insurance, regional insurance pool)
It is good practice to provide for each CCA measure the following information:
Qualitative expert judgement on:
o The relevance of the CCA measure (does the CCA measure
have a sound intervention logic?)
o Costs and maintenance for the CCA measure;
o Potential effectiveness of the CCA measure for averting damage
(how much does a CCA measure reduce an hazard impact);
o Institutional feasibility of the CCA measure.
This long list of CCA measures could include up to 100 CCA measures depending
on your region. In the next step, we will see how you can reduce this long list for a
more detailed parameterisation.
TIP: HOW SHORT SHOULD BE THE SHORT LIST?
It is helpful to provide scale in order to dimension your long list, short list and selected CCA measures for a detailed
feasibility study.
A long list can include up to 100 CCA measures. For the short list, as an indicative scale, for Barisal, a total of 13 CCA
measures were included in the short list for parameterisation in climada. In San Salvador, a total of 38 CCA measures were
included (19 CCA measures were short listed for flooding, 12 for landslides, and 7 for tropical cyclones /winds).
The feasibility study for Barisal included 11 CCA measures, and in San Salvador 14 measures were included.
71 | KfW Development Bank – Materials on Development Financing, No. 6, 2016
Step 2: Select most promising CCA measures to be
investigated in climada (short list)
After pre-selecting a long list of CCA measures, the most promising CCA measures
should be parameterised within climada. Because parameterisation, including costs
and impact reduction, can be very time-consuming, it is best practice to reduce the
long list of CCA measure into a short list. This short list will be further investigated
in terms of cost-benefit and impact reduction, using integrated climada facilities.
Reducing the number of long list CCA measures is not a trivial exercise, and it
should be done during a dedicated workshop with experts including city planners,
engineers, institutional experts and economists. A pre-screening of the long list of
CCA measures could be performed by external consultants following criteria
specific to the region and the political setup. In Barisal and San Salvador, this pre-
screening was followed up by a stakeholder workshop, the outcomes of which were
the inclusion of additional CCA measures (mostly green CCA measures).
Step 3: Parameterise CCA measures into climada
In this step, the short list, agreed between all stakeholders need to be
parameterised into climada. Like other modelling tools, climada will “run” all CCA
measures and compare their performance against different hazards and different
scenarios and allow you to compare CCA measures with one another. However,
note that it is not possible to model how measures will influence one another.
Parameterisation means that several “parameters”, unique to a given CCA
measure, will be entered in climada, using a pre-defined format in Excel. Additional
information on how to parameterise CCA measures into climada are provided in the
climada manual.
These parameters include:
The cost of a particular CCA measure
o The cost of implementing a CCA measure including its
maintenance costs. The costs are in the same currency as the
asset value.
The impact of this CCA measure on hazard intensity
BOX: RELATIONSHIP BETWEEN AVOIDED DAMAGE AND SAVED PERSONS
The best risk reduction measures are also the most relevant ones to prevent damage to people. This has been clearly
demonstrated in field studies for hazards such as landslide and wind. We can thus presume that there is no conflict of
interests between protecting human livelihood and protecting assets of most vulnerable populations.
In case of flood hazard, the situation is more differentiated. In this case, best practice is to consider all measures and combine
the most effective ones for both goals of reducing risks to people and risks to material assets.
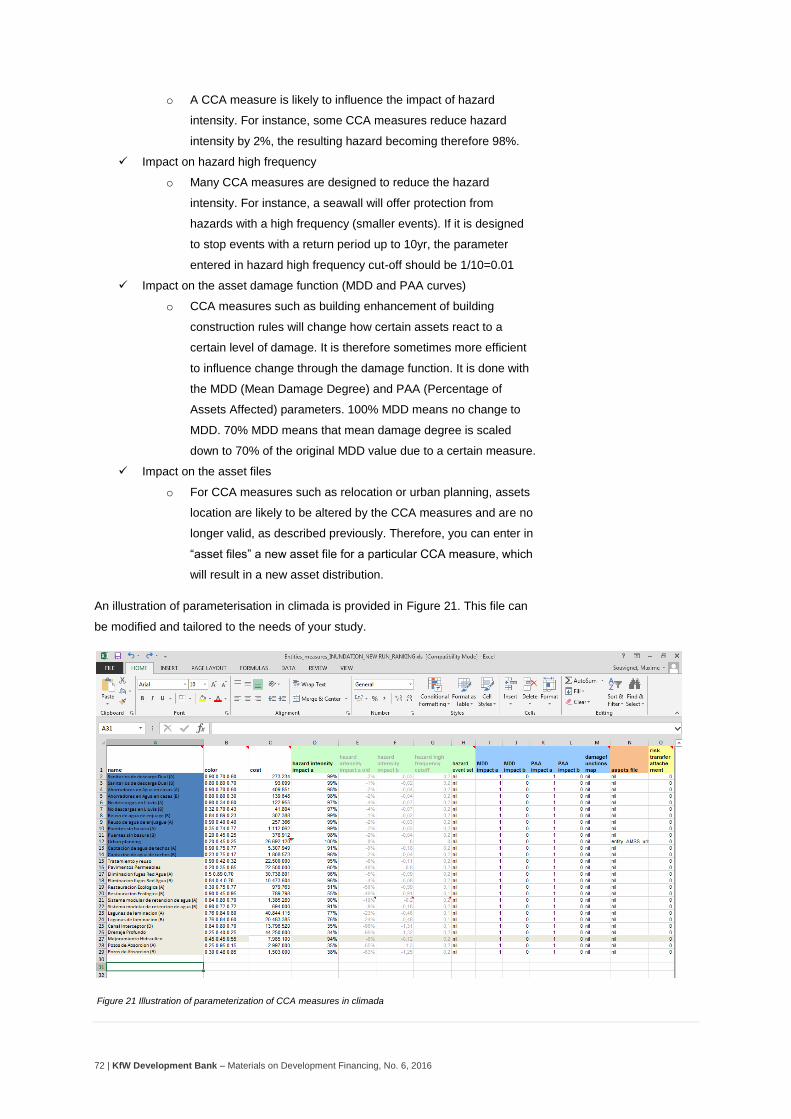
72 | KfW Development Bank – Materials on Development Financing, No. 6, 2016
o A CCA measure is likely to influence the impact of hazard
intensity. For instance, some CCA measures reduce hazard
intensity by 2%, the resulting hazard becoming therefore 98%.
Impact on hazard high frequency
o Many CCA measures are designed to reduce the hazard
intensity. For instance, a seawall will offer protection from
hazards with a high frequency (smaller events). If it is designed
to stop events with a return period up to 10yr, the parameter
entered in hazard high frequency cut-off should be 1/10=0.01
Impact on the asset damage function (MDD and PAA curves)
o CCA measures such as building enhancement of building
construction rules will change how certain assets react to a
certain level of damage. It is therefore sometimes more efficient
to influence change through the damage function. It is done with
the MDD (Mean Damage Degree) and PAA (Percentage of
Assets Affected) parameters. 100% MDD means no change to
MDD. 70% MDD means that mean damage degree is scaled
down to 70% of the original MDD value due to a certain measure.
Impact on the asset files
o For CCA measures such as relocation or urban planning, assets
location are likely to be altered by the CCA measures and are no
longer valid, as described previously. Therefore, you can enter in
“asset files” a new asset file for a particular CCA measure, which
will result in a new asset distribution.
An illustration of parameterisation in climada is provided in Figure 21. This file can
be modified and tailored to the needs of your study.
Figure 21 Illustration of parameterization of CCA measures in climada
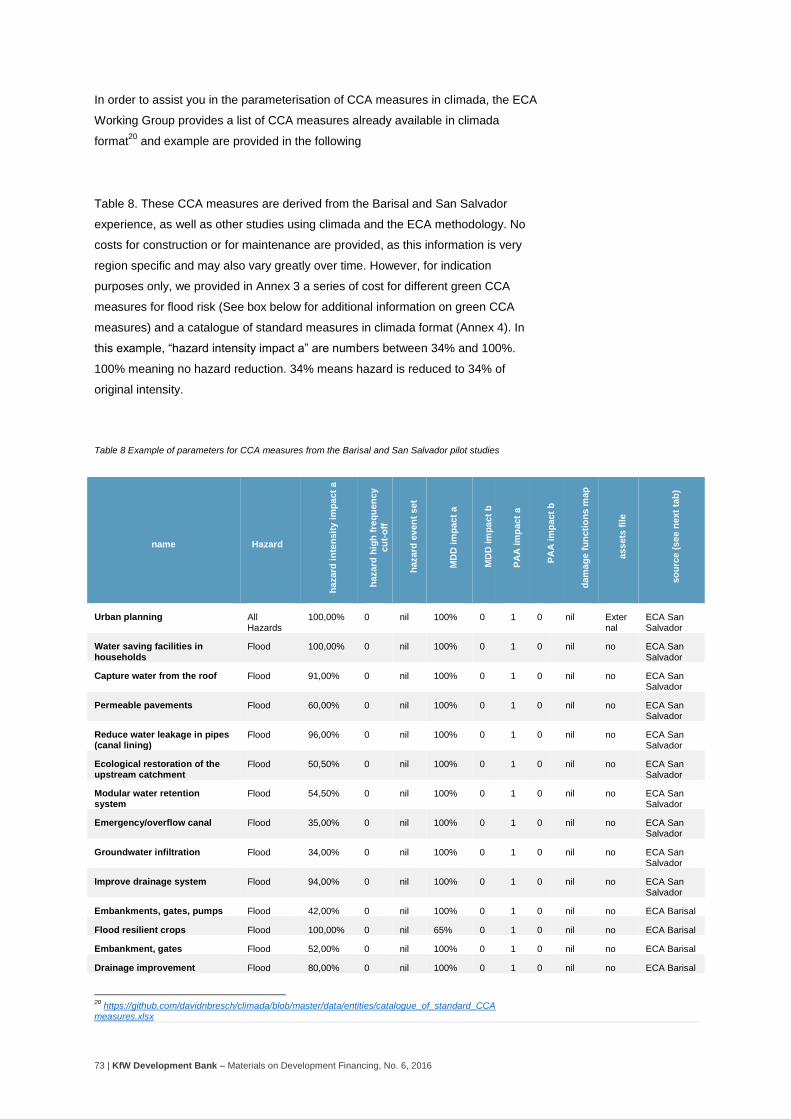
73 | KfW Development Bank – Materials on Development Financing, No. 6, 2016
In order to assist you in the parameterisation of CCA measures in climada, the ECA
Working Group provides a list of CCA measures already available in climada
format20
and example are provided in the following
Table 8. These CCA measures are derived from the Barisal and San Salvador
experience, as well as other studies using climada and the ECA methodology. No
costs for construction or for maintenance are provided, as this information is very
region specific and may also vary greatly over time. However, for indication
purposes only, we provided in Annex 3 a series of cost for different green CCA
measures for flood risk (See box below for additional information on green CCA
measures) and a catalogue of standard measures in climada format (Annex 4). In
this example, “hazard intensity impact a” are numbers between 34% and 100%.
100% meaning no hazard reduction. 34% means hazard is reduced to 34% of
original intensity.
Table 8 Example of parameters for CCA measures from the Barisal and San Salvador pilot studies
name Hazard
hazard
in
ten
sit
y i
mp
act
a
hazard
hig
h f
req
uen
cy
cu
t-o
ff
hazard
ev
en
t s
et
MD
D im
pa
ct
a
MD
D im
pa
ct
b
PA
A im
pact
a
PA
A im
pact
b
dam
ag
e f
un
cti
on
s m
ap
ass
ets
fil
e
so
urc
e (
see n
ext
tab
)
Urban planning All Hazards
100,00% 0 nil 100% 0 1 0 nil External
ECA San Salvador
Water saving facilities in households
Flood 100,00% 0 nil 100% 0 1 0 nil no ECA San Salvador
Capture water from the roof Flood 91,00% 0 nil 100% 0 1 0 nil no ECA San Salvador
Permeable pavements Flood 60,00% 0 nil 100% 0 1 0 nil no ECA San Salvador
Reduce water leakage in pipes (canal lining)
Flood 96,00% 0 nil 100% 0 1 0 nil no ECA San Salvador
Ecological restoration of the upstream catchment
Flood 50,50% 0 nil 100% 0 1 0 nil no ECA San Salvador
Modular water retention system
Flood 54,50% 0 nil 100% 0 1 0 nil no ECA San Salvador
Emergency/overflow canal Flood 35,00% 0 nil 100% 0 1 0 nil no ECA San Salvador
Groundwater infiltration Flood 34,00% 0 nil 100% 0 1 0 nil no ECA San Salvador
Improve drainage system Flood 94,00% 0 nil 100% 0 1 0 nil no ECA San Salvador
Embankments, gates, pumps Flood 42,00% 0 nil 100% 0 1 0 nil no ECA Barisal
Flood resilient crops Flood 100,00% 0 nil 65% 0 1 0 nil no ECA Barisal
Embankment, gates Flood 52,00% 0 nil 100% 0 1 0 nil no ECA Barisal
Drainage improvement Flood 80,00% 0 nil 100% 0 1 0 nil no ECA Barisal
20
https://github.com/davidnbresch/climada/blob/master/data/entities/catalogue_of_standard_CCA measures.xlsx

74 | KfW Development Bank – Materials on Development Financing, No. 6, 2016
Canal deepening Flood 87,00% 0 nil 100% 0 1 0 nil no ECA Barisal
Canal widening Flood 81,00% 0 nil 100% 0 1 0 nil no ECA Barisal
Rain water infiltration Flood 96,00% 0 nil 100% 0 1 0 nil no ECA Barisal
Regular embankments Flood 70,00% 0 nil 100% 0 1 0 nil no ECA Barisal
River erosion control Flood 82,00% 0 nil 100% 0 1 0 nil no ECA Barisal
Additional ponds for infiltration
Flood 98,00% 0 nil 100% 0 1 0 nil no ECA Barisal
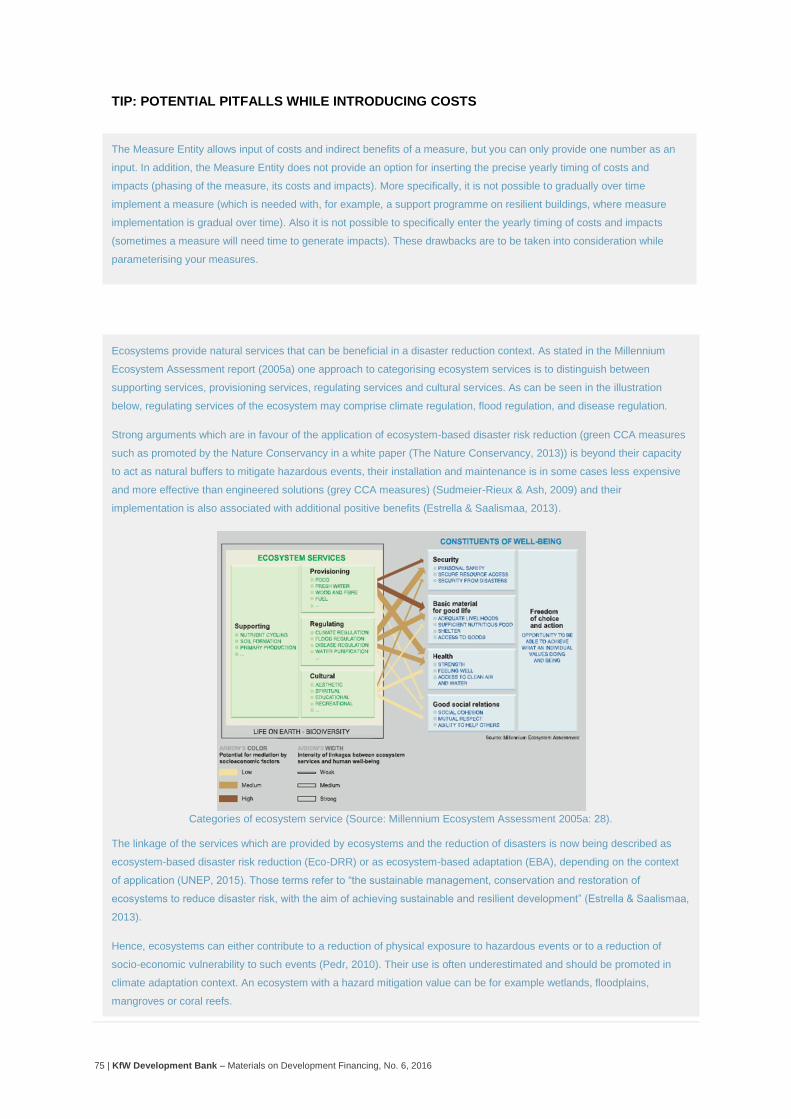
75 | KfW Development Bank – Materials on Development Financing, No. 6, 2016
BOX: PROMOTING GREEN CCA MEASURES
Ecosystems provide natural services that can be beneficial in a disaster reduction context. As stated in the Millennium
Ecosystem Assessment report (2005a) one approach to categorising ecosystem services is to distinguish between
supporting services, provisioning services, regulating services and cultural services. As can be seen in the illustration
below, regulating services of the ecosystem may comprise climate regulation, flood regulation, and disease regulation.
Strong arguments which are in favour of the application of ecosystem-based disaster risk reduction (green CCA measures
such as promoted by the Nature Conservancy in a white paper (The Nature Conservancy, 2013)) is beyond their capacity
to act as natural buffers to mitigate hazardous events, their installation and maintenance is in some cases less expensive
and more effective than engineered solutions (grey CCA measures) (Sudmeier-Rieux & Ash, 2009) and their
implementation is also associated with additional positive benefits (Estrella & Saalismaa, 2013).
Categories of ecosystem service (Source: Millennium Ecosystem Assessment 2005a: 28).
The linkage of the services which are provided by ecosystems and the reduction of disasters is now being described as
ecosystem-based disaster risk reduction (Eco-DRR) or as ecosystem-based adaptation (EBA), depending on the context
of application (UNEP, 2015). Those terms refer to “the sustainable management, conservation and restoration of
ecosystems to reduce disaster risk, with the aim of achieving sustainable and resilient development” (Estrella & Saalismaa,
2013).
Hence, ecosystems can either contribute to a reduction of physical exposure to hazardous events or to a reduction of
socio-economic vulnerability to such events (Pedr, 2010). Their use is often underestimated and should be promoted in
climate adaptation context. An ecosystem with a hazard mitigation value can be for example wetlands, floodplains,
mangroves or coral reefs.
TIP: POTENTIAL PITFALLS WHILE INTRODUCING COSTS
The Measure Entity allows input of costs and indirect benefits of a measure, but you can only provide one number as an
input. In addition, the Measure Entity does not provide an option for inserting the precise yearly timing of costs and
impacts (phasing of the measure, its costs and impacts). More specifically, it is not possible to gradually over time
implement a measure (which is needed with, for example, a support programme on resilient buildings, where measure
implementation is gradual over time). Also it is not possible to specifically enter the yearly timing of costs and impacts
(sometimes a measure will need time to generate impacts). These drawbacks are to be taken into consideration while
parameterising your measures.
76 | KfW Development Bank – Materials on Development Financing, No. 6, 2016
Step 4: Simulate and validate results with historical
observation for different scenarios
Once you have parameterised your CCA measures into climada, it is important to
validate your results (as for other Phases) against historic data. In order to validate
your results, you should first “run” your climada simulation, including assets,
hazards and damage functions previously validated. You will include CCA
measures in them and have a look at how these CCA measures influence the total
damage to your asset. Based on the information you might have collected during
the workshop, but also on literature review and on expert knowledge, you will be
able to judge if these simulations results (in terms of averted damage) are in the
right order of magnitude. You should repeat this step as long as you think that your
CCA measures are too optimistic. For instance, it is quite likely that you have
overestimated the effect of one CCA measure on an asset category if this CCA
measure reduces hazards impact by 90% or 100%.
TIP: THE IMPORTANCE OF MODEL VALIDATION
Validation is a time-consuming process because extensive analysis is needed to verify the results. Without validation,
modellers build less knowledge on the sensitivity of the inputs. Through ‘playing around with the model’, knowledge is
obtained on which areas, inputs and/or measures are most important. This would benefit the optimisation process, building
knowledge on where to reduce uncertainty and, more importantly, when measures are most effective.
With the experience in Barisal, several approaches were developed for the validation exercise. One can compare the
expected hazard damage (Annual Expected Damage, AED) with the total value of assets at risk (Direct Exposure Value,
DEV) in the baseline scenario and under implementation of the measures:
- For the baseline scenario, check for each grid cell and asset class whether the AED/DEV ratio is higher than one.
The related intuition is that an asset can only be damaged once. If the ratio is higher, the baseline damage is
overestimated.
- For the baseline scenario, check whether the simulated AED/DEV ratios already occur somewhere in the project
area. The related intuition is that when an asset gets damaged very frequently, the asset owner will likely stop
rebuilding/repairing the asset. The AED/DEV ratio shouldn’t significantly exceed the ratios currently observed in
practice. Otherwise, the baseline damage is overestimated.
- Check whether the AED/DEV ratio as realised through implementing a measure is realistic: is it possible to
completely negate all damage? How does this relate to what can be observed in practice?
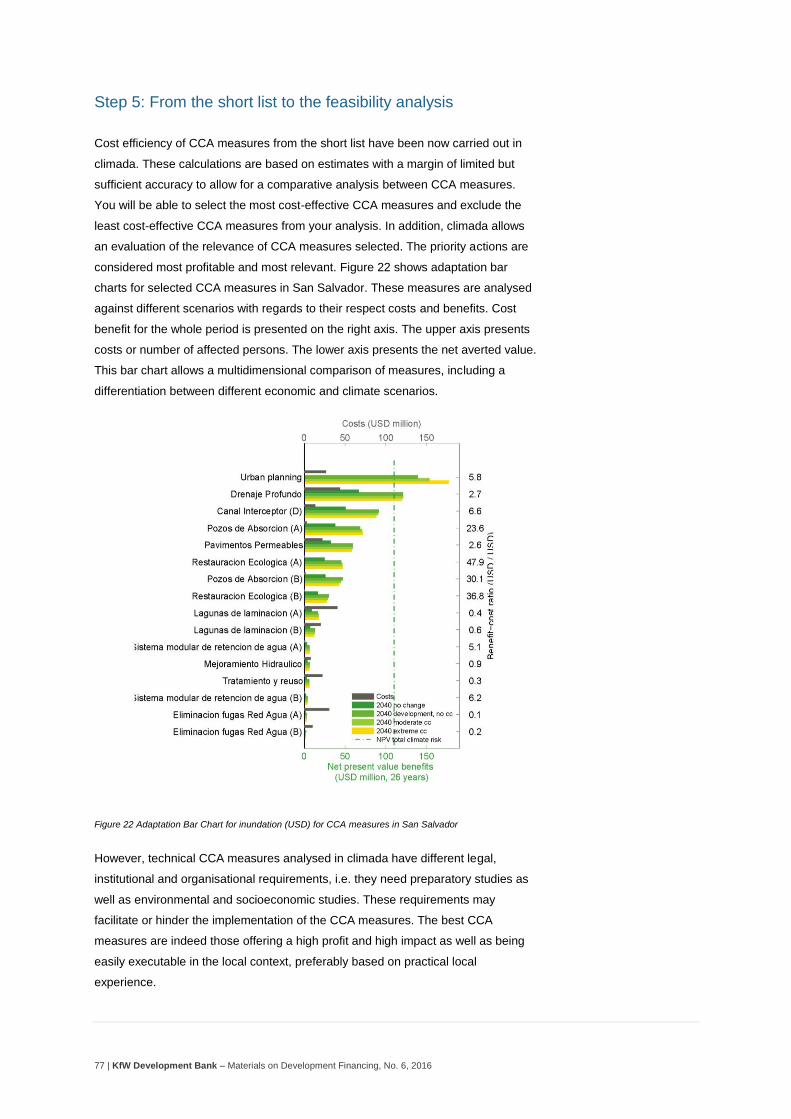
77 | KfW Development Bank – Materials on Development Financing, No. 6, 2016
Step 5: From the short list to the feasibility analysis
Cost efficiency of CCA measures from the short list have been now carried out in
climada. These calculations are based on estimates with a margin of limited but
sufficient accuracy to allow for a comparative analysis between CCA measures.
You will be able to select the most cost-effective CCA measures and exclude the
least cost-effective CCA measures from your analysis. In addition, climada allows
an evaluation of the relevance of CCA measures selected. The priority actions are
considered most profitable and most relevant. Figure 22 shows adaptation bar
charts for selected CCA measures in San Salvador. These measures are analysed
against different scenarios with regards to their respect costs and benefits. Cost
benefit for the whole period is presented on the right axis. The upper axis presents
costs or number of affected persons. The lower axis presents the net averted value.
This bar chart allows a multidimensional comparison of measures, including a
differentiation between different economic and climate scenarios.
Figure 22 Adaptation Bar Chart for inundation (USD) for CCA measures in San Salvador
However, technical CCA measures analysed in climada have different legal,
institutional and organisational requirements, i.e. they need preparatory studies as
well as environmental and socioeconomic studies. These requirements may
facilitate or hinder the implementation of the CCA measures. The best CCA
measures are indeed those offering a high profit and high impact as well as being
easily executable in the local context, preferably based on practical local
experience.
78 | KfW Development Bank – Materials on Development Financing, No. 6, 2016
The objective of the feasibility study is therefore to examine in greater detail the
CCA measures from the short list tested in climada. In the feasibility study, the
analysis of priority CCA measures focuses on the following aspects:
Which level of investment is suggested for each CCA measure within the
framework of the project?
Which level of investment is viable at various implementation levels
(national, local, community)?
Which implementation modalities are recommended for each CCA
measure: institutional responsibility, requirements for tenders and for
implementation contracts, participation of the target group?
Which technical or institutional support is required for efficient
implementation and sustainability?
Which technical, social and environmental risks must be considered
during implementation of the CCA measures?
Which CCA measures can be implemented in a complementary manner or
collectively (packages of CCA measures)?
Thus, the definitive inclusion of CCA measures into the final project proposal is a
further result of the feasibility phase. The feasibility of implementation is a criterion
that can only be assessed qualitatively on the basis of expert opinion. The quality
criteria we have incorporated for this purpose are as follows:
Policies:
o Alignment of CCA measures with national policies
o Studies: Extensive technical studies required or not
Environmental impact studies required or not:
o Previous experience exist in the country
o Skills and entrepreneurial capacities exist in the country
o Technical supervision capacity exists in public administration
o Technical standards for the CCA measure in the country are in
place
Risks:
o High risk of socio-cultural or community resistance to the CCA
measure
o Technical risks
Best practice in your feasibility report shows that a good structure is key to later
communication of your findings. Below, we provide an example of a structure for
your feasibility report:
In your feasibility study, the following sections should be integrated:
1) Context
i. Regional
ii. Socio-economic
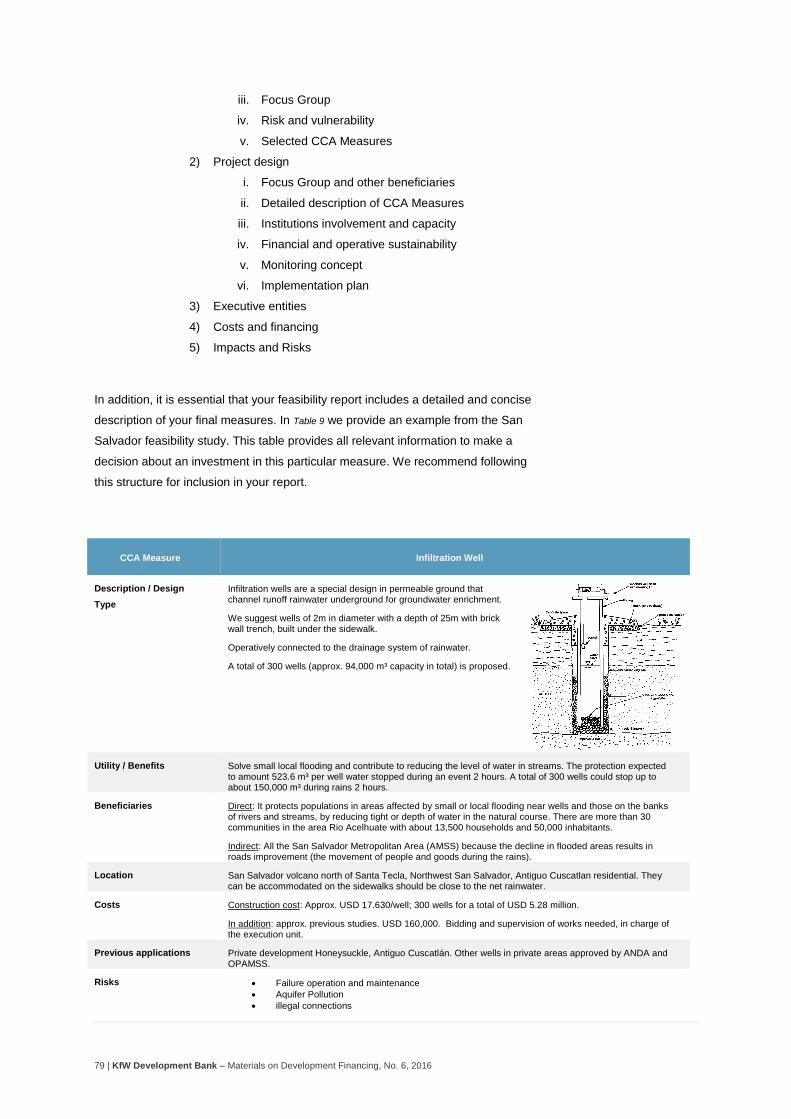
79 | KfW Development Bank – Materials on Development Financing, No. 6, 2016
iii. Focus Group
iv. Risk and vulnerability
v. Selected CCA Measures
2) Project design
i. Focus Group and other beneficiaries
ii. Detailed description of CCA Measures
iii. Institutions involvement and capacity
iv. Financial and operative sustainability
v. Monitoring concept
vi. Implementation plan
3) Executive entities
4) Costs and financing
5) Impacts and Risks
In addition, it is essential that your feasibility report includes a detailed and concise
description of your final measures. In Table 9 we provide an example from the San
Salvador feasibility study. This table provides all relevant information to make a
decision about an investment in this particular measure. We recommend following
this structure for inclusion in your report.
CCA Measure Infiltration Well
Description / Design
Type
Infiltration wells are a special design in permeable ground that channel runoff rainwater underground for groundwater enrichment.
We suggest wells of 2m in diameter with a depth of 25m with brick wall trench, built under the sidewalk.
Operatively connected to the drainage system of rainwater.
A total of 300 wells (approx. 94,000 m³ capacity in total) is proposed.
Utility / Benefits Solve small local flooding and contribute to reducing the level of water in streams. The protection expected to amount 523.6 m³ per well water stopped during an event 2 hours. A total of 300 wells could stop up to about 150,000 m³ during rains 2 hours.
Beneficiaries Direct: It protects populations in areas affected by small or local flooding near wells and those on the banks of rivers and streams, by reducing tight or depth of water in the natural course. There are more than 30 communities in the area Rio Acelhuate with about 13,500 households and 50,000 inhabitants.
Indirect: All the San Salvador Metropolitan Area (AMSS) because the decline in flooded areas results in roads improvement (the movement of people and goods during the rains).
Location San Salvador volcano north of Santa Tecla, Northwest San Salvador, Antiguo Cuscatlan residential. They can be accommodated on the sidewalks should be close to the net rainwater.
Costs Construction cost: Approx. USD 17.630/well; 300 wells for a total of USD 5.28 million.
In addition: approx. previous studies. USD 160,000. Bidding and supervision of works needed, in charge of the execution unit.
Previous applications Private development Honeysuckle, Antiguo Cuscatlán. Other wells in private areas approved by ANDA and OPAMSS.
Risks Failure operation and maintenance
Aquifer Pollution
illegal connections
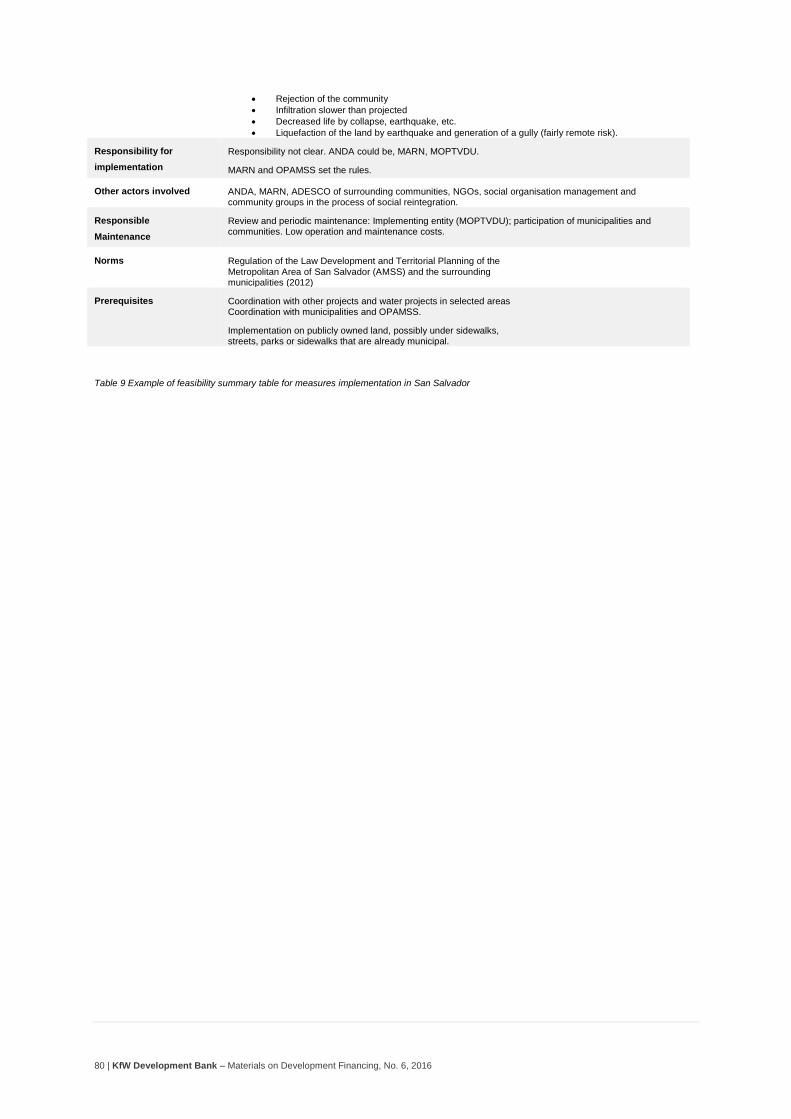
80 | KfW Development Bank – Materials on Development Financing, No. 6, 2016
Rejection of the community
Infiltration slower than projected
Decreased life by collapse, earthquake, etc.
Liquefaction of the land by earthquake and generation of a gully (fairly remote risk).
Responsibility for
implementation
Responsibility not clear. ANDA could be, MARN, MOPTVDU.
MARN and OPAMSS set the rules.
Other actors involved ANDA, MARN, ADESCO of surrounding communities, NGOs, social organisation management and community groups in the process of social reintegration.
Responsible
Maintenance
Review and periodic maintenance: Implementing entity (MOPTVDU); participation of municipalities and communities. Low operation and maintenance costs.
Norms Regulation of the Law Development and Territorial Planning of the Metropolitan Area of San Salvador (AMSS) and the surrounding municipalities (2012)
Prerequisites Coordination with other projects and water projects in selected areas Coordination with municipalities and OPAMSS.
Implementation on publicly owned land, possibly under sidewalks, streets, parks or sidewalks that are already municipal.
Table 9 Example of feasibility summary table for measures implementation in San Salvador
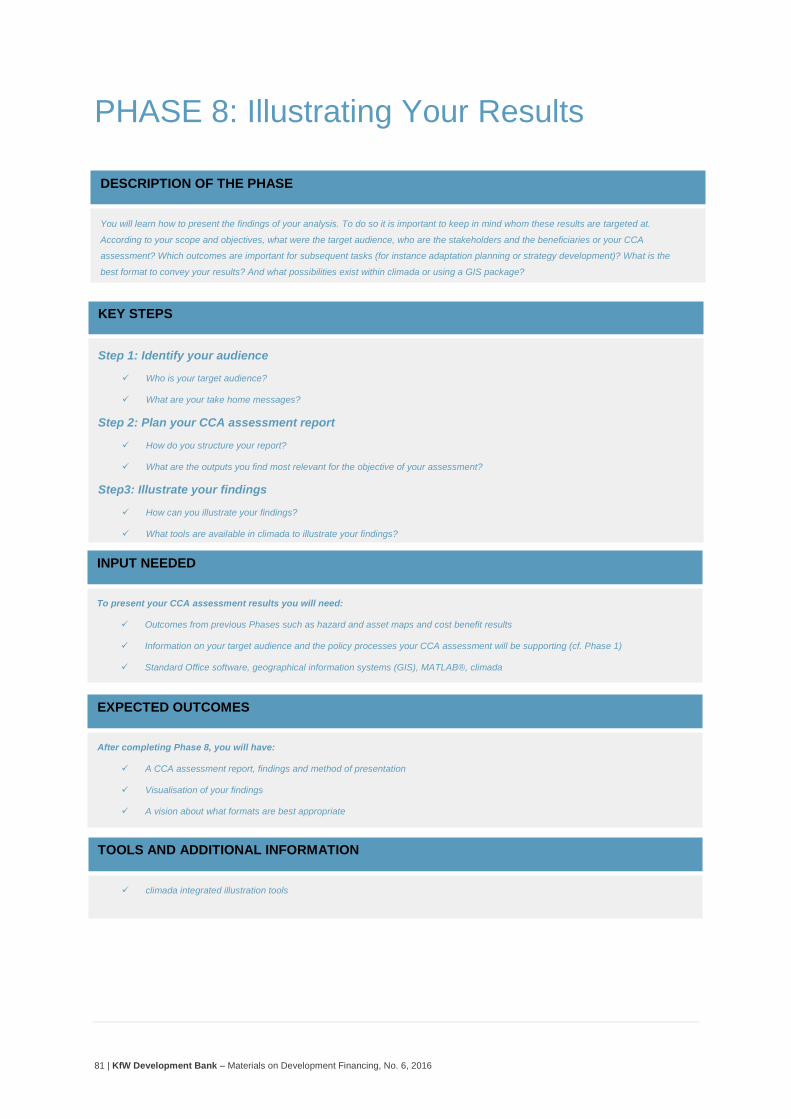
81 | KfW Development Bank – Materials on Development Financing, No. 6, 2016
PHASE 8: Illustrating Your Results
DESCRIPTION OF THE PHASE
You will learn how to present the findings of your analysis. To do so it is important to keep in mind whom these results are targeted at.
According to your scope and objectives, what were the target audience, who are the stakeholders and the beneficiaries or your CCA
assessment? Which outcomes are important for subsequent tasks (for instance adaptation planning or strategy development)? What is the
best format to convey your results? And what possibilities exist within climada or using a GIS package?
KEY STEPS
Step 1: Identify your audience
Who is your target audience?
What are your take home messages?
Step 2: Plan your CCA assessment report
How do you structure your report?
What are the outputs you find most relevant for the objective of your assessment?
Step3: Illustrate your findings
How can you illustrate your findings?
What tools are available in climada to illustrate your findings?
INPUT NEEDED
To present your CCA assessment results you will need:
Outcomes from previous Phases such as hazard and asset maps and cost benefit results
Information on your target audience and the policy processes your CCA assessment will be supporting (cf. Phase 1)
Standard Office software, geographical information systems (GIS), MATLAB®, climada
EXPECTED OUTCOMES
After completing Phase 8, you will have:
A CCA assessment report, findings and method of presentation
Visualisation of your findings
A vision about what formats are best appropriate
TOOLS AND ADDITIONAL INFORMATION
climada integrated illustration tools
82 | KfW Development Bank – Materials on Development Financing, No. 6, 2016
Getting Started
There are numerous ways to present the outcomes of a CCA assessment. One of
the most important conveyors of your output will be your CCA report. This report
should provide a clear description of the objectives, the methods as well as the key
findings. Ideally, this document will give your audience a comprehensive overview,
with all necessary background information needed to understand your outputs.
Illustrating your results is also paramount to communicating your outputs. The right
figure or diagram can be used in many different ways and is potentially an efficient
mean of communication. In this regard, climada offers a unique spatial approach
which enables possibilities in illustrating results, therefore beneficial to the decision
process.
Before compiling your report, it is important to consider a few aspects regarding
your audience (Step 1) and to plan carefully your report (Step 2). Finally, in Step 3,
we will explore what illustrations serve best your objectives while targeting your
audience.
Step 1: Identify your audience
It is important to adapt your report to those who will support the CCA assessment.
The language level, style and content of your report should be appropriate to your
audience. If you are targeting external decision makers, it is important that you
consider their own objectives and how they interact with your assessment. Equally,
it is essential that you tailor the technical level of your report to your target
audience: technical jargon should be avoided or explained in a glossary if not
avoidable.
In general, decision makers and/or policy makers are used to contained, well-
structured documents with the most important information and final results
delivered in key points. Professional or scientists, on the other hand, require a
higher level of details, and are often interested in details about the methodology or
the data you have used. In any cases, a summary is mandatory, and if you address
a mixed audience, it is advisable to provide a summary tailored for decision and
policy makers at the beginning.
Take-home messages?
Very often, you will find your assessment to provide a plethora of outputs. It is
important to select the one you want your audience to “take home”. In the same
vein, you are likely to produce ones which you didn’t expect at the beginning of the
assessment – sometimes they are even counterintuitive. Don’t miss the opportunity
to convey those as well. Challenges in an assessment are always an important
source of knowledge and potentially have a high learning effect, if presented
adequately.
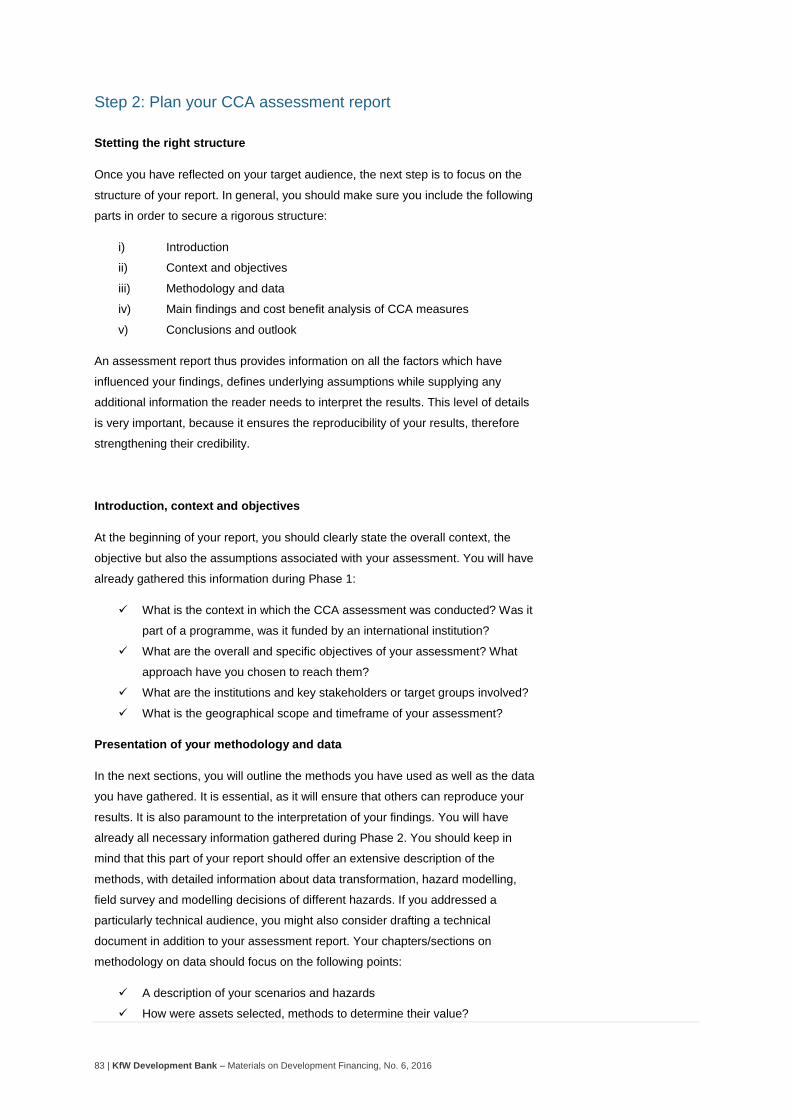
83 | KfW Development Bank – Materials on Development Financing, No. 6, 2016
Step 2: Plan your CCA assessment report
Stetting the right structure
Once you have reflected on your target audience, the next step is to focus on the
structure of your report. In general, you should make sure you include the following
parts in order to secure a rigorous structure:
i) Introduction
ii) Context and objectives
iii) Methodology and data
iv) Main findings and cost benefit analysis of CCA measures
v) Conclusions and outlook
An assessment report thus provides information on all the factors which have
influenced your findings, defines underlying assumptions while supplying any
additional information the reader needs to interpret the results. This level of details
is very important, because it ensures the reproducibility of your results, therefore
strengthening their credibility.
Introduction, context and objectives
At the beginning of your report, you should clearly state the overall context, the
objective but also the assumptions associated with your assessment. You will have
already gathered this information during Phase 1:
What is the context in which the CCA assessment was conducted? Was it
part of a programme, was it funded by an international institution?
What are the overall and specific objectives of your assessment? What
approach have you chosen to reach them?
What are the institutions and key stakeholders or target groups involved?
What is the geographical scope and timeframe of your assessment?
Presentation of your methodology and data
In the next sections, you will outline the methods you have used as well as the data
you have gathered. It is essential, as it will ensure that others can reproduce your
results. It is also paramount to the interpretation of your findings. You will have
already all necessary information gathered during Phase 2. You should keep in
mind that this part of your report should offer an extensive description of the
methods, with detailed information about data transformation, hazard modelling,
field survey and modelling decisions of different hazards. If you addressed a
particularly technical audience, you might also consider drafting a technical
document in addition to your assessment report. Your chapters/sections on
methodology on data should focus on the following points:
A description of your scenarios and hazards
How were assets selected, methods to determine their value?
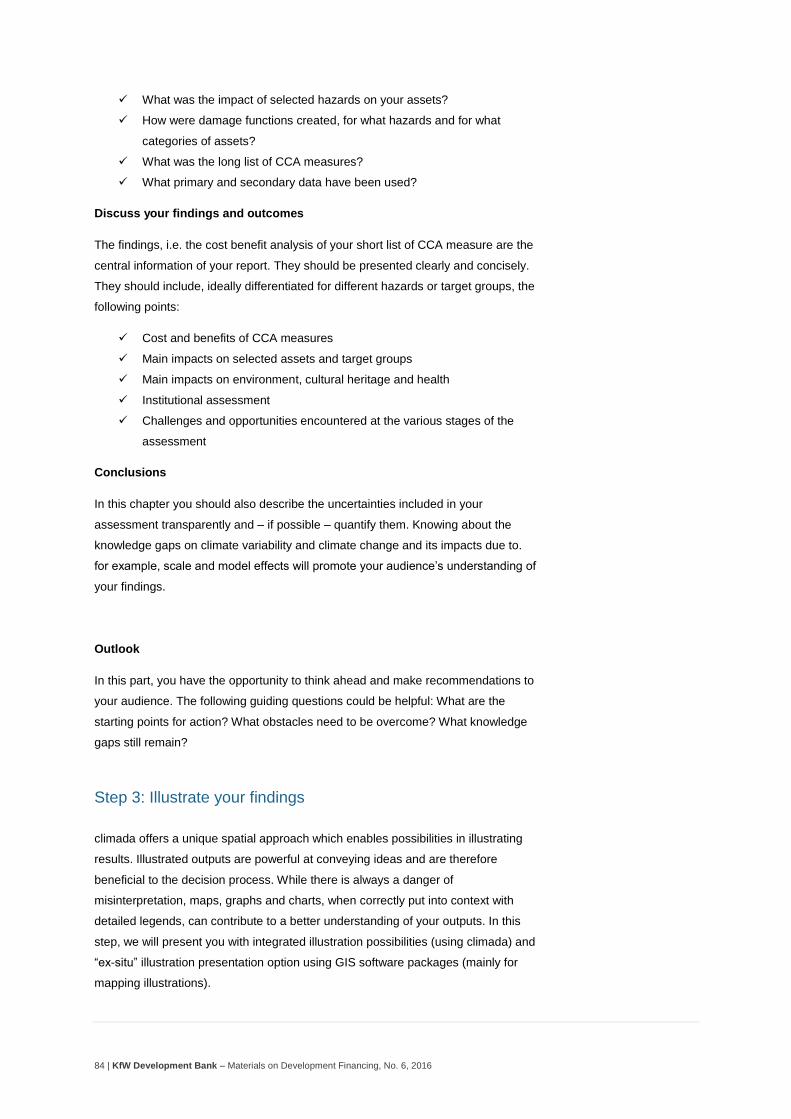
84 | KfW Development Bank – Materials on Development Financing, No. 6, 2016
What was the impact of selected hazards on your assets?
How were damage functions created, for what hazards and for what
categories of assets?
What was the long list of CCA measures?
What primary and secondary data have been used?
Discuss your findings and outcomes
The findings, i.e. the cost benefit analysis of your short list of CCA measure are the
central information of your report. They should be presented clearly and concisely.
They should include, ideally differentiated for different hazards or target groups, the
following points:
Cost and benefits of CCA measures
Main impacts on selected assets and target groups
Main impacts on environment, cultural heritage and health
Institutional assessment
Challenges and opportunities encountered at the various stages of the
assessment
Conclusions
In this chapter you should also describe the uncertainties included in your
assessment transparently and – if possible – quantify them. Knowing about the
knowledge gaps on climate variability and climate change and its impacts due to.
for example, scale and model effects will promote your audience’s understanding of
your findings.
Outlook
In this part, you have the opportunity to think ahead and make recommendations to
your audience. The following guiding questions could be helpful: What are the
starting points for action? What obstacles need to be overcome? What knowledge
gaps still remain?
Step 3: Illustrate your findings
climada offers a unique spatial approach which enables possibilities in illustrating
results. Illustrated outputs are powerful at conveying ideas and are therefore
beneficial to the decision process. While there is always a danger of
misinterpretation, maps, graphs and charts, when correctly put into context with
detailed legends, can contribute to a better understanding of your outputs. In this
step, we will present you with integrated illustration possibilities (using climada) and
“ex-situ” illustration presentation option using GIS software packages (mainly for
mapping illustrations).
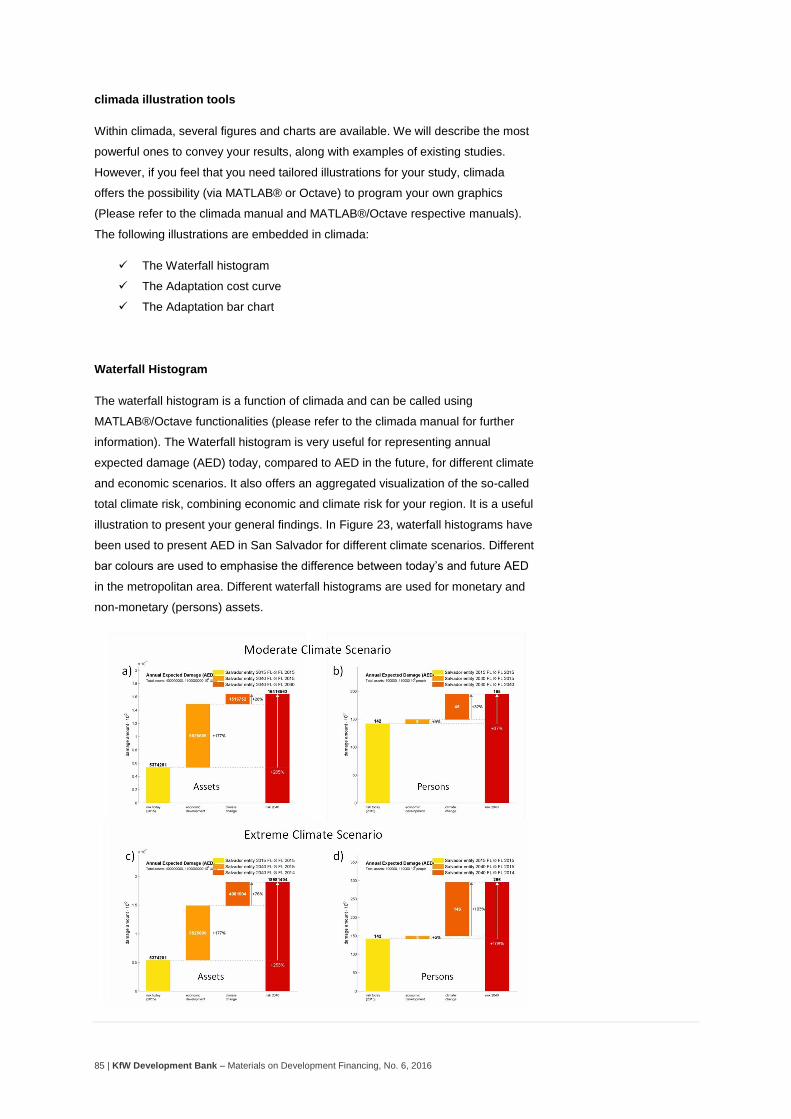
85 | KfW Development Bank – Materials on Development Financing, No. 6, 2016
climada illustration tools
Within climada, several figures and charts are available. We will describe the most
powerful ones to convey your results, along with examples of existing studies.
However, if you feel that you need tailored illustrations for your study, climada
offers the possibility (via MATLAB® or Octave) to program your own graphics
(Please refer to the climada manual and MATLAB®/Octave respective manuals).
The following illustrations are embedded in climada:
The Waterfall histogram
The Adaptation cost curve
The Adaptation bar chart
Waterfall Histogram
The waterfall histogram is a function of climada and can be called using
MATLAB®/Octave functionalities (please refer to the climada manual for further
information). The Waterfall histogram is very useful for representing annual
expected damage (AED) today, compared to AED in the future, for different climate
and economic scenarios. It also offers an aggregated visualization of the so-called
total climate risk, combining economic and climate risk for your region. It is a useful
illustration to present your general findings. In Figure 23, waterfall histograms have
been used to present AED in San Salvador for different climate scenarios. Different
bar colours are used to emphasise the difference between today’s and future AED
in the metropolitan area. Different waterfall histograms are used for monetary and
non-monetary (persons) assets.
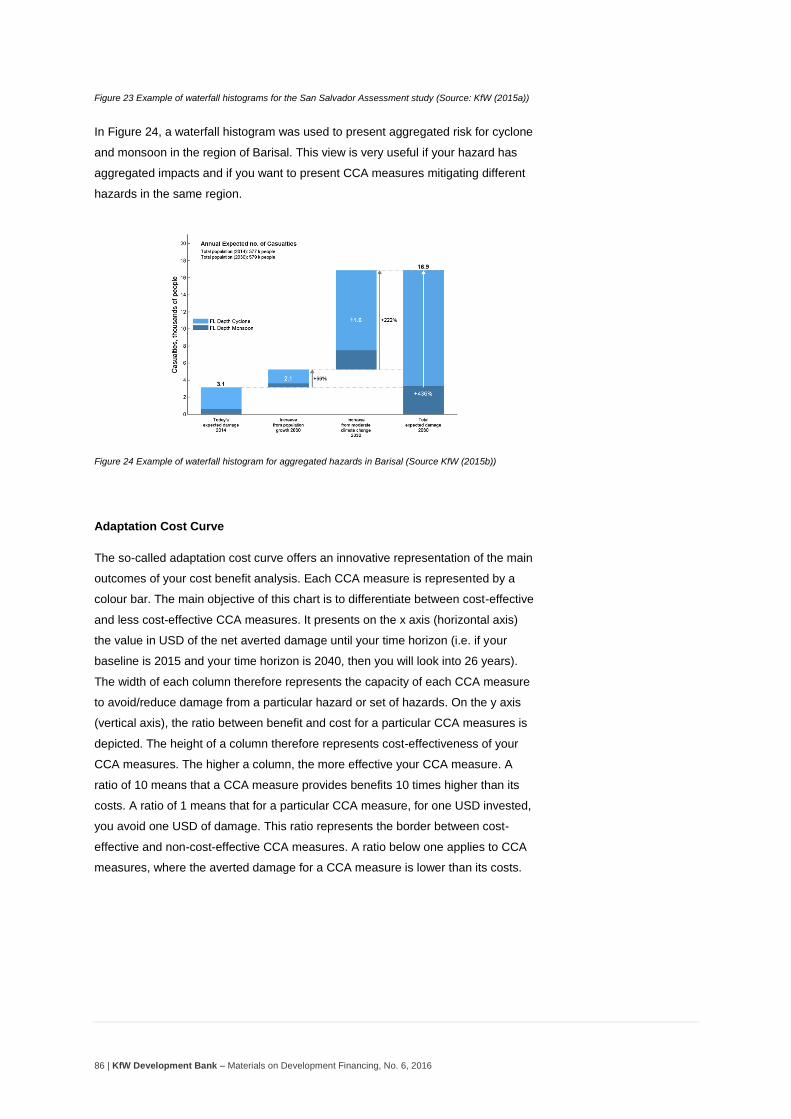
86 | KfW Development Bank – Materials on Development Financing, No. 6, 2016
Figure 23 Example of waterfall histograms for the San Salvador Assessment study (Source: KfW (2015a))
In Figure 24, a waterfall histogram was used to present aggregated risk for cyclone
and monsoon in the region of Barisal. This view is very useful if your hazard has
aggregated impacts and if you want to present CCA measures mitigating different
hazards in the same region.
Figure 24 Example of waterfall histogram for aggregated hazards in Barisal (Source KfW (2015b))
Adaptation Cost Curve
The so-called adaptation cost curve offers an innovative representation of the main
outcomes of your cost benefit analysis. Each CCA measure is represented by a
colour bar. The main objective of this chart is to differentiate between cost-effective
and less cost-effective CCA measures. It presents on the x axis (horizontal axis)
the value in USD of the net averted damage until your time horizon (i.e. if your
baseline is 2015 and your time horizon is 2040, then you will look into 26 years).
The width of each column therefore represents the capacity of each CCA measure
to avoid/reduce damage from a particular hazard or set of hazards. On the y axis
(vertical axis), the ratio between benefit and cost for a particular CCA measures is
depicted. The height of a column therefore represents cost-effectiveness of your
CCA measures. The higher a column, the more effective your CCA measure. A
ratio of 10 means that a CCA measure provides benefits 10 times higher than its
costs. A ratio of 1 means that for a particular CCA measure, for one USD invested,
you avoid one USD of damage. This ratio represents the border between cost-
effective and non-cost-effective CCA measures. A ratio below one applies to CCA
measures, where the averted damage for a CCA measure is lower than its costs.
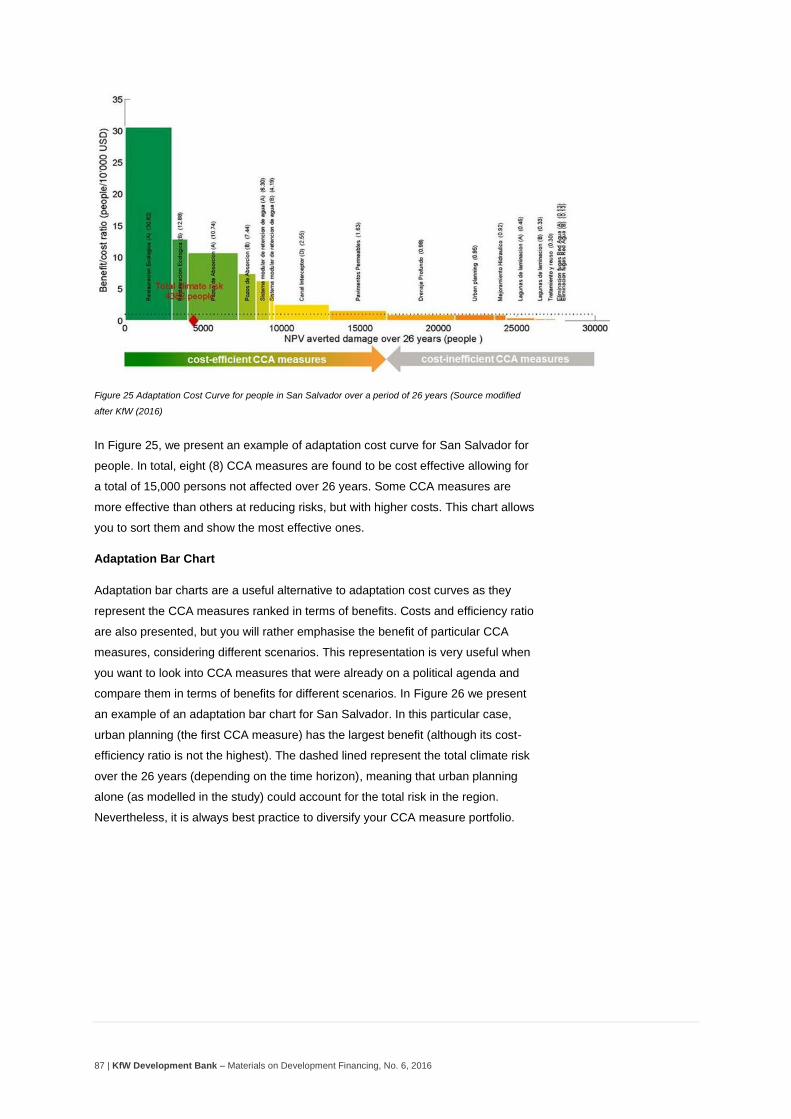
87 | KfW Development Bank – Materials on Development Financing, No. 6, 2016
Figure 25 Adaptation Cost Curve for people in San Salvador over a period of 26 years (Source modified
after KfW (2016)
In Figure 25, we present an example of adaptation cost curve for San Salvador for
people. In total, eight (8) CCA measures are found to be cost effective allowing for
a total of 15,000 persons not affected over 26 years. Some CCA measures are
more effective than others at reducing risks, but with higher costs. This chart allows
you to sort them and show the most effective ones.
Adaptation Bar Chart
Adaptation bar charts are a useful alternative to adaptation cost curves as they
represent the CCA measures ranked in terms of benefits. Costs and efficiency ratio
are also presented, but you will rather emphasise the benefit of particular CCA
measures, considering different scenarios. This representation is very useful when
you want to look into CCA measures that were already on a political agenda and
compare them in terms of benefits for different scenarios. In Figure 26 we present
an example of an adaptation bar chart for San Salvador. In this particular case,
urban planning (the first CCA measure) has the largest benefit (although its cost-
efficiency ratio is not the highest). The dashed lined represent the total climate risk
over the 26 years (depending on the time horizon), meaning that urban planning
alone (as modelled in the study) could account for the total risk in the region.
Nevertheless, it is always best practice to diversify your CCA measure portfolio.
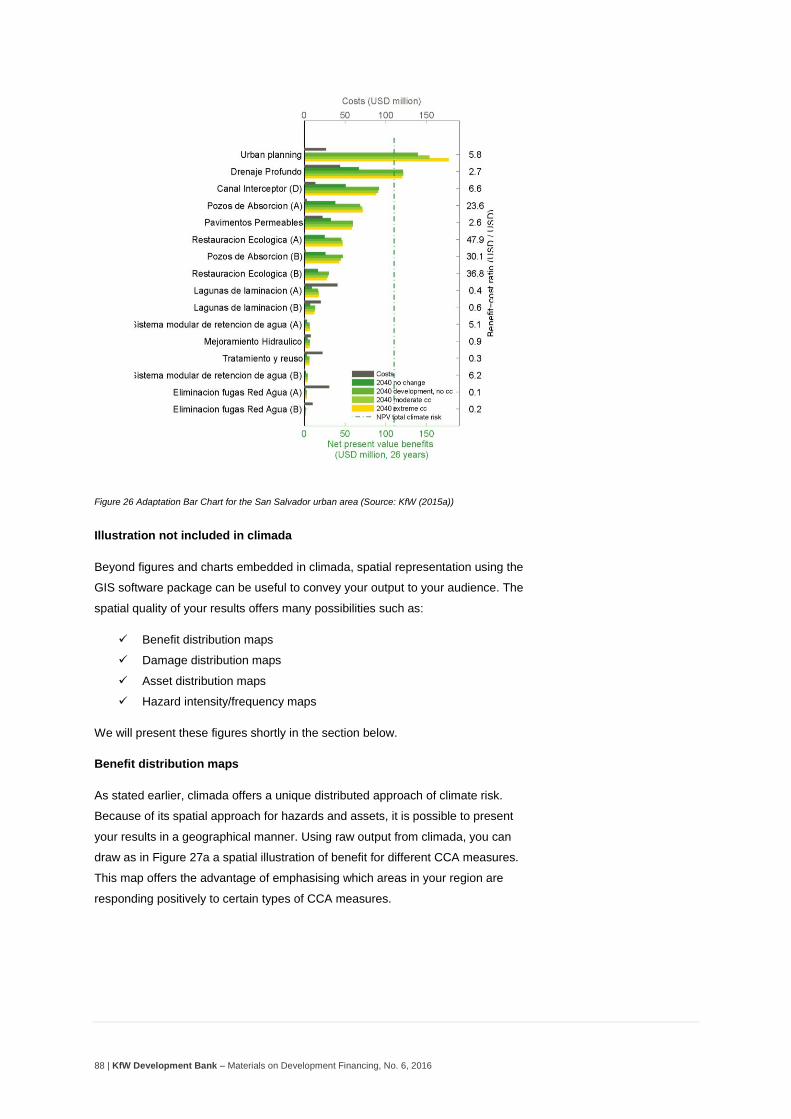
88 | KfW Development Bank – Materials on Development Financing, No. 6, 2016
Figure 26 Adaptation Bar Chart for the San Salvador urban area (Source: KfW (2015a))
Illustration not included in climada
Beyond figures and charts embedded in climada, spatial representation using the
GIS software package can be useful to convey your output to your audience. The
spatial quality of your results offers many possibilities such as:
Benefit distribution maps
Damage distribution maps
Asset distribution maps
Hazard intensity/frequency maps
We will present these figures shortly in the section below.
Benefit distribution maps
As stated earlier, climada offers a unique distributed approach of climate risk.
Because of its spatial approach for hazards and assets, it is possible to present
your results in a geographical manner. Using raw output from climada, you can
draw as in Figure 27a a spatial illustration of benefit for different CCA measures.
This map offers the advantage of emphasising which areas in your region are
responding positively to certain types of CCA measures.
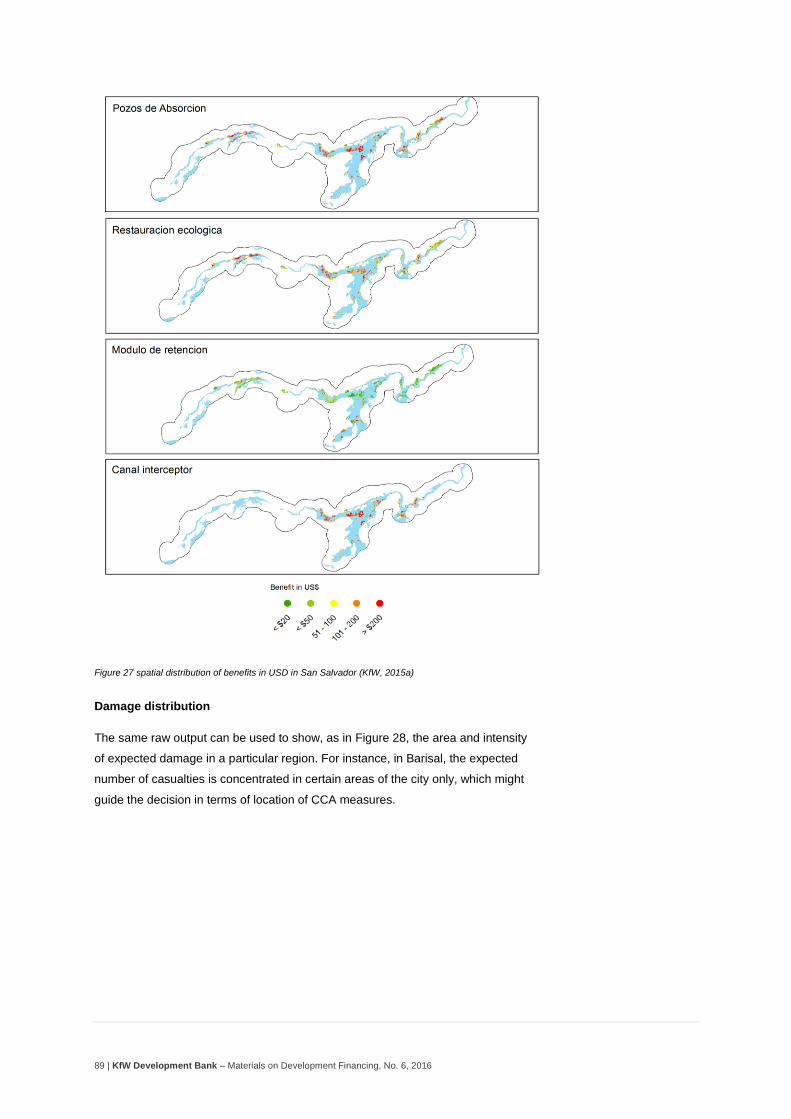
89 | KfW Development Bank – Materials on Development Financing, No. 6, 2016
Figure 27 spatial distribution of benefits in USD in San Salvador (KfW, 2015a)
Damage distribution
The same raw output can be used to show, as in Figure 28, the area and intensity
of expected damage in a particular region. For instance, in Barisal, the expected
number of casualties is concentrated in certain areas of the city only, which might
guide the decision in terms of location of CCA measures.
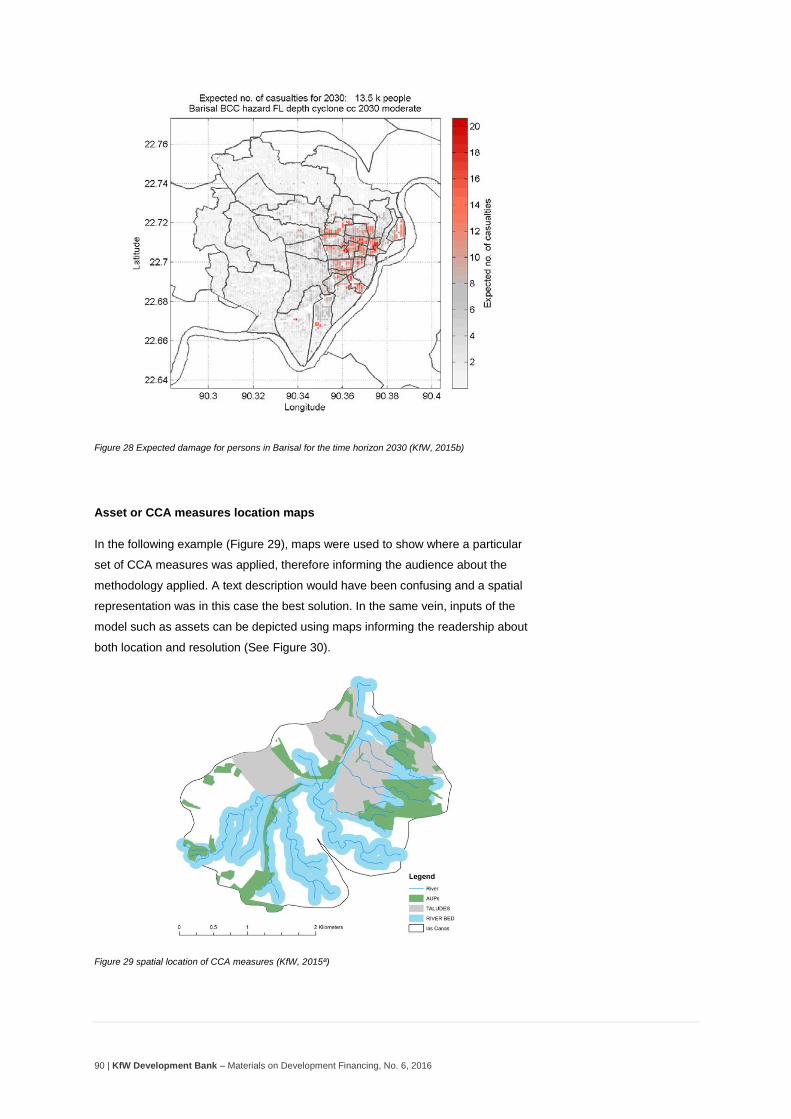
90 | KfW Development Bank – Materials on Development Financing, No. 6, 2016
Figure 28 Expected damage for persons in Barisal for the time horizon 2030 (KfW, 2015b)
Asset or CCA measures location maps
In the following example (Figure 29), maps were used to show where a particular
set of CCA measures was applied, therefore informing the audience about the
methodology applied. A text description would have been confusing and a spatial
representation was in this case the best solution. In the same vein, inputs of the
model such as assets can be depicted using maps informing the readership about
both location and resolution (See Figure 30).
Figure 29 spatial location of CCA measures (KfW, 2015ª)

91 | KfW Development Bank – Materials on Development Financing, No. 6, 2016
Figure 30 Spatial location of monetary assets in San Salvador (KfW, 2015a)
Hazard Maps
Hazard and risk maps are also a good conveyor of your message. Your audience
will often wish to visualise where the main hazards are concentrated and a hazard
map constitutes an important asset in your report. These maps are made based on
input data for climada either directly in MATLAB® or using GIS packages such as
in Figure 31.
Figure 31 Hazard map for flood risk in San Salvador for selected return periods (KfW, 2015a)
92 | KfW Development Bank – Materials on Development Financing, No. 6, 2016
Glossary
Adaptation (to climate change) IPCC AR5 definition: The process of adjustment
to actual or expected climate and its effects. In human systems, adaptation seeks
to moderate harm or exploit beneficial opportunities. In natural systems, human
intervention may facilitate adjustment to expected climate and its effects.
(EUFIWACC, 2016)
Adaptive Capacity Adaptive capacity is the ability or potential of a system to
respond successfully to climate variability and change, and includes adjustments in
both behaviour and in resources and technologies. The presence of adaptive
capacity has been shown to be a necessary condition for the design and
implementation of effective adaptation strategies so as to reduce the likelihood and
the magnitude of harmful outcomes resulting from climate change. Adaptive
capacity also enables sectors and institutions to take advantage of opportunities or
benefits from climate change, such as a longer growing season or increased
potential for tourism. (EUFIWACC, 2016)
Baseline Period The baseline (or reference) is the state against which change is
CCA measured. It might be a ‘current baseline’, in which case it represents
observable, present-day conditions. It might also be a ‘future baseline’, which is a
projected future set of conditions excluding the driving factor of interest. Alternative
interpretations of the reference conditions can give rise to multiple baselines. For
example, the Intergovernmental Panel on Climate Change (IPCC) recommends a
baseline of 1961 – 1990, and the World Meteorological Organisation (WMO)
recommends a baseline of 1981 – 2010. (EUFIWACC, 2016)
Capacity building In the context of climate change, the process of developing the
technical skills and institutional capability in developing countries and economies in
transition to enable them to address effectively the causes and results of climate
change.
93 | KfW Development Bank – Materials on Development Financing, No. 6, 2016
Climate change IPCC AR5 definition: Climate change refers to a change in the
state of the climate that can be identified (e.g., by using statistical tests) by changes
in the mean and/or the variability of its properties, and that persists for an extended
period, typically decades or longer. Climate change may be due to natural internal
processes or external forcing such as modulations of the solar cycles, volcanic
eruptions, and persistent anthropogenic changes in the composition of the
atmosphere or in land use. (EUFIWACC, 2016)
UNFCCC definition: A change of climate which is attributed directly or indirectly to
human activity that alters the composition of the global atmosphere and which is in
addition to natural climate variability observed over comparable time periods.
Climate change adaptation assessment (CCA) The process of identifying
options to adapt to climate change, and of evaluating them in terms of criteria such
as availability, benefits, costs, effectiveness, efficiency and feasibility. (EUFIWACC,
2016)
Climate change signal Observed and simulated climate change is the sum of the
forced (signal) and the natural variability (noise). (EUFIWACC, 2016)
Climate model A numerical representation of the climate system based on the
physical, chemical and biological properties of its components, their interactions
and feedback processes, and accounting for all or some of its known properties.
The climate system can be represented by models of varying complexity, that is, for
any one component or combination of components a spectrum or hierarchy of
models can be identified, differing in such aspects as the number of spatial
dimensions, the extent to which physical, chemical or biological processes are
explicitly represented, or the level at which empirical parameterisations are
involved. Climate models are applied as a research tool to study and simulate the
climate, and for operational purposes, including monthly, seasonal and inter-annual
climate predictions. (EUFIWACC, 2016)
Climate prediction A climate prediction or climate forecast is the result of an
attempt to produce an estimate of the actual evolution of the climate in the future,
e.g., at seasonal, inter-annual or long-term time scales. (EUFIWACC, 2016)
Climate variability Climate variability refers to variations in the mean state and
other statistics (such as standard deviations, statistics of extremes, etc.) of the
climate on all temporal and spatial scales beyond that of individual weather events.
Variability may be due to natural internal processes within the climate system
94 | KfW Development Bank – Materials on Development Financing, No. 6, 2016
(internal variability), or to variations in natural or anthropogenic external forcing
(external variability). (EUFIWACC, 2016)
Damage replaceable damage [ersetzbarer Verlust], e.g. damage of property (can
be repaired/rebuilt), consequential damage, like business interruption (can be
monetarily compensated). Damage can be repaired or rebuilt at a cost. The full
scale of risk management options can be employed: avoidance, prevention,
intervention and risk transfer. Therefore, an economic analysis provides a suitable
framework to assess the damage and to determine the most effective combination
of avoidance, prevention, intervention and risk transfer measures to address
damage (climada manual, 2016)
Damage function A damage function describes the relation between the intensity
of a specific hazard and the typical monetary damage caused with respect to either
a single structure (microscale) or a portfolio of structures (macroscale).
http://www.nat-hazards-earth-syst-sci.net/15/769/2015/nhess-15-769-2015.pdf
Discount rate A mathematical operation making monetary (or other) amounts
received or expended at different points in time (years) comparable across time.
The operator uses a fixed or possibly time-varying discount rate (>0) from year to
year that makes future value worth less today. In a descriptive discounting
approach one accepts the discount rates people (savers and investors) actually
apply in their day-to-day decisions (private discount rate). In a prescriptive (ethical
or normative) discounting approach the discount rate is fixed from a social
perspective, e.g. based on an ethical judgement about the interests of future
generations (social discount rate) (IPCC, 2014)
Fifth Assessment Report (AR5) The Fifth Assessment Report of the
Intergovernmental Panel on Climate Change, released in 2014.
Hazard A dangerous phenomenon, substance, human activity or condition that
may cause loss of life, injury or other health impacts, property damage, loss of
livelihoods and services, social and economic disruption, or environmental damage.
(UNISDR 2009: 17).
Loss irrevocable loss [unersetzbarer Verlust], e.g. loss of glaciers (due to warmer
climate) or loss of coastal land (due to sea level rise) or loss of precipitation (due to
changed weather patterns). Losses can only be compensated for, not re-stated or
re-placed. A risk management approach to loss does strongly suggest avoiding
95 | KfW Development Bank – Materials on Development Financing, No. 6, 2016
such losses due to their irrevocable nature. Risk management options such as
intervention or sharing of risk can only deal with some of the consequences of the
loss, not the loss itself. Irrevocable losses are uninsurable - still, some of their
consequences can be insured (e.g. glacier melt is not random, hence cannot be
insured, but the risk of a glacier lake bursting can be insured, since it's a random
event. Likely: sea level rise and the loss of coastal land cannot be insured, since it's
not random - but storm surge risk can be insured, since it's a random event)
(climada manual, 2016)
Loss and damage Loss and damage refers to negative effects of climate variability
and climate change that people have not been able to cope with or adapt to. This
includes the inability to respond adequately to climate stressors and the costs and
adverse effects associated with the adaptation and coping measures themselves.
Such costs and adverse effects can be both economic and non-economic. Loss
and damage is also related to mitigation, as the potential costs of future climate
change depend to a large extent on the intensity of climatic disruptions, which in
turn depend on mitigation efforts globally. (Warner & van der Geest 2013: 369).
http://www.inderscienceonline.com/doi/pdf/10.1504/IJGW.2013.057289
National adaptation programmes of action (NAPAs) Documents prepared by
least developed countries (LDCs) identifying urgent and immediate needs for
adapting to climate change. (EUFIWACC, 2016)
Reference Period Climate ‘normal’ are reference points used by climatologists to
compare current climatological trends to that of the past or what is considered
‘normal’. A normal is defined as the arithmetic average of a climate element (e.g.
temperature) over a 30-year period. A 30-year period is used, as it is long enough
to filter out any inter-annual variation or anomalies, but also short enough to be
able to show longer climatic trends. The current climate normal period is calculated
from 1 January 1961 to 31 December 1990. (EUFIWACC, 2016)
Resilience The ability of a system, community or society exposed to hazards to
resist, absorb, accommodate to and recover from the effects of a hazard in a timely
and efficient manner, including through the preservation and restoration of its
essential basic structures and functions. (UNISDR 2009).
Risk The potential for consequences where something of value is at stake and
where the outcome is uncertain, recognizing the diversity of values. Risk is often
represented as probability or likelihood of occurrence of hazardous events or trends
multiplied by the impacts if these events or trends occur. In this report, the term risk
96 | KfW Development Bank – Materials on Development Financing, No. 6, 2016
is often used to refer to the potential, when the outcome is uncertain, for adverse
consequences on lives, livelihoods, health, ecosystems and species, economic,
social and cultural assets, services (including environmental services) and
infrastructure. (EUFIWACC, 2016)
Risk assessment A methodology to determine the nature and extent of risk by
analysing potential hazards and evaluating existing conditions of vulnerability that
could pose a potential threat or harm to people, livelihoods and the environment on
which they depend. (Source UN-ISDR: http://www.unisdr.org/eng/library/lib-
terminology-eng%20home.htm)
Sensitivity Sensitivity is the degree to which a system is affected, either adversely
or beneficially, by climate variability or change. The effect may be direct (e.g., a
change in crop yield in response to a change in the mean, range or variability of
temperature) or indirect (e.g., damages caused by an increase in the frequency of
coastal flooding due to sea-level rise). (EUFIWACC, 2016)
Temporal average The temporal mean is the arithmetic mean of a series of values
over a time period. Assuming equidistant measuring or sampling times, it can be
computed as the sum of the values over a period divided by the number of values.
(EUFIWACC, 2016)
Uncertainty An expression of the degree to which a value (e.g., the future state of
the climate system) is unknown. Uncertainty can result from lack of information or
from disagreement about what is known or even knowable. It may have many types
of sources, from quantifiable errors in the data to ambiguously defined concepts or
terminology, or uncertain projections of human behaviour. Uncertainty can
therefore be represented by quantitative measures, for example, a range of values
calculated by various models, or by qualitative statements, for example, reflecting
the judgement of a team of experts. (IPCC, 2015)
Vulnerability to climate change The degree to which a system is susceptible to,
or unable to cope with, adverse effects of climate change, including changes in
climate variability and extremes. Vulnerability to climate change is a function of the
character, magnitude, and rate of climate variation to which a system is exposed,
its sensitivity, and its adaptive capacity. (EUFIWACC, 2016)
97 | KfW Development Bank – Materials on Development Financing, No. 6, 2016
Links, Literature
Bresch, D.N. & Mueller, L. (2016): Climada Manual. Available on https://github.com/davidnbresch/climada/blob/master/docs/climada_manual.pdf (accessed 5th September 2016).
Bresch, D.N. (2016): Catalogue of standard measures. Dataset. https://github.com/davidnbresch/climada/blob/master/data/entities/catalogue_of_standard_measures.xlsx (accessed 15th September 2016).
BMZ (2014) The Vulnerability Source Book. Concept and Guidelines on standardized Vulnerability Assessment, published by GIZ. Eschborn August 2014.
CAPRA (2015): ERN-Vulnerability. http://www.ecapra.org/ern-vulnerability (accessed 15th September 2016).
Climate Service Center (2016): Climate Service Center Germany. http://www.climate-service-center.de/index.php.en (accessed 13th September 2016).
DesInventar (2016): DesInventar online. Inventory system of the effects of disasters. https://online.desinventar.org/ (accessed 15
th September 2016).
ECA Working Group (2009) Shaping Climate Resilient Development. Report on the economics of climate adaptation. A framework for decision making. http://www.swissre.com/eca/ (accessed 13
th September 2016).
EM-Dat (2016): The International Disaster Database. http://www.emdat.be/ (accessed 15th September 2016).
Estrella, M. & Saalismaa, N. (2013): Ecosystem-based DRR: An overview. In: Renaud et al. (eds.): The role of ecosystems for disaster risk reduction. United Nations University Press, Tokyo, pp. 26-54.
EUFIWACC (2016) Integrating Climate Change Information and Adaptation in Project Development Emerging Experience from Practitioners. European Financing Institutions Working Group on Adaptation to Climate Change (EUFIWACC) http://ec.europa.eu/clima/publications/docs/integrating_climate_change_en.pdf (accessed 08/2016)
FAO (1992): Cost Control in Forest Harvesting and Road Construction. Forestry Paper 99. FAO. Rome.
FAO (2016): GeoNetwork. http://www.fao.org/geonetwork/srv/en/main.home (accessed 15th September 2016).
Glidenumber (2016): Glidenumber database. http://www.glidenumber.net/glide/public/search/search.jsp (accessed 15th
September 2016).
Global Land Cover Facility: Global Land Cover Facility. http://glcf.umd.edu/index.shtml (accessed 15th September 2016).
International Risk Management Institute (2016): Direct damage. https://www.irmi.com/online/insurance-glossary/terms/d/direct-damage.aspx (accessed 15
th September 2016).
IPCC (2014): Annex II: Glossary [Mach, K.J., S. Planton and C. von Stechow (eds.)]. In: Climate Change 2014: Synthesis Report. Contribution of Working Groups I, II and III to the Fifth Assessment Report of the Intergovernmental Panel on Climate Change [Core Writing Team, R.K. Pachauri and L.A. Meyer (eds.)]. IPCC, Geneva, Switzerland, pp. 117-130.
IPCC (2007): Climate Change 2007: Synthesis Report. Contribution of Working Groups I, II and III to the Fourth Assessment Report of the Intergovernmental Panel on Climate Change [Core Writing Team, Pachauri, R.K and Reisinger, A. (eds.)]. IPCC, Geneva, Switzerland, 104 pp.
IRI/LDEO Climate Data Library. https://iridl.ldeo.columbia.edu/ (accessed 15th September 2016).
KfW (2015a). Climate Change Assessment in the Metropolitan Area of San Salvador, El Salvador. Final Report. KfW, Frankfurt.
KfW (2015b). Climate Change Assessment in Barisal, Bangladesh. Final Report. KfW, Frankfurt
KfW (2016). ECA-A Climate Risk Assessment Approach Providing climate adaptation measures for decision makers. Authors: F. Wieneke & D. Bresch. KfW, Frankfurt. https://www.kfw-entwicklungsbank.de/PDF/Download-Center/Materialien/2016_No5_Economics-of-Adaptation_EN.pdf
98 | KfW Development Bank – Materials on Development Financing, No. 6, 2016
Munich Re (2016): NatCatSERVICE. Download center for statistics on natural catastrophes. https://www.munichre.com/en/reinsurance/business/non-life/natcatservice/index.html (accessed 15
th September
2016).
NASA (2016a): U.S. Releases Enhanced Shuttle Land Elevation Data. http://www2.jpl.nasa.gov/srtm/ (accessed 15th September
2016).
NASA (2016): MODIS Land Science Team. https://modis-land.gsfc.nasa.gov/ (accessed 15th September 2016).
NASA (2016b): Socioeconomic Data and Applications Center (SEDAC). http://sedac.ciesin.columbia.edu/
NCAR (2016): Climate Change Scenarios. https://gisclimatechange.ucar.edu/ (accessed 15th September 2016).
NOAA (2016): Natural hazards Data, Images and Education. http://www.ngdc.noaa.gov/hazard/ (accessed 15th September
2016).
O’Keefe, P., Westgate, K. & Wisner, B. (1976): Taking the naturalness out of Natural Disasters. Nature 260, pp. 566-567.
PEDRR (2010): Global Assessment Report on Disaster Risk Reduction. Demonstrating the Role of Ecosystems-based Management for Disaster Risk Reduction. Partnership for Environment and
Prahl, B.F. et al. (2015): Comparison of storm damage functions and their performance. In: Natural Hazards and Earth System Sciences 15, pp. 769-788.
Sudmeier-Rieux, K. & Ash, N. (2009): Environmental Guidance Note for Disaster Risk Reduction. Healthy Ecosystems for Human Security. Ecosystem Management Series No., Commission on Ecosystem Management, revised edition. Gland, Switzerland: IUCN.
The Nature Conservancy, 2013. The case for green infrastructure. Joint –industry White Paper. http://www.nature.org/about-us/the-case-for-green-infrastructure.pdf (accessed 08/2016)
UNEP (2015): Promoting ecosystems for disaster risk reduction and climate change adaptation. Opportunities for Integration. Discussion Pape, pp.48.
UNEP (2016): Global Risk Data Platform. http://preview.grid.unep.ch/ (accessed 15th September 2016).
UNISDR (2009): UNISDR Terminology on Disaster Risk Reduction. United Nations International Strategy for Disaster Reduction (UNISDR), Geneva, Switzerland, May 2009, 30 pp. http://www.unisdr.org/files/7817_UNISDRTerminologyEnglish.pdf (accessed 5
th September 2016).
Van Westen C.J., Alkema D, Damen M, Kerle N. And Kingma N. (2011) Multihazard- Risk Assessment. Distance Education Course. United Nations University – ITC School on Disaster Geoinformation Management (UNU-ITC DGIM), Twente, 2011
Warner, K. & Van der Geest, K. (2013): Loss and damage from climate change: local-level evidence from nine vulnerable countries. International Journal of Global Warming, Vol. 5, No. 4, pp. 367–386.
99 | KfW Development Bank – Materials on Development Financing, No. 6, 2016
ANNEXES
ANNEX 1…………………………………………………….Data and Input Needed Check List
https://www.ethz.ch/content/dam/ethz/special-interest/usys/ied/ied-dam/text/edu/climrisk_ANNEX_1.pdf
ANNEX 2 ……………………………………………………Template Data Gathering for Asset Value
https://www.ethz.ch/content/dam/ethz/special-interest/usys/ied/ied-dam/text/edu/climrisk_ANNEX_2.pdf
ANNEX 3 …………………………………………………….Example of Flood Risk Adaptation Measure Parameters
https://www.ethz.ch/content/dam/ethz/special-interest/usys/ied/ied-dam/text/edu/climrisk_ANNEX_3.pdf
ANNEX 4 …………………………………………………….Catalogue of Standard Measures
https://github.com/davidnbresch/climada/blob/master/data/entities/catalogue_of_standard_measures.xlsx

Imprint
Publisher
KfW Group
KfW Development Bank
Palmengartenstrasse 5-9
60325 Frankfurt am Main, Germany
Telephone +49 69 74310
Fax +49 69 7431 2944
www.kfw.de
Editing
Competence Centre Climate and Energy
Photo
An aerial view of the flooded houses in the aftermath of the tropical storm "Hanna"
Source: UN Photo / Marco Dormino 2008