Embed Size (px)
Citation preview
Contents lists available at ScienceDirect
Materials Science & Engineering A
journal homepage: www.elsevier.com/locate/msea
Nanocrystalline Al-Mg with extreme strength due to grain boundary doping
Simon C. Puna, Wenbo Wangc, Amirhossein Khalajhedayatib, Jennifer D. Schulerb,Jason R. Trelewiczc, Timothy J. Ruperta,b,⁎
a Department of Mechanical and Aerospace Engineering, University of California, Irvine, CA 92697, USAb Department of Chemical Engineering and Materials Science, University of California, Irvine, CA 92697, USAc Department of Materials Science and Engineering, Stony Brook University, Stony Brook, NY 11794, USA
A R T I C L E I N F O
Keywords:Grain boundary strengtheningGrain boundary dopingNanocrystalline metalsNanoindentationMechanical behavior
A B S T R A C T
Nanocrystalline Al-Mg alloys are used to isolate the effect of grain boundary doping on the strength ofnanostructured metals. Mg is added during mechanical milling, followed by low homologous temperatureannealing treatments to induce segregation without grain growth. Nanocrystalline Al -7 at% Mg that is annealedfor 1 h at 200 °C is the strongest alloy fabricated, with a hardness of 4.56 GPa or approximately three times thatof pure nanocrystalline Al. Micropillar compression experiments indicate a yield strength of 865 MPa and aspecific strength of 329 kN m/kg, making this one of the strongest lightweight metals reported to date.
1. Introduction
Nanocrystalline metals exhibit beneficial mechanical propertiessuch as high strength, prolonged fatigue life, and improved wearresistance [1–3]. Reducing a material's grain size results in a largeincrease in the number of grain boundaries, which act as obstacles todislocation motion [4]. For grain sizes over the range of ~15–100 nm,plasticity is dominated by dislocations that are nucleated from grainboundary sources, travel across the grain while being momentarilypinned at the ends by boundary sites, and finally are absorbed into theopposite grain boundary [5]. While plasticity is still based on disloca-tion motion, the grain boundary is now heavily involved in the entireprocess and local grain boundary state should therefore be important.For example, grain boundary relaxation is a process where energystored during processing in the form of excess grain boundary defects ordisorder is released as the boundary transforms towards an equilibriumconfiguration [6,7]. This boundary relaxation serves to strengthen ananocrystalline material, with a study of nanocrystalline Ni-W showinghardness increases of up to 35% compared to the as-deposited materialupon low homologous temperature annealing [8]. Molecular dynamicssimulations have confirmed such relaxation, showing that relaxedboundaries better resist grain boundary sliding and make dislocationnucleation and propagation more difficult [9,10].
Grain boundary structure can be intimately tied to grain boundarychemistry as well. Nanocrystalline alloys with segregating dopants havebeen developed for improved thermal stability [11] and also for theproduction of materials with controllable grain sizes [12], with
predominant theories suggesting that the dopants reduce grain bound-ary energy [13]. The addition of solutes to interfaces and the reductionof grain boundary energy should also influence the mechanicalbehavior of nanostructured metals. Extremely high strengths near thetheoretical limit were predicted by Vo et al. [14] through moleculardynamics simulations and attributed to heavy doping of the grainboundaries. Ozerinc et al. confirmed that boundary doping cansignificantly increase the strength of nanocrystalline metals usingnanoindentation experiments on Cu, Cu-Nb, and Cu-Fe films [15].However, grain size varied between samples and solid solutionstrengthening, while ruled out as the dominant effect, was not explicitlytreated and subtracted in Ref. [15].
In this paper, the effect of grain boundary doping on hardness andstrength is isolated using nanocrystalline Al and Al-Mg alloys with aconstant grain size. By keeping grain size constant, the strengtheningcontribution from grain size reduction is constant among all testingsamples. Low homologous temperature heat treatments are employedto tailor segregation state, which is quantified through X-ray diffractionand contrasted with stable nanocrystalline grain structures created bylattice Monte Carlo (LMC) simulations. The distribution of solute in thegrain interior and grain boundary regions is extracted and then used tomeasure the respective contributions of solid solution strengtheningand grain boundary segregation strengthening. We find that boundarysegregation has a much larger effect on strength than solid solutionaddition, which enables the production of alloys with roughly threetimes the strength of pure nanocrystalline Al. Microcompressionexperiments were used to confirm the extreme strength of the nano-
http://dx.doi.org/10.1016/j.msea.2017.04.095Received 29 November 2016; Received in revised form 23 March 2017; Accepted 24 April 2017
⁎ Corresponding author at: Department of Mechanical and Aerospace Engineering, University of California, Irvine, CA 92697, USA.E-mail address: [email protected] (T.J. Rupert).
Materials Science & Engineering A 696 (2017) 400–406
Available online 25 April 20170921-5093/ © 2017 Elsevier B.V. All rights reserved.
MARK
crystalline Al-Mg alloys, and the results position these materials amongthe strongest Al alloys to date with a specific strength of 329 kN m/kg.
2. Methods
Pure nanocrystalline Al and Al-Mg alloys with Mg concentrations upto 7 at% were produced using a high-energy SPEX 8000 M ball millunder Ar atmosphere at 2×10⁻³ Torr. This dopant choice was moti-vated by the work of Murdoch and Schuh [16], which suggested thatMg has a positive enthalpy of segregation in Al and would thereforehave an energetic preference to segregate to the grain boundaries.Selected samples were annealed at 150 °C and 200 °C under vacuum for1 h, to facilitate solute redistribution toward thermodynamically fa-vored configurations. Structural characterization of both as-milled andannealed specimens was performed by using X-ray diffraction (XRD) ina Rigaku Ultima III Diffractometer with a Cu Kα radiation sourceoperated at 40 kV and 30 mA. XRD profiles were used to verify that allalloys were polycrystalline, face-centered cubic (fcc) solid solutions.Grain size was measured by applying the Scherrer equation to eachpeak, with the reported values representing the average from allreflections [17]. Since coherent X-ray scattering only occurs from thegrain interiors, peak positions were used to quantify the distribution ofdopant atoms between grain interior and grain boundary sites, whichwill be described in detail later. Energy dispersive X-ray spectroscopy(EDS) was performed on a Philips XL-30 field emission scanningelectron microscope (SEM) at 10 kV to quantify global alloy composi-tion. Transmission electron microscopy (TEM) samples were made fromthe powders with the focused ion beam (FIB) lift-out technique, usingan FEI Quanta 3D microscope and Ga+ ions. In order to reduce ionbeam damage, TEM samples received a final polish with a low power5 kV beam. Bright field TEM images, selected area electron diffraction(SAED) patterns, EDS profiles, and scanning TEM images were collectedon an FEI Titan operating at 300 kV. Analysis of SAED patterns wasperformed with the Crystallographic Tool Box (CrysTBox) [18].
Hardness was measured using an Agilent G200 nanoindenter with adiamond Berkovich tip, which was calibrated with a standard fusedsilica specimen. All quoted hardness values are based on a minimum of30 measurements, determined at an indentation depth of 300 nm andusing a constant indentation strain rate of 0.05 s−1. Micropillars withaverage diameters of 6.3 µm and average heights of 16.4 µm werefabricated with automated lathe milling using a focus ion beam (FIB)microscope, following the method of Uchic and Dimiduk [19]. Thepillar aspect ratio (height/diameter) of ~2.6 was chosen to followmicrocompression testing best practices developed by Zhang et al. [20]to avoid plastic buckling. Yield strength was obtained by performingmicrocompression on three individual micropillars with a flat punch tipin the same nanoindenter and then using the 0.7% yield strain offsetcriterion of Brandstetter et al. [21].
Solute distributions and grain boundary formation energies forstable nanocrystalline states in Al-Mg alloys were explored as a functionof alloy composition and grain size using the LMC formalism. The LMCmethodology elucidates the lowest free energy state of an alloy from aconfigurational space that incorporates chemical mixing (i.e. as origin-ally captured by the Ising model [22]) collectively with grain bound-aries. The latter was enabled by assigning each lattice site a grainallegiance in addition to a chemical identity with nearest-neighborbond energies parameterized via the Regular Nanocrystalline Solution(RNS) model [23], which prescribes unique energies to crystalline(grain interior) and grain boundary bonds. Pioneering work wasconducted on tungsten alloys that identified nanocrystalline stablestates in refractory metal alloys [24], and the technique was recentlyapplied to compare predicted stable and unstable configurations indifferent binary iron alloys [25].
Seven alloy compositions were investigated including 1, 2, 5, 7, 10,15, and 20 at% Mg, and each simulation cell was constructed to contain400×400×6 sites on an fcc lattice. The chemical identity and grain
allegiance of each site was randomly assigned by initializing thesimulation at 10,000 K, followed by cooling to the equilibrationtemperature (Teq) at a rate of − T T( − )
1000step eq . A single equilibration
temperature of 300 K was employed and each configuration wasevolved at this temperature using the Metropolis method [26]. Thelowest free energy state was identified using a convergence rate definedby S = E
lΔΔ where ΔE represents the internal energy difference over a
prescribed number of Monte Carlo steps defined by Δl; herein, aconstant value of 2000 was assigned for Δl. The system was evolvedto a state where the convergence rate was< 10−6, and followed by anadditional 50,000 Monte Carlo steps to confirm the lowest free energystate was in fact achieved.
The internal energy of the system for a given configurational statewas determined by summing over all bond energies for nearest-neighbor bonds following the implementation of the RNS model forthe LMC framework [27]. This energy parameterization distinguishedlike and unlike bonds in both the crystalline lattice and grain boundaryregions via distinct interaction energies denoted ωc and ωgb, respec-tively. The bulk interaction energy of ωc=0.13 kJ/mol was ascertainedfrom the dilute heat of mixing, ΔHmix, for Al-Mg of 1.607 kJ/mol [28],which enabled the energy of the unlike bonds in the crystalline lattice(EAl Mg
c− ) to be determined using like bond energies of EAl Al
c− =135 kJ/
mol and EMg Mgc
− =9 kJ/mol [29]. Given these like bond energies, adilute heat of segregation, ΔHseg, of 12.744 kJ/mol [28], and grainboundary energy penalty, Ωγ
zt2 o , for the solvent and solute of 2.14 and
2.8 kJ/mol, respectively, the grain boundary interaction parameter wasdetermined to be ωgb=−1.73 kJ/mol. The grain boundary bondenergies were computed using the above values, thus providing therequisite energy parameterization for calculating the total internalenergy of each configurational state.
3. Results and discussion
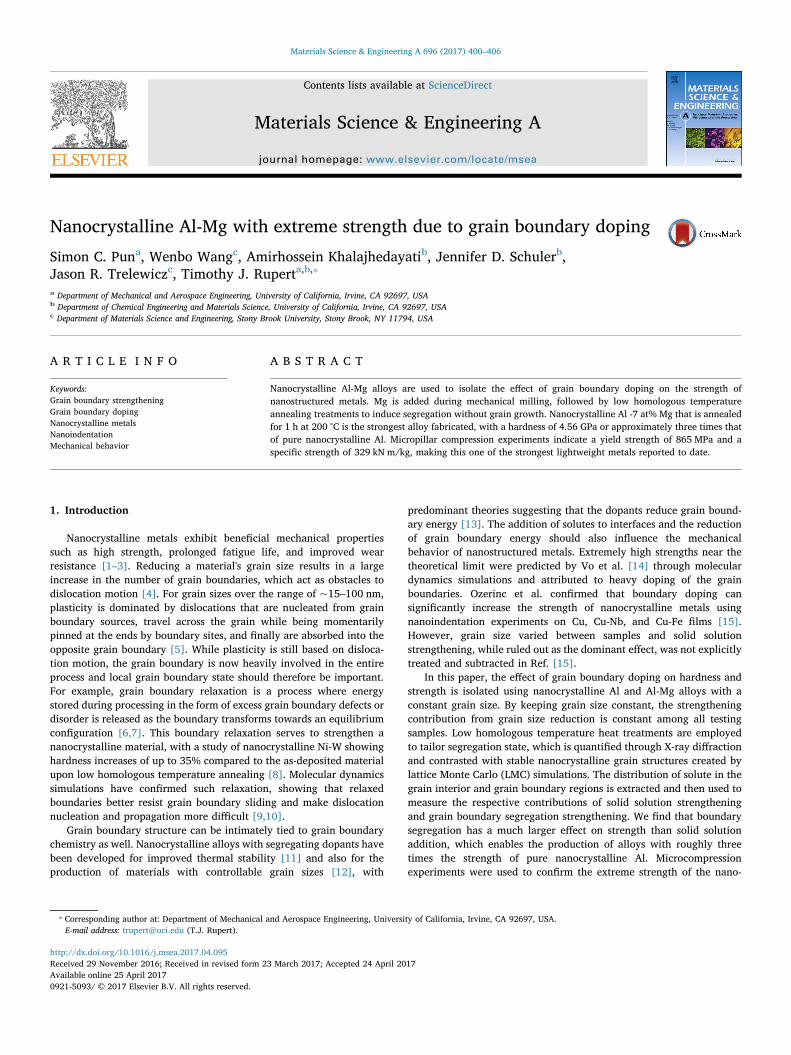
Hardness is shown as a function of global alloy composition in Fig. 1for nanocrystalline Al-Mg alloys with a mutually consistent grain size of24 nm. The sample containing 7 at% Mg exhibited a hardness of4.19 GPa whereas the hardness of nominally pure nanocrystalline Alwas 1.61 GPa, which demonstrates the dramatic increase in hardnessachieved through alloying. Annealing at low homologous temperaturesfurther increased the hardness of the alloys, with a maximum hardnessof 4.56 GPa measured following the 200 °C heat treatment. Thisparticular alloy is roughly three times as strong as pure nanocrystallineAl and is among the strongest Al-based materials that can be found in
Fig. 1. Hardness values of Al-Mg alloys plotted against the global Mg concentration.While the as-milled alloys show high hardness, the annealing provides relaxation thatfurther hardens the alloys. It is also obvious that strengthening from grain size reductionis much less than that from doping.
S.C. Pun et al. Materials Science & Engineering A 696 (2017) 400–406
401
the literature, surpassing the hardness of commercial Al alloys [30].With the XRD measurements confirming a consistent average grain sizeof 24 nm for all samples, strengthening from grain size effects wereruled out of the analysis.
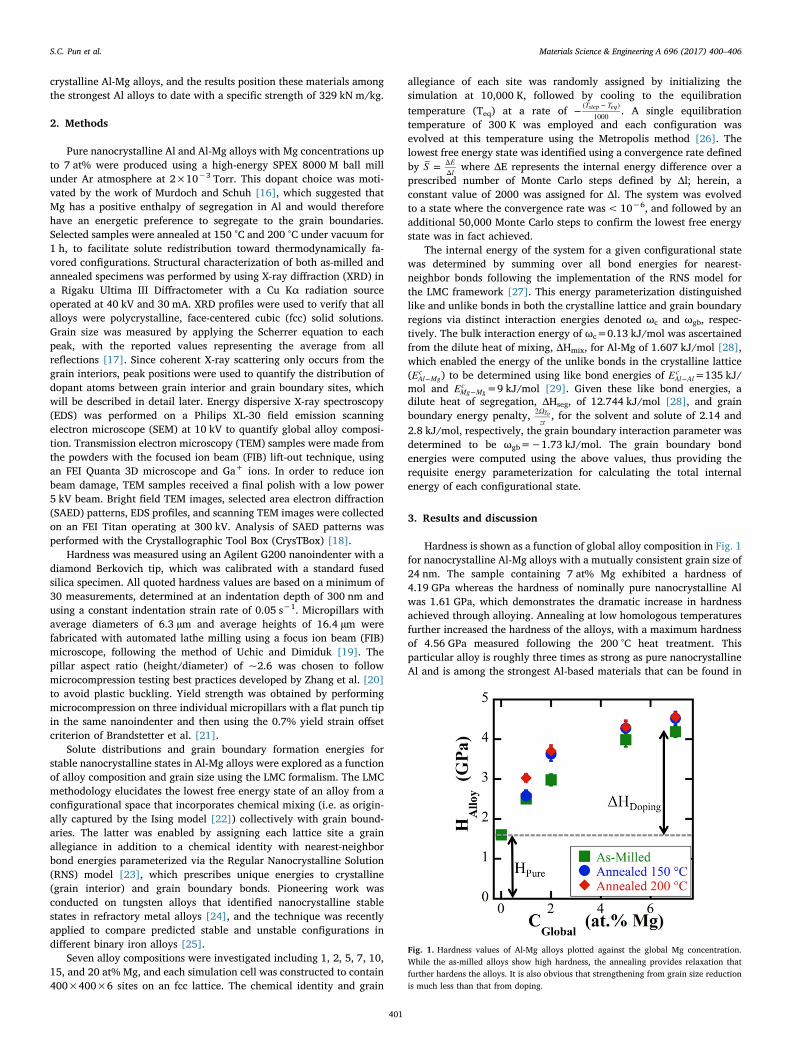
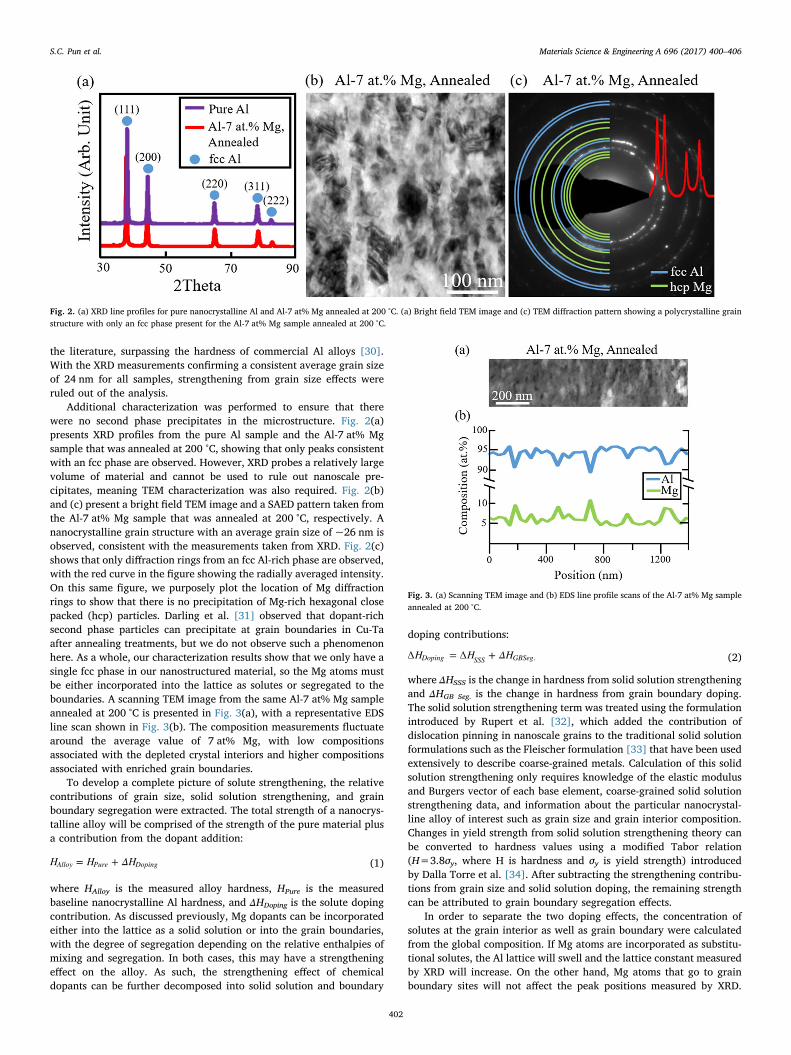
Additional characterization was performed to ensure that therewere no second phase precipitates in the microstructure. Fig. 2(a)presents XRD profiles from the pure Al sample and the Al-7 at% Mgsample that was annealed at 200 °C, showing that only peaks consistentwith an fcc phase are observed. However, XRD probes a relatively largevolume of material and cannot be used to rule out nanoscale pre-cipitates, meaning TEM characterization was also required. Fig. 2(b)and (c) present a bright field TEM image and a SAED pattern taken fromthe Al-7 at% Mg sample that was annealed at 200 °C, respectively. Ananocrystalline grain structure with an average grain size of ~26 nm isobserved, consistent with the measurements taken from XRD. Fig. 2(c)shows that only diffraction rings from an fcc Al-rich phase are observed,with the red curve in the figure showing the radially averaged intensity.On this same figure, we purposely plot the location of Mg diffractionrings to show that there is no precipitation of Mg-rich hexagonal closepacked (hcp) particles. Darling et al. [31] observed that dopant-richsecond phase particles can precipitate at grain boundaries in Cu-Taafter annealing treatments, but we do not observe such a phenomenonhere. As a whole, our characterization results show that we only have asingle fcc phase in our nanostructured material, so the Mg atoms mustbe either incorporated into the lattice as solutes or segregated to theboundaries. A scanning TEM image from the same Al-7 at% Mg sampleannealed at 200 °C is presented in Fig. 3(a), with a representative EDSline scan shown in Fig. 3(b). The composition measurements fluctuatearound the average value of 7 at% Mg, with low compositionsassociated with the depleted crystal interiors and higher compositionsassociated with enriched grain boundaries.
To develop a complete picture of solute strengthening, the relativecontributions of grain size, solid solution strengthening, and grainboundary segregation were extracted. The total strength of a nanocrys-talline alloy will be comprised of the strength of the pure material plusa contribution from the dopant addition:
H H ΔH= +Alloy Pure Doping (1)
where HAlloy is the measured alloy hardness, HPure is the measuredbaseline nanocrystalline Al hardness, and ΔHDoping is the solute dopingcontribution. As discussed previously, Mg dopants can be incorporatedeither into the lattice as a solid solution or into the grain boundaries,with the degree of segregation depending on the relative enthalpies ofmixing and segregation. In both cases, this may have a strengtheningeffect on the alloy. As such, the strengthening effect of chemicaldopants can be further decomposed into solid solution and boundary
doping contributions:
H H ΔH∆ = ∆ +Doping SSS GBSeg. (2)
where ΔHSSS is the change in hardness from solid solution strengtheningand ΔHGB Seg. is the change in hardness from grain boundary doping.The solid solution strengthening term was treated using the formulationintroduced by Rupert et al. [32], which added the contribution ofdislocation pinning in nanoscale grains to the traditional solid solutionformulations such as the Fleischer formulation [33] that have been usedextensively to describe coarse-grained metals. Calculation of this solidsolution strengthening only requires knowledge of the elastic modulusand Burgers vector of each base element, coarse-grained solid solutionstrengthening data, and information about the particular nanocrystal-line alloy of interest such as grain size and grain interior composition.Changes in yield strength from solid solution strengthening theory canbe converted to hardness values using a modified Tabor relation(H=3.8σy, where H is hardness and σy is yield strength) introducedby Dalla Torre et al. [34]. After subtracting the strengthening contribu-tions from grain size and solid solution doping, the remaining strengthcan be attributed to grain boundary segregation effects.
In order to separate the two doping effects, the concentration ofsolutes at the grain interior as well as grain boundary were calculatedfrom the global composition. If Mg atoms are incorporated as substitu-tional solutes, the Al lattice will swell and the lattice constant measuredby XRD will increase. On the other hand, Mg atoms that go to grainboundary sites will not affect the peak positions measured by XRD.
Fig. 2. (a) XRD line profiles for pure nanocrystalline Al and Al-7 at% Mg annealed at 200 °C. (a) Bright field TEM image and (c) TEM diffraction pattern showing a polycrystalline grainstructure with only an fcc phase present for the Al-7 at% Mg sample annealed at 200 °C.
Fig. 3. (a) Scanning TEM image and (b) EDS line profile scans of the Al-7 at% Mg sampleannealed at 200 °C.
S.C. Pun et al. Materials Science & Engineering A 696 (2017) 400–406
402
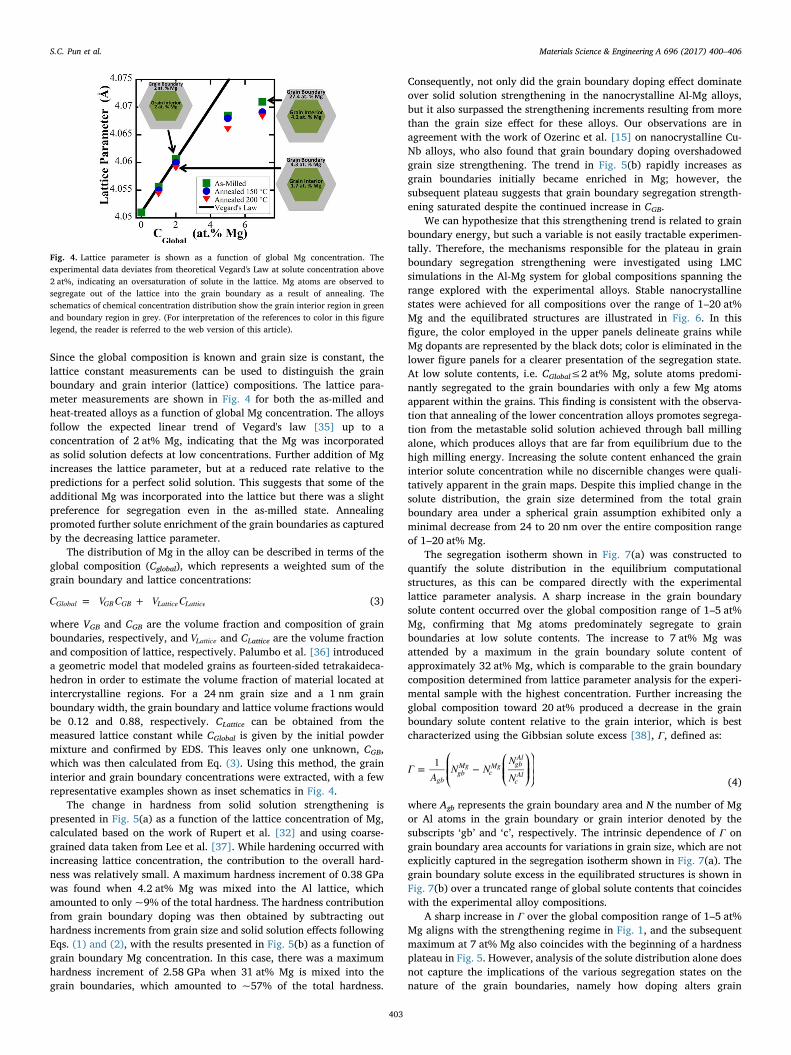
Since the global composition is known and grain size is constant, thelattice constant measurements can be used to distinguish the grainboundary and grain interior (lattice) compositions. The lattice para-meter measurements are shown in Fig. 4 for both the as-milled andheat-treated alloys as a function of global Mg concentration. The alloysfollow the expected linear trend of Vegard's law [35] up to aconcentration of 2 at% Mg, indicating that the Mg was incorporatedas solid solution defects at low concentrations. Further addition of Mgincreases the lattice parameter, but at a reduced rate relative to thepredictions for a perfect solid solution. This suggests that some of theadditional Mg was incorporated into the lattice but there was a slightpreference for segregation even in the as-milled state. Annealingpromoted further solute enrichment of the grain boundaries as capturedby the decreasing lattice parameter.
The distribution of Mg in the alloy can be described in terms of theglobal composition (Cglobal), which represents a weighted sum of thegrain boundary and lattice concentrations:
C V C V C= +Global GB GB Lattice Lattice (3)
where VGB and CGB are the volume fraction and composition of grainboundaries, respectively, and VLattice and CLattice are the volume fractionand composition of lattice, respectively. Palumbo et al. [36] introduceda geometric model that modeled grains as fourteen-sided tetrakaideca-hedron in order to estimate the volume fraction of material located atintercrystalline regions. For a 24 nm grain size and a 1 nm grainboundary width, the grain boundary and lattice volume fractions wouldbe 0.12 and 0.88, respectively. CLattice can be obtained from themeasured lattice constant while CGlobal is given by the initial powdermixture and confirmed by EDS. This leaves only one unknown, CGB,which was then calculated from Eq. (3). Using this method, the graininterior and grain boundary concentrations were extracted, with a fewrepresentative examples shown as inset schematics in Fig. 4.
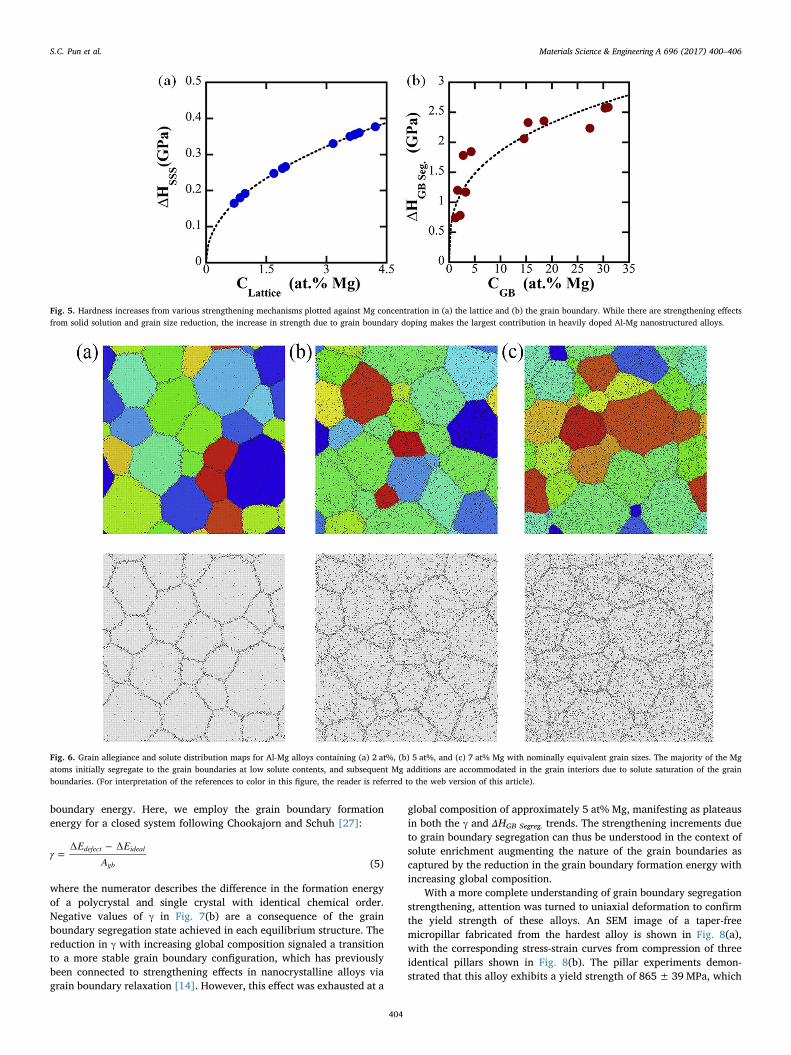
The change in hardness from solid solution strengthening ispresented in Fig. 5(a) as a function of the lattice concentration of Mg,calculated based on the work of Rupert et al. [32] and using coarse-grained data taken from Lee et al. [37]. While hardening occurred withincreasing lattice concentration, the contribution to the overall hard-ness was relatively small. A maximum hardness increment of 0.38 GPawas found when 4.2 at% Mg was mixed into the Al lattice, whichamounted to only ~9% of the total hardness. The hardness contributionfrom grain boundary doping was then obtained by subtracting outhardness increments from grain size and solid solution effects followingEqs. (1) and (2), with the results presented in Fig. 5(b) as a function ofgrain boundary Mg concentration. In this case, there was a maximumhardness increment of 2.58 GPa when 31 at% Mg is mixed into thegrain boundaries, which amounted to ~57% of the total hardness.
Consequently, not only did the grain boundary doping effect dominateover solid solution strengthening in the nanocrystalline Al-Mg alloys,but it also surpassed the strengthening increments resulting from morethan the grain size effect for these alloys. Our observations are inagreement with the work of Ozerinc et al. [15] on nanocrystalline Cu-Nb alloys, who also found that grain boundary doping overshadowedgrain size strengthening. The trend in Fig. 5(b) rapidly increases asgrain boundaries initially became enriched in Mg; however, thesubsequent plateau suggests that grain boundary segregation strength-ening saturated despite the continued increase in CGB.
We can hypothesize that this strengthening trend is related to grainboundary energy, but such a variable is not easily tractable experimen-tally. Therefore, the mechanisms responsible for the plateau in grainboundary segregation strengthening were investigated using LMCsimulations in the Al-Mg system for global compositions spanning therange explored with the experimental alloys. Stable nanocrystallinestates were achieved for all compositions over the range of 1–20 at%Mg and the equilibrated structures are illustrated in Fig. 6. In thisfigure, the color employed in the upper panels delineate grains whileMg dopants are represented by the black dots; color is eliminated in thelower figure panels for a clearer presentation of the segregation state.At low solute contents, i.e. CGlobal≤2 at% Mg, solute atoms predomi-nantly segregated to the grain boundaries with only a few Mg atomsapparent within the grains. This finding is consistent with the observa-tion that annealing of the lower concentration alloys promotes segrega-tion from the metastable solid solution achieved through ball millingalone, which produces alloys that are far from equilibrium due to thehigh milling energy. Increasing the solute content enhanced the graininterior solute concentration while no discernible changes were quali-tatively apparent in the grain maps. Despite this implied change in thesolute distribution, the grain size determined from the total grainboundary area under a spherical grain assumption exhibited only aminimal decrease from 24 to 20 nm over the entire composition rangeof 1–20 at% Mg.
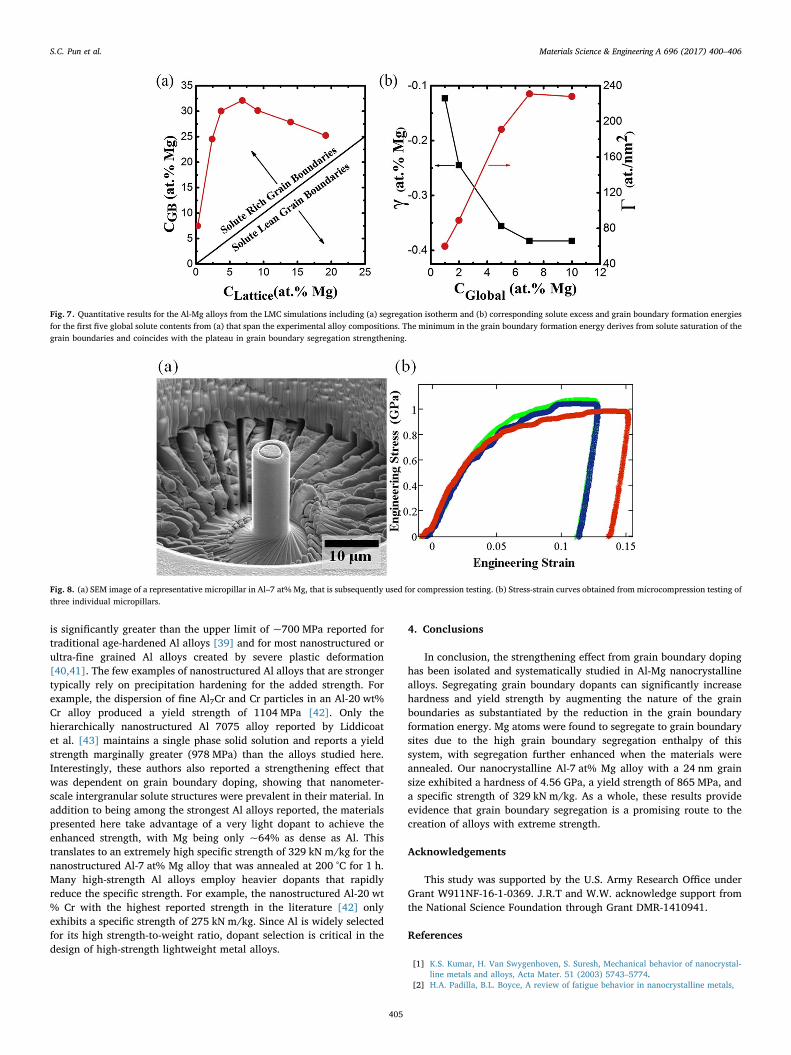
The segregation isotherm shown in Fig. 7(a) was constructed toquantify the solute distribution in the equilibrium computationalstructures, as this can be compared directly with the experimentallattice parameter analysis. A sharp increase in the grain boundarysolute content occurred over the global composition range of 1–5 at%Mg, confirming that Mg atoms predominately segregate to grainboundaries at low solute contents. The increase to 7 at% Mg wasattended by a maximum in the grain boundary solute content ofapproximately 32 at% Mg, which is comparable to the grain boundarycomposition determined from lattice parameter analysis for the experi-mental sample with the highest concentration. Further increasing theglobal composition toward 20 at% produced a decrease in the grainboundary solute content relative to the grain interior, which is bestcharacterized using the Gibbsian solute excess [38], Γ, defined as:
⎛⎝⎜⎜
⎛⎝⎜⎜
⎞⎠⎟⎟
⎞⎠⎟⎟Γ
AN N
NN
= 1 −gb
gbMg
cMg gb
Al
cAl
(4)
where Agb represents the grain boundary area and N the number of Mgor Al atoms in the grain boundary or grain interior denoted by thesubscripts ‘gb’ and ‘c’, respectively. The intrinsic dependence of Γ ongrain boundary area accounts for variations in grain size, which are notexplicitly captured in the segregation isotherm shown in Fig. 7(a). Thegrain boundary solute excess in the equilibrated structures is shown inFig. 7(b) over a truncated range of global solute contents that coincideswith the experimental alloy compositions.
A sharp increase in Γ over the global composition range of 1–5 at%Mg aligns with the strengthening regime in Fig. 1, and the subsequentmaximum at 7 at% Mg also coincides with the beginning of a hardnessplateau in Fig. 5. However, analysis of the solute distribution alone doesnot capture the implications of the various segregation states on thenature of the grain boundaries, namely how doping alters grain
Fig. 4. Lattice parameter is shown as a function of global Mg concentration. Theexperimental data deviates from theoretical Vegard's Law at solute concentration above2 at%, indicating an oversaturation of solute in the lattice. Mg atoms are observed tosegregate out of the lattice into the grain boundary as a result of annealing. Theschematics of chemical concentration distribution show the grain interior region in greenand boundary region in grey. (For interpretation of the references to color in this figurelegend, the reader is referred to the web version of this article).
S.C. Pun et al. Materials Science & Engineering A 696 (2017) 400–406
403
boundary energy. Here, we employ the grain boundary formationenergy for a closed system following Chookajorn and Schuh [27]:
γE E
A=
∆ − ∆defect ideal
gb (5)
where the numerator describes the difference in the formation energyof a polycrystal and single crystal with identical chemical order.Negative values of γ in Fig. 7(b) are a consequence of the grainboundary segregation state achieved in each equilibrium structure. Thereduction in γ with increasing global composition signaled a transitionto a more stable grain boundary configuration, which has previouslybeen connected to strengthening effects in nanocrystalline alloys viagrain boundary relaxation [14]. However, this effect was exhausted at a
global composition of approximately 5 at% Mg, manifesting as plateausin both the γ and ΔHGB Segreg. trends. The strengthening increments dueto grain boundary segregation can thus be understood in the context ofsolute enrichment augmenting the nature of the grain boundaries ascaptured by the reduction in the grain boundary formation energy withincreasing global composition.
With a more complete understanding of grain boundary segregationstrengthening, attention was turned to uniaxial deformation to confirmthe yield strength of these alloys. An SEM image of a taper-freemicropillar fabricated from the hardest alloy is shown in Fig. 8(a),with the corresponding stress-strain curves from compression of threeidentical pillars shown in Fig. 8(b). The pillar experiments demon-strated that this alloy exhibits a yield strength of 865±39 MPa, which
Fig. 5. Hardness increases from various strengthening mechanisms plotted against Mg concentration in (a) the lattice and (b) the grain boundary. While there are strengthening effectsfrom solid solution and grain size reduction, the increase in strength due to grain boundary doping makes the largest contribution in heavily doped Al-Mg nanostructured alloys.
Fig. 6. Grain allegiance and solute distribution maps for Al-Mg alloys containing (a) 2 at%, (b) 5 at%, and (c) 7 at% Mg with nominally equivalent grain sizes. The majority of the Mgatoms initially segregate to the grain boundaries at low solute contents, and subsequent Mg additions are accommodated in the grain interiors due to solute saturation of the grainboundaries. (For interpretation of the references to color in this figure, the reader is referred to the web version of this article).
S.C. Pun et al. Materials Science & Engineering A 696 (2017) 400–406
404
is significantly greater than the upper limit of ~700 MPa reported fortraditional age-hardened Al alloys [39] and for most nanostructured orultra-fine grained Al alloys created by severe plastic deformation[40,41]. The few examples of nanostructured Al alloys that are strongertypically rely on precipitation hardening for the added strength. Forexample, the dispersion of fine Al7Cr and Cr particles in an Al-20 wt%Cr alloy produced a yield strength of 1104 MPa [42]. Only thehierarchically nanostructured Al 7075 alloy reported by Liddicoatet al. [43] maintains a single phase solid solution and reports a yieldstrength marginally greater (978 MPa) than the alloys studied here.Interestingly, these authors also reported a strengthening effect thatwas dependent on grain boundary doping, showing that nanometer-scale intergranular solute structures were prevalent in their material. Inaddition to being among the strongest Al alloys reported, the materialspresented here take advantage of a very light dopant to achieve theenhanced strength, with Mg being only ~64% as dense as Al. Thistranslates to an extremely high specific strength of 329 kN m/kg for thenanostructured Al-7 at% Mg alloy that was annealed at 200 °C for 1 h.Many high-strength Al alloys employ heavier dopants that rapidlyreduce the specific strength. For example, the nanostructured Al-20 wt% Cr with the highest reported strength in the literature [42] onlyexhibits a specific strength of 275 kN m/kg. Since Al is widely selectedfor its high strength-to-weight ratio, dopant selection is critical in thedesign of high-strength lightweight metal alloys.
4. Conclusions
In conclusion, the strengthening effect from grain boundary dopinghas been isolated and systematically studied in Al-Mg nanocrystallinealloys. Segregating grain boundary dopants can significantly increasehardness and yield strength by augmenting the nature of the grainboundaries as substantiated by the reduction in the grain boundaryformation energy. Mg atoms were found to segregate to grain boundarysites due to the high grain boundary segregation enthalpy of thissystem, with segregation further enhanced when the materials wereannealed. Our nanocrystalline Al-7 at% Mg alloy with a 24 nm grainsize exhibited a hardness of 4.56 GPa, a yield strength of 865 MPa, anda specific strength of 329 kN m/kg. As a whole, these results provideevidence that grain boundary segregation is a promising route to thecreation of alloys with extreme strength.
Acknowledgements
This study was supported by the U.S. Army Research Office underGrant W911NF-16-1-0369. J.R.T and W.W. acknowledge support fromthe National Science Foundation through Grant DMR-1410941.
References
[1] K.S. Kumar, H. Van Swygenhoven, S. Suresh, Mechanical behavior of nanocrystal-line metals and alloys, Acta Mater. 51 (2003) 5743–5774.
[2] H.A. Padilla, B.L. Boyce, A review of fatigue behavior in nanocrystalline metals,
Fig. 7. Quantitative results for the Al-Mg alloys from the LMC simulations including (a) segregation isotherm and (b) corresponding solute excess and grain boundary formation energiesfor the first five global solute contents from (a) that span the experimental alloy compositions. The minimum in the grain boundary formation energy derives from solute saturation of thegrain boundaries and coincides with the plateau in grain boundary segregation strengthening.
Fig. 8. (a) SEM image of a representative micropillar in Al–7 at% Mg, that is subsequently used for compression testing. (b) Stress-strain curves obtained from microcompression testing ofthree individual micropillars.
S.C. Pun et al. Materials Science & Engineering A 696 (2017) 400–406
405

Exp. Mech. 50 (2010) 5–23.[3] T.J. Rupert, C.A. Schuh, Sliding wear of nanocrystalline Ni-W: structural evolution
and the apparent breakdown of Archard scaling, Acta Mater. 58 (2010) 4137–4148.[4] H. Gleiter, Nanocrystalline materials, Prog. Mater. Sci. 33 (1989) 223–315.[5] H. Van Swygenhoven, P.M. Derlet, A. Hasnaoui, Atomistic modeling of strength of
nanocrystalline metals, Adv. Eng. Mater. 5 (2003) 345–350.[6] D. Jang, M. Atzmon, Grain-boundary relaxation and its effect on plasticity in
nanocrystalline Fe, J. Appl. Phys. 99 (2006) 7.[7] A.J. Detor, C.A. Schuh, Microstructural evolution during the heat treatment of
nanocrystalline alloys, J. Mater. Res. 22 (2007) 3233–3248.[8] T.J. Rupert, J.R. Trelewicz, C.A. Schuh, Grain boundary relaxation strengthening of
nanocrystalline Ni–W alloys, J. Mater. Res. 27 (2012) 1285–1294.[9] N.Q. Vo, R.S. Averback, P. Bellon, A. Caro, Limits of hardness at the nanoscale:
molecular dynamics simulations, Phys. Rev. B 78 (2008) 4.[10] G.J. Tucker, D.L. McDowell, Non-equilibrium grain boundary structure and
inelastic deformation using atomistic simulations, Int. J. Plast. 27 (2011) 841–857.[11] K.A. Darling, B.K. VanLeeuwen, C.C. Koch, R.O. Scattergood, Thermal stability of
nanocrystalline Fe–Zr alloys, Mater. Sci. Eng. A 527 (2010) 3572–3580.[12] A.J. Detor, C.A. Schuh, Tailoring and patterning the grain size of nanocrystalline
alloys, Acta Mater. 55 (2007) 371–379.[13] H.A. Murdoch, C.A. Schuh, Stability of binary nanocrystalline alloys against grain
growth and phase separation, Acta Mater. 61 (2013) 2121–2132.[14] N.Q. Vo, J. Schafer, R.S. Averback, K. Albe, Y. Ashkenazy, P. Bellon, Reaching
theoretical strengths in nanocrystalline Cu by grain boundary doping, Scr. Mater.65 (2011) 660–663.
[15] S. Ozerinc, K. Tai, N.Q. Vo, P. Bellon, R.S. Averback, W.P. King, Grain boundarydoping strengthens nanocrystalline copper alloys, Scr. Mater. 67 (2012) 720–723.
[16] H.A. Murdoch, C.A. Schuh, Estimation of grain boundary segregation enthalpy andits role in stable nanocrystalline alloy design, J. Mater. Res. 28 (2013) 2154–2163.
[17] Z. Zhang, F. Zhou, E.J. Lavernia, On the analysis of grain size in bulk nanocrys-talline materials via X-ray diffraction, Metall. Mater. Trans. A 34A (13A) (2003)49–55.
[18] M. Klinger, A. Jäger, Crystallographic Tool Box (CrysTBox): automated tools fortransmission electron microscopists and crystallographers, J. Appl. Crystallogr. 48(2015) 2012–2018.
[19] M.D. Uchic, D.A. Dimiduk, A methodology to investigate size scale effects incrystalline plasticity using uniaxial compression testing, Mater. Sci. Eng. A 400(2005) 268–278.
[20] H. Zhang, B.E. Schuster, Q. Wei, K.T. Ramesh, The design of accurate micro-compression experiments, Scr. Mater. 54 (2006) 181–186.
[21] S. Brandstetter, H. Van Swygenhoven, S. Van Petegem, B. Schmitt, R. Maass,P.M. Derlet, From micro- to macroplasticity, Adv. Mater. 18 (2006) 1545–1548.
[22] G. Ceder, A derivation of the Ising model for the computation of phase diagrams,Comput. Mater. Sci. 1 (1993) 144–150.
[23] J.R. Trelewicz, C.A. Schuh, Grain boundary segregation and thermodynamicallystable binary nanocrystalline alloys, Phys. Rev. B (2009) 79.
[24] T. Chookajorn, H.A. Murdoch, C.A. Schuh, Design of stable nanocrystalline alloys,
Science 337 (2012) 951–954.[25] B.G. Clark, K. Hattar, M.T. Marshall, T. Chookajorn, B.L. Boyce, C.A. Schuh,
Thermal stability comparison of nanocrystalline Fe-Based binary alloy pairs, JOM68 (2016) 1625–1633.
[26] N. Metropolis, A.W. Rosenbluth, M.N. Rosenbluth, A.H. Teller, E. Teller, Equationof state calculations by fast computing machines, J. Chem. Phys. 21 (1953)1087–1092.
[27] T. Chookajorn, C.A. Schuh, Thermodynamics of stable nanocrystalline alloys: aMonte Carlo analysis, Phys. Rev. B 89 (2014) 064102.
[28] N. Saunders, A review and thermodynamic assessment of the Al-Mg and Mg-Lisystems, Calphad-Comput. Coupling Ph Diagr. Thermochem. 14 (1990) 61–70.
[29] Y.-R. Luo, Comprehensive Handbook of Chemical Bond Energies, CRC Press, BocaRaton, FL, 2007.
[30] J.R. Davis, Aluminum and Aluminum Alloys, ASM International, Russell Township,OH, 1993.
[31] K.A. Darling, M.A. Tschopp, R.K. Guduru, W.H. Yin, Q. Wei, L.J. Kecskes,Microstructure and mechanical properties of bulk nanostructured Cu–Ta alloysconsolidated by equal channel angular extrusion, Acta Mater. 76 (2014) 168–185.
[32] T.J. Rupert, J.C. Trenkle, C.A. Schuh, Enhanced solid solution effects on thestrength of nanocrystalline alloys, Acta Mater. 59 (2011) 1619–1631.
[33] R.L. Fleischer, Solid-solution hardening, in: D. Peckner (Ed.), The Strengthening ofMetals, Reinhold Publishing Corp., New York, NY, 1964, p. 93.
[34] F. Dalla Torre, H. Van Swygenhoven, M. Victoria, Nanocrystalline electrodepositedNi: microstructure and tensile properties, Acta Mater. 50 (2002) 3957–3970.
[35] L. Vegard, X-rays in the service of research on matter, Z. für Krist. 67 (1928)239–259.
[36] G. Palumbo, S.J. Thorpe, K.T. Aust, On the contribution of triple junctions to thestructure and properties of nanocrystalline materials, Scr. Metall. Mater. 24 (1990)1347–1350.
[37] B.-H. Lee, S.-H. Kim, J.-H. Park, H.-W. Kim, J.-C. Lee, Role of Mg in simultaneouslyimproving the strength and ductility of Al–Mg alloys, Mater. Sci. Eng. A 657 (2016)115–122.
[38] A.P. Sutton, R.W. Balluffi, Interfaces in Crystalline Materials, Clarendon, Oxford,1995.
[39] I.J. Polmear, Light Alloys, From Traditional Alloys to Nanocrystals, Butterworth-Heinemann, Oxford, 2005.
[40] Y.H. Zhao, X.Z. Liao, S. Cheng, E. Ma, Y.T. Zhu, Simultaneously increasing theductility and strength of nanostructured alloys, Adv. Mater. 18 (2006) 2280–2283.
[41] G. Nurislamova, X. Sauvage, M. Murashkin, R. Islamgaliev, R. Valiev, Nanostructureand related mechanical properties of an Al–Mg–Si alloy processed by severe plasticdeformation, Philos. Mag. Lett. 88 (2008) 459–466.
[42] R.K. Gupta, D. Fabijanic, T. Dorin, Y. Qiu, J.T. Wang, N. Birbilis, Simultaneousimprovement in the strength and corrosion resistance of Al via high-energy ballmilling and Cr alloying, Mater. Des. 84 (2015) 270–276.
[43] P.V. Liddicoat, X.-Z. Liao, Y. Zhao, Y. Zhu, M.Y. Murashkin, E.J. Lavernia,R.Z. Valiev, S.P. Ringer, Nanostructural hierarchy increases the strength ofaluminium alloys, Nat. Commun. 1 (2010) 63.
S.C. Pun et al. Materials Science & Engineering A 696 (2017) 400–406
406


![Concurrent transitions in wear rate and surface ...rupert.eng.uci.edu/Publications/Materialia_Concurrent transitions in wear rate and...ist. Rupert and Schuh [36] analyzed Ni-W films](https://img.pdfslide.net/doc/110x75/5e8cb2b83575f9470d22f0c4/concurrent-transitions-in-wear-rate-and-surface-transitions-in-wear-rate-and.jpg)