Embed Size (px)
Citation preview
1 | P a g e
MATERNAL INFANT AND YOUNG CHILD NUTRITION
KNOWLEDGE, ATTITUDE AND PRACTICES (KAP) SURVEY
WAJIR NORTH, ELDAS AND WAJIR WEST SUB-COUNTIES, WAJIR
COUNTY
29th
August – 9th
September, 2014
Survey done by Islamic Relief in collaboration with Ministry of Health Wajir and with funding from DFID and ECHO
2 | P a g e
TABLE OF CONTENTS
TABLE OF CONTENTS ......................................................................................................................... 1
LIST OF FIGURES ................................................................................................................................... 4
LIST OF TABLES .................................................................................................................................... 4
ACRONYMS ............................................................................................................................................. 5
ACKNOWLEDGEMENTS .................................................................................................................... 6
EXECUTIVE SUMMARY ..................................................................................................................... 7
CHAPTER ONE – BACKGROUND AND METHODOLOGY ............................................ 11 1.1 Background....................................................................................................................................... 11 1.2 Survey Objectives ............................................................................................................................. 12
1.2.1 Rationale of the Survey .....................................................................................................................12 1.2.2 Objective of the Survey .....................................................................................................................12 1.2.3 Area Surveyed ......................................................................................................................................12
1.3 Survey Methodology ........................................................................................................................ 12 1.3.1 Survey Design ......................................................................................................................................12 1.3.2 Target Population ................................................................................................................................13 1.3.3 Sample Size Calculation ....................................................................................................................13 1.3.4 Cluster and Households Selection ..................................................................................................13 1.3.5 Data Collection .....................................................................................................................................13 1.3.6 Data Entry and Analysis ....................................................................................................................14
CHAPTER TWO: FINDINGS AND DISCUSSIONS ............................................................... 15 2.1 Introduction ....................................................................................................................................... 15 2.2 Households Demographics and Economic Characteristics ................................................................ 15
2.2.1: Demographic Characteristics ..................................................................................................................15 2.2.2: Economic Characteristics.........................................................................................................................16
2.3 Birth History ...................................................................................................................................... 17 2.4 Index Child Characteristics ............................................................................................................... 18 2.5 Breastfeeding Characteristics ............................................................................................................ 19
2.5.1 Timely Initiation to Breastfeeding and Colostrum Uptake .............................................................19 2.6 Exclusive Breastfeeding Rate ............................................................................................................ 22 2.7 Continued Breastfeeding ................................................................................................................... 24 2.8 Bottle Feeding ................................................................................................................................... 24 2.10 Introduction to Solid, Semi-Solid and Soft Foods ............................................................................. 25 2.11 Minimum Dietary Diversity .............................................................................................................. 26 2.12 Minimum Meal Frequency and Minimum Acceptable Diet .............................................................. 27 2.13 Iron Rich Foods ................................................................................................................................. 28 2.14 Responsive Feeding ........................................................................................................................... 29 2.15 Self-Feeding and Feeding During Illnesses ....................................................................................... 29 2.16 Maternal Characteristics .................................................................................................................... 31
2.16.1 Antenatal Clinic ...................................................................................................................................31 2.17 Nutrition Status of Children and Caregivers using MUAC ............................................................... 32 2.18 Barrier Analysis...................................................................................................................................... 34
2.18.1 Primary Barriers .........................................................................................................................................34 2.18.2 Secondary Barriers ....................................................................................................................................36
2.19 Water, Sanitation and Hygiene (WASH) Knowledge and Awareness ..................................................... 38 2.20 High Impact Nutrition Interventions (HiNi) Knowledge and Awareness ................................................ 39
3 | P a g e
CHAPTER NINE: CONCLUSIONS AND RECOMMENDATIONS .................................. 41 9.1 Conclusions ....................................................................................................................................... 41 9.2 Recommendations ............................................................................................................................. 44
APPENDICIES ...................................................................................................................................... 46
Appendix 1: Survey Teams .............................................................................................................................. 46 Appendix 2: KIIs and FGDs conducted ........................................................................................................... 47 Appendix 3: Questionnaire ............................................................................................................................... 48
4 | P a g e
LIST OF FIGURES
Figure 1: Knowledge and Practice to Timely Initiation to Breastfeeding-------------------------------------------------- 20 Figure 2: Colostrum Uptake ----------------------------------------------------------------------------------------------------- 21 Figure 3: Drinks Given Within the First Three Days ------------------------------------------------------------------------- 21 Figure 4: Knowledge and Practice on Exclusive Breastfeeding ------------------------------------------------------------ 23 Figure 5: Drinks Given to Children Less Than 6 Months -------------------------------------------------------------------- 23 Figure 6: Knowledge and Practice on Bottle Feeding------------------------------------------------------------------------ 25 Figure 8: Knowledge and Practice on Timely Complementary Feeding --------------------------------------------------- 26 Figure 8: Dietary Diversity ------------------------------------------------------------------------------------------------------ 27 Figure 9: Minimum Meal Frequency and Minimum Acceptable Diet ------------------------------------------------------ 28 Figure 10: Methods Used for Responsive Feeding ---------------------------------------------------------------------------- 29 Figure 11: Frequency of Self-Feeding ------------------------------------------------------------------------------------------ 30
LIST OF TABLES
Table 1: Sample Size Calculation ----------------------------------------------------------------------------------------------- 13 Table 2: Demographic Characteristics ----------------------------------------------------------------------------------------- 16 Table 3: Household Economic Characteristics -------------------------------------------------------------------------------- 17 Table 4: Birth History ------------------------------------------------------------------------------------------------------------- 17 Table 5: Index Child Characteristics ------------------------------------------------------------------------------------------- 18 Table 6: Feeding During Illnesses ---------------------------------------------------------------------------------------------- 30 Table 7: Antenatal Clinics -------------------------------------------------------------------------------------------------------- 32 Table 8: Post Natal care and Anthropometric Measurements --------------------------------------------------------------- 33
5 | P a g e
ACRONYMS
CSPRo: Census and Survey Program
DHIS: District Health Information System
EBF: Exclusive Breastfeeding Rate
ENA: Emergency Nutrition Assessment
FTC: Feed the Children
GAM: Global Acute Malnutrition
HiNi: High Impact Nutrition Intervention
IDA: Iron Deficiency Anemia
IYCN: Infant and Young Children Nutrition
KAP: Knowledge Attitude and Practice
KNBS: Kenya National Bureau of Statistics
MIYCN: Maternal Infant and Young Children Nutrition
MtMSGs: Mother to Mother Support Groups
MUAC: Mid-Upper Arm Circumference
OPV: Oral Polio Vaccine
PPS: Probability Proportion to Population Size
SAM: Severe Acute Malnutrition
SD: Standard Deviation
SPSS: Statistical Software for Social Sciences
UNICEF: United National Children Education Fund
WHO: World Health Organization
6 | P a g e
ACKNOWLEDGEMENTS
This survey was carried out with the participation of many partners at different levels who are all
hereby highly acknowledged. At the community level were the caretakers of children 6-23
months who provided the primary data by agreeing to be interviewed. Not to be forgotten are the
respective opinion leaders who provided some key information through key informant
interviews. The local administrators are also acknowledged for being extremely valuable assets
in mobilizing the communities for the survey.
The survey teams composed of the enumerators and team leaders are highly appreciated for the
hard work of collecting high quality data. The Data Entry Clerks who worked day and night to
ensure that the data has been captured in the within the shortest time possible are also
appreciated
Special appreciation goes to Wajir County, Wajir North, Eldas, and Wajir West Health
Management Teams under the Ministry of Health for their active role and support during the
entire process
Finally, we acknowledge Islamic Relief Kenya Nutrition Staffs who coordinated, supervised and
supported the KAP Survey and also for their technical review of both the methodology and the
report.
Report by: SMARTSTAT Limited, Nairobi-Kenya
7 | P a g e
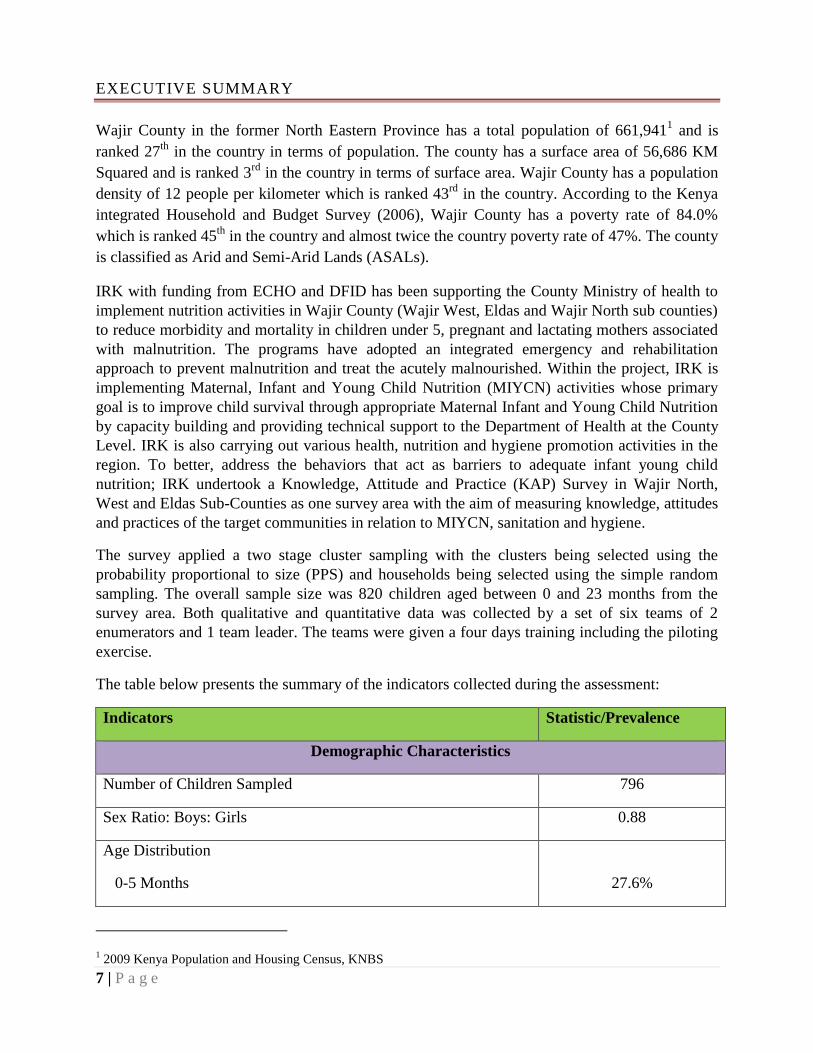
EXECUTIVE SUMMARY
Wajir County in the former North Eastern Province has a total population of 661,9411 and is
ranked 27th
in the country in terms of population. The county has a surface area of 56,686 KM
Squared and is ranked 3rd
in the country in terms of surface area. Wajir County has a population
density of 12 people per kilometer which is ranked 43rd
in the country. According to the Kenya
integrated Household and Budget Survey (2006), Wajir County has a poverty rate of 84.0%
which is ranked 45th
in the country and almost twice the country poverty rate of 47%. The county
is classified as Arid and Semi-Arid Lands (ASALs).
IRK with funding from ECHO and DFID has been supporting the County Ministry of health to
implement nutrition activities in Wajir County (Wajir West, Eldas and Wajir North sub counties)
to reduce morbidity and mortality in children under 5, pregnant and lactating mothers associated
with malnutrition. The programs have adopted an integrated emergency and rehabilitation
approach to prevent malnutrition and treat the acutely malnourished. Within the project, IRK is
implementing Maternal, Infant and Young Child Nutrition (MIYCN) activities whose primary
goal is to improve child survival through appropriate Maternal Infant and Young Child Nutrition
by capacity building and providing technical support to the Department of Health at the County
Level. IRK is also carrying out various health, nutrition and hygiene promotion activities in the
region. To better, address the behaviors that act as barriers to adequate infant young child
nutrition; IRK undertook a Knowledge, Attitude and Practice (KAP) Survey in Wajir North,
West and Eldas Sub-Counties as one survey area with the aim of measuring knowledge, attitudes
and practices of the target communities in relation to MIYCN, sanitation and hygiene.
The survey applied a two stage cluster sampling with the clusters being selected using the
probability proportional to size (PPS) and households being selected using the simple random
sampling. The overall sample size was 820 children aged between 0 and 23 months from the
survey area. Both qualitative and quantitative data was collected by a set of six teams of 2
enumerators and 1 team leader. The teams were given a four days training including the piloting
exercise.
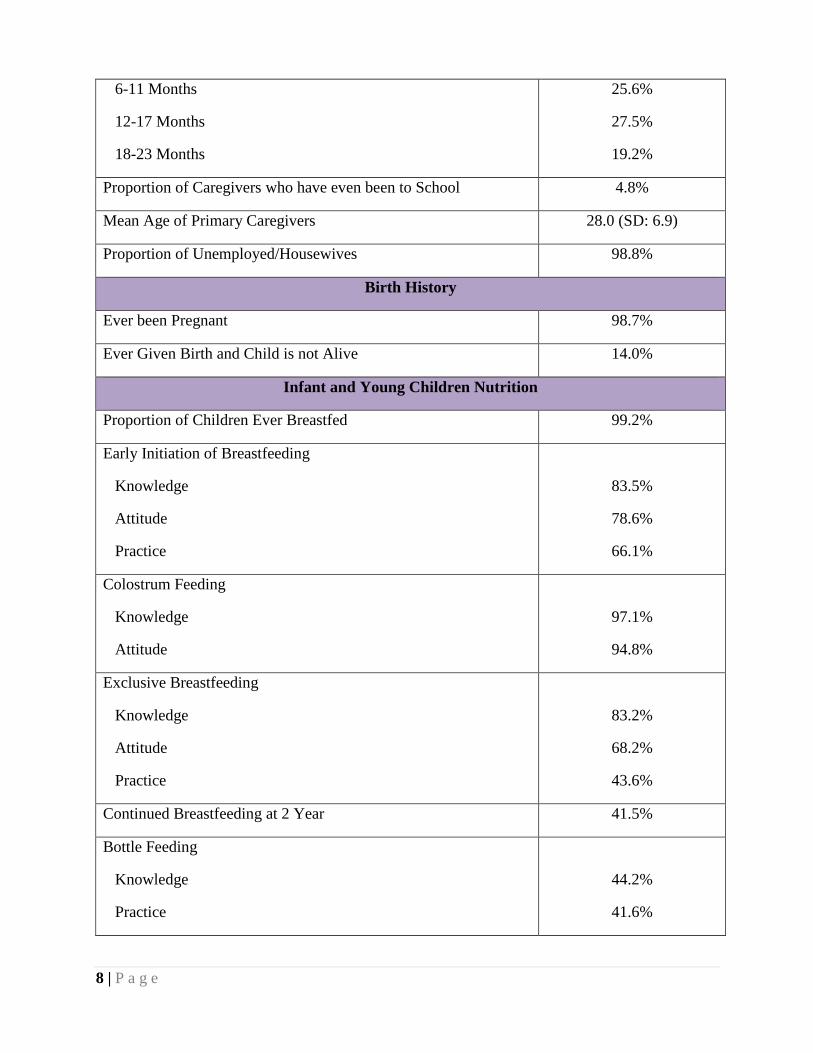
The table below presents the summary of the indicators collected during the assessment:
Indicators Statistic/Prevalence
Demographic Characteristics
Number of Children Sampled 796
Sex Ratio: Boys: Girls 0.88
Age Distribution
0-5 Months
27.6%
1 2009 Kenya Population and Housing Census, KNBS
8 | P a g e
6-11 Months
12-17 Months
18-23 Months
25.6%
27.5%
19.2%
Proportion of Caregivers who have even been to School 4.8%
Mean Age of Primary Caregivers 28.0 (SD: 6.9)
Proportion of Unemployed/Housewives 98.8%
Birth History
Ever been Pregnant 98.7%
Ever Given Birth and Child is not Alive 14.0%
Infant and Young Children Nutrition
Proportion of Children Ever Breastfed 99.2%
Early Initiation of Breastfeeding
Knowledge
Attitude
Practice
83.5%
78.6%
66.1%
Colostrum Feeding
Knowledge
Attitude
97.1%
94.8%
Exclusive Breastfeeding
Knowledge
Attitude
Practice
83.2%
68.2%
43.6%
Continued Breastfeeding at 2 Year 41.5%
Bottle Feeding
Knowledge
Practice
44.2%
41.6%
9 | P a g e
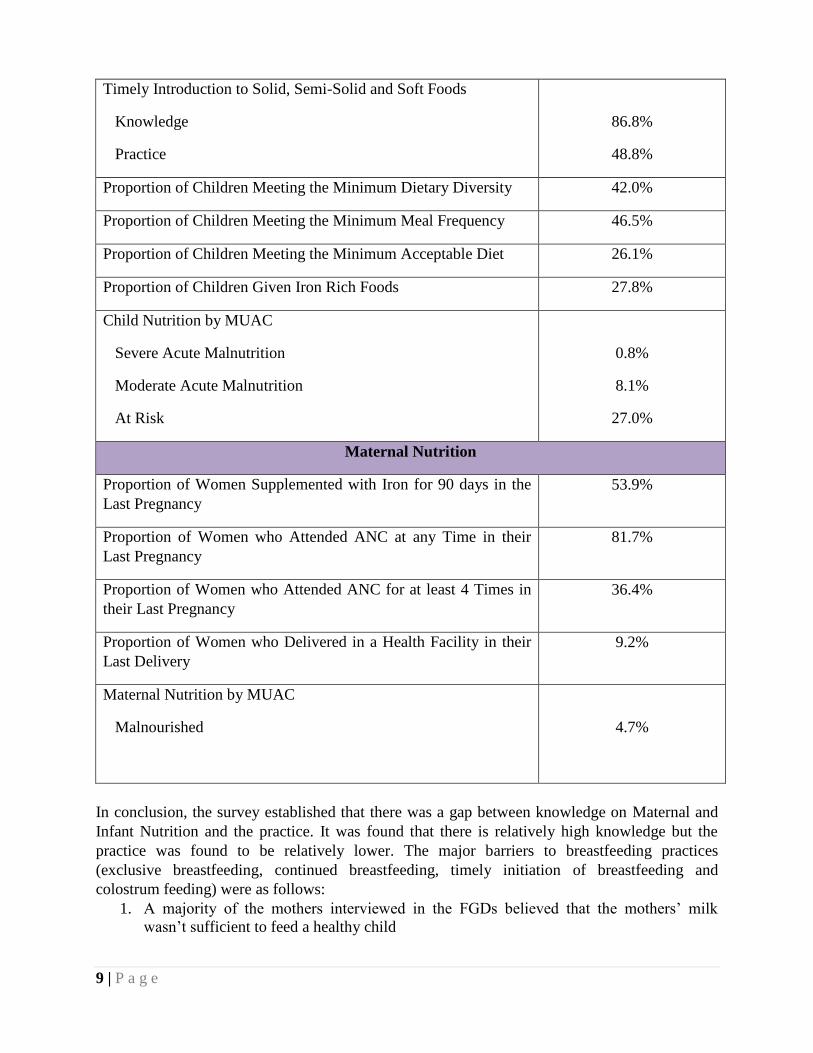
Timely Introduction to Solid, Semi-Solid and Soft Foods
Knowledge
Practice
86.8%
48.8%
Proportion of Children Meeting the Minimum Dietary Diversity 42.0%
Proportion of Children Meeting the Minimum Meal Frequency 46.5%
Proportion of Children Meeting the Minimum Acceptable Diet 26.1%
Proportion of Children Given Iron Rich Foods 27.8%
Child Nutrition by MUAC
Severe Acute Malnutrition
Moderate Acute Malnutrition
At Risk
0.8%
8.1%
27.0%
Maternal Nutrition
Proportion of Women Supplemented with Iron for 90 days in the
Last Pregnancy
53.9%
Proportion of Women who Attended ANC at any Time in their
Last Pregnancy
81.7%
Proportion of Women who Attended ANC for at least 4 Times in
their Last Pregnancy
36.4%
Proportion of Women who Delivered in a Health Facility in their
Last Delivery
9.2%
Maternal Nutrition by MUAC
Malnourished
4.7%
In conclusion, the survey established that there was a gap between knowledge on Maternal and
Infant Nutrition and the practice. It was found that there is relatively high knowledge but the
practice was found to be relatively lower. The major barriers to breastfeeding practices
(exclusive breastfeeding, continued breastfeeding, timely initiation of breastfeeding and
colostrum feeding) were as follows:
1. A majority of the mothers interviewed in the FGDs believed that the mothers’ milk
wasn’t sufficient to feed a healthy child
10 | P a g e
2. The grandmothers influence was also found to inhibit proper breastfeeding practices in
the survey area
3. Workload (which involved fetching firewood and water) was also cited to be a major
barrier to breastfeeding practices since the caregivers usually left their children with the
grandmothers while away and the grandmothers usually fed the children.
4. Short birth spacing was also found to be a big barrier to proper breastfeeding
The survey also noted the following as the major barriers to the feeding practices (minimum
dietary diversity, minimum meal frequency, minimum acceptable diet and iron rich foods)
1. Unavailability of the diversified food in the market coupled with high cost of purchasing
the available diversified food
2. Prolonged drought in the survey area coupled with overreliance on livestock products
such as milk and meat have hindered greatly on the diet diversification since most of the
animals had moved in search of pasture and water
3. It was also determined that the food consumed at the household level was based on the
family pot and no special foods were prepared for the child and due to the cultural
preference of foods high in starch (rice. pasta, anjera) and milk (cow/camel) which are
easily available and affordable.
Based on the conclusions of the survey, the following are recommended:
1. Strengthening the existing mother-to-mother support groups (MTMSGs) and involving a
component of cooking demonstrations in order for the caregivers to accept and adopt a
variety of foods to feed their children.
2. Scale up the kitchen gardens initiative as an initiative to curb the low dietary diversity
which is a proxy indicator of micronutrient deficiency. These can be linked with the
MTMSGs.
3. Scale up community strategy which supports community level health and nutrition. The
community units should then be utilized to spearhead MIYCN activities at the
community level.
11 | P a g e
CHAPTER ONE – BACKGROUND AND METHODOLOGY
1.1 Background
Wajir County in the former North Eastern Province has a total population of 661,9412 and is
ranked 27th
in the country in terms of population. The county has a surface area of 56,686 KM
Squared and is ranked 3rd
in the country in terms of surface area. Wajir County has a population
density of 12 people per kilometer which is ranked 43rd
in the country. According to the Kenya
integrated Household and Budget Survey (2006), Wajir County has a poverty rate of 84.0%
which is ranked 45th
in the country and almost twice the country poverty rate of 47%. The county
is classified as Arid and Semi-Arid Lands (ASALs).
According to National Draught Management Authority (NDMA), Wajir County has five main
livelihood zones namely; Agro-pastoral, Pastoral–camel, pastoral– cattle, pastoral- all species
and irrigated farming/ mixed farming in parts of Wajir North Sub County. SMART nutrition
surveys conducted in June, 2014 showed GAM rates were ranging from 8.8% to 20.6% in Wajir
North and Wajir West/ Eldas Sub-Counties respectively. This indicated the nutrition situation
was classified as serious for Wajir West/Eldas according to WHO classification. Among the key
factors associated with high malnutrition rates are poor Maternal Infant and Young Child
Nutrition (MIYCN) practices, poor hygiene and sanitation with sub-optimal hand washing
practices and minimal treatment of drinking water at the household level. In response, Islamic
Relief together with other non-governmental organizations (NGOs) have established operations
in the counties to support the County governments to scale up delivery of high impact nutrition
interventions.
IRK with funding from ECHO and DFID has been supporting the County Ministry of health to
implement nutrition activities in Wajir County (Wajir West, Eldas and Wajir North sub counties)
to reduce morbidity and mortality in children under 5, pregnant and lactating mothers associated
with malnutrition. The programs have adopted an integrated emergency and rehabilitation
approach to prevent malnutrition and treat the acutely malnourished. Within the project, IRK is
implementing Maternal, Infant and Young Child Nutrition (MIYCN) activities whose primary
goal is to improve child survival through appropriate Maternal Infant and Young Child Nutrition
by capacity building and providing technical support to the Department of Health at the County
Level. IRK is also carrying out various health, nutrition and hygiene promotion activities in the
region.
To better, address the behaviors that act as barriers to adequate infant young child nutrition; IRK
undertook a Knowledge, Attitude and Practice (KAP) Survey in Wajir North, West and Eldas
Sub-Counties as one survey area with the aim of measuring changes in the knowledge, attitudes
and practices of the target communities in relation to MIYCN, sanitation and hygiene.
2 2009 Kenya Population and Housing Census, KNBS
12 | P a g e
1.2 Survey Objectives
1.2.1 Rationale of the Survey
The main purpose of this KAP survey is to generate and document evidence on existing
knowledge, attitudes and practices towards MIYCN among communities in Wajir County (Wajir
North, West and Eldas), with a focus on factors of influence (predisposers, reinforcers,
facilitators or inhibitors). The survey will create better understanding of existing knowledge,
attitudes and practices on pre-and post-natal nutritional care, dietary practices during pregnancy,
post-natal dietary practices, breastfeeding (initiation of breastfeeding, exclusive breastfeeding,
and continued breast feeding with complementary food), complimentary feeding, Water,
Sanitation and Hygiene practices, and obstacles to MIYCN practices
1.2.2 Objective of the Survey
The general objective of this KAP survey is to generate and document evidence on existing
knowledge, attitudes and practices towards MIYCN among communities in Wajir North, Eldas
and Wajir West Sub-Counties
1. To determine existing knowledge, attitudes and practices on MIYCN, sanitation and
hygiene among the target population
2. To identify primary and secondary barriers to adequate MIYCN, sanitation and hygiene
practices.
3. To generate baseline data on existing attitudes and practices in MIYCN, and as part of a
framework for monitoring progress.
4. To provide essential data for formulation of key messages and required areas of focus for
county MIYCN interventions
5. To determine community awareness/knowledge on other HINI services
1.2.3 Area Surveyed
The survey was conducted in Wajir North, Eldas, and Wajir West Sub-Counties in Wajir County,
North Eastern region.
1.3 Survey Methodology
1.3.1 Survey Design
The survey applied a two stage cluster sampling with the clusters being selected using the
probability proportional to size (PPS). Stage one sampling was the selection of the clusters
included in the survey while the second stage sampling was the selection of households from the
sampled clusters.
13 | P a g e
1.3.2 Target Population
The target population for this survey was the children aged between 0 and 23 months and their
primary caregivers residing in the survey area.
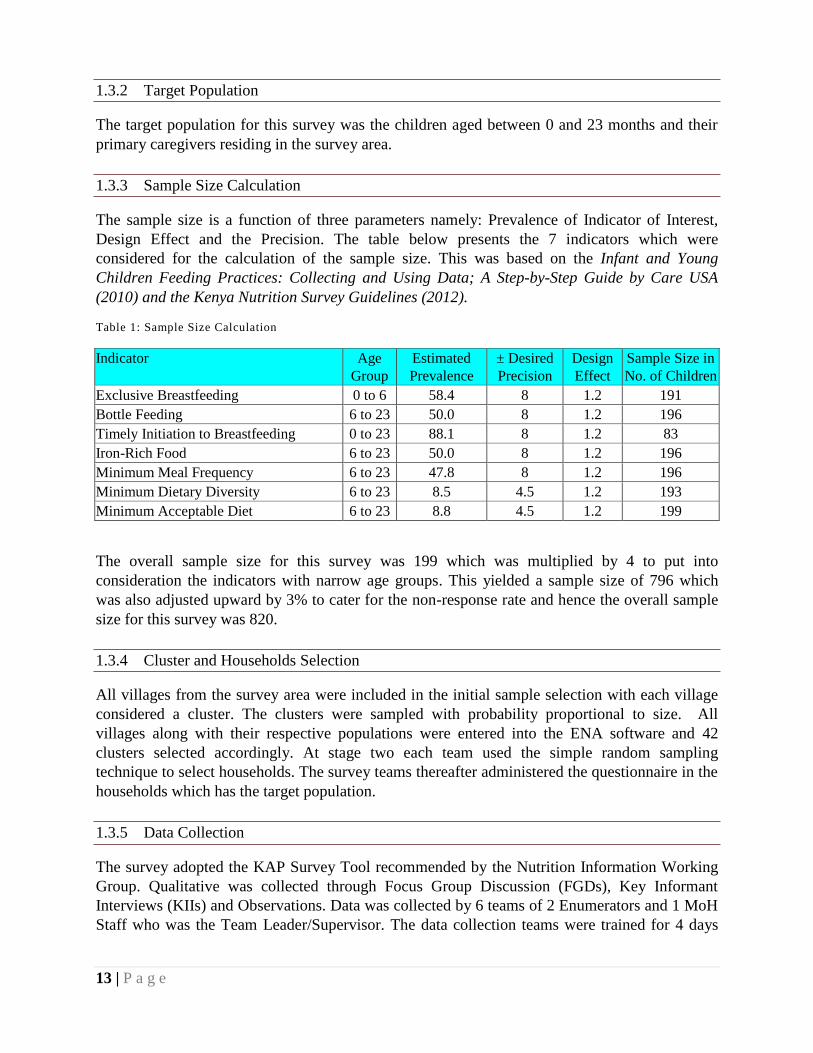
1.3.3 Sample Size Calculation
The sample size is a function of three parameters namely: Prevalence of Indicator of Interest,
Design Effect and the Precision. The table below presents the 7 indicators which were
considered for the calculation of the sample size. This was based on the Infant and Young
Children Feeding Practices: Collecting and Using Data; A Step-by-Step Guide by Care USA
(2010) and the Kenya Nutrition Survey Guidelines (2012).
Table 1: Sample Size Calculation
Indicator Age
Group
Estimated
Prevalence
± Desired
Precision
Design
Effect
Sample Size in
No. of Children
Exclusive Breastfeeding 0 to 6 58.4 8 1.2 191
Bottle Feeding 6 to 23 50.0 8 1.2 196
Timely Initiation to Breastfeeding 0 to 23 88.1 8 1.2 83
Iron-Rich Food 6 to 23 50.0 8 1.2 196
Minimum Meal Frequency 6 to 23 47.8 8 1.2 196
Minimum Dietary Diversity 6 to 23 8.5 4.5 1.2 193
Minimum Acceptable Diet 6 to 23 8.8 4.5 1.2 199
The overall sample size for this survey was 199 which was multiplied by 4 to put into
consideration the indicators with narrow age groups. This yielded a sample size of 796 which
was also adjusted upward by 3% to cater for the non-response rate and hence the overall sample
size for this survey was 820.
1.3.4 Cluster and Households Selection
All villages from the survey area were included in the initial sample selection with each village
considered a cluster. The clusters were sampled with probability proportional to size. All
villages along with their respective populations were entered into the ENA software and 42
clusters selected accordingly. At stage two each team used the simple random sampling
technique to select households. The survey teams thereafter administered the questionnaire in the
households which has the target population.
1.3.5 Data Collection
The survey adopted the KAP Survey Tool recommended by the Nutrition Information Working
Group. Qualitative was collected through Focus Group Discussion (FGDs), Key Informant
Interviews (KIIs) and Observations. Data was collected by 6 teams of 2 Enumerators and 1 MoH
Staff who was the Team Leader/Supervisor. The data collection teams were trained for 4 days
14 | P a g e
which also included the piloting of the data collection tool while data collection took place for 7
days.
1.3.6 Data Entry and Analysis
Quantitative Data Entry was done using CSPro Version 5.0.2 while Data Analysis was done
using SPSS Version 17. On the other hand, the qualitative data was analyzed though content
analysis and triangulated with the quantitative data.
15 | P a g e
CHAPTER TWO: FINDINGS AND DISCUSSIONS
2.1 Introduction
The Knowledge, Attitude and Practice (KAP) survey intended to generate and document
evidence on existing knowledge, attitudes, and practices towards Maternal, Infant and Young
Children Nutrition among the communities living in Wajir North, Eldas, and Wajir West Sub-
Counties of Wajir County in Northern Kenya. Nutrition is very important for everyone and
especially for children because it is directly linked to all aspects of their growth and
development3. Most importantly, the period from conception to two years of age (the first 1000
days) is important for optimal growth, health, and development. Nevertheless, this period is often
marked by growth faltering, micronutrient deficiencies, and common childhood illnesses such as
diarrhea and acute respiratory infections (ARI). On the other hand, a woman’s nutrition status
has important implication for her health as well as the health of her unborn child. Malnutrition, in
women results in reduced productivity, an increased susceptibility to infections, slow recovery
from illnesses and heightened risks of adverse pregnancy outcome4. This chapter therefore
presents the results of the survey findings as well as the discussions.
2.2 Households Demographics and Economic Characteristics
This section summarizes the demographic and socio-economic characteristics of the population
in the households sampled for the MIYCN KAP Survey. In this survey, a household was defined
as a group of people, either related or not-related, who live together and share a common cooking
pot.
2.2.1: Demographic Characteristics
Among the demographic characteristics included in the analysis are marital status, age, religion,
and level of education.
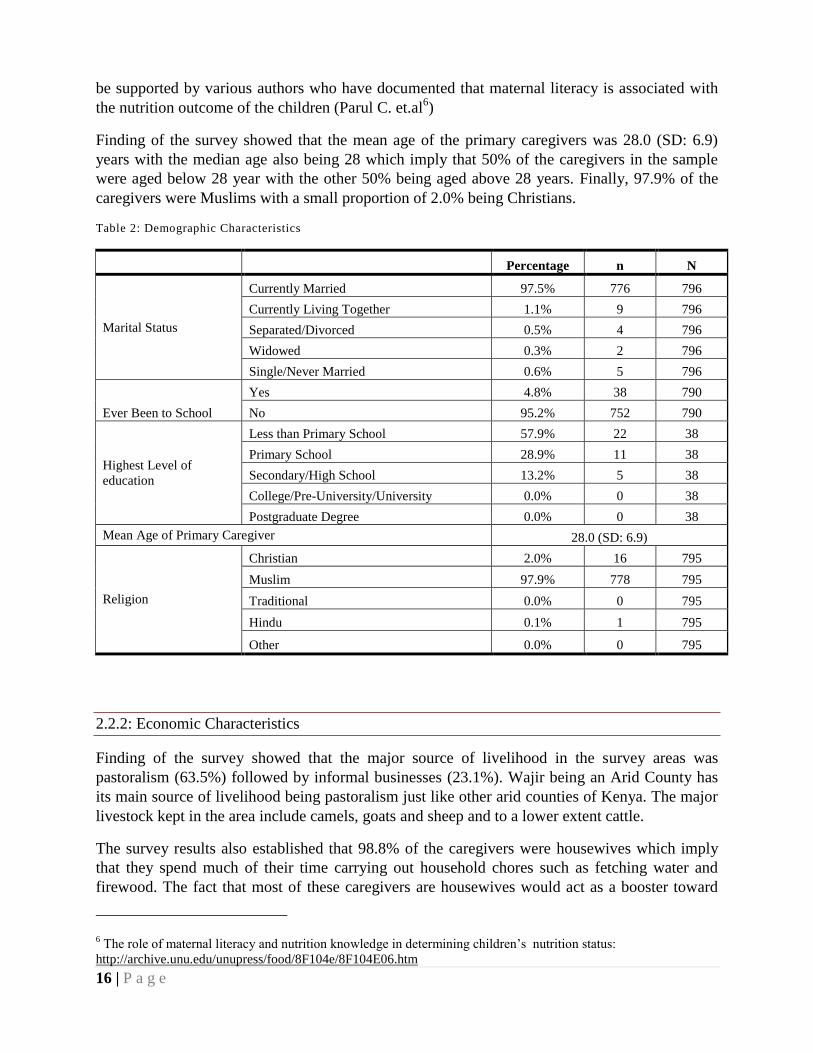
Table 4 below shows that majority (97.5%) of the primary caregivers reported that they were
married while 1.1% reported that they were currently living5 together with the spouse. The
results also showed that 95.2% of the caregivers have never been to school which then may
imply that the literacy level among the caregivers in the survey area is quite low. Further, out of
the caregivers who reported having gone to school, 57.9% reported that the highest level of
education they achieved was “less than primary school” and hence may imply that they dropped
out of school before sitting for their primary certificate education. This also demonstrates low
literacy among the caregivers which may have a negative implication on the feeding practices for
their children, and finally impact negatively on the nutrition outcome of the children. This may
3 http://www.childrensheartcenter.org/whyisnutritionimportantforchildren.html
4 Kenya Demographic Health Survey, 2008/2009
5 Currently living together meant that the spouse and the respondent were not “traditionally married” but cohabiting
together
16 | P a g e
be supported by various authors who have documented that maternal literacy is associated with
the nutrition outcome of the children (Parul C. et.al6)
Finding of the survey showed that the mean age of the primary caregivers was 28.0 (SD: 6.9)
years with the median age also being 28 which imply that 50% of the caregivers in the sample
were aged below 28 year with the other 50% being aged above 28 years. Finally, 97.9% of the
caregivers were Muslims with a small proportion of 2.0% being Christians.
Table 2: Demographic Characteristics
Percentage n N
Marital Status
Currently Married 97.5% 776 796
Currently Living Together 1.1% 9 796
Separated/Divorced 0.5% 4 796
Widowed 0.3% 2 796
Single/Never Married 0.6% 5 796
Ever Been to School
Yes 4.8% 38 790
No 95.2% 752 790
Highest Level of
education
Less than Primary School 57.9% 22 38
Primary School 28.9% 11 38
Secondary/High School 13.2% 5 38
College/Pre-University/University 0.0% 0 38
Postgraduate Degree 0.0% 0 38
Mean Age of Primary Caregiver 28.0 (SD: 6.9)
Religion
Christian 2.0% 16 795
Muslim 97.9% 778 795
Traditional 0.0% 0 795
Hindu 0.1% 1 795
Other 0.0% 0 795
2.2.2: Economic Characteristics
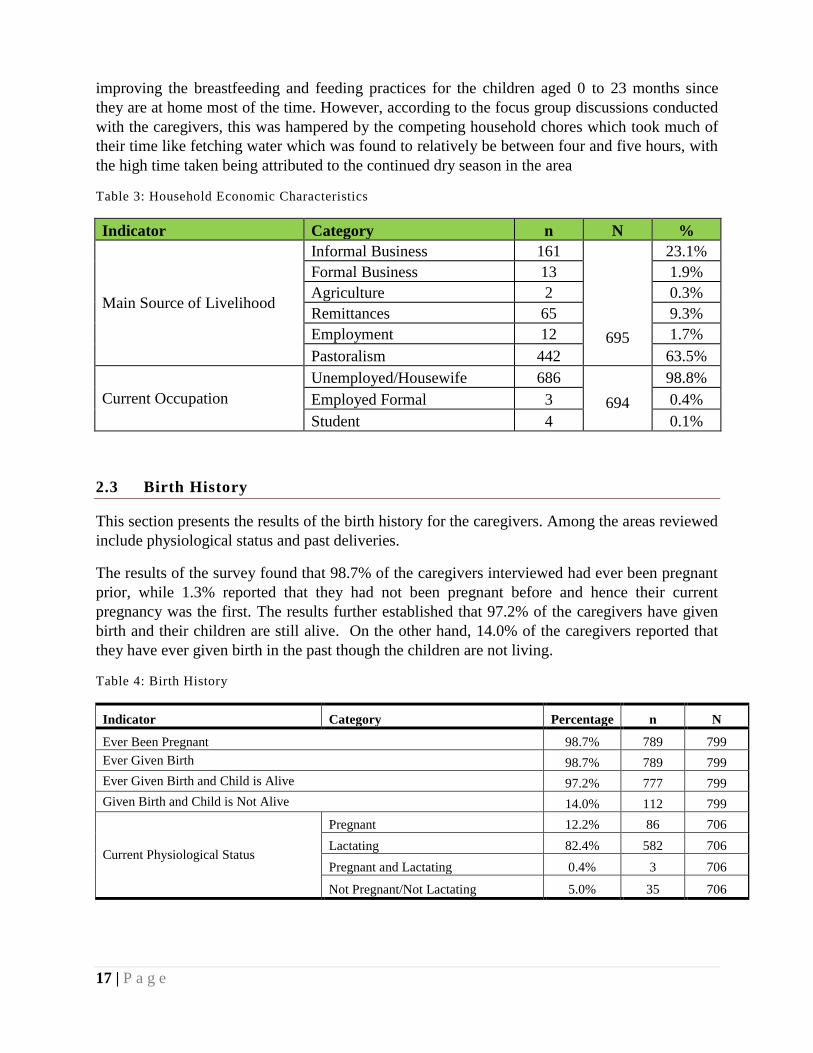
Finding of the survey showed that the major source of livelihood in the survey areas was
pastoralism (63.5%) followed by informal businesses (23.1%). Wajir being an Arid County has
its main source of livelihood being pastoralism just like other arid counties of Kenya. The major
livestock kept in the area include camels, goats and sheep and to a lower extent cattle.
The survey results also established that 98.8% of the caregivers were housewives which imply
that they spend much of their time carrying out household chores such as fetching water and
firewood. The fact that most of these caregivers are housewives would act as a booster toward
6 The role of maternal literacy and nutrition knowledge in determining children’s nutrition status:
http://archive.unu.edu/unupress/food/8F104e/8F104E06.htm
17 | P a g e
improving the breastfeeding and feeding practices for the children aged 0 to 23 months since
they are at home most of the time. However, according to the focus group discussions conducted
with the caregivers, this was hampered by the competing household chores which took much of
their time like fetching water which was found to relatively be between four and five hours, with
the high time taken being attributed to the continued dry season in the area
Table 3: Household Economic Characteristics
Indicator Category n N %
Main Source of Livelihood
Informal Business 161
695
23.1%
Formal Business 13 1.9%
Agriculture 2 0.3%
Remittances 65 9.3%
Employment 12 1.7%
Pastoralism 442 63.5%
Current Occupation
Unemployed/Housewife 686
694
98.8%
Employed Formal 3 0.4%
Student 4 0.1%
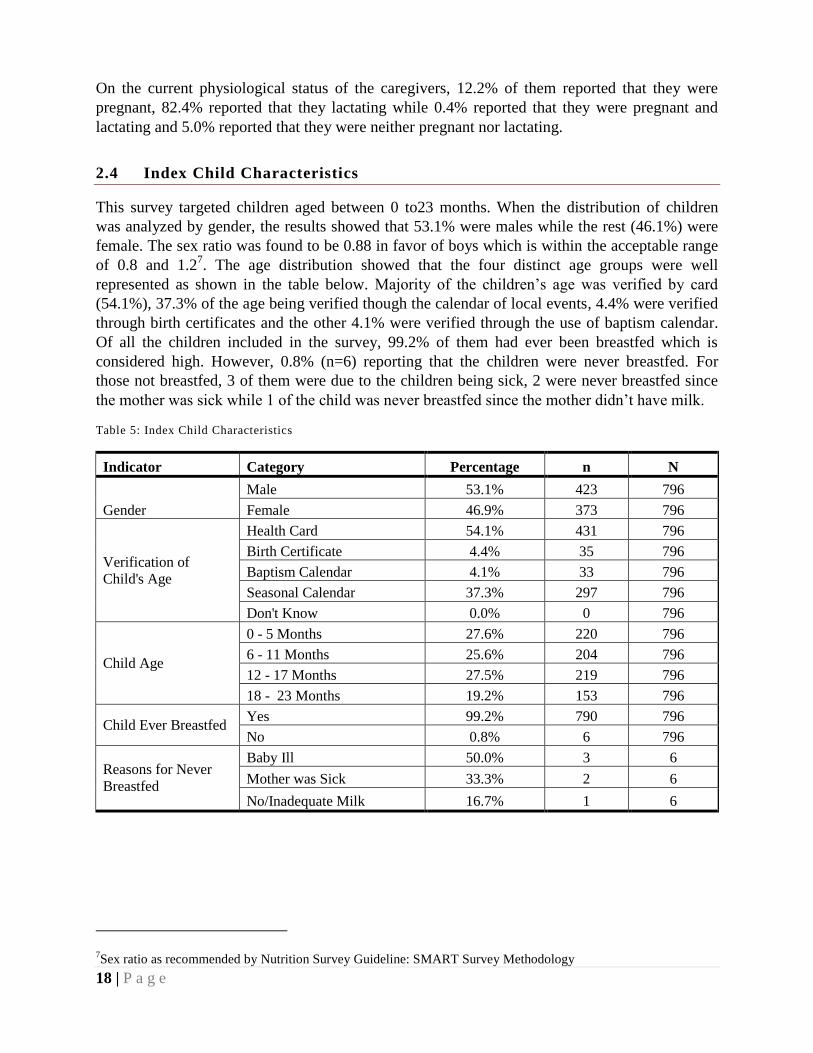
2.3 Birth History
This section presents the results of the birth history for the caregivers. Among the areas reviewed
include physiological status and past deliveries.
The results of the survey found that 98.7% of the caregivers interviewed had ever been pregnant
prior, while 1.3% reported that they had not been pregnant before and hence their current
pregnancy was the first. The results further established that 97.2% of the caregivers have given
birth and their children are still alive. On the other hand, 14.0% of the caregivers reported that
they have ever given birth in the past though the children are not living.
Table 4: Birth History
Indicator Category Percentage n N
Ever Been Pregnant 98.7% 789 799
Ever Given Birth 98.7% 789 799
Ever Given Birth and Child is Alive 97.2% 777 799
Given Birth and Child is Not Alive 14.0% 112 799
Current Physiological Status
Pregnant 12.2% 86 706
Lactating 82.4% 582 706
Pregnant and Lactating 0.4% 3 706
Not Pregnant/Not Lactating 5.0% 35 706
18 | P a g e
On the current physiological status of the caregivers, 12.2% of them reported that they were
pregnant, 82.4% reported that they lactating while 0.4% reported that they were pregnant and
lactating and 5.0% reported that they were neither pregnant nor lactating.
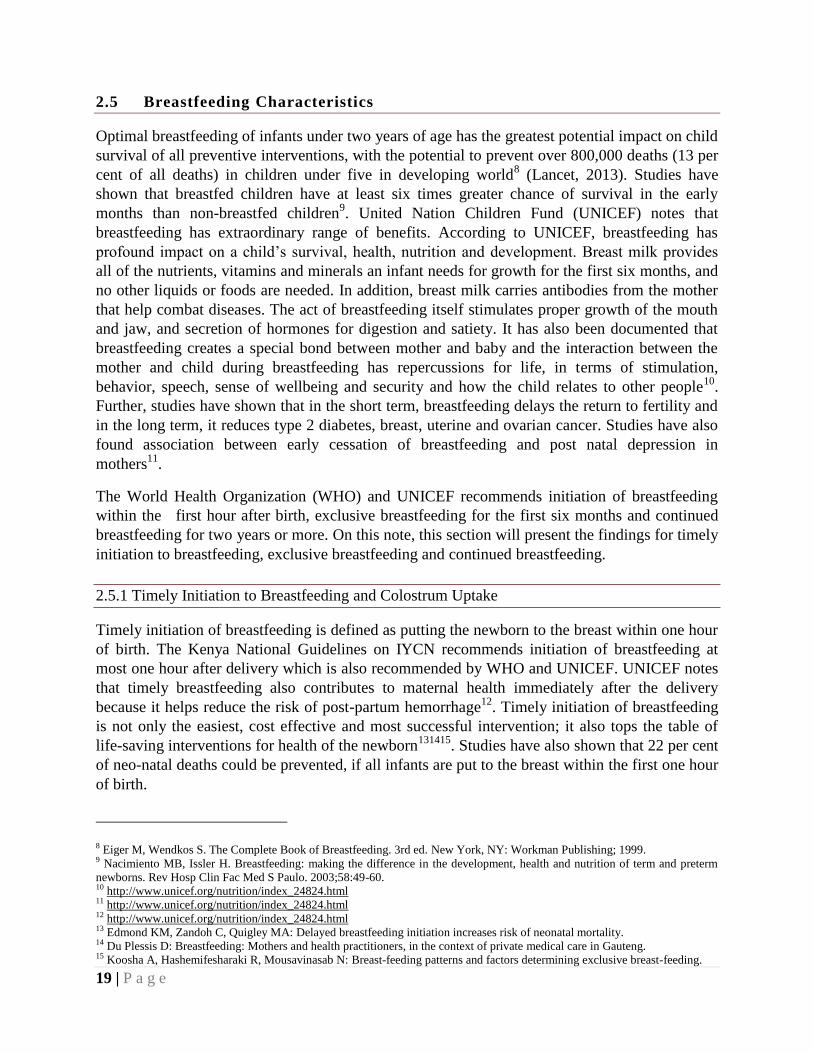
2.4 Index Child Characteristics
This survey targeted children aged between 0 to23 months. When the distribution of children
was analyzed by gender, the results showed that 53.1% were males while the rest (46.1%) were
female. The sex ratio was found to be 0.88 in favor of boys which is within the acceptable range
of 0.8 and 1.27. The age distribution showed that the four distinct age groups were well
represented as shown in the table below. Majority of the children’s age was verified by card
(54.1%), 37.3% of the age being verified though the calendar of local events, 4.4% were verified
through birth certificates and the other 4.1% were verified through the use of baptism calendar.
Of all the children included in the survey, 99.2% of them had ever been breastfed which is
considered high. However, 0.8% (n=6) reporting that the children were never breastfed. For
those not breastfed, 3 of them were due to the children being sick, 2 were never breastfed since
the mother was sick while 1 of the child was never breastfed since the mother didn’t have milk.
Table 5: Index Child Characteristics
Indicator Category Percentage n N
Gender
Male 53.1% 423 796
Female 46.9% 373 796
Verification of
Child's Age
Health Card 54.1% 431 796
Birth Certificate 4.4% 35 796
Baptism Calendar 4.1% 33 796
Seasonal Calendar 37.3% 297 796
Don't Know 0.0% 0 796
Child Age
0 - 5 Months 27.6% 220 796
6 - 11 Months 25.6% 204 796
12 - 17 Months 27.5% 219 796
18 - 23 Months 19.2% 153 796
Child Ever Breastfed Yes 99.2% 790 796
No 0.8% 6 796
Reasons for Never
Breastfed
Baby Ill 50.0% 3 6
Mother was Sick 33.3% 2 6
No/Inadequate Milk 16.7% 1 6
7Sex ratio as recommended by Nutrition Survey Guideline: SMART Survey Methodology
19 | P a g e
2.5 Breastfeeding Characteristics
Optimal breastfeeding of infants under two years of age has the greatest potential impact on child
survival of all preventive interventions, with the potential to prevent over 800,000 deaths (13 per
cent of all deaths) in children under five in developing world8 (Lancet, 2013). Studies have
shown that breastfed children have at least six times greater chance of survival in the early
months than non-breastfed children9. United Nation Children Fund (UNICEF) notes that
breastfeeding has extraordinary range of benefits. According to UNICEF, breastfeeding has
profound impact on a child’s survival, health, nutrition and development. Breast milk provides
all of the nutrients, vitamins and minerals an infant needs for growth for the first six months, and
no other liquids or foods are needed. In addition, breast milk carries antibodies from the mother
that help combat diseases. The act of breastfeeding itself stimulates proper growth of the mouth
and jaw, and secretion of hormones for digestion and satiety. It has also been documented that
breastfeeding creates a special bond between mother and baby and the interaction between the
mother and child during breastfeeding has repercussions for life, in terms of stimulation,
behavior, speech, sense of wellbeing and security and how the child relates to other people10
.
Further, studies have shown that in the short term, breastfeeding delays the return to fertility and
in the long term, it reduces type 2 diabetes, breast, uterine and ovarian cancer. Studies have also
found association between early cessation of breastfeeding and post natal depression in
mothers11
.
The World Health Organization (WHO) and UNICEF recommends initiation of breastfeeding
within the first hour after birth, exclusive breastfeeding for the first six months and continued
breastfeeding for two years or more. On this note, this section will present the findings for timely
initiation to breastfeeding, exclusive breastfeeding and continued breastfeeding.
2.5.1 Timely Initiation to Breastfeeding and Colostrum Uptake
Timely initiation of breastfeeding is defined as putting the newborn to the breast within one hour
of birth. The Kenya National Guidelines on IYCN recommends initiation of breastfeeding at
most one hour after delivery which is also recommended by WHO and UNICEF. UNICEF notes
that timely breastfeeding also contributes to maternal health immediately after the delivery
because it helps reduce the risk of post-partum hemorrhage12
. Timely initiation of breastfeeding
is not only the easiest, cost effective and most successful intervention; it also tops the table of
life-saving interventions for health of the newborn131415
. Studies have also shown that 22 per cent
of neo-natal deaths could be prevented, if all infants are put to the breast within the first one hour
of birth.
8 Eiger M, Wendkos S. The Complete Book of Breastfeeding. 3rd ed. New York, NY: Workman Publishing; 1999. 9 Nacimiento MB, Issler H. Breastfeeding: making the difference in the development, health and nutrition of term and preterm
newborns. Rev Hosp Clin Fac Med S Paulo. 2003;58:49-60. 10 http://www.unicef.org/nutrition/index_24824.html 11 http://www.unicef.org/nutrition/index_24824.html 12 http://www.unicef.org/nutrition/index_24824.html 13 Edmond KM, Zandoh C, Quigley MA: Delayed breastfeeding initiation increases risk of neonatal mortality. 14 Du Plessis D: Breastfeeding: Mothers and health practitioners, in the context of private medical care in Gauteng. 15 Koosha A, Hashemifesharaki R, Mousavinasab N: Breast-feeding patterns and factors determining exclusive breast-feeding.
20 | P a g e
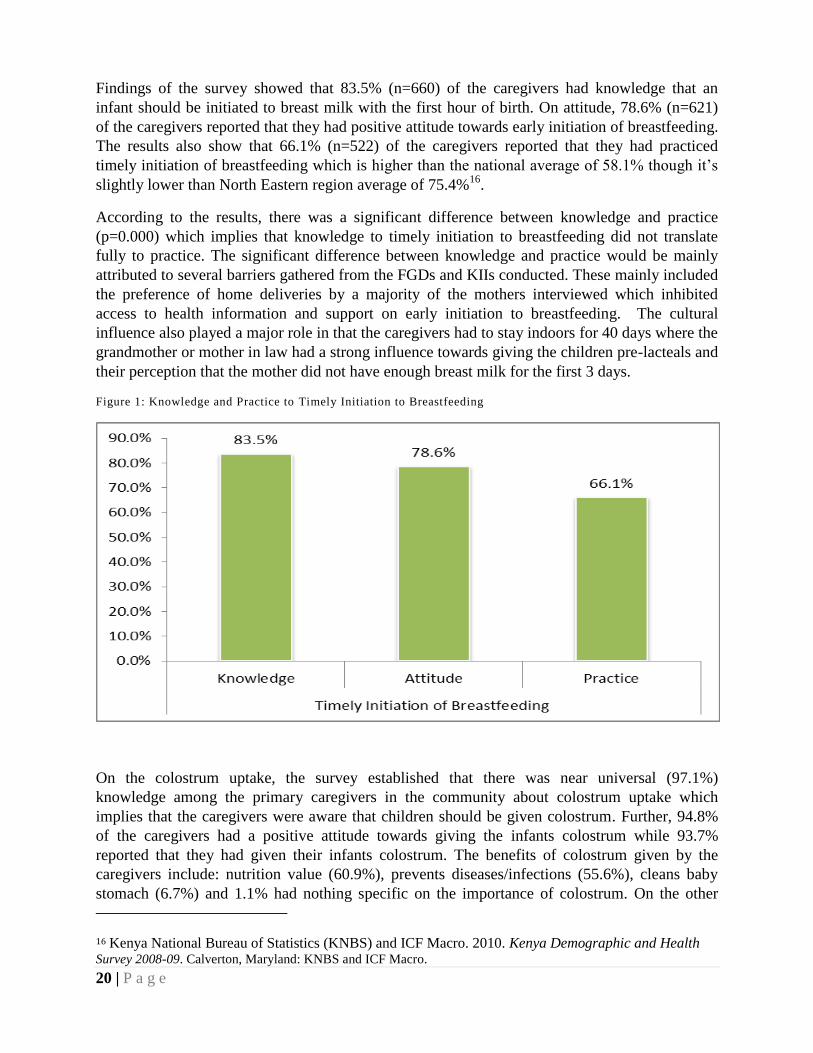
Findings of the survey showed that 83.5% (n=660) of the caregivers had knowledge that an
infant should be initiated to breast milk with the first hour of birth. On attitude, 78.6% (n=621)
of the caregivers reported that they had positive attitude towards early initiation of breastfeeding.
The results also show that 66.1% (n=522) of the caregivers reported that they had practiced
timely initiation of breastfeeding which is higher than the national average of 58.1% though it’s
slightly lower than North Eastern region average of 75.4%16
.
According to the results, there was a significant difference between knowledge and practice
(p=0.000) which implies that knowledge to timely initiation to breastfeeding did not translate
fully to practice. The significant difference between knowledge and practice would be mainly
attributed to several barriers gathered from the FGDs and KIIs conducted. These mainly included
the preference of home deliveries by a majority of the mothers interviewed which inhibited
access to health information and support on early initiation to breastfeeding. The cultural
influence also played a major role in that the caregivers had to stay indoors for 40 days where the
grandmother or mother in law had a strong influence towards giving the children pre-lacteals and
their perception that the mother did not have enough breast milk for the first 3 days.
Figure 1: Knowledge and Practice to Timely Initiation to Breastfeeding
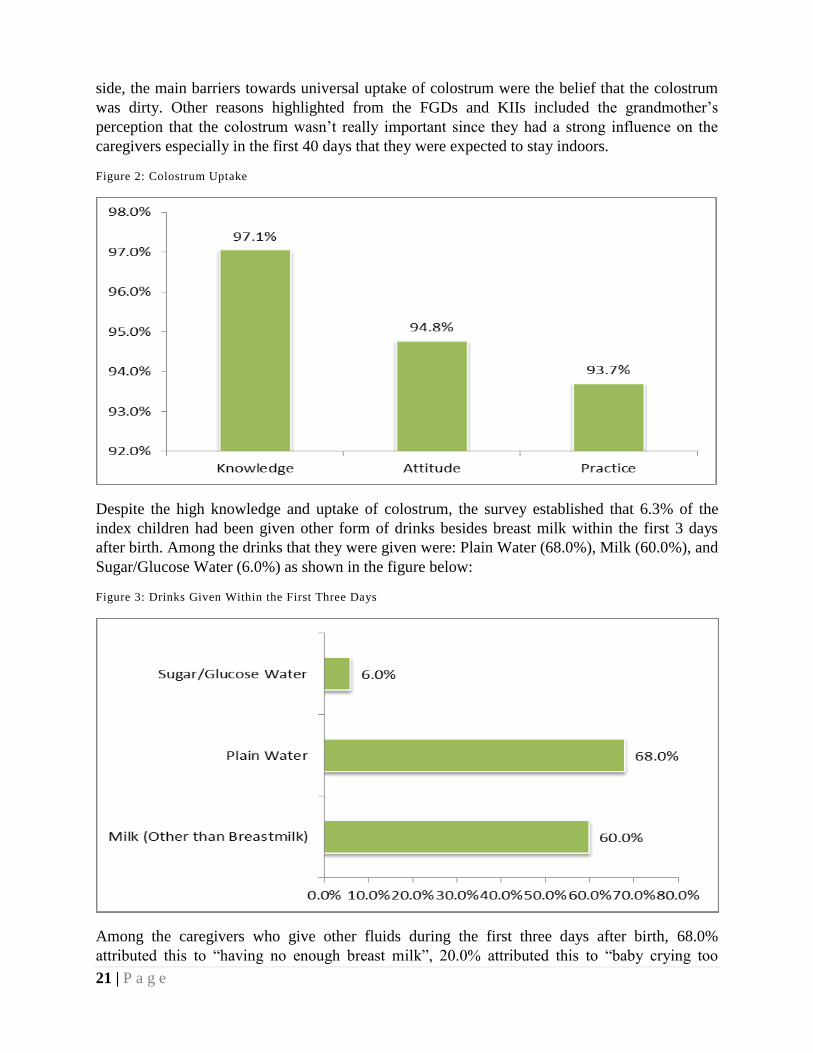
On the colostrum uptake, the survey established that there was near universal (97.1%)
knowledge among the primary caregivers in the community about colostrum uptake which
implies that the caregivers were aware that children should be given colostrum. Further, 94.8%
of the caregivers had a positive attitude towards giving the infants colostrum while 93.7%
reported that they had given their infants colostrum. The benefits of colostrum given by the
caregivers include: nutrition value (60.9%), prevents diseases/infections (55.6%), cleans baby
stomach (6.7%) and 1.1% had nothing specific on the importance of colostrum. On the other
16 Kenya National Bureau of Statistics (KNBS) and ICF Macro. 2010. Kenya Demographic and Health Survey 2008-09. Calverton, Maryland: KNBS and ICF Macro.
21 | P a g e
side, the main barriers towards universal uptake of colostrum were the belief that the colostrum
was dirty. Other reasons highlighted from the FGDs and KIIs included the grandmother’s
perception that the colostrum wasn’t really important since they had a strong influence on the
caregivers especially in the first 40 days that they were expected to stay indoors.
Figure 2: Colostrum Uptake
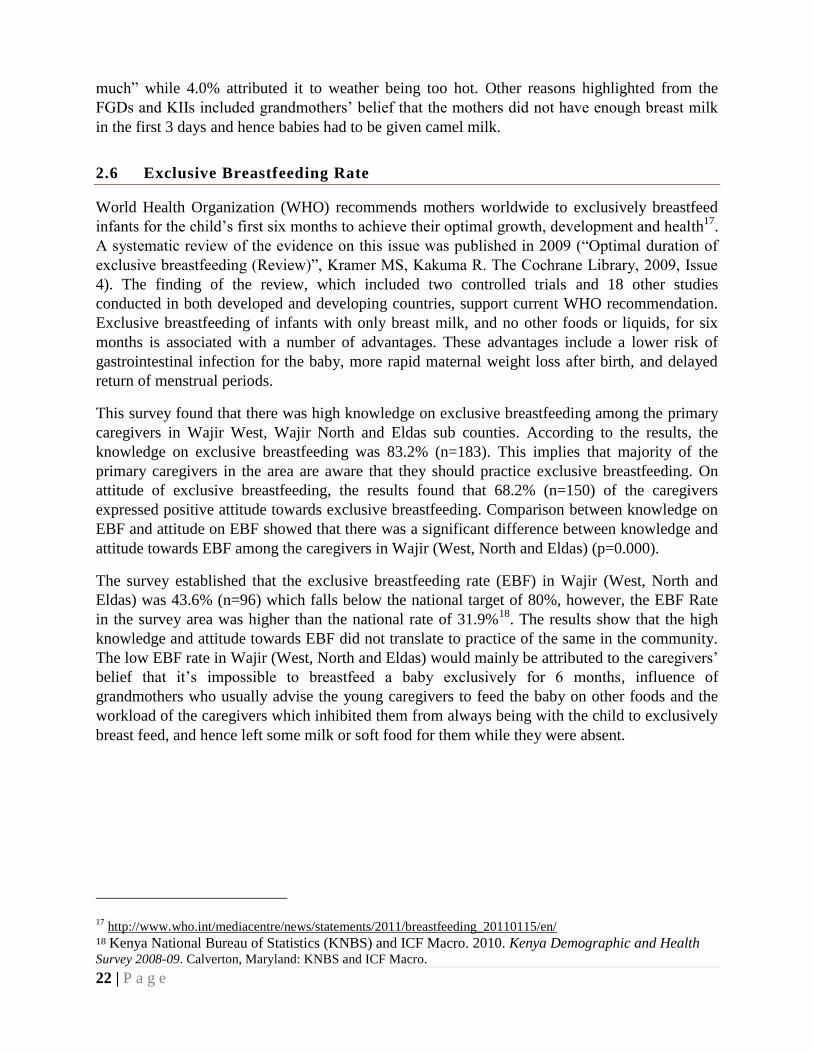
Despite the high knowledge and uptake of colostrum, the survey established that 6.3% of the
index children had been given other form of drinks besides breast milk within the first 3 days
after birth. Among the drinks that they were given were: Plain Water (68.0%), Milk (60.0%), and
Sugar/Glucose Water (6.0%) as shown in the figure below:
Figure 3: Drinks Given Within the First Three Days
Among the caregivers who give other fluids during the first three days after birth, 68.0%
attributed this to “having no enough breast milk”, 20.0% attributed this to “baby crying too
22 | P a g e
much” while 4.0% attributed it to weather being too hot. Other reasons highlighted from the
FGDs and KIIs included grandmothers’ belief that the mothers did not have enough breast milk
in the first 3 days and hence babies had to be given camel milk.
2.6 Exclusive Breastfeeding Rate
World Health Organization (WHO) recommends mothers worldwide to exclusively breastfeed
infants for the child’s first six months to achieve their optimal growth, development and health17
.
A systematic review of the evidence on this issue was published in 2009 (“Optimal duration of
exclusive breastfeeding (Review)”, Kramer MS, Kakuma R. The Cochrane Library, 2009, Issue
4). The finding of the review, which included two controlled trials and 18 other studies
conducted in both developed and developing countries, support current WHO recommendation.
Exclusive breastfeeding of infants with only breast milk, and no other foods or liquids, for six
months is associated with a number of advantages. These advantages include a lower risk of
gastrointestinal infection for the baby, more rapid maternal weight loss after birth, and delayed
return of menstrual periods.
This survey found that there was high knowledge on exclusive breastfeeding among the primary
caregivers in Wajir West, Wajir North and Eldas sub counties. According to the results, the
knowledge on exclusive breastfeeding was 83.2% (n=183). This implies that majority of the
primary caregivers in the area are aware that they should practice exclusive breastfeeding. On
attitude of exclusive breastfeeding, the results found that 68.2% (n=150) of the caregivers
expressed positive attitude towards exclusive breastfeeding. Comparison between knowledge on
EBF and attitude on EBF showed that there was a significant difference between knowledge and
attitude towards EBF among the caregivers in Wajir (West, North and Eldas) (p=0.000).
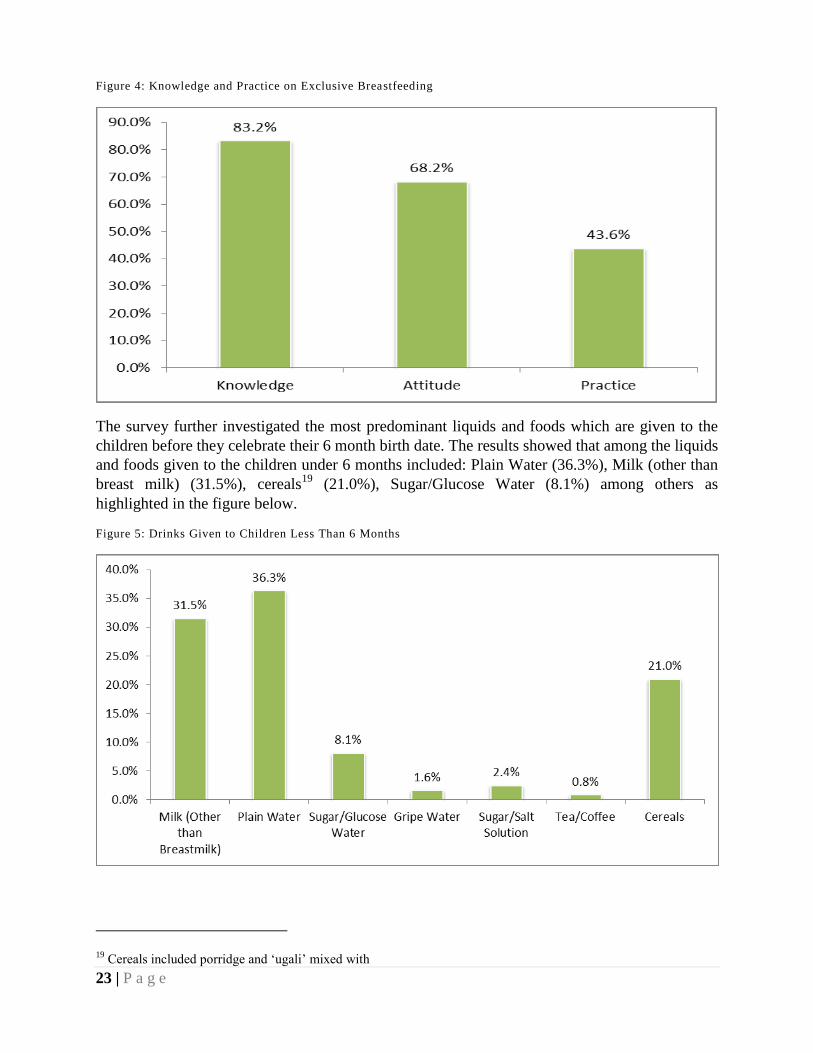
The survey established that the exclusive breastfeeding rate (EBF) in Wajir (West, North and
Eldas) was 43.6% (n=96) which falls below the national target of 80%, however, the EBF Rate
in the survey area was higher than the national rate of 31.9%18
. The results show that the high
knowledge and attitude towards EBF did not translate to practice of the same in the community.
The low EBF rate in Wajir (West, North and Eldas) would mainly be attributed to the caregivers’
belief that it’s impossible to breastfeed a baby exclusively for 6 months, influence of
grandmothers who usually advise the young caregivers to feed the baby on other foods and the
workload of the caregivers which inhibited them from always being with the child to exclusively
breast feed, and hence left some milk or soft food for them while they were absent.
17 http://www.who.int/mediacentre/news/statements/2011/breastfeeding_20110115/en/
18 Kenya National Bureau of Statistics (KNBS) and ICF Macro. 2010. Kenya Demographic and Health Survey 2008-09. Calverton, Maryland: KNBS and ICF Macro.
23 | P a g e
Figure 4: Knowledge and Practice on Exclusive Breastfeeding
The survey further investigated the most predominant liquids and foods which are given to the
children before they celebrate their 6 month birth date. The results showed that among the liquids
and foods given to the children under 6 months included: Plain Water (36.3%), Milk (other than
breast milk) (31.5%), cereals19
(21.0%), Sugar/Glucose Water (8.1%) among others as
highlighted in the figure below.
Figure 5: Drinks Given to Children Less Than 6 Months
19 Cereals included porridge and ‘ugali’ mixed with
24 | P a g e
2.7 Continued Breastfeeding
The World Health Organization recommends that a child should be breastfed up to 2 years of age
or beyond20
. Science has documented that some immune factors in breast milk that protect the
baby against infection are present in greater amounts in the second year of life than in the first.
This is, of course as it should be, since children older than a year are generally exposed to more
infections than young babies. Further, it has been observed that breast milk still contains special
growth factors that help the immune system to mature and which help the brain, gut and other
organs to develop and mature21
. Given the benefits of continued breastfeeding at two years, this
survey sought to establish the knowledge and practice around continued breastfeeding among the
caregivers in Wajir North, West and Eldas sub-Counties.
The survey established that 41.5% (n=56) practiced continued breastfeeding at 2 years at the
time of the survey. The results imply that majority of the caregivers in the area stop
breastfeeding before the children reach 20 months. The major reasons given by the primary
caregivers for stopping breastfeeding before 2 years included: mother refused to
breastfed(43.1%), recommendation from spouse (38.2%), baby was old enough to stop
breastfeeding (18.4%) and baby refused to suckle (11.9%).
2.8 Bottle Feeding
Bottle feeding is considered a negative practice for feeding children. It is recommended to
always feed the babies using clean open cups. Bottles which have nipples have been found to be
difficult to clean and can consequently cause a baby to become sick. The Kenya Ministry of
Health continues to discourage bottle feeding. The Ministry’s aim is to reduce bottle feeding to
less than 5% with the current national rate being estimated at 25%22
.
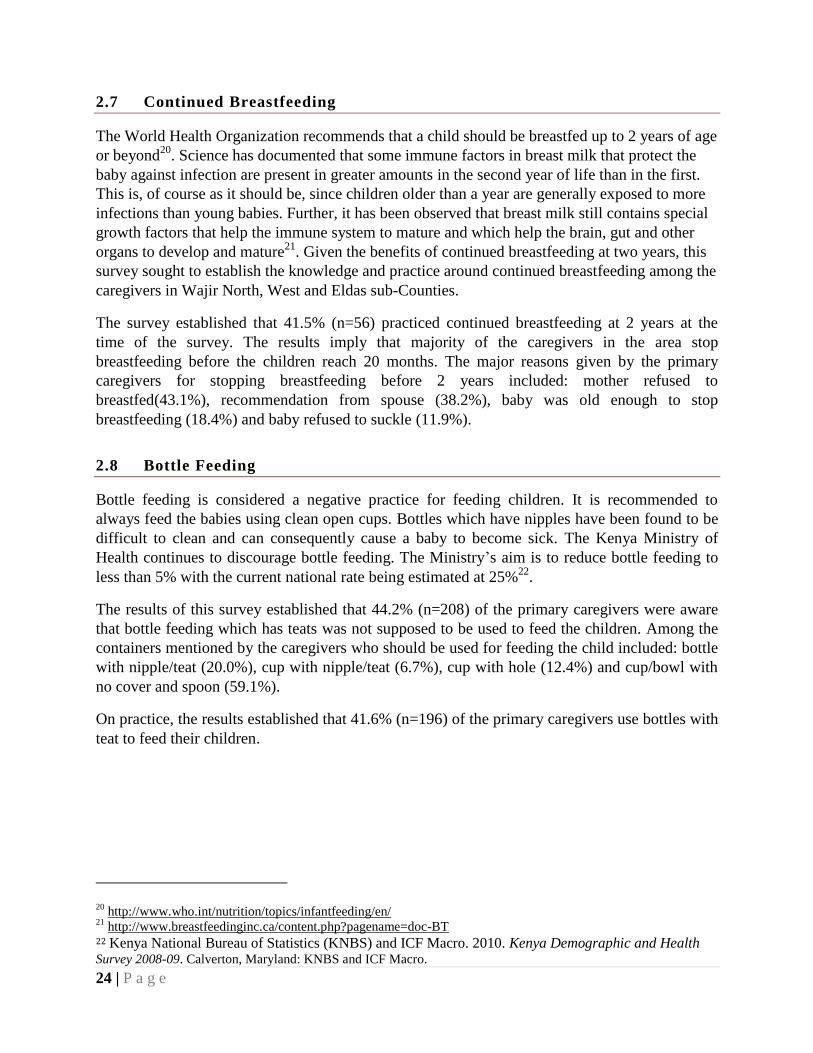
The results of this survey established that 44.2% (n=208) of the primary caregivers were aware
that bottle feeding which has teats was not supposed to be used to feed the children. Among the
containers mentioned by the caregivers who should be used for feeding the child included: bottle
with nipple/teat (20.0%), cup with nipple/teat (6.7%), cup with hole (12.4%) and cup/bowl with
no cover and spoon (59.1%).
On practice, the results established that 41.6% (n=196) of the primary caregivers use bottles with
teat to feed their children.
20 http://www.who.int/nutrition/topics/infantfeeding/en/
21 http://www.breastfeedinginc.ca/content.php?pagename=doc-BT
22 Kenya National Bureau of Statistics (KNBS) and ICF Macro. 2010. Kenya Demographic and Health Survey 2008-09. Calverton, Maryland: KNBS and ICF Macro.
25 | P a g e
Figure 6: Knowledge and Practice on Bottle Feeding
2.9 Introduction to Solid, Semi-Solid and Soft Foods
The transition from exclusive breastfeeding to family foods is referred to as complementary
feeding and it covers the period from 6 to 18-24 months of age which is a very vulnerable period.
It is the time when malnutrition starts in many infants, contributing significantly to high
prevalence of malnutrition in children under-five years of age worldwide. The WHO
recommends that complementary feeding should be timely, meaning that all infants should start
receiving foods in addition to breast milk from 6 months onwards. It should be adequate,
meaning that the complementary foods should be given in amounts, frequency, consistency and
variety to cover the nutritional needs of the growing child while maintaining breastfeeding.
Further, WHO recommends that infants start receiving complementary foods at 6 months of age
in addition to breast milk, initially 2-3 times a day between 6-8 months, increasing to 3-4 times
daily between 9-11 months and 12-24 months with additional nutritious snacks offered 1-2 times
per day, as desired.
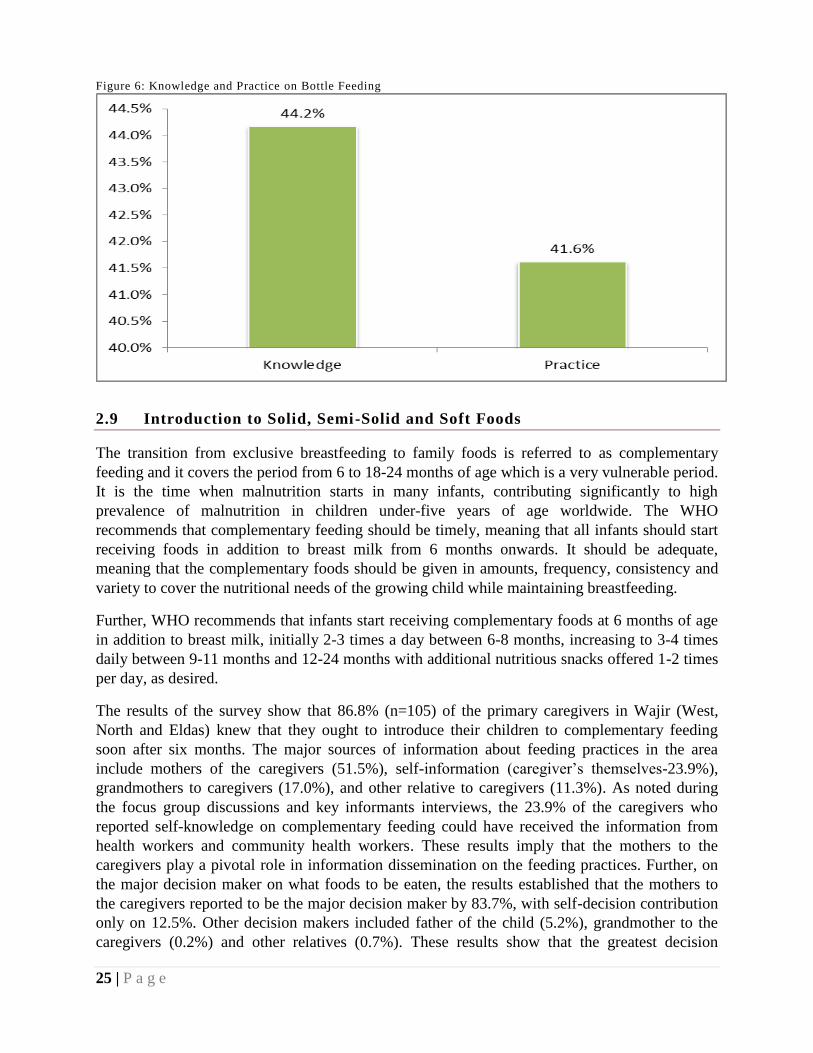
The results of the survey show that 86.8% (n=105) of the primary caregivers in Wajir (West,
North and Eldas) knew that they ought to introduce their children to complementary feeding
soon after six months. The major sources of information about feeding practices in the area
include mothers of the caregivers (51.5%), self-information (caregiver’s themselves-23.9%),
grandmothers to caregivers (17.0%), and other relative to caregivers (11.3%). As noted during
the focus group discussions and key informants interviews, the 23.9% of the caregivers who
reported self-knowledge on complementary feeding could have received the information from
health workers and community health workers. These results imply that the mothers to the
caregivers play a pivotal role in information dissemination on the feeding practices. Further, on
the major decision maker on what foods to be eaten, the results established that the mothers to
the caregivers reported to be the major decision maker by 83.7%, with self-decision contribution
only on 12.5%. Other decision makers included father of the child (5.2%), grandmother to the
caregivers (0.2%) and other relatives (0.7%). These results show that the greatest decision
26 | P a g e
makers in terms of the feeding practices of the children are the mothers of the caregivers (the
grandmothers to the child).
On practice, the results showed that only 48.8% (n=59) of the complementary feeding was
timely. According to the results, among the respondents who did not introduce their children to
complementary feeding reported that they had introduced their children before the age of six
months. The practice of timely complementary feeding is below the National Target of 80%.
Figure 7: Knowledge and Practice on Timely Complementary Feeding
2.10 Minimum Dietary Diversity
All people need a variety of foods to meet requirement for essential nutrients, and the value of a
diverse diet has long been recognized. Diversified diet is important for the infants and young
children since they need energy and nutrient-dense foods to grow and develop both physically
and mentally and to live a healthy life. Low dietary diversity has been associated with stunting. It
is recommended that infants and young children should consume foods from at least four
different food groups in addition to breast milk.
The results of the survey established that only 42.0% (n=198) of the children were found to have
fed with the minimum diet within the 24 hours prior to the survey which is below the national
target of 80%. This implies that only 42% of the children in the survey area met the minimum
required diet diversity. The minimum dietary diversity is also an indicator of food accessibility,
which in this context would mean that 42% of the children had poor accessibility to food. The
low dietary diversity in the area would mainly be attributed to several reasons which were
highlighted from the KIIs and FGDs and the literature review. These included: unavailability of a
variety of foods at the local markets at the village level mainly attributed to the dry climate and
water scarcity, cultural emphasis and preference on milk due to their pastoralist lifestyle of
livestock keeping, poverty which made the available foods in the local markets to be costly to the
communities and the provision of food rations which mainly comprised of carbohydrates, oil and
legumes.
27 | P a g e
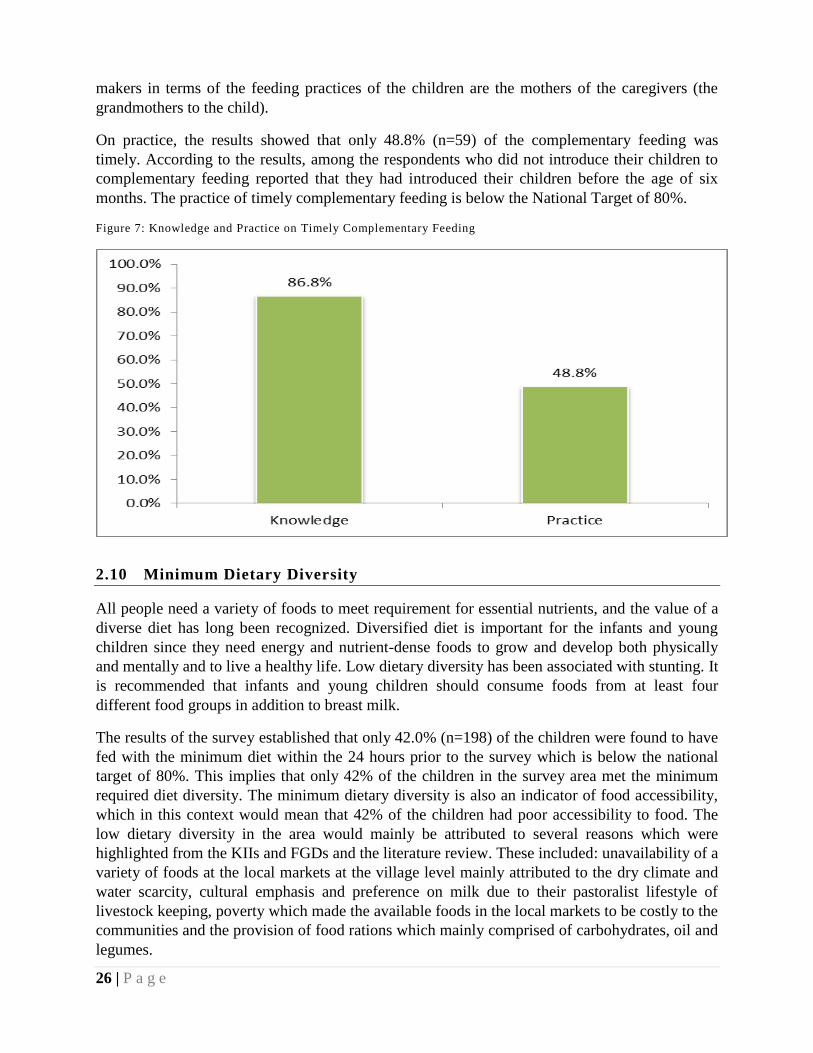
On the specific foods fed to the children aged between 6 and 23 months, the results show that the
dominant food type was grains, roots and tubers (67.1%) followed by dairy products (65.2%),
then legumes and nuts at 48.8%. It is worth to note that the community living in Wajir (West,
North and Eldas) is pastoral hence this might explain the reason for the high uptake of milk and
dairy products among the children in the sub-county. The results show low uptake of eggs and
flesh foods among the children. Qualitative data collected through FGDs and KIIs showed that
the low consumption of eggs in the county was due to cultural perceptions that they were not
appropriate for consumption.
Figure 8: Dietary Diversity
2.11 Minimum Meal Frequency and Minimum Acceptable Diet
Besides meeting the minimum dietary diversity, a child aged between 6 and 23 months ought to
feed for a minimum number of times in a span of 24 hours. For instance, a child aged between 6
and 8 months and is breastfeeding is supposed to feed at least twice per 24 hours, a child aged
between 9 and 23 months and is breastfeeding is supposed to feed at least 3 hours in a span of 24
hours. This survey also measured whether the children aged between 6 and 23 months are
meeting the minimum meal frequency as expected.
Additionally, appropriate feeding of children 6-23 months is multidimensional and hence a
composite indicator that tracks the extent to which multiple dimension of adequate child feeding
are being met is required. The minimum acceptable diet indicator which is a composite indicator
combines standards of dietary diversity dietary diversity and feeding frequency by breastfeeding
status.
Findings of this survey showed that the 46.5% (n=219) meet the minimum meal frequency which
is below the national target of 80%. Further, only 26.1% (n=123) of the children aged 6 to 23
months who met the minimum acceptable diet implying that they were able to meet the
minimum meal and dietary diversity. The low proportion of children meeting both the minimum
meal frequency and acceptable would mainly be attributed as noted during the FGDs and KIIs to
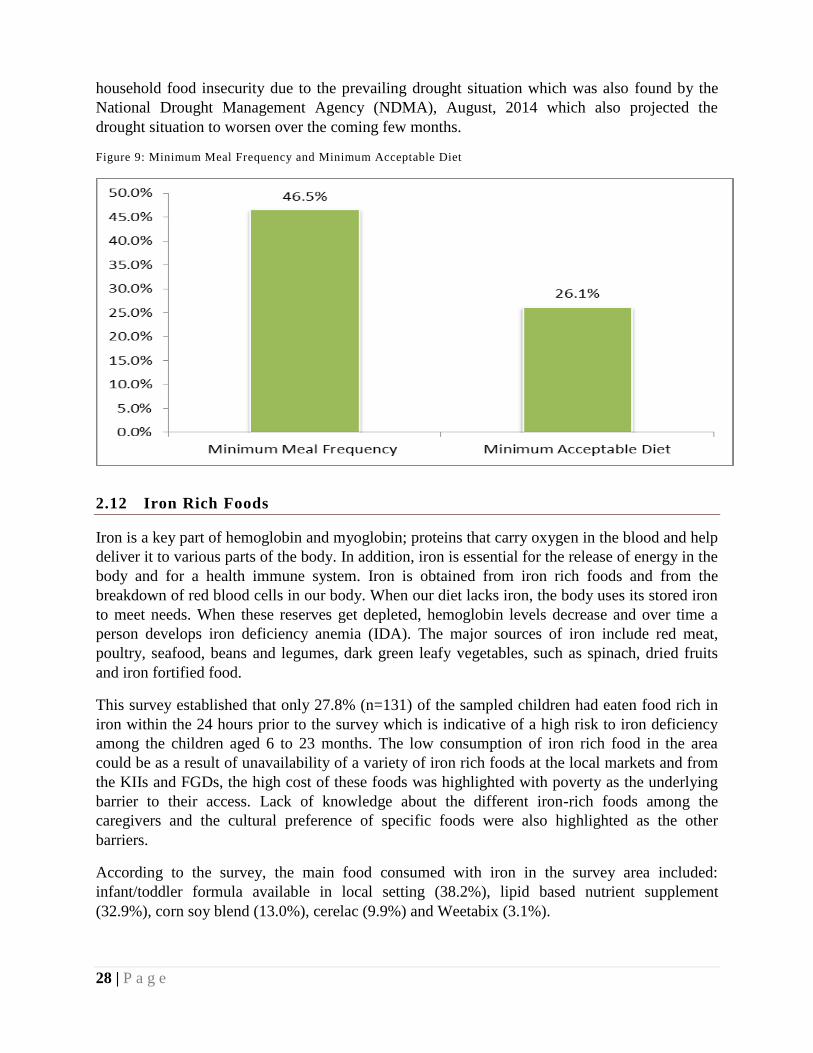
28 | P a g e
household food insecurity due to the prevailing drought situation which was also found by the
National Drought Management Agency (NDMA), August, 2014 which also projected the
drought situation to worsen over the coming few months.
Figure 9: Minimum Meal Frequency and Minimum Acceptable Diet
2.12 Iron Rich Foods
Iron is a key part of hemoglobin and myoglobin; proteins that carry oxygen in the blood and help
deliver it to various parts of the body. In addition, iron is essential for the release of energy in the
body and for a health immune system. Iron is obtained from iron rich foods and from the
breakdown of red blood cells in our body. When our diet lacks iron, the body uses its stored iron
to meet needs. When these reserves get depleted, hemoglobin levels decrease and over time a
person develops iron deficiency anemia (IDA). The major sources of iron include red meat,
poultry, seafood, beans and legumes, dark green leafy vegetables, such as spinach, dried fruits
and iron fortified food.
This survey established that only 27.8% (n=131) of the sampled children had eaten food rich in
iron within the 24 hours prior to the survey which is indicative of a high risk to iron deficiency
among the children aged 6 to 23 months. The low consumption of iron rich food in the area
could be as a result of unavailability of a variety of iron rich foods at the local markets and from
the KIIs and FGDs, the high cost of these foods was highlighted with poverty as the underlying
barrier to their access. Lack of knowledge about the different iron-rich foods among the
caregivers and the cultural preference of specific foods were also highlighted as the other
barriers.
According to the survey, the main food consumed with iron in the survey area included:
infant/toddler formula available in local setting (38.2%), lipid based nutrient supplement
(32.9%), corn soy blend (13.0%), cerelac (9.9%) and Weetabix (3.1%).
29 | P a g e
2.13 Responsive Feeding
Responsive feeding is a method a mother or child caretaker can use to encourage the child to eat
and to finish his/her meals. This is a child feeding mode that emphasizes attention and a positive
reaction to the child’s hunger and satiety cues.
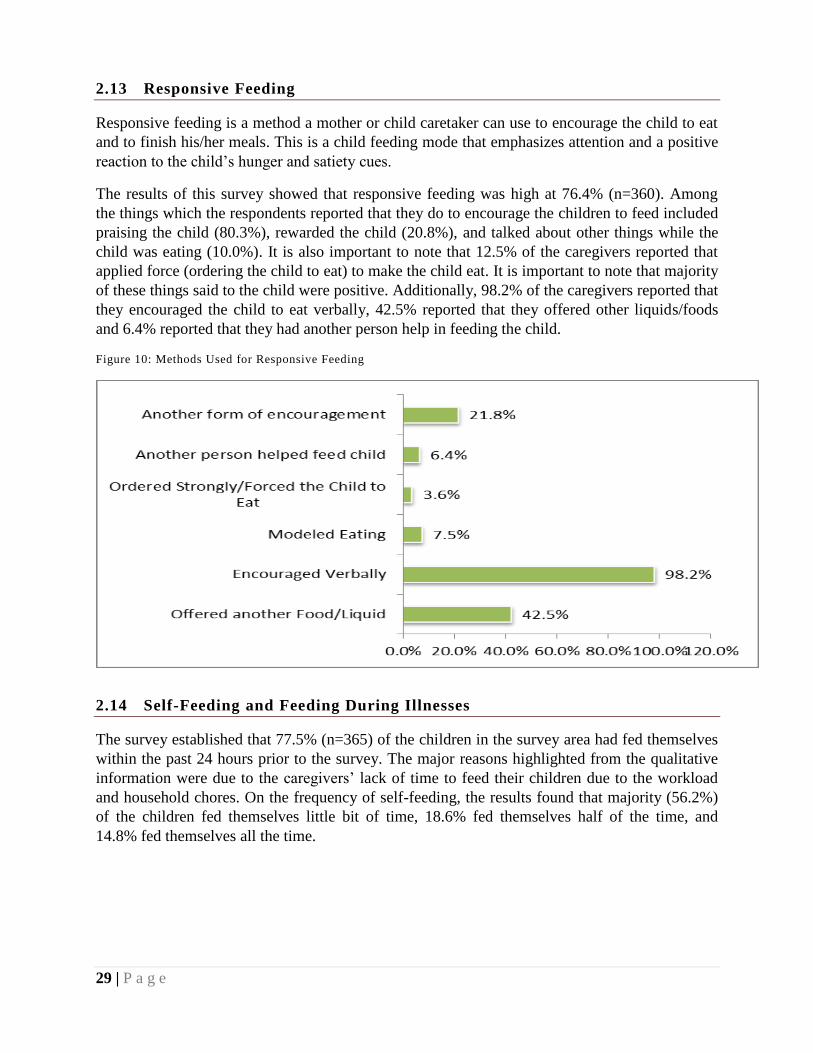
The results of this survey showed that responsive feeding was high at 76.4% (n=360). Among
the things which the respondents reported that they do to encourage the children to feed included
praising the child (80.3%), rewarded the child (20.8%), and talked about other things while the
child was eating (10.0%). It is also important to note that 12.5% of the caregivers reported that
applied force (ordering the child to eat) to make the child eat. It is important to note that majority
of these things said to the child were positive. Additionally, 98.2% of the caregivers reported that
they encouraged the child to eat verbally, 42.5% reported that they offered other liquids/foods
and 6.4% reported that they had another person help in feeding the child.
Figure 10: Methods Used for Responsive Feeding
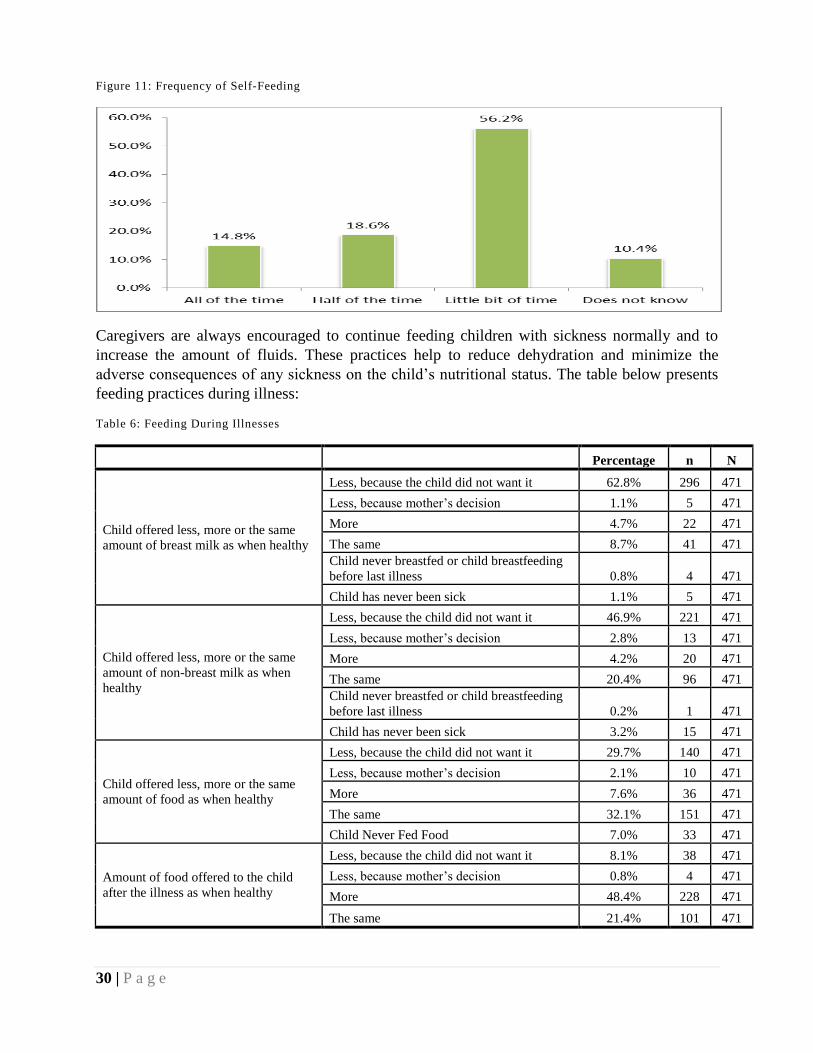
2.14 Self-Feeding and Feeding During Illnesses
The survey established that 77.5% (n=365) of the children in the survey area had fed themselves
within the past 24 hours prior to the survey. The major reasons highlighted from the qualitative
information were due to the caregivers’ lack of time to feed their children due to the workload
and household chores. On the frequency of self-feeding, the results found that majority (56.2%)
of the children fed themselves little bit of time, 18.6% fed themselves half of the time, and
14.8% fed themselves all the time.
30 | P a g e
Figure 11: Frequency of Self-Feeding
Caregivers are always encouraged to continue feeding children with sickness normally and to
increase the amount of fluids. These practices help to reduce dehydration and minimize the
adverse consequences of any sickness on the child’s nutritional status. The table below presents
feeding practices during illness:
Table 6: Feeding During Illnesses
Percentage n N
Child offered less, more or the same
amount of breast milk as when healthy
Less, because the child did not want it 62.8% 296 471
Less, because mother’s decision 1.1% 5 471
More 4.7% 22 471
The same 8.7% 41 471
Child never breastfed or child breastfeeding
before last illness 0.8% 4 471
Child has never been sick 1.1% 5 471
Child offered less, more or the same
amount of non-breast milk as when
healthy
Less, because the child did not want it 46.9% 221 471
Less, because mother’s decision 2.8% 13 471
More 4.2% 20 471
The same 20.4% 96 471
Child never breastfed or child breastfeeding
before last illness 0.2% 1 471
Child has never been sick 3.2% 15 471
Child offered less, more or the same
amount of food as when healthy
Less, because the child did not want it 29.7% 140 471
Less, because mother’s decision 2.1% 10 471
More 7.6% 36 471
The same 32.1% 151 471
Child Never Fed Food 7.0% 33 471
Amount of food offered to the child
after the illness as when healthy
Less, because the child did not want it 8.1% 38 471
Less, because mother’s decision 0.8% 4 471
More 48.4% 228 471
The same 21.4% 101 471
31 | P a g e
2.15 Maternal Characteristics
This section presents the results of the maternal indicators which were assessed during the
survey. These includes: physiological status, antenatal visits, post-natal visits, iron
supplementation and place of delivery.
2.15.1 Antenatal Clinic
Proper care during pregnancy and delivery are important for the health of both the mother and
the baby. Among the services provided to pregnant women is the Antenatal Care (ANC) whose
major objective is to identify and treat problems such as anemia and other infections. ANC is
also an opportunity to promote the use of skilled attendance at birth and healthy behaviors such
as breastfeeding, early postnatal care, and planning for optimal pregnancy spacing. It is during an
antenatal care visit that screening for complications occurs and advice is given on a range of
issues, including place of delivery, and referral to mothers.
In this survey, mothers of children below 23 months were asked whether they received antenatal
care for their most recent birth, the duration of pregnancy at the 1st ANC Visit, the number of
times they attended the ANC Visits, measurements taken during the ANC Visits and for the
women who reported that they had not attended any ANC Visit, then they were asked the reasons
for non-attendance.
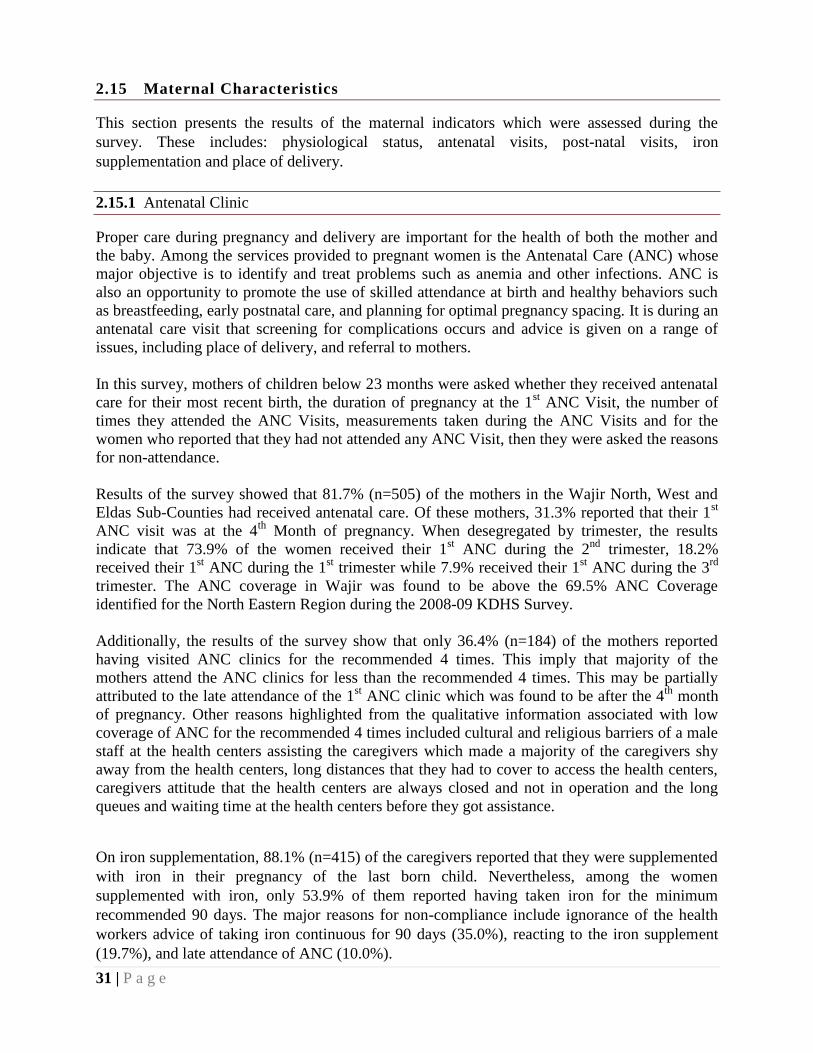
Results of the survey showed that 81.7% (n=505) of the mothers in the Wajir North, West and
Eldas Sub-Counties had received antenatal care. Of these mothers, 31.3% reported that their 1st
ANC visit was at the 4th
Month of pregnancy. When desegregated by trimester, the results
indicate that 73.9% of the women received their 1st ANC during the 2
nd trimester, 18.2%
received their 1st ANC during the 1
st trimester while 7.9% received their 1
st ANC during the 3
rd
trimester. The ANC coverage in Wajir was found to be above the 69.5% ANC Coverage
identified for the North Eastern Region during the 2008-09 KDHS Survey.
Additionally, the results of the survey show that only 36.4% (n=184) of the mothers reported
having visited ANC clinics for the recommended 4 times. This imply that majority of the
mothers attend the ANC clinics for less than the recommended 4 times. This may be partially
attributed to the late attendance of the 1st ANC clinic which was found to be after the 4
th month
of pregnancy. Other reasons highlighted from the qualitative information associated with low
coverage of ANC for the recommended 4 times included cultural and religious barriers of a male
staff at the health centers assisting the caregivers which made a majority of the caregivers shy
away from the health centers, long distances that they had to cover to access the health centers,
caregivers attitude that the health centers are always closed and not in operation and the long
queues and waiting time at the health centers before they got assistance.
On iron supplementation, 88.1% (n=415) of the caregivers reported that they were supplemented
with iron in their pregnancy of the last born child. Nevertheless, among the women
supplemented with iron, only 53.9% of them reported having taken iron for the minimum
recommended 90 days. The major reasons for non-compliance include ignorance of the health
workers advice of taking iron continuous for 90 days (35.0%), reacting to the iron supplement
(19.7%), and late attendance of ANC (10.0%).
32 | P a g e
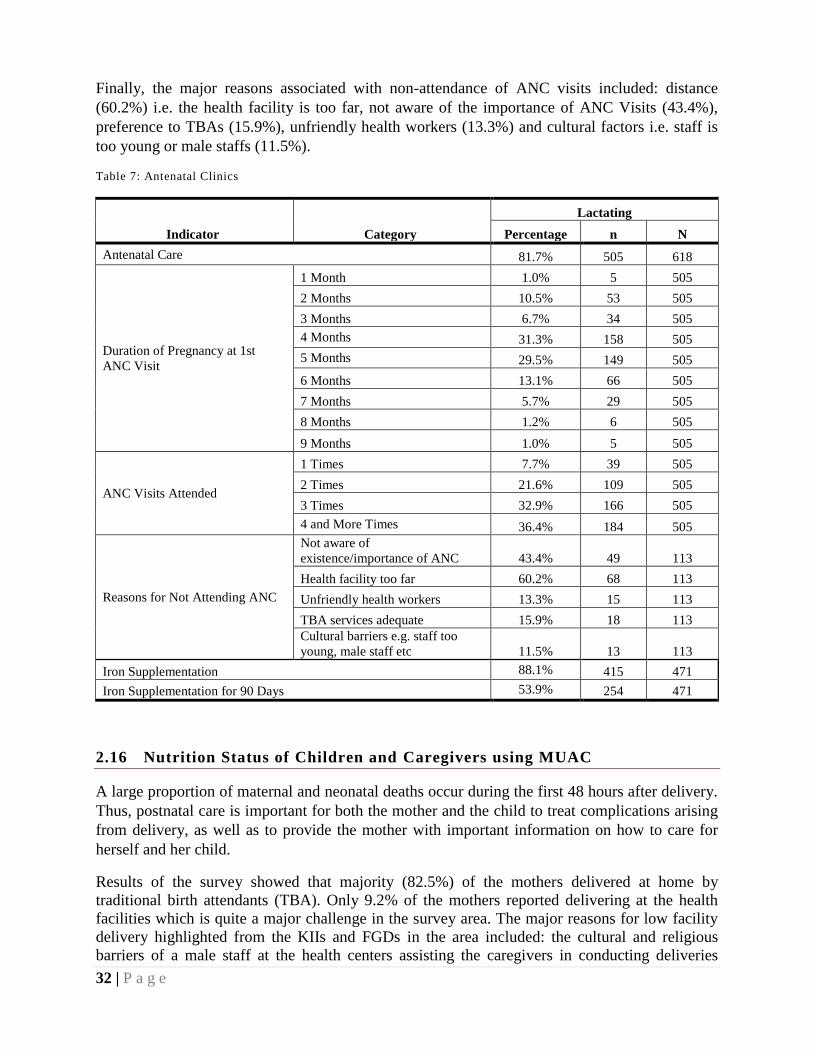
Finally, the major reasons associated with non-attendance of ANC visits included: distance
(60.2%) i.e. the health facility is too far, not aware of the importance of ANC Visits (43.4%),
preference to TBAs (15.9%), unfriendly health workers (13.3%) and cultural factors i.e. staff is
too young or male staffs (11.5%).
Table 7: Antenatal Clinics
Indicator Category
Lactating
Percentage n N
Antenatal Care 81.7% 505 618
Duration of Pregnancy at 1st
ANC Visit
1 Month 1.0% 5 505
2 Months 10.5% 53 505
3 Months 6.7% 34 505
4 Months 31.3% 158 505
5 Months 29.5% 149 505
6 Months 13.1% 66 505
7 Months 5.7% 29 505
8 Months 1.2% 6 505
9 Months 1.0% 5 505
ANC Visits Attended
1 Times 7.7% 39 505
2 Times 21.6% 109 505
3 Times 32.9% 166 505
4 and More Times 36.4% 184 505
Reasons for Not Attending ANC
Not aware of
existence/importance of ANC 43.4% 49 113
Health facility too far 60.2% 68 113
Unfriendly health workers 13.3% 15 113
TBA services adequate 15.9% 18 113
Cultural barriers e.g. staff too
young, male staff etc 11.5% 13 113
Iron Supplementation 88.1% 415 471
Iron Supplementation for 90 Days 53.9% 254 471
2.16 Nutrition Status of Children and Caregivers using MUAC
A large proportion of maternal and neonatal deaths occur during the first 48 hours after delivery.
Thus, postnatal care is important for both the mother and the child to treat complications arising
from delivery, as well as to provide the mother with important information on how to care for
herself and her child.
Results of the survey showed that majority (82.5%) of the mothers delivered at home by
traditional birth attendants (TBA). Only 9.2% of the mothers reported delivering at the health
facilities which is quite a major challenge in the survey area. The major reasons for low facility
delivery highlighted from the KIIs and FGDs in the area included: the cultural and religious
barriers of a male staff at the health centers assisting the caregivers in conducting deliveries
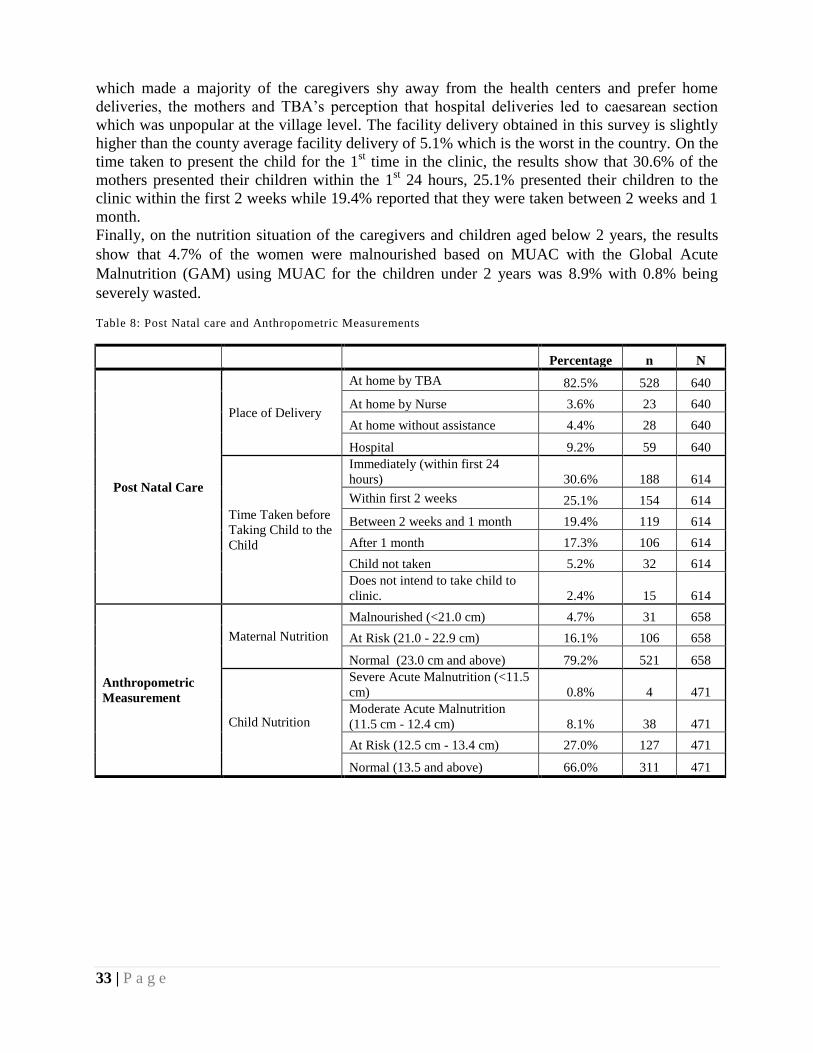
33 | P a g e
which made a majority of the caregivers shy away from the health centers and prefer home
deliveries, the mothers and TBA’s perception that hospital deliveries led to caesarean section
which was unpopular at the village level. The facility delivery obtained in this survey is slightly
higher than the county average facility delivery of 5.1% which is the worst in the country. On the
time taken to present the child for the 1st time in the clinic, the results show that 30.6% of the
mothers presented their children within the 1st 24 hours, 25.1% presented their children to the
clinic within the first 2 weeks while 19.4% reported that they were taken between 2 weeks and 1
month.
Finally, on the nutrition situation of the caregivers and children aged below 2 years, the results
show that 4.7% of the women were malnourished based on MUAC with the Global Acute
Malnutrition (GAM) using MUAC for the children under 2 years was 8.9% with 0.8% being
severely wasted.
Table 8: Post Natal care and Anthropometric Measurements
Percentage n N
Post Natal Care
Place of Delivery
At home by TBA 82.5% 528 640
At home by Nurse 3.6% 23 640
At home without assistance 4.4% 28 640
Hospital 9.2% 59 640
Time Taken before
Taking Child to the
Child
Immediately (within first 24
hours) 30.6% 188 614
Within first 2 weeks 25.1% 154 614
Between 2 weeks and 1 month 19.4% 119 614
After 1 month 17.3% 106 614
Child not taken 5.2% 32 614
Does not intend to take child to
clinic. 2.4% 15 614
Anthropometric
Measurement
Maternal Nutrition
Malnourished (<21.0 cm) 4.7% 31 658
At Risk (21.0 - 22.9 cm) 16.1% 106 658
Normal (23.0 cm and above) 79.2% 521 658
Child Nutrition
Severe Acute Malnutrition (<11.5
cm) 0.8% 4 471
Moderate Acute Malnutrition
(11.5 cm - 12.4 cm) 8.1% 38 471
At Risk (12.5 cm - 13.4 cm) 27.0% 127 471
Normal (13.5 and above) 66.0% 311 471
34 | P a g e
2.17 BARRIER ANALYSIS
The qualitative information collected through KIIs and FGDs were analyzed through content
analysis using emerging themes and issues highlighted by different stakeholders to generate a
detailed report on issues related MIYCN. Qualitative data was first transcribed, summarized and
thematically analyzed according to the specific objectives. The analysis process entailed:
Content analysis of information gathered from secondary data sources (desk/ literature
reviews);
Manual analysis of qualitative data from KIIs, which included coding, summarizing,
categorizing, direct quoting and comparisons;
Categorization and recording the information collected as per the laid out format and then
analyzing them. The findings were then summarized in terms of the various MIYCN as
well as water; sanitation and hygiene (WASH) emerging themes.
The respondents included multi-sectorial groups which had the potential to influence the MIYCN
activities in the survey area. These included the following: Caregivers (N= 95), fathers (N= 41),
TBAs (N= 37), CHWs (N= 39) and KIIs (N= 17) which ranged from health workers, County
health management team (CHMT), religious leaders, partner NGOs, public health officers,
World Food Programme (WFP), National Drought Management Authority (NDMA) and Islamic
Relief –Kenya (IRK) personnel.
The barriers identified were then divided into either primary or secondary barriers
2.17.1 Primary Barriers
The respondents were interviewed to give their opinion on the main barriers which inhibited
ideal MIYCN practices in their areas. Three main reasons were highlighted by the majority of the
respondents which included:
a) Heavy workload- This was especially emphasized by the caregivers (N=95) where the
majority (76%, n=72) highlighted the main household chores e.g. fetching water and
firewood inhibited them from providing the proper care to their children and were forced
to leave them behind with their grandmothers/ mother-in-law who did not know about the
proper infant and young care and feeding practices taught at the health centers. This was
also because the survey area had a patriarchal society where most of the household chores
were carried out by the women
b) Lack of food- This was emphasized by the majority of the caregivers (69%, n=66) and
fathers (59%, n=24) during the FGDs and the KIIs with the partner organizations. At the
household level, it was apparent from the discussions that there was household food
insecurity and that the caregivers did not have to eat and had scaled down the feeding
frequency of the meals at the household level. This was evidenced by the prevailing
drought (National Drought Management Authority [NDMA] - Aug bulletin). The
35 | P a g e
caregivers reported that lack of food inhibited them from practicing exclusive
breastfeeding and hence gave their children camel milk. From the FGDs conducted with
the fathers, they highlighted the high cost of food as an inhibiting factor to food
availability at the household level and hence even the children were not able to access a
variety of nutritious food e.g. fruits and vegetables. This had ‘forced’ them to rely on the
World Food Programme (WFP) which was mainly comprised legumes and starches.
However, the situation was slightly different in Wajir North sub-county where food was
available, partly attributed to the favorable climate and proximity to Moyale town, which
provided a ready market and supply of food stuffs.
c) Livelihood/ lifestyle of the community- This was emphasized from both the FGDs and
KIIs conducted. A majority of the mothers (65%, n=62) and the fathers (90%, n= 37)
highlighted that the nomadic nature of the communities in the survey area caused
frequent migration (due to insecurity/ tribal clashes or in search of pasture) of the people
which caused constant disruption of structures that supported ideal MIYCN situation. The
structures included inaccessibility of healthcare services and outreach activities which
provided the largest platform for MIYCN interventions e.g. HINI activities and mother
support groups that supported MIYCN component. The nomadic lifestyle also
predisposed the communities to over-reliance of livestock and livestock products,
especially milk, which composed the main food in their diets and hence also influenced
the feeding of the infants and young children hence their diets being nutritionally
inadequate.
In addition, the following reasons were also highlighted by most of the respondents as the
barriers to ideal MIYCN practices
a) Home deliveries- This was reported to be quite prevalent in the survey areas as evidenced
by the FGDs of caregivers, traditional birth attendants (TBAs) and KIIs of the health
personnel. This proved to be a barrier to MIYCN since the health facility provides the
single-largest platform for MIYCN interventions which ranges from supplementation to
health education and counseling. The main reasons highlighted by a majority of the
caregivers (68%, n=65) and the TBAs (86%, n=32 ) was the stigma and fear of male
nurses at the health facilities due to cultural and religious taboos and the misconception
of both the caregivers and TBAs that hospital deliveries meant caesarian section
surgeries.
b) Poor child spacing- was also cited as a barrier from the FGDs and KIIs to ideal MIYCN
since poor birth spacing led to inadequate care of the infants and young children in terms
of proper feeding and care. This was mostly highlighted by a majority of the KIIs (94%,
n=16) . At the household level, this led to the competition of food by the older children
for the food prepared for the younger children causing the caregivers to adopt the ‘family
pot’ for feeding the whole family including the young children. This becomes a barrier
since the young children require nutrient dense foods due to the increased nutritional
needs. This was also evidenced by the low family planning uptake in the survey area
mainly attributed to a conflict with the religious beliefs.
36 | P a g e
The others reasons that were mentioned included:
a) Distance to health center – This was highlighted by some caregivers (36% n=35) as a
barrier since the health facilities available were far and not easily accessible. This
inhibited important MIYCN interventions that were mainly offered at the health facilities.
b) Maternal health- This was cited by some caregivers (17%, n= 16) who reported that their
own illness inhibited them from practicing ideal MIYCN e.g. they could not breastfeed
their children when sick for fear of transmitting the disease into their children. This was
further aggravated by the poor health-seeking behaviour of the caregivers.
c) Personnel absenteeism at health centers- This was reported by some caregivers (12%,
n= 11) who were constantly discouraged by the absenteeism of the health care personnel
at the local health centers to access information on MIYCN and hence promoted the poor
health seeking behaviour of the community members.
2.17.2 Secondary Barriers
The respondents were interviewed to give their opinion on the main barriers which inhibited
ideal MIYCN practices in their areas. Three main reasons were highlighted by the majority of the
respondents which included:
a) Mothers' perception- This was a major hindrance reported by a majority of the
caregivers (91%, n=87) to ideal MIYCN practices which could be mainly related to the
low education and literacy levels of the caregivers which left them prone to believing
misconceptions on MIYCN issues. The main perceived barriers related to MIYCN which
were mostly mentioned included the following:
Mothers avoided eating adequately for the perceived 'fear' that the child will grow
bigger
Mother's perception that their health and nutrition status isn’t as important as their
child's or husband
Mothers' belief that they do not have any/ adequate milk within the first 3 days
and hence give pre-lacteals
Mothers' belief that the breast milk is poisonous for the child if mother is pregnant
Mothers' belief that breast milk only isn’t enough for the baby for 6 months
Mothers' belief that breast milk is sugary for the child and hence give water
Mothers' perception that hospital deliveries ARE caesarian sections only
b) Culture – This was gathered from the FGDs and KIIs conducted which identified culture
as a main barrier to MIYCN. The main examples provided included:
37 | P a g e
The 40 days after delivery requires the woman to stay indoors which predisposes
infant to pre-lacteals since grandmothers/ mothers are the main caretakers. This is
because a majority of the caregivers interviewed reported to have given birth at
home and during the 40 days; the grandmother, mother-in-law or the TBAs were
the main people who gave them advice the care and feeding of the child.
Mothers avoid health centers and hospital deliveries due to male nurses which is
culturally a taboo for male personnel to assist in birth.
It’s considered a taboo for man to assist woman take care of the child directly.
This is due to the patriarchal society of the survey area
Grandmothers' perception- This was also a critical influencer of MIYCN issues at
the community and household level. This was majorly because they spent more
time with the infants and young children in their formative years and hence
influenced their feeding and care practices. They also spent time with the mother
immediately after delivery and during the 40 days the mothers are culturally
required to stay indoors. From the FGDs conducted with the grandmothers/
TBAs, it was determined that they believed that breast milk only is not enough for
child and that child should be given camel milk to grow strong/ healthy.
The others reasons that were mentioned included:
a) Poor health seeking behaviour- It was reported from the FGDs at the community and the
KIIs with health personnel and community health workers (CHWs) that the health
seeking behaviour was poor only going to the hospitals as the last resort. This was partly
attributed to the general attitude of the community that the health centers are not
operational due to personnel absenteeism.
b) Fathers' perception – From the FGDs conducted with the fathers, a majority (66%,
n=27) believed that the mothers’ breast milk was not enough for a healthy and strong
child and had to be given camel milk in order to grow strong.
c) TBAs perception- From the FGDs conducted with the TBAs, the majority (70%, n=26)
rejected hospital deliveries since they believed that hospital personnel only conducted
caesarian section only and they disliked CS- operations. They in turn discouraged the
caregivers from hospital deliveries.
38 | P a g e
2.18 Water, Sanitation and Hygiene (WASH) Knowledge and Awareness
The WASH component and the level of knowledge and awareness at the community level is very
crucial since it impacts the MIYCN practices either positively or negatively depending on the
water, hygiene and sanitation situation at the community. This information was gathered from a
variety of sources which included FGDs with community members, literature review, and KIIs
with both County officials in public health and partner organization dealing in WASH activities
in the survey area. From the qualitative data collected on WASH, the following observations
were made:
The main barrier to good WASH practices directly related to MIYCN is water scarcity in
the survey areas. This was mainly highlighted by a majority of the caregivers (73%,
n=69), the fathers (65%, n=27) and the KIIs conducted. Water accessibility is also
difficult with distances to be covered to access a water point ranging from 6-15 km which
was being exacerbated by the ongoing drought- KII Public Health Officer. This makes
water to be a very precious resource that is reserved for the basic utilization i.e. drinking,
cooking and for livestock’s consumption. From the discussions with the survey
respondents, a majority considered hand washing at the critical times a “luxury” and
“water wastage” due to water scarcity. This has a negative impact on the MIYCN
situation especially with a special focus on the complementary feeding and food
preparation for children aged <2 years.
The latrine coverage is very low (<20%) with a high rate of open defecation at the
community level with the situation being worse in the rural areas- - KII Public Health
Officer. The high rate of open defecation was attributed to the frequent migrations by the
communities in search of better pasture for their livestock or due to insecurity hence
giving rise to new unplanned settlements without latrines/ toilets.
The poor WASH situation related to MIYCN was also due to the low literacy levels of
the communities’ hence giving rise to ignorance to hygiene and sanitation practices.
From the qualitative discussions, most caregivers (>40%) reported that “it wasn’t very
important to wash hands before feeding baby since it would lead to water wastage.”
From the KIIs conducted, it was established that a majority of the population (>60%)
drew their water from the water pans which were being shared with the animals, therefore
giving a high likelihood of water contamination. This was further exacerbated by the lack
of water treatment for drinking water by the community members at the household level.
39 | P a g e
2.19 High Impact Nutrition Interventions (HiNi) Knowledge and Awareness
Islamic Relief-Kenya are implementing programs that have adopted an integrated emergency and
rehabilitation approach to prevent malnutrition and treat the acutely malnourished in Wajir
North, West and Eldas sub-counties.
In this regard, it’s essential to determine the level of community awareness of the existing HINI
activities that are being implemented. This was captured using qualitative data collection
methods which involved FGDs and KIIs conducted at the community level and comprised of the
caregivers with children aged less than 2 years, and fathers. The various HINI services offered
and their level of community awareness is summarized below.
a) Knowledge and awareness on malnutrition
A majority (87%, n=83) of the respondents interviewed, which mainly included the caregivers
had a good level of knowledge and awareness about malnutrition as they were able to give the
signs and symptoms of malnutrition which included: the reduction of the child’s body weight,
lack of appetite, general body weakness and observable ribs (thinness).
b) Knowledge and awareness on Integrated Management of Acute Malnutrition (IMAM)
services
The level of community knowledge and awareness on the IMAM services available was very
high as evidenced by 80% (n=76) of the caregivers interviewed who had a high level of
awareness of the nutrition programmes on Outpatient therapeutic programme (OTP) and the
Supplementary feeding programme (SFP) and the services/ products provided. They were also
aware that the OTP and SFP programmes were available to treat and reduce malnutrition.
On further discussions from the KIIs conducted, it was found out that the high level of
community awareness of the IMAM programmes was directly linked to the nutritional products
and supplements provided which were quite popular with the community e.g. plumpy nut, CSB
flour etc.
c) Knowledge and awareness on Vitamin A
A majority of the respondents (76%, n=72) interviewed indicated a good level of knowledge and
awareness on Vitamin A as they could easily identify the Vitamin capsule and provide the
importance of giving the supplement to the children. Most of the caregivers interviewed reported
that the Vitamin capsule boosted the immunity of the children, prevented diseases and for good
eyesight for the children.
d) Knowledge and awareness of deworming
The level of community knowledge and awareness on deworming was found to be fairly low.
This was evidenced by only 24% (n=23) of the caregivers interviewed could not easily identify
the deworming tablets and most reported not to have given their children. However, some of the
respondents identified the supplements and understood the importance of the de-wormers for
treating the intestinal worms.
40 | P a g e
This shows a gap in the community sensitization on deworming activities as evidenced by the
low level of community knowledge and awareness.
e) Knowledge awareness on Zinc supplementation
A majority of the respondents interviewed exhibited a low level of knowledge and awareness on
zinc supplementation since they could not easily identify the zinc sample tablets. Most of the
caregivers interviewed (82%, n=78) reported that they had not taken their children to a health
center during the last diarrheal episode and hence were not able to access the zinc tablets. This is
evidenced by the poor health seeking behavior of the surveyed communities.
f) Knowledge and awareness on Iron and folic acid supplementation
On IFAS, there was an exhibition of a good level of community knowledge and awareness
especially the caregivers of children aged less than 2 years. This was evidenced by the fact that
the most of the caregivers (64%, n=61) could easily identify the IFAS sample tablets showed to
them. A majority of the caregivers also reported that the IFAS was to help in increasing the
blood in the women while some reported that it helped to prevent anemia. From the KIIs
conducted with the health personnel, this was mainly attributed to the attendance of the women
for antenatal clinic (ANC) at least once partly attributed to the increased referrals by TBAs for
the pregnant mothers to the health facilities for deliveries. However, the respondents, especially
the caregivers reported not to like it due to its “bad” taste.
g) Knowledge and awareness on Exclusive Breastfeeding
There was reportedly a high level of community knowledge and awareness on exclusive
breastfeeding and its importance. A majority of the caregivers interviewed (86%, n=82) indicated
knowledge that a baby should be exclusively breastfed for 6 months since it was good for the
baby’s growth and development. On further discussions, it was noted that EBF was advocated
for by the Muslim religion (which a majority of the respondents were affiliated to) as per a KII
performed with a Muslim religious leader who reported that the religion advocated for
breastfeeding the children up to the age of 2 years.
h) Knowledge and awareness on Complementary feeding
The level of community knowledge and awareness on complementary feeding was poor as
evidenced by lack of any information by the respondents on the timely introduction of
complementary foods and the type of food to be introduced in terms of variety, consistency and
frequency. A majority (74%, n=70) of the caregivers interviewed reported that they did not know
the appropriate time and food to introduce to their children after the breastfeeding period. This
highlights a gap in the MIYCN interventions and the need to focus on complementary feeding
issues.
41 | P a g e
CHAPTER NINE: CONCLUSIONS AND RECOMMENDATIONS
9.1 Conclusions
The conclusions for the MIYCN situation in Eldas, Wajir North and Wajir West are summarized
per indicator as shown below:
a) Indicator: Early Initiation to breastfeeding
The knowledge (83.5%) did not translate into practice (66.1%) mainly because:
• From the FGDs, a majority of the caregivers believed that they did not have sufficient
milk within the first 3 days and hence did not initiate breastfeeding as recommended.
Some TBAs were reported saying: ‘the first 3 days was for the mother to rest and wait
for the milk to flow in the breasts.’
• In addition, a majority of the caregivers delivered at home where there was no emphasis
on early initiation of breastfeeding by the people taking care of the mother.
• Low literacy levels as only as only 4.8% had ever attended school.
b) Indicator: Exclusive breastfeeding
The knowledge (83.2%) on EBF did not translate into practice (43.6%) mainly because:
• A majority of the mothers interviewed in the FGDs believed that the mothers’ milk
wasn’t sufficient to feed a healthy child. This was also upon the strong influence of the
mothers/ grandmothers who advised them to give the baby animal milk even from past
experience.
• Most of the mothers reported that they did not have milk within the first 3 days and hence
gave the child water and milk to quench their thirst.
• Workload (which involved fetching firewood and water) was also cited to be a major
barrier to exclusive breastfeeding since the caregivers usually left their children with the
grandmothers while away and the grandmothers usually fed the children.
• Mothers also reported that they themselves did not have adequate food to be able to
breastfeed their children every time.
• Some mothers reported that they were having another pregnancy* and hence wasn’t safe
to breastfeed the child because they believed their milk was ‘poisonous’ for child.
(*The family planning uptake is very poor in the local community mainly due to the religious
belief that it’s unacceptable- KII with County Nursing officer)
c) Indicator: Introduction to solid, semi-solid foods
The knowledge (86.8%) also did not translate into practice (48.8%). This was mainly attributed
to the following:
• From the FGDs, the caregivers reported that they introduced the other foods late (> 9
months) since the baby was too young to eat other foods due to lack of teeth. They
reported that animal milk is the appropriate food to feed the young children.
• Most of the caregivers also reported that lack of other foods to give the child hindered
them due to the prevailing drought* situation. They said that milk was the only food
available currently.
*(NDMA August bulletin reported that the County drought situation is at an early phase of
alarm stage on a worsening trend following the depressed long rains)
42 | P a g e
d) Indicator: Minimum dietary diversity
The dietary diversity performed poorly (42%) due to the following reasons:
• The prevailing drought* situation which is causing most of the households to be food
insecure. *(NDMA August bulletin reported that the County drought situation is at an
early phase of alarm stage on a worsening trend following the depressed long rains)
• The reliance of the community on food assistance which is mainly high on starches and
legumes.
• From the FGDs with the fathers (who were the main providers of food at the household),
they reported that the other foods (fruits, vegetables and meats) were too expensive for
them to buy for their families and were not easily accessible at the village level.
• From the FGDs, it was also determined that the food consumed at the household level
was based on the family pot and no special foods were prepared for the child. Due to the
cultural preference of foods high in starch (rice. pasta, anjera) and milk (cow/camel)
which are easily available and affordable, the child’s diet is also influenced by the family
meals.
• The prevailing drought* situation which is causing most of the households to be food
insecure. *(NDMA August bulletin reported that the County drought situation is at an
early phase of alarm stage on a worsening trend following the depressed long rains)
e) Indicator: Minimum meal frequency
The indicator was poor (46.5%) due to the following reasons:
• The prevailing drought* situation which is causing most of the households to be food
insecure. *(NDMA August bulletin reported that the County drought situation is at an
early phase of alarm stage on a worsening trend following the depressed long rains)
• Availability of the foods of the foods was cited as the main reasons for the decreased
meal frequency.
f) Indicator: Consumption of Iron-rich foods
The indicator performed poorly (27.8%) mainly due to the unavailability of the iron-rich foods
(esp. fruits and vegetables) at the village level (due to the prevailing drought situation).
• From the FGDs, the caregivers reported that their children were too young/ did not have
teeth to consume meat (which is considered to be iron-rich)
g) Indicator: Feeding during and after illness
This performed poorly and is a major gap in the nutrition status of the child during or after
illness.
• The major reason highlighted by the caregivers was that the child lacked appetite during
illness.
• This highlights a major gap in the area of infant feeding during and after illness.
h) WASH
In terms of knowledge and awareness on WASH, there is a major gap in the practice of the ideal
sanitation and hygiene components due to the various constraints highlighted above. It was also
reported that hand washing at the critical times also performed poorly. This has a negative
impact on MIYCN and especially on the complementary feeding of children <2 years which is a
crucial phase of growth and development of the child.
43 | P a g e
i) HINI
With regard to knowledge and awareness on HINI activities being implemented, there was a gap
in the deworming, zinc supplementation and complementary feeding at the community level. It
was evidenced that more emphasis had been given to exclusive breastfeeding information while
the complementary feeding component performed poorly in terms of awareness. For deworming
and zinc supplementation, it was found out that it performed poorly due to the poor health
seeking behaviour of the communities and the constant movements which made the outreach
activities challenging in finding and retracing the communities.
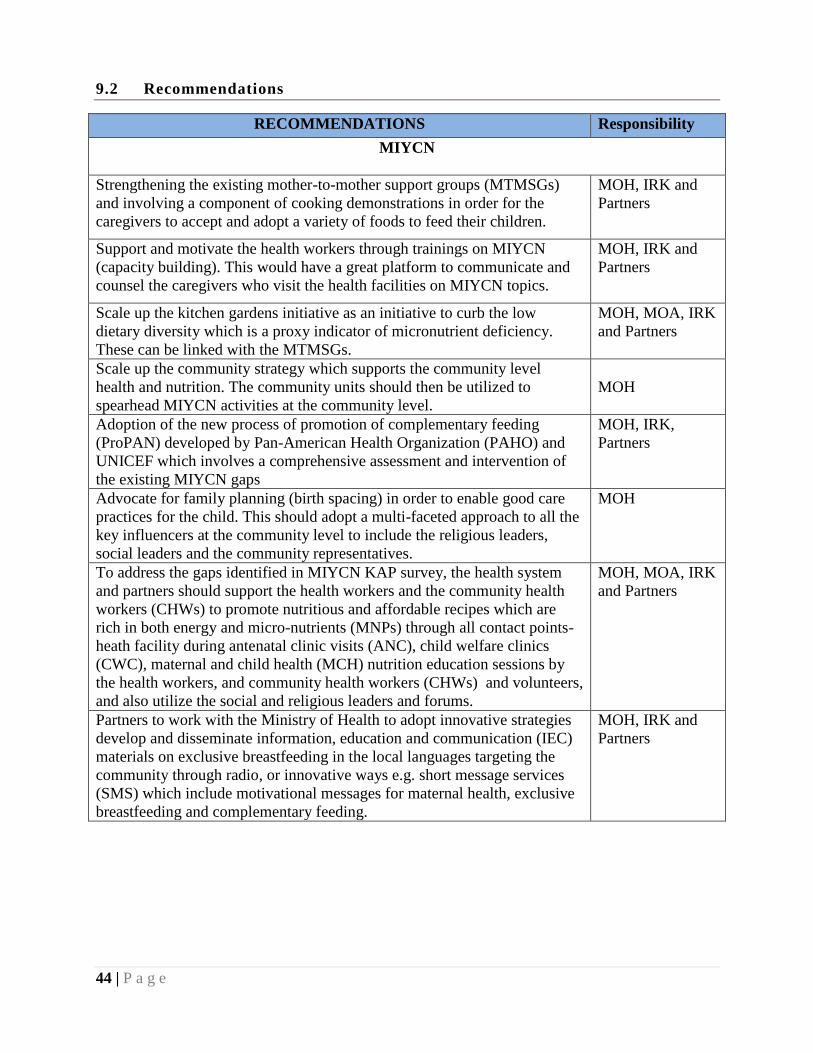
44 | P a g e
9.2 Recommendations
RECOMMENDATIONS Responsibility
MIYCN
Strengthening the existing mother-to-mother support groups (MTMSGs)
and involving a component of cooking demonstrations in order for the
caregivers to accept and adopt a variety of foods to feed their children.
MOH, IRK and
Partners
Support and motivate the health workers through trainings on MIYCN
(capacity building). This would have a great platform to communicate and
counsel the caregivers who visit the health facilities on MIYCN topics.
MOH, IRK and
Partners
Scale up the kitchen gardens initiative as an initiative to curb the low
dietary diversity which is a proxy indicator of micronutrient deficiency.
These can be linked with the MTMSGs.
MOH, MOA, IRK
and Partners
Scale up the community strategy which supports the community level
health and nutrition. The community units should then be utilized to
spearhead MIYCN activities at the community level.
MOH
Adoption of the new process of promotion of complementary feeding
(ProPAN) developed by Pan-American Health Organization (PAHO) and
UNICEF which involves a comprehensive assessment and intervention of
the existing MIYCN gaps
MOH, IRK,
Partners
Advocate for family planning (birth spacing) in order to enable good care
practices for the child. This should adopt a multi-faceted approach to all the
key influencers at the community level to include the religious leaders,
social leaders and the community representatives.
MOH
To address the gaps identified in MIYCN KAP survey, the health system
and partners should support the health workers and the community health
workers (CHWs) to promote nutritious and affordable recipes which are
rich in both energy and micro-nutrients (MNPs) through all contact points-
heath facility during antenatal clinic visits (ANC), child welfare clinics
(CWC), maternal and child health (MCH) nutrition education sessions by
the health workers, and community health workers (CHWs) and volunteers,
and also utilize the social and religious leaders and forums.
MOH, MOA, IRK
and Partners
Partners to work with the Ministry of Health to adopt innovative strategies
develop and disseminate information, education and communication (IEC)
materials on exclusive breastfeeding in the local languages targeting the
community through radio, or innovative ways e.g. short message services
(SMS) which include motivational messages for maternal health, exclusive
breastfeeding and complementary feeding.
MOH, IRK and
Partners
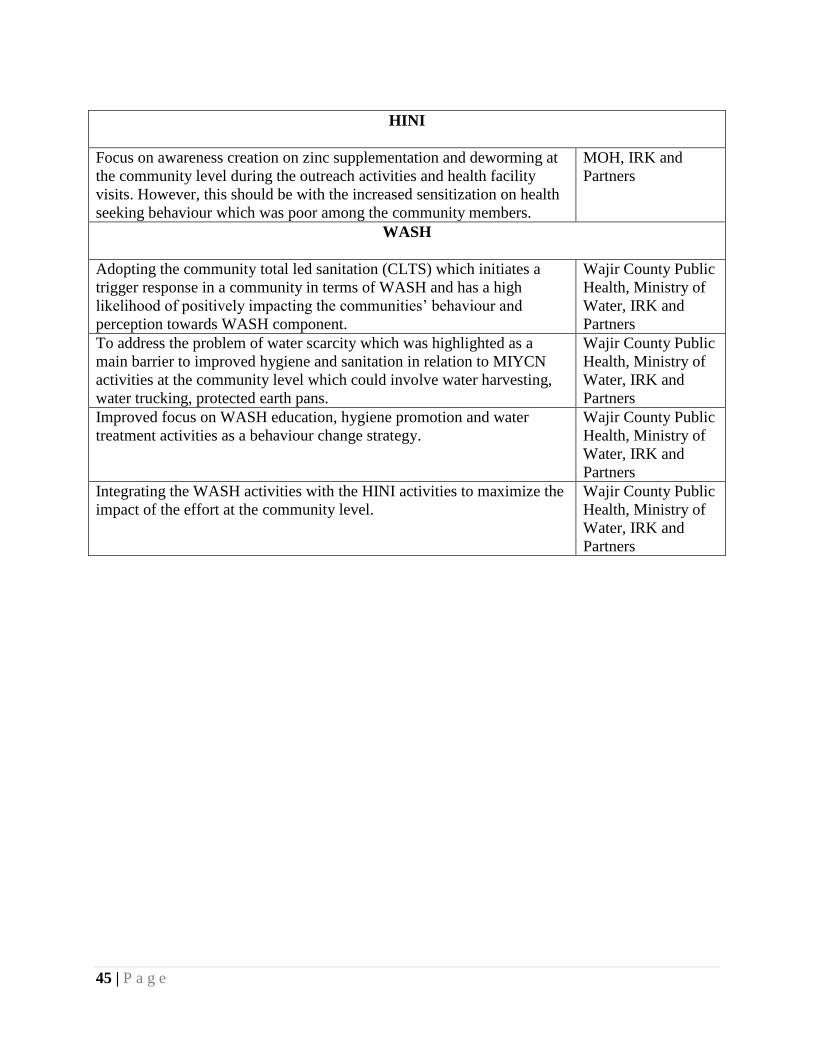
45 | P a g e
HINI
Focus on awareness creation on zinc supplementation and deworming at
the community level during the outreach activities and health facility
visits. However, this should be with the increased sensitization on health
seeking behaviour which was poor among the community members.
MOH, IRK and
Partners
WASH
Adopting the community total led sanitation (CLTS) which initiates a
trigger response in a community in terms of WASH and has a high
likelihood of positively impacting the communities’ behaviour and
perception towards WASH component.
Wajir County Public
Health, Ministry of
Water, IRK and
Partners
To address the problem of water scarcity which was highlighted as a
main barrier to improved hygiene and sanitation in relation to MIYCN
activities at the community level which could involve water harvesting,
water trucking, protected earth pans.
Wajir County Public
Health, Ministry of
Water, IRK and
Partners
Improved focus on WASH education, hygiene promotion and water
treatment activities as a behaviour change strategy.
Wajir County Public
Health, Ministry of
Water, IRK and
Partners
Integrating the WASH activities with the HINI activities to maximize the
impact of the effort at the community level.
Wajir County Public
Health, Ministry of
Water, IRK and
Partners
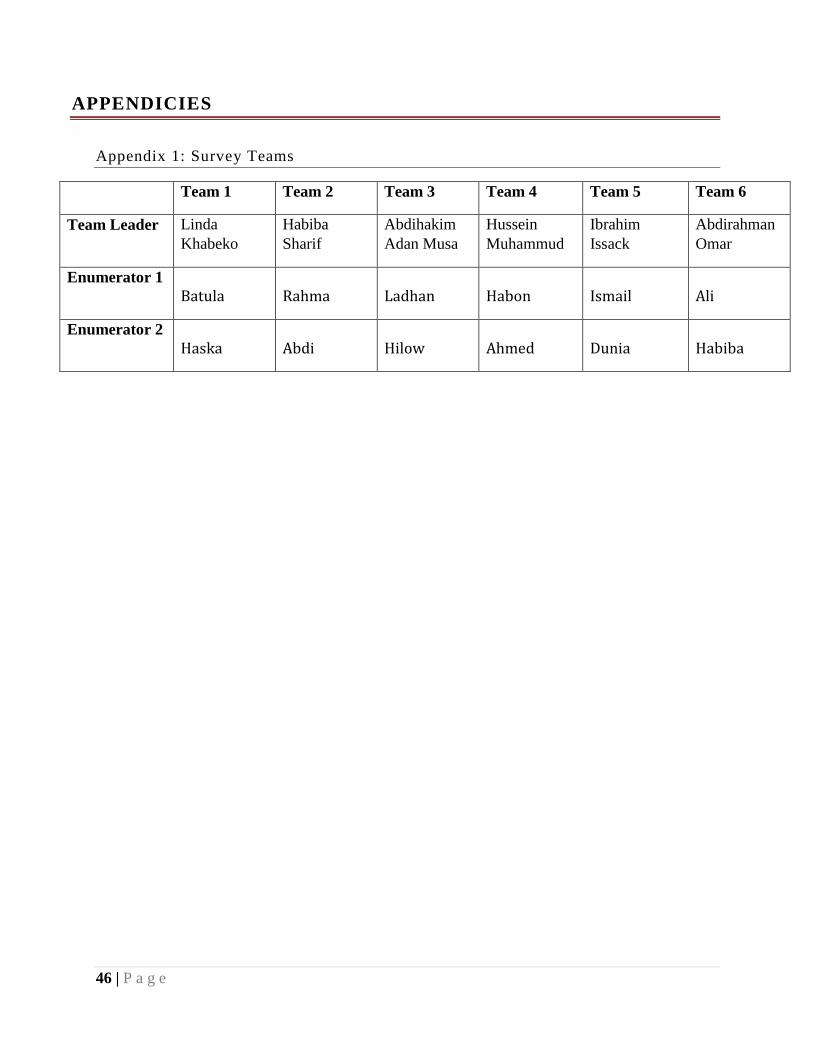
46 | P a g e
APPENDICIES
Appendix 1: Survey Teams
Team 1 Team 2 Team 3 Team 4 Team 5 Team 6
Team Leader Linda
Khabeko
Habiba
Sharif
Abdihakim
Adan Musa
Hussein
Muhammud
Ibrahim
Issack
Abdirahman
Omar
Enumerator 1
Batula Rahma Ladhan Habon Ismail Ali
Enumerator 2
Haska Abdi Hilow Ahmed Dunia Habiba
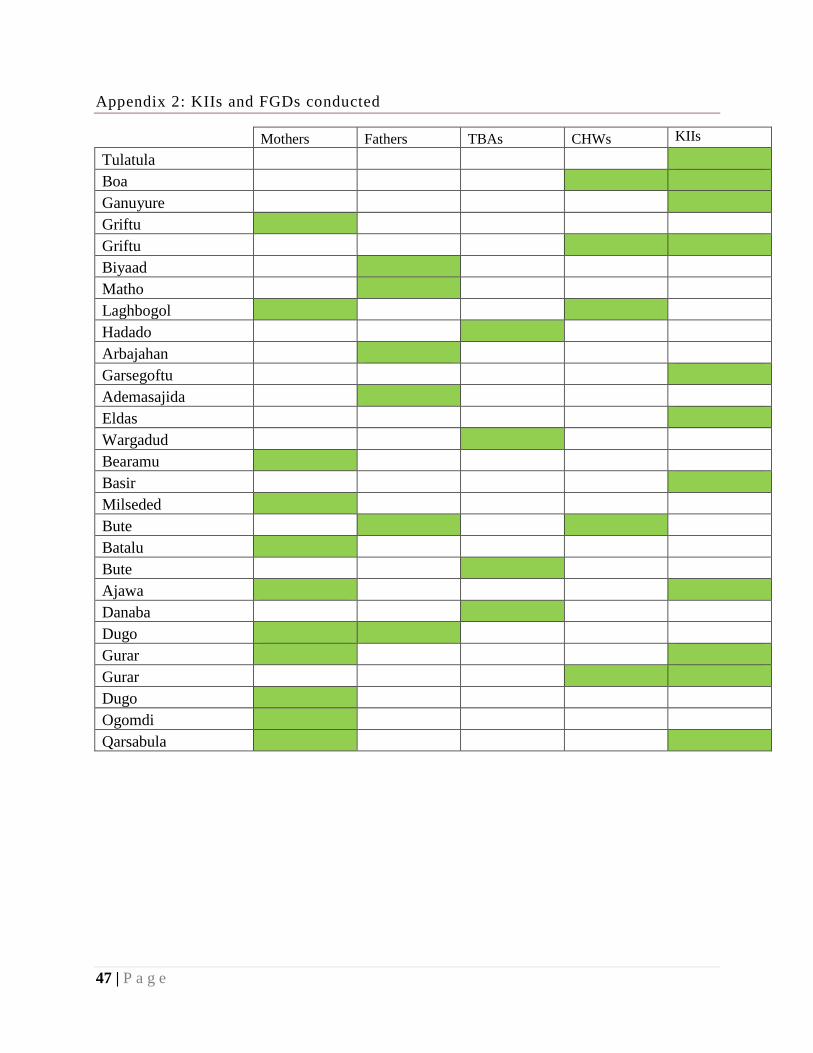
47 | P a g e
Appendix 2: KIIs and FGDs conducted
Mothers Fathers TBAs CHWs KIIs
Tulatula
Boa
Ganuyure
Griftu
Griftu
Biyaad
Matho
Laghbogol
Hadado
Arbajahan
Garsegoftu
Ademasajida
Eldas
Wargadud
Bearamu
Basir
Milseded
Bute
Batalu
Bute
Ajawa
Danaba
Dugo
Gurar
Gurar
Dugo
Ogomdi
Qarsabula
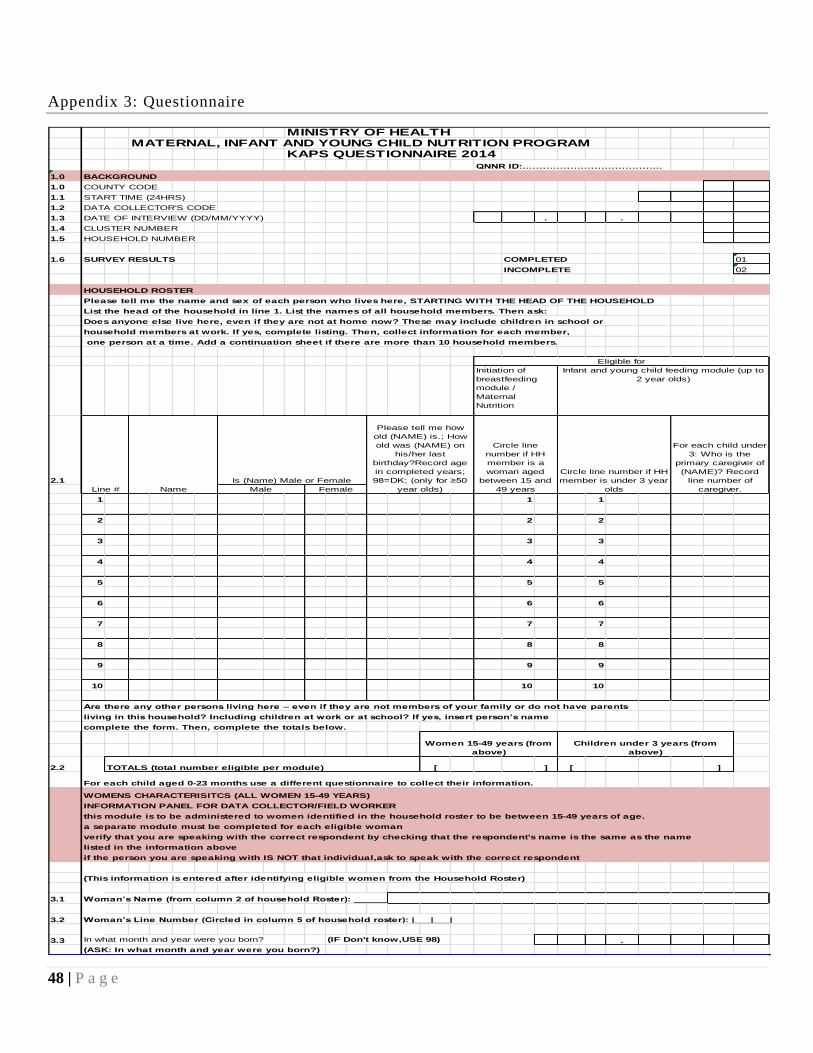
48 | P a g e
Appendix 3: Questionnaire
MINISTRY OF HEALTHMATERNAL, INFANT AND YOUNG CHILD NUTRITION PROGRAM
KAPS QUESTIONNAIRE 2014 QNNR ID:…………………………………..
1.0 BACKGROUND
1.0 COUNTY CODE
1.1 START TIME (24HRS)
1.2 DATA COLLECTOR'S CODE
1.3 DATE OF INTERVIEW (DD/MM/YYYY) . .
1.4 CLUSTER NUMBER
1.5 HOUSEHOLD NUMBER
1.6 SURVEY RESULTS COMPLETED 01
INCOMPLETE 02
HOUSEHOLD ROSTER
Please tell me the name and sex of each person who lives here, STARTING WITH THE HEAD OF THE HOUSEHOLD
List the head of the household in line 1. List the names of all household members. Then ask:
Does anyone else live here, even if they are not at home now? These may include children in school or
household members at work. If yes, complete listing. Then, collect information for each member,
one person at a time. Add a continuation sheet if there are more than 10 household members.
2.1
1 1 1
2 2 2
3 3 3
4 4 4
5 5 5
6 6 6
7 7 7
8 8 8
9 9 9
10 10 10
Are there any other persons living here – even if they are not members of your family or do not have parents
living in this household? Including children at work or at school? If yes, insert person’s name
complete the form. Then, complete the totals below.
2.2 [ ] [ ]
For each child aged 0-23 months use a different questionnaire to collect their information.
WOMENS CHARACTERISITCS (ALL WOMEN 15-49 YEARS)
INFORMATION PANEL FOR DATA COLLECTOR/FIELD WORKER
this module is to be administered to women identified in the household roster to be between 15-49 years of age.
a separate module must be completed for each eligible woman
verify that you are speaking with the correct respondent by checking that the respondent's name is the same as the name
listed in the information above
if the person you are speaking with IS NOT that individual,ask to speak with the correct respondent
(This information is entered after identifying eligible women from the Household Roster)
3.1 Woman’s Name (from column 2 of household Roster): _________________________________________________
3.2 Woman’s Line Number (Circled in column 5 of household roster): |___|___|
3.3 In what month and year were you born? (IF Don't know,USE 98) .
(ASK: In what month and year were you born?)
Male Female
Women 15-49 years (from
above)
TOTALS (total number eligible per module)
Line # Name
Is (Name) Male or Female
Please tell me how
old (NAME) is.; How
old was (NAME) on
his/her last
birthday?Record age
in completed years;
98=DK; (only for ≥50
year olds)
Circle line
number if HH
member is a
woman aged
between 15 and
49 years
Eligible for
Initiation of
breastfeeding
module /
Maternal
Nutrition
Infant and young child feeding module (up to
2 year olds)
Children under 3 years (from
above)
Circle line number if HH
member is under 3 year
olds
For each child under
3: Who is the
primary caregiver of
(NAME)? Record
line number of
caregiver.
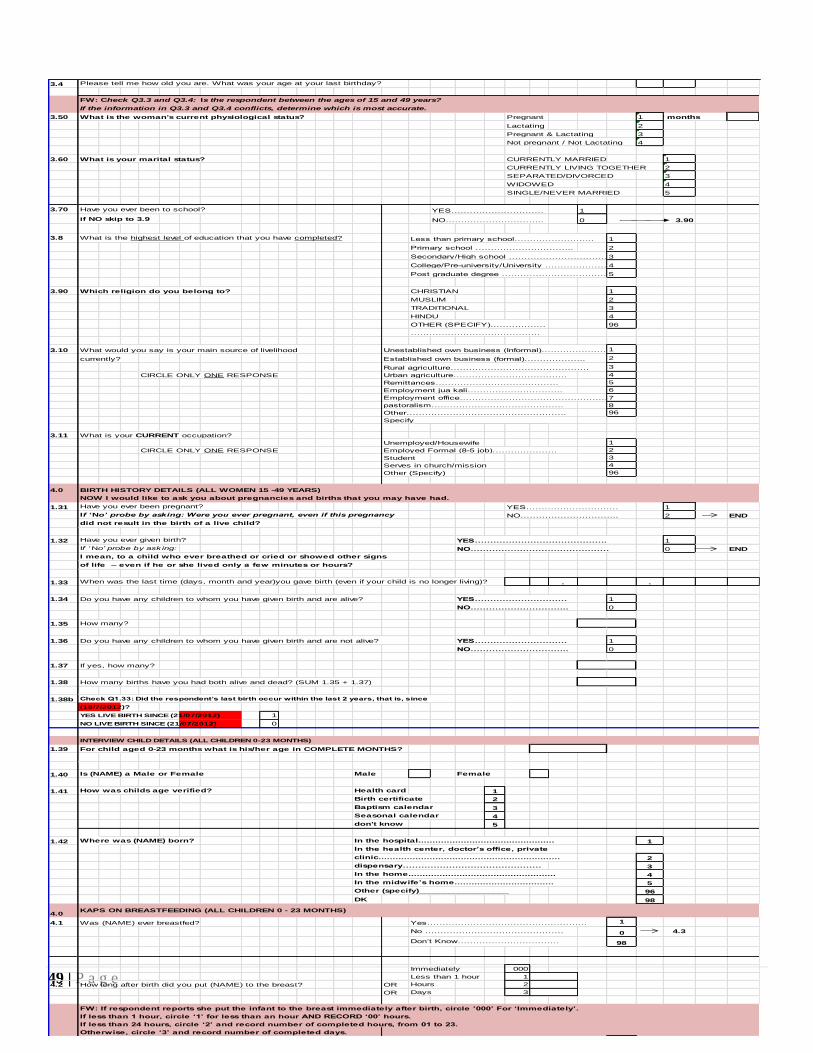
49 | P a g e
3.4 Please tell me how old you are. What was your age at your last birthday?
FW: Check Q3.3 and Q3.4: Is the respondent between the ages of 15 and 49 years?
If the information in Q3.3 and Q3.4 conflicts, determine which is most accurate.
3.50 What is the woman's current physiological status? Pregnant 1 # months
Lactating 2
Pregnant & Lactating 3
Not pregnant / Not Lactating 4
3.60 What is your marital status? CURRENTLY MARRIED 1
CURRENTLY LIVING TOGETHER 2
SEPARATED/DIVORCED 3
WIDOWED 4
SINGLE/NEVER MARRIED 5
3.70 Have you ever been to school? YES………………………… 1
if NO skip to 3.9 NO………………………….. 0 3.90
3.8 What is the highest level of education that you have completed? Less than primary school…………………….. 1
Primary school ………………………….. 2
Secondary/High school ………………………………….3
College/Pre-university/University ………………….4
Post graduate degree …………………………………..5
3.90 Which religion do you belong to? CHRISTIAN 1
MUSLIM 2
TRADITIONAL 3
HINDU 4
OTHER (SPECIFY)……………… 96
……………………………………
3.10 What would you say is your main source of livelihood Unestablished own business (Informal)…………………………………1
currently? Established own business (formal)……………….. 2
Rural agriculture……………………………………… 3
CIRCLE ONLY ONE RESPONSE Urban agriculture………………………………. 4
Remittances…………………………………. 5
Employment jua kali…………………………. 6
Employment office………………………………………….7
pastoralism……………………………………. 8
Other……………………………………………. 96
Specify___________________________
3.11 What is your CURRENT occupation?
Unemployed/Housewife 1
CIRCLE ONLY ONE RESPONSE Employed Formal (8-5 job)………………… 2
Student 3
Serves in church/mission 4
Other (Specify) 96
4.0 BIRTH HISTORY DETAILS (ALL WOMEN 15 -49 YEARS)
NOW I would like to ask you about pregnancies and births that you may have had.
1.31 Have you ever been pregnant? YES………………………… 1
If ‘No’ probe by asking: Were you ever pregnant, even if this pregnancy NO………………………….. 2 END
did not result in the birth of a live child?
1.32 Have you ever given birth? YES……………………………………. 1
If ‘ No’ probe by ask ing: NO……………………………………… 0 END
I mean, to a child who ever breathed or cried or showed other signs
of life – even if he or she lived only a few minutes or hours?
1.33 When was the last time (days, month and year)you gave birth (even if your child is no longer living)? . .
1.34 Do you have any children to whom you have given birth and are alive? YES………………………… 1
NO………………………….. 0
1.35 How many?
1.36 Do you have any children to whom you have given birth and are not alive? YES………………………… 1
NO………………………….. 0
1.37 If yes, how many?
1.38 How many births have you had both alive and dead? (SUM 1.35 + 1.37)
1.38b Check Q1.33: Did the respondent’s last birth occur within the last 2 years, that is, since
(18/7/2012)?
YES LIVE BIRTH SINCE (21/07/2012) 1
NO LIVE BIRTH SINCE (21/07/2012) 0
INTERVIEW CHILD DETAILS (ALL CHILDREN 0-23 MONTHS)
1.39 For child aged 0-23 months what is his/her age in COMPLETE MONTHS?
1.40 Is (NAME) a Male or Female Male Female
1.41 How was childs age verified? Health card 1
Birth certificate 2
Baptism calendar 3
Seasonal calendar 4
don't know 5
1.42 Where was (NAME) born? In the hospital................................................ 1
In the health center, doctor’s office, private
clinic................................................................ 2
dispensary……………………………………… 3
In the home.................................................... 4
In the midwife’s home................................... 5
Other (specify)__________________ 96
DK 98
4.0KAPS ON BREASTFEEDING (ALL CHILDREN 0 - 23 MONTHS)
4.1 Was (NAME) ever breastfed? Yes……………………………………………. 1
No ……………………………………… 0 4.3
Don’t Know…………………………… 98
Immediately 000
Less than 1 hour 1
4.2 How long after birth did you put (NAME) to the breast? OR Hours 2
OR Days 3
FW: If respondent reports she put the infant to the breast immediately after birth, circle ’000’ For ‘Immediately’.
If less than 1 hour, circle ‘1’ for less than an hour AND RECORD ‘00’ hours.
If less than 24 hours, circle ‘2’ and record number of completed hours, from 01 to 23.
Otherwise, circle ‘3’ and record number of completed days.
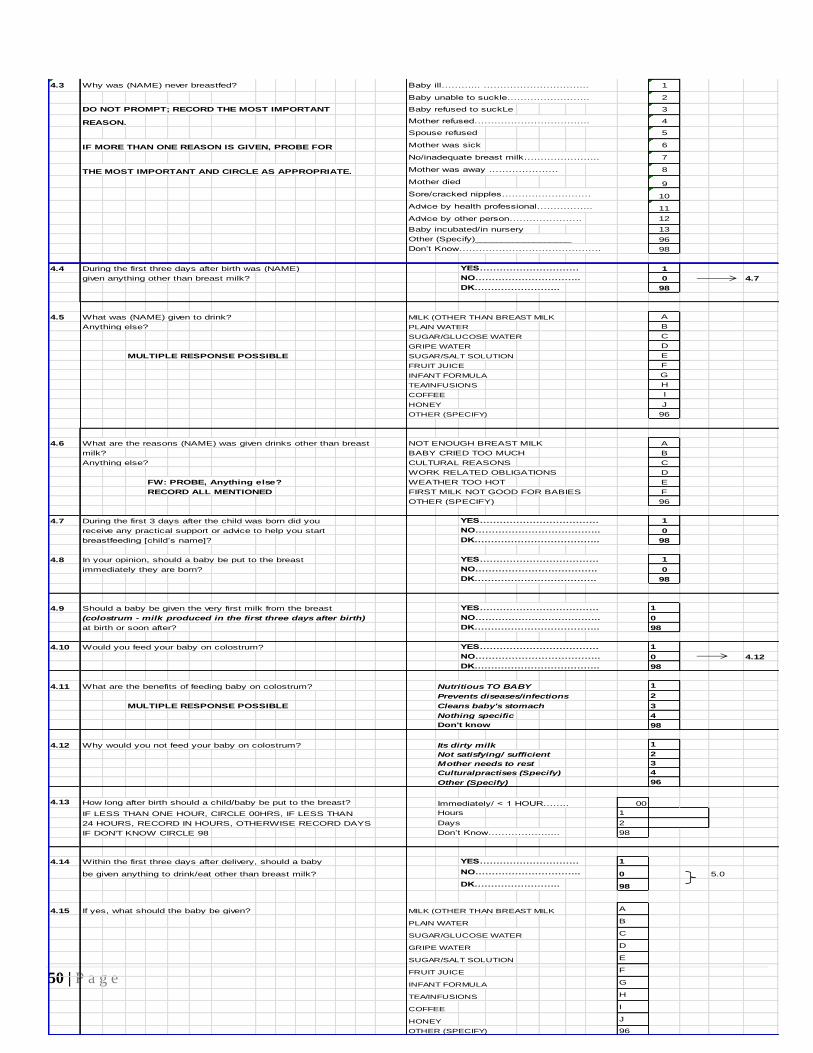
50 | P a g e
4.3 Why was (NAME) never breastfed? Baby ill………... ………………………….. 1
Baby unable to suckle……………………. 2
DO NOT PROMPT; RECORD THE MOST IMPORTANT Baby refused to suckLe 3
REASON. Mother refused…………………………….. 4
Spouse refused 5
IF MORE THAN ONE REASON IS GIVEN, PROBE FOR Mother was sick 6
No/inadequate breast milk………………….. 7
THE MOST IMPORTANT AND CIRCLE AS APPROPRIATE. Mother was away ………………… 8
Mother died 9
Sore/cracked nipples……………………… 10
Advice by health professional…………….. 11
Advice by other person…………………. 12
Baby incubated/in nursery 13
Other (Specify)__________________ 96
Don’t Know……………………………………. 98
4.4 During the first three days after birth was (NAME) YES………………………… 1
given anything other than breast milk? NO………………………….. 0 4.7
DK…………………….. 98
4.5 What was (NAME) given to drink? MILK (OTHER THAN BREAST MILK A
Anything else? PLAIN WATER B
SUGAR/GLUCOSE WATER C
GRIPE WATER D
MULTIPLE RESPONSE POSSIBLE SUGAR/SALT SOLUTION E
FRUIT JUICE F
INFANT FORMULA G
TEA/INFUSIONS H
COFFEE I
HONEY J
OTHER (SPECIFY) 96
4.6 What are the reasons (NAME) was given drinks other than breast NOT ENOUGH BREAST MILK A
milk? BABY CRIED TOO MUCH B
Anything else? CULTURAL REASONS C
WORK RELATED OBLIGATIONS D
FW: PROBE, Anything else? WEATHER TOO HOT E
RECORD ALL MENTIONED FIRST MILK NOT GOOD FOR BABIES F
OTHER (SPECIFY) 96
4.7 During the first 3 days after the child was born did you YES……………………………… 1
receive any practical support or advice to help you start NO……………………………….. 0
breastfeeding [child’s name]? DK……………………………….. 98
4.8 In your opinion, should a baby be put to the breast YES……………………………… 1
immediately they are born? NO………………………………. 0
DK………………………………. 98
4.9 Should a baby be given the very first milk from the breast YES……………………………… 1
(colostrum - milk produced in the first three days after birth) NO……………………………….. 0
at birth or soon after? DK……………………………….. 98
4.10 Would you feed your baby on colostrum? YES……………………………… 1
NO……………………………….. 0 4.12
DK……………………………….. 98
4.11 What are the benefits of feeding baby on colostrum? Nutritious TO BABY 1
Prevents diseases/infections 2
MULTIPLE RESPONSE POSSIBLE Cleans baby's stomach 3
Nothing specific 4
Don't know 98
4.12 Why would you not feed your baby on colostrum? Its dirty milk 1
Not satisfying/ sufficient 2
Mother needs to rest 3
Culturalpractises (Specify) 4
Other (Specify) 96
4.13 How long after birth should a child/baby be put to the breast? Immediately/ < 1 HOUR…….. 00
IF LESS THAN ONE HOUR, CIRCLE 00HRS, IF LESS THAN Hours 1
24 HOURS, RECORD IN HOURS, OTHERWISE RECORD DAYS Days 2
IF DON'T KNOW CIRCLE 98 Don’t Know……………….... 98
4.14 Within the first three days after delivery, should a baby YES………………………… 1
be given anything to drink/eat other than breast milk? NO………………………….. 0 5.0
DK…………………….. 98
4.15 If yes, what should the baby be given? MILK (OTHER THAN BREAST MILK A
PLAIN WATER B
SUGAR/GLUCOSE WATER C
GRIPE WATER D
SUGAR/SALT SOLUTION E
FRUIT JUICE F
INFANT FORMULA G
TEA/INFUSIONS H
COFFEE I
HONEY J
OTHER (SPECIFY) 96
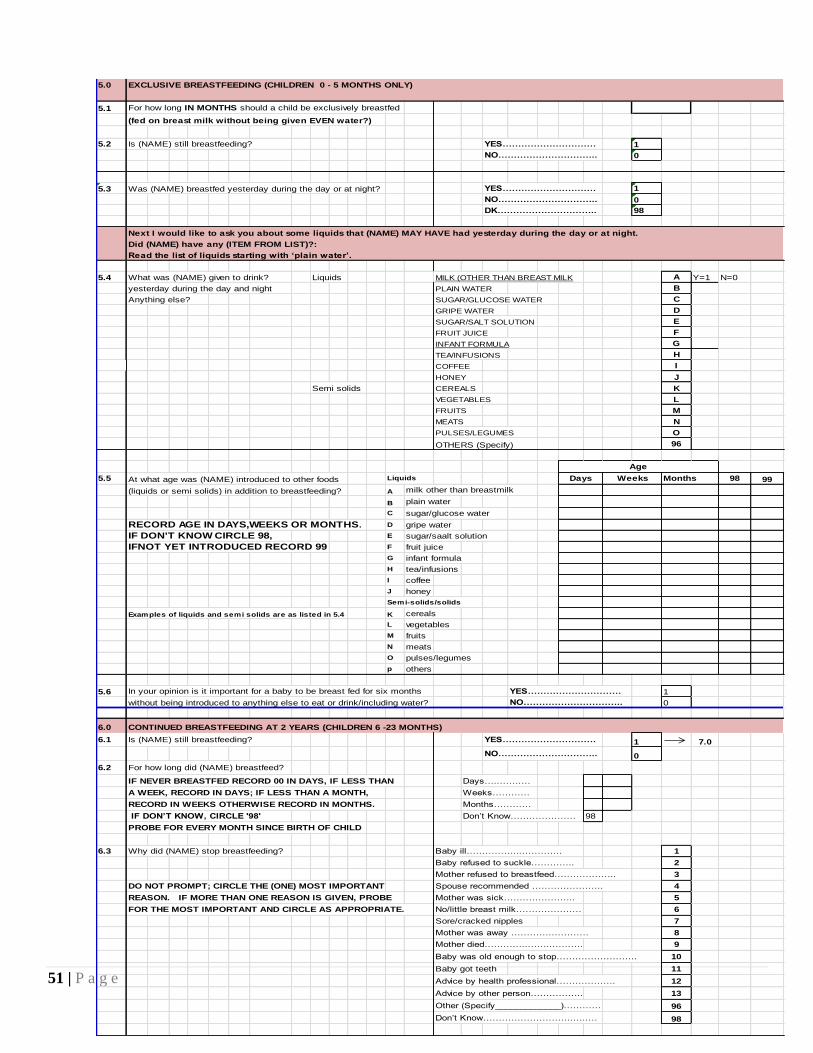
51 | P a g e
5.0 EXCLUSIVE BREASTFEEDING (CHILDREN 0 - 5 MONTHS ONLY)
5.1 For how long IN MONTHS should a child be exclusively breastfed
(fed on breast milk without being given EVEN water?)
5.2 Is (NAME) still breastfeeding? YES………………………… 1
NO………………………….. 0
5.3 Was (NAME) breastfed yesterday during the day or at night? YES………………………… 1
NO………………………….. 0
DK………………………….. 98
Next I would like to ask you about some liquids that (NAME) MAY HAVE had yesterday during the day or at night.
Did (NAME) have any (ITEM FROM LIST)?:
Read the list of liquids starting with ‘plain water’.
5.4 What was (NAME) given to drink? Liquids MILK (OTHER THAN BREAST MILK A Y=1 N=0
yesterday during the day and night PLAIN WATER B
Anything else? SUGAR/GLUCOSE WATER C
GRIPE WATER D
SUGAR/SALT SOLUTION E
FRUIT JUICE F
INFANT FORMULA G
TEA/INFUSIONS H
COFFEE I
HONEY J
Semi solids CEREALS K
VEGETABLES L
FRUITS M
MEATS N
PULSES/LEGUMES O
OTHERS (Specify) 96
5.5 At what age was (NAME) introduced to other foods Liquids Months 98 99
(liquids or semi solids) in addition to breastfeeding? A milk other than breastmilk
B plain water
C sugar/glucose water
RECORD AGE IN DAYS,WEEKS OR MONTHS. D gripe water
IF DON'T KNOW CIRCLE 98, E sugar/saalt solution
IFNOT YET INTRODUCED RECORD 99 F fruit juice
G infant formula
H tea/infusions
I coffee
J honey
Semi-solids/solids
Examples of liquids and semi solids are as listed in 5.4 K cereals
L vegetables
M fruits
N meats
O pulses/legumes
p others
5.6 In your opinion is it important for a baby to be breast fed for six months YES………………………… 1
without being introduced to anything else to eat or drink/including water? NO………………………….. 0
6.0 CONTINUED BREASTFEEDING AT 2 YEARS (CHILDREN 6 -23 MONTHS)
6.1 Is (NAME) still breastfeeding? YES………………………… 1 7.0
NO………………………….. 0
6.2 For how long did (NAME) breastfeed?
IF NEVER BREASTFED RECORD 00 IN DAYS, IF LESS THAN Days…..…….…
A WEEK, RECORD IN DAYS; IF LESS THAN A MONTH, Weeks…………
RECORD IN WEEKS OTHERWISE RECORD IN MONTHS. Months…………
IF DON’T KNOW, CIRCLE '98' Don’t Know………………… 98
PROBE FOR EVERY MONTH SINCE BIRTH OF CHILD
6.3 Why did (NAME) stop breastfeeding? Baby ill……………...…………. 1
Baby refused to suckle………….. 2
Mother refused to breastfeed……………….. 3
DO NOT PROMPT; CIRCLE THE (ONE) MOST IMPORTANT Spouse recommended ………………….. 4
REASON. IF MORE THAN ONE REASON IS GIVEN, PROBE Mother was sick………………….. 5
FOR THE MOST IMPORTANT AND CIRCLE AS APPROPRIATE. No/little breast milk………………… 6
Sore/cracked nipples 7
Mother was away ………….………… 8
Mother died…………..……..………. 9
Baby was old enough to stop…………………….. 10
Baby got teeth 11
Advice by health professional………………. 12
Advice by other person…………….. 13
Other (Specify_____________)………… 96
Don’t Know………………………..…..… 98
WeeksDays
Age
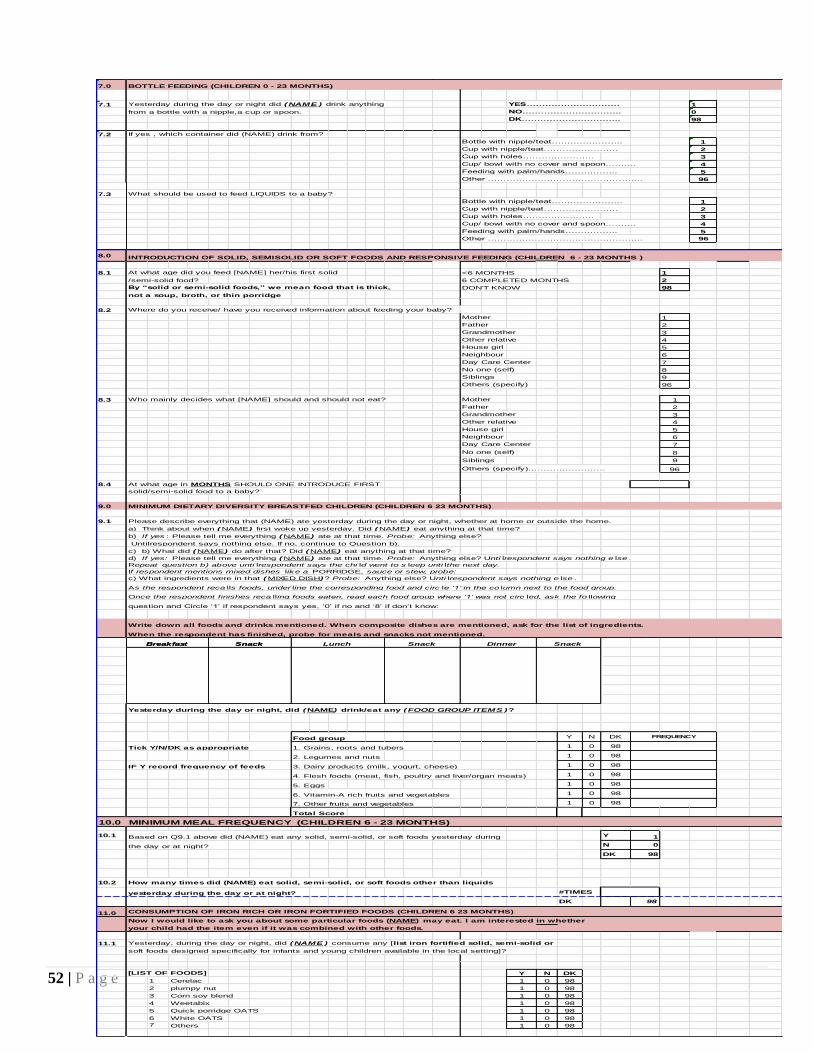
52 | P a g e
7.0 BOTTLE FEEDING (CHILDREN 0 - 23 MONTHS)
7.1 Yesterday during the day or night did (NAME ) drink anything YES………………………… 1
from a bottle with a nipple,a cup or spoon. NO………………………….. 0
DK………………………….. 98
7.2 If yes , which container did (NAME) drink from?
Bottle with nipple/teat………………….. 1
Cup with nipple/teat…………………… 2
Cup with holes………………….. 3
Cup/ bowl with no cover and spoon………. 4
Feeding with palm/hands…………….. 5
Other ………………………………………….. 96
7.3 What should be used to feed LIQUIDS to a baby?
Bottle with nipple/teat………………….. 1
Cup with nipple/teat…………………… 2
Cup with holes………………….. 3
Cup/ bowl with no cover and spoon………. 4
Feeding with palm/hands…………….. 5
Other ………………………………………….. 96
8.0 INTRODUCTION OF SOLID, SEMISOLID OR SOFT FOODS AND RESPONSIVE FEEDING (CHILDREN 6 - 23 MONTHS )
8.1 At what age did you feed [NAME] her/his first solid <6 MONTHS 1
/semi-solid food? 6 COMPLETED MONTHS 2
By “solid or semi-solid foods,” we mean food that is thick, DON'T KNOW 98
not a soup, broth, or thin porridge
8.2 Where do you receive/ have you received information about feeding your baby?
Mother 1
Father 2
Grandmother 3
Other relative 4
House girl 5
Neighbour 6
Day Care Center 7
No one (self) 8
Siblings 9
Others (specify) 96
8.3 Who mainly decides what [NAME] should and should not eat? Mother 1
Father 2
Grandmother 3
Other relative 4
House girl 5
Neighbour 6
Day Care Center 7
No one (self) 8
Siblings 9
Others (specify)……………………. 96
8.4 At what age in MONTHS SHOULD ONE INTRODUCE FIRST
solid/semi-solid food to a baby?
9.0 MINIMUM DIETARY DIVERSITY BREASTFED CHILDREN (CHILDREN 6 23 MONTHS)
9.1 Please describe everything that (NAME) ate yesterday during the day or night, whether at home or outside the home.
a) Think about when (NAME) first woke up yesterday. Did (NAME) eat anything at that time?
b) If yes : Please tell me everything (NAME) ate at that time. Probe: Anything else?
Untilrespondent says nothing else. If no, continue to Question b).
c) b) What did (NAME) do after that? Did (NAME) eat anything at that time?
d) If yes: Please tell me everything (NAME) ate at that time. Probe: Anything else? Unti lrespondent says nothing e lse .
Repeat question b) above unti lrespondent says the chi ld went to s leep unti lthe next day.
If respondent mentions mixed dishes like a PORRIDGE, sauce or stew, probe:
c) What ingredients were in that (MIXED DISH)? Probe: Anything else? Unti lrespondent says nothing e lse .
As the respondent reca lls foods, under line the corresponding food and circ le ‘1’ in the co lumn next to the food group.
Once the respondent finishes reca lling foods eaten, read each food group where ‘1’ was not circ led, ask the fo llowing
question and Circle ‘1’ if respondent says yes, ‘0’ if no and ‘8’ if don’t know:
Write down all foods and drinks mentioned. When composite dishes are mentioned, ask for the list of ingredients.
When the respondent has finished, probe for meals and snacks not mentioned.
Yesterday during the day or night, did (NAME) drink/eat any (FOOD GROUP ITEMS )?
Food group Y N DK
Tick Y/N/DK as appropriate 1. Grains, roots and tubers 1 0 98
2. Legumes and nuts 1 0 98
IF Y record frequency of feeds 3. Dairy products (milk, yogurt, cheese) 1 0 98
4. Flesh foods (meat, fish, poultry and liver/organ meats) 1 0 98
5. Eggs 1 0 98
6. Vitamin-A rich fruits and vegetables 1 0 98
7. Other fruits and vegetables 1 0 98
Total Score
10.0 MINIMUM MEAL FREQUENCY (CHILDREN 6 - 23 MONTHS)
10.1 Based on Q9.1 above did (NAME) eat any solid, semi-solid, or soft foods yesterday during Y 1
the day or at night? N 0
DK 98
10.2 How many times did (NAME) eat solid, semi-solid, or soft foods other than liquids
yesterday during the day or at night? #TIMES
DK 98
11.0 CONSUMPTION OF IRON RICH OR IRON FORTIFIED FOODS (CHILDREN 6 23 MONTHS)
Now I would like to ask you about some particular foods (NAME) may eat. I am interested in whether
your child had the item even if it was combined with other foods.
11.1 Yesterday, during the day or night, did (NAME ) consume any [list iron fortified solid, semi-solid or
soft foods designed specifically for infants and young children available in the local setting]?
[LIST OF FOODS] Y N DK
1 Cerelac 1 0 98
2 plumpy nut 1 0 98
3 Corn soy blend 1 0 98
4 Weetabix 1 0 98
5 Quick porridge OATS 1 0 98
6 White OATS 1 0 98
7 Others 1 0 98
Snack DinnerSnackBreakfastBreakfast Snack SnackLunch
FREQUENCY
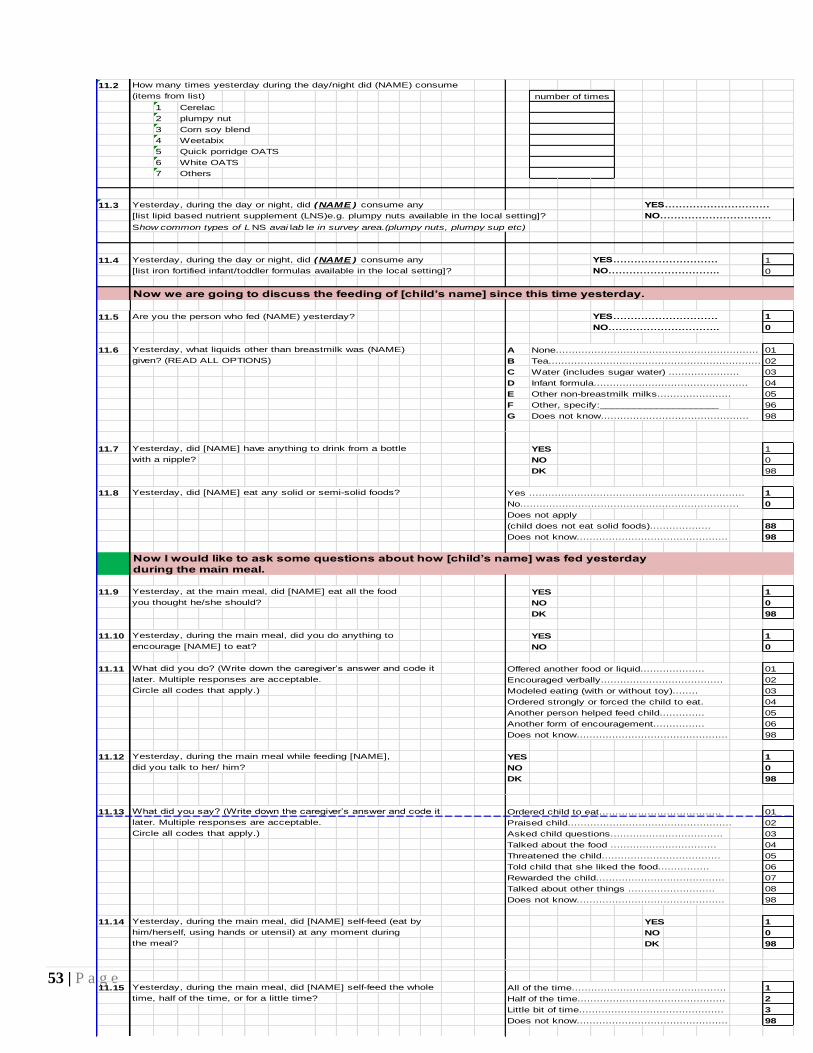
53 | P a g e
11.2 How many times yesterday during the day/night did (NAME) consume
(items from list)
1 Cerelac
2 plumpy nut
3 Corn soy blend
4 Weetabix
5 Quick porridge OATS
6 White OATS
7 Others
11.3 Yesterday, during the day or night, did (NAME ) consume any YES…………………………
[list lipid based nutrient supplement (LNS)e.g. plumpy nuts available in the local setting]? NO…………………………..
Show common types of L NS avai lab le in survey area.(plumpy nuts, plumpy sup etc)
11.4 Yesterday, during the day or night, did (NAME ) consume any YES………………………… 1
[list iron fortified infant/toddler formulas available in the local setting]? NO………………………….. 0
Now we are going to discuss the feeding of [child’s name] since this time yesterday.
11.5 Are you the person who fed (NAME) yesterday? YES………………………… 1
NO………………………….. 0
11.6 Yesterday, what liquids other than breastmilk was (NAME) A None............................................................... 01
given? (READ ALL OPTIONS) B Tea.................................................................. 02
C Water (includes sugar water) ...................... 03
D Infant formula................................................ 04
E Other non-breastmilk milks....................... 05
F Other, specify:_____________________ 96
G Does not know.............................................. 98
11.7 Yesterday, did [NAME] have anything to drink from a bottle YES 1
with a nipple? NO 0
DK 98
11.8 Yesterday, did [NAME] eat any solid or semi-solid foods? Yes ................................................................... 1
No.................................................................... 0
Does not apply
(child does not eat solid foods)................... 88
Does not know............................................... 98
Now I would like to ask some questions about how [child’s name] was fed yesterday
during the main meal.
11.9 Yesterday, at the main meal, did [NAME] eat all the food YES 1
you thought he/she should? NO 0
DK 98
11.10 Yesterday, during the main meal, did you do anything to YES 1
encourage [NAME] to eat? NO 0
11.11 What did you do? (Write down the caregiver’s answer and code it Offered another food or liquid.................... 01
later. Multiple responses are acceptable. Encouraged verbally...................................... 02
Circle all codes that apply.) Modeled eating (with or without toy)........ 03
Ordered strongly or forced the child to eat. 04
Another person helped feed child.............. 05
Another form of encouragement................ 06
Does not know............................................... 98
11.12 Yesterday, during the main meal while feeding [NAME], YES 1
did you talk to her/ him? NO 0
DK 98
11.13 What did you say? (Write down the caregiver’s answer and code it Ordered child to eat...................................... 01
later. Multiple responses are acceptable. Praised child................................................... 02
Circle all codes that apply.) Asked child questions................................... 03
Talked about the food ................................. 04
Threatened the child..................................... 05
Told child that she liked the food................ 06
Rewarded the child........................................ 07
Talked about other things ........................... 08
Does not know.............................................. 98
11.14 Yesterday, during the main meal, did [NAME] self-feed (eat by YES 1
him/herself, using hands or utensil) at any moment during NO 0
the meal? DK 98
11.15 Yesterday, during the main meal, did [NAME] self-feed the whole All of the time................................................ 1
time, half of the time, or for a little time? Half of the time.............................................. 2
Little bit of time............................................. 3
Does not know............................................... 98
number of times
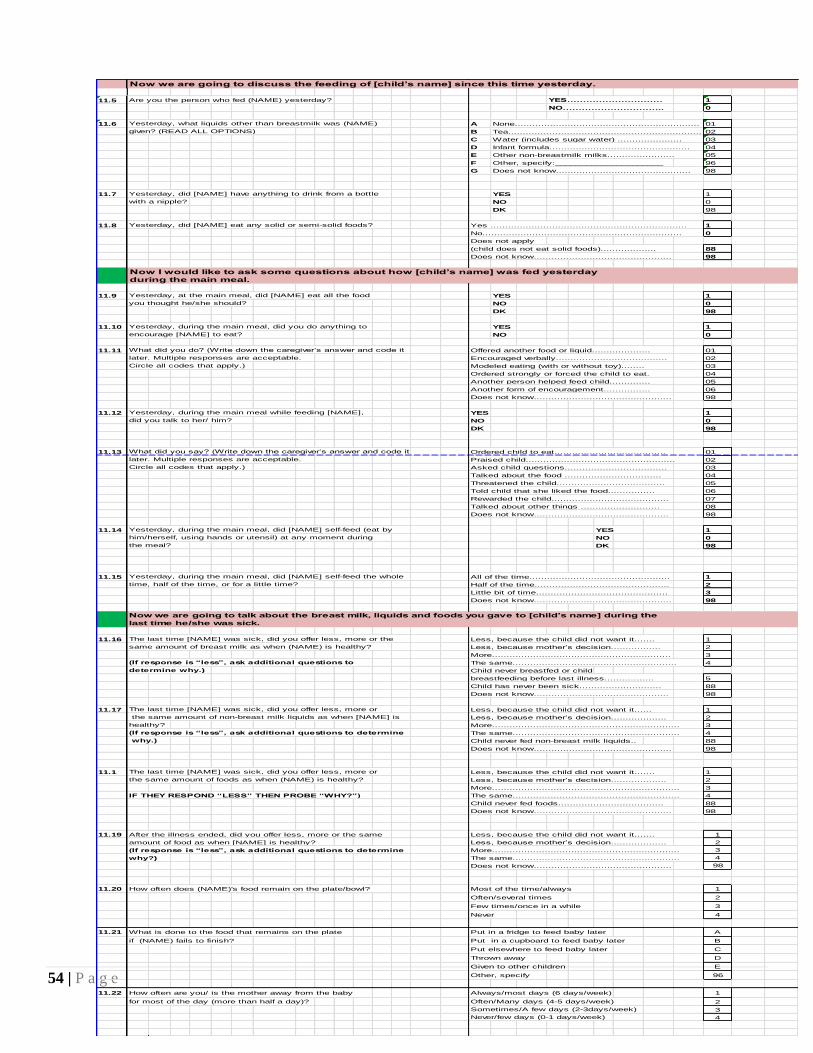
54 | P a g e
Now we are going to discuss the feeding of [child’s name] since this time yesterday.
11.5 Are you the person who fed (NAME) yesterday? YES………………………… 1
NO………………………….. 0
11.6 Yesterday, what liquids other than breastmilk was (NAME) A None............................................................... 01
given? (READ ALL OPTIONS) B Tea.................................................................. 02
C Water (includes sugar water) ...................... 03
D Infant formula................................................ 04
E Other non-breastmilk milks....................... 05
F Other, specify:_____________________ 96
G Does not know.............................................. 98
11.7 Yesterday, did [NAME] have anything to drink from a bottle YES 1
with a nipple? NO 0
DK 98
11.8 Yesterday, did [NAME] eat any solid or semi-solid foods? Yes ................................................................... 1
No.................................................................... 0
Does not apply
(child does not eat solid foods)................... 88
Does not know............................................... 98
Now I would like to ask some questions about how [child’s name] was fed yesterday
during the main meal.
11.9 Yesterday, at the main meal, did [NAME] eat all the food YES 1
you thought he/she should? NO 0
DK 98
11.10 Yesterday, during the main meal, did you do anything to YES 1
encourage [NAME] to eat? NO 0
11.11 What did you do? (Write down the caregiver’s answer and code it Offered another food or liquid.................... 01
later. Multiple responses are acceptable. Encouraged verbally...................................... 02
Circle all codes that apply.) Modeled eating (with or without toy)........ 03
Ordered strongly or forced the child to eat. 04
Another person helped feed child.............. 05
Another form of encouragement................ 06
Does not know............................................... 98
11.12 Yesterday, during the main meal while feeding [NAME], YES 1
did you talk to her/ him? NO 0
DK 98
11.13 What did you say? (Write down the caregiver’s answer and code it Ordered child to eat...................................... 01
later. Multiple responses are acceptable. Praised child................................................... 02
Circle all codes that apply.) Asked child questions................................... 03
Talked about the food ................................. 04
Threatened the child..................................... 05
Told child that she liked the food................ 06
Rewarded the child........................................ 07
Talked about other things ........................... 08
Does not know.............................................. 98
11.14 Yesterday, during the main meal, did [NAME] self-feed (eat by YES 1
him/herself, using hands or utensil) at any moment during NO 0
the meal? DK 98
11.15 Yesterday, during the main meal, did [NAME] self-feed the whole All of the time................................................ 1
time, half of the time, or for a little time? Half of the time.............................................. 2
Little bit of time............................................. 3
Does not know............................................... 98
Now we are going to talk about the breast milk, liquids and foods you gave to [child’s name] during the
last time he/she was sick.
11.16 The last time [NAME] was sick, did you offer less, more or the Less, because the child did not want it....... 1
same amount of breast milk as when (NAME) is healthy? Less, because mother’s decision................. 2
More............................................................. 3
(If response is “less”, ask additional questions to The same........................................................ 4
determine why.) Child never breastfed or child
breastfeeding before last illness................. 5
Child has never been sick............................ 88
Does not know.............................................. 98
11.17 The last time [NAME] was sick, did you offer less, more or Less, because the child did not want it...... 1
the same amount of non-breast milk liquids as when [NAME] is Less, because mother’s decision................... 2
healthy? More................................................................ 3
(If response is “less”, ask additional questions to determine The same......................................................... 4
why.) Child never fed non-breast milk liquids.. 88
Does not know............................................... 98
11.1 The last time [NAME] was sick, did you offer less, more or Less, because the child did not want it....... 1
the same amount of foods as when (NAME) is healthy? Less, because mother’s decision................... 2
More................................................................ 3
IF THEY RESPOND “LESS” THEN PROBE “WHY?”) The same......................................................... 4
Child never fed foods.................................... 88
Does not know............................................... 98
11.19 After the illness ended, did you offer less, more or the same Less, because the child did not want it....... 1
amount of food as when [NAME] is healthy? Less, because mother’s decision................... 2
(If response is “less”, ask additional questions to determine More................................................................ 3
why?) The same......................................................... 4
Does not know............................................... 98
11.20 How often does (NAME)'s food remain on the plate/bowl? Most of the time/always 1
Often/several times 2
Few times/once in a while 3
Never 4
11.21 What is done to the food that remains on the plate Put in a fridge to feed baby later A
if (NAME) fails to finish? Put in a cupboard to feed baby later B
Put elsewhere to feed baby later C
Thrown away D
Given to other children E
Other, specify 96
11.22 How often are you/ is the mother away from the baby Always/most days (6 days/week) 1
for most of the day (more than half a day)? Often/Many days (4-5 days/week) 2
Sometimes/A few days (2-3days/week) 3
Never/few days (0-1 days/week) 4
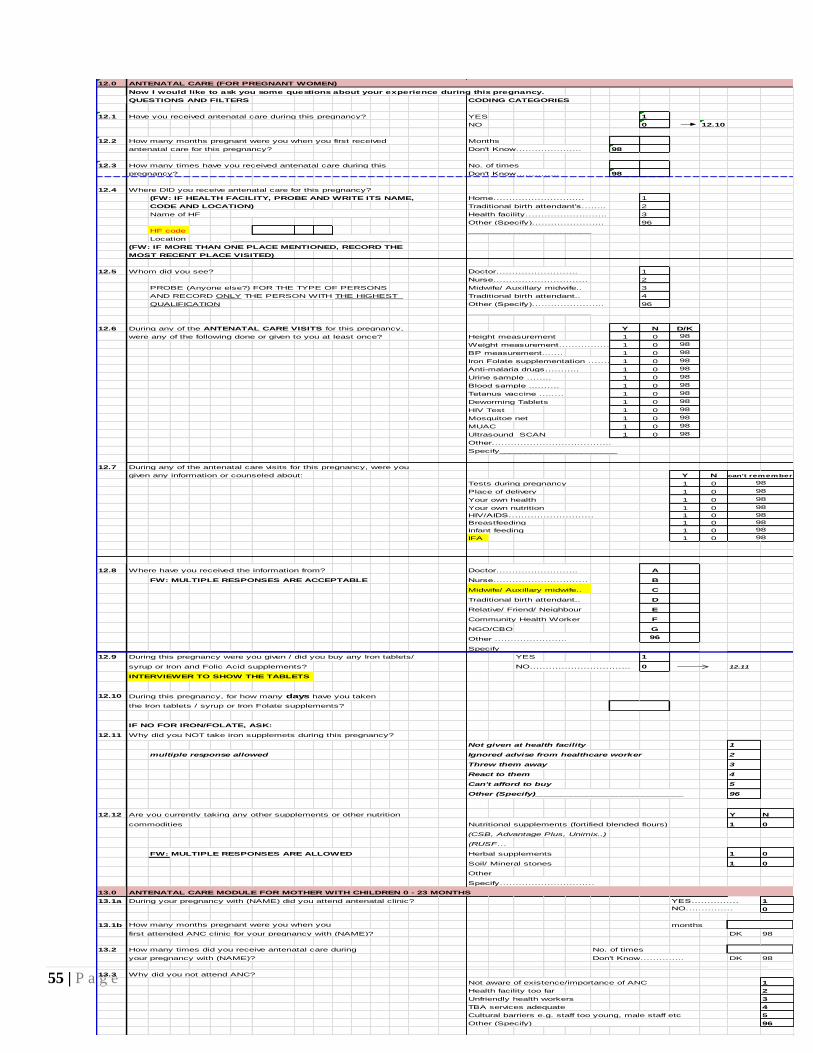
55 | P a g e
12.0 ANTENATAL CARE (FOR PREGNANT WOMEN)
Now I would like to ask you some questions about your experience during this pregnancy.
QUESTIONS AND FILTERS CODING CATEGORIES
12.1 Have you received antenatal care during this pregnancy? YES 1
NO 0 12.10
12.2 How many months pregnant were you when you first received Months
antenatal care for this pregnancy? Don't Know……….……….. 98
12.3 How many times have you received antenatal care during this No. of times
pregnancy? Don't Know………….. 98
12.4 Where DID you receive antenatal care for this pregnancy?
(FW: IF HEALTH FACILITY, PROBE AND WRITE ITS NAME, Home……………………..… 1
CODE AND LOCATION) Traditional birth attendant's…….. 2
Name of HF _________________________________ Health facility…………………….. 3
Other (Specify)………………….. 96
HF code ________________________
Location _________________________________
(FW: IF MORE THAN ONE PLACE MENTIONED, RECORD THE
MOST RECENT PLACE VISITED)
12.5 Whom did you see? Doctor…………………….. 1
Nurse………………………… 2
PROBE (Anyone else?) FOR THE TYPE OF PERSONS Midwife/ Auxillary midwife.. 3
AND RECORD ONLY THE PERSON WITH THE HIGHEST Traditional birth attendant.. 4
QUALIFICATION Other (Specify)………………….. 96
________________________
12.6 During any of the ANTENATAL CARE VISITS for this pregnancy, Y N D/K
were any of the following done or given to you at least once? Height measurement 1 0 98
Weight measurement……………………..1 0 98
BP measurement...…. 1 0 98
Iron Folate supplementation ………….1 0 98
Anti-malaria drugs……….. 1 0 98
Urine sample …….. 1 0 98
Blood sample ...……. 1 0 98
Tetanus vaccine …..… 1 0 98
Deworming Tablets 1 0 98
HIV Test 1 0 98
Mosquitoe net 1 0 98
MUAC 1 0 98
Ultrasound SCAN 1 0 98
Other………………………………..
Specify_______________________
12.7 During any of the antenatal care visits for this pregnancy, were you
given any information or counseled about: Y N
Tests during pregnancy 1 0
Place of delivery 1 0
Your own health 1 0
Your own nutrition 1 0
HIV/AIDS……………………… 1 0
Breastfeeding 1 0
Infant feeding 1 0
IFA 1 0
12.8 Where have you received the information from? Doctor…………………….. A
FW: MULTIPLE RESPONSES ARE ACCEPTABLE Nurse………………………… B
Midwife/ Auxillary midwife.. C
Traditional birth attendant.. D
Relative/ Friend/ Neighbour E
Community Health Worker F
NGO/CBO G
Other ………………….. 96
Specify___________________
12.9 During this pregnancy were you given / did you buy any Iron tablets/ YES 1
syrup or Iron and Folic Acid supplements? NO………………………….. 0 12.11
INTERVIEWER TO SHOW THE TABLETS
12.10 During this pregnancy, for how many days have you taken
the Iron tablets / syrup or Iron Folate supplements?
IF NO FOR IRON/FOLATE, ASK:
12.11 Why did you NOT take iron supplemets during this pregnancy?
Not given at health facility 1
multiple response allowed Ignored advise from healthcare worker 2
Threw them away 3
React to them 4
Can't afford to buy 5
Other (Specify)_____________________________ 96
12.12 Are you currently taking any other supplements or other nutrition Y N
commodities Nutritional supplements (fortified blended flours) 1 0
(CSB, Advantage Plus, Unimix..)
(RUSF…
FW: MULTIPLE RESPONSES ARE ALLOWED Herbal supplements 1 0
Soil/ Mineral stones 1 0
Other
Specify…………………………
13.0 ANTENATAL CARE MODULE FOR MOTHER WITH CHILDREN 0 - 23 MONTHS
13.1a During your pregnancy with (NAME) did you attend antenatal clinic? YES…………… 1
NO…………… 0
13.1b How many months pregnant were you when you months
first attended ANC clinic for your pregnancy with (NAME)? DK 98
13.2 How many times did you receive antenatal care during No. of times
your pregnancy with (NAME)? Don't Know………….. DK 98
13.3 Why did you not attend ANC?
Not aware of existence/importance of ANC 1
Health facility too far 2
Unfriendly health workers 3
TBA services adequate 4
Cultural barriers e.g. staff too young, male staff etc 5
Other (Specify)_______________________________ 96
98
98
can't remember
98
98
98
98
98
98
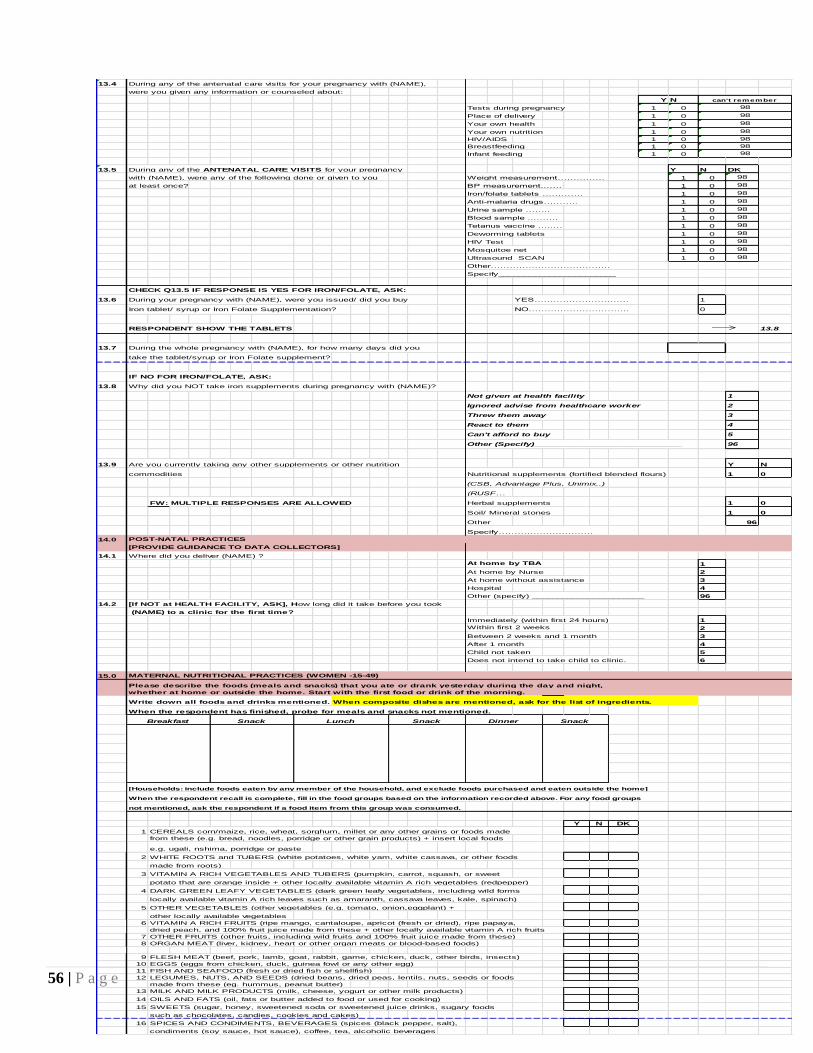
56 | P a g e
13.4 During any of the antenatal care visits for your pregnancy with (NAME),
were you given any information or counseled about:
Y N
Tests during pregnancy 1 0
Place of delivery 1 0
Your own health 1 0
Your own nutrition 1 0
HIV/AIDS 1 0
Breastfeeding 1 0
Infant feeding 1 0
13.5 During any of the ANTENATAL CARE VISITS for your pregnancy Y N DK
with (NAME), were any of the following done or given to you Weight measurement…………… 1 0 98
at least once? BP measurement...…. 1 0 98
Iron/folate tablets …………. 1 0 98
Anti-malaria drugs……….. 1 0 98
Urine sample …….. 1 0 98
Blood sample ...……. 1 0 98
Tetanus vaccine …..… 1 0 98
Deworming tablets 1 0 98
HIV Test 1 0 98
Mosquitoe net 1 0 98
Ultrasound SCAN 1 0 98
Other………………………………..
Specify_______________________
CHECK Q13.5 IF RESPONSE IS YES FOR IRON/FOLATE, ASK:
13.6 During your pregnancy with (NAME), were you issued/ did you buy YES………………………… 1
Iron tablet/ syrup or Iron Folate Supplementation? NO………………………….. 0
RESPONDENT SHOW THE TABLETS 13.8
13.7 During the whole pregnancy with (NAME), for how many days did you
take the tablet/syrup or Iron Folate supplement?
IF NO FOR IRON/FOLATE, ASK:
13.8 Why did you NOT take iron supplements during pregnancy with (NAME)?
Not given at health facility 1
Ignored advise from healthcare worker 2
Threw them away 3
React to them 4
Can't afford to buy 5
Other (Specify)_____________________________ 96
13.9 Are you currently taking any other supplements or other nutrition Y N
commodities Nutritional supplements (fortified blended flours) 1 0
(CSB, Advantage Plus, Unimix..)
(RUSF…
FW: MULTIPLE RESPONSES ARE ALLOWED Herbal supplements 1 0
Soil/ Mineral stones 1 0
Other 96
Specify…………………………
14.0 POST-NATAL PRACTICES
[PROVIDE GUIDANCE TO DATA COLLECTORS]
14.1 Where did you deliver (NAME) ?
At home by TBA 1
At home by Nurse 2
At home without assistance 3
Hospital 4
Other (specify) ______________________ 96
14.2 [If NOT at HEALTH FACILITY, ASK], How long did it take before you took
(NAME) to a clinic for the first time?
Immediately (within first 24 hours) 1
Within first 2 weeks 2
Between 2 weeks and 1 month 3
After 1 month 4
Child not taken 5
Does not intend to take child to clinic. 6
15.0 MATERNAL NUTRITIONAL PRACTICES (WOMEN -15-49)
Please describe the foods (meals and snacks) that you ate or drank yesterday during the day and night,
whether at home or outside the home. Start with the first food or drink of the morning.
Write down all foods and drinks mentioned. When composite dishes are mentioned, ask for the list of ingredients.
When the respondent has finished, probe for meals and snacks not mentioned.
[Households: include foods eaten by any member of the household, and exclude foods purchased and eaten outside the home]
When the respondent recall is complete, fill in the food groups based on the information recorded above. For any food groups
not mentioned, ask the respondent if a food item from this group was consumed.
Y N DK
1 CEREALS corn/maize, rice, wheat, sorghum, millet or any other grains or foods made
from these (e.g. bread, noodles, porridge or other grain products) + insert local foods
e.g. ugali, nshima, porridge or paste
2 WHITE ROOTS and TUBERS (white potatoes, white yam, white cassava, or other foods
made from roots)
3 VITAMIN A RICH VEGETABLES AND TUBERS (pumpkin, carrot, squash, or sweet
potato that are orange inside + other locally available vitamin A rich vegetables (redpepper)
4 DARK GREEN LEAFY VEGETABLES (dark green leafy vegetables, including wild forms
locally available vitamin A rich leaves such as amaranth, cassava leaves, kale, spinach)
5 OTHER VEGETABLES (other vegetables (e.g. tomato, onion,eggplant) +
other locally available vegetables
6 VITAMIN A RICH FRUITS (ripe mango, cantaloupe, apricot (fresh or dried), ripe papaya,
dried peach, and 100% fruit juice made from these + other locally available vitamin A rich fruits
7 OTHER FRUITS (other fruits, including wild fruits and 100% fruit juice made from these)
8 ORGAN MEAT (liver, kidney, heart or other organ meats or blood-based foods)
9 FLESH MEAT (beef, pork, lamb, goat, rabbit, game, chicken, duck, other birds, insects)
10 EGGS (eggs from chicken, duck, guinea fowl or any other egg)
11 FISH AND SEAFOOD (fresh or dried fish or shellfish)
12 LEGUMES, NUTS, AND SEEDS (dried beans, dried peas, lentils, nuts, seeds or foods
made from these (eg. hummus, peanut butter)
13 MILK AND MILK PRODUCTS (milk, cheese, yogurt or other milk products)
14 OILS AND FATS (oil, fats or butter added to food or used for cooking)
15 SWEETS (sugar, honey, sweetened soda or sweetened juice drinks, sugary foods
such as chocolates, candies, cookies and cakes)
16 SPICES AND CONDIMENTS, BEVERAGES (spices (black pepper, salt),
condiments (soy sauce, hot sauce), coffee, tea, alcoholic beverages
98
98
98
Dinner SnackSnackLunchSnackBreakfast
can't remember
98
98
98
98
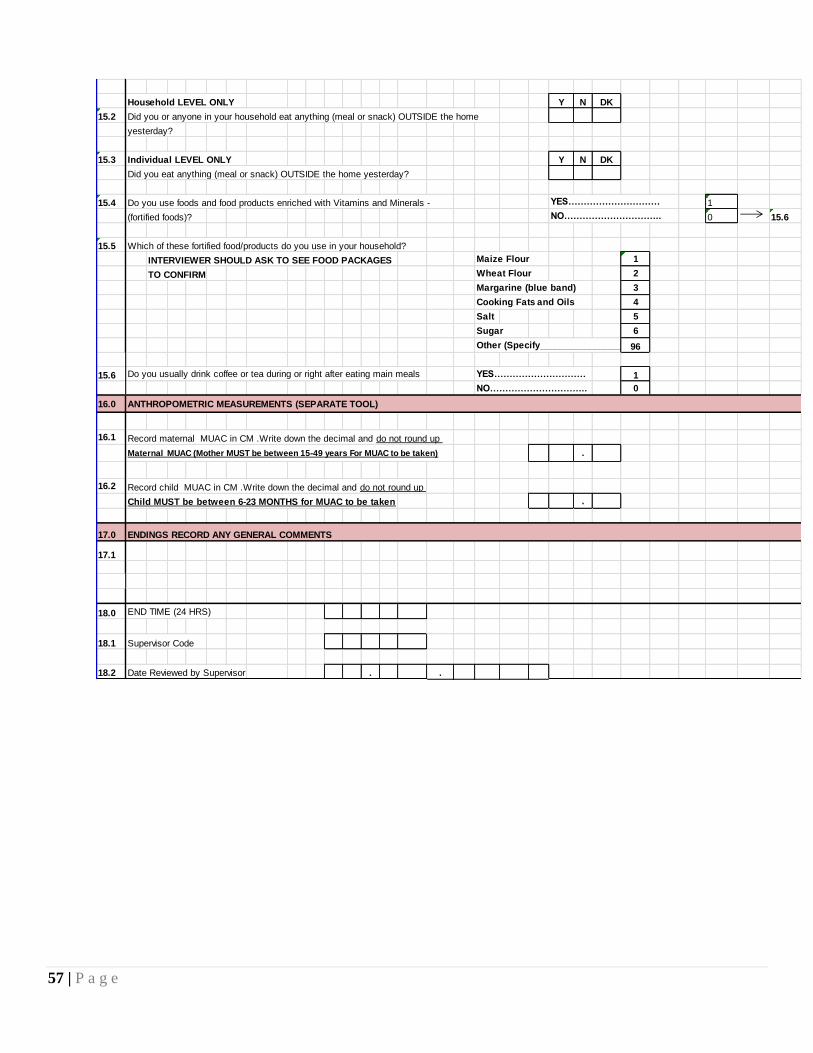
57 | P a g e
Household LEVEL ONLY Y N DK
15.2 Did you or anyone in your household eat anything (meal or snack) OUTSIDE the home
yesterday?
15.3 Individual LEVEL ONLY Y N DK
Did you eat anything (meal or snack) OUTSIDE the home yesterday?
15.4 Do you use foods and food products enriched with Vitamins and Minerals - YES………………………… 1
(fortified foods)? NO………………………….. 0 15.6
15.5 Which of these fortified food/products do you use in your household?
INTERVIEWER SHOULD ASK TO SEE FOOD PACKAGES Maize Flour 1
TO CONFIRM Wheat Flour 2
Margarine (blue band) 3
Cooking Fats and Oils 4
Salt 5
Sugar 6
Other (Specify_________________) 96
15.6 Do you usually drink coffee or tea during or right after eating main meals YES………………………… 1
NO………………………….. 0
16.0 ANTHROPOMETRIC MEASUREMENTS (SEPARATE TOOL)
16.1 Record maternal MUAC in CM .Write down the decimal and do not round up
Maternal MUAC (Mother MUST be between 15-49 years For MUAC to be taken) .
16.2 Record child MUAC in CM .Write down the decimal and do not round up
Child MUST be between 6-23 MONTHS for MUAC to be taken .
17.0 ENDINGS RECORD ANY GENERAL COMMENTS
17.1
18.0 END TIME (24 HRS)
18.1 Supervisor Code
18.2 Date Reviewed by Supervisor . .


![DIET Management for Lactating Women Auto Saved]](https://img.pdfslide.net/doc/110x75/577d33ba1a28ab3a6b8b90a9/diet-management-for-lactating-women-auto-saved.jpg)