Embed Size (px)
Citation preview
MATH 132
Problem Solving:Algebra, Probability,
and Statistics
Spring 2015
Typeset: Jan. 6, 2015
2
MATH 132 – Problem Solving: Algebra, Probability, and StatisticsLecture notes version 1.2 (Spring 2015)
Copyright (c) 2009-2015 Carolyn Abbott, Claire Blackman, Anne Candioto, Benjamin Ellison,Allison Gordon, Edward Hanson, Diane Holcomb, Noah Kieserman, Oh Hoon Kwon, ChristineLien, Daniel McGinn, Balazs Strenner, Elizabeth Skubak WolfPermission is granted to copy, distribute and/or modify this document under the terms of theGNU Free Documentation License, Version 1.0 or any later version published by the Free SoftwareFoundation; with no Invariant Sections, no Front-Cover Texts, and no Back-Cover Texts. A copyof the license can be found at http://fsf.org/.
Contents
1 Probability 51.1 Flipping Coins: An Introduction to Probability . . . . . . . . . . . . . . . . . . . . 51.2 Sample Spaces and Equally Likely Outcomes . . . . . . . . . . . . . . . . . . . . . 91.3 Modeling Probabilities . . . . . . . . . . . . . . . . . . . . . . . . . . . . . . . . . 131.4 More Modeling . . . . . . . . . . . . . . . . . . . . . . . . . . . . . . . . . . . . 171.5 Expected Value . . . . . . . . . . . . . . . . . . . . . . . . . . . . . . . . . . . . 201.6 Using Models in Probability . . . . . . . . . . . . . . . . . . . . . . . . . . . . . . 23
2 Statistics 252.1 Measures of Center . . . . . . . . . . . . . . . . . . . . . . . . . . . . . . . . . . 252.2 Measures of Spread . . . . . . . . . . . . . . . . . . . . . . . . . . . . . . . . . . 282.3 Histograms, Stem-and-Leaf Plots, & Box Plots . . . . . . . . . . . . . . . . . . . 302.4 Scatterplots . . . . . . . . . . . . . . . . . . . . . . . . . . . . . . . . . . . . . . 342.5 Misleading Graphs & Statistics . . . . . . . . . . . . . . . . . . . . . . . . . . . . 38
3 Algebra 433.1 Arithmetic to Algebra . . . . . . . . . . . . . . . . . . . . . . . . . . . . . . . . . 433.2 Basic Equations . . . . . . . . . . . . . . . . . . . . . . . . . . . . . . . . . . . . 493.3 Ratio and Proportions Review . . . . . . . . . . . . . . . . . . . . . . . . . . . . . 583.4 Proportional Relationship . . . . . . . . . . . . . . . . . . . . . . . . . . . . . . . 693.5 Linear Relationships . . . . . . . . . . . . . . . . . . . . . . . . . . . . . . . . . . 793.6 Patterns and Rules . . . . . . . . . . . . . . . . . . . . . . . . . . . . . . . . . . 863.7 Patterns and Rules II . . . . . . . . . . . . . . . . . . . . . . . . . . . . . . . . . 89
3

4 CONTENTS
Chapter 1
Probability
1.1 Flipping Coins: An Introduction to Probability
Consider playing a game where there are two teams, the Brewers and the Cubs. You flip twocoins at the same time; if the faces that come up match (i.e. both heads or both tails), then theBrewers get a point. If the faces are different, then the Cubs get a point. I’ll come around withcoins. Don’t actually flip any of them until you get to the second question.
1. Suppose you were to flip the coins ten times. Which team do you think would have themost points? Make an exact prediction for the score (like 10-0, or 7-3). For what reasonsdid you come up with that prediction?
2. Now actually flip the coins ten times and keep score. Did the outcome match yourprediction? Do you think this is a coincidence? Do you think your prediction was a goodone? a bad one? and why? Do these results make you want to change your prediction? Ifso, what is your prediction now?
5
6 CHAPTER 1. PROBABILITY
3. What do you think the “probability” is of the Brewers scoring a point? Of the Cubs?Think carefully about how you got this answer. What reasoning and information is it basedon? Try to write down explicitly the definition of probability that you are using to getthese answers.
Now for some vocabulary to get us started. Any particular performance of a probabilityexperiment is called a trial. In this class, we will assume that a trial or experiment is random,unless otherwise noted. Sometimes we use the words trial and experiment interchangeably, but ifyou need to distinguish between the two words, consider an experiment to be the larger entity,formed by a number of trials. Each trial results in one or more outcomes. For example, we justran a probability experiment in which a trial was simultaneously flipping two coins. An outcomeof one trial was, for example, “two heads.”A basic but very important concept is the idea of a sample space, which is a list of all thepossible outcomes of a trial. Consider our probability experiment of simultaneously flipping twocoins. One student might give a sample space of
{two heads, one head and one tail, two tails},
while others student might give sample spaces of
{head-head, head-tail, tail-head, tail-tail} or even {no heads, some heads}.
Notice that in each list, every possible outcome of a trial is listed. So they are all valid samplespaces. But they are undoubtedly different; they’re not even of the same size!Lastly, we define an event to be any subset of a sample space (any collection of outcomes). Forexample, the subset {head-tail, tail-head, tail-tail} of the second sample space above is anevent. Notice we can say this in English more succinctly as the event flipping at least one tail.Think about the difference between outcomes and events. Can outcomes be events?
Having different sample spaces for the same probability experiment is not immediately aproblem. The problem comes in with the way many textbooks define probability:
Naıve Definition of Probability: The probability of event A happening is:
P (A) =number of outcomes in event A
total number of outcomes in the sample space
1.1. FLIPPING COINS: AN INTRODUCTION TO PROBABILITY 7
For example, in our probability experiment of simultaneously flipping two coins, let’s consider theevent “one head and one tail”. Going by the first sample space mentioned above, we getPr(one head and one tail) = 1
3 , but going by the second sample space mentioned above, we getPr(one head and one tail) = 2
4 . These are undoubtedly different answers. What happens if wetry to calculate this probability using the third sample space?A simple event like this should have a certain probability of happening, and we should be able tocalculate it. Furthermore, the answer we get shouldn’t change depending only on how we chooseto think about the problem. So...
1. Is the probability of getting one head and one tail actually 13 or actually 2
4 = 12? If you had
a student who wasn’t sure, what would you suggest they try to get an idea of which one iscorrect? Why?
2. Suppose we want to find the probability of getting a spade when randomly drawing a cardfrom a standard 52 card deck (with 13 cards in each of the four suits). Think about thefollowing three sample spaces. For each, what does the naıve definition give as theprobability of choosing a spade? Use the definition of probability given above and thesample spaces, not any prior knowledge!
• {club, diamond, heart, spade}
• {spade, not a spade}
• {A♣, 2♣, 3♣, ...,K♣,A♦, 2♦, ...,K♠} (i.e., all 52 cards)
One of the above is not like the others. Why does it give you a different answer? Bespecific.
8 CHAPTER 1. PROBABILITY
3. What’s wrong with the naıve definition? That is, how should you calculate probabilities?This should include some thoughts on how to choose a useful sample space.
Better Definition of Probability: The probability of event A happening is:
1.2. SAMPLE SPACES AND EQUALLY LIKELY OUTCOMES 9
1.2 Sample Spaces and Equally Likely Outcomes
1. Two students are playing a game called “Evens and Odds,” where they each roll one dieand then multiply the numbers that turn up. Brandon gets a point if the product is even,while Melissa gets a point if the product is odd. Before they play, they are asked to comeup with a sample space, and then give the probability that each will win a point.
(a) Brandon answers that there are only two possibilities, one being “Product is Even”and one being “Product is Odd”, so that each player is equally likely to win a point.Is this reasoning correct? If not, what is wrong with it?
(b) Melissa answers that the sample space is this:(1; 1) (2; 2) (3; 3) (4; 4) (5; 5) (6; 6)(1; 2) (2; 3) (3; 4) (4; 5) (5; 6)(1; 3) (2; 4) (3; 5) (4; 6)(1; 4) (2; 5) (3; 6)(1; 5) (2; 6)(1; 6)Counting up these possibilities, there are 6 combinations which give an odd product,and 15 which give an even product. Thus, the probability of Player 1 winning is 15
21 ,or 5
7 , while the probability of Player 2 winning is 621 , or 2
7 . Is this reasoning correct?Why or why not?
(c) What sample space would you use (one of the above or another)? Why?
10 CHAPTER 1. PROBABILITY
2. Suppose the letters of the word MASSACHUSETTS are each written on a separate pieceof paper and placed in a paper bag. As one trial, you choose one piece of paper at randomfrom the bag.
(a) Find a sample space for this scenario.
(b) Are each of the outcomes in your sample space equally likely? Why or why not? Ifnot, can you come up with a way to write a sample space in which the outcomes areequally likely? If your space already has equally likely outcomes, what different spacemight you see younger students coming up with first?
(c) Find the probability of the event choosing an ‘S’, and of the event choosing a vowel.
3. Suppose, as one trial, you draw two coins (without replacing the first one) from a pursewhich contains two quarters, one nickel, and one dime.
(a) Find a sample space for this scenario. Are the outcomes equally likely?
(b) If you have not yet done so, come up with a way to write a sample space in which theoutcomes are equally likely.
(c) Find the probability of the event choosing at least one quarter.
1.2. SAMPLE SPACES AND EQUALLY LIKELY OUTCOMES 11
4. (a) Consider our Brewers vs Cubs coin game from the first day of class. Suppose we wantto predict what the score will be after 3 rounds of flipping coins; for instance, say wewant to find the probability that the Brewers are ahead after 3 rounds. We originallygave a sample space, with equally likely outcomes, of{head-head, head-tail, tail-head, tail-tail}. Can we calculate the probability that wewant using only our definition and this sample space?
(b) What has changed? What should be considered as a trial? What are the outcomes ofthese trials (i.e., what is the sample space)? Are these outcomes equally likely? Ifnot, adjust your sample space so that they are.
(c) Now calculate P(the Brewers are ahead after 3 rounds).

12 CHAPTER 1. PROBABILITY
In summary: when we want to calculate a probability from our definition, we need to create asample space that will work for us. First of all, we need that all outcomes are equally likely. Also,recall our definition of probability– we can only calculate probabilities of events, and what countsas an event depends on what we choose as a sample space. Briefly discuss a strategy forapproaching a probability calculation like that from part (a) above.
1.3. MODELING PROBABILITIES 13
1.3 Modeling Probabilities
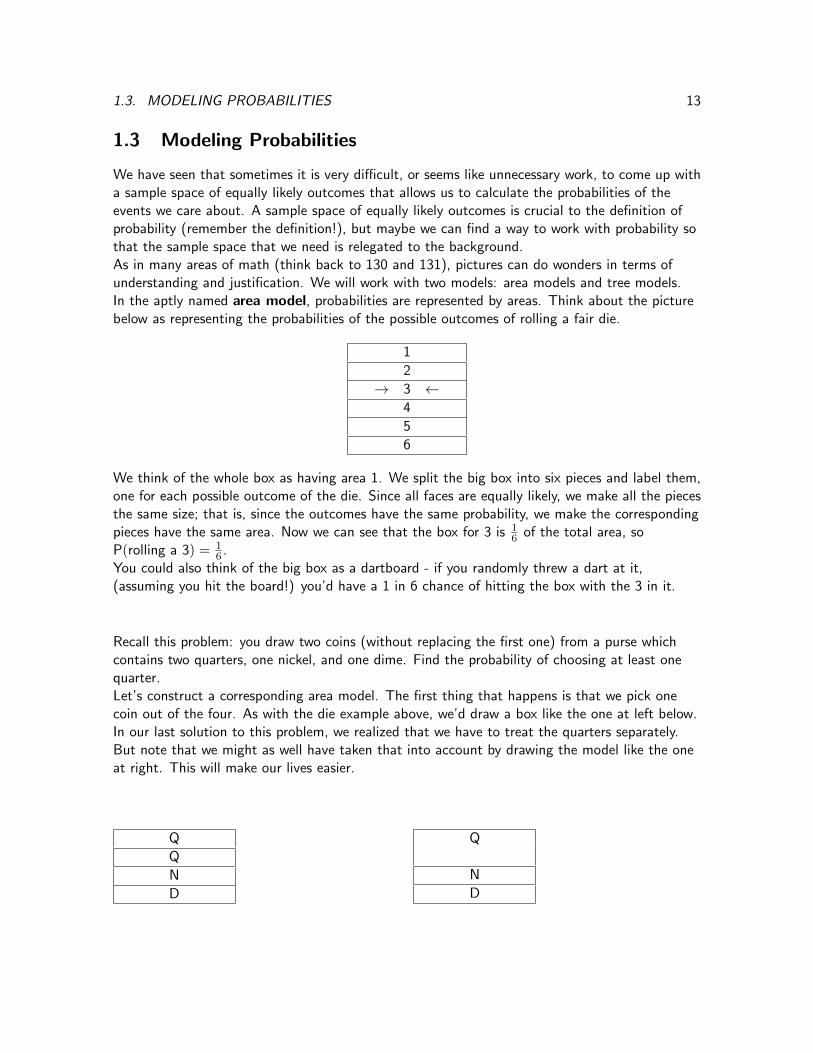
We have seen that sometimes it is very difficult, or seems like unnecessary work, to come up witha sample space of equally likely outcomes that allows us to calculate the probabilities of theevents we care about. A sample space of equally likely outcomes is crucial to the definition ofprobability (remember the definition!), but maybe we can find a way to work with probability sothat the sample space that we need is relegated to the background.As in many areas of math (think back to 130 and 131), pictures can do wonders in terms ofunderstanding and justification. We will work with two models: area models and tree models.In the aptly named area model, probabilities are represented by areas. Think about the picturebelow as representing the probabilities of the possible outcomes of rolling a fair die.
1
2
→ 3 ←4
5
6
We think of the whole box as having area 1. We split the big box into six pieces and label them,one for each possible outcome of the die. Since all faces are equally likely, we make all the piecesthe same size; that is, since the outcomes have the same probability, we make the correspondingpieces have the same area. Now we can see that the box for 3 is 1
6 of the total area, soP(rolling a 3) = 1
6 .You could also think of the big box as a dartboard - if you randomly threw a dart at it,(assuming you hit the board!) you’d have a 1 in 6 chance of hitting the box with the 3 in it.
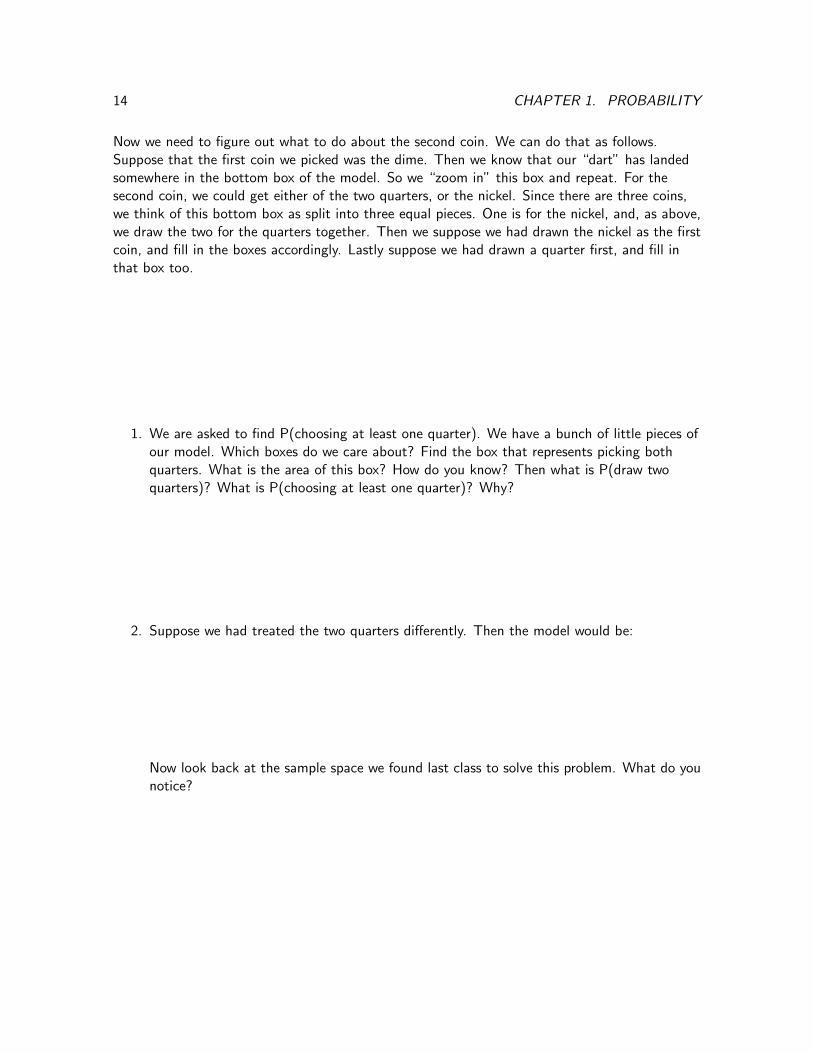
Recall this problem: you draw two coins (without replacing the first one) from a purse whichcontains two quarters, one nickel, and one dime. Find the probability of choosing at least onequarter.Let’s construct a corresponding area model. The first thing that happens is that we pick onecoin out of the four. As with the die example above, we’d draw a box like the one at left below.In our last solution to this problem, we realized that we have to treat the quarters separately.But note that we might as well have taken that into account by drawing the model like the oneat right. This will make our lives easier.
Q
Q
N
D
Q
N
D
14 CHAPTER 1. PROBABILITY
Now we need to figure out what to do about the second coin. We can do that as follows.Suppose that the first coin we picked was the dime. Then we know that our “dart” has landedsomewhere in the bottom box of the model. So we “zoom in” this box and repeat. For thesecond coin, we could get either of the two quarters, or the nickel. Since there are three coins,we think of this bottom box as split into three equal pieces. One is for the nickel, and, as above,we draw the two for the quarters together. Then we suppose we had drawn the nickel as the firstcoin, and fill in the boxes accordingly. Lastly suppose we had drawn a quarter first, and fill inthat box too.
1. We are asked to find P(choosing at least one quarter). We have a bunch of little pieces ofour model. Which boxes do we care about? Find the box that represents picking bothquarters. What is the area of this box? How do you know? Then what is P(draw twoquarters)? What is P(choosing at least one quarter)? Why?
2. Suppose we had treated the two quarters differently. Then the model would be:
Now look back at the sample space we found last class to solve this problem. What do younotice?
1.3. MODELING PROBABILITIES 15
We can also use a tree to model probability. For each “thing” that happens (we are careful notto use the word event), we start with a point, and draw a line from that point for each differentoutcome that can happen. If another activity then occurs, we create new tree models startingfrom the end of each of the previous branches.
3. I have a strange but fair four-sided die, with sides labeled 1,2,3,4. Draw a tree model forrolling this die twice, and find P(roll two 1’s). Think ahead to be neat– how large will thistree be? Also find P(roll a 1 and a 4, in either order).
Now, suppose sides 1, 2, and 3 are painted blue; side 4 is red. I will ask you for P(roll bluetwice). But instead of using the above model, note that, now, numbers don’t matter, only color,so that sides 1, 2, and 3 are essentially the same. Then maybe we can represent them by onebranch instead of three (we did something similar in the area model). But now, the probability ofblue and red are not equally likely, so we better label this model with the correct probabilities.
4. Finish the rest of the model like this. Now find P(roll blue twice) using this model. Whatshould you do? Why? Use the model from problem 1 for ideas, and justify yourcalculation, again as if to a 7th grader.
16 CHAPTER 1. PROBABILITY
5. We always need the sum of the probabilities of all the outcomes to be 1 (why?). In thearea model, we decree that the area of the whole box is 1, so that is is trivially true. Howcan we be sure this happens in the tree model?
Remember: the only definition of probability we have relies on a sample space of equally likelyoutcomes. These models use that definition, and in fact, we’ve seen that if we draw the modelsalways using equally likely outcomes, the sample space shows up. However, the models allow usto skip the “equally likely” step as long as we label and think correctly. That’s a niceimprovement.
6. Previously you thought about a strategy for probability calculations using sample spaces.Come up with a new strategy that uses these models, including thoughts on how to decidewhich model may be best to use.
1.4. MORE MODELING 17
1.4 More Modeling
1. Suzie got two A’s this week, and so she gets to choose a marble out of a bag of 5 marbles,2 of which are red; the rest are white. If she gets a white marble, she is out of luck. But ifshe gets a red marble, she gets to choose from a bag with equal amounts of cherry, grape,and apple lollipops. Model this situation using a tree diagram, and find the probability thatSuzie ends up with an apple lollipop.
2. Now think about how you could write down a sample space for this scenario. You don’tneed to actually come up with one: instead, I want you to focus on why it is difficult tomake the outcomes equally likely. Looking at your tree may give you some ideas.
18 CHAPTER 1. PROBABILITY
3. Annette plays ultimate frisbee, and sometimes her games have to be canceled because ofthe weather. During her season, there is a 4/5 chance that it is cold; the other 1/5 of thetime it is warm. Also, regardless of temperature, there is a 25% chance of precipitation.Annette’s games are played if it is warm or there is no precipitation.
(a) Draw a tree diagram representing both temperature and precipitation.
(b) What is the probability that Annette plays her game? In other words, find P(it iswarm or there is no precipitation (or both)), from your tree.
(c) Why is this not equal to P(it is warm)+P(there is no precipitation)?
(d) Find a way to calculate P(it is warm or there is no precipitation (or both)) using P(itis warm) and P(there is no precipitation) (and maybe some other probabilities).
1.4. MORE MODELING 19
4. In basketball, a free throw is worth one point. Suppose Yao gets fouled in the act ofshooting, so he will get two free throw shots. Create both an area and tree model, and findthe probability that he gets 0 points, 1 point, and 2 points in each of the followingscenarios:
(a) Each of Yao’s shots has a 60% chance of going in.
(b) Now suppose that, given Yao makes the first shot, he’ll feel more confident and so onhis second attempt he will make the shot with 80% probability. Given that he misses,he will feel less confident and his second attempt will have only a 50% probability ofgoing in.
(c) There is a difference between your two tree diagrams. What is it, and what caused it?
20 CHAPTER 1. PROBABILITY
1.5 Expected Value
1. A parking lot charges $7 to park per day. A car that is illegally parked will receive a $25ticket if caught, and the chance of being caught is 60%. On average, is it cheaper to payto park or to risk getting a ticket? Can you figure out a way to quantify your answer?
2. Now suppose you learn that Jack, one of the two parking enforcers, is very nice, so that ifhe catches your car parked illegally he will just charge you the $7 you should have paid. IfJill, the other enforcer, catches your car parked illegally, however, she’ll still charge you the$25 ticket. Suppose the chance of a car being caught by Jack is 30%, and the chance ofbeing caught by Jill is 30% (so the change of being caught at all is still 60%). Should youchange your answer from above? Why?
1.5. EXPECTED VALUE 21
The value we found for each situation is called the expected value of that situation. You canfind the expected value for any probability experiment that has numerical outcomes (here it wasan amount of money paid - it doesn’t really make sense to find expected value when theoutcomes are grape, cherry and apple lollipops).
Intuitively, the expected value tells you the average value of the outcomes if you were to repeatthe experiment many times.
Mathematically, we find the expected value by adding up the values of each outcome timestheir probabilities. This is really just a weighted average.
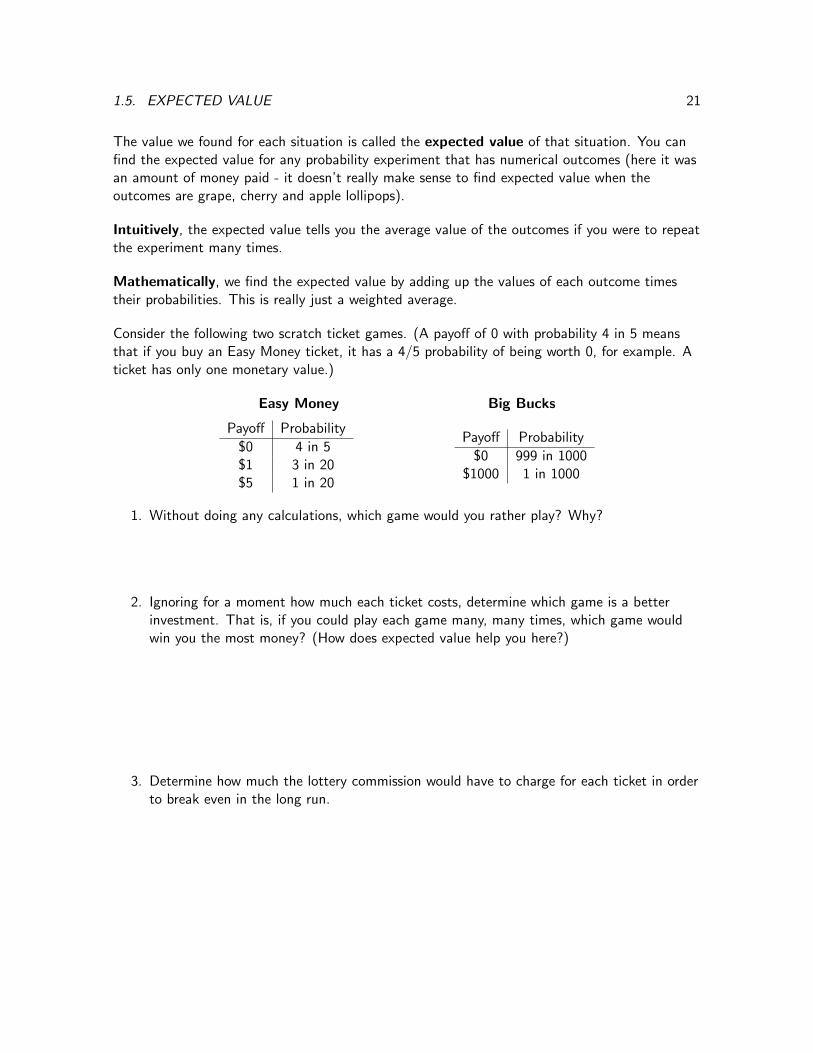
Consider the following two scratch ticket games. (A payoff of 0 with probability 4 in 5 meansthat if you buy an Easy Money ticket, it has a 4/5 probability of being worth 0, for example. Aticket has only one monetary value.)
Easy Money Big Bucks
Payoff Probability
$0 4 in 5$1 3 in 20$5 1 in 20
Payoff Probability
$0 999 in 1000$1000 1 in 1000
1. Without doing any calculations, which game would you rather play? Why?
2. Ignoring for a moment how much each ticket costs, determine which game is a betterinvestment. That is, if you could play each game many, many times, which game wouldwin you the most money? (How does expected value help you here?)
3. Determine how much the lottery commission would have to charge for each ticket in orderto break even in the long run.
22 CHAPTER 1. PROBABILITY
4. What sort of reasoning or intuition are you using in answering number 3? Try to bespecific.
5. While working on this above, Thom announces that the expected value for the EasyMoney game is $0. When asked why, he says, “you’d expect to win that prize the mostoften. If you played a whole bunch of times, you’d get $0 more often than any other prize.I mean, on average you’d get $0.” How would you respond to Thom’s reasoning?
1.6. USING MODELS IN PROBABILITY 23
1.6 Using Models in Probability
1. A certain slot machine has 3 windows. In each window, you can get either a cherry or alemon. In each window, a lemon is twice as likely to come up as a cherry. If you pull andget all cherries, you win $10. If you pull and get all lemons, you win the booby prize of $1.Determine the amount of money you should charge per pull so that this machine breakseven in the long run. Draw a tree model to help you find the probabilities you need. (Hint:you can treat each window as a trial.)
Expected value can show up in situations that don’t involve money. We can talk about expectedvalue for any probability experiment which has numerical outcomes.
2. Jay is betting his marbles in a game with his friend Caleb. Each turn, first Jay will flip afair coin. If the coin comes up heads, Jay wins a marble from Caleb and the round is over.Otherwise, Jay flips the coin again. If this second coin is tails, Caleb wins four marblesfrom Jay, but if it’s heads, they call the round a tie.
(a) Use an area model to find Jay’s expected marble winnings per turn. What does thisnumber tell you about Jay’s prospects in this game? Why does this make sense?
(b) Suppose the boys ask you to make the game fair. What adjustments could you maketo do this?
3. We’ve talked about expected value being a weighted average. How can you see this usingthese models?
24 CHAPTER 1. PROBABILITY
4. Annette enjoyed ultimate frisbee so much, she decided to play in the summer, too.However, sometimes her games still have to be canceled because of bad weather. Duringthe summer, 3 out of 4 days are warm; the rest the time it is hot. If it’s warm, there is a10% chance of storms. In hot weather, the chance of storms is 40%. Unless it is storming,Annette will play her game.
(a) Draw an area model representing the summer weather.
(b) What is the probability that Annette’s game is canceled?
Chapter 2
Statistics
2.1 Measures of Center
We’ve discussed some ways in which two quantities can be related, for example a proportional orlinear relationship, and we’ve also practiced finding patterns in sequences of numbers. In real life,however such relationships are usually not so obvious, or so nicely defined. Instead, we often haveonly a collection of data points, and try to describe a pattern or relationship as best we can. Inthe next few weeks, we will be discussing ways to analyze, describe, and represent sets of data.
Consider these three sets of data points, taken from students’ scores on an algebra quiz (out of10 points):
Class A: {4, 7, 4, 3, 4, 1, 6, 10, 4, 6}Class B: {9, 4, 3, 2, 7, 10, 3, 6, 5, 9}Class C: {6, 6, 7, 1, 7, 6, 5, 6, 7, 8}
1. Don’t do any calculations yet; just look at the data sets. What similarities do theyhave? What differences? Do you think one class did “better” on the quiz than anotherclass? Why?
2. How might you represent these scores visually to demonstrate your answer from question1? Come up with at least 2 ways to visually represent the scores. What are the advantagesand disadvantages of each of the ways? Suppose instead of the scores being out of 10, thescores were out of 100. What would be the advantages and disadvantages of yourmethods?
25
26 CHAPTER 2. STATISTICS
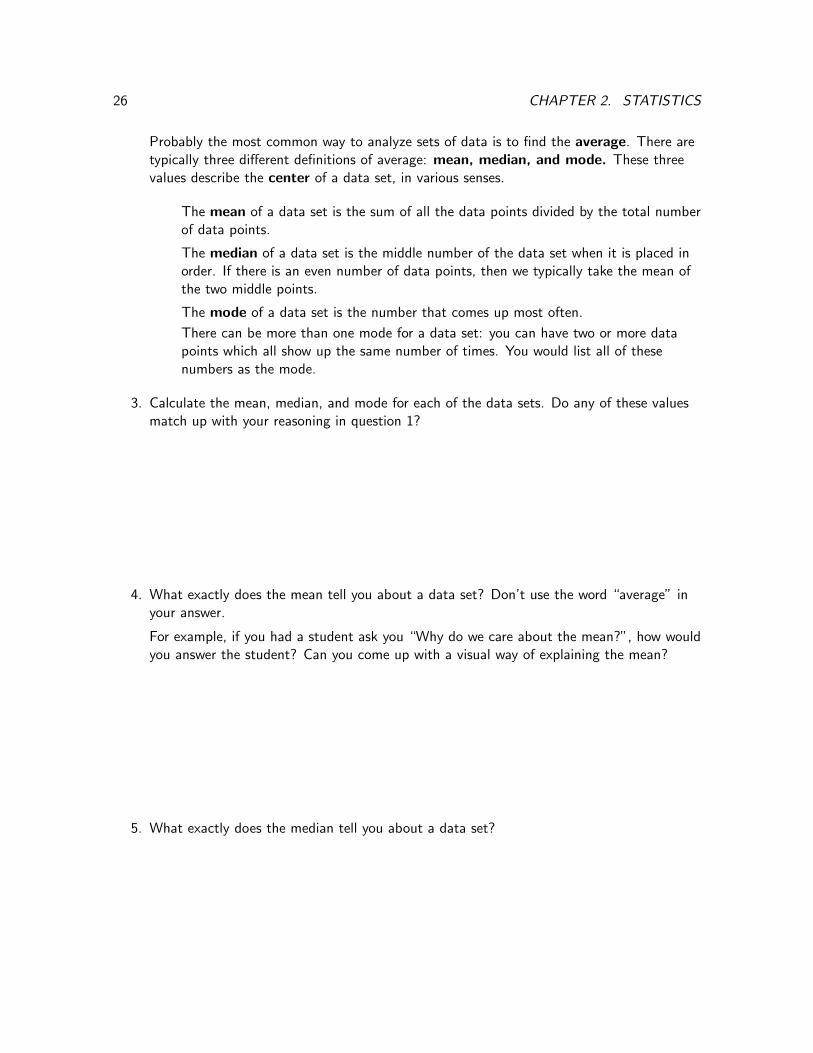
Probably the most common way to analyze sets of data is to find the average. There aretypically three different definitions of average: mean, median, and mode. These threevalues describe the center of a data set, in various senses.
The mean of a data set is the sum of all the data points divided by the total numberof data points.
The median of a data set is the middle number of the data set when it is placed inorder. If there is an even number of data points, then we typically take the mean ofthe two middle points.
The mode of a data set is the number that comes up most often.
There can be more than one mode for a data set: you can have two or more datapoints which all show up the same number of times. You would list all of thesenumbers as the mode.
3. Calculate the mean, median, and mode for each of the data sets. Do any of these valuesmatch up with your reasoning in question 1?
4. What exactly does the mean tell you about a data set? Don’t use the word “average” inyour answer.
For example, if you had a student ask you “Why do we care about the mean?”, how wouldyou answer the student? Can you come up with a visual way of explaining the mean?
5. What exactly does the median tell you about a data set?
2.1. MEASURES OF CENTER 27
6. The mean and median both try to somehow describe the “center” of a data set. What canyou say about a data set where the mean is much larger than the median? Much smaller?(Trying to construct such data sets might be helpful.) Discuss the strengths andweaknesses of the mean and the median. Why might you choose to use one over the other?
7. What does the mode tell you about each data set? Can you come up with an examplewhere the mode tells you something that the mean and median don’t?
8. The data set of daily high temperatures in Madison for the month of May last year has amedian of 70, a mean of 66, and a mode of 60. What sorts of conclusions can you makefrom this data? What sorts of conclusions can you not make, i.e., what doesn’t this datatell you?
28 CHAPTER 2. STATISTICS
2.2 Measures of Spread
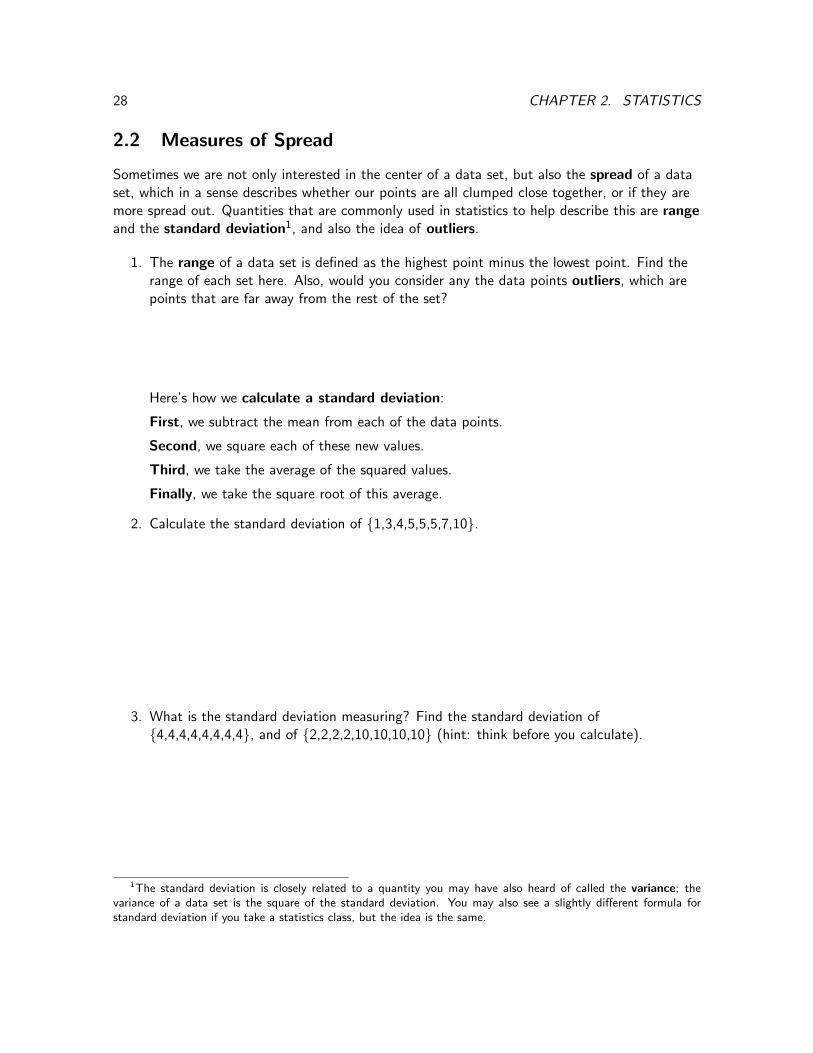
Sometimes we are not only interested in the center of a data set, but also the spread of a dataset, which in a sense describes whether our points are all clumped close together, or if they aremore spread out. Quantities that are commonly used in statistics to help describe this are rangeand the standard deviation1, and also the idea of outliers.
1. The range of a data set is defined as the highest point minus the lowest point. Find therange of each set here. Also, would you consider any the data points outliers, which arepoints that are far away from the rest of the set?
Here’s how we calculate a standard deviation:
First, we subtract the mean from each of the data points.
Second, we square each of these new values.
Third, we take the average of the squared values.
Finally, we take the square root of this average.
2. Calculate the standard deviation of {1,3,4,5,5,5,7,10}.
3. What is the standard deviation measuring? Find the standard deviation of{4,4,4,4,4,4,4,4}, and of {2,2,2,2,10,10,10,10} (hint: think before you calculate).
1The standard deviation is closely related to a quantity you may have also heard of called the variance; thevariance of a data set is the square of the standard deviation. You may also see a slightly different formula forstandard deviation if you take a statistics class, but the idea is the same.
2.2. MEASURES OF SPREAD 29
4. What is the standard deviation of {8,8,8,8,16,16,16,16}? Compare this to your calculationfor {2,2,2,2,10,10,10,10}. Why does this make sense?
5. In statistics, outliers are often defined as points that are more than 2.5 standarddeviations away from the mean. Why is this a reasonable way to define an outlier?
6. Which class’s data set do you think has the bigger standard deviation? Explain why, andwhat the number represents in this context. (Don’t try to calculate it exactly, just think.)
30 CHAPTER 2. STATISTICS
2.3 Histograms, Stem-and-Leaf Plots, & Box Plots
Consider the following ordered data set of exam scores (out of 100):
{39, 43, 47, 52, 52, 54, 58, 59, 60, 67, 73, 74, 76, 77, 78, 82, 89, 93, 93, 96, 97}
Would a pie graph be appropriate? What about a bar graph or line graph? What would yourbars count?
When we use a bar graph to count the number of data points that fall into a range of values, wecall it a histogram. Create a histogram for our data.
We can also create a stem-and-leaf plot by first ordering the data points (here they are alreadyordered), and then grouping them by their first digit in a table. Draw a stem-and-leaf plot forthe data here.
How is this like the histogram? How is it like a frequency table? Is it more helpful than theseother two types of graph? What if our data points were scores out of 1000? What if they wereheights, like 5’3”? Discuss strengths and weaknesses of these two methods.
2.3. HISTOGRAMS, STEM-AND-LEAF PLOTS, & BOX PLOTS 31
Yet another way to represent this data is the box-and-whisker plot (sometimes called aboxplot). This is a relatively new graph (it was first invented by John Tukey in 1977), but it hasgained popularity because it has many useful properties. We first find a 5 number summary.
1. First, find the smallest and largest data points of your set.
2. Find the median of your data set. The median is sometimes called the middle quartile.
3. As we’ve discussed, the median divides your data into 2 halves (if your data set has an oddnumber of points, don’t put the median into either of the halves). Find the median of thebottom half of data points. This is called the lower quartile.
4. Find the median of the upper half of data points. This median is called the upper quartile.
To draw the box plot, indicate these five numbers on the number line and draw a box spanningfrom the lower quartile to the upper quartile. Draw a vertical line in your box to indicate themedian. Draw a line from your box at the upper quartile to the largest data point, then one fromthe lower quartile to your lowest data point.
Find the 5 number summary and draw a box-and-whisker plot for our data (copied below). Seethe next page for an example.
{39, 43, 47, 52, 52, 54, 58, 59, 60, 67, 73, 74, 76, 77, 78, 82, 89, 93, 93, 96, 97}
32 CHAPTER 2. STATISTICS
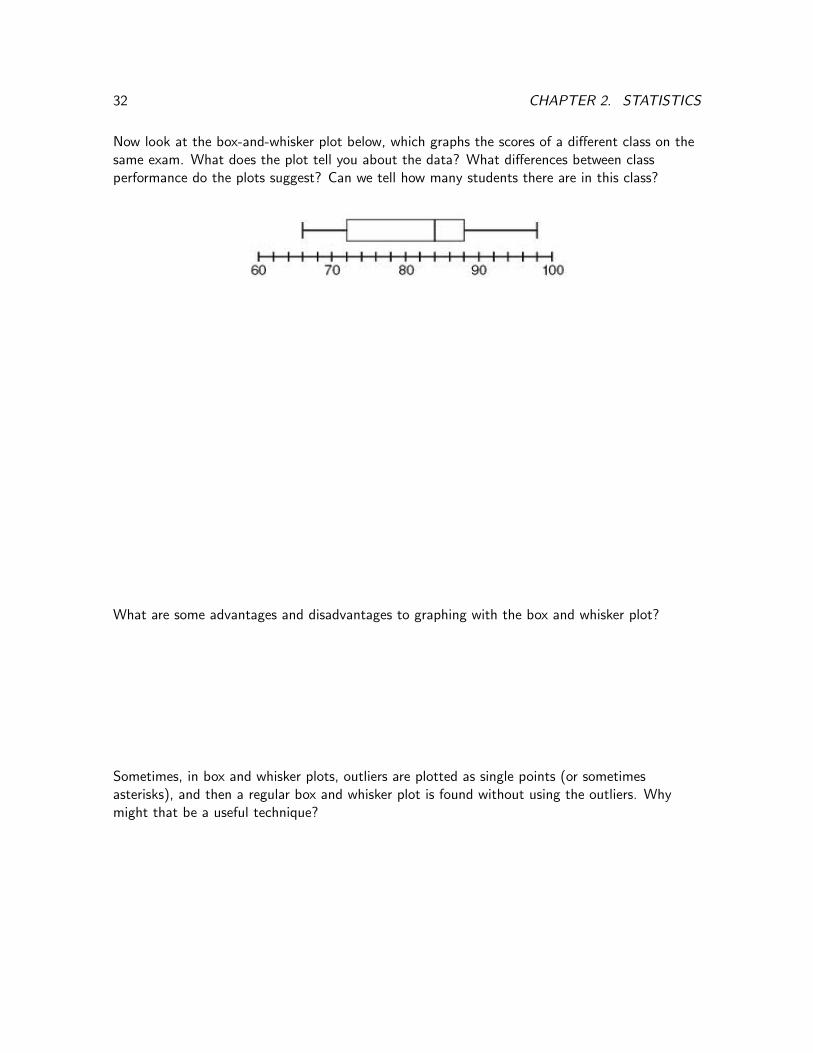
Now look at the box-and-whisker plot below, which graphs the scores of a different class on thesame exam. What does the plot tell you about the data? What differences between classperformance do the plots suggest? Can we tell how many students there are in this class?
What are some advantages and disadvantages to graphing with the box and whisker plot?
Sometimes, in box and whisker plots, outliers are plotted as single points (or sometimesasterisks), and then a regular box and whisker plot is found without using the outliers. Whymight that be a useful technique?
2.3. HISTOGRAMS, STEM-AND-LEAF PLOTS, & BOX PLOTS 33
We’ve now seen pie graphs, line graphs/bar graphs, histograms, stem and leaf plots, and box andwhisker plots. We’ve also discussed three measures of center and two (range and standarddeviation) of spread.
It’s all well and good to be able to draw these graphs and compute these statistics. Thekey is the ability to use them to succinctly explain data, so it’s important to be able toreason about which graph and/or statistics you should present in a given situation.
For each of these five graph types, briefly note if and how the graph displays each of thestatistics above. You might want to organize your thoughts using a table.
34 CHAPTER 2. STATISTICS
2.4 Scatterplots
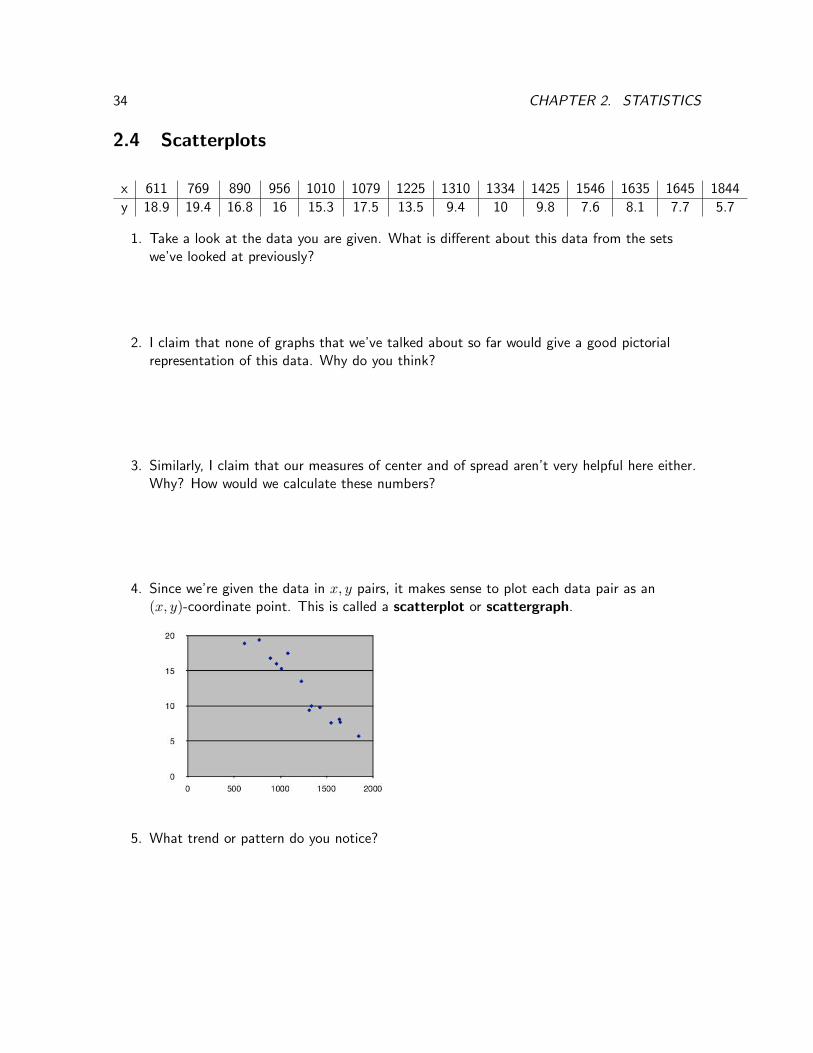
x 611 769 890 956 1010 1079 1225 1310 1334 1425 1546 1635 1645 1844
y 18.9 19.4 16.8 16 15.3 17.5 13.5 9.4 10 9.8 7.6 8.1 7.7 5.7
1. Take a look at the data you are given. What is different about this data from the setswe’ve looked at previously?
2. I claim that none of graphs that we’ve talked about so far would give a good pictorialrepresentation of this data. Why do you think?
3. Similarly, I claim that our measures of center and of spread aren’t very helpful here either.Why? How would we calculate these numbers?
4. Since we’re given the data in x, y pairs, it makes sense to plot each data pair as an(x, y)-coordinate point. This is called a scatterplot or scattergraph.
5. What trend or pattern do you notice?
2.4. SCATTERPLOTS 35
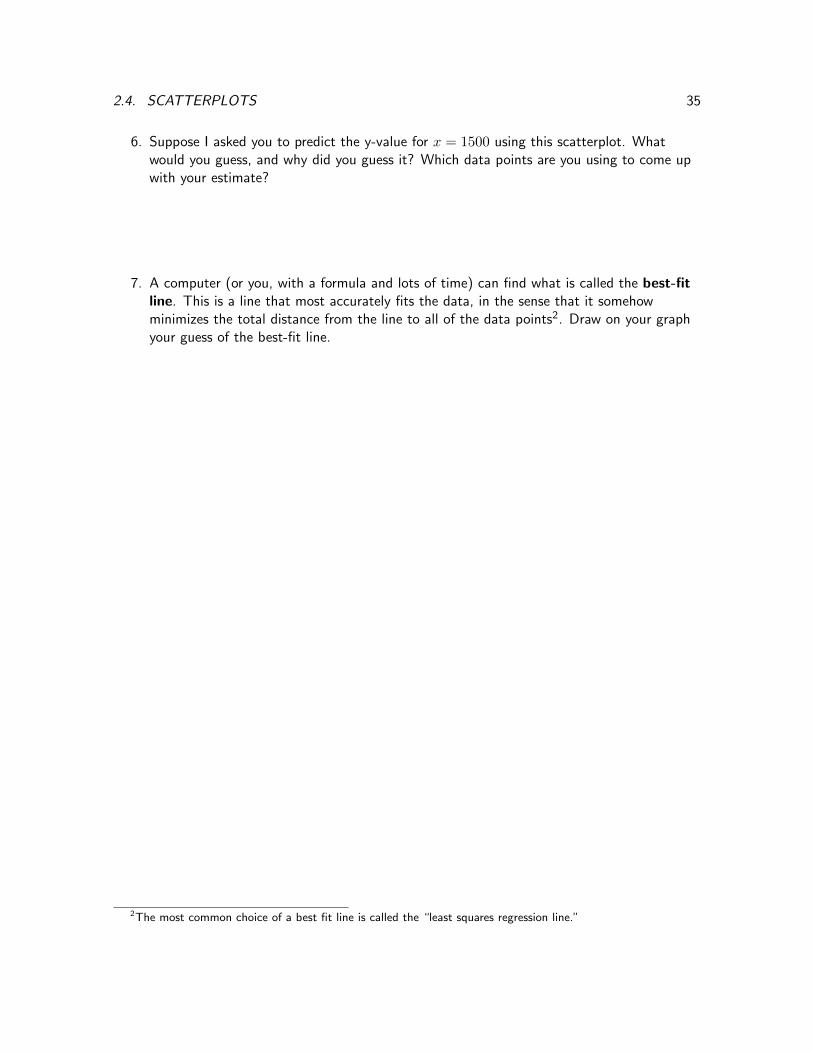
6. Suppose I asked you to predict the y-value for x = 1500 using this scatterplot. Whatwould you guess, and why did you guess it? Which data points are you using to come upwith your estimate?
7. A computer (or you, with a formula and lots of time) can find what is called the best-fitline. This is a line that most accurately fits the data, in the sense that it somehowminimizes the total distance from the line to all of the data points2. Draw on your graphyour guess of the best-fit line.
2The most common choice of a best fit line is called the “least squares regression line.”
36 CHAPTER 2. STATISTICS
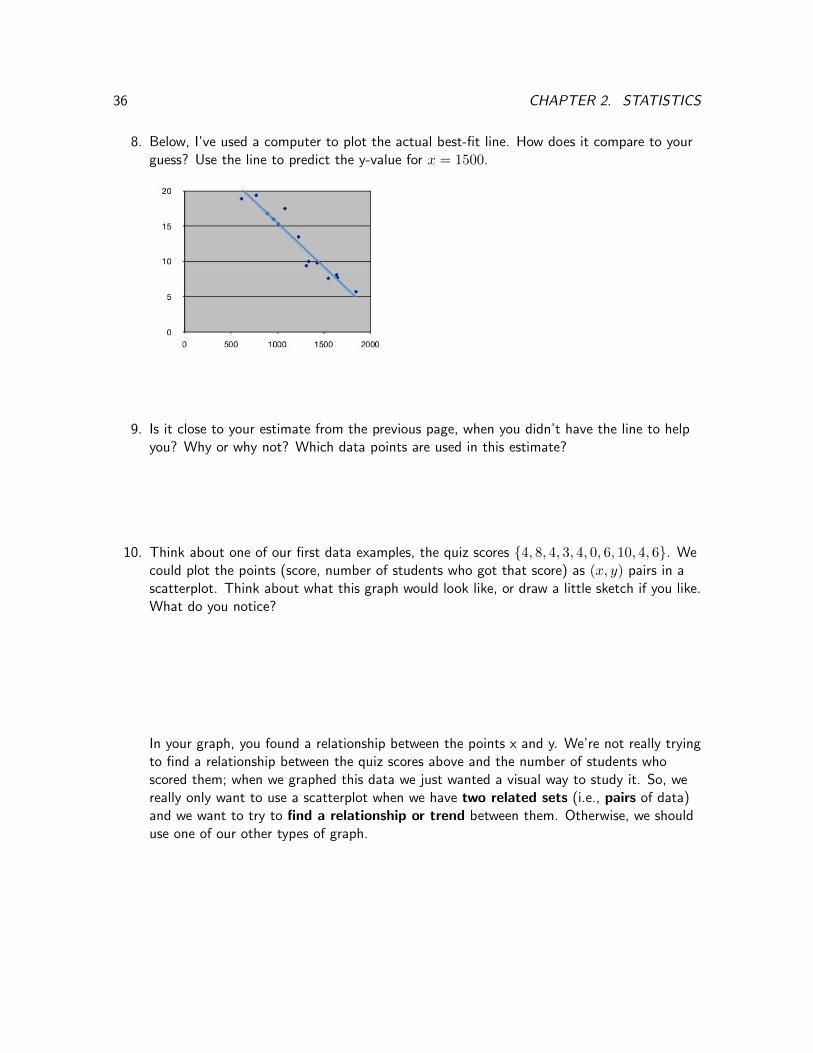
8. Below, I’ve used a computer to plot the actual best-fit line. How does it compare to yourguess? Use the line to predict the y-value for x = 1500.
9. Is it close to your estimate from the previous page, when you didn’t have the line to helpyou? Why or why not? Which data points are used in this estimate?
10. Think about one of our first data examples, the quiz scores {4, 8, 4, 3, 4, 0, 6, 10, 4, 6}. Wecould plot the points (score, number of students who got that score) as (x, y) pairs in ascatterplot. Think about what this graph would look like, or draw a little sketch if you like.What do you notice?
In your graph, you found a relationship between the points x and y. We’re not really tryingto find a relationship between the quiz scores above and the number of students whoscored them; when we graphed this data we just wanted a visual way to study it. So, wereally only want to use a scatterplot when we have two related sets (i.e., pairs of data)and we want to try to find a relationship or trend between them. Otherwise, we shoulduse one of our other types of graph.
2.4. SCATTERPLOTS 37
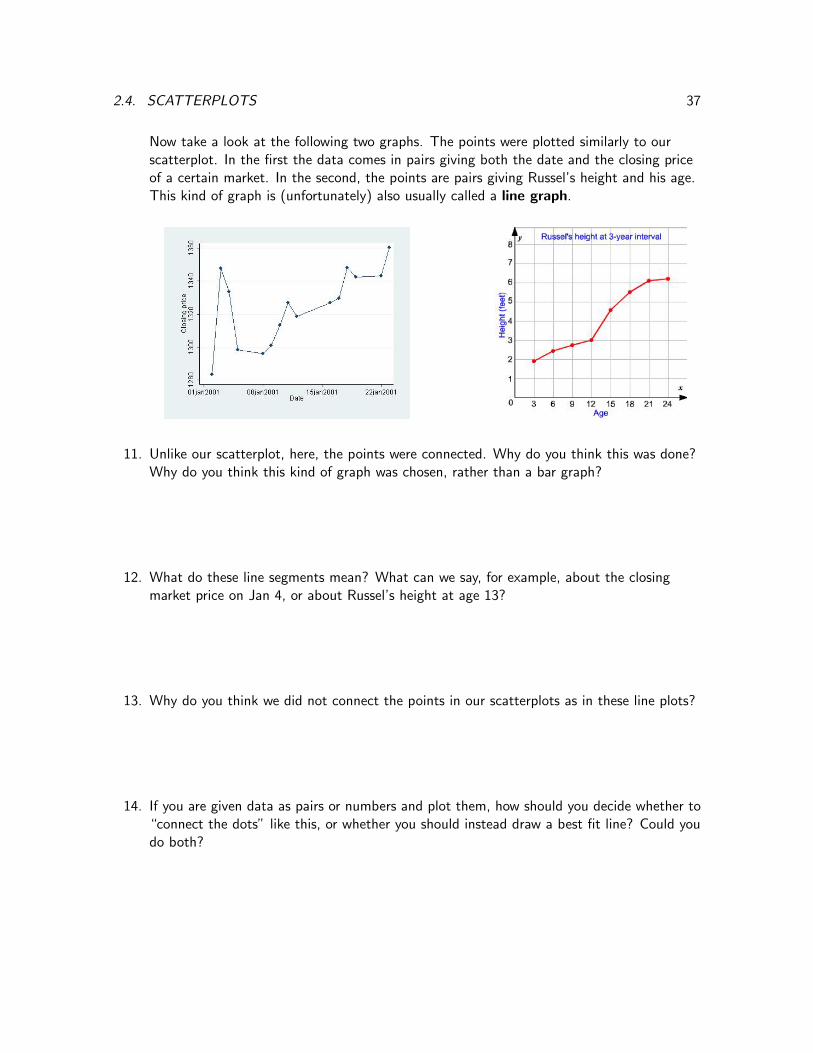
Now take a look at the following two graphs. The points were plotted similarly to ourscatterplot. In the first the data comes in pairs giving both the date and the closing priceof a certain market. In the second, the points are pairs giving Russel’s height and his age.This kind of graph is (unfortunately) also usually called a line graph.
11. Unlike our scatterplot, here, the points were connected. Why do you think this was done?Why do you think this kind of graph was chosen, rather than a bar graph?
12. What do these line segments mean? What can we say, for example, about the closingmarket price on Jan 4, or about Russel’s height at age 13?
13. Why do you think we did not connect the points in our scatterplots as in these line plots?
14. If you are given data as pairs or numbers and plot them, how should you decide whether to“connect the dots” like this, or whether you should instead draw a best fit line? Could youdo both?
38 CHAPTER 2. STATISTICS
2.5 Misleading Graphs & Statistics
We’ve talked about how graphs can tell a story. Unfortunately, that means that graphs,unintentionally or otherwise, can tell misleading stories.Similarly, we use statistics to succinctly describe important features of a potentially large dataset so that it can be analyzed. By their very nature, then, statistics often don’t tell the wholestory. Not to mention, statistics are often calculated or interpreted completely incorrectly. Aquote popularized by Mark Twain speaks of “lies, damned lies, and statistics.” It’s important tobe able to look with a critical eye.
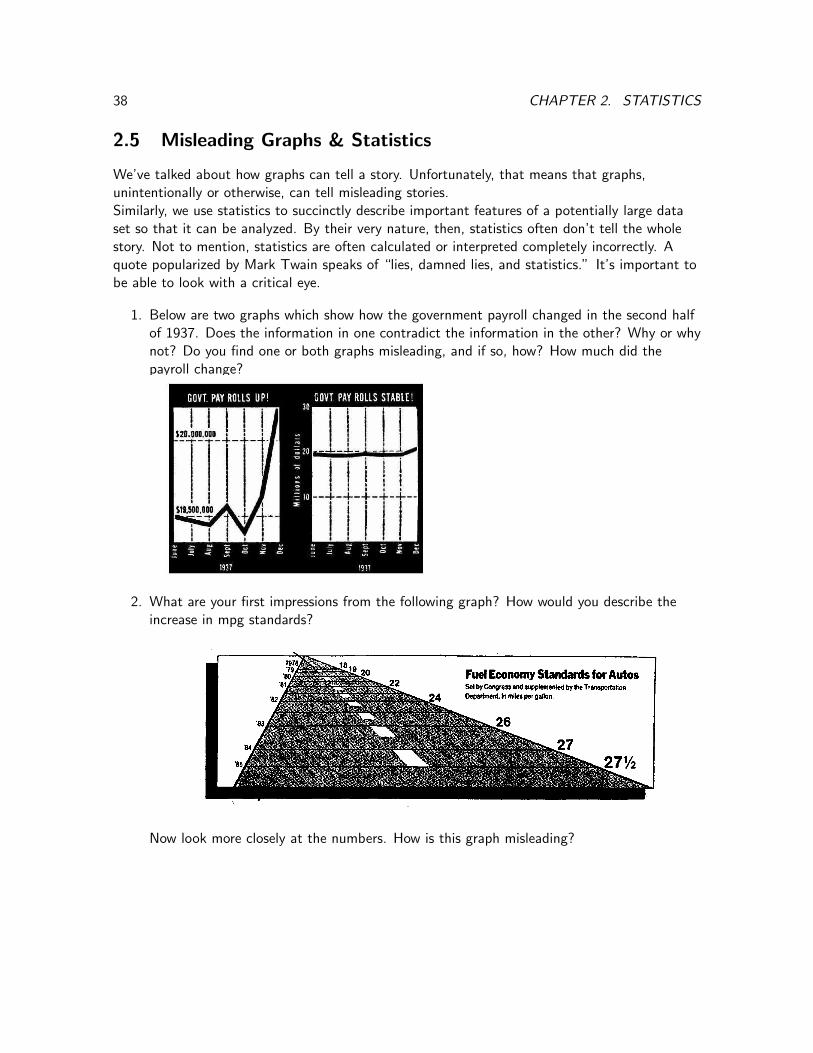
1. Below are two graphs which show how the government payroll changed in the second halfof 1937. Does the information in one contradict the information in the other? Why or whynot? Do you find one or both graphs misleading, and if so, how? How much did thepayroll change?
2. What are your first impressions from the following graph? How would you describe theincrease in mpg standards?
Now look more closely at the numbers. How is this graph misleading?
2.5. MISLEADING GRAPHS & STATISTICS 39
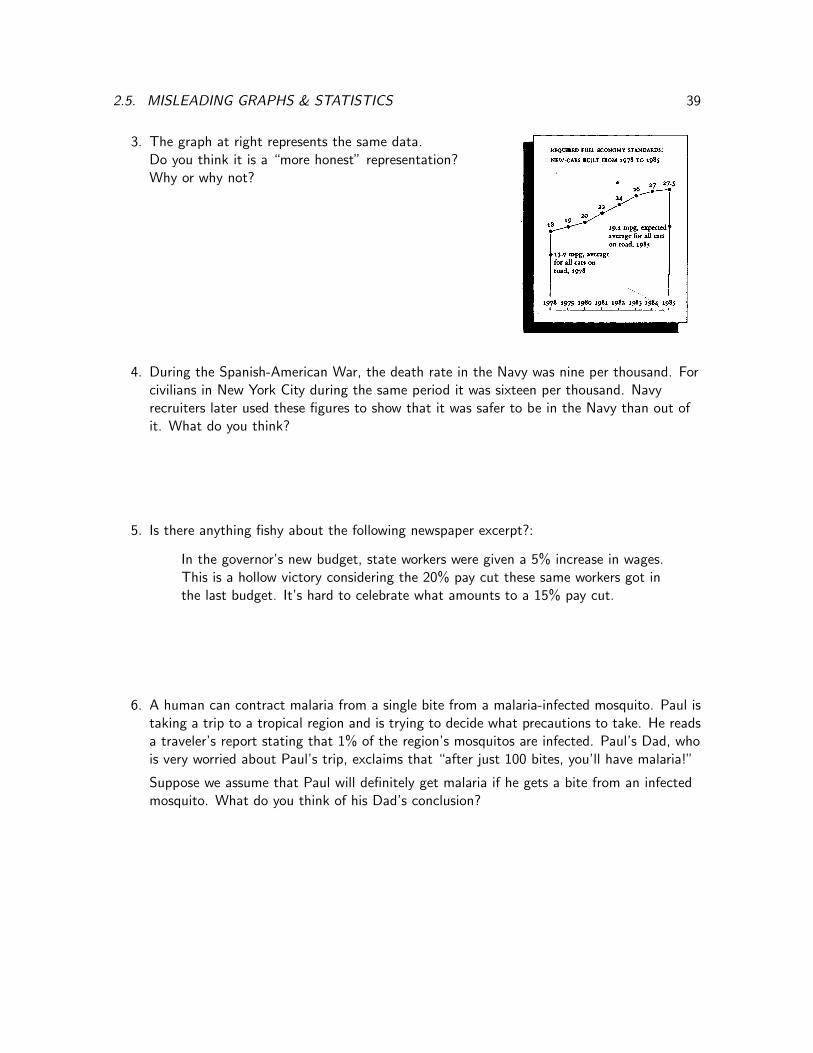
3. The graph at right represents the same data.Do you think it is a “more honest” representation?Why or why not?
4. During the Spanish-American War, the death rate in the Navy was nine per thousand. Forcivilians in New York City during the same period it was sixteen per thousand. Navyrecruiters later used these figures to show that it was safer to be in the Navy than out ofit. What do you think?
5. Is there anything fishy about the following newspaper excerpt?:
In the governor’s new budget, state workers were given a 5% increase in wages.This is a hollow victory considering the 20% pay cut these same workers got inthe last budget. It’s hard to celebrate what amounts to a 15% pay cut.
6. A human can contract malaria from a single bite from a malaria-infected mosquito. Paul istaking a trip to a tropical region and is trying to decide what precautions to take. He readsa traveler’s report stating that 1% of the region’s mosquitos are infected. Paul’s Dad, whois very worried about Paul’s trip, exclaims that “after just 100 bites, you’ll have malaria!”
Suppose we assume that Paul will definitely get malaria if he gets a bite from an infectedmosquito. What do you think of his Dad’s conclusion?
40 CHAPTER 2. STATISTICS
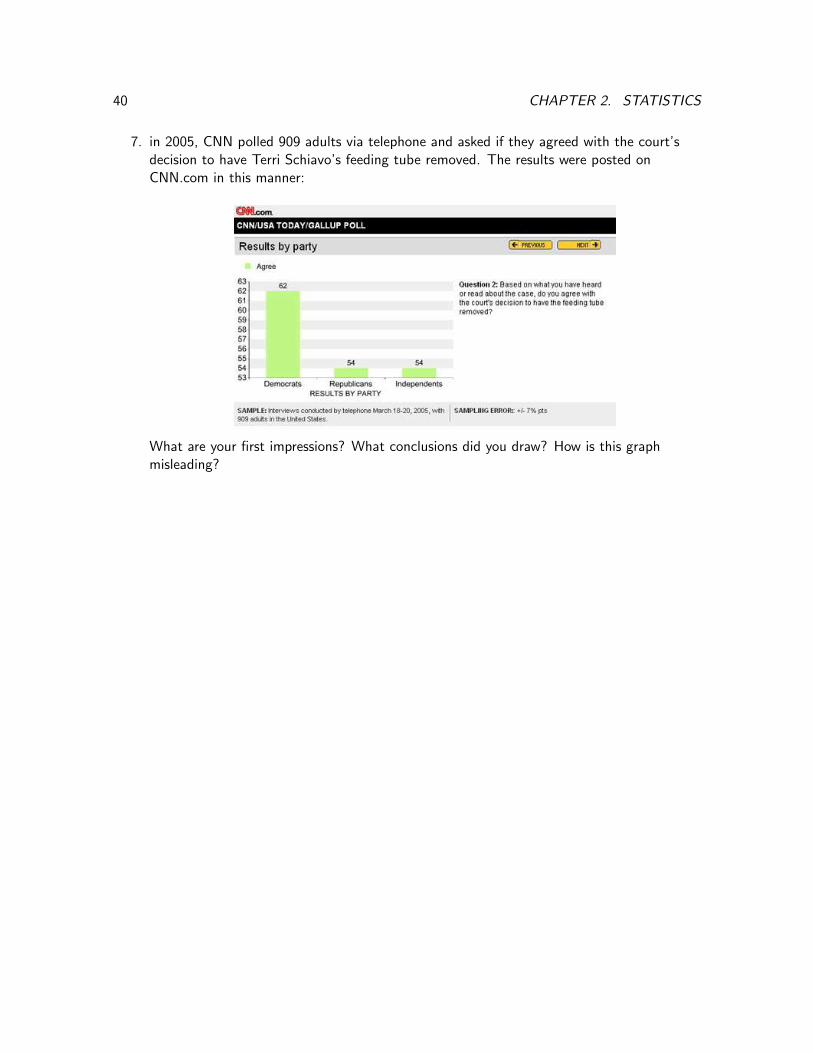
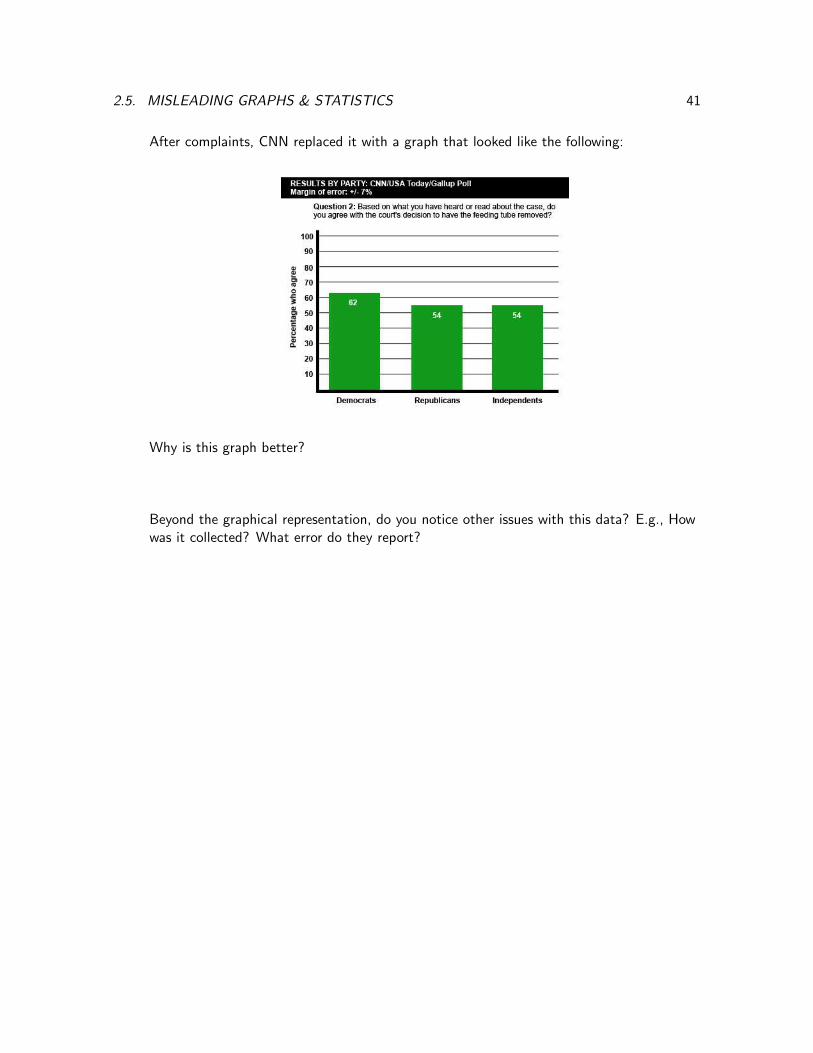
7. in 2005, CNN polled 909 adults via telephone and asked if they agreed with the court’sdecision to have Terri Schiavo’s feeding tube removed. The results were posted onCNN.com in this manner:
What are your first impressions? What conclusions did you draw? How is this graphmisleading?
2.5. MISLEADING GRAPHS & STATISTICS 41
After complaints, CNN replaced it with a graph that looked like the following:
Why is this graph better?
Beyond the graphical representation, do you notice other issues with this data? E.g., Howwas it collected? What error do they report?

42 CHAPTER 2. STATISTICS
Chapter 3
Algebra
3.1 Arithmetic to Algebra
Bar diagrams that we used in Math 130 help students make an easy transition from arithmetic toalgebra. The problems in this sections were inspired by problems in the mathematics textbooksused in Singapore in grades 4-6. (from Beckmann’s ACTIVITY MANUAL 9.4)
Solve the following problems in two ways: by using the bar diagram and with equations (usingalgebra). Explain both solution methods, and discuss how they are related.
1. At a store, a hat costs 3 times as much as a T-shirt. Together, the hat and T-shirt cost$35. How much does the T-shirt cost?
2. [Blanket Problem] There are 180 blankets at a shelter. The blankets are divided into twogroups. There are 30 more blankets in the first group than in the second group. Howmany blankets are in the second group?
43
44 CHAPTER 3. ALGEBRA
3. On a farm, 17 of the sheep are grey, 2
7 of the sheep are black, and the rest of the sheep arewhite. There are 36 white sheep. How many sheep in all are on the farm?
4. Ms. Jones gave 14 of her money to charity and 1
2 of the remainder to her mother. ThenMs. Jones had $240 left. How much money did Ms. Jones have at first?
5. When a box of chocolates was full, it weighed 1.1 kg. After 12 of the chocolates were
eaten, the box (with the remaining chocolates) weighed 0.7 kg. How much did the boxweigh without the chocolates?
6. Quint had 4 times as many math problems to do as Agustin. After Quint did 20 problemsand Agustin did 2 problems, they each had the same number of math problems left to do.How many math problems did Quint have to do at first?
3.1. ARITHMETIC TO ALGEBRA 45
7. There are two numbers whose sum is 50. Three times the first is 5 more than twice thesecond. What are the numbers?
8. Find three consecutive integers whose sum is 87.
9. Find three consecutive even integers such that the largest is three times the smallest.
10. Four consecutive odd integers have a sum of 64. Find the integers.
46 CHAPTER 3. ALGEBRA
Recall the blanket problem.
[Blanket Problem] There are 180 blankets at a shelter. The blankets are dividedinto two groups. There are 30 more blankets in the first group than in the secondgroup. How many blankets are in the second group?
1. Suppose you want to modify the blanket problem for your students by changing thenumbers 180 and 30 to different numbers. Can you change the numbers any way you wantand still have a sensible problem? Explain.
2. Suppose you want to modify the blanket problem for your students so that the blanketswill be divided into 3 unequal groups instead of 2 groups. Write such a modified problem,making sure that it can be solved. Show two different ways to solve your problem.
3.1. ARITHMETIC TO ALGEBRA 47
Solve the following question in as many different ways as you can think of, and explain eachsolution. Try relate your different solution methods to each other.
[Pencil Problem] In the morning, MS. Wilkins put some pencils for her students ina pencil box. After a while, Ms. Wilkins found that 1
2 of the pencils were gone. Alittle later, Ms. Wilkins found that 1
3 of the pencils that were left from when shechecked before were gone. Still later, Ms. Wilkins found that 1
4 of the pencils thatwere left from the last time she checked were gone. At that point there were 15pencils left. No pencils were ever added to the pencil box. How many pencils didMs. Wilkins put in the pencil box in the morning?
1. Suppose you want to modify the pencil problem for your students by changing the number15 to a different number. Which numbers could you replace the 15 in the problem with andstill have a sensible problem (without changing anything else in the problem)? Explain.
2. Experiment with changing some or all of the fractions (12 , 13 , and 1
4) in the problem to someother “easy” fractions. When you make a change, do you also need to change the number15? Which changes make the problem harder? Which changes make the problem easier?
48 CHAPTER 3. ALGEBRA
Solve the following problems either with the aid of a bar diagram or by using equations. Explainyour reasoning.
1. Markus had M dollars in his bank account. After removing 15 of the money in the account
and then removing another $200, Markus now has $800. How much money did Markushave initially?
2. Keisha had K dollars in her bank account. After removing $200 and then removing 15 of
the remaining money, Keisha now has $800. How many dollars did Keisha have in herbank account before removing any money?
3.2. BASIC EQUATIONS 49
3.2 Basic Equations
The different conceptions of ‘algebra’ are related to different uses of ‘letters’. Here is anoversimplified summary of those relationships:
Conception of algebra Use of lettersGeneralized arithmetic Pattern generalizers (translate, generalize)Means to solve certain problems Unknowns, constants (solve, simplify)Study of relationships Arguments, parameters (relate, graph)Structure Arbitrary marks on paper (manipulate, justify)
1. Each of the following has a different meaning of equality. Discuss the differences andidentify them with the appropriate ‘titles’ such as a function, a formula, an equation tosolve, a property, an identity, etc. You are allowed to use your own term to explain thedifference. All have the same form, the product of two numbers equals a third, except for(f).
(a) S = TV where S distance, T time, and V velocity
(b) 40 = 5x
(c) sin(x) = tan(x) · cos(x)
(d) 1 = n · 1n
(e) y = kx
(f) a+ b = b+ a
2. Discuss the use of letters in above examples. Find and describe the differences.
We usually use letters to state relationships which hold for all numbers, to work through acalculation procedure without specifying the numbers, or to show a relationship betweenquantities without specifying their values.
An algebraic expression is a combination of numbers, parentheses, operation signs, and letterswhich represents a number for some choice of numerical values for the letters. An expression canbe evaluated by assigning specific values to the letters appearing in it. The expression thenbecomes a number. Expressions such as 3× n, x× 4, and a× b can be written as 3n, 4x, and
50 CHAPTER 3. ALGEBRA
ab. These are referred to as algebraic terms. An equation is a statement that two expressionsare equal.
Algebraic terms which are different only in the coefficients are called like terms. To collect liketerms, we simply do addition and subtraction of the coefficients to simplify several like terms toa single term. When parentheses are involved, we remove them before collecting the like terms.
Let’s simplify the following with combining like terms.
1. 4(x2 − 11xy − 3y2)− 2(3xy − 4x2 + y2)
2. (x− 2x2)÷ (−x)− 3x
3.1 + a
5− 1 + a
3+
3− a
6
Practicing algebraic manipulations is as much important as understanding the meanings ofletters and contexts when doing algebra.
1. If x =a+ b
a− b, find ax− b, bx+ a, and
ax− b
bx+ a.
3.2. BASIC EQUATIONS 51
2. If a2 + 6a = 6, find a(a2 + 6a) + a2, and a3 + 7a2.
Building up algebraic expressions
1. If m dollars are shared between John and Paul so that John’s share is n times Paul’s share,write an expression for John’s share.
2. The average age of m boys and n girls is p. If the average age of the boys is q, find anexpression for the average age of the girls.
3. Make up a short word problem which builds on the given expression in the given context.Be sure to make clear what each letter represents. (from Math 130 textbook)
(a) 12c in the context of baking cookies
(b) 13r + 3s in the context of shopping
52 CHAPTER 3. ALGEBRA
(c) 2w + 13 in the context of money saved from an allowance
(d) 240−x50 as the time needed to complete a trip to another city.
4. Write a story problem so that some quantity in the story situation can be expressed as4x+ 2. Explain why 4x+ 2 is the appropriate formula for the quantity. Be sure to saywhat x stands for.
5. There are T tons of sand in a pile initially.
(a) Assume that 14 of the sand in the pile is removed from the pile and, after that,
another 23 of a ton of sand is dumped onto the pile. Write a formula in terms of T for
the number of tons of sand that are in the pile now.
(b) Starting with T tons of sand, assume that 23 of a ton of sand is dumped onto the pile
and, after that, 14 of the sand in the new, larger pile is removed. Write a formula in
terms of T for the number of tons of sand that are in the pile now. Is this formulathe same as the formula in part (a)?
(c) Evaluate your formulas from parts (a) and (b) when T = 123 .
3.2. BASIC EQUATIONS 53
6. At a store, the price of an item is $P . Consider three different scenarios.
(a) First scenario: Starting at the price $P , the price of the item was lowered by A%.Then the new price was lowered by B%.
(b) Second scenario: Starting at the price $P , the price of the item was lowered byB%. Then the new price was lowered by A%.
(c) Third scenario: Starting at the price $P , the price of the item was lowered byA+B%.
For each scenario, write an expression for the final price of the item. Are any of the finalprices the same?
Construction of Equations
1. To make concrete, you need 3 times as much sand as cement. When Aaron was asked toformulate an equation about concrete, here’s what he wrote: T=concrete, S=sand,C=cement, so, T=S+C and 3S=C. Discuss Aaron’s work. How should he revise it?
54 CHAPTER 3. ALGEBRA
2. Describe quantities that are related by the equation y = 2x. State clearly the meaning of yand of x and explain briefly why the equation applies.
3. For each of the following equations, write a corresponding story problem. Be sure to definex in each case.
(a) (x+ 30)− 14(x+ 30) = 150
(b) 23(x− 60) + 20 = 80
[Coin Problem]
1. Michael has some coins in his pocket consisting of dimes, nickels, and pennies. He has twomore nickels than dimes, and three times as many pennies as nickels. How many of eachkind of coin does he have if the total value is 52 cents?
3.2. BASIC EQUATIONS 55
2. A coin collector had a collection of silver coins worth $205. There were five times as manyquarters as half-dollars (50-cent pieces) and 200 fewer dimes than quarters. How many ofeach kind of coin did the collector have?
3. Mr. Dinkelspiel bought $32.56 worth of stamps. He bought 20 more 19-cent stamps than50-cent stamps. He bought twice as many 32-cent stamps as 19-cent stamps. How manyof each kind of stamp did he buy?
[Age Problem]
1. Mary’s father is four times as old as Mary. Five years ago he was seven times as old. Howold is each now?
2. Abigail is 6 years older than Jonathan. Six years ago she was twice as old as him. How oldis each now?
56 CHAPTER 3. ALGEBRA
3. Wolfgang’s father is 26 years older than Wolfgang. In 10 years, the sum of their ages willbe 80. What are their present ages?
4. Mary is twice as old as Helen. If 8 is subtracted from Helen’s age and 4 is added to Mary’sage, Mary will then be four times as old as Helen. Find their ages.
3.2. BASIC EQUATIONS 57
[Correction Problem]
1. Mr. Strenner wrote two numbers on the blackboard for his students to calculate theproduct of these two numbers. The last digit 8 (i.e., at the ‘ones’ place) of one of thesenumbers was not written clearly and John mistook it for 6. As a result, he obtained 4740as the answer which was wrong. Mary mistook the digit 8 for 3 and obtained 4695 as theanswer which was also incorrect. What should be the correct answer?
2. Meatballs and fishballs were sold in packets, each packet containing the same number ofmeatballs or fishballs. Meatballs were priced at 4 pieces for $1 and fishballs at 6 piece for$1. A man had just enough money to buy 2 packets of meatballs and 1 packet of fishballs.He needed to one more dollar if he were to buy 3 packets of meatballs with no packets offishballs instead. Find the number of meatballs or fishballs in a packet.
3. Mr. Kwon has just enough money to buy 20 mangoes only or 30 oranges only. If he wantsto buy equal numbers of mangoes and oranges together, how many each type can he buywith the money?
58 CHAPTER 3. ALGEBRA
3.3 Ratio and Proportions Review
We say that the ratio between two quantities is A : B if there is a unit so that the first quantitymeasures A units and the second measures B units. (In writing the ratio, one does not specifythe unit.) Two ratios are equivalent or equal if one is obtained from the other by multiplying ordividing all of the measurements by the same (nonzero) number. A proportion is a statementthat two ratios are equal.
1. If a : b = c : d, prove thata
b=
c
dusing the definition of equivalent ratios.
2. The ratio of Isabel’s money to Rosalind’s money is 8 : 3. If Isabel has $24, how muchmoney do they have together? Use a proportion, a bar diagram, and/or the definitionof the ratio to solve.
3. Express each of the following ratios as simply as possible in the form a : b.
(a) A mass of 2kg to a mass of 850g.
3.3. RATIO AND PROPORTIONS REVIEW 59
(b) 0.4 : 1.2
(c) A length of 34 ft to a length of 2
3 ft
4. Two numbers are in the ratio 3 : 5. After subtracting 11 from each, the new ratio is 2 : 7.What are the two numbers?
5. If A : B = 5 : 6 and B : C = 4 : 5, find A : B : C. The ratio between two numbers can berepresented either by a : b form or by a
b form. Discuss which representation is moreappropriate in this example. You may draw bar diagrams and use LCM or GCF of twonumbers to figure out A : B : C.
60 CHAPTER 3. ALGEBRA
6. A ribbon is cut into 3 pieces, A, B, and C, in the ratio 1 : 2 : 4. If C is longer than B by16cm, find the length of the ribbon.
7. The ratio of the number of boys to the number of girls in a group of students is 2 : 3. If 14
of the boys and 13 of the girls wear glasses, find the ratio of the number of girls who wear
glasses to the number of boys who wear glasses.
PercentThe expression per cent comes from a Latin phrase per centum meaning ‘for each hundred’ or‘out of a hundred’. Use ratios and proportions first to solve the following problems, and then usethe decimal representation of percent and algebra to revisit them.
1. David saves $600 and Justin saves $700. Express Justin’s savings as a percentage ofDavid’s.
3.3. RATIO AND PROPORTIONS REVIEW 61
2. A baker made 350 cookies. 100 of them were chocolate chip and the rest were sugarcookies. How many percent fewer chocolate chip cookies were there than sugar cookies?
3. Peter is 8% heavier than Henry, and James is 10% lighter than Henry. By what percentageis Peter heavier than James?
4. In the course of a year, 13 of a company’s capital increases by 4%, 1
5 of it decreases by 5%and the rest increases by 10%. What is the percentage increase on the whole?
62 CHAPTER 3. ALGEBRA
5. As a B&N member, you can get 10% discount. Sometimes B&N send you extra 20%discount coupons. If you apply a coupon in addition to your membership discount, can youget 30% off? What if the membership discount is 20%, and you have an extra 10% offcoupon? Is it total 30% off? Why or why not?
Rate and speedWhen a ratio is used to compare two quantities that involve different units, the result is called arate. Some textbooks use different definitions. For example in CCSSM (Common Core StateStandards for Mathematics), a (unit) rate is defined as a fractional form of “ratio” and it is usedto describe how a quantity is changing with another quantity. (a : b = a
b : 1). A ratio indicateswhat fraction on quantity is of the other, or how many times one quantity is as much as theother.
1. If a typist can type 250 words in 5 minutes, how many words can she type in 1 minute?
2. A motorist took 2 hours to travel from town X to town Y . For the first half of thejourney, he traveled at an average speed of 60 km/h. His average speed for the second halfwas 80 km/h. Find his average speed for the whole journey.
3.3. RATIO AND PROPORTIONS REVIEW 63
3. A motorist took 212 hours to travel from town X to town Y . His average speed for the
whole journey was 80 km/h. For the first 14 of the journey, he traveled at an average speed
of 60 km/h. Find his average speed for the second part of the journey.
4. A motorist took some hours to travel from town X to town Y . His average speed for thewhole journey was 80 km/h. For the first 1
4 of the journey, he traveled at an average speedof 60 km/h. Find his average speed for the second part of the journey. Compare thisquestion to the previous question. What’s the difference? Did you get the same answer forboth or not?
5. A motorist took some hours to travel from town X to town Y . For the first 12 of the
journey, he traveled at an average speed of a km/h. His average speed for the second halfof the journey was b km/h. Find his average speed for the whole journey in terms of a andb.
64 CHAPTER 3. ALGEBRA
6. A car traveling at a uniform speed started at noon and covered the first 150 km of ajourney by 3:00 pm. Find the time when it had completed the whole journey of 600 km.
Cross-multiply algorithmYou are probably familiar with the cross-multiply algorithm. The cross multiply algorithm isusually used when two ratios in a proportion are given in the form of a
b , not in the form of a : b.Teachers and students usually don’t know why and how this algorithm work. The followingproblems help us understand the meaning of the algorithm.
1. If a : b = c : d, prove that ad = bc. (Hint: We proved a : b = c : d impliesa
b=
c
d.)
2. A recipe for cookies calls for 1 cup of sugar for 24 cookies.
(a) How much sugar should you use for 36 cookies?
(b) What about for 32 cookies?
3.3. RATIO AND PROPORTIONS REVIEW 65
3. How did you know how to answer the questions above? What assumptions are youimplicitly making?
4. Think of at least two different ways to approach solving these problems. Discuss yourmethods. Do you think one of the methods would be better for younger children?
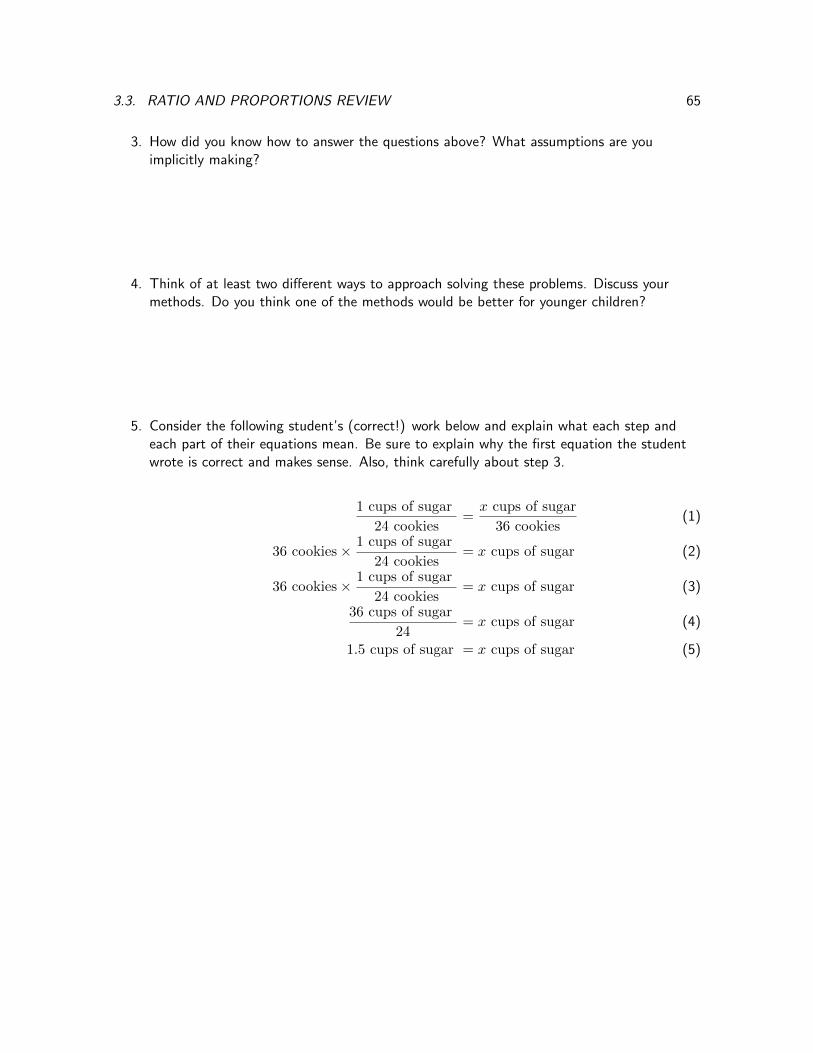
5. Consider the following student’s (correct!) work below and explain what each step andeach part of their equations mean. Be sure to explain why the first equation the studentwrote is correct and makes sense. Also, think carefully about step 3.
1 cups of sugar
24 cookies=
x cups of sugar
36 cookies(1)
36 cookies× 1 cups of sugar
24 cookies= x cups of sugar (2)
36 cookies× 1 cups of sugar
24 cookies= x cups of sugar (3)
36 cups of sugar
24= x cups of sugar (4)
1.5 cups of sugar = x cups of sugar (5)
66 CHAPTER 3. ALGEBRA
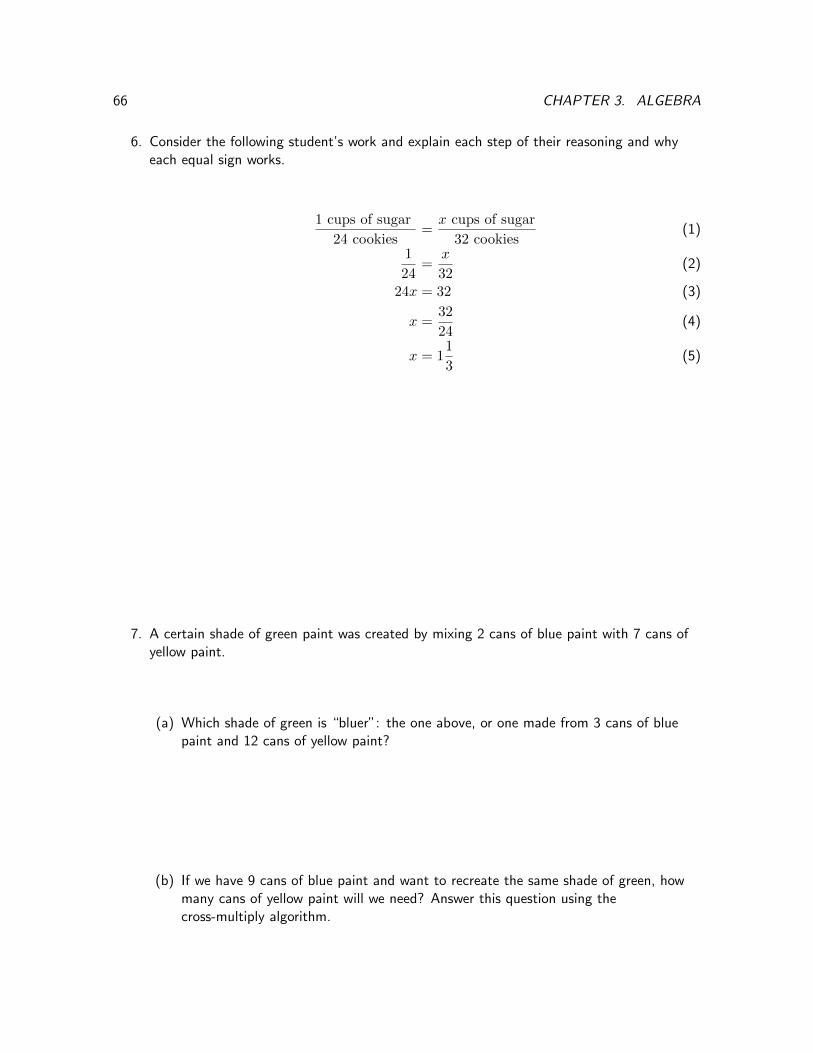
6. Consider the following student’s work and explain each step of their reasoning and whyeach equal sign works.
1 cups of sugar
24 cookies=
x cups of sugar
32 cookies(1)
1
24=
x
32(2)
24x = 32 (3)
x =32
24(4)
x = 11
3(5)
7. A certain shade of green paint was created by mixing 2 cans of blue paint with 7 cans ofyellow paint.
(a) Which shade of green is “bluer”: the one above, or one made from 3 cans of bluepaint and 12 cans of yellow paint?
(b) If we have 9 cans of blue paint and want to recreate the same shade of green, howmany cans of yellow paint will we need? Answer this question using thecross-multiply algorithm.
3.3. RATIO AND PROPORTIONS REVIEW 67
(c) If we instead start with 4 cans of blue paint, how many cans of yellow paint will weneed in order to get the same green? Can you use a picture to explain your solution?
(d) What are the limitations of this pictorial method? What are the advantages? Thinkabout if you could use the method to answer the problem if we started with 20 cansof blue paint, or 1
3 of a can, or 2.15 cans.
(e) Think about this technique graphically. Draw a graph with “cans of blue paint” onthe horizontal axis and “cans of yellow” paint on the vertical axis. Plot your answersfor parts (b) and (c) on this graph. What is the interpretation of slope in thiscontext? Estimate the cans of yellow paint needed if we start with 1
3 of a can of bluepaint. What are the limitations and advantages of this method?
68 CHAPTER 3. ALGEBRA
(f) Think about this technique algebraically. Generalize your technique so that you canfind the number of cans of yellow paint required for any given number of cans of bluepaint. What if we started with 1
3 of a can of blue paint? 20 cans of blue paint? 2.15cans of blue paint? What are the limitations and advantages of this method?
(g) Can you connect this generalized technique to the cross multiply algorithm? Why dothey give the same answer?
3.4. PROPORTIONAL RELATIONSHIP 69
3.4 Proportional Relationship
[The Connected Gear Problem] - from Patterns, Quantities and Linear Functions by Amy B.Ellis, Mathematics Teaching in the Middle School, Vol. 14, No. 8, April 2009
1. You have two gears on your table. Gear A has 8 teeth, and gear B has 12 teeth. If youturn gear A a certain number of times, does gear B turn more revolutions, fewerrevolutions, or the same number? How can you tell?
2. If you could replace gear A with a new gear that would make gear B turn twice as fast,how many teeth would the new gear have?
3. You want to replace gear A with a different gear to make gear B turn twice as slow insteadof twice as fast. How many teeth would that different gear have?
4. Right now, gear A has 8 teeth and gear B has 12 teeth. Can you think of two differentsizes for gear A and gear B so that the gear ratio would still be the same? How manypossibilities can you find?
5. Gear C has 6 teeth. You hook it up to gear D and turn it a certain number of times. GearD turned 1
4 of the number of turns that gear C turned. How many teeth would gear Dhave to have?
70 CHAPTER 3. ALGEBRA
6. Gear E has 15 teeth. If you turn it 12 times, gear F turns 10 times. How many teeth doesgear F have to have?
7. Ricardo was working with gear A and gear B (8 teeth and 12 teeth). He turned the gears acertain number of times. He is not sure exactly how many times, because he lost count.Then he turned gear A one extra rotation. How many extra rotations did gear B turn?
8. You have two gears, one small one and one big one. The smaller gear has 23 of the number
of total teeth that the bigger gear has. How does this relate to the rotations the gearmake? Justify your answer.
9. What is the relationship between the number of teeth on the gears and the number ofrotations that the gear make? How many teeth does each gear have? Why?
3.4. PROPORTIONAL RELATIONSHIP 71
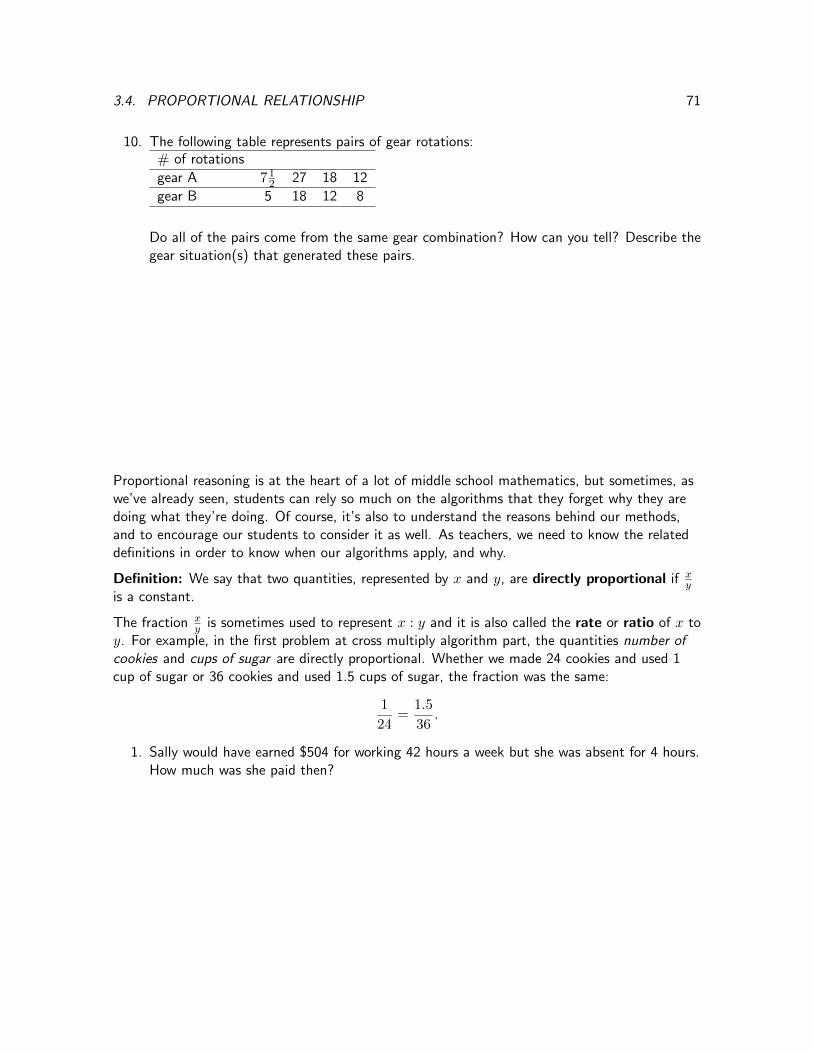
10. The following table represents pairs of gear rotations:# of rotations
gear A 712 27 18 12
gear B 5 18 12 8
Do all of the pairs come from the same gear combination? How can you tell? Describe thegear situation(s) that generated these pairs.
Proportional reasoning is at the heart of a lot of middle school mathematics, but sometimes, aswe’ve already seen, students can rely so much on the algorithms that they forget why they aredoing what they’re doing. Of course, it’s also to understand the reasons behind our methods,and to encourage our students to consider it as well. As teachers, we need to know the relateddefinitions in order to know when our algorithms apply, and why.
Definition: We say that two quantities, represented by x and y, are directly proportional if xy
is a constant.
The fraction xy is sometimes used to represent x : y and it is also called the rate or ratio of x to
y. For example, in the first problem at cross multiply algorithm part, the quantities number ofcookies and cups of sugar are directly proportional. Whether we made 24 cookies and used 1cup of sugar or 36 cookies and used 1.5 cups of sugar, the fraction was the same:
1
24=
1.5
36.
1. Sally would have earned $504 for working 42 hours a week but she was absent for 4 hours.How much was she paid then?
72 CHAPTER 3. ALGEBRA
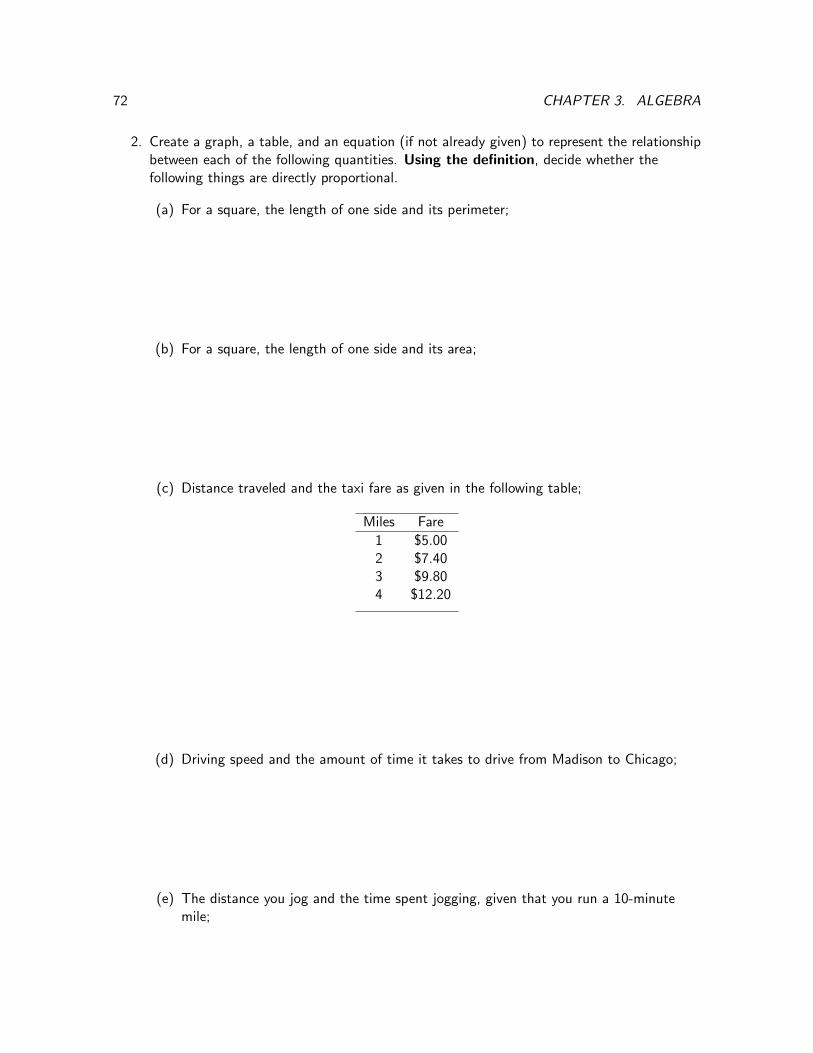
2. Create a graph, a table, and an equation (if not already given) to represent the relationshipbetween each of the following quantities. Using the definition, decide whether thefollowing things are directly proportional.
(a) For a square, the length of one side and its perimeter;
(b) For a square, the length of one side and its area;
(c) Distance traveled and the taxi fare as given in the following table;
Miles Fare
1 $5.002 $7.403 $9.804 $12.20
(d) Driving speed and the amount of time it takes to drive from Madison to Chicago;
(e) The distance you jog and the time spent jogging, given that you run a 10-minutemile;
3.4. PROPORTIONAL RELATIONSHIP 73
(f) Your age and my age;
(g) During a 25% off sale, the original price of an item and the sale price of the item.
3. If you have an equation describing the relationship between two quantities, how can youdetermine if they have a proportional relationship?
4. If you have a table describing the relationship between two quantities, how can youdetermine if they have a proportional relationship? What properties can you identify fromthe table?
5. If you have a graph describing the relationship between two quantities, how can youdetermine if they have a proportional relationship? What properties can you identify fromthe graph?
74 CHAPTER 3. ALGEBRA
Recall that we say that two quantities represented by x and y, are directly proportional if xy is a
constant. Also recall that we decided that “driving speed and the amount of time it takes todrive from Madison to Chicago” was not directly proportional. What is the relationship betweenspeed and time here?
So what is remaining constant in this driving example?
Definition: We say that two quantities represented by x and y, are inversely proportional if xy(x times y) is a constant.
Let’s explore some more directly and inversely proportional examples:
1. Boyle’s Law says that if the temperature and the amount of air inside a balloon are fixed,the pressure P inside the balloon and the volume V of gas inside the balloon, satisfyPV = k where k is some constant. If you squish the balloon, and so decrease the volume,what happens to the pressure? What sort of relationship is this?
2. Define the concentration of salt water as the amount (mass) of salt per unit of volume ofwater. Suppose we have a cup of salt water. We leave it sitting out, and over time, waterstarts evaporating, while the salt remains. Describe the relationship between concentrationand volume.
3. Suppose we have a different cup. We’ve filled the cup with water and begin stirring inspoonfuls of salt, without changing the amount of water. What’s the relationship betweenthe amount of salt (mass) and the concentration of the salt water?
3.4. PROPORTIONAL RELATIONSHIP 75
4. Again suppose we plan to go for a drive. We set out from Madison and set the cruisecontrol. What’s the relationship between the time we drive and the distance we travel?
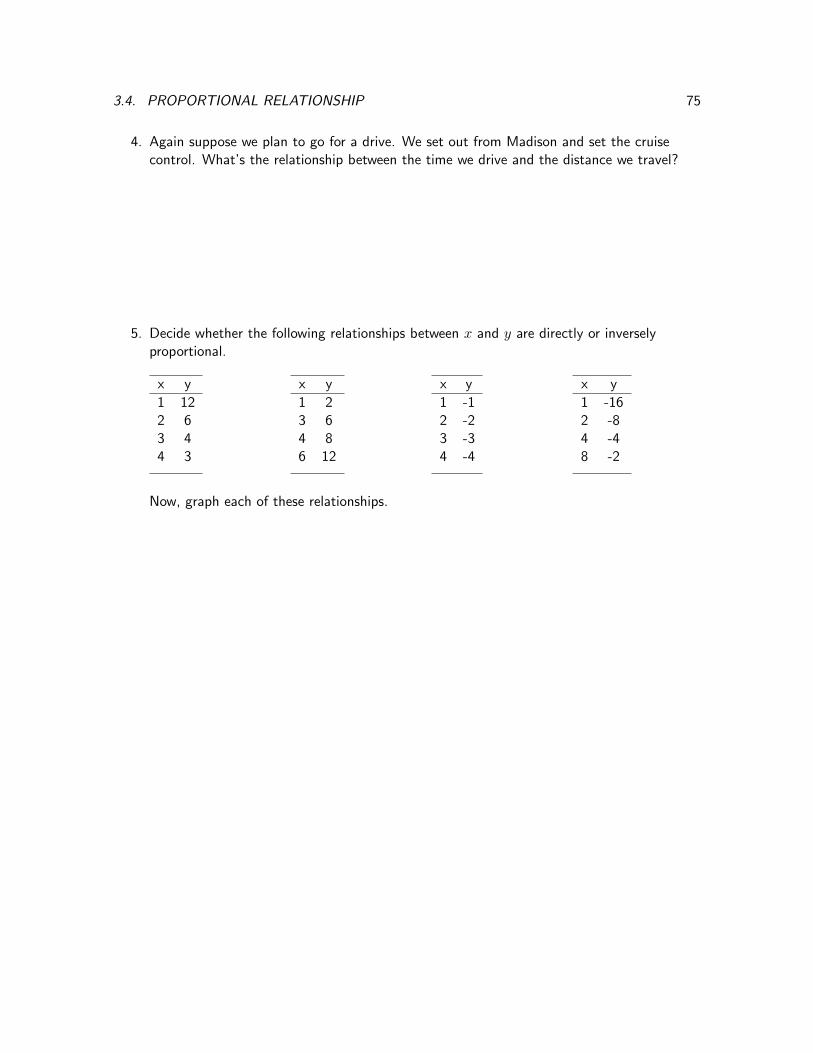
5. Decide whether the following relationships between x and y are directly or inverselyproportional.
x y
1 122 63 44 3
x y
1 23 64 86 12
x y
1 -12 -23 -34 -4
x y
1 -162 -84 -48 -2
Now, graph each of these relationships.
76 CHAPTER 3. ALGEBRA
6. There is a “rule of thumb” for deciding whether a proportion is a direct or inverseproportion that says: In a direct proportion, when the first quantity goes up, the secondgoes up too. In an inverse proportion, when the first quantity goes up, the second goesdown. What do you think? Why is this not always true? (Look at the graphs you justdrew.) Why is it still a useful rule of thumb? How would you adjust it to make it precise?
7. It takes Jim 12 hours to paint a house.
(a) That’s a long day, so Jim plans to hire some help. Assuming the help can paint atthe same rate as Jim does, how long would it take to paint a house if Jim hired oneadditional person to help him? Two additional people? Three additional people?How about four additional people?
(b) What is the relationship between the total number of people painting and the time ittakes to finish a house?
8. Jim and his son Charlie also mow lawns. If they mow at the same time, they can mow 3lawns in one hour. If Jim mows for half an hour, and then Charlie takes over and mows for2 hours, they can again mow 3 lawns. How many lawns can Jim (by himself) mow in onehour?
3.4. PROPORTIONAL RELATIONSHIP 77
Mixture problemsAnother type of problem that is closely related to directly proportional relationships is mixtureproblems. In these problems, you are mixing two substances together to obtain a certain result.If you add a pure substance (as in the first two problems below), the result is directlyproportional. However, if you add a substance that is not pure (as in the last two problemsbelow), the situation becomes more complicated.
1. You have a 10 ounce bottle of juice that contains 80% orange juice and 20% water, butyou think it is too acidic. How much water would you have to add in order for the juice tobe only 60% orange juice and 40% water?
2. A chemist needs a solution of tannic acid that is 70% pure. How much distilled watermust she add to 5 gallons of acid which is 90% pure to obtain the 70% solution?
3. A solution containing 6% boric acid is to be mixed with 2 quarts of a mixture which is15% boric acid in order to obtain a solution which is 12% boric acid. How much of the 6%solution must be used?
78 CHAPTER 3. ALGEBRA
4. John is making his own trail mix. He has bought two kinds of trail mix from the store, onethat is 65% peanuts and one that is 30% peanuts. If he wants to have 10 lbs of trail mixthat is 40% peanuts, how much of each will he need to use?
5. A merchant wishes to mix two grades of coffee, one of which sells for $4 per pound andone of which sells for $6 per pound. He wants to sell the mixture for $5.50 per pound. Ifhe has 25 pounds of the $4 coffee, how much of the $6 coffee must he add so that thevalue of the final mixture is equal to the total value of the two separately?
6. Kathy brought to a Badger tailgate a bowl containing 1 gallon of M&Ms, a mix of twoparts white candy to three parts red candy. Bob then added white M&Ms until the mixwas three parts white to two parts red candy instead. How many gallons of candy did Bobadd to the bowl?
3.5. LINEAR RELATIONSHIPS 79
3.5 Linear Relationships
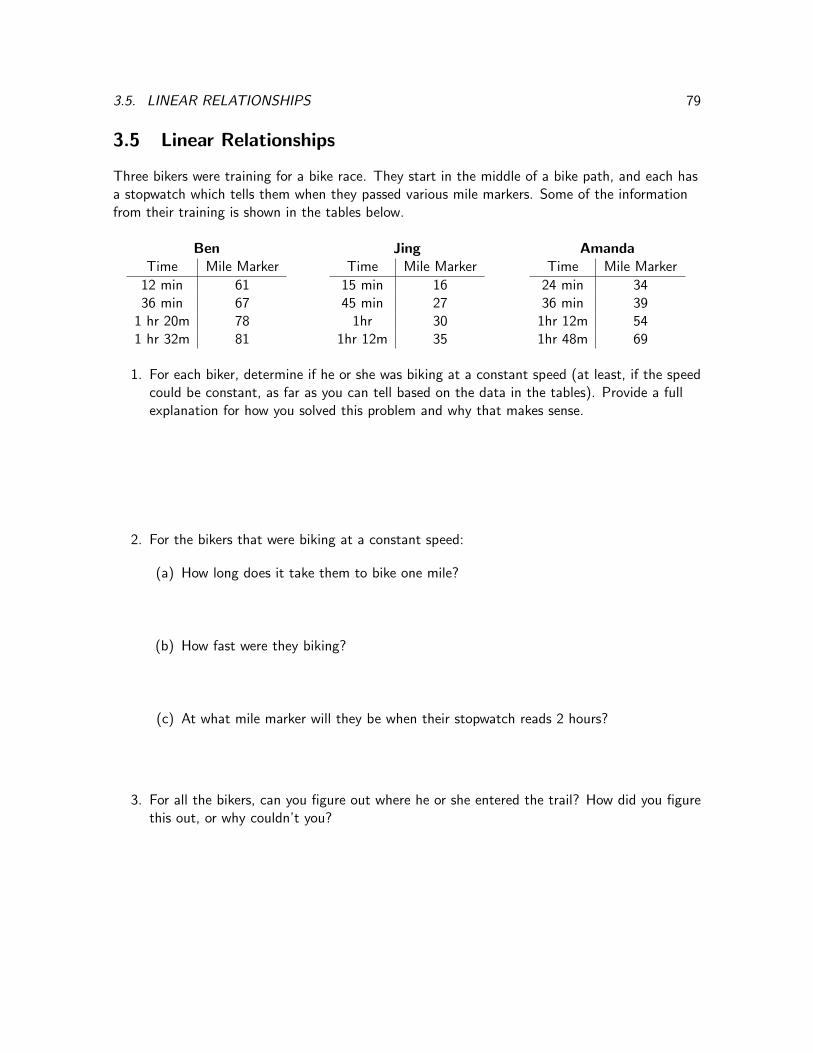
Three bikers were training for a bike race. They start in the middle of a bike path, and each hasa stopwatch which tells them when they passed various mile markers. Some of the informationfrom their training is shown in the tables below.
BenTime Mile Marker
12 min 6136 min 67
1 hr 20m 781 hr 32m 81
JingTime Mile Marker
15 min 1645 min 27
1hr 301hr 12m 35
AmandaTime Mile Marker
24 min 3436 min 39
1hr 12m 541hr 48m 69
1. For each biker, determine if he or she was biking at a constant speed (at least, if the speedcould be constant, as far as you can tell based on the data in the tables). Provide a fullexplanation for how you solved this problem and why that makes sense.
2. For the bikers that were biking at a constant speed:
(a) How long does it take them to bike one mile?
(b) How fast were they biking?
(c) At what mile marker will they be when their stopwatch reads 2 hours?
3. For all the bikers, can you figure out where he or she entered the trail? How did you figurethis out, or why couldn’t you?
80 CHAPTER 3. ALGEBRA
Ben and Amanda are going to race. Suppose they race at the same speeds they had in training.The race course is 75 miles long. Amanda is going to start one hour after Ben.
1. Draw a graph of this situation. What variables should go on which axes? Be neat, andthink ahead to find a good scale.
2. For now, we will say that two quantities x and y are in a linear relationship if, when wegraph x vs y, we get a line. This means that x and y are in a linear relationship if there isa constant number m (the slope) and a constant number b (the y-intercept) so thaty = mx+ b.
Why are your graphs lines above? Why would a graph of Jing’s biking not be a line?
3. Use your graph to decide if Amanda will catch up with Ben by the end of the race. If so,when and where?
4. Using the graph, find out when each person will finish the race.
3.5. LINEAR RELATIONSHIPS 81
5. Find algebraic equations describing rules for the two bikers that tells their distance in therace at a given time. Be sure to say what your variables stand for, any special cases inwhich your rules don’t apply, etc. Solve previous questions again using these rules.
6. What are the x− and y−intercepts for each biker in this problem? What do they tell youin this problem situation?
7. What is the slope for each biker in this problem? What does the slope tell you in thisproblem situation?
8. How can you “see” the slope in the
(a) graph?
(b) table?
(c) algebraic equation?
82 CHAPTER 3. ALGEBRA
9. What is the slope mathematically? That is, how would you describe what the slope is interms of variables without referring to the problem situation?
Just about any relationship found in middle school algebra can be represented in the 4 ways wehave seen in this activity: we can describe the relation in terms of a table of values, a graph, anequation, or in terms of a problem context (something like “Ben bikes at the constant rate of.25 miles per minute; how long does it take him to finish a 75 mile race?). It’s important forteachers to be able to recognize the strengths and weaknesses of each of these representations aswell as to be able to move flexibly between them.
1. Describe a linear relationship between two quantities with a graph, an equation, and atable. What are the differences among linear relationships between two variables, linearexpressions, linear equations in one, two, or more variables, equation of lines, linearfunctions?
2. Suppose you know that x and y are in a linear relationship. Also suppose that you knowthe points (5, 12) and (11, 21) are on the graph of this relationship.
(a) Without finding the equation of the line, find y when x is 7. Justify your reasoning.
(b) When x = 3, find y without finding the equation of the line. How about whenx = 14?
3.5. LINEAR RELATIONSHIPS 83
3. Sometimes, we call this kind of reasoning “additive” reasoning. Explain how your work inthe question above fits with this name.
4. Now look back at one of our proportional reasoning problems: If I need 1 cup of sugar for24 cookies, how much sugar do I need for 36 cookies? We looked at the work of a student,who set up two ratios and solved. We often call this kind of reasoning “multiplicative.”Why do you think that is?
5. Come up with a way to find the amount of sugar for 36 cookies using additive reasoninginstead.
6. Can you come up with a way to use multiplicative reasoning to solve above questions?
Recall that Ben entered the bike trail at mile marker 58 and rode at a constant speed of 3 milesevery 12 minutes. Is this a proportional situation? That is, is the ratio between Ben’s milemarker and time proportional (either directly or inversely)? Is it linear?
84 CHAPTER 3. ALGEBRA
1. Are all directly proportional relationships also linear relationships? Are all linearrelationships also directly proportional relationships?
2. Explain how you can tell the difference between the two in terms of equations as well as interms of graphs.
3. What about inversely proportional relationships? Can such a relationship also be linear ordirectly proportional? Why or why not?
4. We defined a directly proportional relationship by saying that the ratio between y and xremains constant. We can define a linear relationship similarly: a linear relationship is suchthat the ratio between which two quantities remains constant?
5. What do we usually call this ratio (or perhaps the reciprocal of the ratio)?
3.5. LINEAR RELATIONSHIPS 85
Matt bikes at a speed of 6 mph, and Lucy bikes at a speed of 18 mph.
1. At 2:34pm, Matt and Lucy took off biking in opposite directions. What’s the relationshipbetween time and distance between the bikers? Write an equation to prove it.
2. Now use your equation to find the time at which they will be 64 miles apart.
3. Now suppose Matt started biking at 2:34pm, and 20 minutes later, Lucy started biking inthe opposite direction. At what time will they be 64 miles apart?
86 CHAPTER 3. ALGEBRA
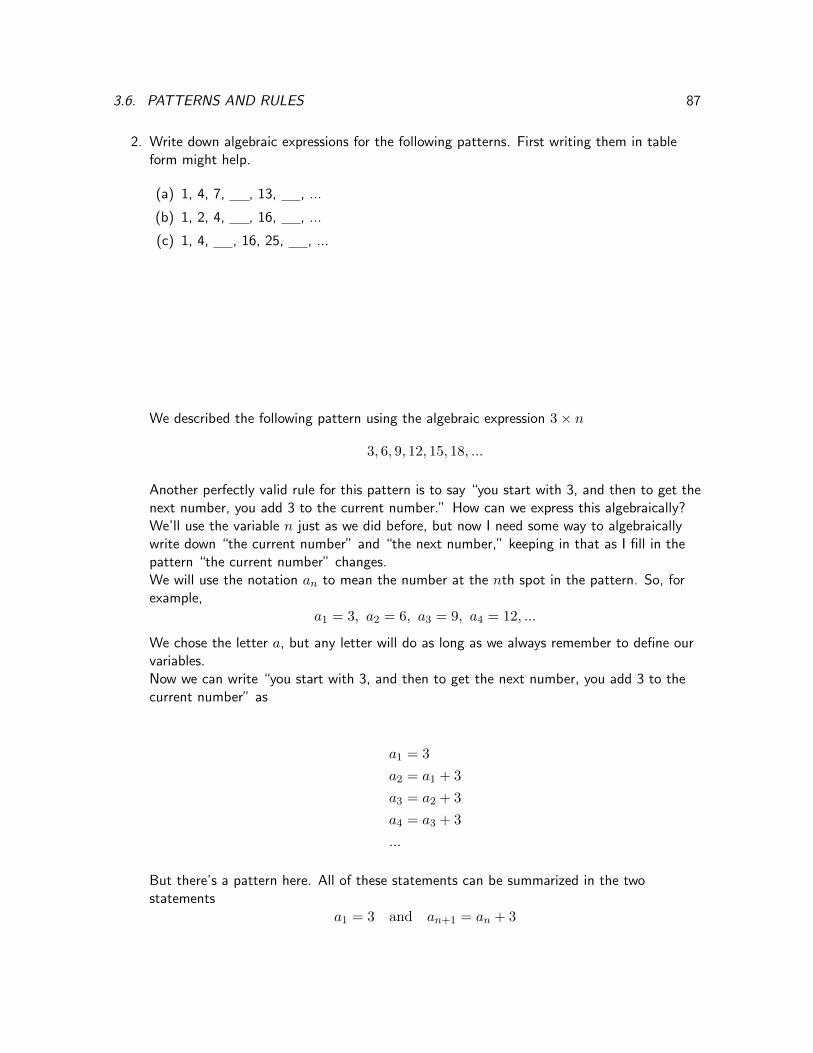
3.6 Patterns and Rules
Find numbers that fit into the patterns below. Then try to write a general rule for the patterns.If you can think of multiple ways to state your rule, great – write them all down. Be as clear aspossible. You should be able to explain what each part of your rule means, and how the part isrelated to the pattern you are observing.
If you get really stuck on one or two of these patterns, move on. We’ll come back to them later.
1. 3, 6, 9, , 15, , ...
2. 1, 4, 7, , 13, , ...
3. 1, 2, 4, , 16, , ...
4. 1, 4, , 16, 25, , ...
Let’s look again at the first pattern from the previous page, presented in a different way. Sincethe 1st number is 3, the 2nd is 6, etc., it makes sense to write
1 32 63 94 125 156 18
Does this representation suggest any different rules? Also, draw a graph in the space above, withthe left column as x-values and the right column as y-values. What rules or patterns does thegraph suggest?
For younger students, tables and graphs are great ways to to explain rules, and to display apattern in an organized way. It’s also important to be able to explain your rules in words (like:“you start with 3, and then to get the next number, you add 3 to the current number”).We also, however, want to be able to write rules algebraically.
For example, the expression
3× n
can be used to describe the pattern above. But it’s important to think about what we mean.
1. What is n? Where can you “see” n in the pattern, the table, and the graph? Whatnumbers is n allowed to stand for?
3.6. PATTERNS AND RULES 87
2. Write down algebraic expressions for the following patterns. First writing them in tableform might help.
(a) 1, 4, 7, , 13, , ...
(b) 1, 2, 4, , 16, , ...
(c) 1, 4, , 16, 25, , ...
We described the following pattern using the algebraic expression 3× n
3, 6, 9, 12, 15, 18, ...
Another perfectly valid rule for this pattern is to say “you start with 3, and then to get thenext number, you add 3 to the current number.” How can we express this algebraically?We’ll use the variable n just as we did before, but now I need some way to algebraicallywrite down “the current number” and “the next number,” keeping in that as I fill in thepattern “the current number” changes.We will use the notation an to mean the number at the nth spot in the pattern. So, forexample,
a1 = 3, a2 = 6, a3 = 9, a4 = 12, ...
We chose the letter a, but any letter will do as long as we always remember to define ourvariables.Now we can write “you start with 3, and then to get the next number, you add 3 to thecurrent number” as
a1 = 3
a2 = a1 + 3
a3 = a2 + 3
a4 = a3 + 3
...
But there’s a pattern here. All of these statements can be summarized in the twostatements
a1 = 3 and an+1 = an + 3
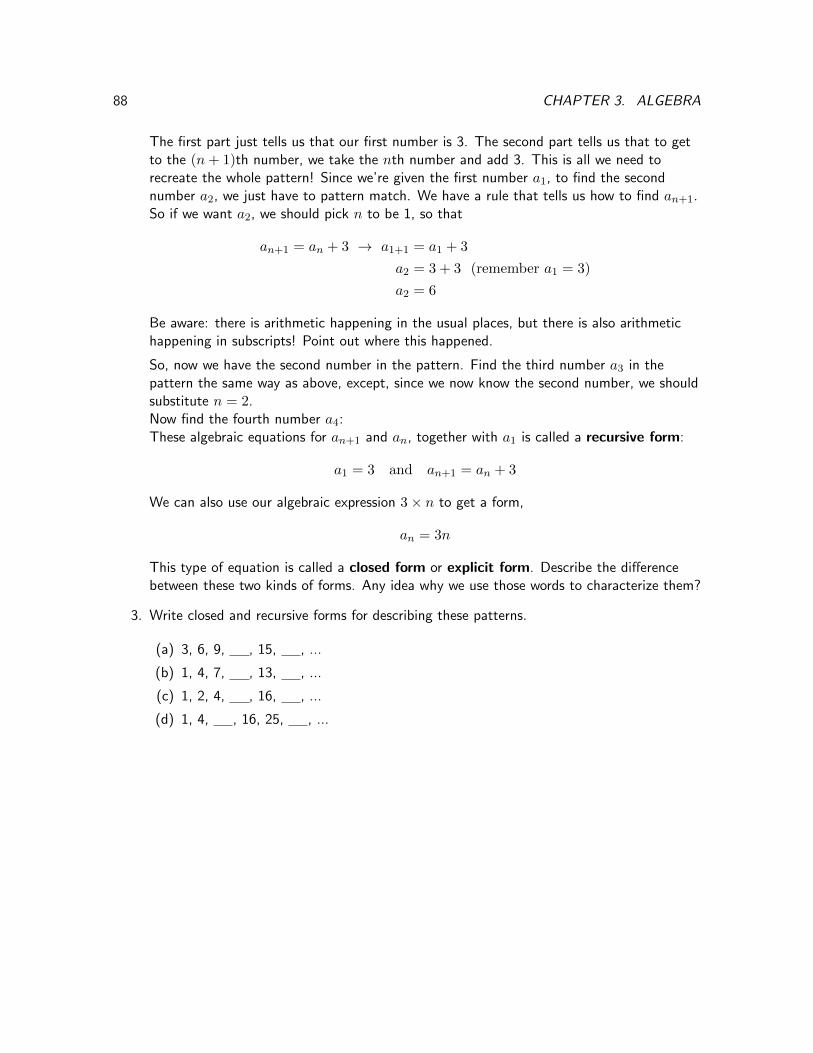
88 CHAPTER 3. ALGEBRA
The first part just tells us that our first number is 3. The second part tells us that to getto the (n+ 1)th number, we take the nth number and add 3. This is all we need torecreate the whole pattern! Since we’re given the first number a1, to find the secondnumber a2, we just have to pattern match. We have a rule that tells us how to find an+1.So if we want a2, we should pick n to be 1, so that
an+1 = an + 3 → a1+1 = a1 + 3
a2 = 3 + 3 (remember a1 = 3)
a2 = 6
Be aware: there is arithmetic happening in the usual places, but there is also arithmetichappening in subscripts! Point out where this happened.
So, now we have the second number in the pattern. Find the third number a3 in thepattern the same way as above, except, since we now know the second number, we shouldsubstitute n = 2.Now find the fourth number a4:These algebraic equations for an+1 and an, together with a1 is called a recursive form:
a1 = 3 and an+1 = an + 3
We can also use our algebraic expression 3× n to get a form,
an = 3n
This type of equation is called a closed form or explicit form. Describe the differencebetween these two kinds of forms. Any idea why we use those words to characterize them?
3. Write closed and recursive forms for describing these patterns.
(a) 3, 6, 9, , 15, , ...
(b) 1, 4, 7, , 13, , ...
(c) 1, 2, 4, , 16, , ...
(d) 1, 4, , 16, 25, , ...
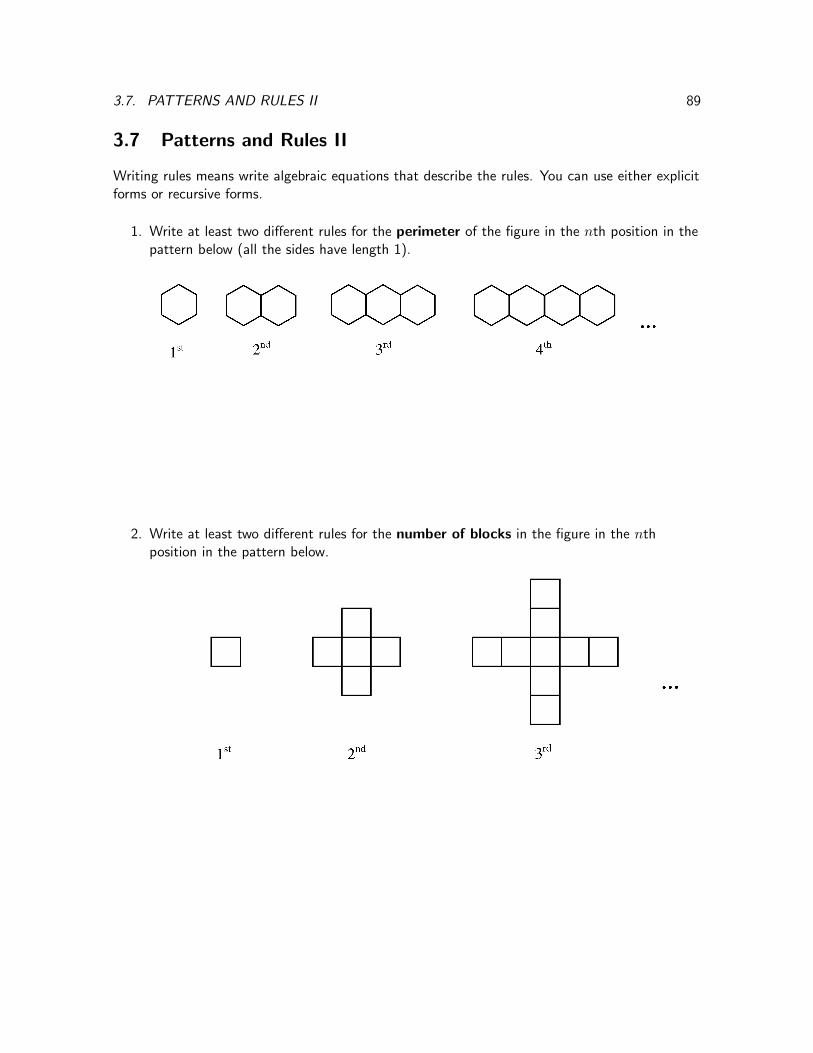
3.7. PATTERNS AND RULES II 89
3.7 Patterns and Rules II
Writing rules means write algebraic equations that describe the rules. You can use either explicitforms or recursive forms.
1. Write at least two different rules for the perimeter of the figure in the nth position in thepattern below (all the sides have length 1).
2. Write at least two different rules for the number of blocks in the figure in the nthposition in the pattern below.
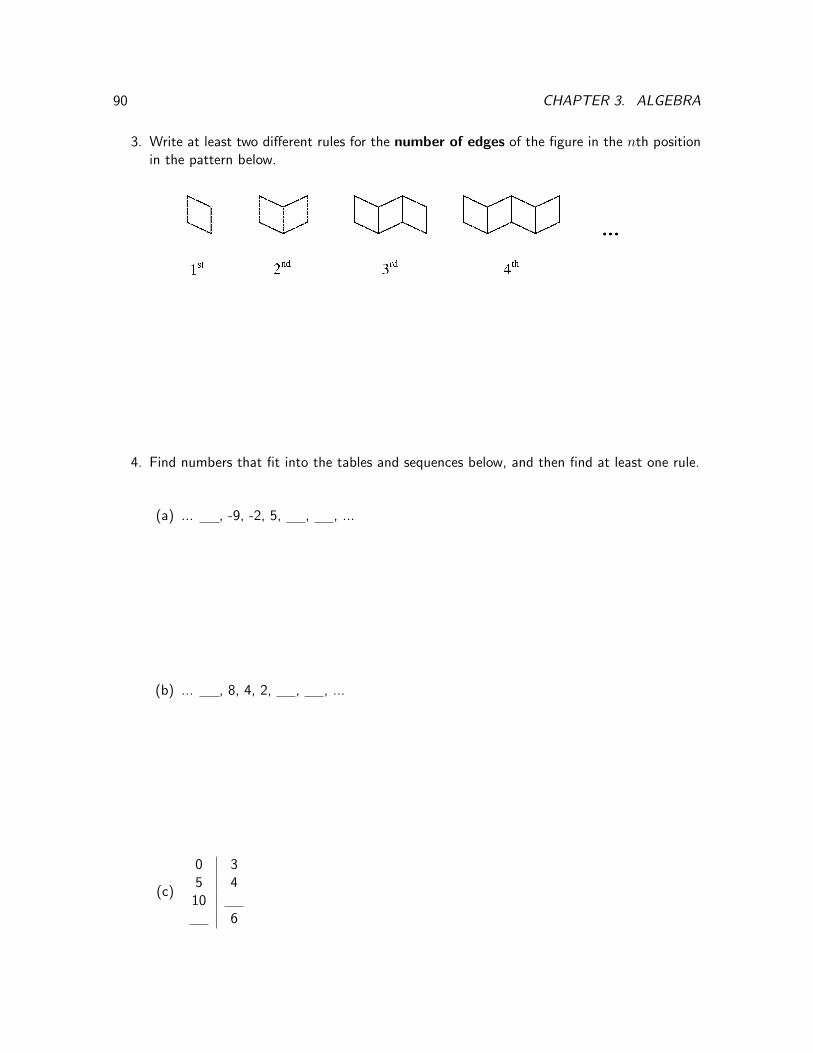
90 CHAPTER 3. ALGEBRA
3. Write at least two different rules for the number of edges of the figure in the nth positionin the pattern below.
4. Find numbers that fit into the tables and sequences below, and then find at least one rule.
(a) ... , -9, -2, 5, , , ...
(b) ... , 8, 4, 2, , , ...
(c)
0 35 4
106
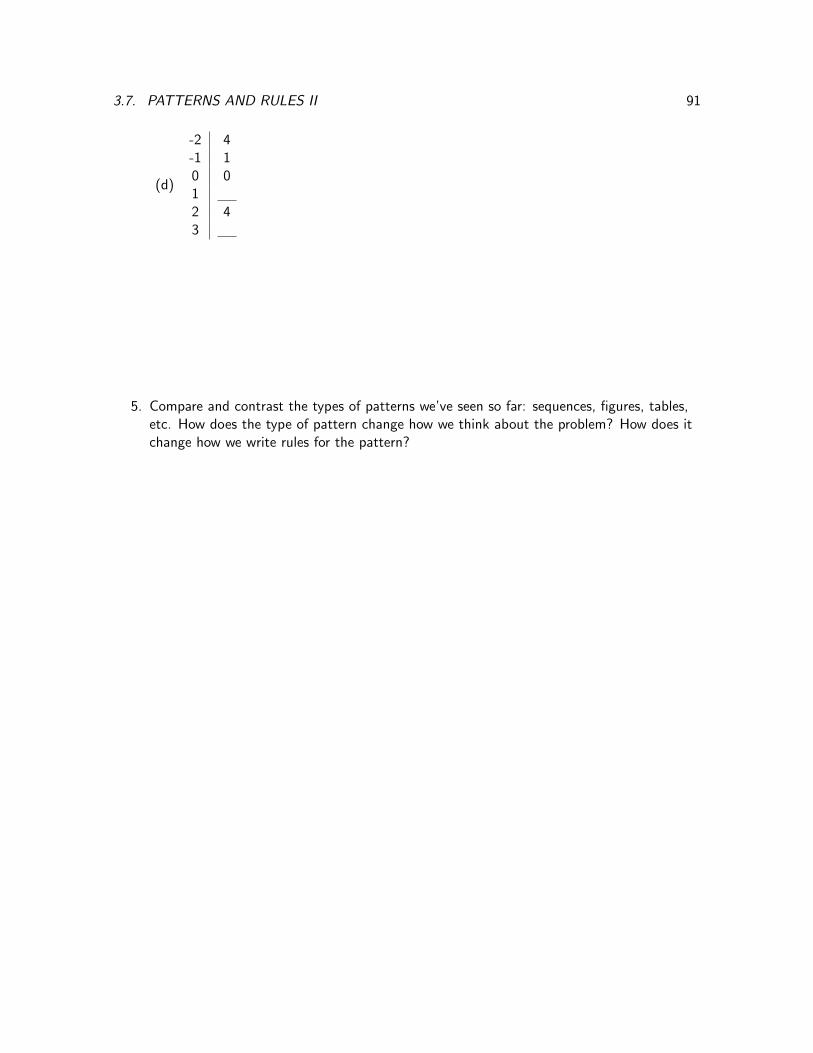
3.7. PATTERNS AND RULES II 91
(d)
-2 4-1 10 012 43
5. Compare and contrast the types of patterns we’ve seen so far: sequences, figures, tables,etc. How does the type of pattern change how we think about the problem? How does itchange how we write rules for the pattern?