Embed Size (px)
Citation preview
2855 Telegraph Ave, Suite 400, Berkeley, CA 94705
phone 510.848.8098 fax 510.848.8398
TECHNICAL MEMORANDUM
DATE: June 3, 2014
TO: Management Team, Matilija Dam Ecosystem Restoration Project
FROM: Derek Booth PhD PE PG, Stillwater Sciences
SUBJECT: Matilija Dam Removal, Sediment Transport, & Robles Diversion Mitigation Study HYDROLOGIC ASSESSMENT, Task 2.1
1 INTRODUCTION
This memo summarizes hydrologic data, data sources, prior hydrologic investigations, and key
attributes of flow conditions in Matilija Creek and the Ventura River that are anticipated to be
relevant to evaluating alternatives for the removal of Matilija Dam. It includes preliminary
identification of “hydrologic scenarios that will be utilized in the sediment transport and flood
assessments, based primarily on the existing gage and rainfall records from the Ventura River
watershed” (from the original Scope of Work for Task 2.1).
These analyses are not intended to be final, however, insofar as definition of suitable hydrologic
scenarios (whether historical or synthetic) depends in part on the final choice of dam-removal
scenarios and the detailed needs of the selected sediment-transport model. In addition, a variety of
other hydrologic attributes and issues not directly anticipated by the original scope language are
also likely to prove relevant in the evaluation, selection, and analysis of dam-removal scenarios,
and so they are included in the following discussion as well.
Thus, the purpose of this document is three-fold:
1. Provide an overall characterization of the hydrology of the Matilija–Ventura watershed,
with particular emphasis on the episodicity of extreme events that is likely to influence the
selection of dam-removal scenarios.
2. Analyze the hydrograph of the Ventura River and Matilija Creek over the full period of
record to identify other specific attributes of those records that are likely to affect the
feasibility and implementation of one or more prospective dam-removal scenarios.
3. Generate (or otherwise identify) the scope-specified “hydrologic scenarios that will be
utilized in the sediment transport and flood assessments,” at a level of detail sufficient to
support the screening of initial dam-removal options, and with the expectation of further
refinements once the option(s) advancing to more detailed analysis have been determined.
This topic is covered in the last section of the memo.
Technical Memorandum Hydrologic Assessment
Stillwater Sciences
2
2 DATA SOURCES, TIME SPAN, AND PRIOR INVESTIGATIONS
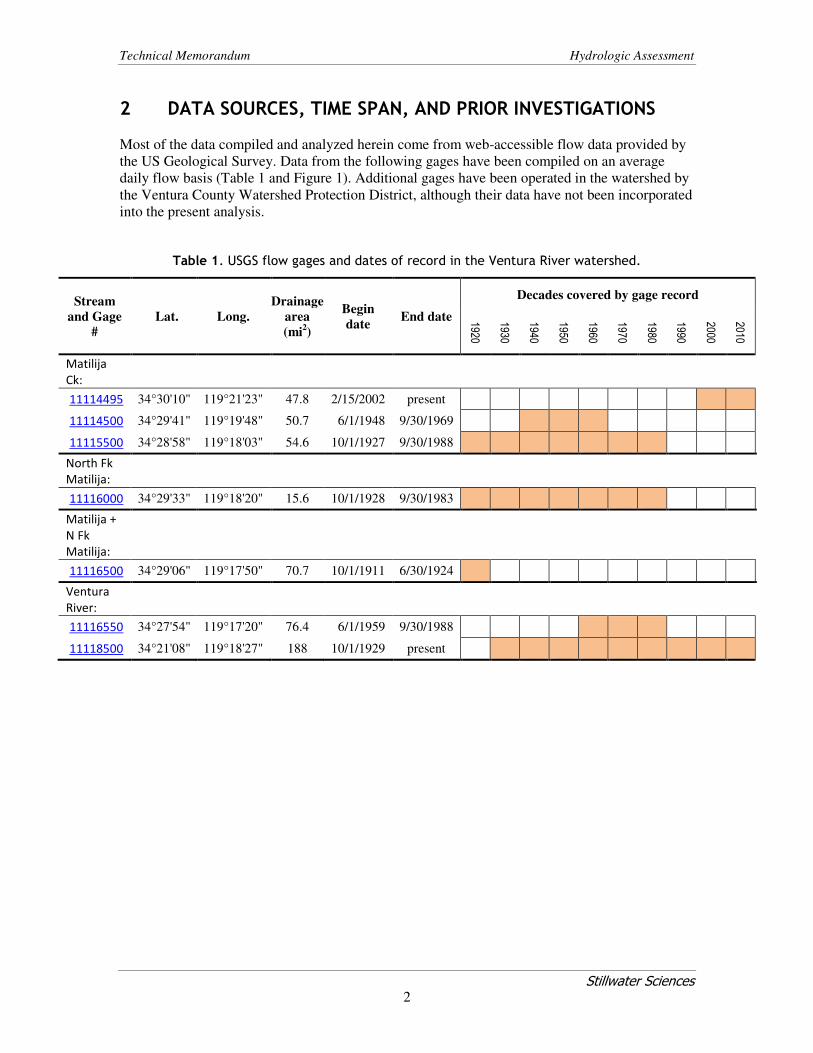
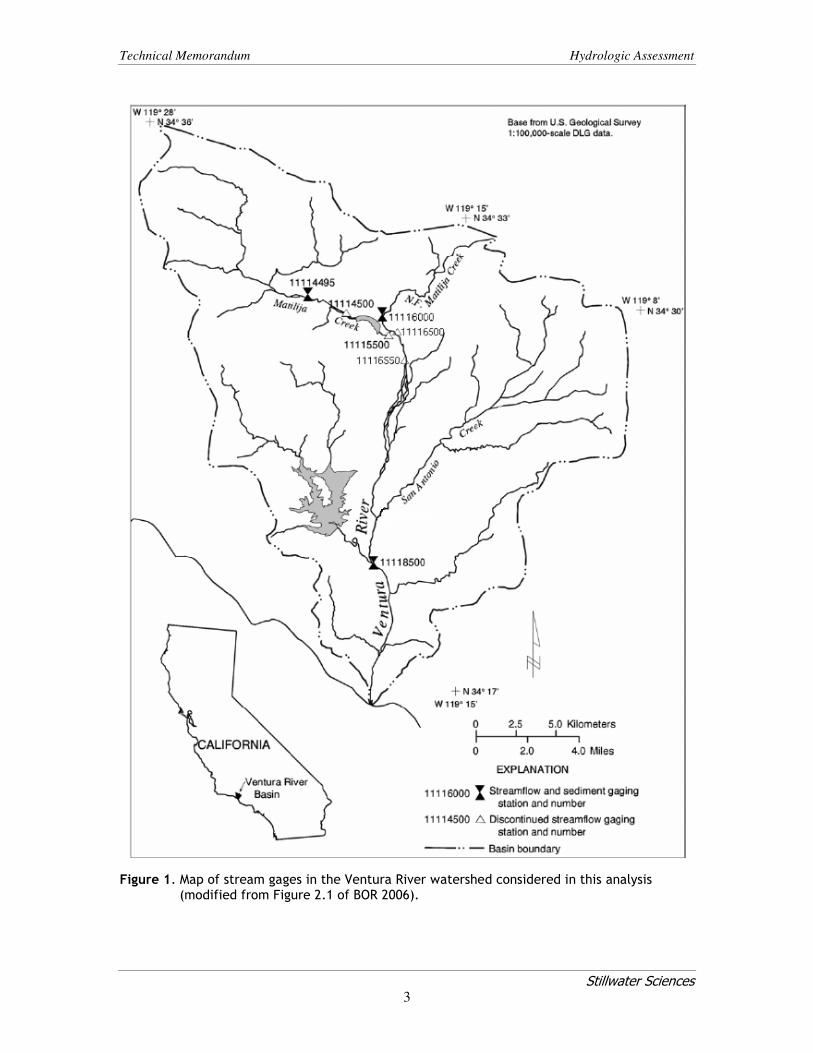
Most of the data compiled and analyzed herein come from web-accessible flow data provided by
the US Geological Survey. Data from the following gages have been compiled on an average
daily flow basis (Table 1 and Figure 1). Additional gages have been operated in the watershed by
the Ventura County Watershed Protection District, although their data have not been incorporated
into the present analysis.
Table 1. USGS flow gages and dates of record in the Ventura River watershed.
Stream
and Gage
#
Lat. Long.
Drainage
area
(mi2)
Begin
date End date
Decades covered by gage record
1920
1930
1940
1950
1960
1970
1980
1990
2000
2010
Matilija
Ck:
11114495 34°30'10" 119°21'23" 47.8 2/15/2002 present
11114500 34°29'41" 119°19'48" 50.7 6/1/1948 9/30/1969
11115500 34°28'58" 119°18'03" 54.6 10/1/1927 9/30/1988
North Fk
Matilija:
11116000 34°29'33" 119°18'20" 15.6 10/1/1928 9/30/1983
Matilija +
N Fk
Matilija:
11116500 34°29'06" 119°17'50" 70.7 10/1/1911 6/30/1924
Ventura
River:
11116550 34°27'54" 119°17'20" 76.4 6/1/1959 9/30/1988
11118500 34°21'08" 119°18'27" 188 10/1/1929 present
Technical Memorandum Hydrologic Assessment
Stillwater Sciences
3
Figure 1. Map of stream gages in the Ventura River watershed considered in this analysis (modified from Figure 2.1 of BOR 2006).
Technical Memorandum Hydrologic Assessment
Stillwater Sciences
4
In addition, peak annual instantaneous floods were compiled for the 7 gages listed in Table 1, and
analyses of flood frequency and flow durations were compiled from Colorado State University’s
on-line Environmental Risk and Management System (www.erams.com/), which provides a
convenient platform for analysis of the USGS gage data (or any other data series) using standard
hydrologic tools (in particular, Bulletin 17B for flood-frequency analysis). Note, however, that
BOR (2006, p. 42) warned that “It is expected that the distribution does not work well in this
region of the county because of the peculiarities of the weather patterns.” Adjustments have not
been made at this stage in the analysis, pending a determination of whether or not they are
important to the management issues now being explored.
Finally, individual Excel workbooks covering the years 1993–2013 were provided by the Casitas
Water District, documenting daily reservoir, meteorological, and diversion data for this 21-year
period. A subset of these data judged relevant to the characterization of watershed hydrology was
extracted from these records; they were compiled and matched with USGS gage data for the
corresponding dates.
These hydrologic data are readily accessible and thus have been the subject of multiple prior
investigations. BOR (2006) devoted an entire chapter to the topic of hydrology, including flood-
frequency analyses of multiple gages and compilation of daily average and extreme flow
statistics, flow-duration curves, and Casitas diversions over the period 1991–2000. The following
discussion, therefore, does not attempt to replicate this past work, but instead to augment it where
the additional length of record (in particular, the floods of 2005 and 2010/2011, and the additional
13 years of Casitas diversion) yields materially expanded findings. Also discussed herein are
aspects of the watershed hydrology that may have particular relevance for dam-removal
alternatives currently or potentially under consideration, but that were not specifically addressed
in BOR (2006).
One additional prior document, an informal 9-page memo prepared by Dr. Thomas Dunne of the
Technical Advisory Committee in mid-2013 (referenced as Dunne 2013), has also been
referenced in the preparation of the following text. It raises several potentially relevant points
regarding the hydrology of the watershed that have not been heretofore explored in full, and it has
provided the framework for several of the topics discussed below.
3 GENERAL FLOW REGIME OF THE VENTURA RIVER AND MATILIJA CREEK
The entire Ventura River system is strongly seasonal and highly episodic, with long periods of
near-zero flow punctuated by moderate to extremely high discharges. This hydrologic behavior is
common to much of the western Transverse Ranges and is driven by intense rainstorms over a
generally steep catchment with rapid runoff response and minimal valley storage of floodwaters
throughout most of the channel network (e.g., Warrick and Mertes 2009; Stillwater Sciences
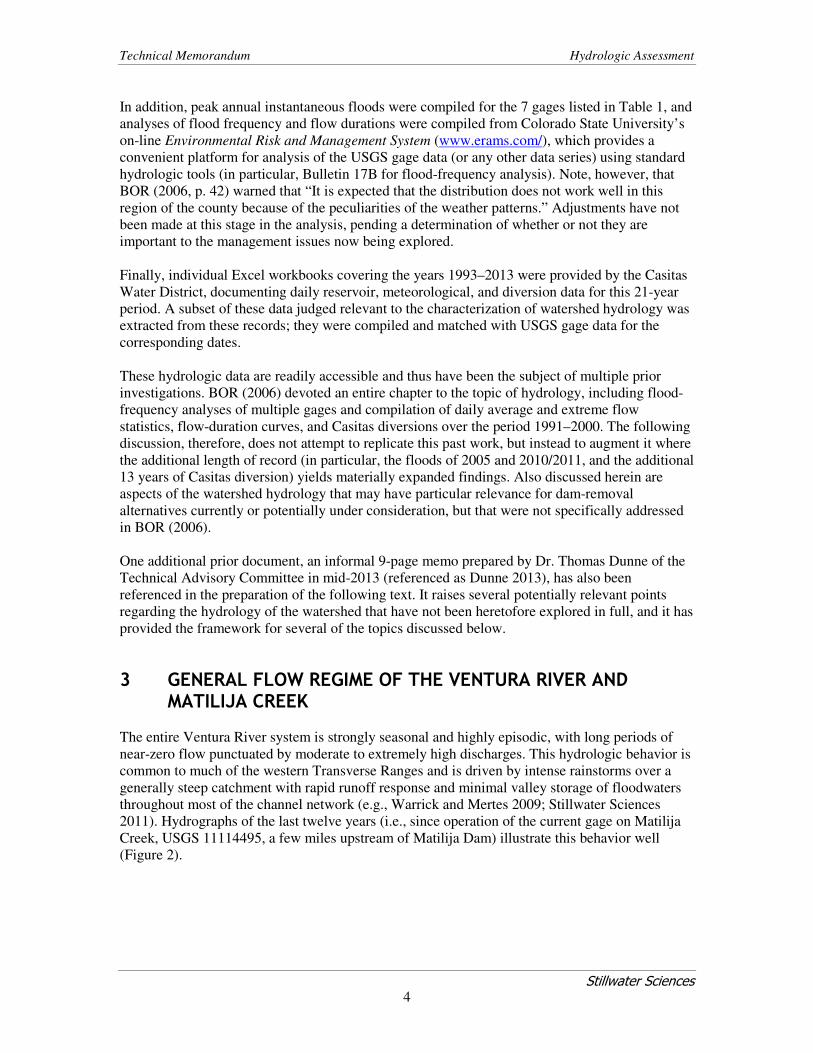
2011). Hydrographs of the last twelve years (i.e., since operation of the current gage on Matilija
Creek, USGS 11114495, a few miles upstream of Matilija Dam) illustrate this behavior well
(Figure 2).
Technical Memorandum Hydrologic Assessment
Stillwater Sciences
5
Figure 2. Hydrographs of the Ventura River and Matilija Creek for water years 2003 through mid-2014, expressed as cubic feet per second (cfs) on arithmetic (left) and log (right) scales. The former emphasizes the dramatic variability of this system, with individual flow events of typically a few days’ to a few weeks’ duration, separated by one to several years of very low flow; the latter shows that that flow is minimal but almost always non-zero in both channels at the gage locations. Both graphs also show the close correspondence of tributary (Matilija) and mainstem (Ventura) flows at the resolution of a daily time step.
Based on conversations with California Department of Fish and Wildlife (Dana McCanne, pers.
comm., Environmental Scientist, South Coast Region Steelhead Monitoring Program, California
Department of Fish and Wildlife, April 3, 2014), these 2003–2014 gage data are broadly
representative of hydrologic behavior over the entire period of record. During most years the
mainstem Ventura River is wet from the confluence of San Antonio Creek (about two miles
upstream of 11118500) to the estuary. There is typically perennial flow from Matilija Creek (also
see Figure 2, right panel), but a losing reach from the Camino Cielo road crossing, downstream of
Matilija Dam, past the Robles Diversion, and continuing downstream as far as the confluence
with San Antonio Creek results in dry riverbed conditions during portions of most years. Summer
2013 was unusually dry, and the mainstem Ventura River dropped to nearly unprecedented levels
(Figure 2, right panel) but still with areas of wetted habitat. Under almost all less extreme
conditions, there are typically measurable numbers of O. mykiss rearing in the mainstem.
4 ANALYSES
4.1 Data Quality
Gaging intermittent and multi-channel rivers of southern California has commonly proved to be
challenging, particularly in unconfined reaches with mobile beds. Although Matilija Creek and
the Ventura River are primarily gravel- and cobble-bedded over much of their length, and so not
as highly mobile as (for example) the Santa Maria River (Booth et al. 2013; Stillwater Sciences
and Kear Groundwater [2012], which included an extensive evaluation of gage data quality), a
degree of caution is nonetheless warranted in working with any such data. For example, the 2013
annual Water-Data Report for gage 11114495 rates the data quality as “poor” (i.e., >15%
divergence of recorded from actual); that of gage 11118500 rates the quality no better than “fair”
(10–15% error; and worse at very low flows). Based on records from around the region, gaging of
very high flows is also likely to carry significant errors (e.g., Booth et al. 2013).
Technical Memorandum Hydrologic Assessment
Stillwater Sciences
6
Two USGS gages on Matilija Creek (11114500 and 11115500) operated simultaneously for 21
years (6/1/1948 through 9/30/1969), providing a limited opportunity to evaluate the consistency
of these flow data. They lay on opposite sides of Matilija Dam, which BOR (2006) noted
provides minimal attenuation of flows greater than about a 5-year return interval and likely even
less influence following the dramatic shrinkage of the reservoir volume following the 1969
storms. Table 2.3 of BOR (2006) showed measured peak flows up- and downstream of the dam
for 7 events, with the greatest attenuation being more than 2-fold for the earliest (1/15/1952).
Comparison of the average daily flows for these two gages on this same date show even greater
differences but less than 5% difference on the day following. In January 1969, differences in
average daily flows between the two gages were typically less than 10%, not only for the very
high-flow days (e.g., >3,000 cfs) but also for the intervening flows of only one to several hundred
cfs. Low flows upstream and downstream of the dam track each other almost exactly through the
rest of that water year (after which the upstream gage 11114500 was retired), a consistency
suggesting that flow records are broadly accurate. These data also affirm BOR (2006)’s
conclusion of minimal flow attenuation by the dam.
4.2 Relationship between Flows in Matilija Creek and the Ventura River
Evaluating the relationship between flows in these two channels is likely to be useful for future
applications, because the natural transport of sediment out of the Matilija reservoir area will
depend exclusively on flows in Matilija Creek (as presently measured at gage 11114495, and
previously by gages 11114500 and 11115500) but will continue down the Ventura River only
insofar as mainstem discharges (as represented here by measurements at gage 11118500) are also
sufficiently high. The availability of historical flow data is greater on the Ventura River than on
Matilija Creek, and so establishing a relationship may also enable the extrapolation of an
extended record beyond that available for Matilija Creek.
The records of flows in these two channels overlap almost continuously from 1929 through to the
present day, except for water years 1989–2001 (inclusive) when gage 11115500 had retired and
gage 11114495 had not yet come into service, and they bracket the closure of Matilija Dam
(1948). Thus, flows from 19 years pre-dam and more than 50 years post-dam are available for
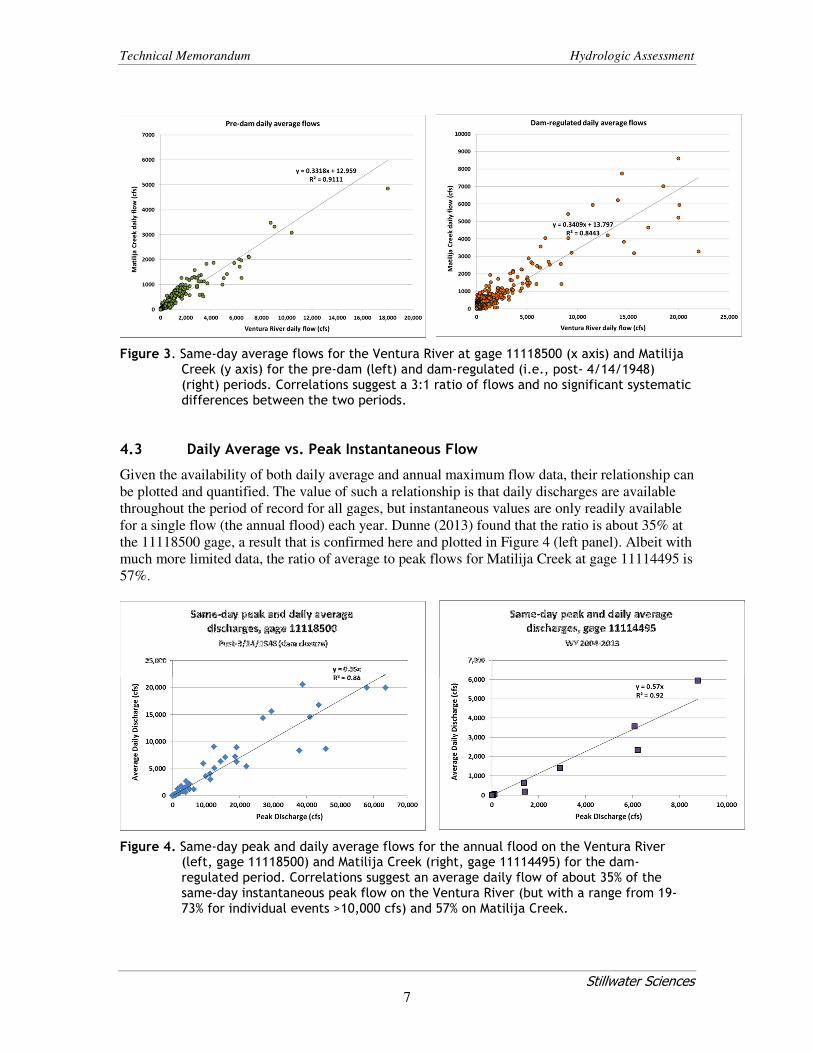
comparison. Inspection of these data (Figure 3) suggest that (1) on a daily average basis, flows in
Matilija Creek below the dam are almost exactly one-third those in the mainstem Ventura River
at gage 11118500, only modestly greater than the 25–29% fraction of the contributing watershed
area; and (2) the presence of Matilija Dam has not significantly influenced the larger daily
average flows that most strongly determine the correlations.
Technical Memorandum Hydrologic Assessment
Stillwater Sciences
7
Figure 3. Same-day average flows for the Ventura River at gage 11118500 (x axis) and Matilija Creek (y axis) for the pre-dam (left) and dam-regulated (i.e., post- 4/14/1948) (right) periods. Correlations suggest a 3:1 ratio of flows and no significant systematic differences between the two periods.
4.3 Daily Average vs. Peak Instantaneous Flow
Given the availability of both daily average and annual maximum flow data, their relationship can
be plotted and quantified. The value of such a relationship is that daily discharges are available
throughout the period of record for all gages, but instantaneous values are only readily available
for a single flow (the annual flood) each year. Dunne (2013) found that the ratio is about 35% at
the 11118500 gage, a result that is confirmed here and plotted in Figure 4 (left panel). Albeit with
much more limited data, the ratio of average to peak flows for Matilija Creek at gage 11114495 is
57%.
Figure 4. Same-day peak and daily average flows for the annual flood on the Ventura River (left, gage 11118500) and Matilija Creek (right, gage 11114495) for the dam-regulated period. Correlations suggest an average daily flow of about 35% of the same-day instantaneous peak flow on the Ventura River (but with a range from 19-73% for individual events >10,000 cfs) and 57% on Matilija Creek.
Technical Memorandum Hydrologic Assessment
Stillwater Sciences
8
4.4 Historical Levels of Significant Sediment Transport
Detailed sediment-transport modeling is reported in BOR (2006) and more will be accomplished
as part of the Matilija Dam Removal, Sediment Transport, and Robles Diversion Mitigation
Study (of which this memo is a part). There is no intention here to replicate prior efforts or
anticipate the potential range of future work; however, initial screening of alternatives will
require some knowledge of the general flow levels at which significant sediment movement has
historically occurred under present conditions of watershed sediment delivery and sediment
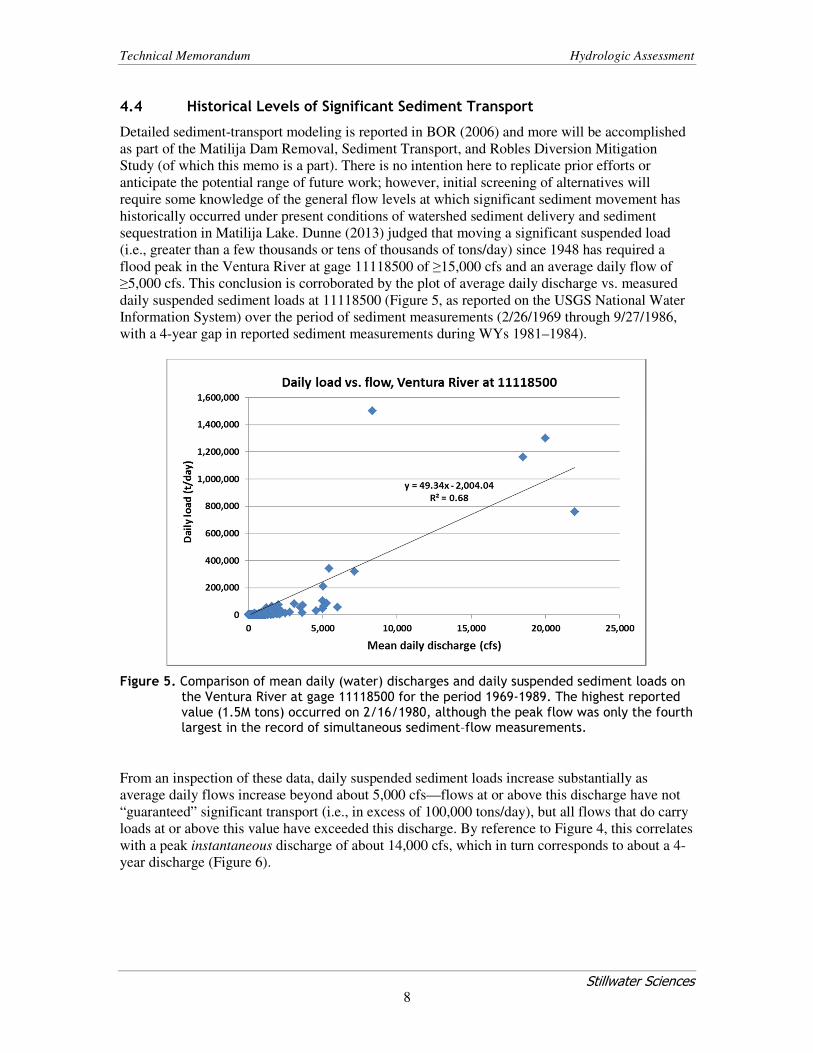
sequestration in Matilija Lake. Dunne (2013) judged that moving a significant suspended load
(i.e., greater than a few thousands or tens of thousands of tons/day) since 1948 has required a
flood peak in the Ventura River at gage 11118500 of ≥15,000 cfs and an average daily flow of
≥5,000 cfs. This conclusion is corroborated by the plot of average daily discharge vs. measured
daily suspended sediment loads at 11118500 (Figure 5, as reported on the USGS National Water
Information System) over the period of sediment measurements (2/26/1969 through 9/27/1986,
with a 4-year gap in reported sediment measurements during WYs 1981–1984).
Figure 5. Comparison of mean daily (water) discharges and daily suspended sediment loads on the Ventura River at gage 11118500 for the period 1969-1989. The highest reported value (1.5M tons) occurred on 2/16/1980, although the peak flow was only the fourth largest in the record of simultaneous sediment–flow measurements.
From an inspection of these data, daily suspended sediment loads increase substantially as
average daily flows increase beyond about 5,000 cfs—flows at or above this discharge have not
“guaranteed” significant transport (i.e., in excess of 100,000 tons/day), but all flows that do carry
loads at or above this value have exceeded this discharge. By reference to Figure 4, this correlates
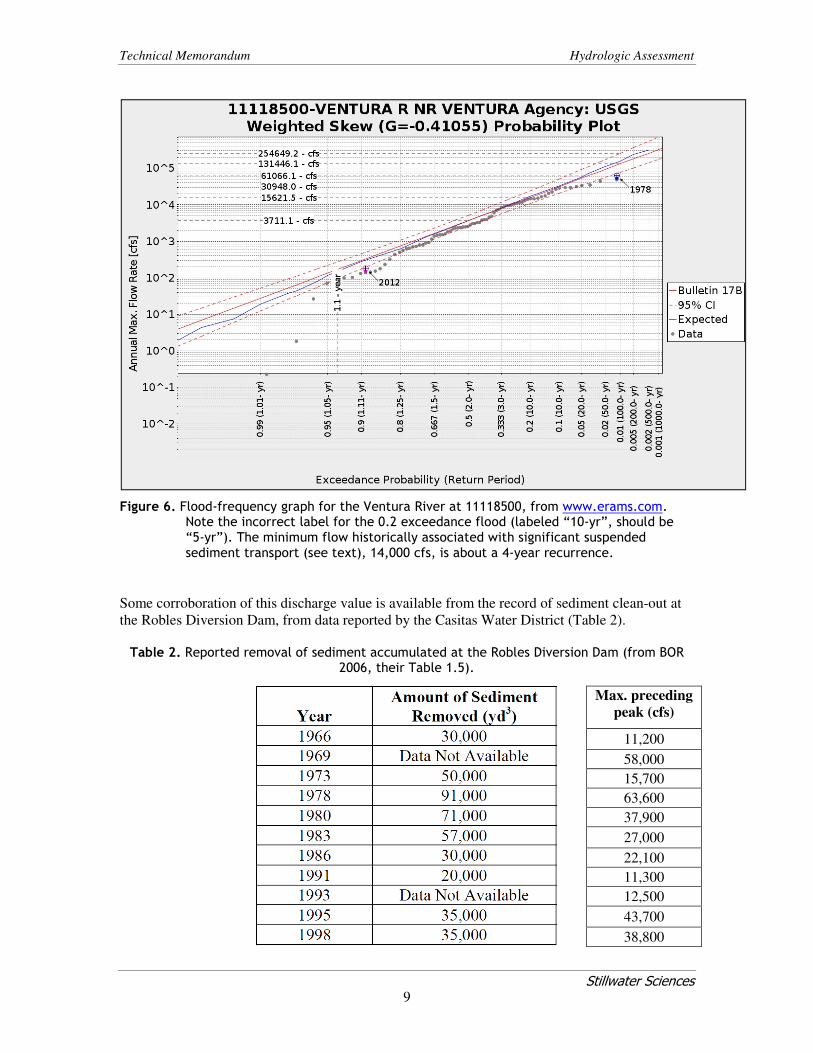
with a peak instantaneous discharge of about 14,000 cfs, which in turn corresponds to about a 4-
year discharge (Figure 6).
Technical Memorandum Hydrologic Assessment
Stillwater Sciences
9
Figure 6. Flood-frequency graph for the Ventura River at 11118500, from www.erams.com. Note the incorrect label for the 0.2 exceedance flood (labeled “10-yr”, should be “5-yr”). The minimum flow historically associated with significant suspended sediment transport (see text), 14,000 cfs, is about a 4-year recurrence.
Some corroboration of this discharge value is available from the record of sediment clean-out at
the Robles Diversion Dam, from data reported by the Casitas Water District (Table 2).
Table 2. Reported removal of sediment accumulated at the Robles Diversion Dam (from BOR
2006, their Table 1.5).
Max. preceding
peak (cfs)
11,200
58,000
15,700
63,600
37,900
27,000
22,100
11,300
12,500
43,700
38,800
Technical Memorandum Hydrologic Assessment
Stillwater Sciences
10
With one exception, these years correspond exactly to those years that experienced one to several
days of average daily flows ≥5,000 cfs at the Ventura River gage (11118500). That exception is
1991, showing the smallest removal amount on this table and whose highest average daily flows
of the year were 2,370 and 2,990 cfs. There is only one year (1992) with a 5,000-cfs flow
exceedence that is not represented in this list, and its sediment may have been included in the
“unavailable” 1993 removal data. These data suggest that the concept of a “threshold” is not
absolute based on the historical record but may be a useful construct for planning purposes.
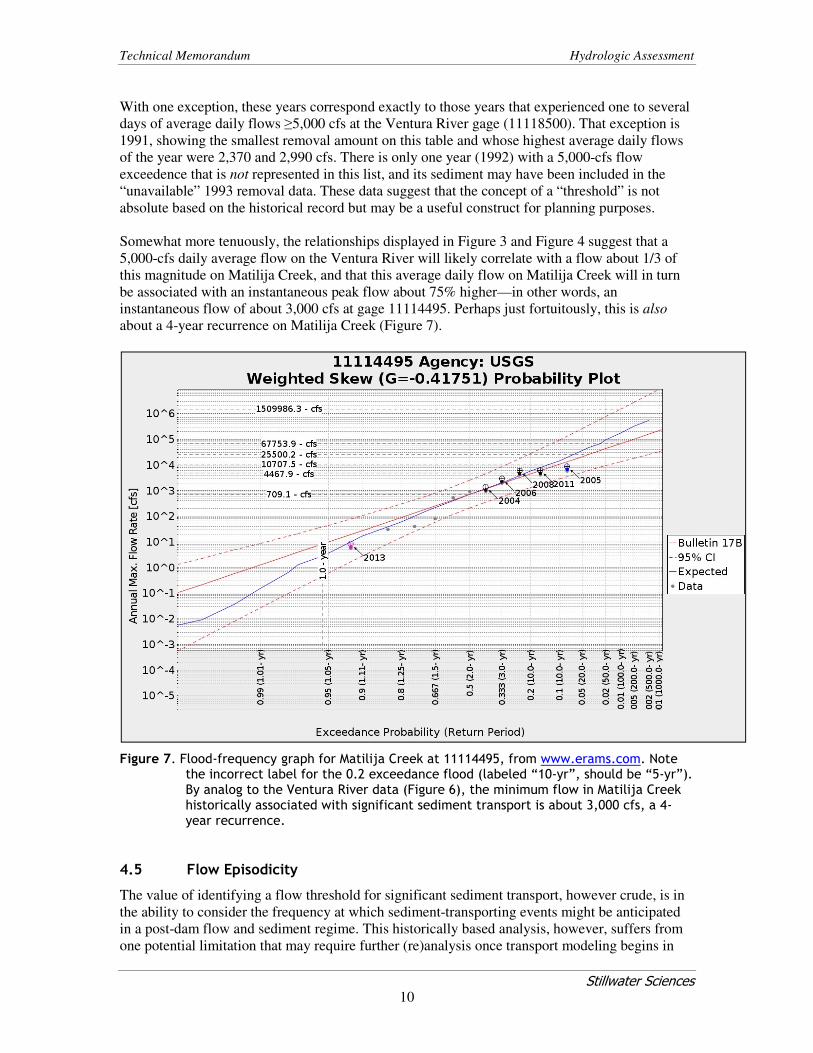
Somewhat more tenuously, the relationships displayed in Figure 3 and Figure 4 suggest that a
5,000-cfs daily average flow on the Ventura River will likely correlate with a flow about 1/3 of
this magnitude on Matilija Creek, and that this average daily flow on Matilija Creek will in turn
be associated with an instantaneous peak flow about 75% higher—in other words, an
instantaneous flow of about 3,000 cfs at gage 11114495. Perhaps just fortuitously, this is also
about a 4-year recurrence on Matilija Creek (Figure 7).
Figure 7. Flood-frequency graph for Matilija Creek at 11114495, from www.erams.com. Note the incorrect label for the 0.2 exceedance flood (labeled “10-yr”, should be “5-yr”). By analog to the Ventura River data (Figure 6), the minimum flow in Matilija Creek historically associated with significant sediment transport is about 3,000 cfs, a 4-year recurrence.
4.5 Flow Episodicity
The value of identifying a flow threshold for significant sediment transport, however crude, is in
the ability to consider the frequency at which sediment-transporting events might be anticipated
in a post-dam flow and sediment regime. This historically based analysis, however, suffers from
one potential limitation that may require further (re)analysis once transport modeling begins in
Technical Memorandum Hydrologic Assessment
Stillwater Sciences
11
earnest: the empirical measurement of sediment transport is a function of both transport capacity
and sediment supply, and the latter is likely to be dramatically altered under most potential dam-
removal scenarios. Thus, the current presumption of a threshold of significant transport at a 4-
year event may be overly conservative with respect to the channel’s ability to transport sediment
in a post-dam regime. At this stage in the analyses, however, exploring the consequences of such
an assumption is nonetheless instructive.
A “4-year event” means that over a long period of record, about one-quarter of the years will
express such a flood. However, the prior record of flows on this system suggests that the
variability in time between such events can be quite high. This variability was noted by both BOR
(2006) and Dunne (2013), but it is sufficiently critical to the planning of alternative removal
scenarios that the key points will be summarized here as well.
Analysis of the average daily flows for the Ventura River (gage 11118500) and Matilija Creek
(various gages, with an absence of any data from 1989 through 2001) reveal 26 water years with
at least one event that meets the minimum flow criteria for “significant” sediment transport (i.e.,
average daily flow ≥5,000 cfs at 11118500 and/or one-third of that amount [1,667 cfs] in Matilija
Creek). In all but two instances both criteria were met, and so the distinction between them is not
critical for planning purposes. This averages to slightly more frequent than a 1-in-4-year
occurrence, but the actual gaps between such events vary widely: from 10 years (from 1/15/1952
to 2/9/1962) to as little as 1 year (most recently, from 2005 to 2006, although the 2006 event on
4/4/2006 was one of the two instances where the Ventura River exceeded its threshold [5,930 cfs]
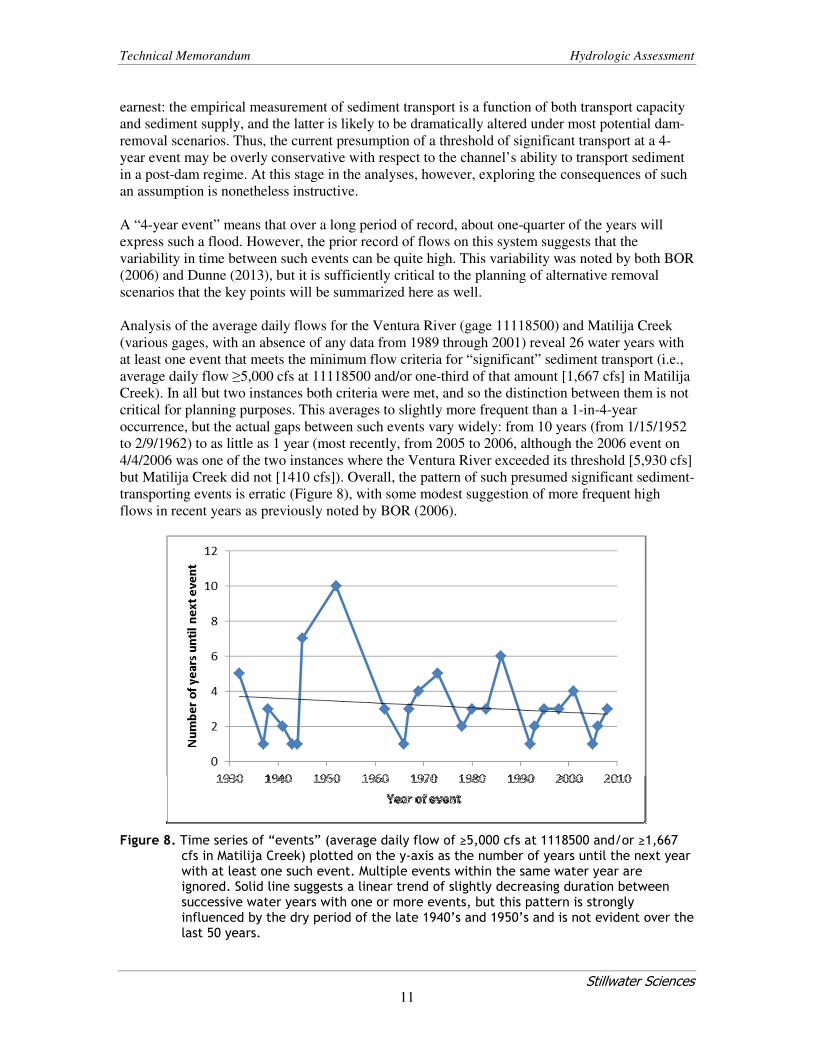
but Matilija Creek did not [1410 cfs]). Overall, the pattern of such presumed significant sediment-
transporting events is erratic (Figure 8), with some modest suggestion of more frequent high
flows in recent years as previously noted by BOR (2006).
Figure 8. Time series of “events” (average daily flow of ≥5,000 cfs at 1118500 and/or ≥1,667 cfs in Matilija Creek) plotted on the y-axis as the number of years until the next year with at least one such event. Multiple events within the same water year are ignored. Solid line suggests a linear trend of slightly decreasing duration between successive water years with one or more events, but this pattern is strongly influenced by the dry period of the late 1940’s and 1950’s and is not evident over the last 50 years.
Technical Memorandum Hydrologic Assessment
Stillwater Sciences
12
On average, 3 to 4 “non-transporting” years have passed between years with sufficient flow to
move a significant sediment flow through the channel network.
4.6 Correlation of High-flow Periods with ENSO Index
Given extended, multi-year periods of dry or nearly dry conditions in the channel network, any
dam-removal scenarios that require advance planning would benefit from an “early warning” of
likely wet weather—not just on the scale of a few days to a week or so (i.e., weather forecasting),
but rather with sufficient time to mobilize equipment and personnel (i.e., many weeks or months).
To that end, the well-recognized association of wet winters in southern California with the El
Niño phase of the Southern Oscillation was explored for its potential utility in predicting
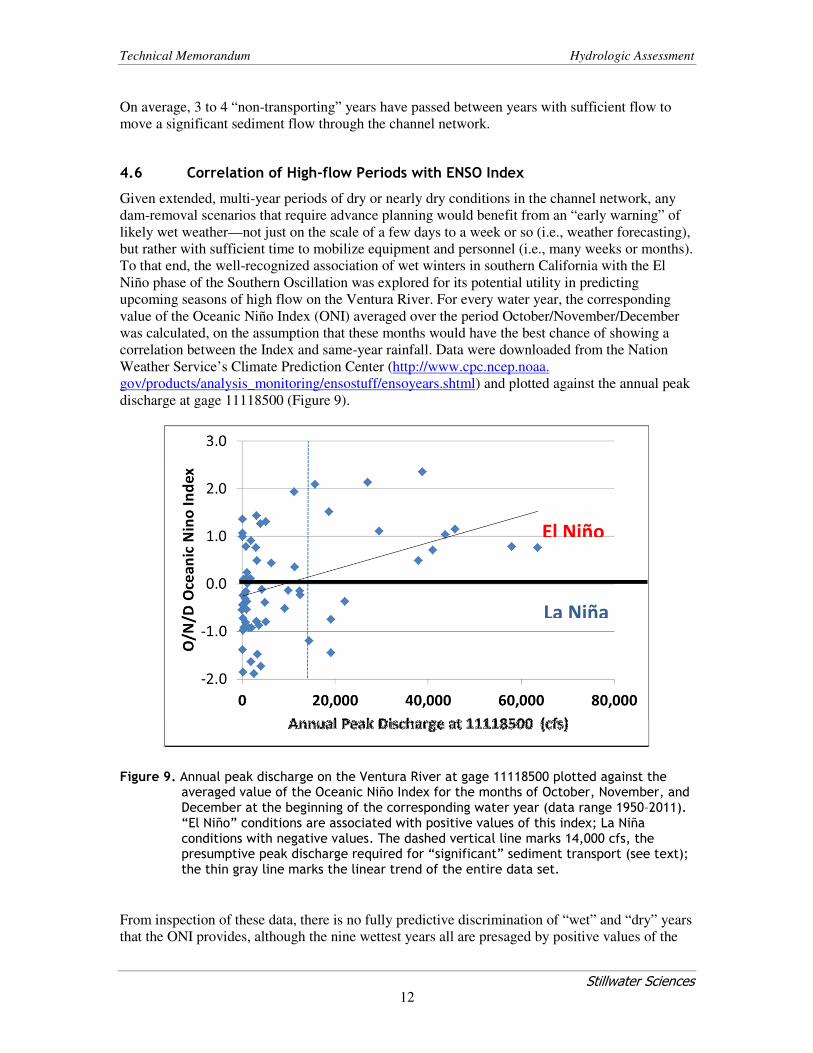
upcoming seasons of high flow on the Ventura River. For every water year, the corresponding
value of the Oceanic Niño Index (ONI) averaged over the period October/November/December
was calculated, on the assumption that these months would have the best chance of showing a
correlation between the Index and same-year rainfall. Data were downloaded from the Nation
Weather Service’s Climate Prediction Center (http://www.cpc.ncep.noaa.
gov/products/analysis_monitoring/ensostuff/ensoyears.shtml) and plotted against the annual peak
discharge at gage 11118500 (Figure 9).
Figure 9. Annual peak discharge on the Ventura River at gage 11118500 plotted against the averaged value of the Oceanic Niño Index for the months of October, November, and December at the beginning of the corresponding water year (data range 1950–2011). “El Niño” conditions are associated with positive values of this index; La Niña conditions with negative values. The dashed vertical line marks 14,000 cfs, the presumptive peak discharge required for “significant” sediment transport (see text); the thin gray line marks the linear trend of the entire data set.
From inspection of these data, there is no fully predictive discrimination of “wet” and “dry” years
that the ONI provides, although the nine wettest years all are presaged by positive values of the
El Niño
La Niña
Technical Memorandum Hydrologic Assessment
Stillwater Sciences
13
index. When the index was positive in the autumn, 11 of 29 years (38%) had a significant
sediment-transporting event. In contrast, those years with negative ONI values have had a
significant transport event in only 4 of 33 years (12%). Thus, significant transport is three times
more likely in years with a positive autumn index—but this has still only occurred a bit more than
1/3 of the time.
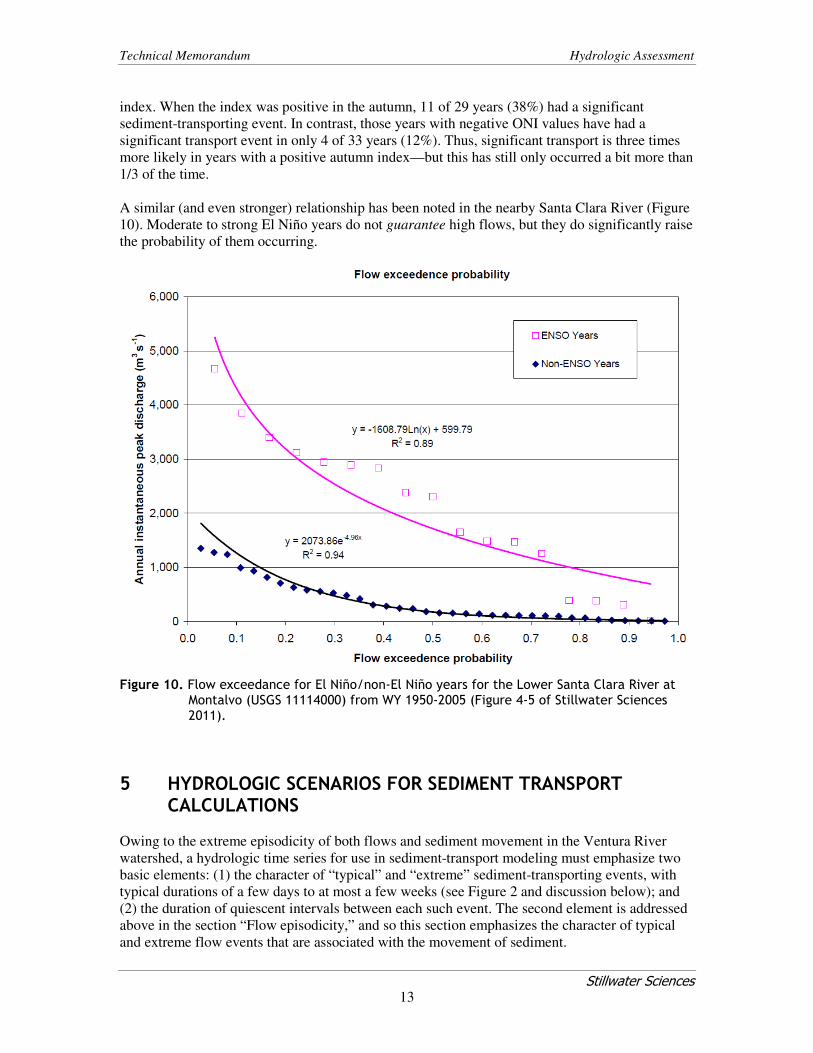
A similar (and even stronger) relationship has been noted in the nearby Santa Clara River (Figure
10). Moderate to strong El Niño years do not guarantee high flows, but they do significantly raise
the probability of them occurring.
Figure 10. Flow exceedance for El Niño/non-El Niño years for the Lower Santa Clara River at Montalvo (USGS 11114000) from WY 1950-2005 (Figure 4-5 of Stillwater Sciences 2011).
5 HYDROLOGIC SCENARIOS FOR SEDIMENT TRANSPORT CALCULATIONS
Owing to the extreme episodicity of both flows and sediment movement in the Ventura River
watershed, a hydrologic time series for use in sediment-transport modeling must emphasize two
basic elements: (1) the character of “typical” and “extreme” sediment-transporting events, with
typical durations of a few days to at most a few weeks (see Figure 2 and discussion below); and
(2) the duration of quiescent intervals between each such event. The second element is addressed
above in the section “Flow episodicity,” and so this section emphasizes the character of typical
and extreme flow events that are associated with the movement of sediment.
Technical Memorandum Hydrologic Assessment
Stillwater Sciences
14
Choosing “typical” and “extreme” flow conditions can follow a variety of alternative approaches.
BOR (2006), for example, noted that “The hydrology is such that an average year is atypical. It is
more likely that the annual discharge is greater or less than the average” (p. 45). It identified
“wet” (1969), “dry” (1948), and “average” (1991) years for flows at Matilija Creek gage
11115500, considering both average and maximum daily discharges relative to minima and
maxima over the period of record (for the dry and wet years) and the arithmetic mean of flows
relative to the average flow for each year (Figures 2.9 and 2.10 in BOR 2006). For purposes of
identifying representative full-year hydrographs, no substantive changes need be made to this
analysis; and at this stage in the overall project, BOR’s (2006) recommendations for the choice of
full-year hydrographs are accepted without modification.
A closer look at the 1969 record provides further support for following BOR’s (2006) choice of
this water year as representative of a “wet” year, given the Scope of Work’s specification for
defining a “50-year event.” The plotting position for the annual flood of 1969 is the closest
approximation to a 50-year event in the record (see Figure 6, being the second-largest discharge
over 80 years). As with all of the highest peak discharges recorded at gage 11118500, however,
the magnitude of this peak is significantly below the eRAMS projection of flood magnitude for
this recurrence. Even the flood of record over the past 80 years at this gage (63,600 cfs on
2/10/1978) lies below a projected 25-year recurrence, suggesting that the upper tail of the
distribution at this gage is not well-represented by the Bulletin 17B methodology (see also BOR
2006, p. 42). This is likely true of the flood-frequency distribution on Matilija Creek as well,
wherein the corresponding peak discharge for 1969 (20,000 cfs at gage 11115500, the flood of
record over the 34-year lifetime of this gage) rates as less than a 20-year discharge as calculated
by Bulletin 17B (and also as implemented by eRAMS), based on either the full gage 11115500
record or the shorter (but more current) record of 11114495 (Figure 7).
In the context of sediment transport for dam removal, however, the analysis of representative
hydrographs can benefit from an expanded focus on typical and extreme events rather than full-
year hydrographs. Such events are defined as having likely initiated some degree of significant
sediment transport in the mainstem Ventura River by virtue of average daily flows ≥5,000 cfs
(see above, based on the record of measured suspended sediment loads at the gage) and/or
reported sediment removal at the Robles Diversion (presumably reflecting some significant
degree of bedload transport). For purposes of identifying such events, the full record of daily
average flows at gage 11118500 was filtered to identify all instances of at least one average daily
discharge exceeding 2,000 cfs (as a conservative, inclusive threshold), and including all
contiguous days before and after this ≥2,000 cfs value with a discharge of at least 200 cfs, in
order to capture the “tails” of the peak flow event. Years with multiple such “events” separated
by brief intervals of low flow were generally plotted as multiple events, but any such
discrimination is somewhat arbitrary (and ultimately irrelevant for any future analyses using a
continuous flow series). The raw data are graphed in Figure 11.
A concept within the overall strategy of sediment-transport modeling that may influence the final
selection of hydrologic years for model input is that some scenarios may include human control
on when to initiate a post-dam removal sediment transport event. For example, an upstream
cofferdam might be constructed and maintained following dam removal to prevent the erosion of
reservoir deposit during relatively small flows until the discharge in Matilija Creek reaches a
designed threshold that breaches the cofferdam. Under such a design concept, the “dry” year
would be selected to the year with the smallest storm event with a discharge exceeding the
designed threshold discharge for cofferdam breaching, and “average” and “dry” years would need
Technical Memorandum Hydrologic Assessment
Stillwater Sciences
15
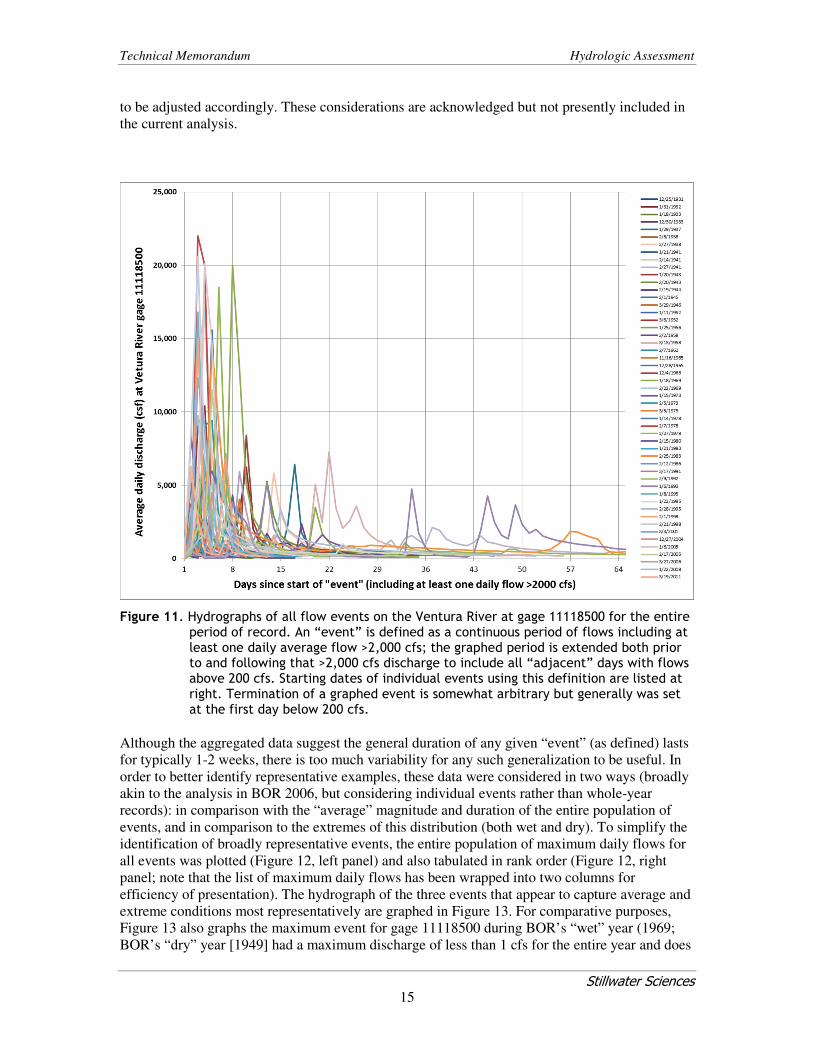
to be adjusted accordingly. These considerations are acknowledged but not presently included in
the current analysis.
Figure 11. Hydrographs of all flow events on the Ventura River at gage 11118500 for the entire period of record. An “event” is defined as a continuous period of flows including at least one daily average flow >2,000 cfs; the graphed period is extended both prior to and following that >2,000 cfs discharge to include all “adjacent” days with flows above 200 cfs. Starting dates of individual events using this definition are listed at right. Termination of a graphed event is somewhat arbitrary but generally was set at the first day below 200 cfs.
Although the aggregated data suggest the general duration of any given “event” (as defined) lasts
for typically 1-2 weeks, there is too much variability for any such generalization to be useful. In
order to better identify representative examples, these data were considered in two ways (broadly
akin to the analysis in BOR 2006, but considering individual events rather than whole-year
records): in comparison with the “average” magnitude and duration of the entire population of
events, and in comparison to the extremes of this distribution (both wet and dry). To simplify the
identification of broadly representative events, the entire population of maximum daily flows for
all events was plotted (Figure 12, left panel) and also tabulated in rank order (Figure 12, right
panel; note that the list of maximum daily flows has been wrapped into two columns for
efficiency of presentation). The hydrograph of the three events that appear to capture average and
extreme conditions most representatively are graphed in Figure 13. For comparative purposes,
Figure 13 also graphs the maximum event for gage 11118500 during BOR’s “wet” year (1969;
BOR’s “dry” year [1949] had a maximum discharge of less than 1 cfs for the entire year and does
Technical Memorandum Hydrologic Assessment
Stillwater Sciences
16
not show at this scale; the maximum flow that occurred during BOR’s “average” year [1991] is
also shown, but here as inclusive of a typical “dry” sediment-transporting event).
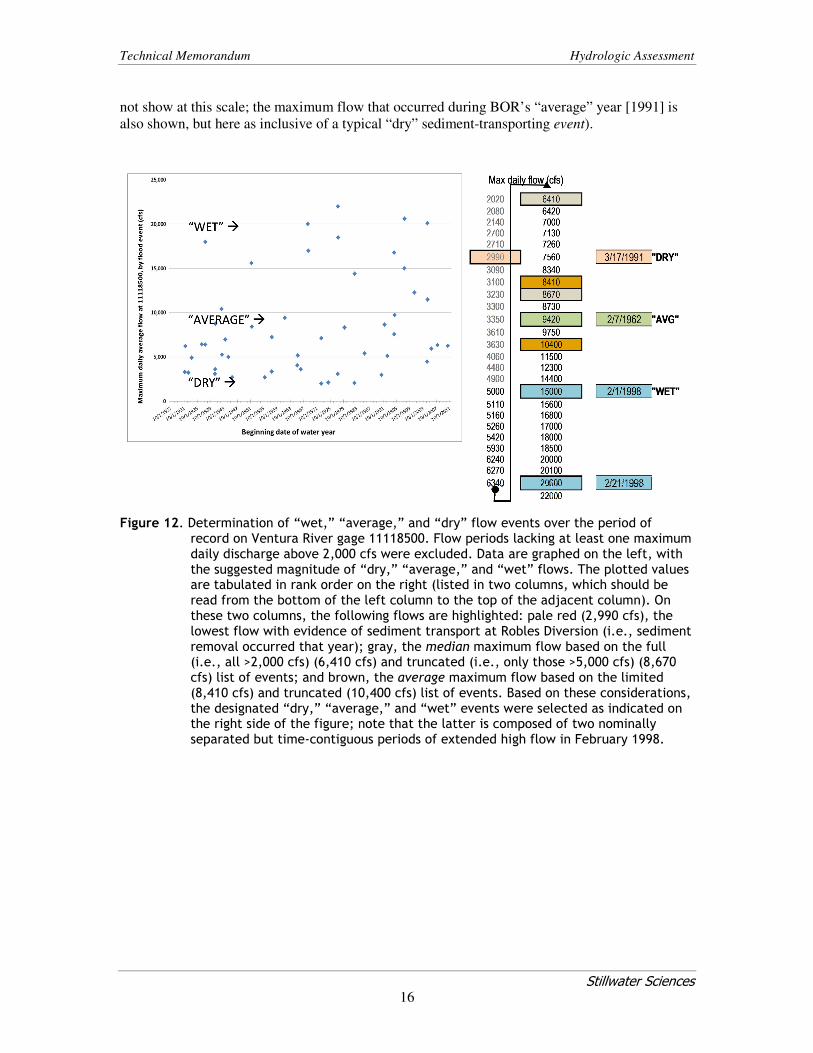
Figure 12. Determination of “wet,” “average,” and “dry” flow events over the period of
record on Ventura River gage 11118500. Flow periods lacking at least one maximum daily discharge above 2,000 cfs were excluded. Data are graphed on the left, with the suggested magnitude of “dry,” “average,” and “wet” flows. The plotted values are tabulated in rank order on the right (listed in two columns, which should be read from the bottom of the left column to the top of the adjacent column). On these two columns, the following flows are highlighted: pale red (2,990 cfs), the lowest flow with evidence of sediment transport at Robles Diversion (i.e., sediment removal occurred that year); gray, the median maximum flow based on the full (i.e., all >2,000 cfs) (6,410 cfs) and truncated (i.e., only those >5,000 cfs) (8,670 cfs) list of events; and brown, the average maximum flow based on the limited (8,410 cfs) and truncated (10,400 cfs) list of events. Based on these considerations, the designated “dry,” “average,” and “wet” events were selected as indicated on the right side of the figure; note that the latter is composed of two nominally separated but time-contiguous periods of extended high flow in February 1998.
Technical Memorandum Hydrologic Assessment
Stillwater Sciences
17
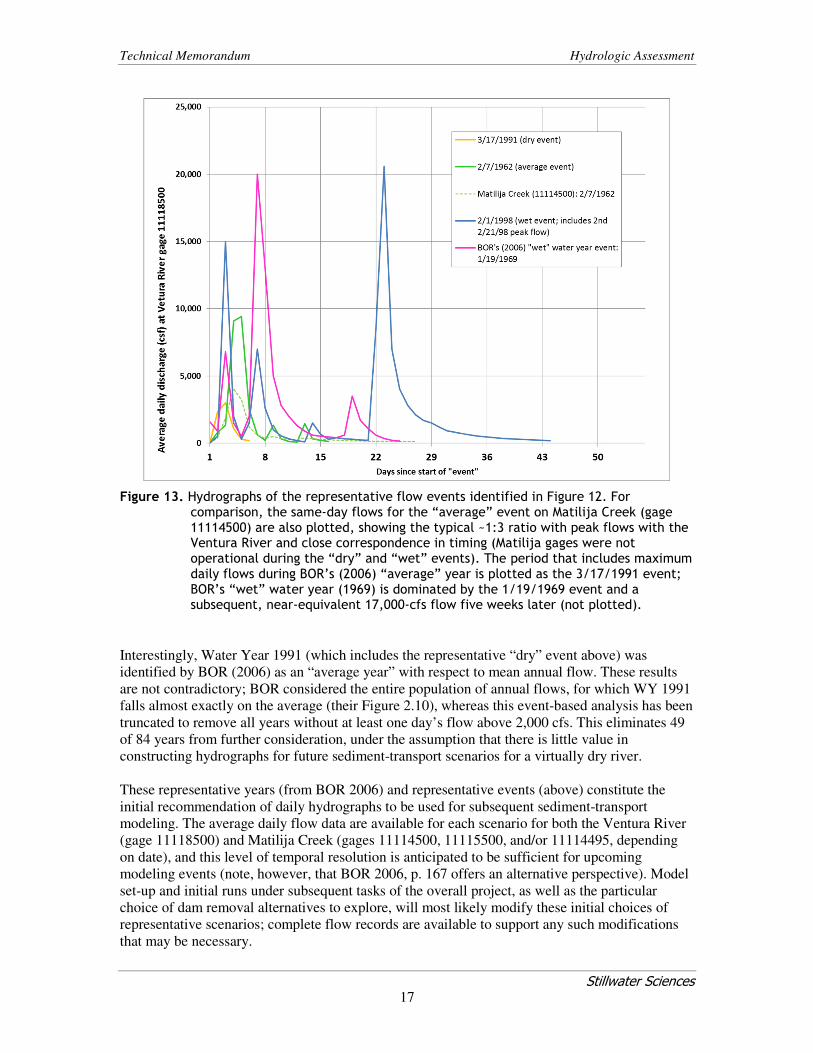
Figure 13. Hydrographs of the representative flow events identified in Figure 12. For comparison, the same-day flows for the “average” event on Matilija Creek (gage 11114500) are also plotted, showing the typical ~1:3 ratio with peak flows with the Ventura River and close correspondence in timing (Matilija gages were not operational during the “dry” and “wet” events). The period that includes maximum daily flows during BOR’s (2006) “average” year is plotted as the 3/17/1991 event; BOR’s “wet” water year (1969) is dominated by the 1/19/1969 event and a subsequent, near-equivalent 17,000-cfs flow five weeks later (not plotted).
Interestingly, Water Year 1991 (which includes the representative “dry” event above) was
identified by BOR (2006) as an “average year” with respect to mean annual flow. These results
are not contradictory; BOR considered the entire population of annual flows, for which WY 1991
falls almost exactly on the average (their Figure 2.10), whereas this event-based analysis has been
truncated to remove all years without at least one day’s flow above 2,000 cfs. This eliminates 49
of 84 years from further consideration, under the assumption that there is little value in
constructing hydrographs for future sediment-transport scenarios for a virtually dry river.
These representative years (from BOR 2006) and representative events (above) constitute the
initial recommendation of daily hydrographs to be used for subsequent sediment-transport
modeling. The average daily flow data are available for each scenario for both the Ventura River
(gage 11118500) and Matilija Creek (gages 11114500, 11115500, and/or 11114495, depending
on date), and this level of temporal resolution is anticipated to be sufficient for upcoming
modeling events (note, however, that BOR 2006, p. 167 offers an alternative perspective). Model
set-up and initial runs under subsequent tasks of the overall project, as well as the particular
choice of dam removal alternatives to explore, will most likely modify these initial choices of
representative scenarios; complete flow records are available to support any such modifications
that may be necessary.
Technical Memorandum Hydrologic Assessment
Stillwater Sciences
18
6 REFERENCES
Booth, D.B., Cui, Y., Diggory, Z., Pedersen, D., Kear, J., and Bowen, M. 2013. Determining
appropriate instream flows for anadromous fish passage on an intermittent mainstem river,
coastal southern California, USA. Ecohydrology 7(2): 745–759.
Bureau of Reclamation (BOR). 2006. Hydrology, Hydraulics, and Sediment Studies for the
Matilija Dam Ecosystem Restoration Project, Ventura, CA – DRAFT Report. November 2006,
323 pp.
Dunne, T. 2013. Stochastic Aspects of Sediment Management Associated With Matilija Dam
Removal. Informal memo to Technical Advisory Committee, 9 pp.
Lavé, J. and D. Burbank. 2004. Denudation processes and rates in the Transverse Ranges,
southern California: erosional response of a transitional landscape to external and anthropogenic
forcing. Journal of Geophysical Research 109: F01006, doi:01010.01029/02003JF000023.
Stillwater Sciences. 2011. Geomorphic assessment of the Santa Clara River watershed: synthesis
of the lower and upper watershed studies, Ventura and Los Angeles counties, California. Prepared
by Stillwater Sciences, Berkeley, California for Ventura County Watershed Protection District,
Los Angeles County Department of Public Works, and the U.S. Army Corps of Engineers–L.A.
District.
Stillwater Sciences and Kear Groundwater. 2012. Santa Maria River Instream Flow Study: flow
recommendations for steelhead passage. Final Report. Prepared by Stillwater Sciences, Santa
Barbara, California; and Kear Groundwater, Santa Barbara, California for California Ocean
Protection Council, Oakland, California; and California Department of Fish and Game,
Sacramento, California.
Warrick, J. A., and L. A. K. Mertes. 2009. Sediment yield from the tectonically active semiarid
western Transverse Ranges of California. Geological Society of America Bulletin 121: 1054–
1070.