Embed Size (px)
Citation preview
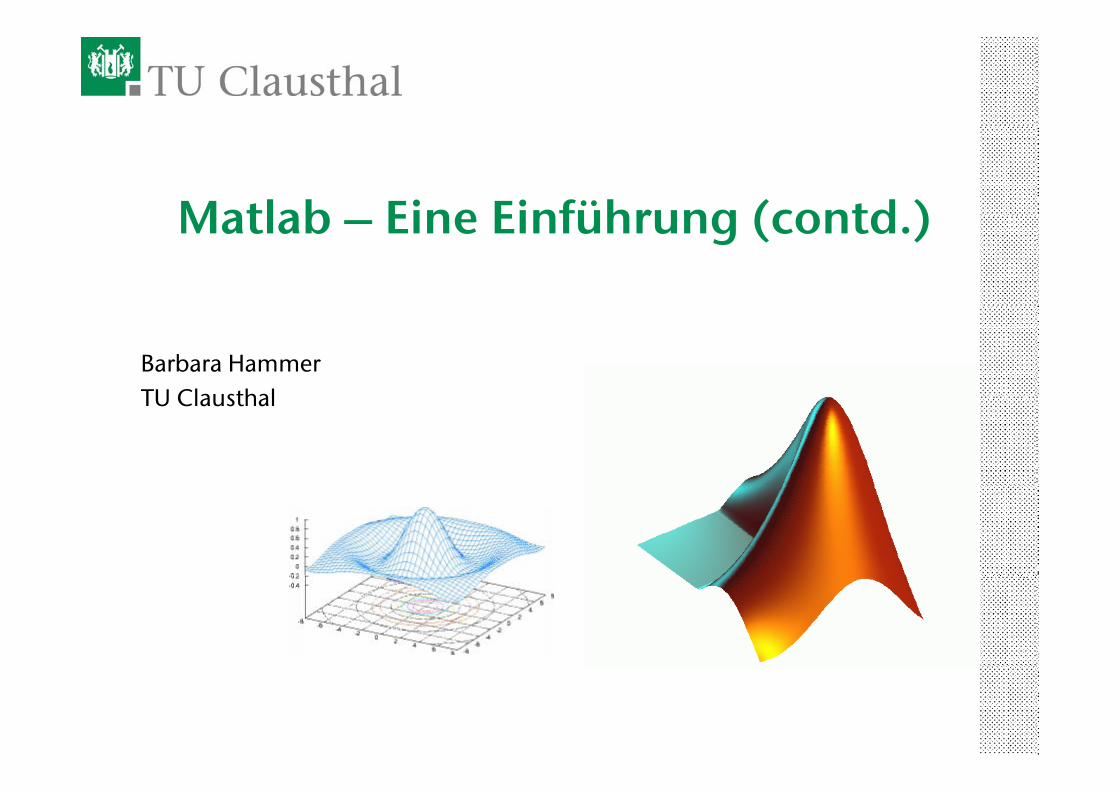
Matlab Eine Einführung (contd )Matlab – Eine Einführung (contd.)
Barbara HammerTU ClausthalTU Clausthal
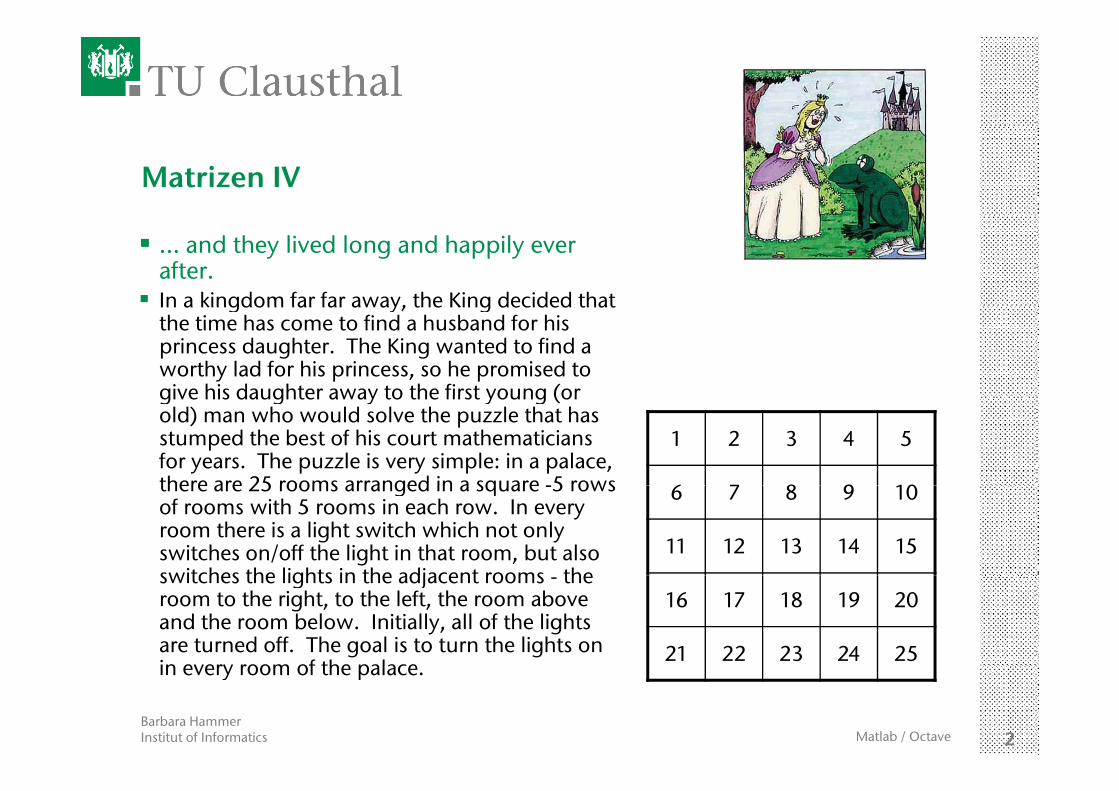
Matrizen IV
... and they lived long and happily ever after.In a kingdom far far away, the King decided thatIn a kingdom far far away, the King decided that the time has come to find a husband for his princess daughter. The King wanted to find a worthy lad for his princess, so he promised to give his daughter away to the first young (orgive his daughter away to the first young (or old) man who would solve the puzzle that has stumped the best of his court mathematicians for years. The puzzle is very simple: in a palace, there are 25 rooms arranged in a square -5 rows
1 2 3 4 5
6 7 8 9 10there are 25 rooms arranged in a square -5 rows of rooms with 5 rooms in each row. In every room there is a light switch which not only switches on/off the light in that room, but also switches the lights in the adjacent rooms the
6 7 8 9 10
11 12 13 14 15switches the lights in the adjacent rooms - the room to the right, to the left, the room above and the room below. Initially, all of the lights are turned off. The goal is to turn the lights on in every room of the palace
16 17 18 19 20
21 22 23 24 25
Barbara HammerInstitut of Informatics 2Matlab / Octave
in every room of the palace.
Matrizen IV
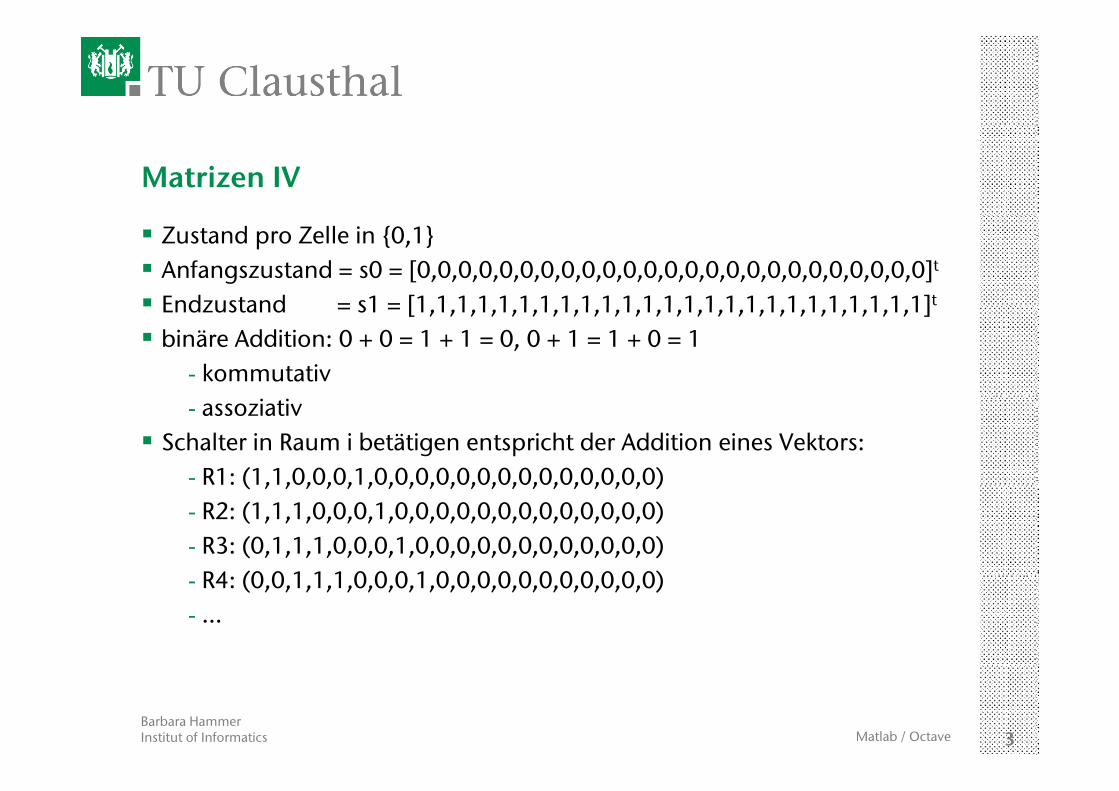
Zustand pro Zelle in {0,1}Anfangszustand = s0 = [0,0,0,0,0,0,0,0,0,0,0,0,0,0,0,0,0,0,0,0,0,0,0,0,0]t
Endzustand = s1 = [1 1 1 1 1 1 1 1 1 1 1 1 1 1 1 1 1 1 1 1 1 1 1 1 1]tEndzustand = s1 = [1,1,1,1,1,1,1,1,1,1,1,1,1,1,1,1,1,1,1,1,1,1,1,1,1]binäre Addition: 0 + 0 = 1 + 1 = 0, 0 + 1 = 1 + 0 = 1
- kommutativ- assoziativ
Schalter in Raum i betätigen entspricht der Addition eines Vektors:- R1: (1,1,0,0,0,1,0,0,0,0,0,0,0,0,0,0,0,0,0,0)( , , , , , , , , , , , , , , , , , , , )- R2: (1,1,1,0,0,0,1,0,0,0,0,0,0,0,0,0,0,0,0,0)- R3: (0,1,1,1,0,0,0,1,0,0,0,0,0,0,0,0,0,0,0,0)
R4 (0 0 1 1 1 0 0 0 1 0 0 0 0 0 0 0 0 0 0 0)- R4: (0,0,1,1,1,0,0,0,1,0,0,0,0,0,0,0,0,0,0,0)- …
Barbara HammerInstitut of Informatics 3Matlab / Octave
Matrizen IV
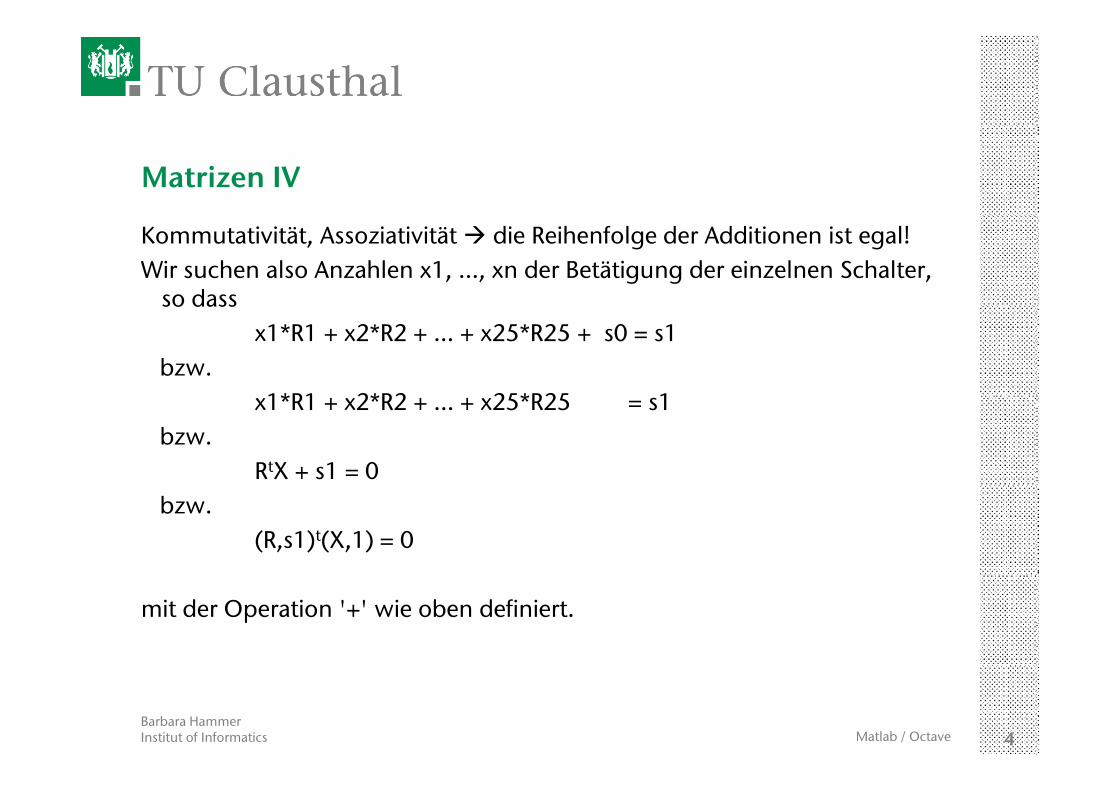
Kommutativität, Assoziativität die Reihenfolge der Additionen ist egal!Wir suchen also Anzahlen x1, …, xn der Betätigung der einzelnen Schalter,
so dassso dassx1*R1 + x2*R2 + … + x25*R25 + s0 = s1
bzw.1*R1 2*R2 25*R25 1x1*R1 + x2*R2 + … + x25*R25 = s1
bzw.RtX + s1 = 0
bzw.(R,s1)t(X,1) = 0
mit der Operation '+' wie oben definiert.
Barbara HammerInstitut of Informatics 4Matlab / Octave
Matrizen IV
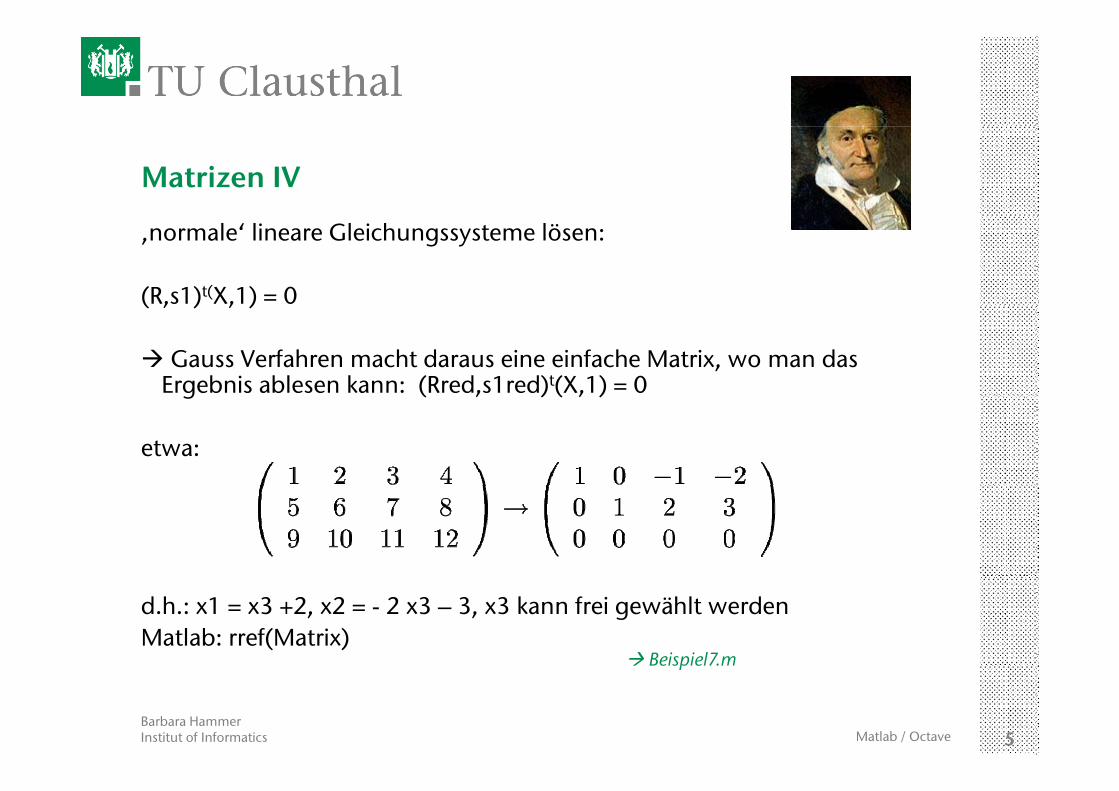
‚normale‘ lineare Gleichungssysteme lösen:
(R,s1)t(X,1) = 0 ( , ) , )
Gauss Verfahren macht daraus eine einfache Matrix, wo man das Ergebnis ablesen kann: (Rred,s1red)t(X,1) = 0 g ( , ) ( , )
etwa:
d.h.: x1 = x3 +2, x2 = - 2 x3 – 3, x3 kann frei gewählt werdenMatlab: rref(Matrix)
Beispiel7.m
Barbara HammerInstitut of Informatics 5Matlab / Octave
Beispiel7.m
Matrizen IV
lineare Gleichungssysteme modulo 2 lösen?Mathematik sagt: dasselbe modulo 2 rechnen
rref aus (C:\Programme\MATLAB\R2007a)\toolbox\matlab\matfunc\rref.m kopieren und abändern!kopieren und abändern!
Barbara HammerInstitut of Informatics 6Matlab / Octave
Matrizen IV
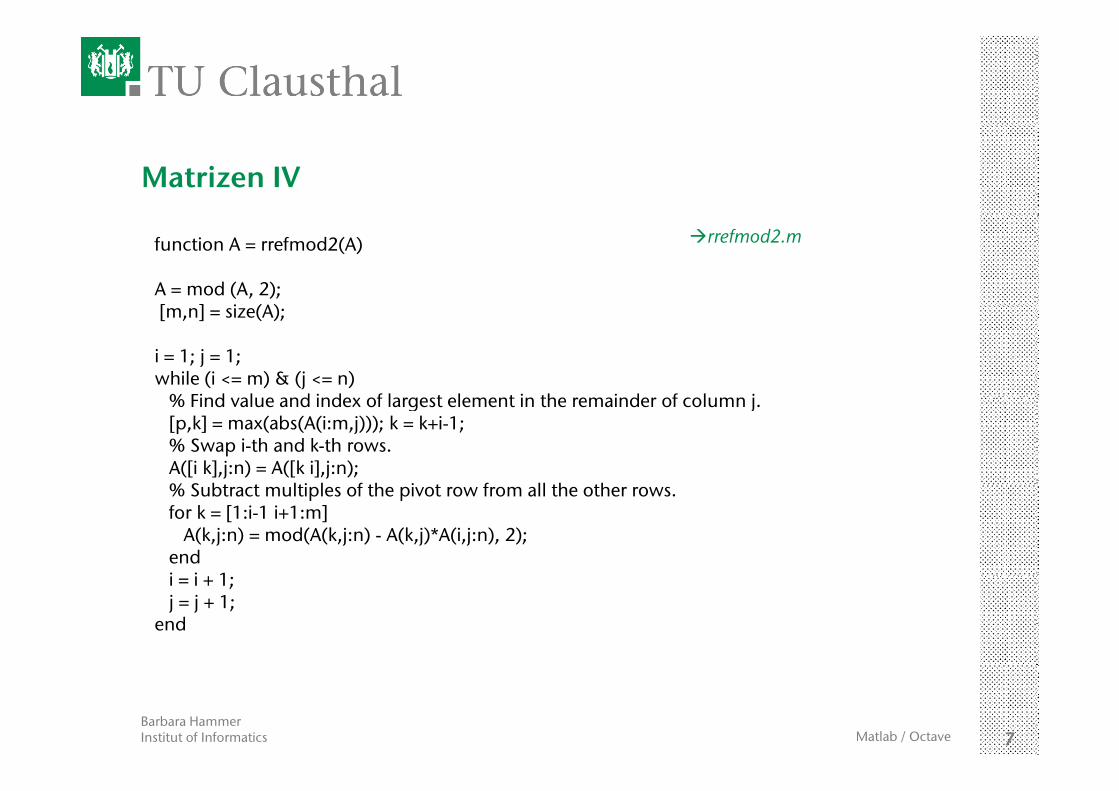
function A = rrefmod2(A)
A = mod (A, 2);[ ] i (A)
rrefmod2.m
[m,n] = size(A);
i = 1; j = 1;while (i <= m) & (j <= n)
% Fi d l d i d f l t l t i th i d f l j% Find value and index of largest element in the remainder of column j.[p,k] = max(abs(A(i:m,j))); k = k+i-1;% Swap i-th and k-th rows.A([i k],j:n) = A([k i],j:n);% S bt t lti l f th i t f ll th th% Subtract multiples of the pivot row from all the other rows.for k = [1:i-1 i+1:m]
A(k,j:n) = mod(A(k,j:n) - A(k,j)*A(i,j:n), 2);endi i 1i = i + 1;j = j + 1;
end
Barbara HammerInstitut of Informatics 7Matlab / Octave
Matrizen IV
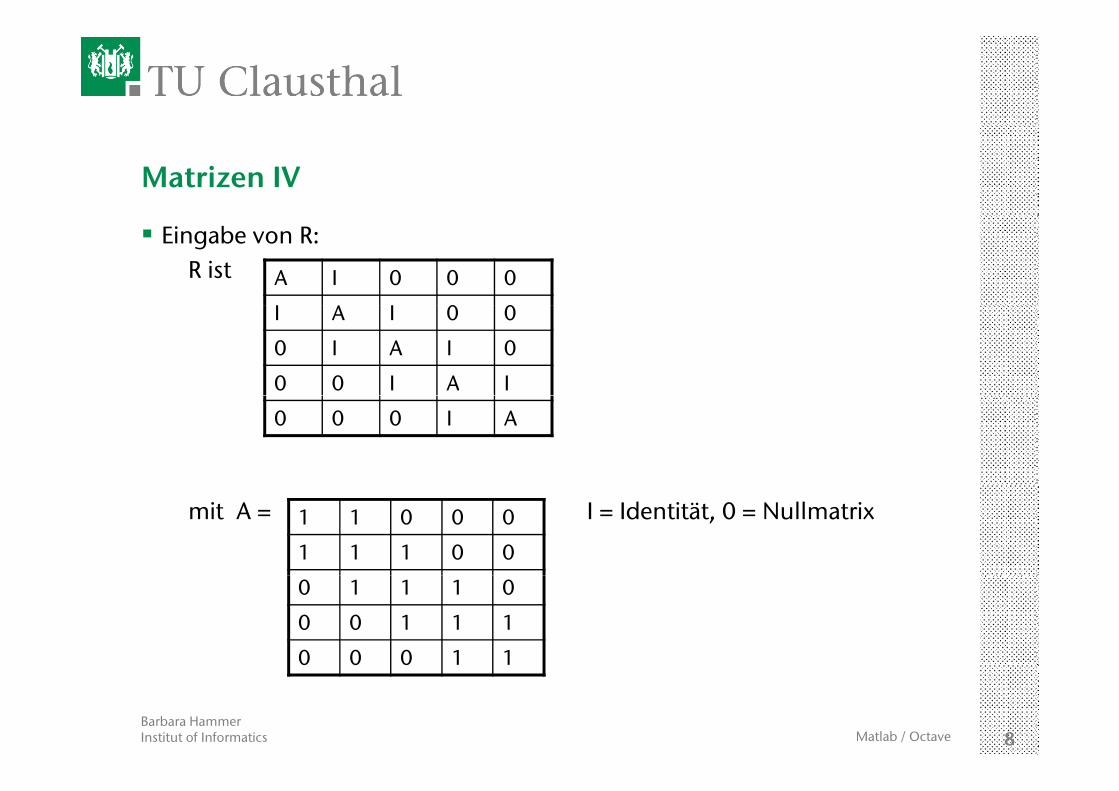
Eingabe von R:R ist A I 0 0 0
I A I 0 0I A I 0 0
0 I A I 0
0 0 I A I
0 0 0 I A
mit A = I = Identität, 0 = Nullmatrix1 1 0 0 0
1 1 1 0 0
0 1 1 1 0
0 0 1 1 1
0 0 0 1 1
Barbara HammerInstitut of Informatics 8Matlab / Octave
0 0 0
Matrizen IVBeispiel8 m
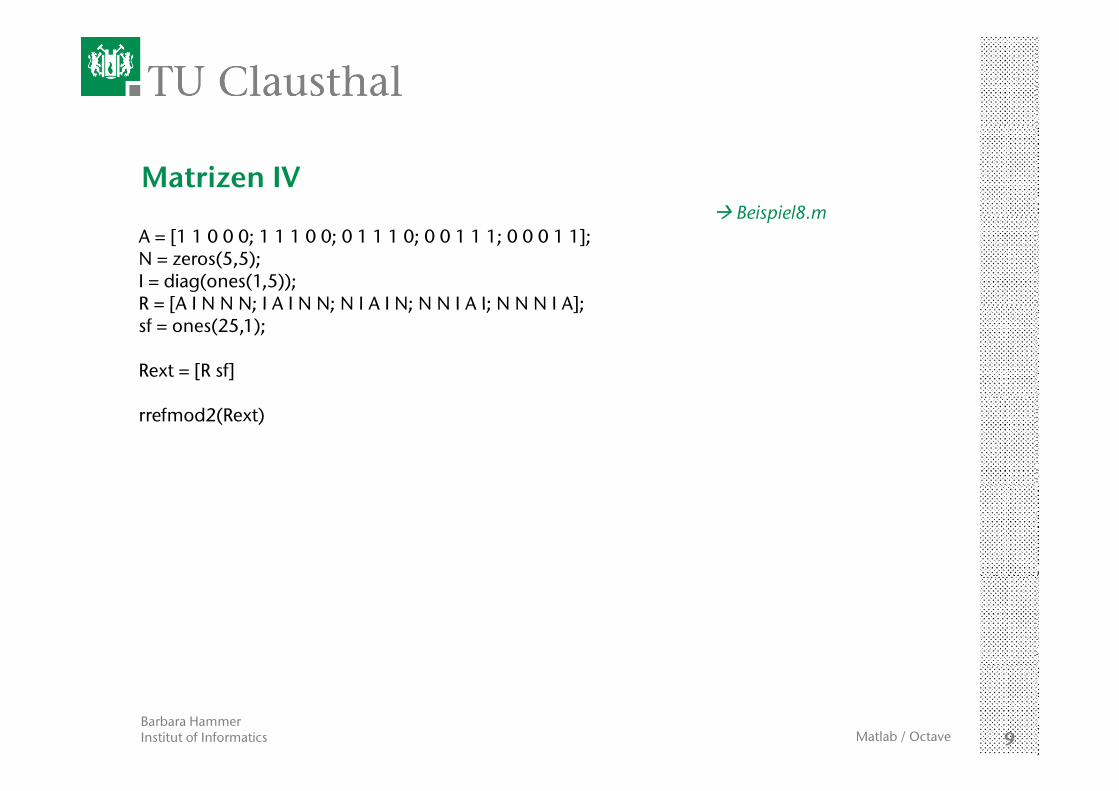
A = [1 1 0 0 0; 1 1 1 0 0; 0 1 1 1 0; 0 0 1 1 1; 0 0 0 1 1];N = zeros(5,5);I = diag(ones(1,5));R = [A I N N N; I A I N N; N I A I N; N N I A I; N N N I A];
Beispiel8.m
R = [A I N N N; I A I N N; N I A I N; N N I A I; N N N I A];sf = ones(25,1);
Rext = [R sf]
rrefmod2(Rext)
Barbara HammerInstitut of Informatics 9Matlab / Octave
Matrizen IV 0 1 01 0 11 1 11 0 0
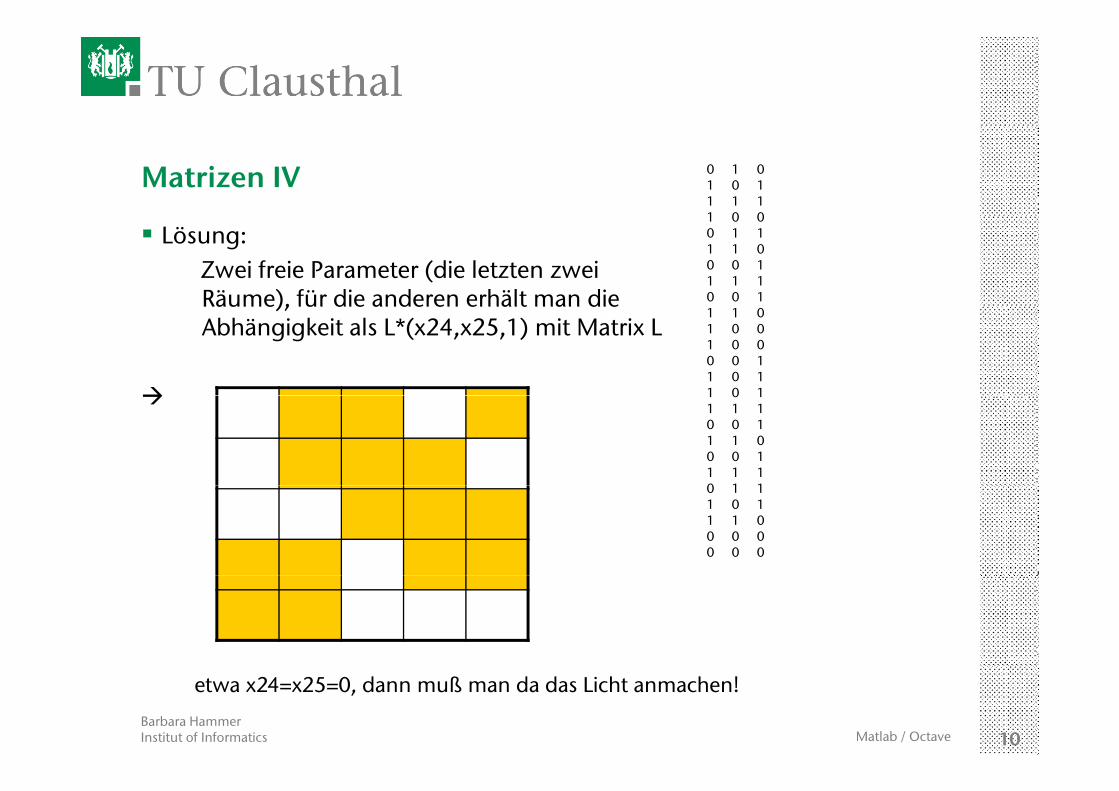
Lösung: Zwei freie Parameter (die letzten zwei Räume), für die anderen erhält man die
1 0 00 1 11 1 00 0 11 1 10 0 1Räume), für die anderen erhält man die
Abhängigkeit als L*(x24,x25,1) mit Matrix L1 1 01 0 01 0 00 0 11 0 11 0 11 0 11 1 10 0 11 1 00 0 11 1 10 1 10 1 11 0 11 1 00 0 00 0 0
Barbara HammerInstitut of Informatics 10Matlab / Octave
etwa x24=x25=0, dann muß man da das Licht anmachen!
Grafik IBeispiel9 m
Es werde Licht.Die Illumination des Palastes durch den glücklichen Prinzen soll visualisiert werden.
Beispiel9.m
visualisiert werden.Darstellung von Matrizen/Bitmaps:
- image(matrix)F b l ( ) d fi i t t J t (bl t) G- Farben: colormap(..), vordefiniert etwa Jet (blau rot), Gray (schwarz weiss) , Lines (gemischt)
- Achsen, Skalierung, Beschriftungen etc. können gesetzt werden
Barbara HammerInstitut of Informatics 11Matlab / Octave
Grafik IBeispiel10 m
Objekte erscheinen in Figures - figure, figure(h), h=figure erzeugt ein Fenster für die Grafik mit
Referenz h
Beispiel10.m
Referenz h- falls h schon existiert, wird durch diesen Befehl die Grafik die aktuelle
Jedes Grafik-Objekt erscheint in der aktuellen Figure, es hat ebenfalls eine eindeutige Referenzeindeutige Referenz
- ein neues Objekt überschreibt ein altes per default- umschalten:
- hold on zufügen - hold off überschreiben
- durch die Referenzen kann man Objekteigenschaften erfragen und t ( t t)setzen (get, set)
Barbara HammerInstitut of Informatics 12Matlab / Octave
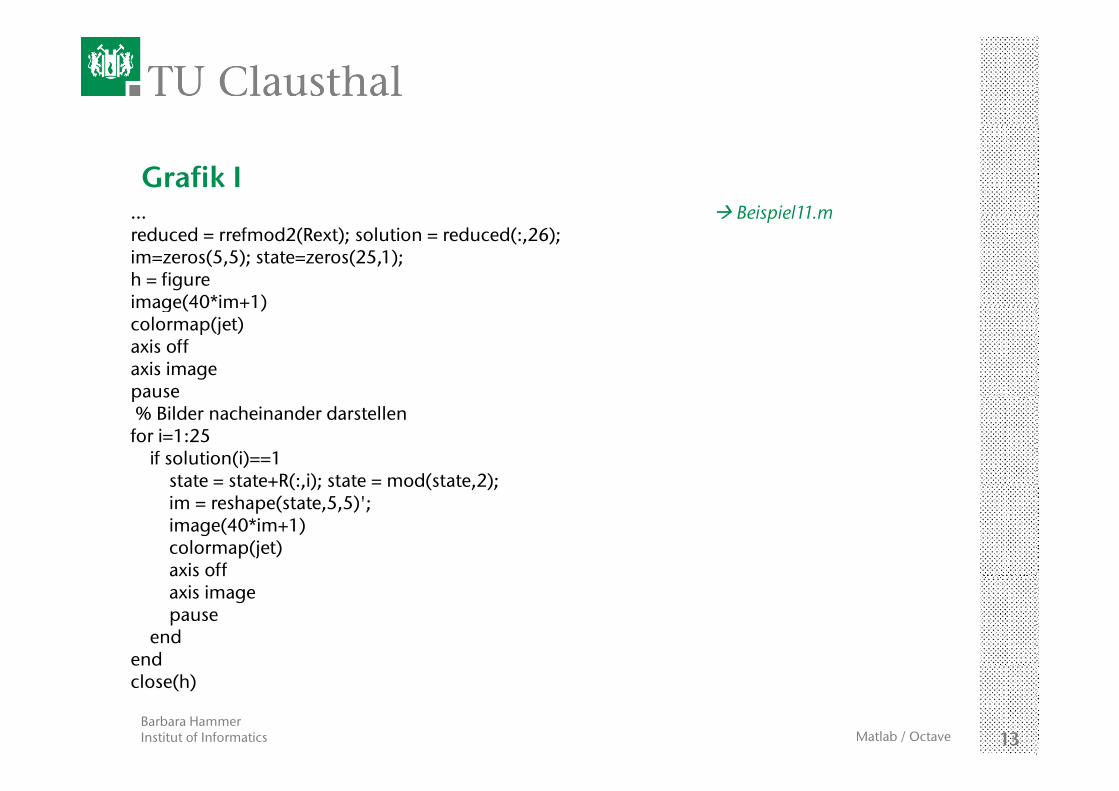
Grafik IBeispiel11 m…
reduced = rrefmod2(Rext); solution = reduced(:,26);im=zeros(5,5); state=zeros(25,1);h = figureimage(40*im+1)
Beispiel11.m
image(40 im+1)colormap(jet)axis offaxis imagepausepause% Bilder nacheinander darstellenfor i=1:25
if solution(i)==1state = state+R(:,i); state = mod(state,2);state state+R(:,i); state mod(state,2);im = reshape(state,5,5)';image(40*im+1)colormap(jet)axis offaxis offaxis imagepause
endend
Barbara HammerInstitut of Informatics 13Matlab / Octave
endclose(h)
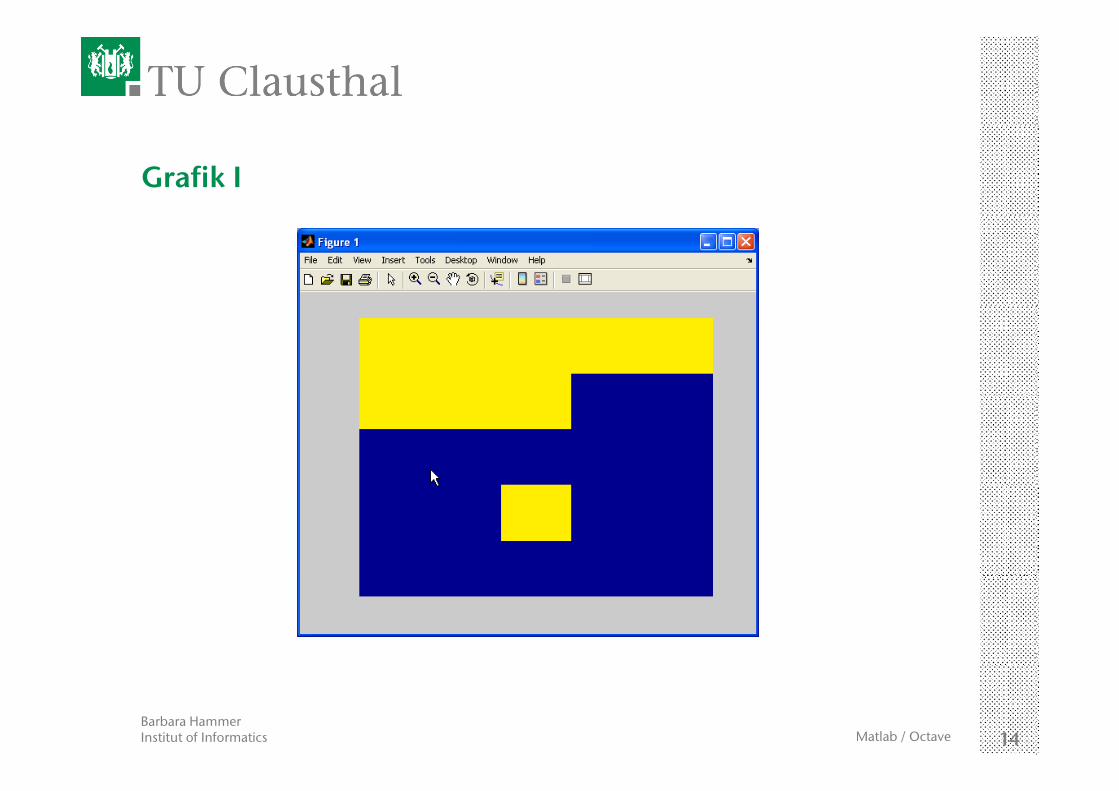
Grafik I
Barbara HammerInstitut of Informatics 14Matlab / Octave
Grafik I Beispiel12.m
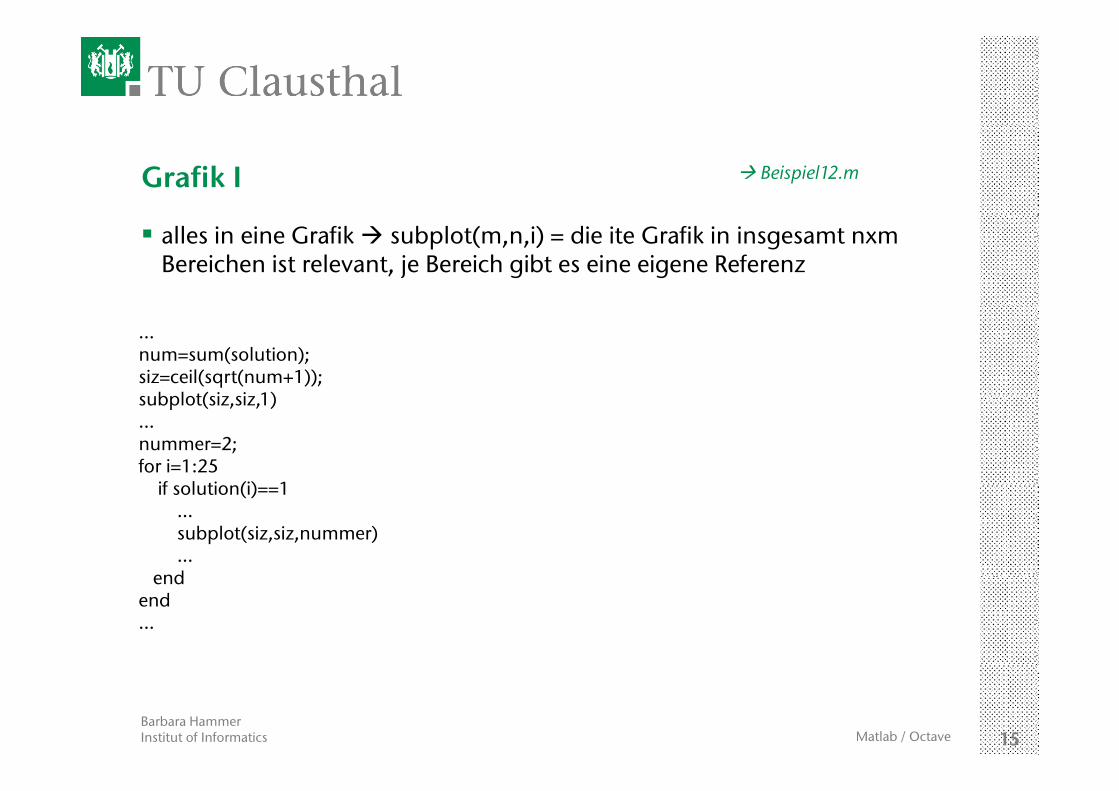
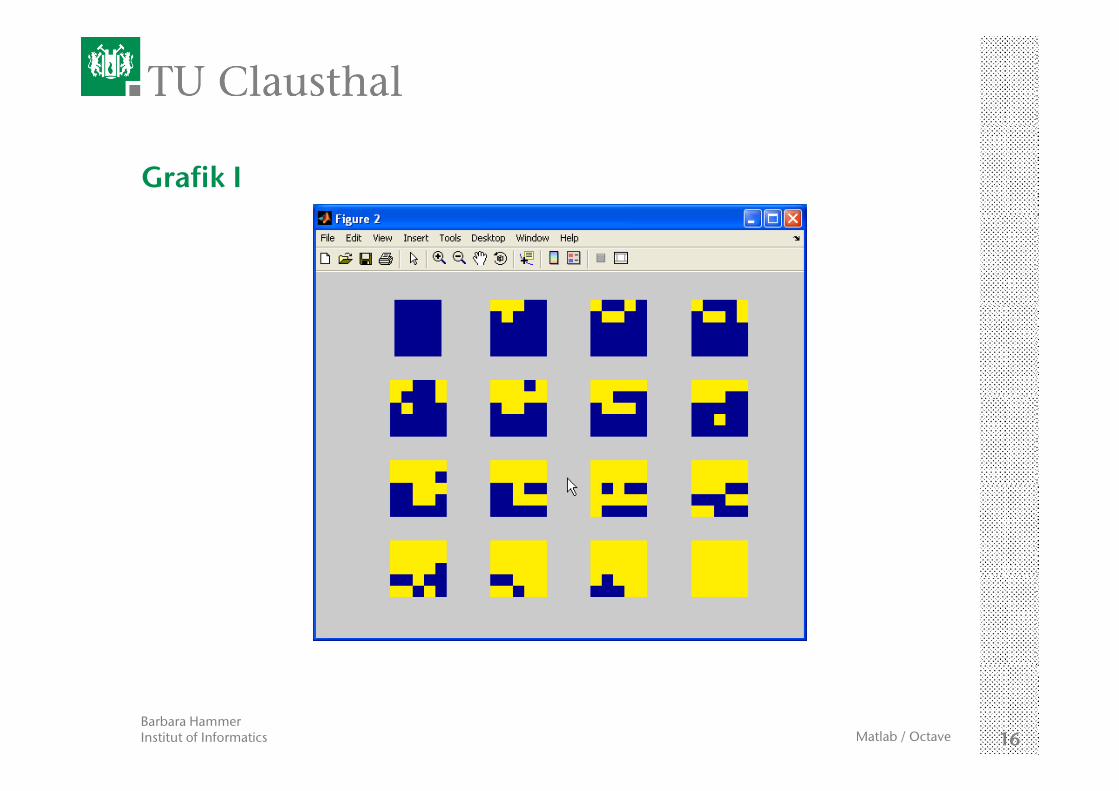
alles in eine Grafik subplot(m,n,i) = die ite Grafik in insgesamt nxm Bereichen ist relevant, je Bereich gibt es eine eigene Referenz
…num=sum(solution);siz=ceil(sqrt(num+1));
b l t( i i 1)subplot(siz,siz,1)…nummer=2; for i=1:25
if sol tion(i) 1if solution(i)==1…subplot(siz,siz,nummer)…
endendend…
Barbara HammerInstitut of Informatics 15Matlab / Octave
Grafik I
Barbara HammerInstitut of Informatics 16Matlab / Octave
n intern iterativ0 0 0000 0 0000
Grafik II
0 0.0000 0.000010.0000 0.0001 0.000420.0000 0.0001 0.002630.0000 0.0002 0.007540 0000 0 0004 0 0168
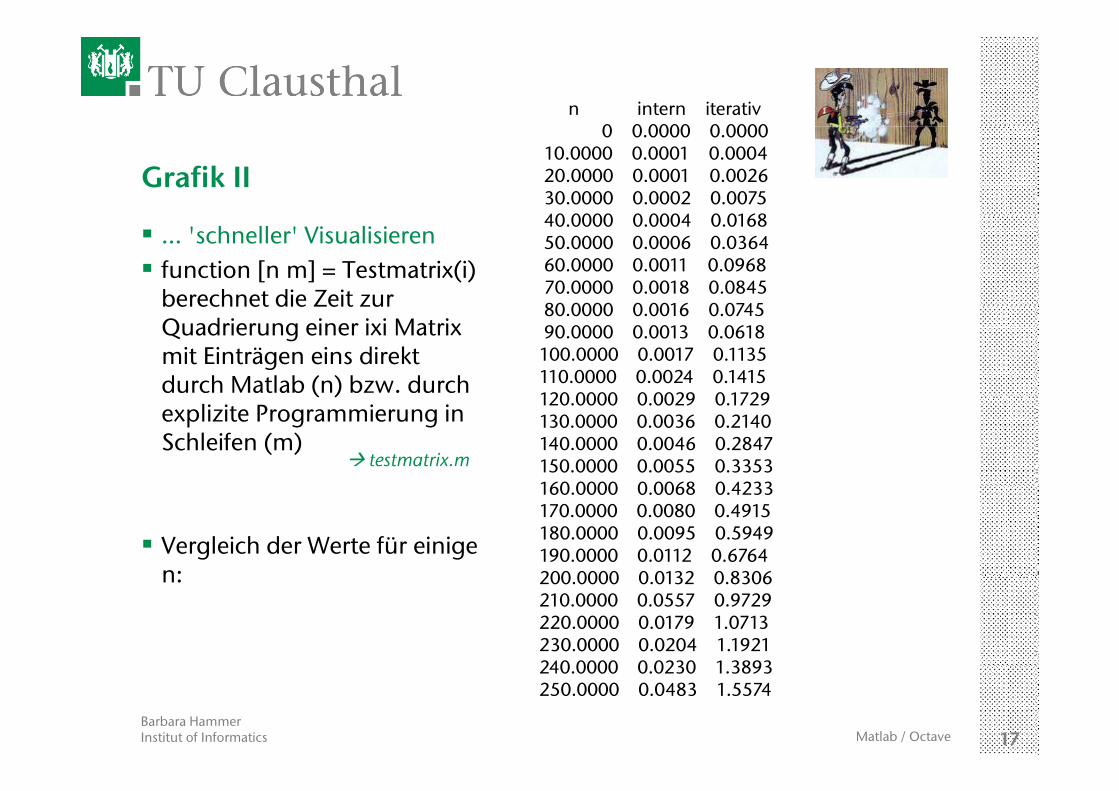
… 'schneller' Visualisierenfunction [n m] = Testmatrix(i) berechnet die Zeit zur
40.0000 0.0004 0.016850.0000 0.0006 0.036460.0000 0.0011 0.096870.0000 0.0018 0.084580 0000 0 0016 0 0745berechnet die Zeit zur
Quadrierung einer ixi Matrix mit Einträgen eins direkt durch Matlab (n) bzw. durch
80.0000 0.0016 0.074590.0000 0.0013 0.0618100.0000 0.0017 0.1135110.0000 0.0024 0.1415120 0000 0 0029 0 1729
( )explizite Programmierung in Schleifen (m)
120.0000 0.0029 0.1729130.0000 0.0036 0.2140140.0000 0.0046 0.2847150.0000 0.0055 0.3353160 0000 0 0068 0 4233
testmatrix.m
Vergleich der Werte für einige n:
160.0000 0.0068 0.4233170.0000 0.0080 0.4915180.0000 0.0095 0.5949190.0000 0.0112 0.6764200 0000 0 0132 0 8306n: 200.0000 0.0132 0.8306210.0000 0.0557 0.9729220.0000 0.0179 1.0713230.0000 0.0204 1.1921240 0000 0 0230 1 3893
Barbara HammerInstitut of Informatics 17Matlab / Octave
240.0000 0.0230 1.3893250.0000 0.0483 1.5574
Grafik II Beispiel13.m
n = 251;erg = zeros((n-1)/10,3);
f i 1 10for i=1:10:nnumber = (i-1)/10+1;erg(number,1)= i-1;[erg(number,2),erg(number,3)]=testmatrix(i);dend
erg
Barbara HammerInstitut of Informatics 18Matlab / Octave
Grafik II Beispiel13.m
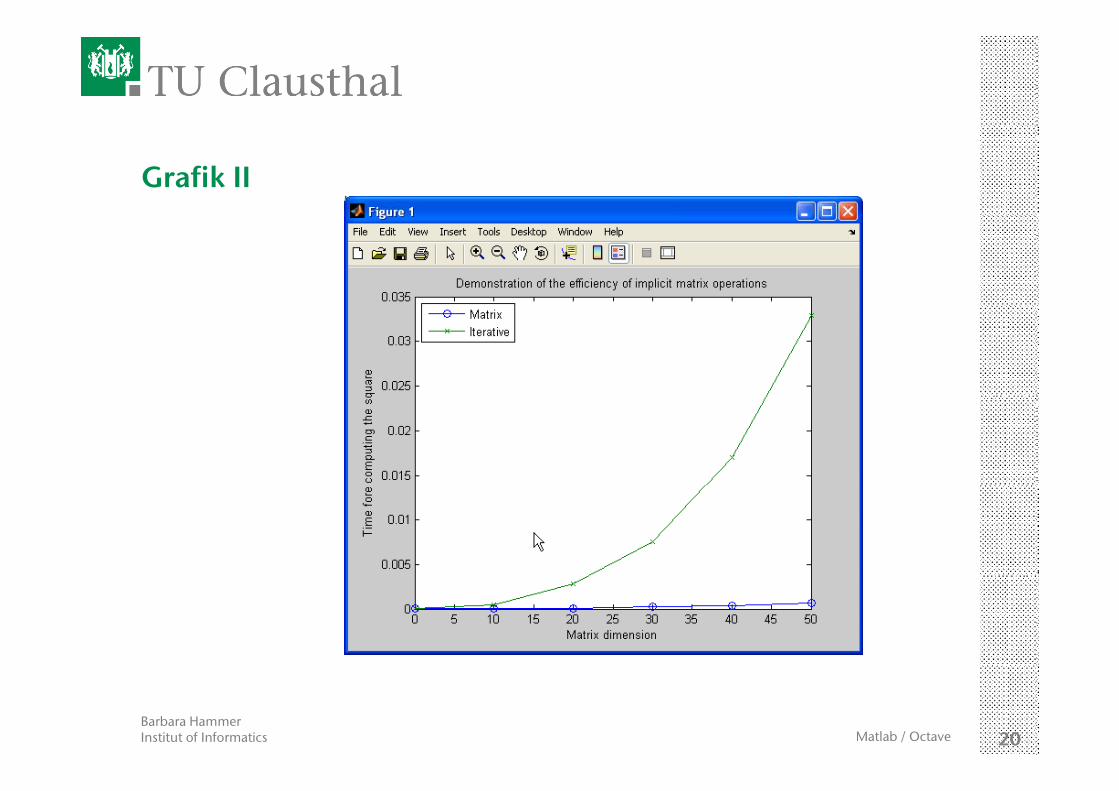
plot(erg(:,1),erg(:,2),'-o',erg(:,1),erg(:,3),'-x')xlabel('Matrix dimension')ylabel('Time fore computing the square')% t t( ( b 2) 'M t i ')% text(n,erg(number,2),'Matrix')% text(n,erg(number,3),'Iterative')h=legend('Matrix','Iterative')set(h,'Location','Northwest')titl ('D t ti f th ffi i f i li it t i ti ')title('Demonstration of the efficiency of implicit matrix operations')
print -deps2 'wow.eps'
Barbara HammerInstitut of Informatics 19Matlab / Octave
Grafik II
Barbara HammerInstitut of Informatics 20Matlab / Octave
Grafik II
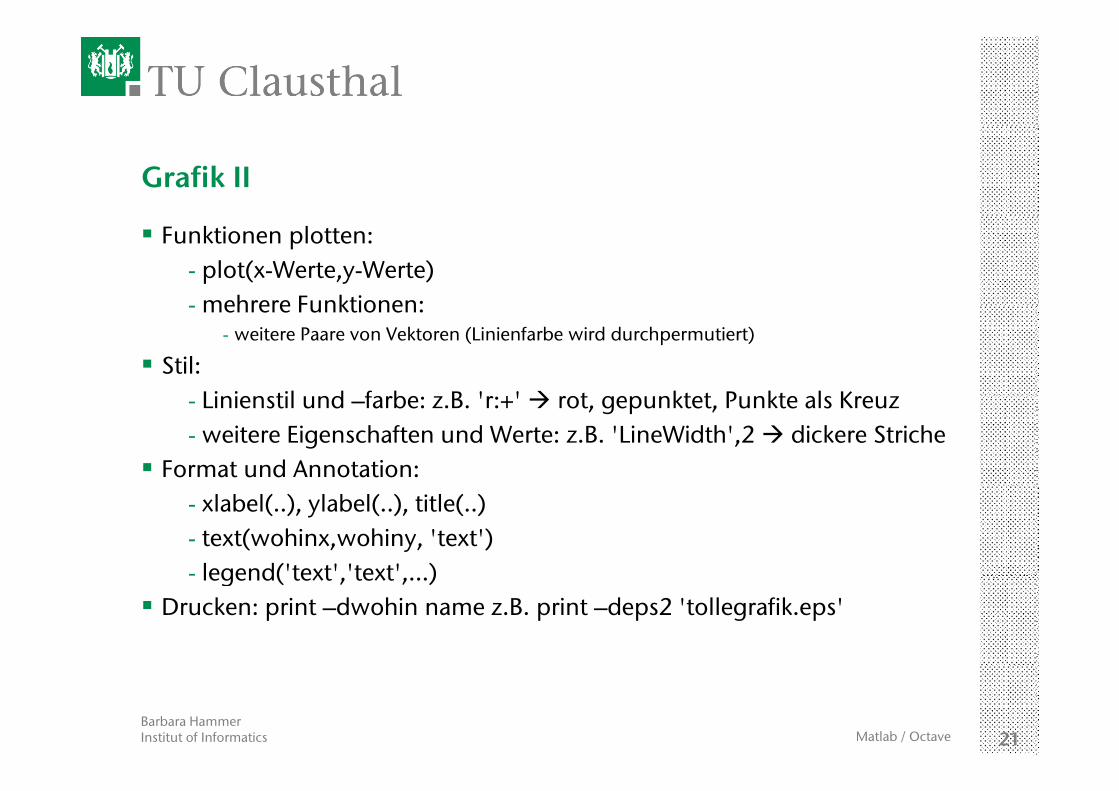
Funktionen plotten: - plot(x-Werte,y-Werte) - mehrere Funktionen:- mehrere Funktionen:
- weitere Paare von Vektoren (Linienfarbe wird durchpermutiert)
Stil: Li i til d f b B ' ' t kt t P kt l K- Linienstil und –farbe: z.B. 'r:+' rot, gepunktet, Punkte als Kreuz
- weitere Eigenschaften und Werte: z.B. 'LineWidth',2 dickere StricheFormat und Annotation:
- xlabel(..), ylabel(..), title(..)- text(wohinx,wohiny, 'text')- legend('text' 'text' )- legend( text , text ,…)
Drucken: print –dwohin name z.B. print –deps2 'tollegrafik.eps'
Barbara HammerInstitut of Informatics 21Matlab / Octave
Beispiel14.m
Grafik III
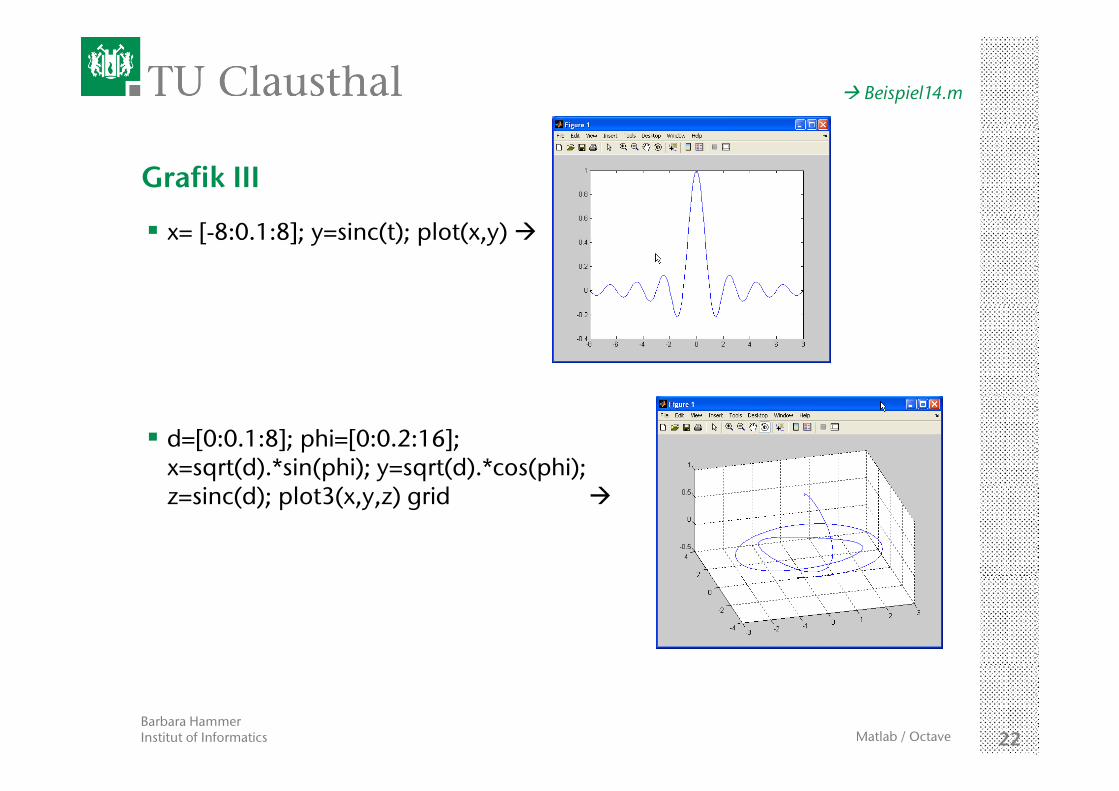
x= [-8:0.1:8]; y=sinc(t); plot(x,y)
d=[0:0.1:8]; phi=[0:0.2:16]; x=sqrt(d).*sin(phi); y=sqrt(d).*cos(phi); z=sinc(d); plot3(x,y,z) grid
Barbara HammerInstitut of Informatics 22Matlab / Octave
Grafik III
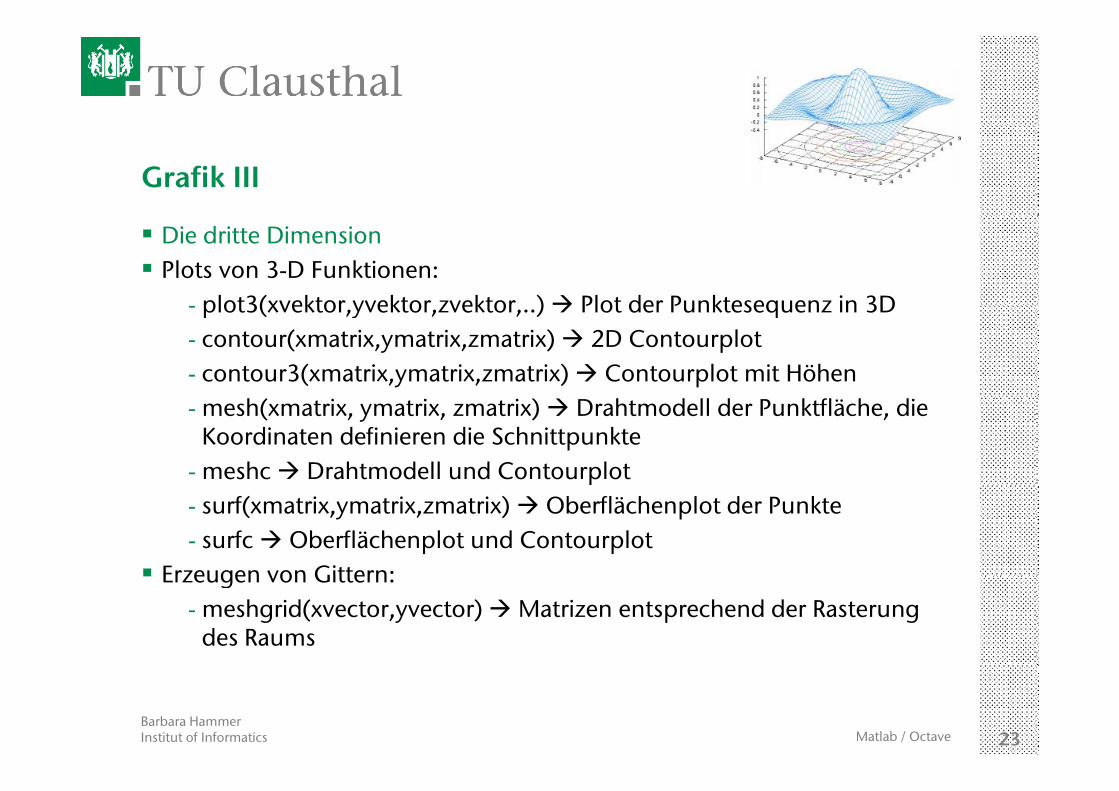
Die dritte DimensionPlots von 3-D Funktionen:
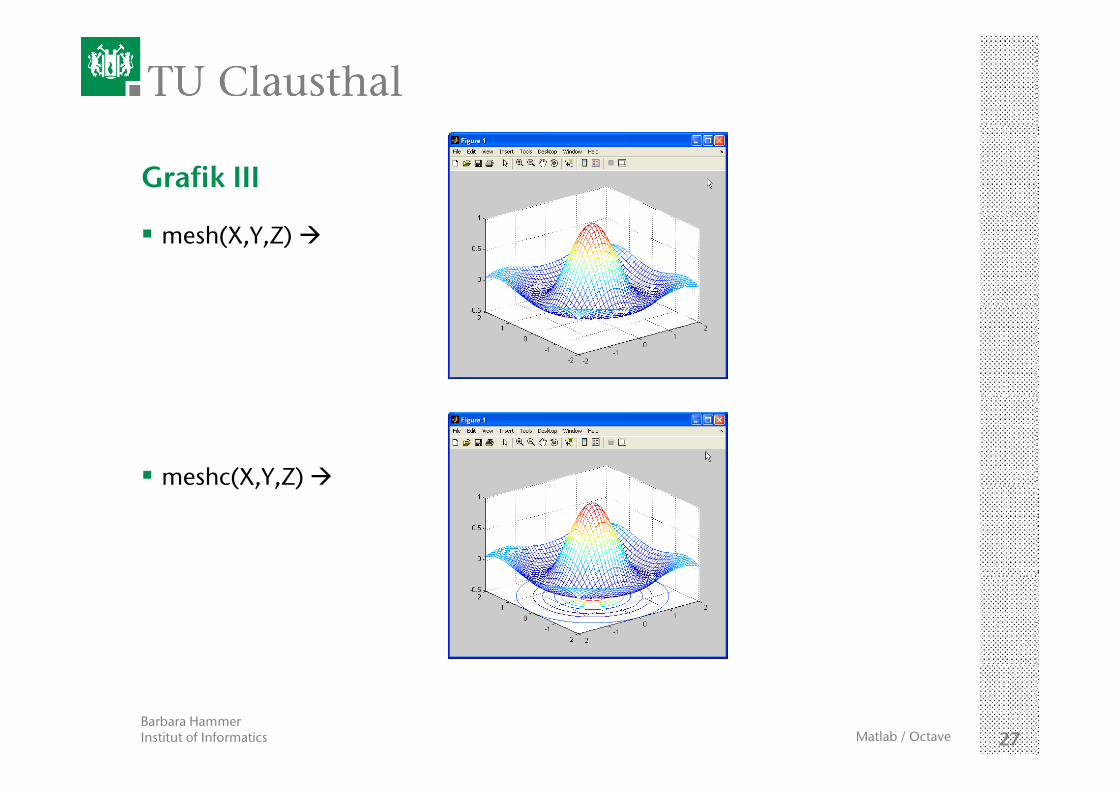
- plot3(xvektor yvektor zvektor ) Plot der Punktesequenz in 3D- plot3(xvektor,yvektor,zvektor,..) Plot der Punktesequenz in 3D- contour(xmatrix,ymatrix,zmatrix) 2D Contourplot- contour3(xmatrix,ymatrix,zmatrix) Contourplot mit Höhen - mesh(xmatrix, ymatrix, zmatrix) Drahtmodell der Punktfläche, die
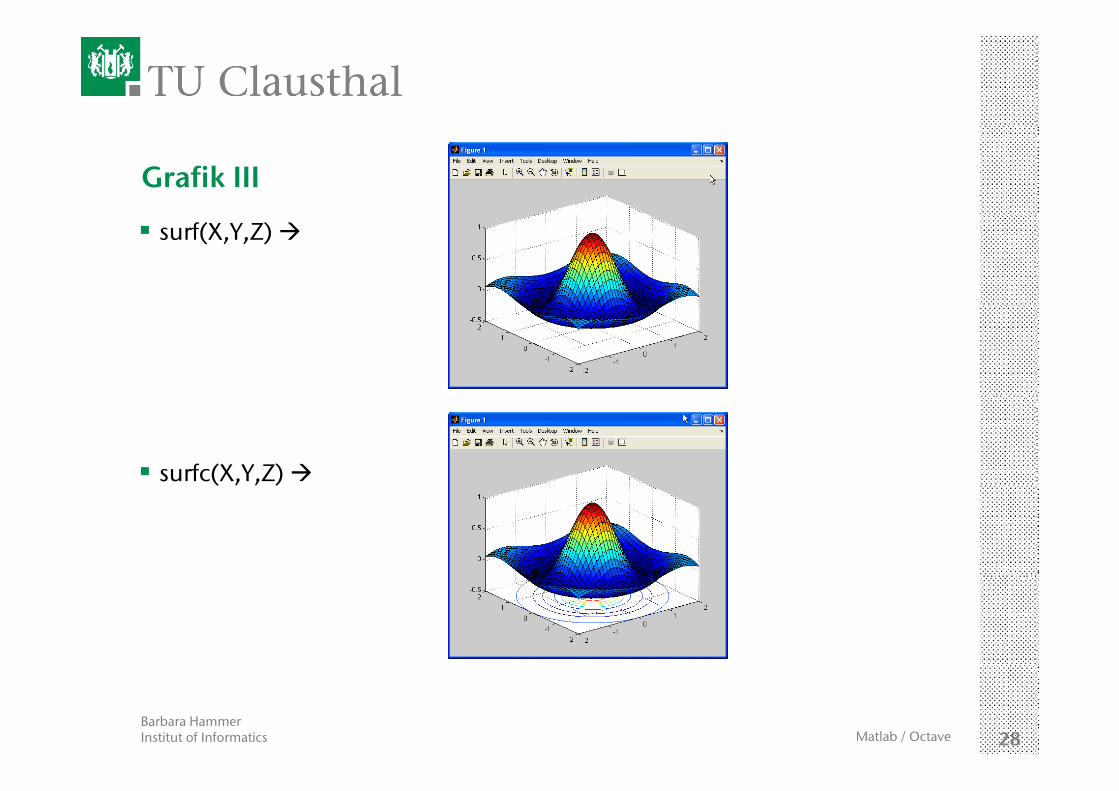
Koordinaten definieren die Schnittpunkte - meshc Drahtmodell und Contourplot- surf(xmatrix,ymatrix,zmatrix) Oberflächenplot der Punkte- surfc Oberflächenplot und Contourplot
Erzeugen von Gittern:Erzeugen von Gittern:- meshgrid(xvector,yvector) Matrizen entsprechend der Rasterung
des Raums
Barbara HammerInstitut of Informatics 23Matlab / Octave
Grafik III
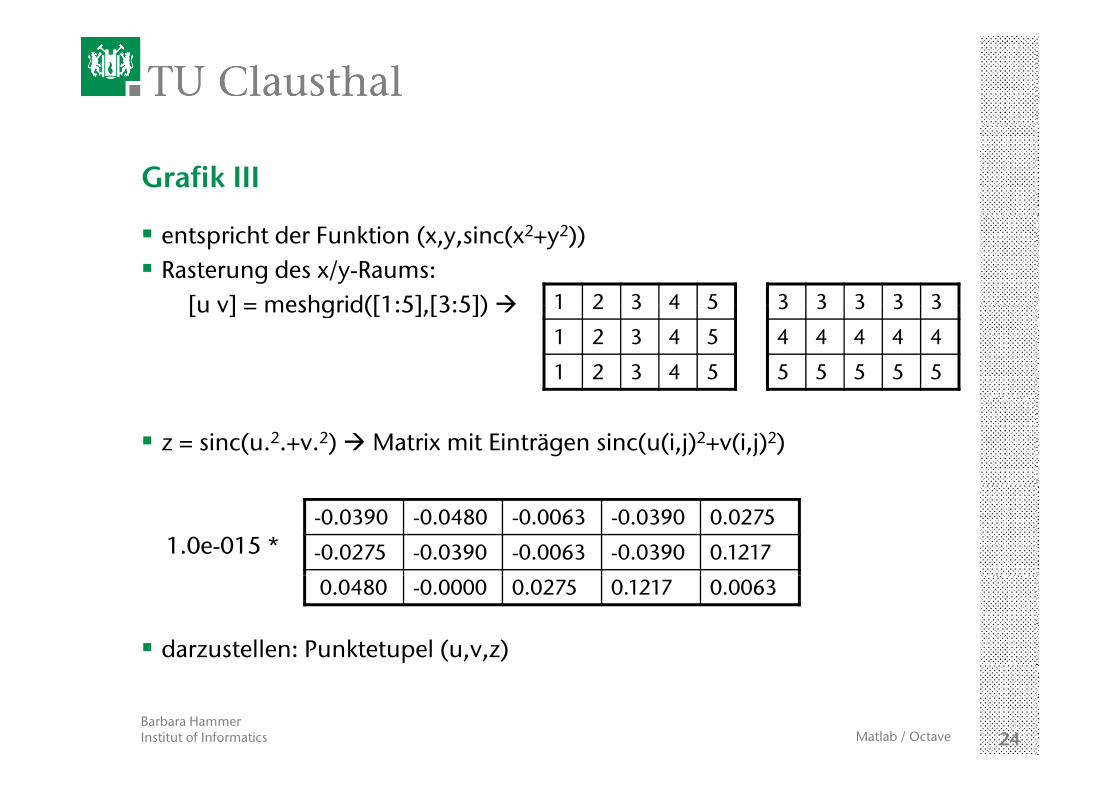
entspricht der Funktion (x,y,sinc(x2+y2))Rasterung des x/y-Raums:
[u v] = meshgrid([1:5] [3:5]) 1 2 3 4 5 3 3 3 3 3[u v] = meshgrid([1:5],[3:5]) 1 2 3 4 5
1 2 3 4 5
1 2 3 4 5
3 3 3 3 3
4 4 4 4 4
5 5 5 5 5
z = sinc(u.2.+v.2) Matrix mit Einträgen sinc(u(i,j)2+v(i,j)2)
1.0e-015 *-0.0390 -0.0480 -0.0063 -0.0390 0.0275
-0.0275 -0.0390 -0.0063 -0.0390 0.1217
darzustellen: Punktetupel (u,v,z)
0.0480 -0.0000 0.0275 0.1217 0.0063
Barbara HammerInstitut of Informatics 24Matlab / Octave
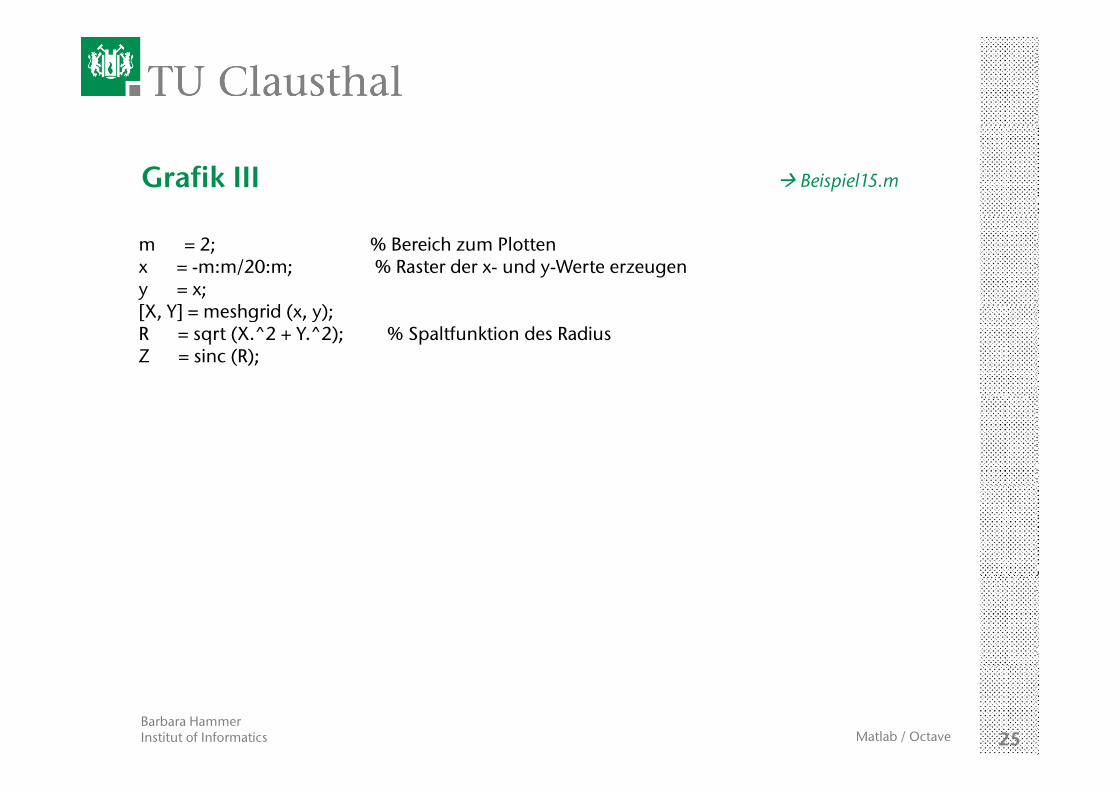
Grafik III Beispiel15.m
m = 2; % Bereich zum Plottenx = -m:m/20:m; % Raster der x- und y-Werte erzeugeny = x;[X Y] h id ( )[X, Y] = meshgrid (x, y);R = sqrt (X.^2 + Y.^2); % Spaltfunktion des RadiusZ = sinc (R);
Barbara HammerInstitut of Informatics 25Matlab / Octave
Grafik III
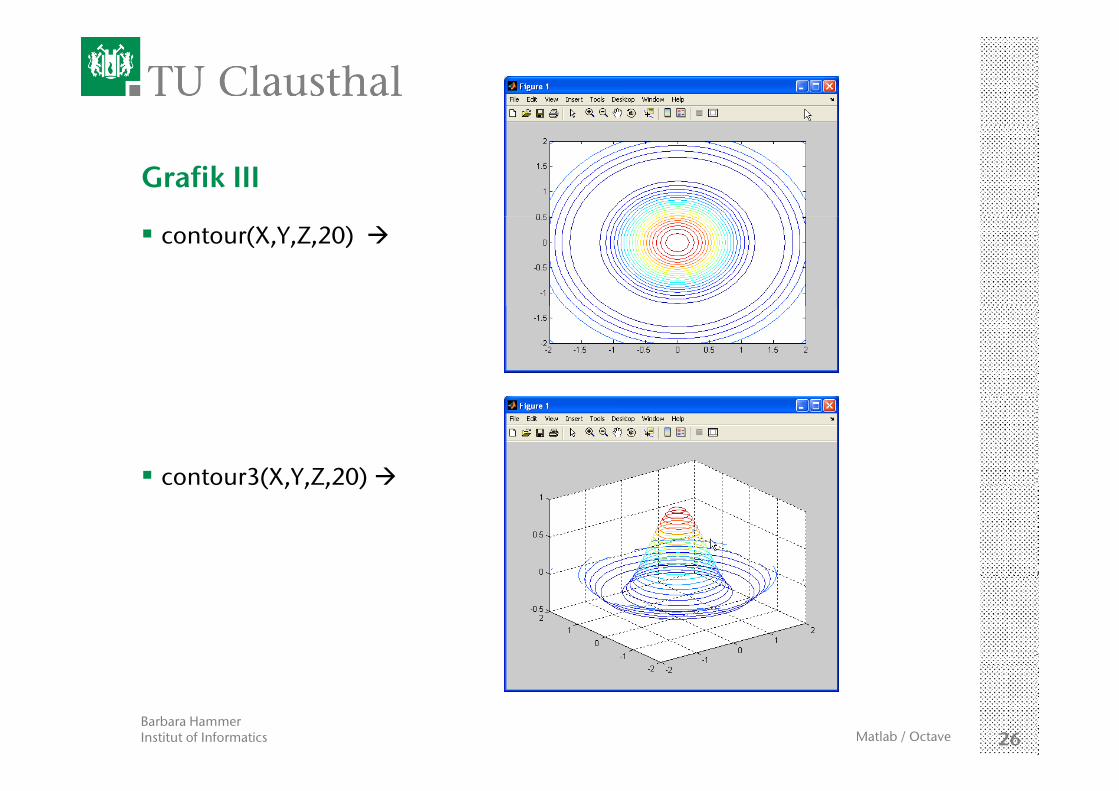
contour(X,Y,Z,20)
contour3(X,Y,Z,20) ( , , , )
Barbara HammerInstitut of Informatics 26Matlab / Octave
Grafik III
mesh(X,Y,Z)
meshc(X,Y,Z) ( , , )
Barbara HammerInstitut of Informatics 27Matlab / Octave
Grafik III
surf(X,Y,Z)
surfc(X,Y,Z) ( , , )
Barbara HammerInstitut of Informatics 28Matlab / Octave
Grafik III
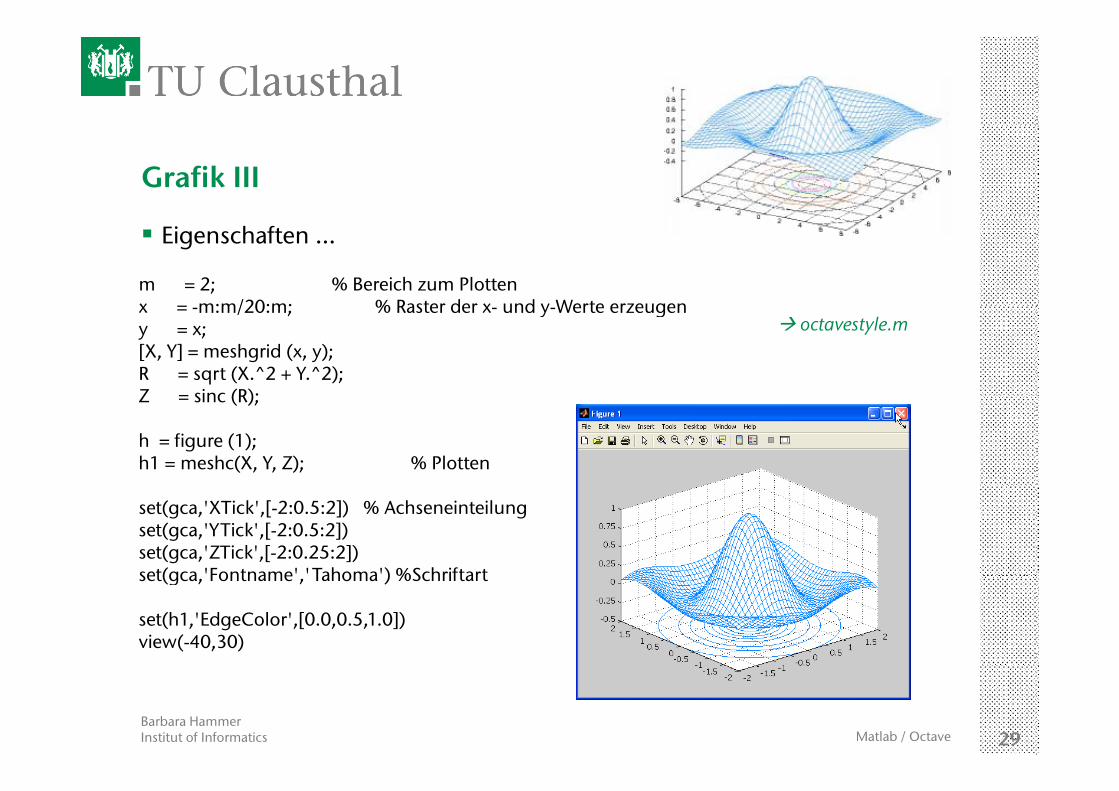
Eigenschaften …
m = 2; % Bereich zum Plottenx = m:m/20:m; % Raster der x und y Werte erzeugenx = -m:m/20:m; % Raster der x- und y-Werte erzeugeny = x;[X, Y] = meshgrid (x, y);R = sqrt (X.^2 + Y.^2); Z = sinc (R);
octavestyle.m
Z = sinc (R);
h = figure (1);h1 = meshc(X, Y, Z); % Plotten
set(gca,'XTick',[-2:0.5:2]) % Achseneinteilungset(gca,'YTick',[-2:0.5:2])set(gca,'ZTick',[-2:0.25:2])set(gca 'Fontname' 'Tahoma') %Schriftartset(gca, Fontname , Tahoma ) %Schriftart
set(h1,'EdgeColor',[0.0,0.5,1.0])view(-40,30)
Barbara HammerInstitut of Informatics 29Matlab / Octave
Grafik III
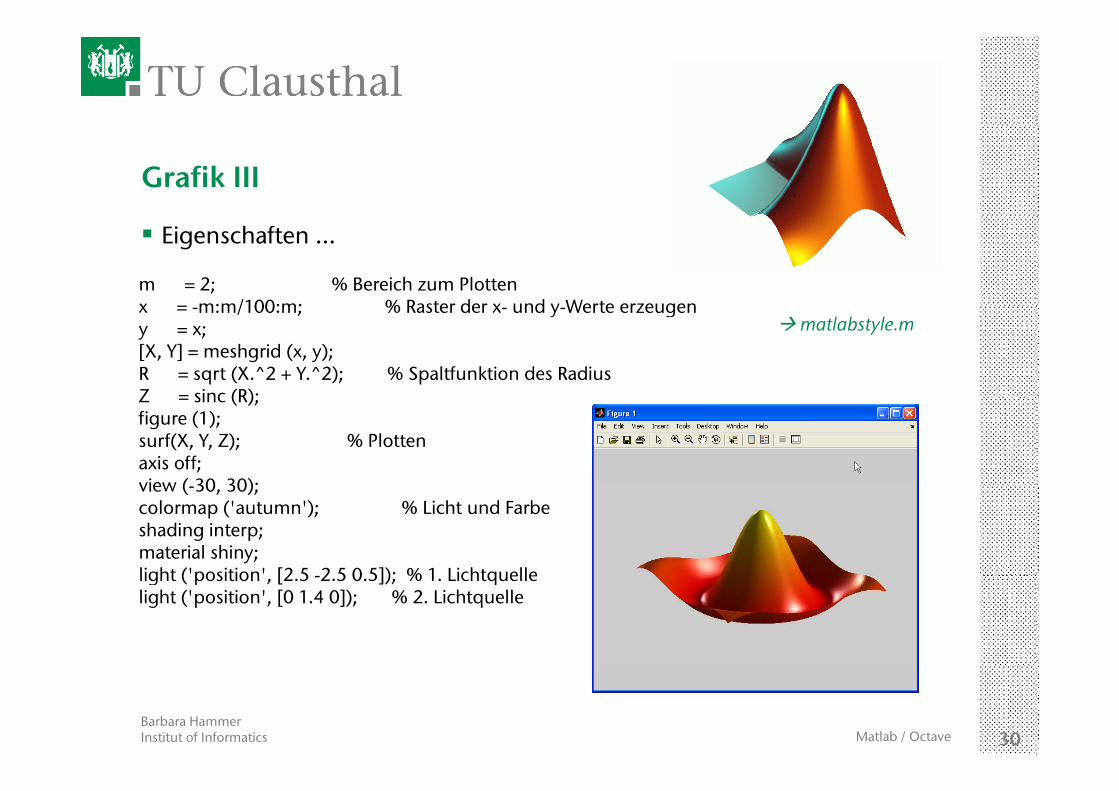
Eigenschaften …
m = 2; % Bereich zum Plottenx = m:m/100:m; % Raster der x und y Werte erzeugenx = -m:m/100:m; % Raster der x- und y-Werte erzeugeny = x;[X, Y] = meshgrid (x, y);R = sqrt (X.^2 + Y.^2); % Spaltfunktion des RadiusZ = sinc (R);
matlabstyle.m
Z = sinc (R);figure (1);surf(X, Y, Z); % Plottenaxis off;view ( 30 30);view (-30, 30);colormap ('autumn'); % Licht und Farbeshading interp;material shiny;light ('position' [2 5 2 5 0 5]); % 1 Lichtquellelight ( position , [2.5 -2.5 0.5]); % 1. Lichtquellelight ('position', [0 1.4 0]); % 2. Lichtquelle
Barbara HammerInstitut of Informatics 30Matlab / Octave
Add on …
… das folgende wird nur erzählt, wenn noch Zeit ist (eher nicht), und ist nicht prüfungsrelevant (aber relevant, wenn Sie eine Oberfläche mit Matlab konfigurieren wollen)g
Barbara HammerInstitut of Informatics 31Matlab / Octave
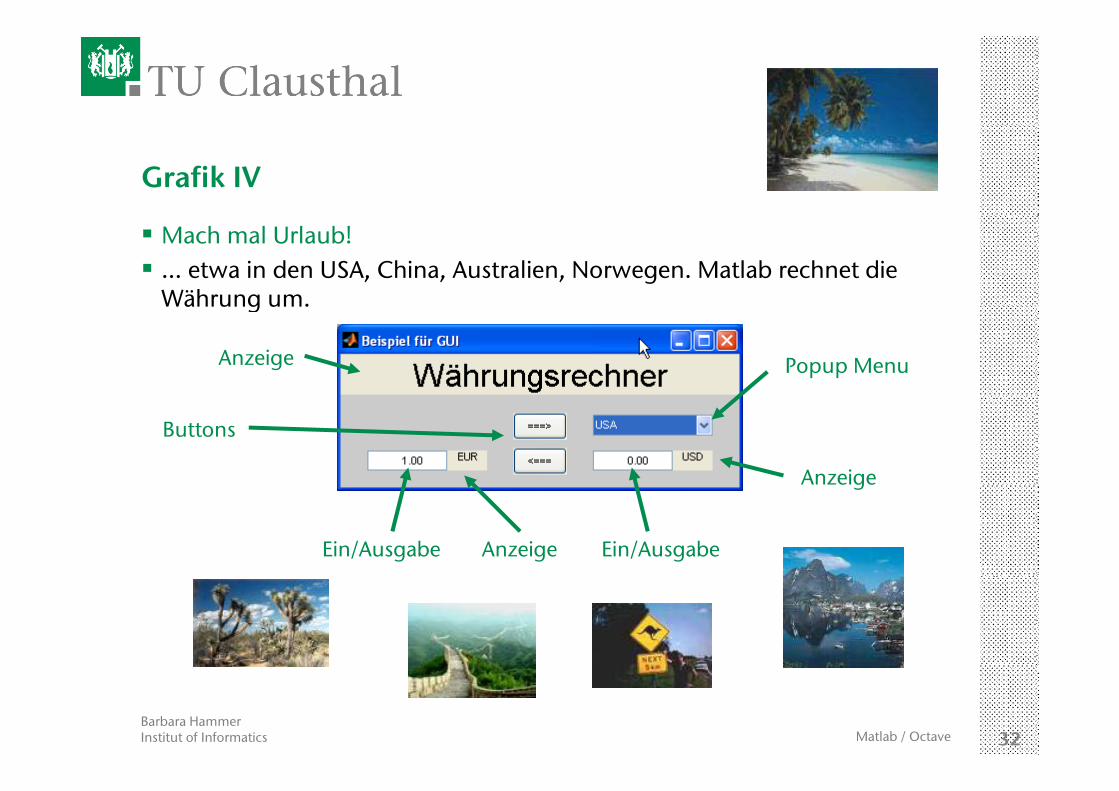
Grafik IV
Mach mal Urlaub!… etwa in den USA, China, Australien, Norwegen. Matlab rechnet die Währung um.Währung um.
Popup MenuAnzeige
Buttons
Anzeige
Ein/Ausgabe
g
Ein/AusgabeAnzeige
Barbara HammerInstitut of Informatics 32Matlab / Octave
Grafik IV
Grafical user interfaces (guis) sind Bestandteil von figureszentrale vordefinierte Funktion für Bestandteile des guis: uicontrolParameter von uicontrol:
- Parent Referenz der zugehörigen figure- typische Eigenschaften wie etwa Fontsize, Units, …- Position [linke untere Eckex/y Breite Höhe]Position [linke untere Eckex/y, Breite, Höhe]- String zu erscheinender Text (man kann auch Bilder einbetten)- Style Typ des zu definierenden Objekts
vordefinierte Typen sind etwavordefinierte Typen sind etwa- text- pushbutton- popupmenu- edit- …
Barbara HammerInstitut of Informatics 33Matlab / Octave
Grafik IV
Programmieren von Aktionen durch die Assoziation des Parameters 'Callback' mit {@<funktionsname>}<funktionsname> ist eine in der globalen Funktion definierte Unterfunktion (die Zugriff auf alle Variblen der globalen Funktion hat)Übergabeparameter sind
- die Referenz des Objekts, für die der Callback aufgerufen wurde- eventdata … für spätere Matlab-Versionen ☺- Struktur mit allen weiteren Referenzen der figure
Barbara HammerInstitut of Informatics 34Matlab / Octave
Grafik IV guibeispiel.m
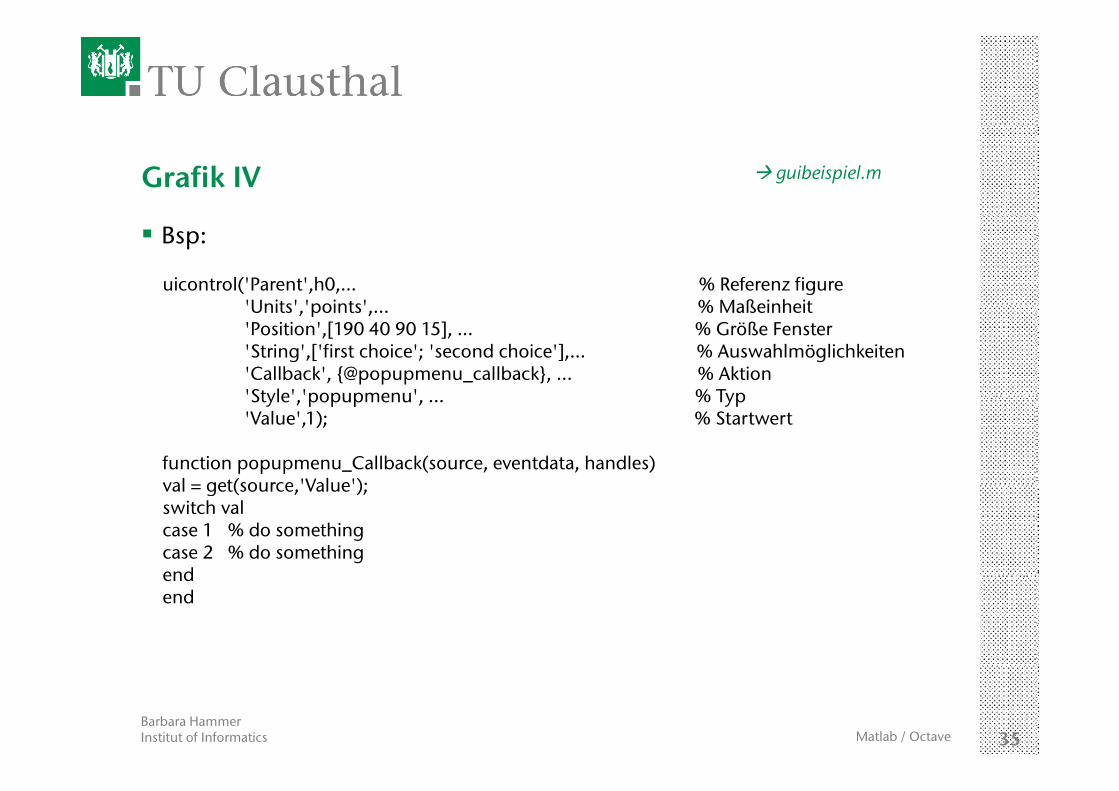
Bsp:
uicontrol('Parent',h0,… % Referenz figure'Units' 'points' % MaßeinheitUnits , points ,… % Maßeinheit'Position',[190 40 90 15], … % Größe Fenster'String',['first choice'; 'second choice'],… % Auswahlmöglichkeiten'Callback', {@popupmenu_callback}, ... % Aktion'Style' 'popupmenu' % TypStyle , popupmenu , … % Typ'Value',1); % Startwert
function popupmenu_Callback(source, eventdata, handles)val = get(source 'Value');val = get(source, Value );switch valcase 1 % do somethingcase 2 % do somethingendendend
Barbara HammerInstitut of Informatics 35Matlab / Octave
Grafik IV
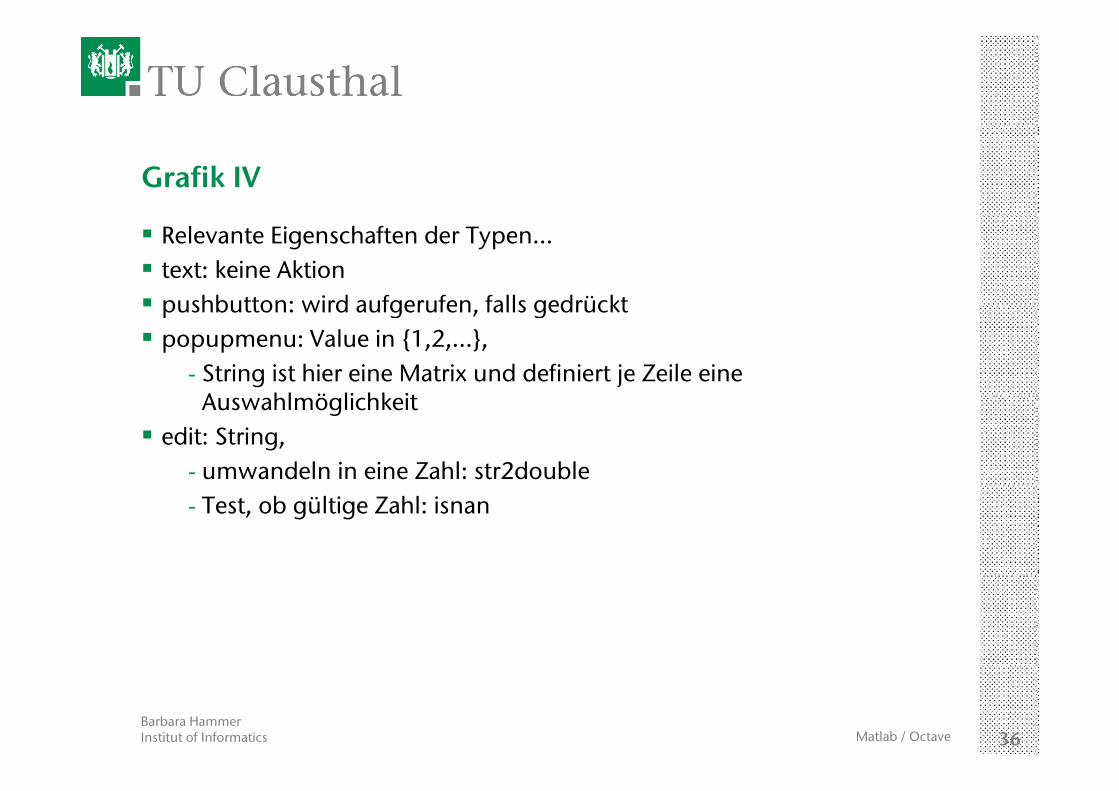
Relevante Eigenschaften der Typen…text: keine Aktionpushbutton: wird aufgerufen falls gedrücktpushbutton: wird aufgerufen, falls gedrücktpopupmenu: Value in {1,2,…},
- String ist hier eine Matrix und definiert je Zeile eine A hl ö li hk itAuswahlmöglichkeit
edit: String, - umwandeln in eine Zahl: str2double- Test, ob gültige Zahl: isnan
Barbara HammerInstitut of Informatics 36Matlab / Octave
Grafik IV
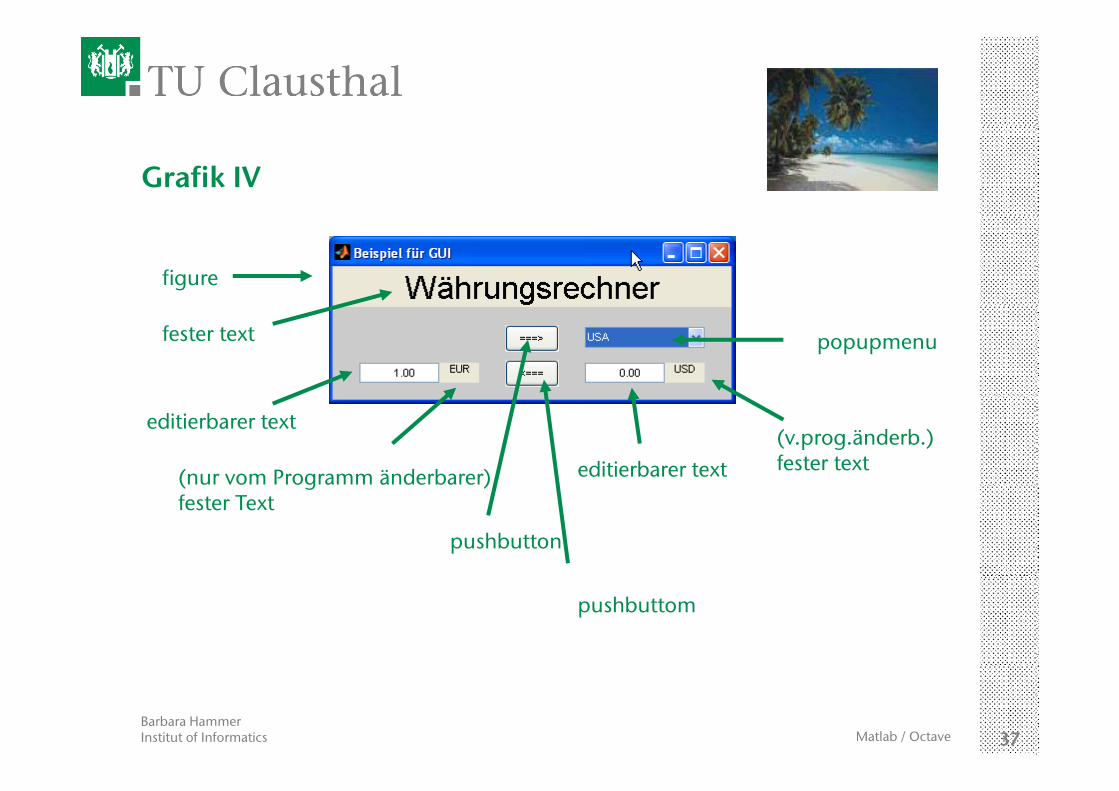
figure
fester text popupmenu
editierbarer text
(nur vom Programm änderbarer) editierbarer text(v.prog.änderb.)fester text
( g )fester Text
pushbutton
pushbuttom
Barbara HammerInstitut of Informatics 37Matlab / Octave
Grafik IV
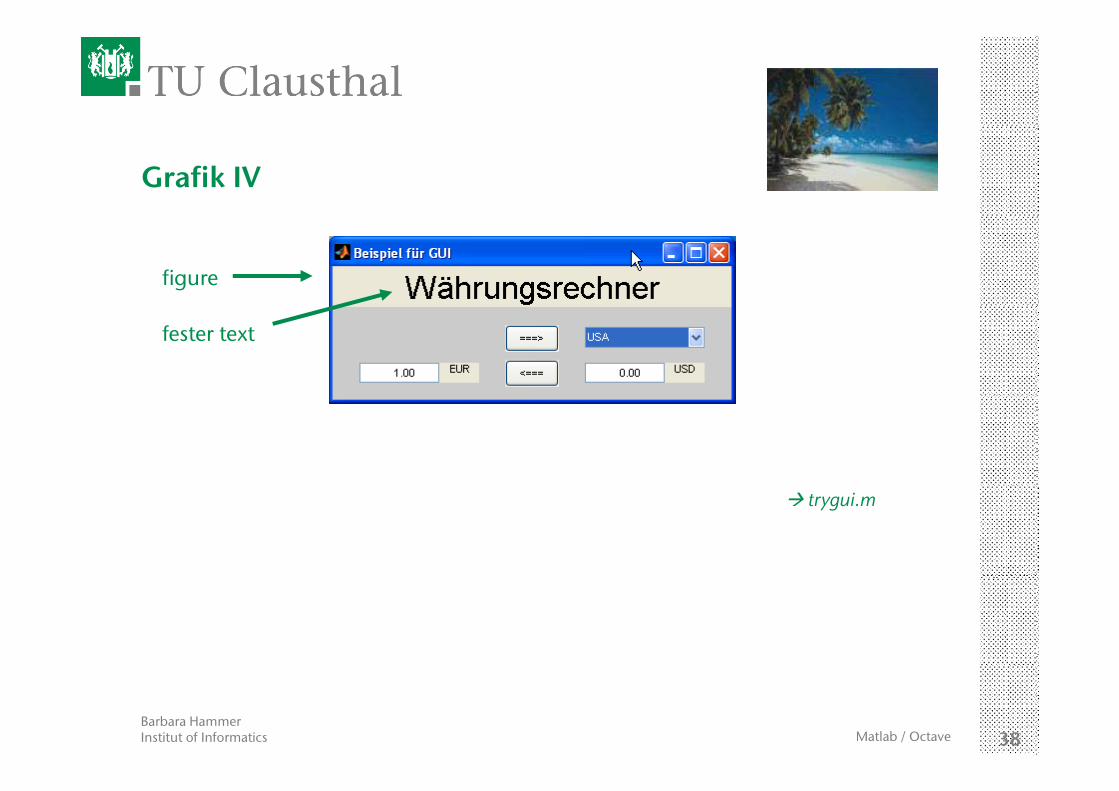
figure
fester text
trygui.m
Barbara HammerInstitut of Informatics 38Matlab / Octave
Grafik IV
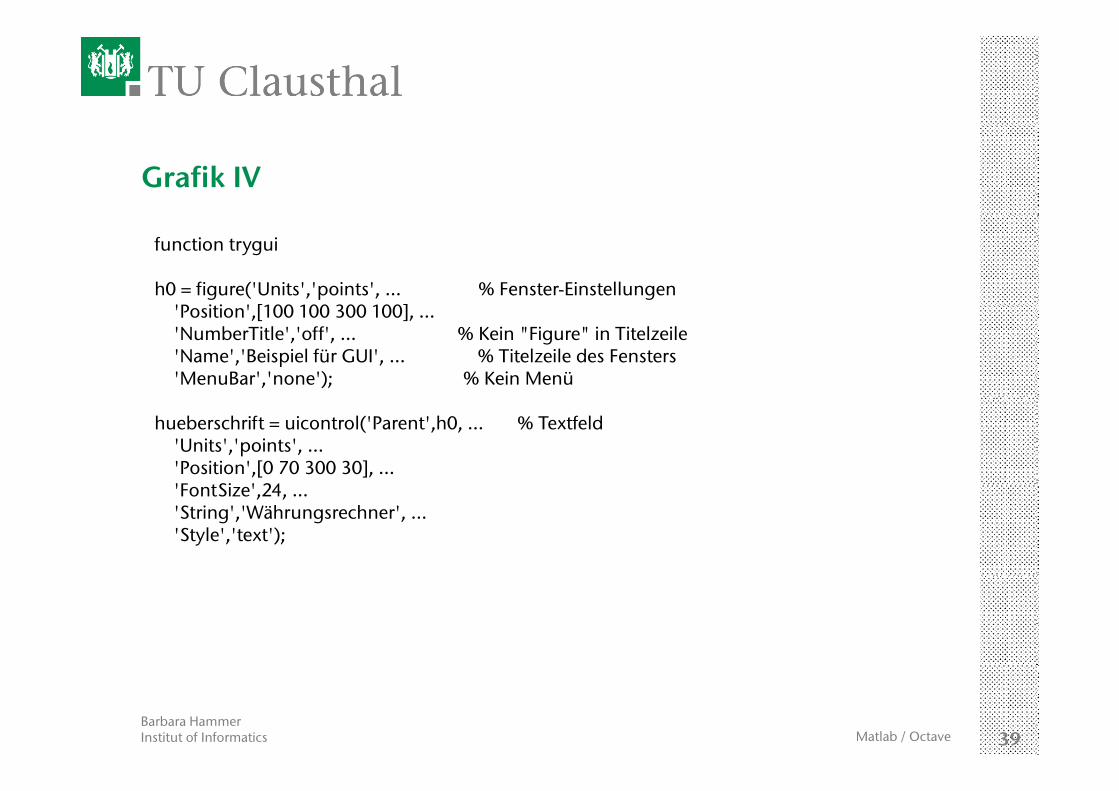
function trygui
h0 = figure('Units','points', ... % Fenster-Einstellungen'P iti ' [100 100 300 100]'Position',[100 100 300 100], ...'NumberTitle','off', ... % Kein "Figure" in Titelzeile'Name','Beispiel für GUI', ... % Titelzeile des Fensters'MenuBar','none'); % Kein Menü
hueberschrift = uicontrol('Parent',h0, ... % Textfeld'Units','points', ...'Position',[0 70 300 30], ...'F tSi ' 24'FontSize',24, ...'String','Währungsrechner', ...'Style','text');
Barbara HammerInstitut of Informatics 39Matlab / Octave
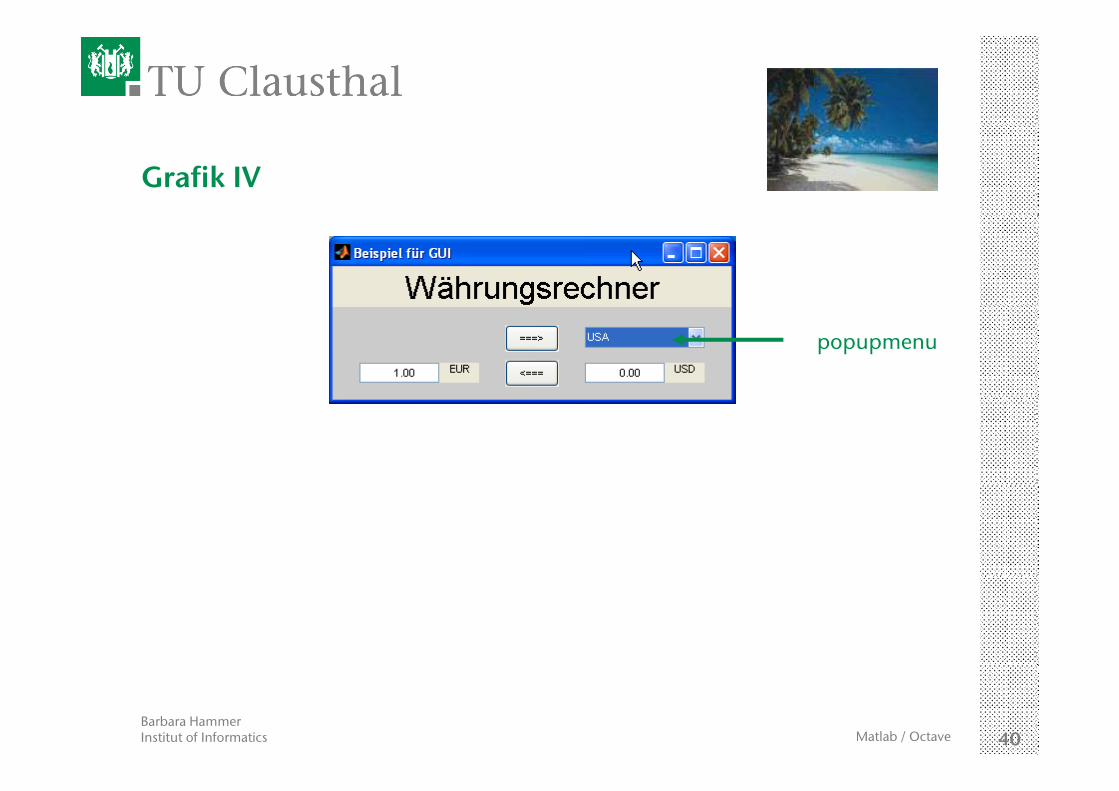
Grafik IV
popupmenu
Barbara HammerInstitut of Informatics 40Matlab / Octave
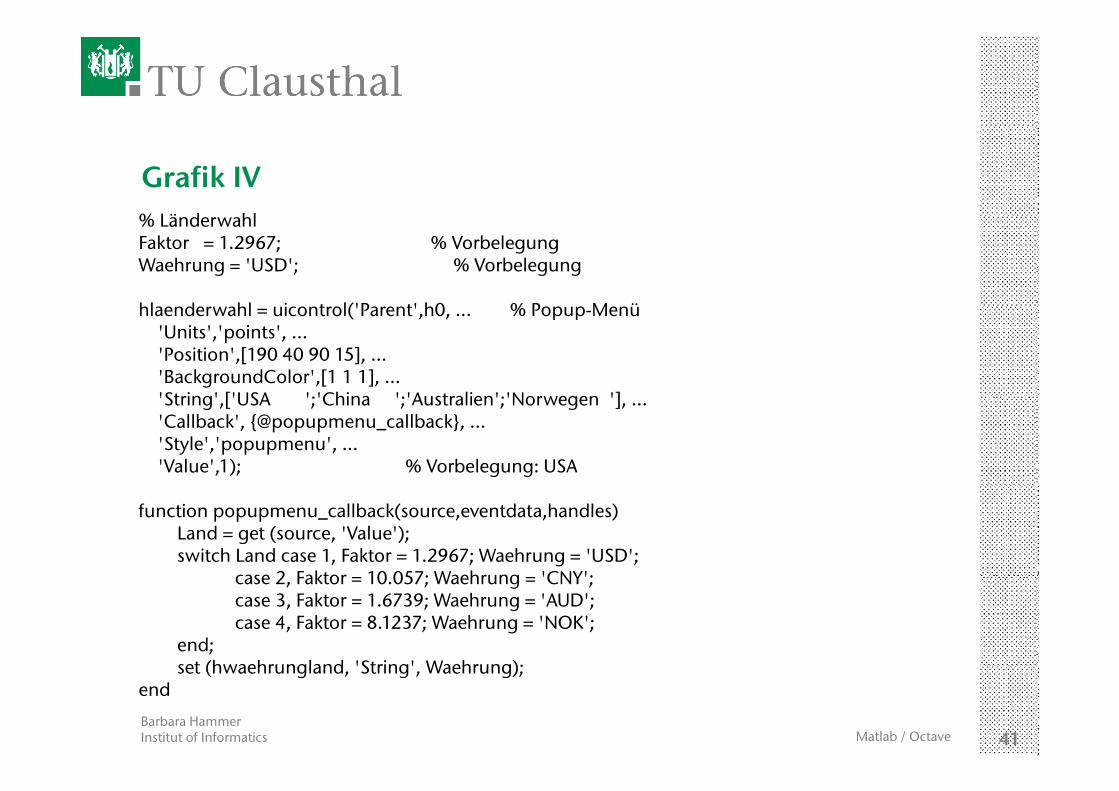
Grafik IV% Lä d hl% LänderwahlFaktor = 1.2967; % Vorbelegung Waehrung = 'USD'; % Vorbelegung
hl d hl i t l('P t' h0 % P M ühlaenderwahl = uicontrol('Parent',h0, ... % Popup-Menü'Units','points', ...'Position',[190 40 90 15], ...'BackgroundColor',[1 1 1], ...'St i ' ['USA ' 'Chi ' 'A t li ' 'N ']'String',['USA ';'China ';'Australien';'Norwegen '], ...'Callback', {@popupmenu_callback}, ...'Style','popupmenu', ...'Value',1); % Vorbelegung: USA
function popupmenu_callback(source,eventdata,handles)Land = get (source, 'Value');switch Land case 1, Faktor = 1.2967; Waehrung = 'USD';
case 2 Faktor 10 057; Waehrung 'CNY';case 2, Faktor = 10.057; Waehrung = 'CNY';case 3, Faktor = 1.6739; Waehrung = 'AUD';case 4, Faktor = 8.1237; Waehrung = 'NOK';
end;set (hwaehrungland 'String' Waehrung);
Barbara HammerInstitut of Informatics 41Matlab / Octave
set (hwaehrungland, 'String', Waehrung);end
Grafik IV
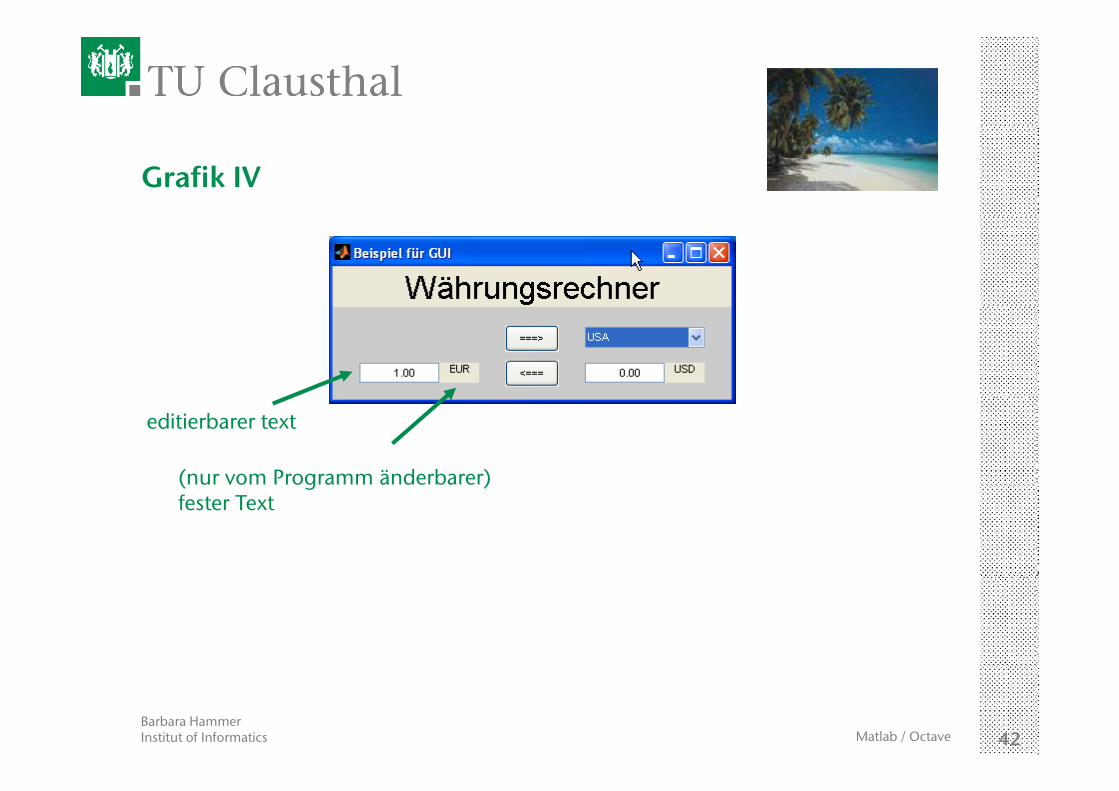
editierbarer text
(nur vom Programm änderbarer)( g )fester Text
Barbara HammerInstitut of Informatics 42Matlab / Octave
Grafik IV
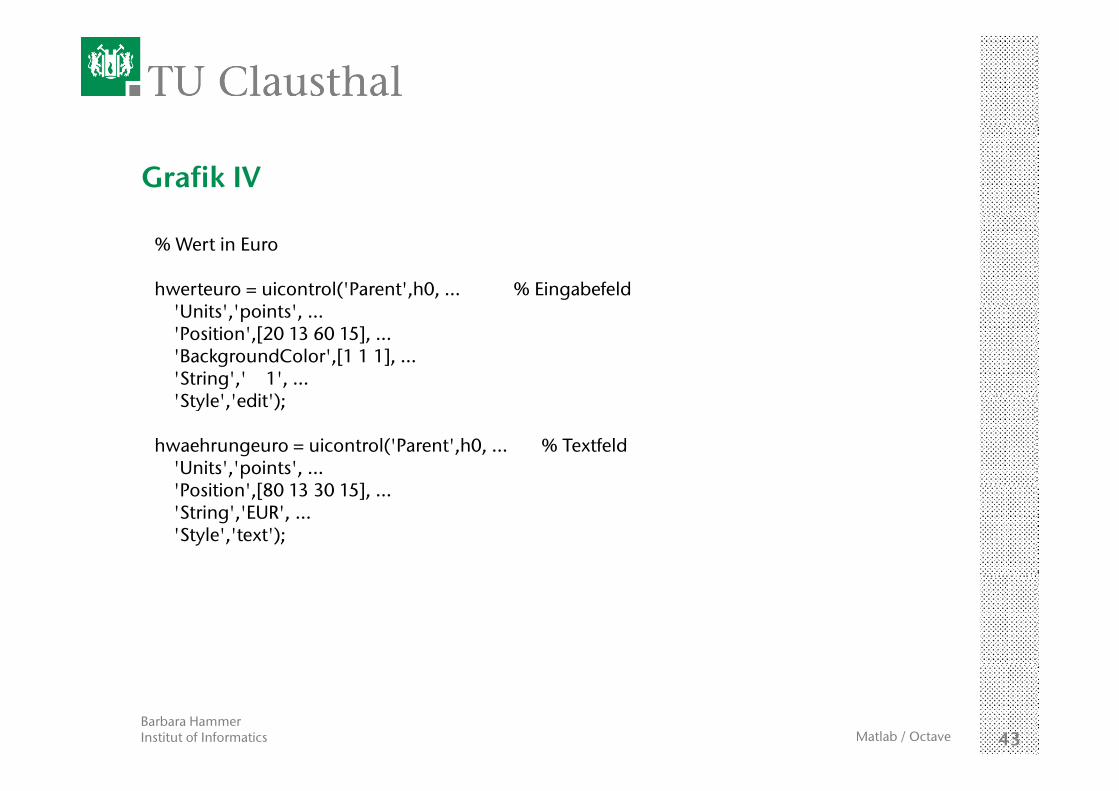
% Wert in Euro
hwerteuro = uicontrol('Parent',h0, ... % Eingabefeld'U it ' ' i t ''Units','points', ...'Position',[20 13 60 15], ...'BackgroundColor',[1 1 1], ...'String',' 1', ...'St l ' ' dit')'Style','edit');
hwaehrungeuro = uicontrol('Parent',h0, ... % Textfeld'Units','points', ...'P iti ' [80 13 30 15]'Position',[80 13 30 15], ...'String','EUR', ...'Style','text');
Barbara HammerInstitut of Informatics 43Matlab / Octave
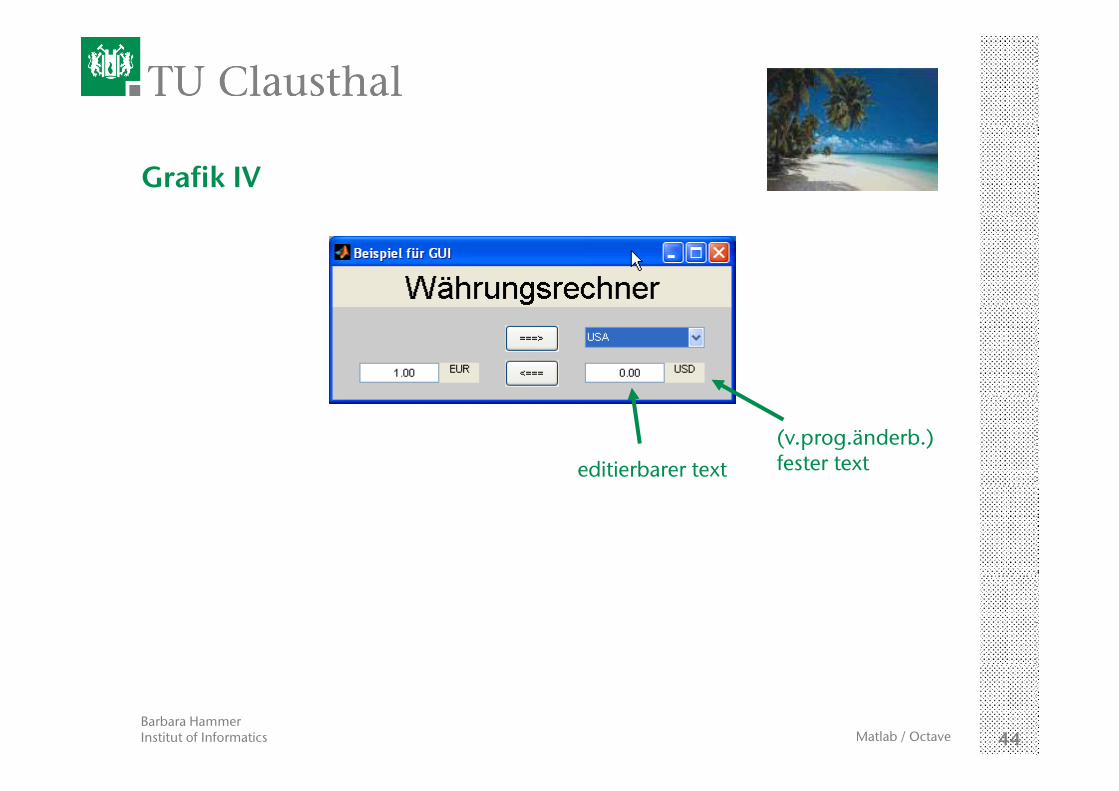
Grafik IV
editierbarer text(v.prog.änderb.)fester text
Barbara HammerInstitut of Informatics 44Matlab / Octave
Grafik IV
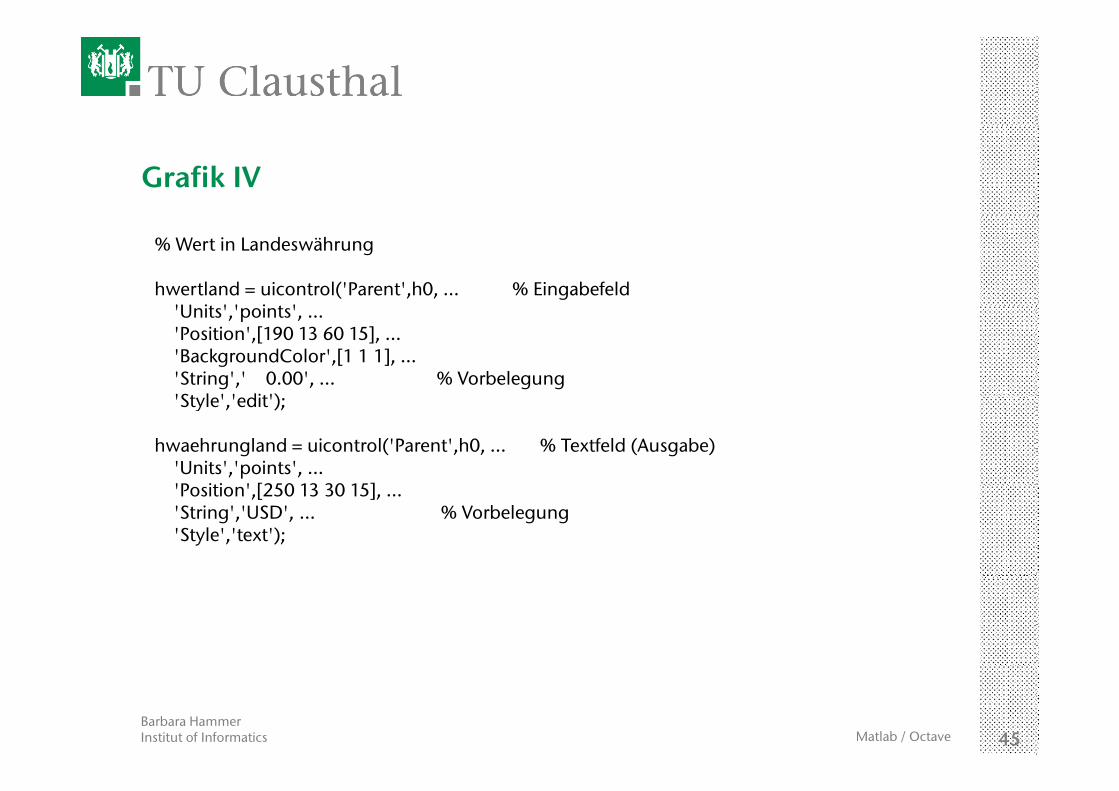
% Wert in Landeswährung
hwertland = uicontrol('Parent',h0, ... % Eingabefeld'U it ' ' i t ''Units','points', ...'Position',[190 13 60 15], ...'BackgroundColor',[1 1 1], ...'String',' 0.00', ... % Vorbelegung'St l ' ' dit')'Style','edit');
hwaehrungland = uicontrol('Parent',h0, ... % Textfeld (Ausgabe)'Units','points', ...'P iti ' [250 13 30 15]'Position',[250 13 30 15], ...'String','USD', ... % Vorbelegung'Style','text');
Barbara HammerInstitut of Informatics 45Matlab / Octave
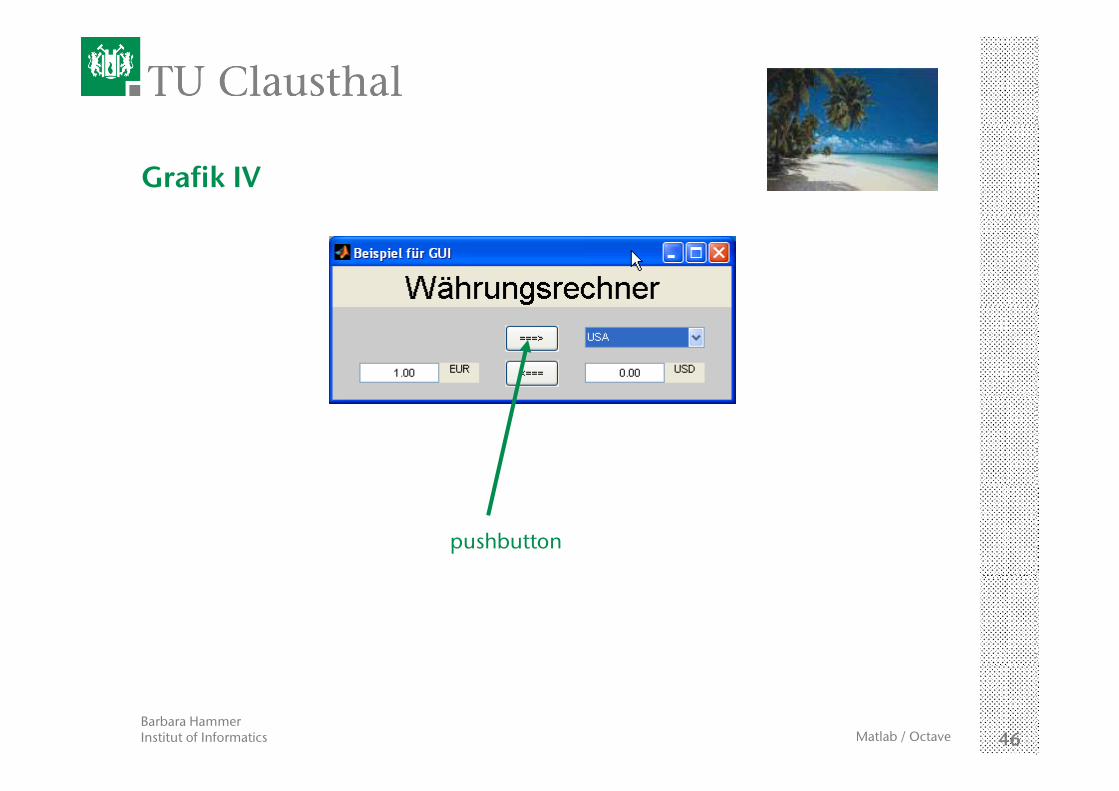
Grafik IV
pushbutton
Barbara HammerInstitut of Informatics 46Matlab / Octave
Grafik IV
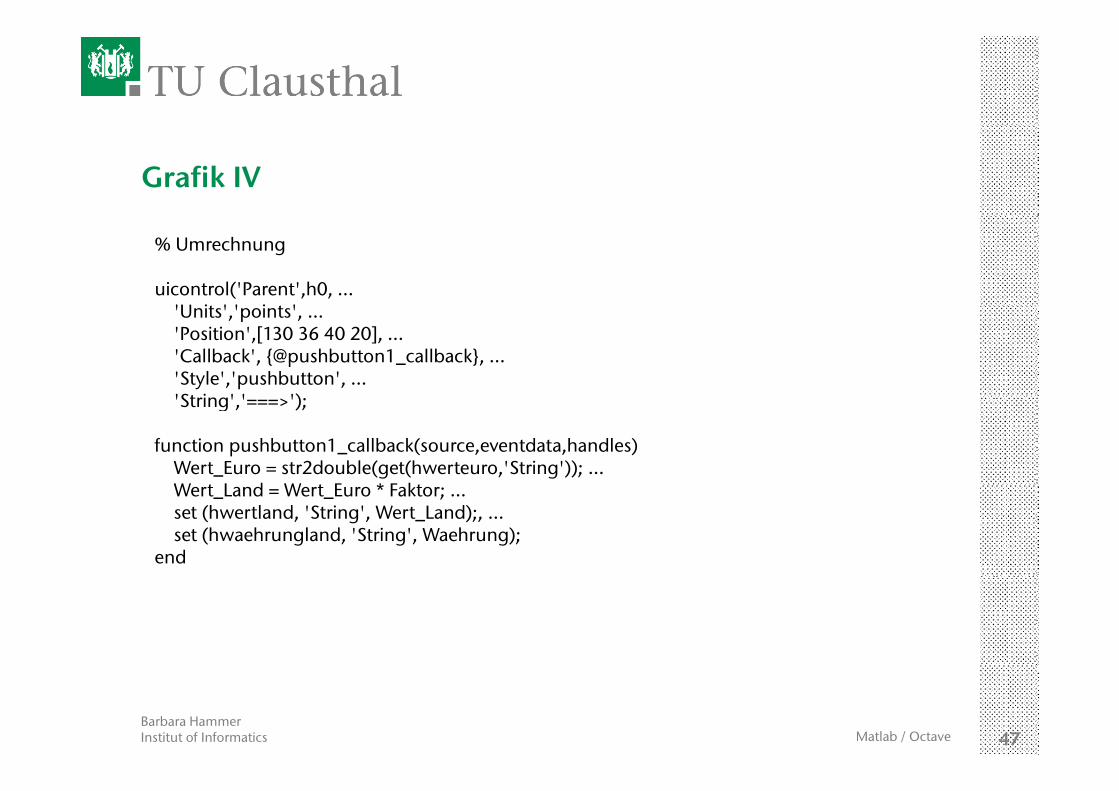
% Umrechnung
uicontrol('Parent',h0, ... 'U it ' ' i t ''Units','points', ...'Position',[130 36 40 20], ...'Callback', {@pushbutton1_callback}, ...'Style','pushbutton', ...'St i ' ' ')'String','===>');
function pushbutton1_callback(source,eventdata,handles)Wert_Euro = str2double(get(hwerteuro,'String')); ... W t L d W t E * F ktWert_Land = Wert_Euro * Faktor; ...set (hwertland, 'String', Wert_Land);, ...set (hwaehrungland, 'String', Waehrung);
end
Barbara HammerInstitut of Informatics 47Matlab / Octave
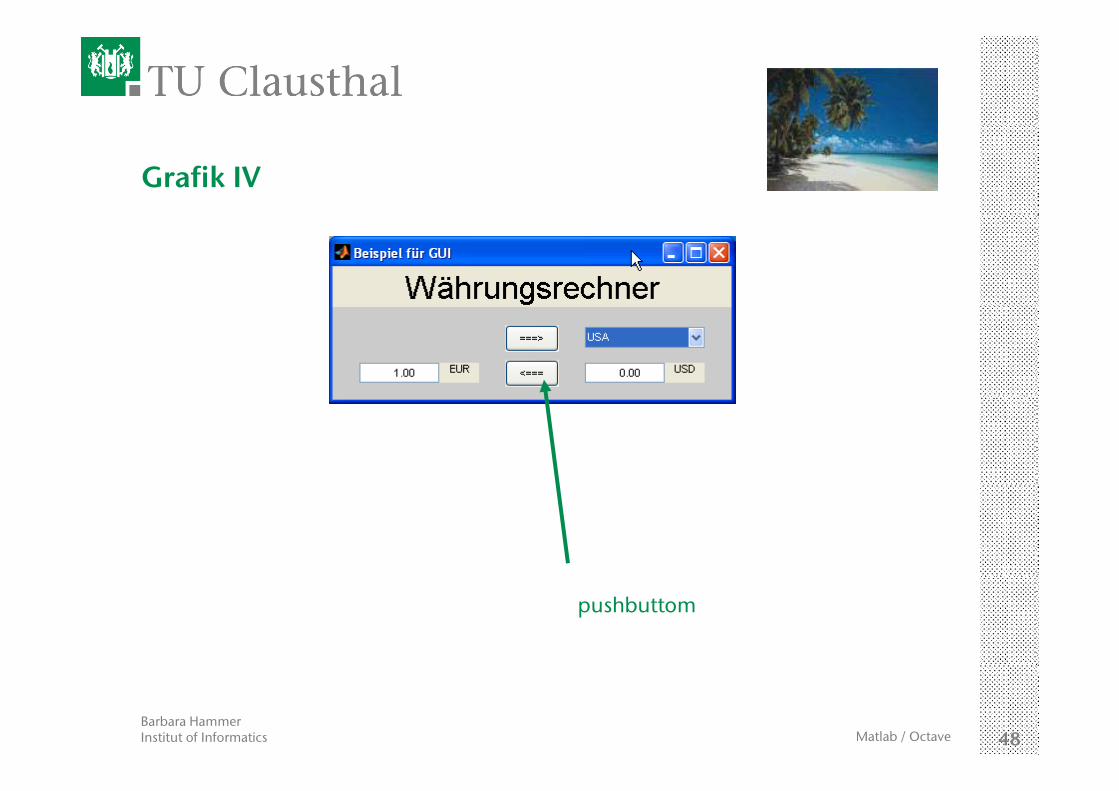
Grafik IV
pushbuttom
Barbara HammerInstitut of Informatics 48Matlab / Octave
Grafik IV
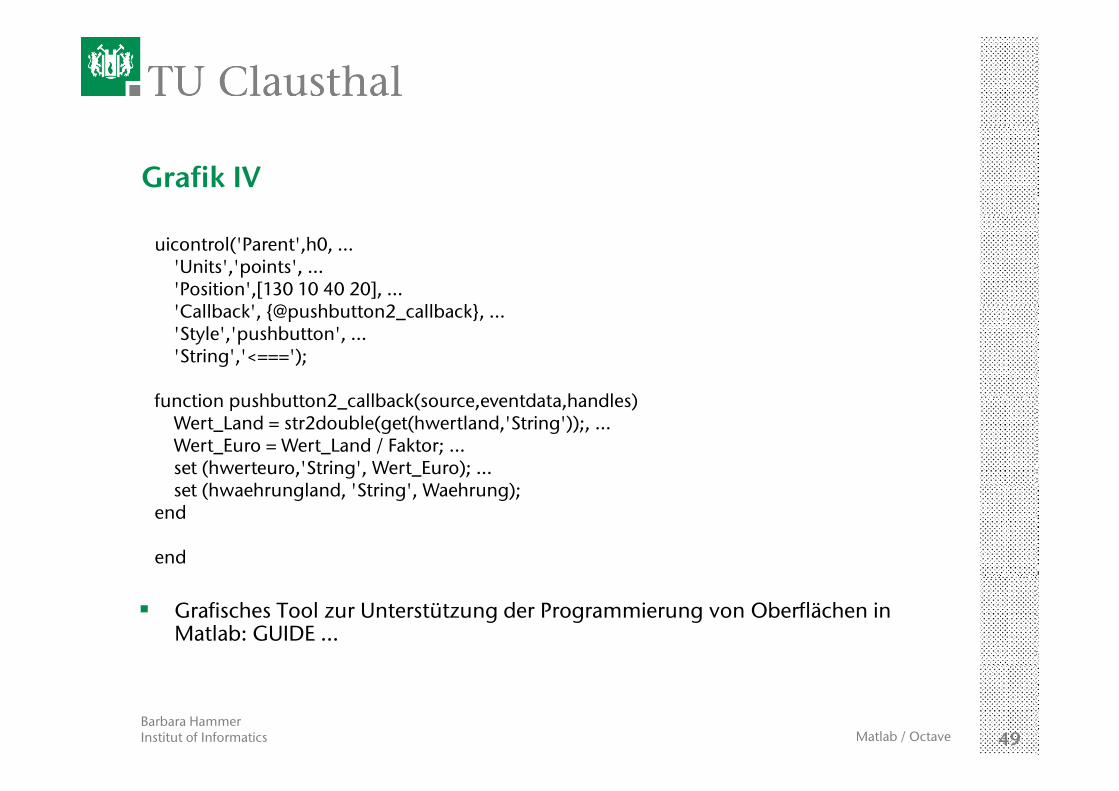
uicontrol('Parent',h0, ... 'Units','points', ...'Position',[130 10 40 20], ...'C llb k' {@ hb tt 2 llb k}'Callback', {@pushbutton2_callback}, ...'Style','pushbutton', ...'String','<===');
f ti hb tt 2 llb k( td t h dl )function pushbutton2_callback(source,eventdata,handles)Wert_Land = str2double(get(hwertland,'String'));, ... Wert_Euro = Wert_Land / Faktor; ...set (hwerteuro,'String', Wert_Euro); ...
t (h h l d 'St i ' W h )set (hwaehrungland, 'String', Waehrung);end
end
Grafisches Tool zur Unterstützung der Programmierung von Oberflächen in Matlab: GUIDE …
Barbara HammerInstitut of Informatics 49Matlab / Octave
Resume
… auf in den Urlaub!!!
Barbara HammerInstitut of Informatics 50Matlab / Octave