Embed Size (px)
Citation preview
Matrix-based pattern matching
Regulatory sequence analysis
Jacques van Helden
[email protected] Aix-Marseille Université, France
Technological Advances for Genomics and Clinics (TAGC, INSERM Unit U1090)
http://jacques.van-helden.perso.luminy.univmed.fr/
FORMER ADDRESS (1999-2011) Université Libre de Bruxelles, Belgique
Bioinformatique des Génomes et des Réseaux (BiGRe lab) http://www.bigre.ulb.ac.be/ 1
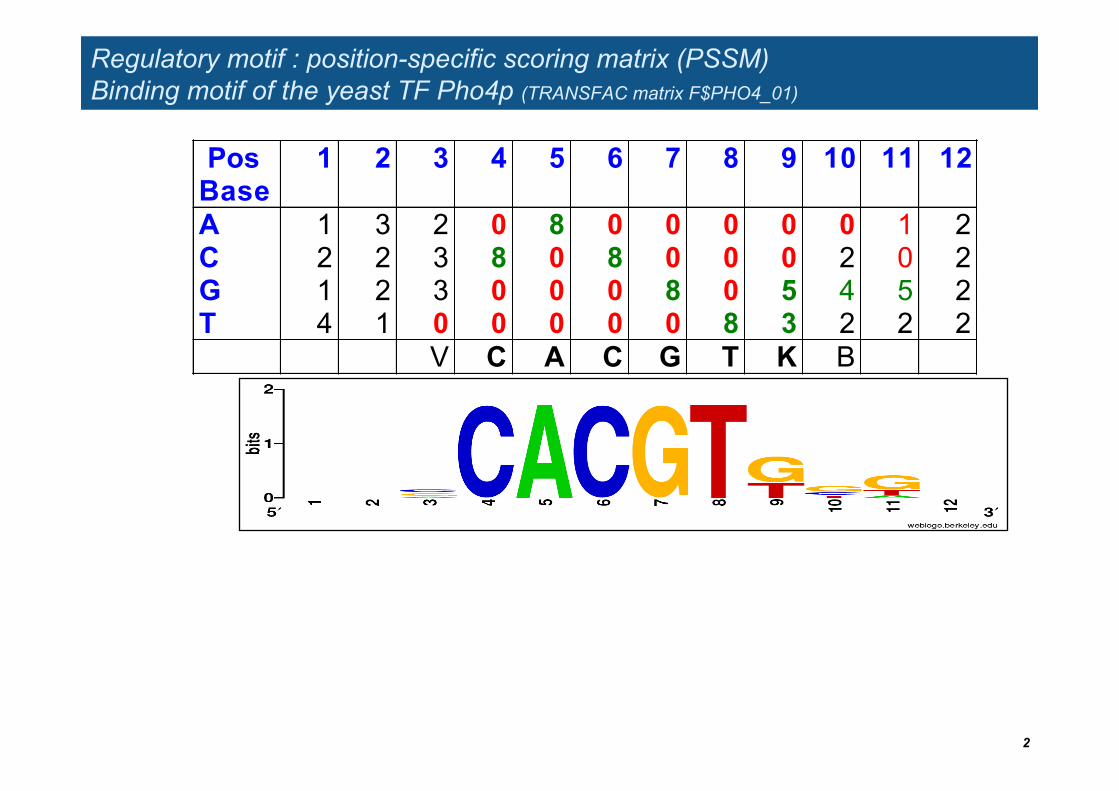
Regulatory motif : position-specific scoring matrix (PSSM) Binding motif of the yeast TF Pho4p (TRANSFAC matrix F$PHO4_01)
2
Pos Base
1 2 3 4 5 6 7 8 9 10 11 12
A 1 3 2 0 8 0 0 0 0 0 1 2 C 2 2 3 8 0 8 0 0 0 2 0 2 G 1 2 3 0 0 0 8 0 5 4 5 2 T 4 1 0 0 0 0 0 8 3 2 2 2 V C A C G T K B
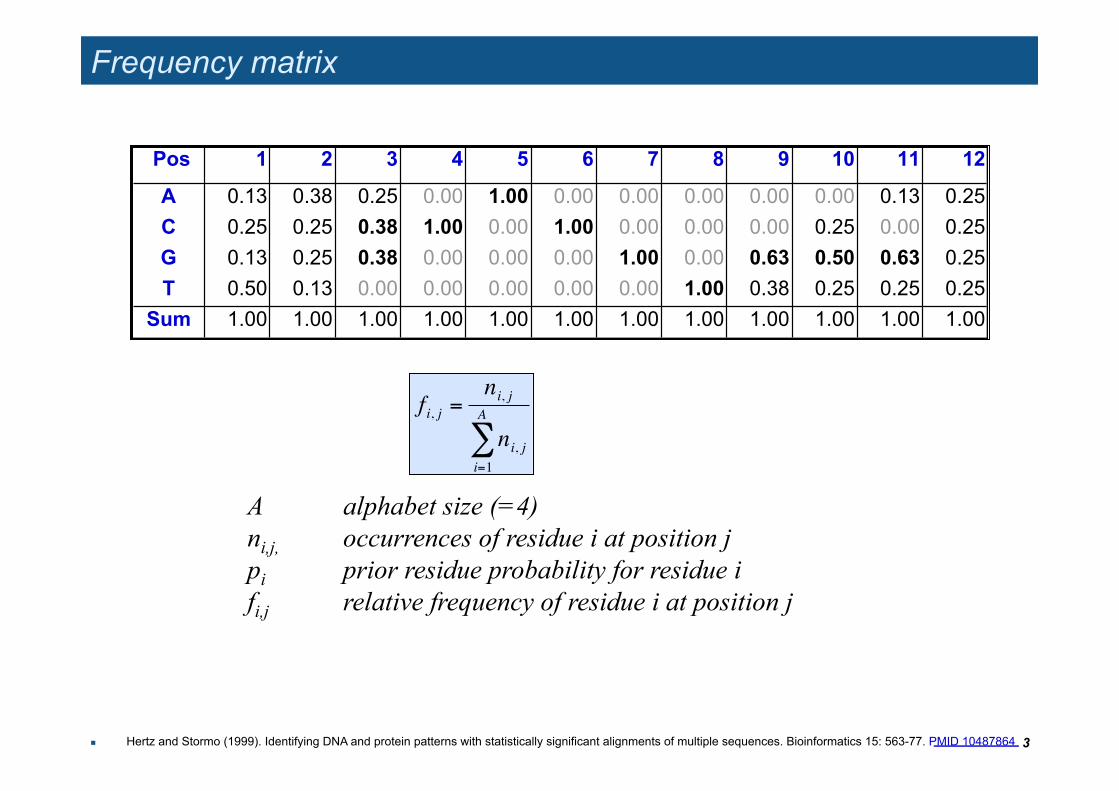
Frequency matrix
3
Pos 1 2 3 4 5 6 7 8 9 10 11 12
A 0.13 0.38 0.25 0.00 1.00 0.00 0.00 0.00 0.00 0.00 0.13 0.25 C 0.25 0.25 0.38 1.00 0.00 1.00 0.00 0.00 0.00 0.25 0.00 0.25 G 0.13 0.25 0.38 0.00 0.00 0.00 1.00 0.00 0.63 0.50 0.63 0.25 T 0.50 0.13 0.00 0.00 0.00 0.00 0.00 1.00 0.38 0.25 0.25 0.25
Sum 1.00 1.00 1.00 1.00 1.00 1.00 1.00 1.00 1.00 1.00 1.00 1.00
A alphabet size (=4) ni,j, occurrences of residue i at position j pi prior residue probability for residue i fi,j relative frequency of residue i at position j
!
fi, j =ni, j
ni, ji=1
A
"
Hertz and Stormo (1999). Identifying DNA and protein patterns with statistically significant alignments of multiple sequences. Bioinformatics 15: 563-77. PMID 10487864
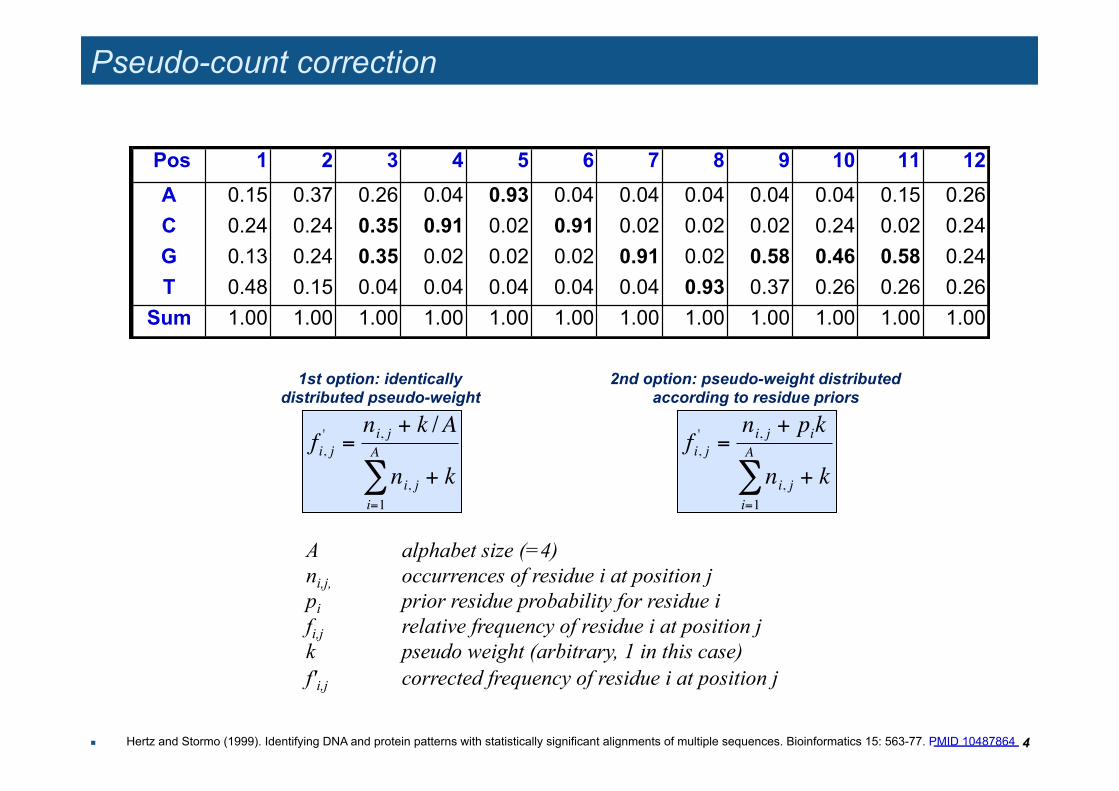
Pseudo-count correction
4
Pr
Pos 1 2 3 4 5 6 7 8 9 10 11 12
A 0.15 0.37 0.26 0.04 0.93 0.04 0.04 0.04 0.04 0.04 0.15 0.26 C 0.24 0.24 0.35 0.91 0.02 0.91 0.02 0.02 0.02 0.24 0.02 0.24 G 0.13 0.24 0.35 0.02 0.02 0.02 0.91 0.02 0.58 0.46 0.58 0.24 T 0.48 0.15 0.04 0.04 0.04 0.04 0.04 0.93 0.37 0.26 0.26 0.26
Sum 1.00 1.00 1.00 1.00 1.00 1.00 1.00 1.00 1.00 1.00 1.00 1.00
A alphabet size (=4) ni,j, occurrences of residue i at position j pi prior residue probability for residue i fi,j relative frequency of residue i at position j k pseudo weight (arbitrary, 1 in this case) f'i,j corrected frequency of residue i at position j
!
fi, j' =
ni, j + k /A
ni, ji=1
A
" + k
!
fi, j' =
ni, j + pik
ni, ji=1
A
" + k
1st option: identically distributed pseudo-weight
2nd option: pseudo-weight distributed according to residue priors
Hertz and Stormo (1999). Identifying DNA and protein patterns with statistically significant alignments of multiple sequences. Bioinformatics 15: 563-77. PMID 10487864
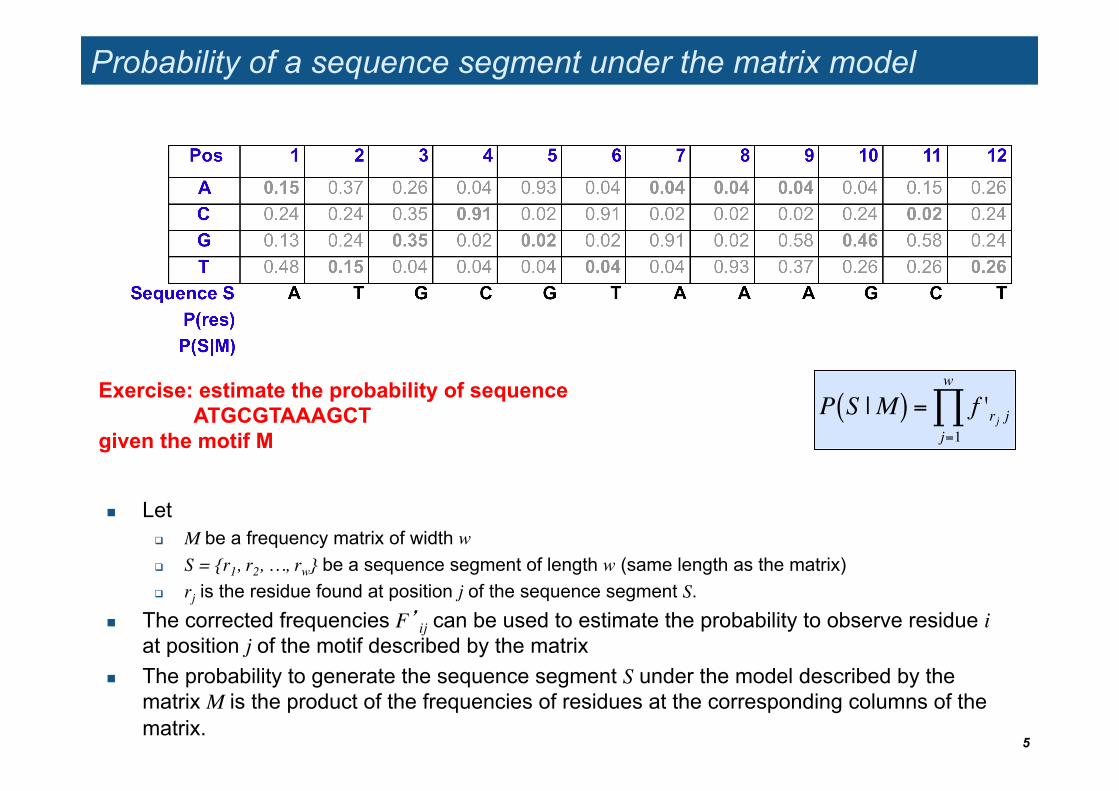
Probability of a sequence segment under the matrix model
Let M be a frequency matrix of width w S = {r1, r2, …, rw} be a sequence segment of length w (same length as the matrix) rj is the residue found at position j of the sequence segment S.
The corrected frequencies F’ij can be used to estimate the probability to observe residue i at position j of the motif described by the matrix
The probability to generate the sequence segment S under the model described by the matrix M is the product of the frequencies of residues at the corresponding columns of the matrix.
5
!
P S |M( ) = f 'rj jj=1
w
"Exercise: estimate the probability of sequence ATGCGTAAAGCT
given the motif M
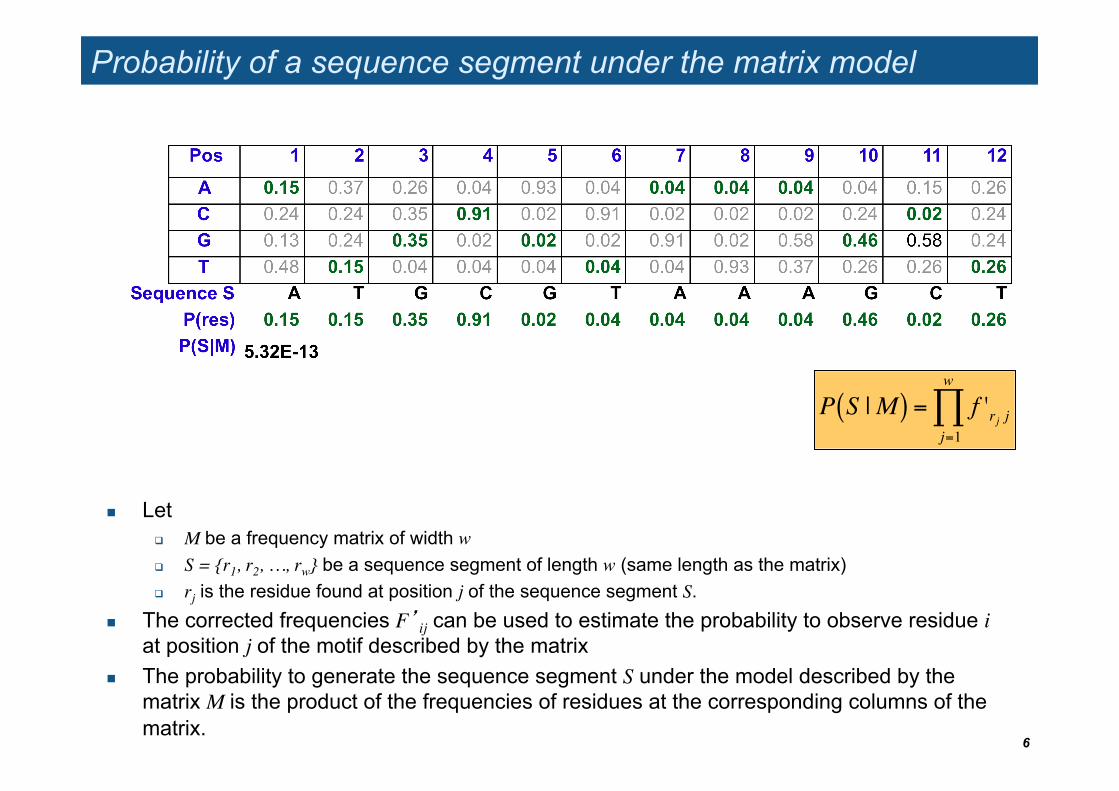
Probability of a sequence segment under the matrix model
6
!
P S |M( ) = f 'rj jj=1
w
"
Let M be a frequency matrix of width w S = {r1, r2, …, rw} be a sequence segment of length w (same length as the matrix) rj is the residue found at position j of the sequence segment S.
The corrected frequencies F’ij can be used to estimate the probability to observe residue i at position j of the motif described by the matrix
The probability to generate the sequence segment S under the model described by the matrix M is the product of the frequencies of residues at the corresponding columns of the matrix.
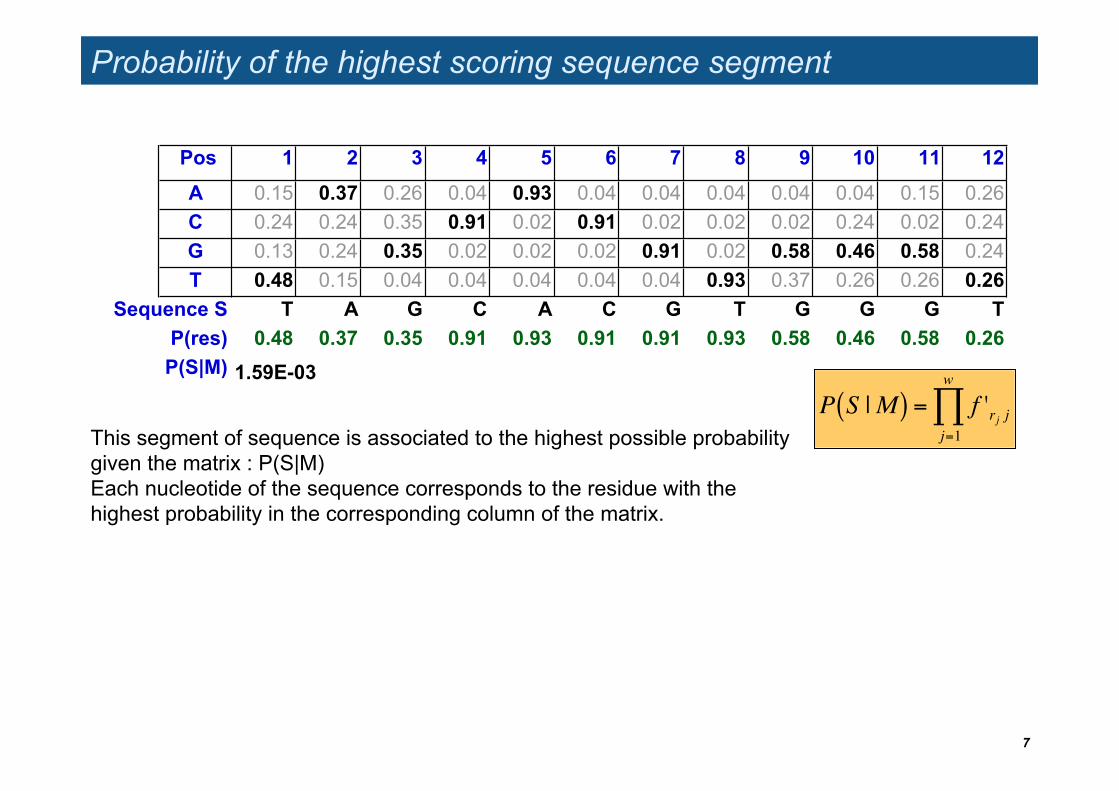
Probability of the highest scoring sequence segment
7
Pos 1 2 3 4 5 6 7 8 9 10 11 12
A 0.15 0.37 0.26 0.04 0.93 0.04 0.04 0.04 0.04 0.04 0.15 0.26 C 0.24 0.24 0.35 0.91 0.02 0.91 0.02 0.02 0.02 0.24 0.02 0.24 G 0.13 0.24 0.35 0.02 0.02 0.02 0.91 0.02 0.58 0.46 0.58 0.24 T 0.48 0.15 0.04 0.04 0.04 0.04 0.04 0.93 0.37 0.26 0.26 0.26
Sequence S T A G C A C G T G G G TP(res) 0.48 0.37 0.35 0.91 0.93 0.91 0.91 0.93 0.58 0.46 0.58 0.26
P(S|M) 1.59E-03
This segment of sequence is associated to the highest possible probability given the matrix : P(S|M) Each nucleotide of the sequence corresponds to the residue with the highest probability in the corresponding column of the matrix.
!
P S |M( ) = f 'rj jj=1
w
"
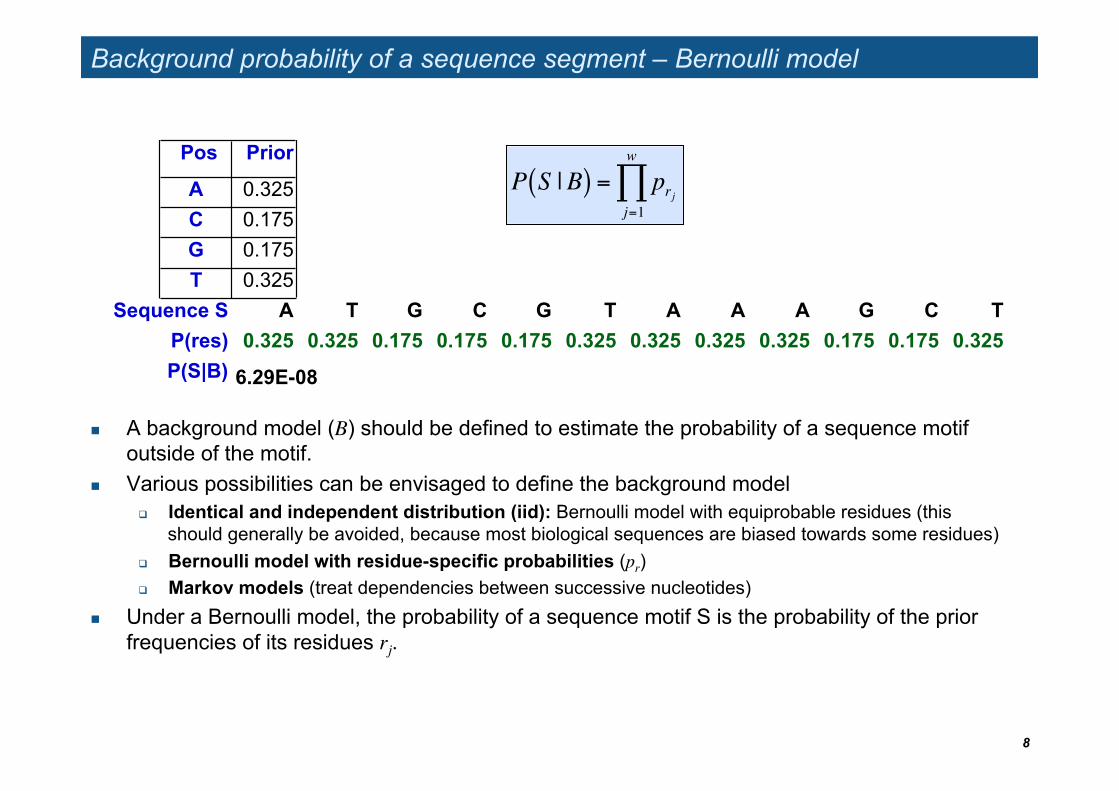
Background probability of a sequence segment – Bernoulli model
8
A background model (B) should be defined to estimate the probability of a sequence motif outside of the motif.
Various possibilities can be envisaged to define the background model Identical and independent distribution (iid): Bernoulli model with equiprobable residues (this
should generally be avoided, because most biological sequences are biased towards some residues) Bernoulli model with residue-specific probabilities (pr) Markov models (treat dependencies between successive nucleotides)
Under a Bernoulli model, the probability of a sequence motif S is the probability of the prior frequencies of its residues rj.
!
P S |B( ) = prjj=1
w
" Pos Prior
A 0.325C 0.175G 0.175T 0.325
Sequence S A T G C G T A A A G C TP(res) 0.325 0.325 0.175 0.175 0.175 0.325 0.325 0.325 0.325 0.175 0.175 0.325P(S|B) 6.29E-08
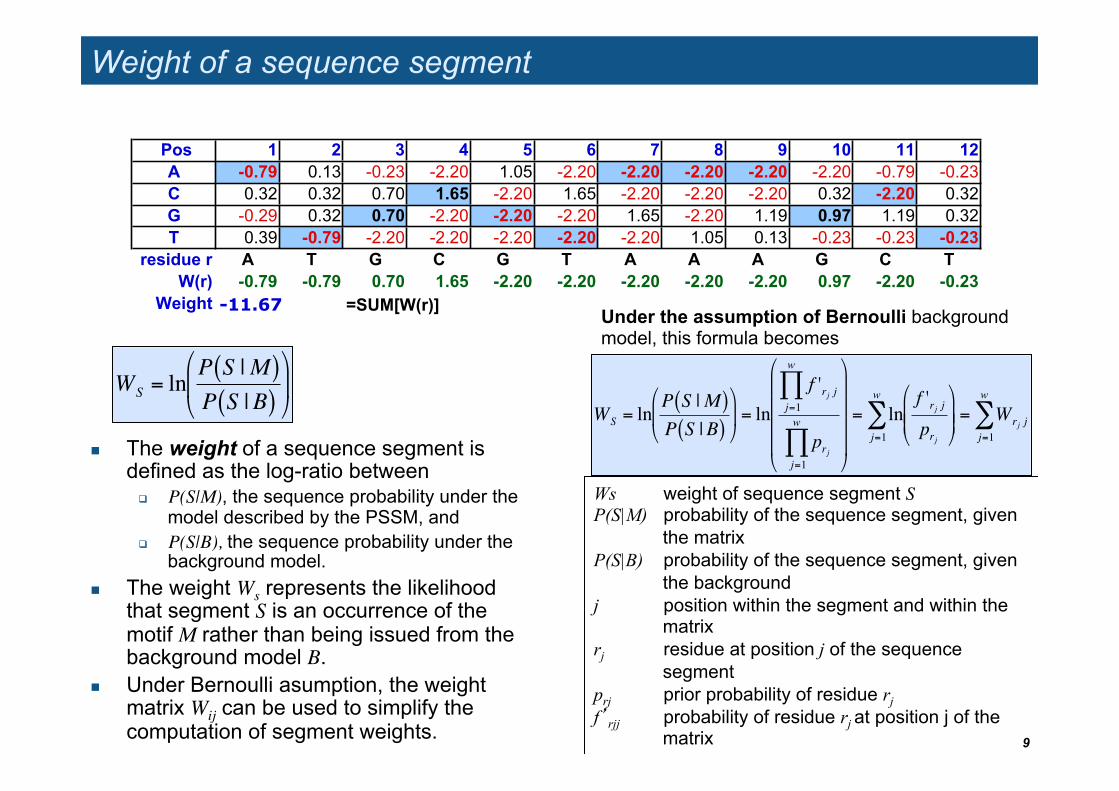
Weight of a sequence segment
The weight of a sequence segment is defined as the log-ratio between
P(S|M), the sequence probability under the model described by the PSSM, and
P(S|B), the sequence probability under the background model.
The weight Ws represents the likelihood that segment S is an occurrence of the motif M rather than being issued from the background model B.
Under Bernoulli asumption, the weight matrix Wij can be used to simplify the computation of segment weights. 9
Ws weight of sequence segment S P(S|M) probability of the sequence segment, given
the matrix P(S|B) probability of the sequence segment, given
the background j position within the segment and within the
matrix rj residue at position j of the sequence
segment prj prior probability of residue rj f’rjj probability of residue rj at position j of the
matrix
!
WS = lnP S |M( )P S |B( )
"
# $
%
& '
Pos 1 2 3 4 5 6 7 8 9 10 11 12A -0.79 0.13 -0.23 -2.20 1.05 -2.20 -2.20 -2.20 -2.20 -2.20 -0.79 -0.23 C 0.32 0.32 0.70 1.65 -2.20 1.65 -2.20 -2.20 -2.20 0.32 -2.20 0.32 G -0.29 0.32 0.70 -2.20 -2.20 -2.20 1.65 -2.20 1.19 0.97 1.19 0.32 T 0.39 -0.79 -2.20 -2.20 -2.20 -2.20 -2.20 1.05 0.13 -0.23 -0.23 -0.23
residue r A T G C G T A A A G C TW(r) -0.79 -0.79 0.70 1.65 -2.20 -2.20 -2.20 -2.20 -2.20 0.97 -2.20 -0.23
Weight =SUM[W(r)]-11.67
!
WS = lnP S |M( )P S |B( )
"
# $
%
& ' = ln
f 'rj jj=1
w
(
prjj=1
w
(
"
#
$ $ $ $
%
&
' ' ' '
= lnf 'rj jprj
"
# $ $
%
& ' '
j=1
w
) = Wrj jj=1
w
)
Under the assumption of Bernoulli background model, this formula becomes
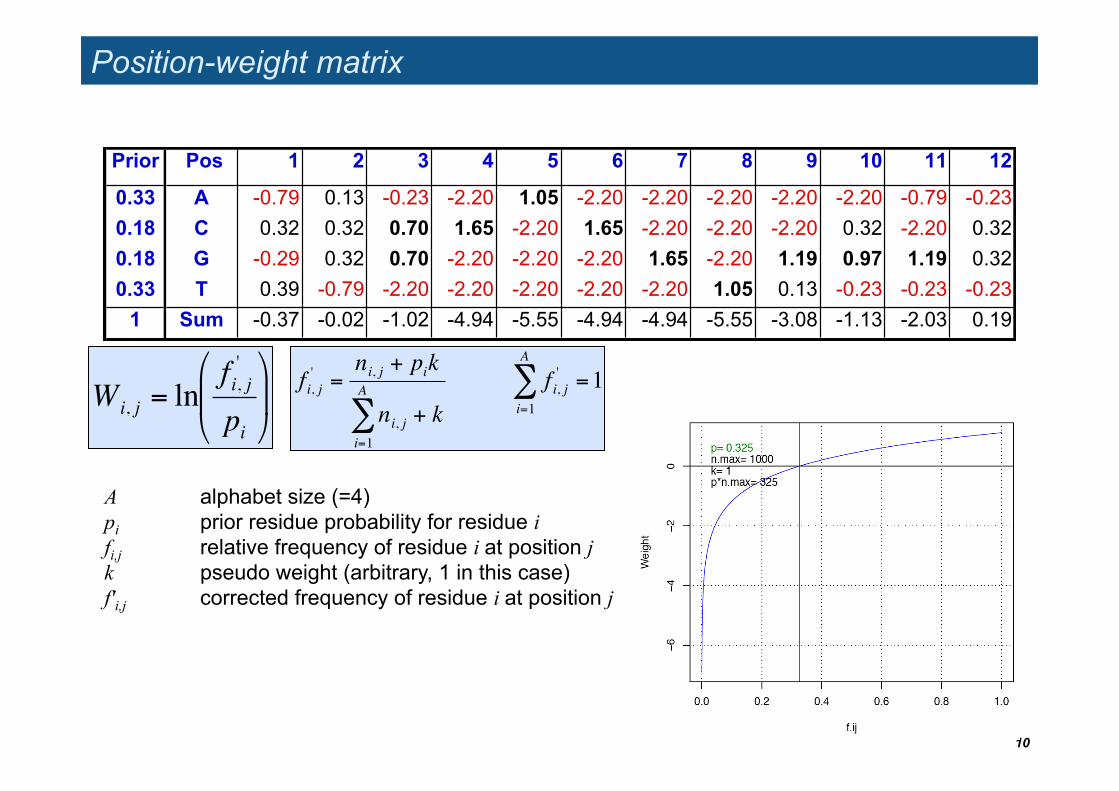
Position-weight matrix
10
Prior Pos 1 2 3 4 5 6 7 8 9 10 11 12
0.33 A -0.79 0.13 -0.23 -2.20 1.05 -2.20 -2.20 -2.20 -2.20 -2.20 -0.79 -0.23 0.18 C 0.32 0.32 0.70 1.65 -2.20 1.65 -2.20 -2.20 -2.20 0.32 -2.20 0.32 0.18 G -0.29 0.32 0.70 -2.20 -2.20 -2.20 1.65 -2.20 1.19 0.97 1.19 0.32 0.33 T 0.39 -0.79 -2.20 -2.20 -2.20 -2.20 -2.20 1.05 0.13 -0.23 -0.23 -0.23
1 Sum -0.37 -0.02 -1.02 -4.94 -5.55 -4.94 -4.94 -5.55 -3.08 -1.13 -2.03 0.19
!
Wi, j = lnfi, j'
pi
"
# $
%
& '
A alphabet size (=4) pi prior residue probability for residue i fi,j relative frequency of residue i at position j k pseudo weight (arbitrary, 1 in this case) f'i,j corrected frequency of residue i at position j
!
fi, j' =
ni, j + pik
ni, ji=1
A
" + kfi, j'
i=1
A
" =1
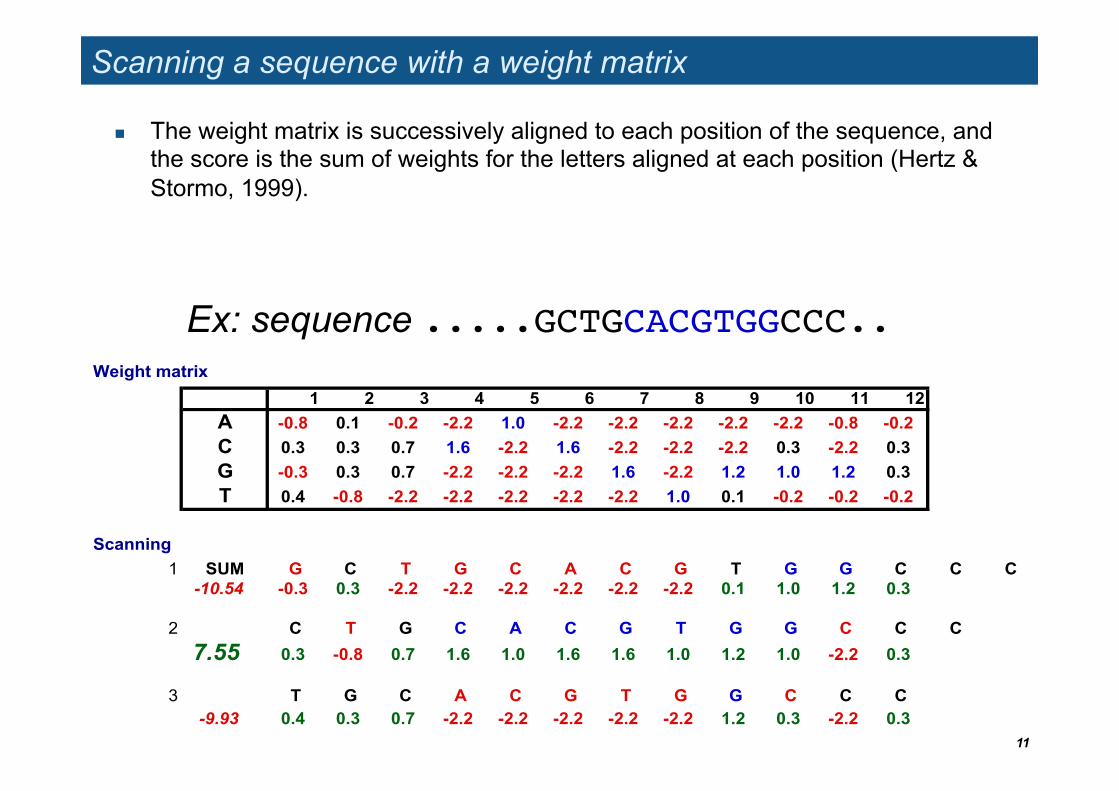
Scanning a sequence with a weight matrix
The weight matrix is successively aligned to each position of the sequence, and the score is the sum of weights for the letters aligned at each position (Hertz & Stormo, 1999).
11
Ex: sequence .....GCTGCACGTGGCCC..!Weight matrix
1 2 3 4 5 6 7 8 9 10 11 12A -0.8 0.1 -0.2 -2.2 1.0 -2.2 -2.2 -2.2 -2.2 -2.2 -0.8 -0.2 C 0.3 0.3 0.7 1.6 -2.2 1.6 -2.2 -2.2 -2.2 0.3 -2.2 0.3G -0.3 0.3 0.7 -2.2 -2.2 -2.2 1.6 -2.2 1.2 1.0 1.2 0.3T 0.4 -0.8 -2.2 -2.2 -2.2 -2.2 -2.2 1.0 0.1 -0.2 -0.2 -0.2
Scanning1 SUM G C T G C A C G T G G C C C
-10.54 -0.3 0.3 -2.2 -2.2 -2.2 -2.2 -2.2 -2.2 0.1 1.0 1.2 0.3
2 C T G C A C G T G G C C C
7.55 0.3 -0.8 0.7 1.6 1.0 1.6 1.6 1.0 1.2 1.0 -2.2 0.3
3 T G C A C G T G G C C C-9.93 0.4 0.3 0.7 -2.2 -2.2 -2.2 -2.2 -2.2 1.2 0.3 -2.2 0.3
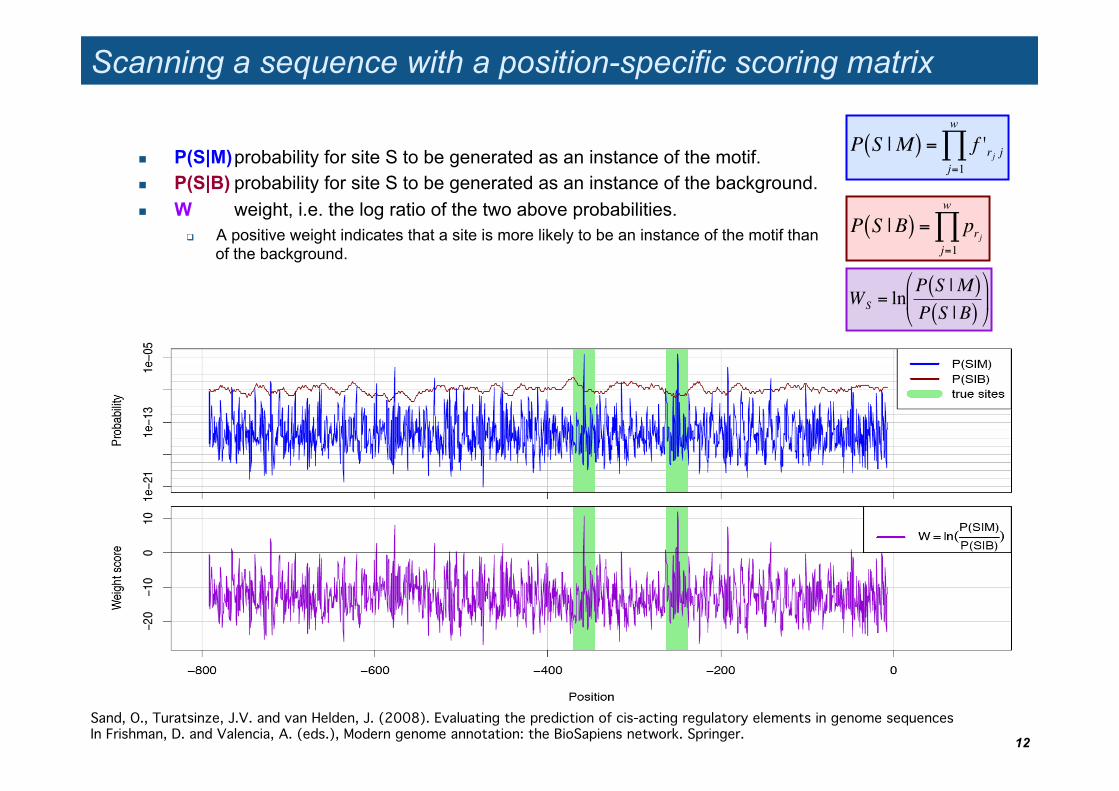
Scanning a sequence with a position-specific scoring matrix
P(S|M) probability for site S to be generated as an instance of the motif. P(S|B) probability for site S to be generated as an instance of the background. W weight, i.e. the log ratio of the two above probabilities.
A positive weight indicates that a site is more likely to be an instance of the motif than of the background.
12
Sand, O., Turatsinze, J.V. and van Helden, J. (2008). Evaluating the prediction of cis-acting regulatory elements in genome sequences In Frishman, D. and Valencia, A. (eds.), Modern genome annotation: the BioSapiens network. Springer."
!
P S |M( ) = f 'rj jj=1
w
"
!
P S |B( ) = prjj=1
w
"
!
WS = lnP S |M( )P S |B( )
"
# $
%
& '
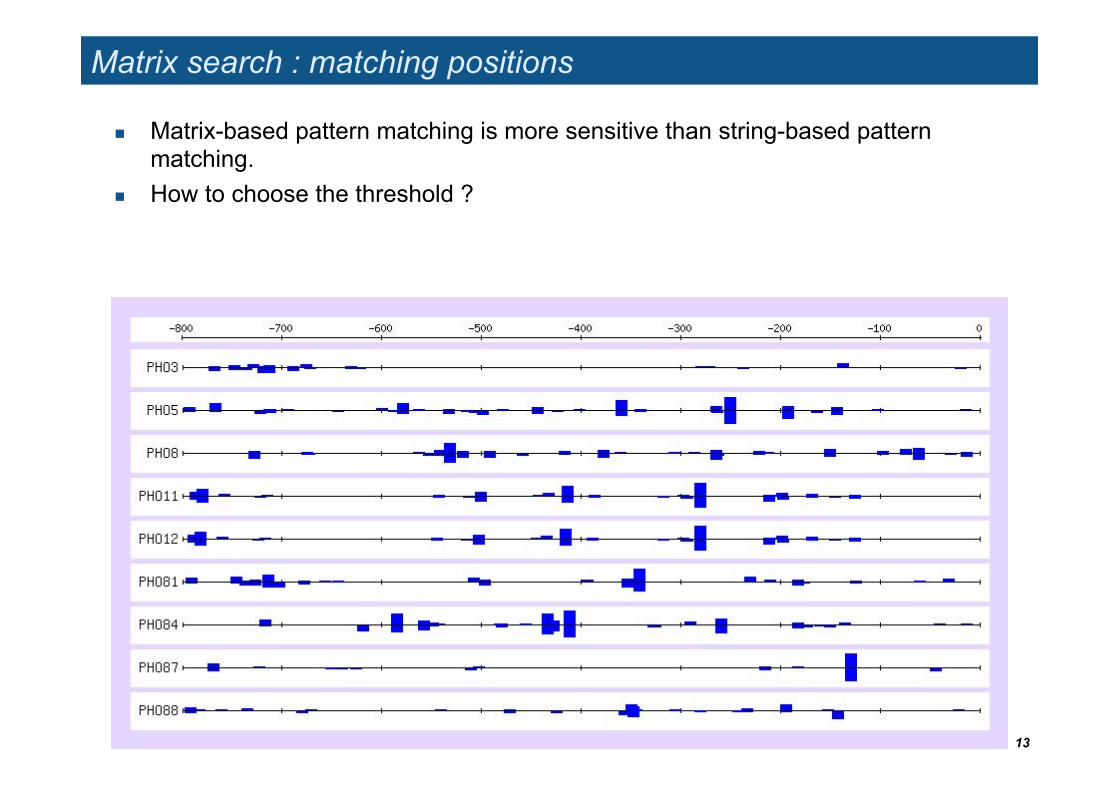
Matrix search : matching positions
Matrix-based pattern matching is more sensitive than string-based pattern matching.
How to choose the threshold ?
13
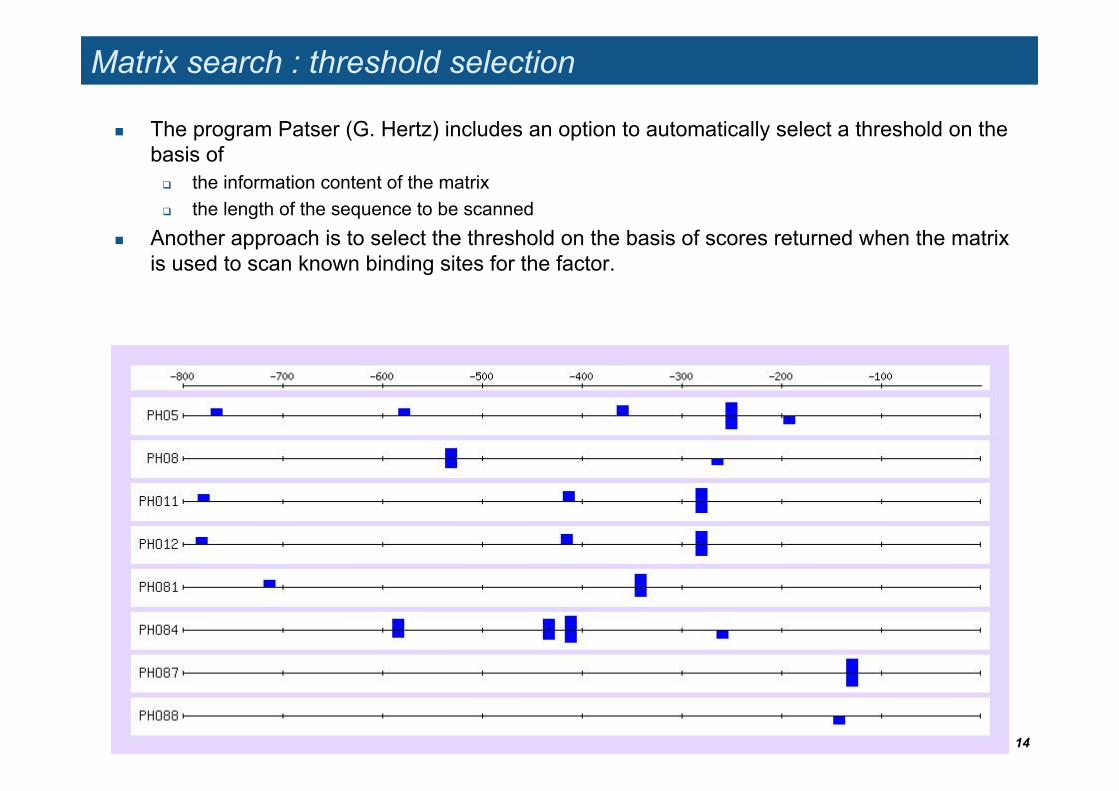
Matrix search : threshold selection
The program Patser (G. Hertz) includes an option to automatically select a threshold on the basis of
the information content of the matrix the length of the sequence to be scanned
Another approach is to select the threshold on the basis of scores returned when the matrix is used to scan known binding sites for the factor.
14
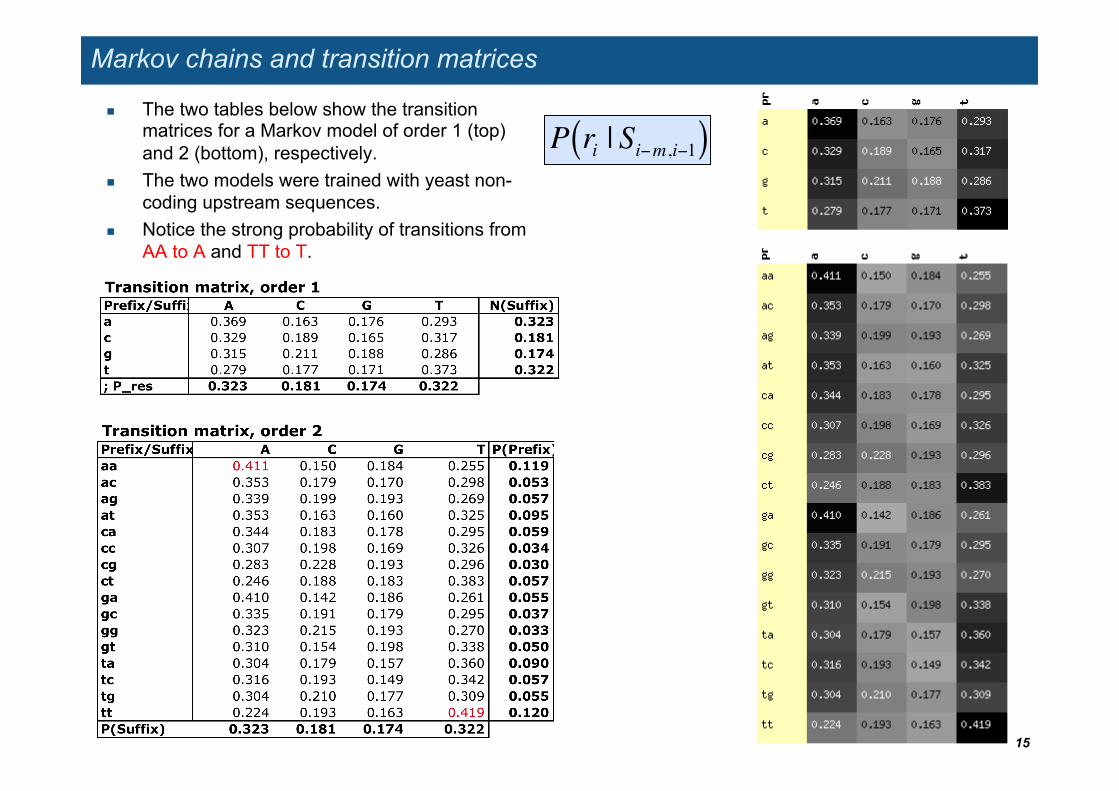
Markov chains and transition matrices
The two tables below show the transition matrices for a Markov model of order 1 (top) and 2 (bottom), respectively.
The two models were trained with yeast non-coding upstream sequences.
Notice the strong probability of transitions from AA to A and TT to T.
15
!
P ri | Si"m,i"1( )
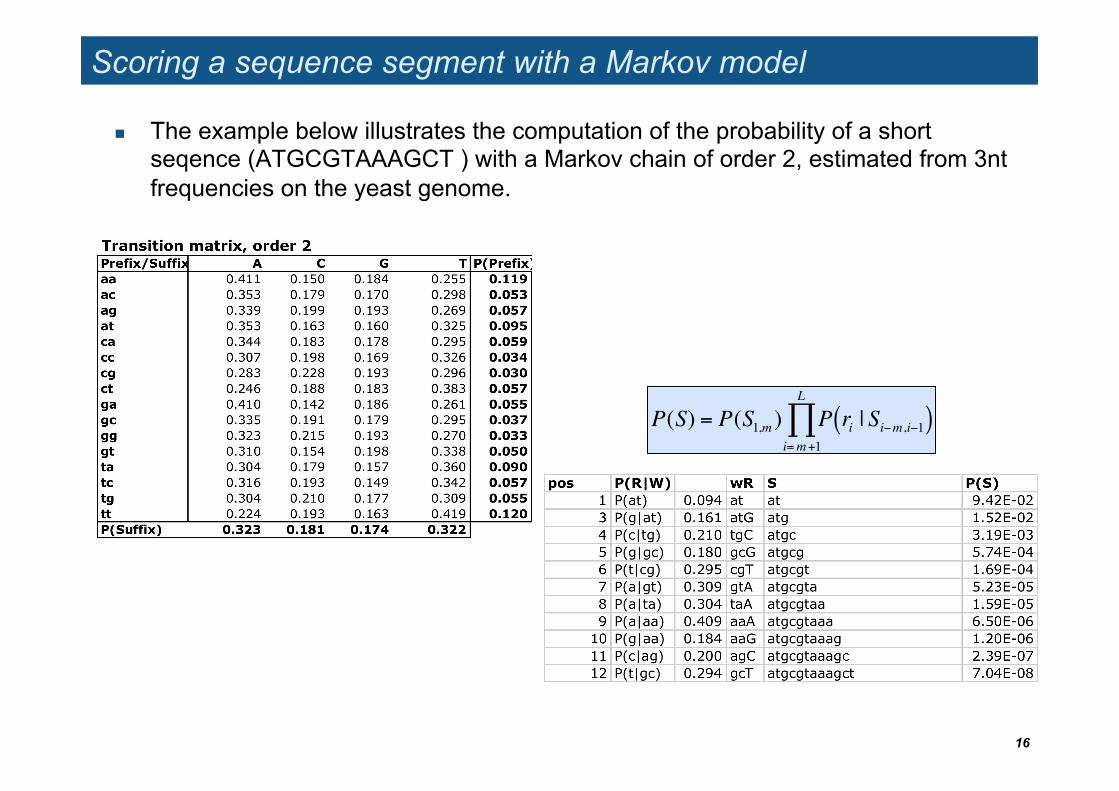
Scoring a sequence segment with a Markov model
The example below illustrates the computation of the probability of a short seqence (ATGCGTAAAGCT ) with a Markov chain of order 2, estimated from 3nt frequencies on the yeast genome.
16
!
P(S) = P(S1,m ) P ri | Si"m,i"1( )i=m+1
L
#
Sensitivity / selectivity tradeoff
The sequence is scanned with the matrix, and a score is assigned to each position.
The highest score reflects the highest probability of having a functional site. How to define the threshold ? There is a tradeoff :
high selectivity ⇔ low sensitivity high confidence in the predicted sites, but many real sites are missed low selectivity ⇔ high sensitivity
the real sites are drawn in a see of false positive
17
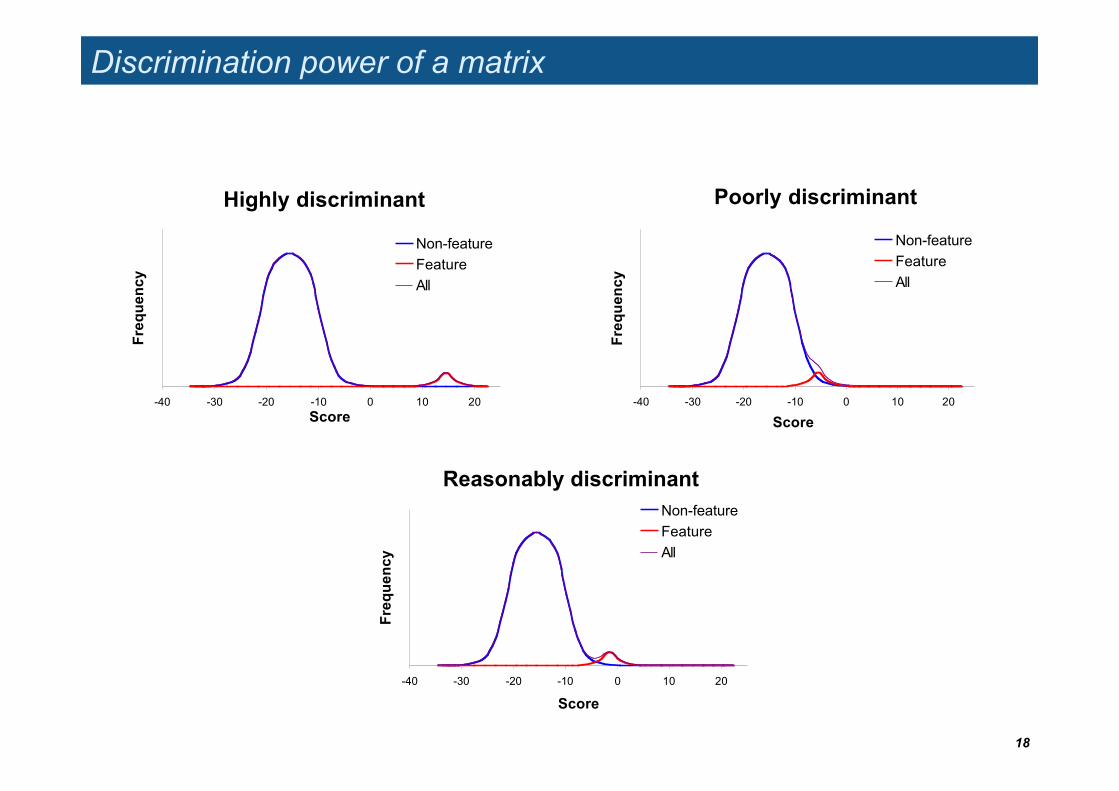
Discrimination power of a matrix
18
Highly discriminant
-40 -30 -20 -10 0 10 20Score
Freq
uenc
y
Non-featureFeatureAll
Reasonably discriminant
-40 -30 -20 -10 0 10 20
Score
Freq
uenc
y
Non-featureFeatureAll
Poorly discriminant
-40 -30 -20 -10 0 10 20
Score
Freq
uenc
y
Non-featureFeatureAll
Old slides
Regulatory Sequence Analysis
19
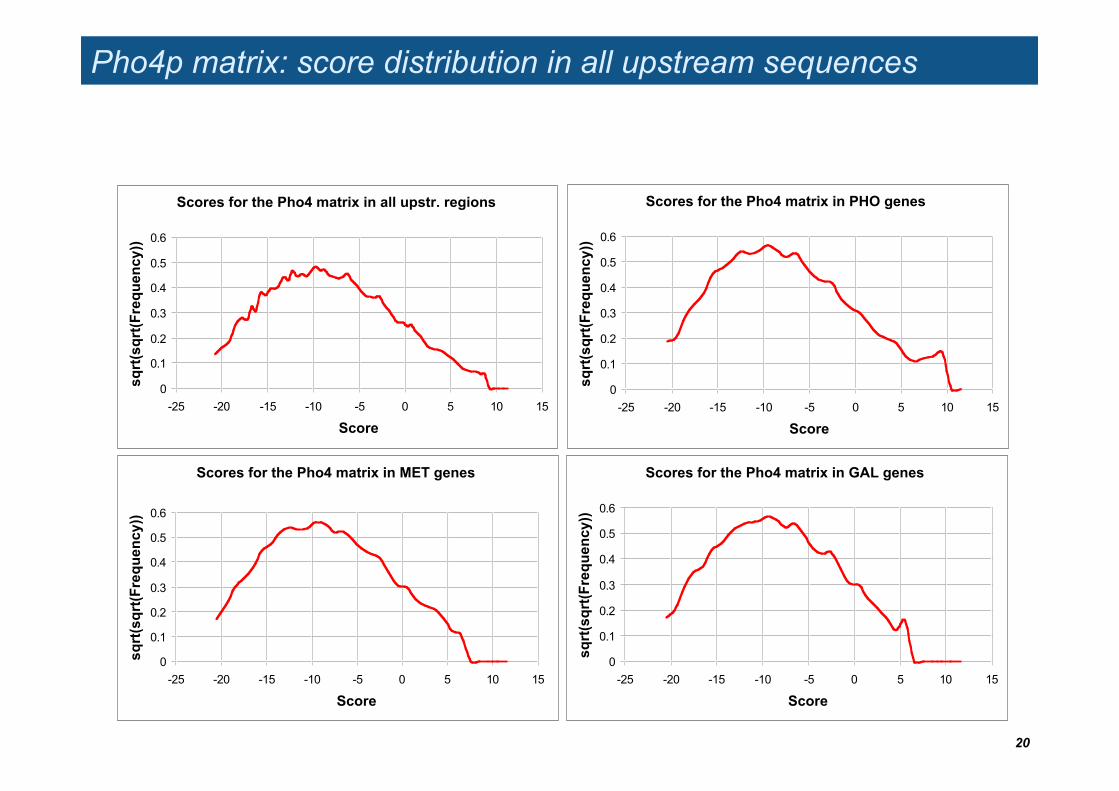
Pho4p matrix: score distribution in all upstream sequences
20
Scores for the Pho4 matrix in all upstr. regions
0
0.1
0.2
0.3
0.4
0.5
0.6
-25 -20 -15 -10 -5 0 5 10 15
Score
sqrt
(sqr
t(Fr
eque
ncy)
)
Scores for the Pho4 matrix in MET genes
0
0.1
0.2
0.3
0.4
0.5
0.6
-25 -20 -15 -10 -5 0 5 10 15
Score
sqrt
(sqr
t(Fr
eque
ncy)
)
Scores for the Pho4 matrix in GAL genes
0
0.1
0.2
0.3
0.4
0.5
0.6
-25 -20 -15 -10 -5 0 5 10 15
Score
sqrt
(sqr
t(Fr
eque
ncy)
)
Scores for the Pho4 matrix in PHO genes
0
0.1
0.2
0.3
0.4
0.5
0.6
-25 -20 -15 -10 -5 0 5 10 15
Score
sqrt
(sqr
t(Fre
quen
cy))
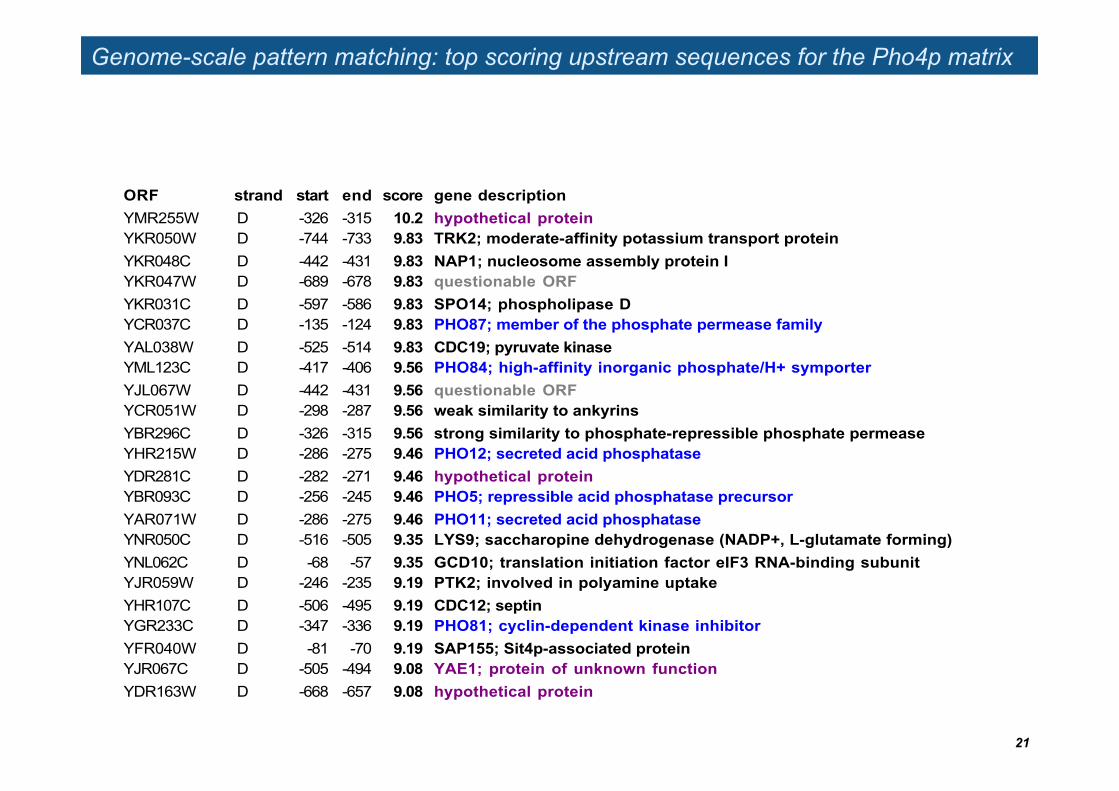
Genome-scale pattern matching: top scoring upstream sequences for the Pho4p matrix
21
ORF strand start end score gene descriptionYMR255W D -326 -315 10.2 hypothetical proteinYKR050W D -744 -733 9.83 TRK2; moderate-affinity potassium transport proteinYKR048C D -442 -431 9.83 NAP1; nucleosome assembly protein IYKR047W D -689 -678 9.83 questionable ORFYKR031C D -597 -586 9.83 SPO14; phospholipase DYCR037C D -135 -124 9.83 PHO87; member of the phosphate permease familyYAL038W D -525 -514 9.83 CDC19; pyruvate kinaseYML123C D -417 -406 9.56 PHO84; high-affinity inorganic phosphate/H+ symporterYJL067W D -442 -431 9.56 questionable ORFYCR051W D -298 -287 9.56 weak similarity to ankyrinsYBR296C D -326 -315 9.56 strong similarity to phosphate-repressible phosphate permeaseYHR215W D -286 -275 9.46 PHO12; secreted acid phosphataseYDR281C D -282 -271 9.46 hypothetical proteinYBR093C D -256 -245 9.46 PHO5; repressible acid phosphatase precursorYAR071W D -286 -275 9.46 PHO11; secreted acid phosphataseYNR050C D -516 -505 9.35 LYS9; saccharopine dehydrogenase (NADP+, L-glutamate forming)YNL062C D -68 -57 9.35 GCD10; translation initiation factor eIF3 RNA-binding subunitYJR059W D -246 -235 9.19 PTK2; involved in polyamine uptakeYHR107C D -506 -495 9.19 CDC12; septinYGR233C D -347 -336 9.19 PHO81; cyclin-dependent kinase inhibitorYFR040W D -81 -70 9.19 SAP155; Sit4p-associated proteinYJR067C D -505 -494 9.08 YAE1; protein of unknown functionYDR163W D -668 -657 9.08 hypothetical protein
Improving genome-scale predictions
The prediction of single binding sites is notoriously noisy. However, one can try to combine different types of information in order to predict the regulation of a gene as a whole, rather than each potential binding site.
Include as much biological information as possible Site repetition (e.g. GATA boxes) Combination of heterologous sites (e.g. Met4p and Met31p) Information about site positions: distribution of position for known sites and impose a
constraint on putative site positions Supervised classification: train a program with
a set of reliable positive sites (from known target genes) a set of reliable negative sites
(genes known not to respond to the factor)
22
Matching a sequence with a library of patterns
Regulatory Sequence Analysis
23
Match a sequence with a library of patterns
Goal : given a sequence, find matches for any known regulatory site → identify transcription factors that could regulate the gene
Strategy: apply systematically pattern search with all patterns stored in the library Problem: how to set the threshold for the different patterns ? Warning : generates many false positive
24
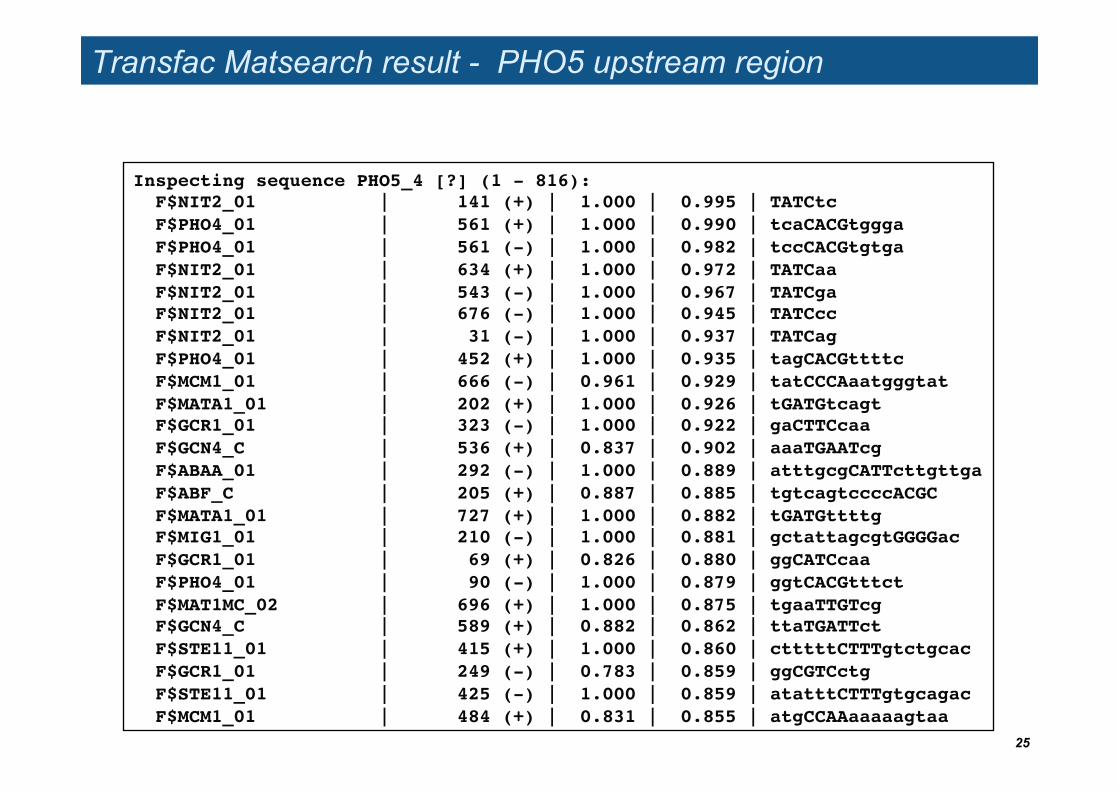
Transfac Matsearch result - PHO5 upstream region
25
Inspecting sequence PHO5_4 [?] (1 - 816):! F$NIT2_01 | 141 (+) | 1.000 | 0.995 | TATCtc! F$PHO4_01 | 561 (+) | 1.000 | 0.990 | tcaCACGtggga! F$PHO4_01 | 561 (-) | 1.000 | 0.982 | tccCACGtgtga! F$NIT2_01 | 634 (+) | 1.000 | 0.972 | TATCaa! F$NIT2_01 | 543 (-) | 1.000 | 0.967 | TATCga! F$NIT2_01 | 676 (-) | 1.000 | 0.945 | TATCcc! F$NIT2_01 | 31 (-) | 1.000 | 0.937 | TATCag! F$PHO4_01 | 452 (+) | 1.000 | 0.935 | tagCACGttttc! F$MCM1_01 | 666 (-) | 0.961 | 0.929 | tatCCCAaatgggtat! F$MATA1_01 | 202 (+) | 1.000 | 0.926 | tGATGtcagt! F$GCR1_01 | 323 (-) | 1.000 | 0.922 | gaCTTCcaa! F$GCN4_C | 536 (+) | 0.837 | 0.902 | aaaTGAATcg! F$ABAA_01 | 292 (-) | 1.000 | 0.889 | atttgcgCATTcttgttga! F$ABF_C | 205 (+) | 0.887 | 0.885 | tgtcagtccccACGC! F$MATA1_01 | 727 (+) | 1.000 | 0.882 | tGATGttttg! F$MIG1_01 | 210 (-) | 1.000 | 0.881 | gctattagcgtGGGGac! F$GCR1_01 | 69 (+) | 0.826 | 0.880 | ggCATCcaa! F$PHO4_01 | 90 (-) | 1.000 | 0.879 | ggtCACGtttct! F$MAT1MC_02 | 696 (+) | 1.000 | 0.875 | tgaaTTGTcg! F$GCN4_C | 589 (+) | 0.882 | 0.862 | ttaTGATTct! F$STE11_01 | 415 (+) | 1.000 | 0.860 | ctttttCTTTgtctgcac! F$GCR1_01 | 249 (-) | 0.783 | 0.859 | ggCGTCctg! F$STE11_01 | 425 (-) | 1.000 | 0.859 | atatttCTTTgtgcagac! F$MCM1_01 | 484 (+) | 0.831 | 0.855 | atgCCAAaaaaagtaa!

Transfac Matsearch result - random sequence (mkv 5)
26
Inspecting sequence random mkv5 [?] (1 - 817):! F$NIT2_01 | 176 (+) | 1.000 | 1.000 | TATCta! F$NIT2_01 | 656 (+) | 1.000 | 1.000 | TATCta! F$NIT2_01 | 275 (+) | 1.000 | 0.995 | TATCtc! F$NIT2_01 | 455 (+) | 1.000 | 0.995 | TATCtc! F$NIT2_01 | 298 (-) | 1.000 | 0.980 | TATCtt! F$MATA1_01 | 506 (-) | 1.000 | 0.980 | tGATGtatgt! F$ABF_C | 84 (+) | 0.991 | 0.973 | aatcattcttgACGT! F$MIG1_01 | 264 (-) | 1.000 | 0.958 | gagataaaactGGGGtt! F$NIT2_01 | 701 (+) | 1.000 | 0.947 | TATCgt! F$NIT2_01 | 802 (-) | 1.000 | 0.947 | TATCgt! F$ABF1_01 | 81 (+) | 0.976 | 0.944 | gtaaatcattcttgACGTtttt! F$MAT1MC_02 | 665 (-) | 1.000 | 0.918 | cctaTTGTga! F$NIT2_01 | 280 (-) | 1.000 | 0.915 | TATCcg! F$ABAA_01 | 42 (+) | 1.000 | 0.902 | tccccatCATTctaacagt! F$PACC_01 | 331 (-) | 1.000 | 0.897 | acgaGCCAagaaaagtt! F$ABAA_01 | 201 (+) | 1.000 | 0.883 | accatagCATTctggatct! F$MAT1MC_02 | 442 (-) | 1.000 | 0.882 | tataTTGTat! F$ABF_C | 638 (-) | 0.991 | 0.882 | agtcaaatgaaACGT! F$ABF_C | 609 (-) | 0.949 | 0.874 | tttctttaaacACGG! F$MATA1_01 | 558 (-) | 1.000 | 0.868 | tGATGgaaga! F$HSF_03 | 713 (-) | 1.000 | 0.859 | AGAAttgaaattttt! F$MAT1MC_02 | 134 (-) | 1.000 | 0.858 | cacaTTGTgt! F$ABAA_01 | 80 (+) | 1.000 | 0.856 | agtaaatCATTcttgacgt! F$HAP234_01 | 332 (-) | 1.000 | 0.851 | acgagCCAAgaaaagt!
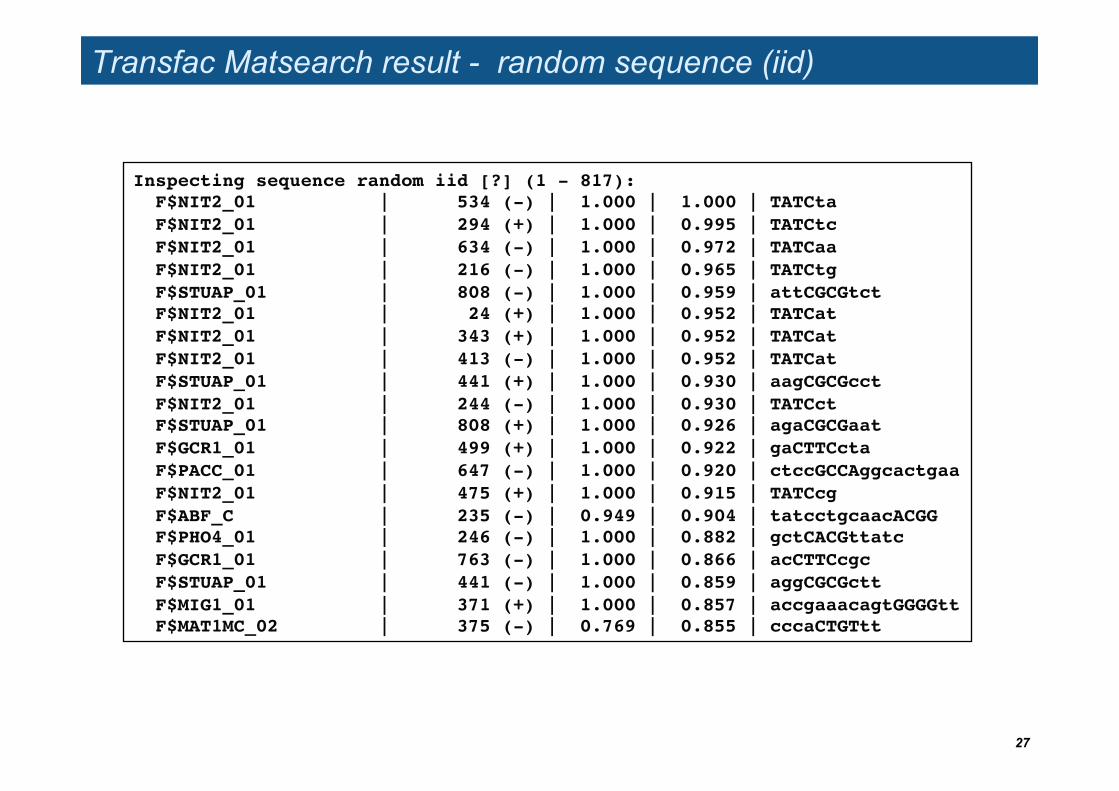
Transfac Matsearch result - random sequence (iid)
27
Inspecting sequence random iid [?] (1 - 817):! F$NIT2_01 | 534 (-) | 1.000 | 1.000 | TATCta! F$NIT2_01 | 294 (+) | 1.000 | 0.995 | TATCtc! F$NIT2_01 | 634 (-) | 1.000 | 0.972 | TATCaa! F$NIT2_01 | 216 (-) | 1.000 | 0.965 | TATCtg! F$STUAP_01 | 808 (-) | 1.000 | 0.959 | attCGCGtct! F$NIT2_01 | 24 (+) | 1.000 | 0.952 | TATCat! F$NIT2_01 | 343 (+) | 1.000 | 0.952 | TATCat! F$NIT2_01 | 413 (-) | 1.000 | 0.952 | TATCat! F$STUAP_01 | 441 (+) | 1.000 | 0.930 | aagCGCGcct! F$NIT2_01 | 244 (-) | 1.000 | 0.930 | TATCct! F$STUAP_01 | 808 (+) | 1.000 | 0.926 | agaCGCGaat! F$GCR1_01 | 499 (+) | 1.000 | 0.922 | gaCTTCcta! F$PACC_01 | 647 (-) | 1.000 | 0.920 | ctccGCCAggcactgaa! F$NIT2_01 | 475 (+) | 1.000 | 0.915 | TATCcg! F$ABF_C | 235 (-) | 0.949 | 0.904 | tatcctgcaacACGG! F$PHO4_01 | 246 (-) | 1.000 | 0.882 | gctCACGttatc! F$GCR1_01 | 763 (-) | 1.000 | 0.866 | acCTTCcgc! F$STUAP_01 | 441 (-) | 1.000 | 0.859 | aggCGCGctt! F$MIG1_01 | 371 (+) | 1.000 | 0.857 | accgaaacagtGGGGtt! F$MAT1MC_02 | 375 (-) | 0.769 | 0.855 | cccaCTGTtt!


![[PPT]Analysis of Algorithms - Utah State Universitydigital.cs.usu.edu/~allanv/cs5050/Goodrich/Chap9.ppt · Web viewPattern Matching Pattern Matching * Pattern Matching * Our algorithm](https://img.pdfslide.net/doc/110x75/5abed1fe7f8b9a5d718d8042/pptanalysis-of-algorithms-utah-state-allanvcs5050goodrichchap9pptweb-viewpattern.jpg)