Embed Size (px)
Citation preview
JOURNAL OF MULTIDISCIPLINARY ENGINEERING SCIENCE AND TECHNOLOGY (JMEST)
ISSN: 3159-0040
VOL. 2 ISSUE 1, JANUARY - 2015
www.jmest.org
JMESTN42350321 88
Maximization of Oil Production in the Norne Field C-Segment: Well Placement Comparative
Study Stella Akpan,
Chemical/Petroleum Department, University of Uyo, P.M.B 1017,Uyo,
Akwa Ibom State, Nigeria; [email protected]
Livinus Aniefiok, Chemical/Petroleum Department,
University of Uyo, P.M.B 1017, Uyo, Akwa-Ibom State, Nigeria; [email protected]
Jon Kleppe, Department of Petroleum Engineering and
Applied Geophysics, Norwegian University of Science and Technology,
7491 Trondheim; [email protected]
Richard Rwechungura, Department of Petroleum Engineering and
Applied Geophysics, Norwegian University of Science and Technology,
7491 Trondheim; [email protected]
Abstract—Maximum oil production can be
obtained with more oil wells, but few optimal numbers of wells in good location reduces economic costs and increase recovery. In this work, The Norne field C-segment reservoir model
in Eclipse software is used to study the effect of well placement. Six producers (while the four injectors remain the same as those of the base case) for two different well placement scenarios, 1 and 2, are located manually after identifying grid blocks with high oil saturation from an updated geological model. Insignificant variation in oil recovery factors, 1.3%, is obtained for the base case and the two scenarios. However, after taking into account the well costs, gas and water injection costs under reasonable economic assumption, the NPV results shows that scenario 2 with the highest NPV is considered to be more favourable.
Keywords—Maximum Oil production, Well placement, Norne field C-Segment, Reservoir Simulation, Oil Recovery, Economic Analysis, Net Present Value.
I. INTRODUCTION
The Norne database in the Center of Integrated Operation in the Petroleum industry at the Norwegian University of Science and Technology (NTNU) has a license limitation but it is readily available for postgraduate research projects. Many academic projects, mostly simulation of chemical EOR processes to improve oil recovery from Norne field, have been carried out at the Center of Integrated Operation in the Petroleum industry at the Norwegian University of Science and Technology (NTNU) by utilizing the Norne database.
However, this work studies the effect of well placement for maximum oil recovery in the Norne Field C-segment. Determining the best location for new wells is a complex problem that depends on
reservoir and fluid properties, well and surface equipment specifications, and economic criteria. Placing too many wells in oil reservoir is known to have tremendous effect in oil recovery but it has also cause increase in economic cost in the oil industry for many years now. Optimum well placement most of the time is done based on a deterministic (most likely) case. In this sense, the use of reservoir simulation allows the engineer to evaluate different placement scenarios.
A total number of ten wells; six producers and four injectors are placed in each scenario. In order to obtain maximum oil recovery, the producers are placed horizontally while injectors remain the same as those from the base case. The new well placements in the scenarios are identified with the suffix “P-H” for producers and “I-H” for injectors. Simulation results, the total oil produced for wells in each scenario from the start year 1997 to December 2015 are reported.
The Net present values for the three cases are then calculated taking into account the economic costs such as well cost, cost of gas and water injection. Sensitization was done on the oil price ($25, $35). The NPV results are discussed and the most economical well placement scenario is thus identified.
II. THE NORNE FIELD AND ITS SIMULATION MODEL
The Norne field, one of the largest discovery on the Norwegian continental shelf in more than a decade with recoverable oil reserves of 450 Mbbl, has four main fault blocks of C, D, E and G segment. The Norne Main Structure (Norne C-, D- and E-segment, discovered in 1991) contains 97% of the oil in place. The Norne field is in Blocks 6008/10 and 6508/10 on a horst block in the southern part of the Nodland II area in the Norwegian Sea. The drainage strategies/drive mechanisms on the field are pressure depletion, gas injection, water injection and combine gas and water injection. Based on the framework, water and gas
JOURNAL OF MULTIDISCIPLINARY ENGINEERING SCIENCE AND TECHNOLOGY (JMEST)
ISSN: 3159-0040
VOL. 2 ISSUE 1, JANUARY - 2015
www.jmest.org
JMESTN42350321 89
injection is recommended as the base mechanism for the C-segment field. The rocks within the Norne reservoir are Late Triassic to Middle Jurassic. The current geological model has five reservoir zones-Garn, Not, Ile, Tofte, and Tilje. Oil is found mainly in the Ile and Tofte formations, and gas is found in the Garn formation. The sandstones are at a depth of 2500m to 2700m. The porosity ranges from 25 to 30%, and permeability varies from 20md to 2500md. The data consist of near-, middle-, and far-stack 3D-seismic data acquired in 2001, 2003, and 2004.
The Norne field has been simulated by four different Eclipse black oil models, from oldest to newest [13, 14]. New simulation models are built when significant updates of the geological model are done, or if certain formation needs refinement. The reservoir model used in this work is the 2004 geological model with 3D three-phase full field black-oil model. The Norne full field model consists of 49080 active grid cells. DX & DY range between 80 – 100 m. The Norne C-segment coarsened grid model was separated from the rest of the field by keeping the C-segment coarsened model with 29x49x22 grid blocks active. Water compressibility of 4.67 x 10⁻⁵/bar at 277 bars and rock compressibility factor of 4.84 x 10⁻⁵/bar are used in the model. The formation volume factor used is 1.038 Rm3/Sm3 and the oil viscosity is 0.318 cp.
III. WORK FLOW
This section explains the base case which is defined as the initial case obtained from Eclipse 100 simulation run from Statoil. The scenarios 1 and 2 are created based on the initial field reservoir conditions (rock and fluid properties) at 1997. New wells are placed manually on high oil saturation on the scenario cases and the results obtained on well placement and oil production will be compared for economic benefit.
A. Base Case
The total number of wells located on the base case is 13, 9 producers and 4 injectors from the simulated model of the field from the duration of 1997 to 2006. More also, the work will predict production until 2015. In the base case the producing well and injection wells used a template name B, D, K and C respectively. Well locations on the base case are based on the following principles [15]:
- Water injectors are located at the flanks of the reservoir
- Gas injectors located at the structural heights of the reservoir.
- Oil producers located between gas and water injectors for delaying gas and water breakthrough.
- Oil producers are located at some distance from major faults to avoid gas inflow.
B. Drilling and Completion Strategy
Three Well; B-2H, D-1H and D-2H, was drilled from the start-up in the C-segment field base case. These give plateau production in 2000. Two producers show good productivity and late gas break through. The last five were drilled continuously form the production start-up with a drilling time of 1-2 years until 2006. The four injectors are locations close to the edge of the simulation model rounding the in centre all the producers. The first injector well C-1H was drilled a year after the stat-up of the field 1997, and follow by the other four injectors all drilled in 1998. The water injection wells has 5.5” and 7” tubing. The injection pressures are dependent on the bottom-hole pressure required to flow the water into the reservoir formation.
The wells are completed in different formations depending on the drainage strategy. The water injectors are perforated below the oil-water contact, and the two gas injectors are perforated in layer one top Garn formation. The vertical production wells are generally perforated in the Ile 1, top of Tofte 3 and Tofte. The production wells are completed to delay gas and water breakthrough and to minimize the amount of well interventions required [16].
C. Well Placement for Scenario 1 and 2
The objective was to place minimum number of wells to obtain same or higher recovery than the Statoil. A decision was made that 10 new wells will be placed taking well type, location and spacing in to consideration. In new well placement, the suffix “P” is used for producers and “I” is used for the injectors in both scenarios 1 and 2. The flow in the reservoir from the base case shows good recovery on both vertical and horizontal wells but high recovery is achieved with horizontal wells then the vertical wells. Since few wells will be placed to achieve high recovery, slant vertical wells and horizontal will be placed to decrease the drilling and operational cost.
D. Procedure
The base case wells were all removed from the Schedule file and the field was left with no wells accepts general reservoir properties. The flow pattern was studied along with oil/gas water saturation. New schedule files from Eclipse were formed and well placed continuously for each year starting with the P-1H to P-6H wells. First, by using keyword WELOPEN all existing injection wells were stopped and then opened only when observed pressure drop during production which are in both scenarios. Well properties in COMPDAT and WELSPECS keyword were on defaulted except wellbore.
To achieve a successful placement both for Scenario 1 and 2, several numbers of simulation runs was carried out and 6 successful producers, P-1H, P-2H, P-3H, P-4H, P-5H and P-6H, all horizontally placed for Scenario 1, while 4 producers, the remaining 2 producers were left in the same position as in Scenario 1, were placed for Scenario 2. The producer placement and completion are carry out where there is only high oil saturation in the field after
JOURNAL OF MULTIDISCIPLINARY ENGINEERING SCIENCE AND TECHNOLOGY (JMEST)
ISSN: 3159-0040
VOL. 2 ISSUE 1, JANUARY - 2015
www.jmest.org
JMESTN42350321 90
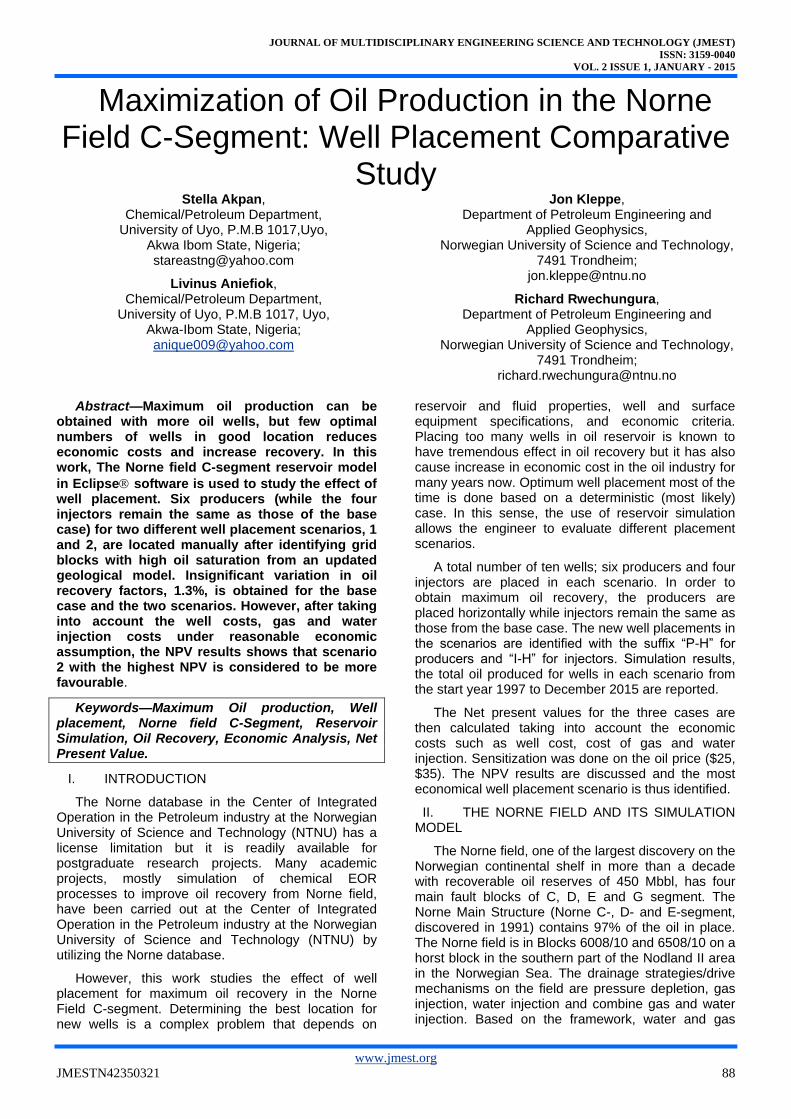
studying the direction of flow in the reservoir. The completions were targeted at the Ile and the Tofte formations which contain about 80% of the oil in Norne C-Segment.
The location of injection wells depends on the factor such as reservoir structure, injected fluid type, and displacement mechanism. Therefore, all injection wells, I-1H, 1-2H, I-3H, and I-4H, in both scenario cases were left in the same location as in the base case. Injection wells are all vertical with perforation in the bottom for water injection and in the top for gas injection. Some of water injection wells are perforated throughout the reservoir. (See Figure 1 for the Wells trajectory from simulation run for the Base case, Scenario 1& 2 in the Norne Field C-Segment.).
To decrease simulation time restart file for first 9 years of production was made. Then for each case including the base case, additional 9 years of
production were simulated using Eclipse software. Results of simulation were extracted from RSM files and compared between each other. In this part of report cases are compared only by using value of recovery factor. For economic calculation following indexes were extracted with time step of one year: cumulative oil production, cumulative water and gas injected. Description of the scenario cases and recovery factor after additional 9 years of production will be explain in as we go further on this work.
E. Production and injection constraints
A slight variation in Production and injection constraints is used in the simulation cases. For the
base case, maximum oil production rate for each oil producer is 7008 Sm3/day while the maximum oil production rate for each oil producer in scenario 1 and 2 is 8009 Sm3/day. Other production and injection constraints include;
- Maximum oil production rate for each oil producer is 7008 Sm3/day
- Maximum gas injection rate for each gas injector is 2600000 Sm3/day.
- Maximum water injection rate for each water injector is 3760 Sm3/day
- Maximum water-cut is 95%
- Maximum gas oil-ratio is 15675 Sm3/Sm3
- Maximum bottom-hole pressure is 376 bars
F. Reservoir Simulation Results and Discussions
The results obtained from simulation on base case field production and the scenario 1 and 2 well placement production and injection are presented and discussed. The results combine the initial production profile of the reservoir from 1997 to 2006 and the expected (forecast) production to 2015. Also the recoverable and unrecoverable reserves are summarised.
a. Oil Production Results
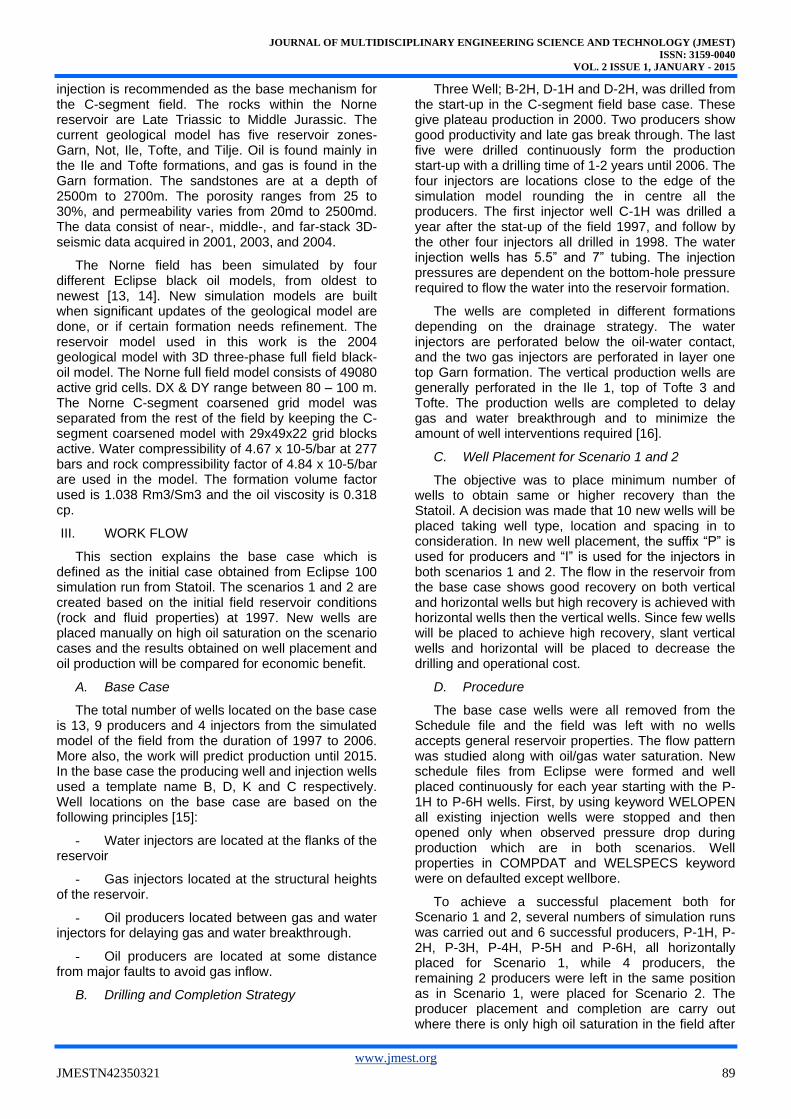
The Oil production in the base case from the year 1997 to 2006 is approximately 31.6 million Sm3. Oil production in case 1 is 34.3 million Sm3 and Scenario 2 is 36.7 million Sm3. Oil production forecast for the base case from 2006 to 2015 is estimated as 9.7 million Sm3. A total of 8.5 million Sm3 of oil is produced in this nine-year period in scenario 1 and 6.5 million Sm3 in scenario 2. The field oil production and the total oil production rate profiles for the three cases can be seen in Figure 2. The cumulative oil production rises from the base case to 41.3 million Sm3. The oil production for scenario case rises to 42.8 and 43.2 million Sm3 in scenario 1 & 2 cases. This shows that there is an increase of 1.5 to 1. 9 million Sm3 of oil production for the two cases when compared to the base case.
Fig 1: Wells trajectory from simulation run for the Base case, Scenario 1&
2
JOURNAL OF MULTIDISCIPLINARY ENGINEERING SCIENCE AND TECHNOLOGY (JMEST)
ISSN: 3159-0040
VOL. 2 ISSUE 1, JANUARY - 2015
www.jmest.org
JMESTN42350321 91
b. Gas Production Results
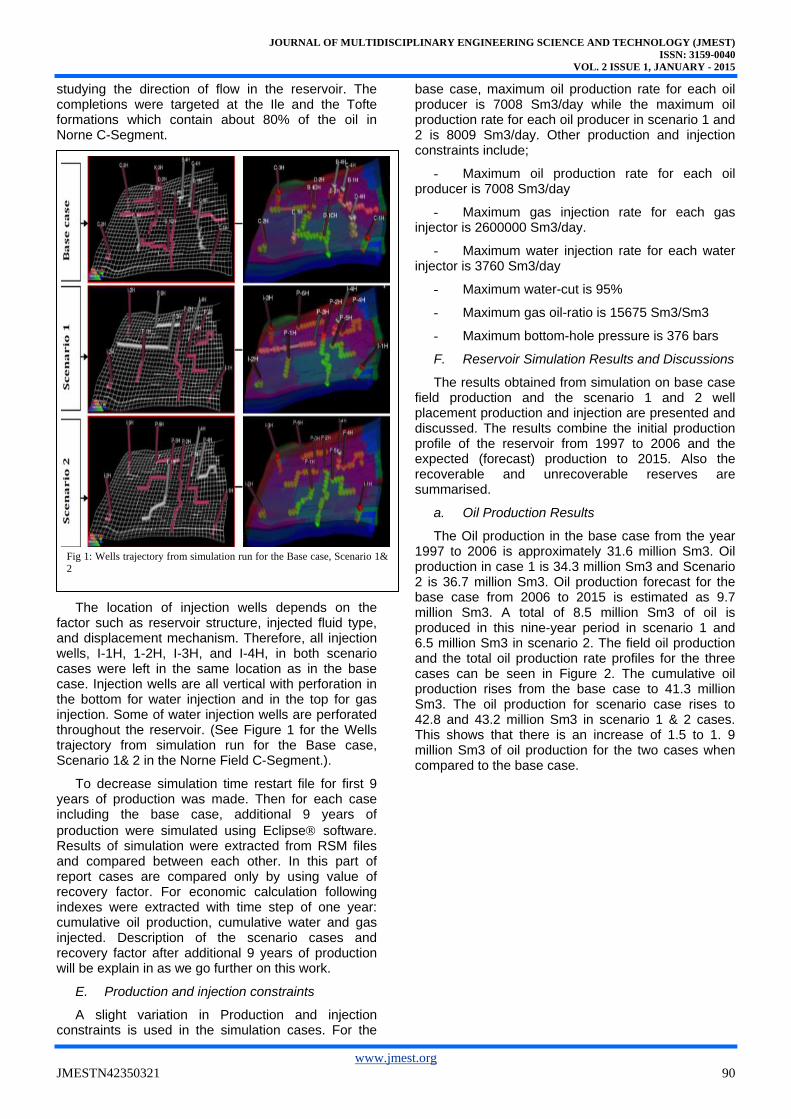
The total volume of gas produced from the base case from 1997 to 2006 is 8.9 billion Sm3. However, the total produced gas for Scenario 1 is 9.7 billion Sm3 and scenario 2 produced 10.2 billion Sm3 of gas. The gas production forecast in the base case from 2006 to 2015 is 8.5 billion Sm3, while gas production for scenario 1 is 2.3 billion Sm3 and 1.8 billion Sm3 for scenario 2 case. The cumulative Gas production from 1997 to 2015 is therefore 12.7 billion Sm3 for the base case and 12.0 billion Sm3 for both Scenario 1 and 2. The production rate and total field gas production profiles can be seen in Figure 3.
c. Water production Results
The total water produced from the base case is 7.3 million Sm3. An approximately 6.1 million Sm3 of water is produced in scenario 1 and 3.7 million Sm3 in scenario 2 case. Water production forecast for base case in 2006 to 2015 is 16.0 million Sm3. A total of 15.5 million Sm3 of water is produced in this nine-year period in scenario 1 and 14.1 million Sm3 in scenario 2. The production rate and the total water production profiles from 1997 to 2015 can be seen in Figure 4. The cumulative water production rises from the base case to 23.3 million Sm3. For scenario 1, it rises to 21.6 million Sm3 and 17.8 million Sm3 for scenario 2 case.
Fig 2: Field oil production rate and total field oil production profiles
Fig 3: Field gas production rate and total field gas production profiles
JOURNAL OF MULTIDISCIPLINARY ENGINEERING SCIENCE AND TECHNOLOGY (JMEST)
ISSN: 3159-0040
VOL. 2 ISSUE 1, JANUARY - 2015
www.jmest.org
JMESTN42350321 92
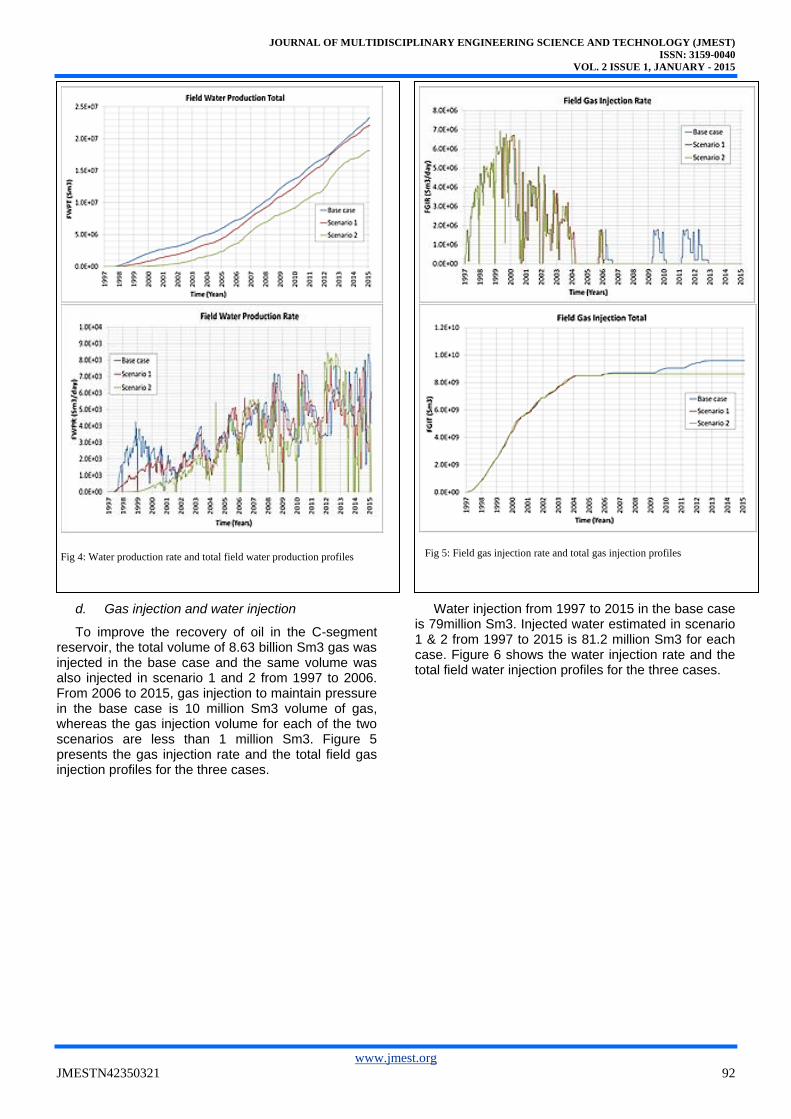
d. Gas injection and water injection
To improve the recovery of oil in the C-segment reservoir, the total volume of 8.63 billion Sm3 gas was injected in the base case and the same volume was also injected in scenario 1 and 2 from 1997 to 2006. From 2006 to 2015, gas injection to maintain pressure in the base case is 10 million Sm3 volume of gas, whereas the gas injection volume for each of the two scenarios are less than 1 million Sm3. Figure 5 presents the gas injection rate and the total field gas injection profiles for the three cases.
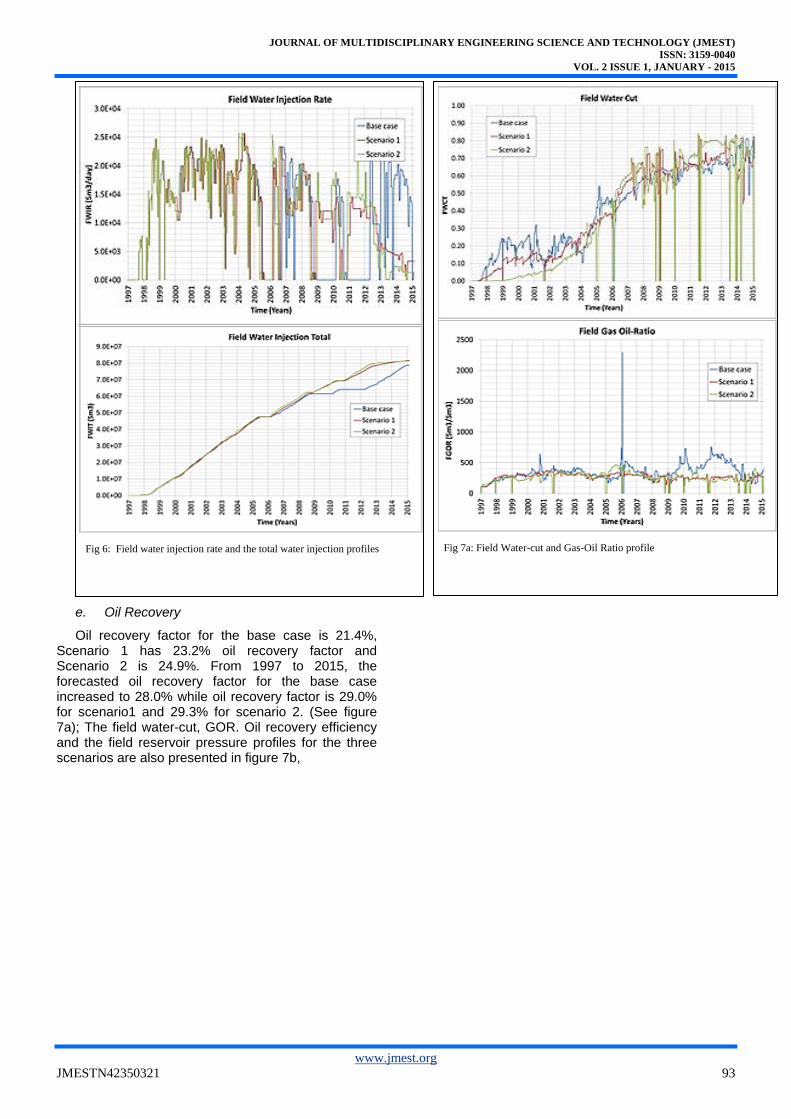
Water injection from 1997 to 2015 in the base case is 79million Sm3. Injected water estimated in scenario 1 & 2 from 1997 to 2015 is 81.2 million Sm3 for each case. Figure 6 shows the water injection rate and the total field water injection profiles for the three cases.
Fig 4: Water production rate and total field water production profiles
Fig 5: Field gas injection rate and total gas injection profiles
JOURNAL OF MULTIDISCIPLINARY ENGINEERING SCIENCE AND TECHNOLOGY (JMEST)
ISSN: 3159-0040
VOL. 2 ISSUE 1, JANUARY - 2015
www.jmest.org
JMESTN42350321 93
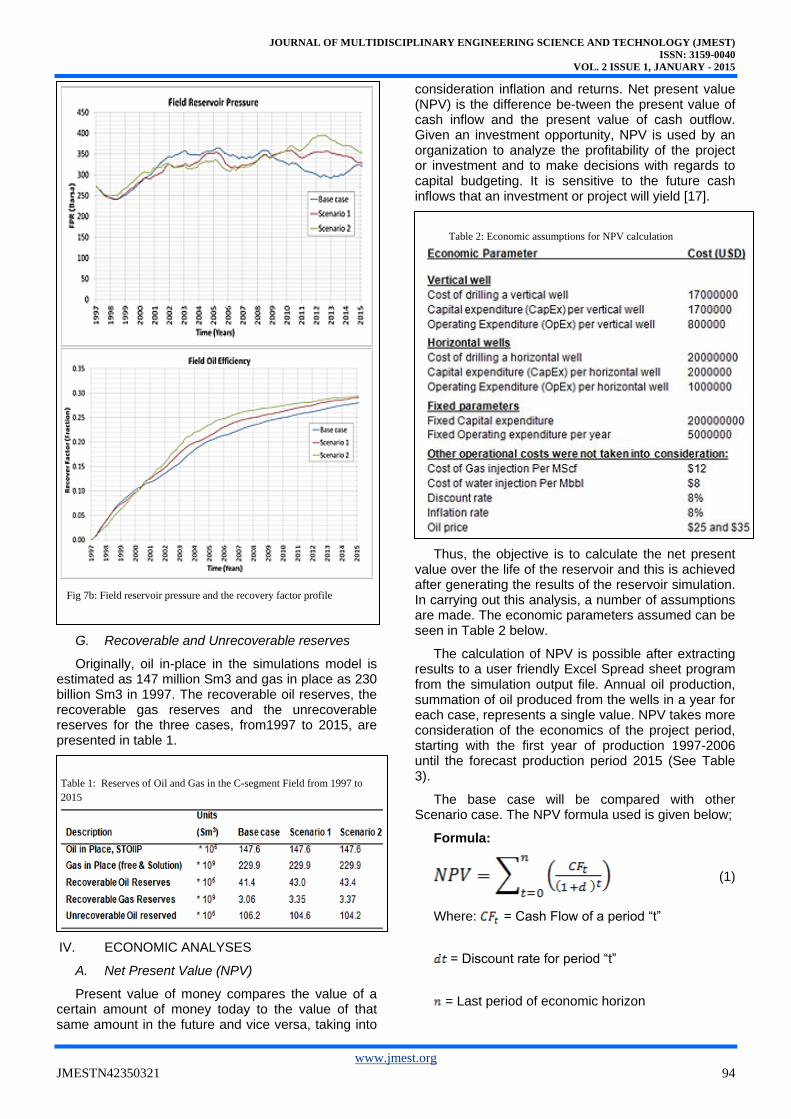
e. Oil Recovery
Oil recovery factor for the base case is 21.4%, Scenario 1 has 23.2% oil recovery factor and Scenario 2 is 24.9%. From 1997 to 2015, the forecasted oil recovery factor for the base case increased to 28.0% while oil recovery factor is 29.0% for scenario1 and 29.3% for scenario 2. (See figure 7a); The field water-cut, GOR. Oil recovery efficiency and the field reservoir pressure profiles for the three scenarios are also presented in figure 7b,
Fig 6: Field water injection rate and the total water injection profiles
Fig 7a: Field Water-cut and Gas-Oil Ratio profile
JOURNAL OF MULTIDISCIPLINARY ENGINEERING SCIENCE AND TECHNOLOGY (JMEST)
ISSN: 3159-0040
VOL. 2 ISSUE 1, JANUARY - 2015
www.jmest.org
JMESTN42350321 94
G. Recoverable and Unrecoverable reserves
Originally, oil in-place in the simulations model is estimated as 147 million Sm3 and gas in place as 230 billion Sm3 in 1997. The recoverable oil reserves, the recoverable gas reserves and the unrecoverable reserves for the three cases, from1997 to 2015, are presented in table 1.
IV. ECONOMIC ANALYSES
A. Net Present Value (NPV)
Present value of money compares the value of a certain amount of money today to the value of that same amount in the future and vice versa, taking into
consideration inflation and returns. Net present value (NPV) is the difference be-tween the present value of cash inflow and the present value of cash outflow. Given an investment opportunity, NPV is used by an organization to analyze the profitability of the project or investment and to make decisions with regards to capital budgeting. It is sensitive to the future cash inflows that an investment or project will yield [17].
Thus, the objective is to calculate the net present value over the life of the reservoir and this is achieved after generating the results of the reservoir simulation. In carrying out this analysis, a number of assumptions are made. The economic parameters assumed can be seen in Table 2 below.
The calculation of NPV is possible after extracting results to a user friendly Excel Spread sheet program from the simulation output file. Annual oil production, summation of oil produced from the wells in a year for each case, represents a single value. NPV takes more consideration of the economics of the project period, starting with the first year of production 1997-2006 until the forecast production period 2015 (See Table 3).
The base case will be compared with other Scenario case. The NPV formula used is given below;
Formula:
(1)
Where: = Cash Flow of a period “t”
= Discount rate for period “t”
= Last period of economic horizon
Table 1: Reserves of Oil and Gas in the C-segment Field from 1997 to
2015
Fig 7b: Field reservoir pressure and the recovery factor profile
Table 2: Economic assumptions for NPV calculation
JOURNAL OF MULTIDISCIPLINARY ENGINEERING SCIENCE AND TECHNOLOGY (JMEST)
ISSN: 3159-0040
VOL. 2 ISSUE 1, JANUARY - 2015
www.jmest.org
JMESTN42350321 95
Cash flow is cash inflow minus cash outflow. The main elements required for a cash flow analysis are: Revenue, R= Production x Price, and Expenditure, E = Operating expenditure (OPEX) + capital expenditure (CAPEX). The investment Decision is if NPV > 0, the Project is accepted or NPV < 0, the Project is rejected. This means the project with the highest NPV is favorable.
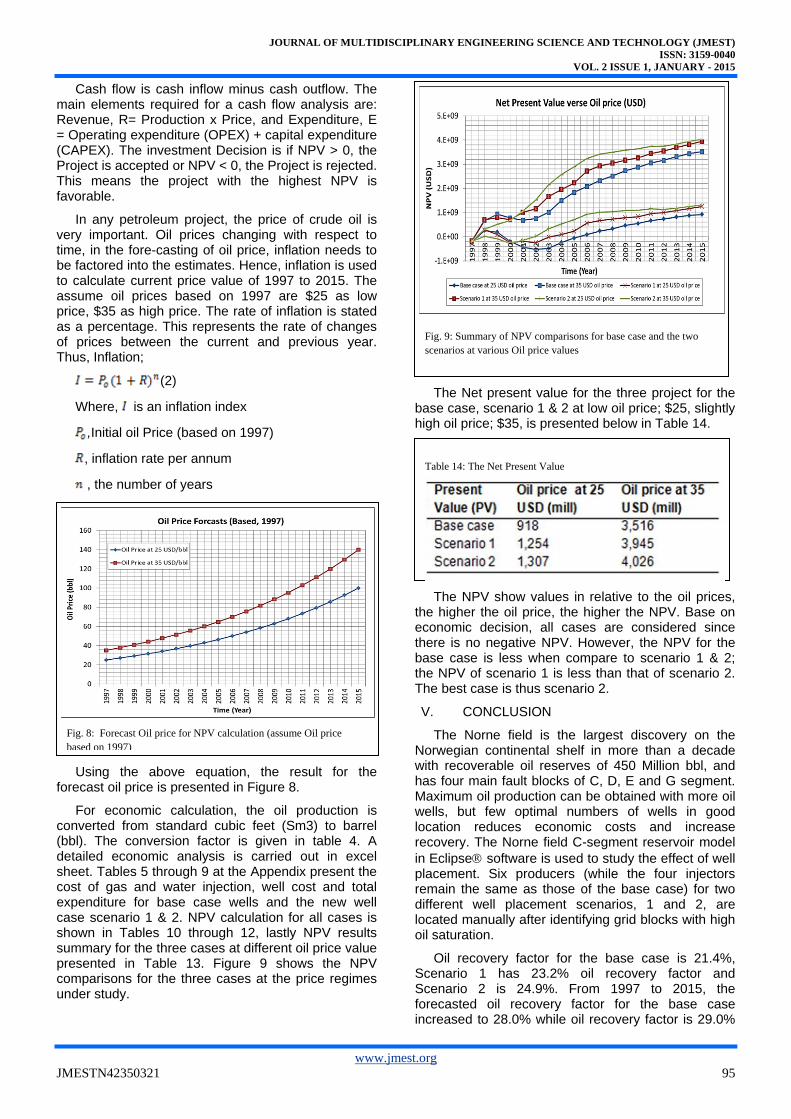
In any petroleum project, the price of crude oil is very important. Oil prices changing with respect to time, in the fore-casting of oil price, inflation needs to be factored into the estimates. Hence, inflation is used to calculate current price value of 1997 to 2015. The assume oil prices based on 1997 are $25 as low price, $35 as high price. The rate of inflation is stated as a percentage. This represents the rate of changes of prices between the current and previous year. Thus, Inflation;
(2)
Where, is an inflation index
,Initial oil Price (based on 1997)
, inflation rate per annum
, the number of years
Using the above equation, the result for the forecast oil price is presented in Figure 8.
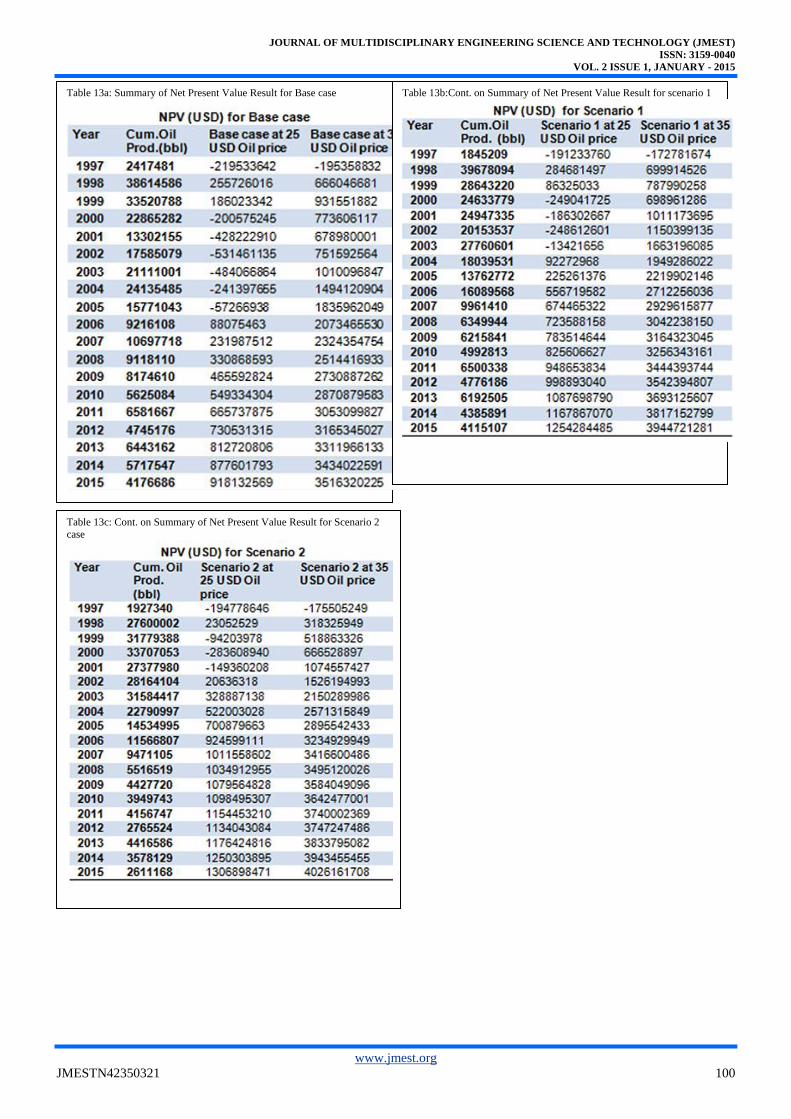
For economic calculation, the oil production is converted from standard cubic feet (Sm3) to barrel (bbl). The conversion factor is given in table 4. A detailed economic analysis is carried out in excel sheet. Tables 5 through 9 at the Appendix present the cost of gas and water injection, well cost and total expenditure for base case wells and the new well case scenario 1 & 2. NPV calculation for all cases is shown in Tables 10 through 12, lastly NPV results summary for the three cases at different oil price value presented in Table 13. Figure 9 shows the NPV comparisons for the three cases at the price regimes under study.
The Net present value for the three project for the base case, scenario 1 & 2 at low oil price; $25, slightly high oil price; $35, is presented below in Table 14.
The NPV show values in relative to the oil prices, the higher the oil price, the higher the NPV. Base on economic decision, all cases are considered since there is no negative NPV. However, the NPV for the base case is less when compare to scenario 1 & 2; the NPV of scenario 1 is less than that of scenario 2. The best case is thus scenario 2.
V. CONCLUSION
The Norne field is the largest discovery on the Norwegian continental shelf in more than a decade with recoverable oil reserves of 450 Million bbl, and has four main fault blocks of C, D, E and G segment. Maximum oil production can be obtained with more oil wells, but few optimal numbers of wells in good location reduces economic costs and increase recovery. The Norne field C-segment reservoir model
in Eclipse software is used to study the effect of well placement. Six producers (while the four injectors remain the same as those of the base case) for two different well placement scenarios, 1 and 2, are located manually after identifying grid blocks with high oil saturation.
Oil recovery factor for the base case is 21.4%, Scenario 1 has 23.2% oil recovery factor and Scenario 2 is 24.9%. From 1997 to 2015, the forecasted oil recovery factor for the base case increased to 28.0% while oil recovery factor is 29.0%
Fig. 8: Forecast Oil price for NPV calculation (assume Oil price
based on 1997)
Fig. 9: Summary of NPV comparisons for base case and the two
scenarios at various Oil price values
Table 14: The Net Present Value
JOURNAL OF MULTIDISCIPLINARY ENGINEERING SCIENCE AND TECHNOLOGY (JMEST)
ISSN: 3159-0040
VOL. 2 ISSUE 1, JANUARY - 2015
www.jmest.org
JMESTN42350321 96
for scenario1 and 29.3% for scenario 2. The cumulative Gas production from 1997 to 2015 is therefore 12.7 billion Sm3 for the base case and 12.0 billion Sm3 for both Scenario 1 and 2. From 1997 to 2015, the cumulative water production rises from the base case to 23.3 million Sm3. For scenario 1, it rises to 21.6 million Sm3 and 17.8 million Sm3 for scenario 2 case. Water injection from 1997 to 2015 in the base case is 79 million Sm3. Injected water estimated in scenario 1 & 2 from 1997 to 2015 is 81.2 million Sm3 for each case.
From the economic analyses, the NPV for the base case is less when compare to scenario 1 & 2; the NPV of scenario 1 is less than that of scenario 2. The best case is thus scenario 2.
ACKNOWLEDGMENT
We wish to thank the Schlumberger Information Systems (SIS) for their support on Simulation software and to STATOIL (operator) of the Norne field and its license partners ENI and Petoro for the release of the Norne data. We also appreciate the support of the Institute of Petroleum Technology staff in NTNU.
REFERENCES
[1] Seifert, D., Lewis, J. J. M., and Hern, C. Y. “Well Placement Optimization and Risking Using 3-D Stochastic Reservoir Modelling Techniques”, paper SPE 35520 presented at the European 3-D Reservoir Modelling Conference, Stavanger, Norway, April 16-17, (1996).
[2] Guyaguler, B and Horne, R.N., “Uncertainty Assessment of well placement Optimization” SPE 71625, SPE Annual Technical Conference and Exhibition, New Orleans, Louisiana, California , October 3-6, (2001).
[3] Badru, Oluwatoyin “Optimization Using the Quality Map Approach” Master’s Thesis, Department of Petroleum Engineering Stanford University, U.S.A. June, (2003).
[4] Bittencourt, A. C., and Horne, R. N. “Reservoir Development and Design Optimization”, paper SPE 38895 presented at the SPE Annual Technical Conference and Exhibition, San Antonio, TX, October 5-8, (1997).
[5] Yeten, B., Durlofsky, L. J., and Aziz, K. “Optimization of Nonconventional Well Type, Location and Trajectory”, paper SPE 77565 presented at the SPE Annual Technical Conference and Exhibition, San Antonio, TX, 29 September-2 October, (2002).
[6] Güyagüler, B., and Gümrah, F., “Comparison of Genetic Algorithm with Linear Programming for the Optimization of an Underground Storage Field”, IN SITU, 23(2), pp 131-150, (1999).
[7] Pan, Y., and Horne, R. N. “Improved Methods for Multivariate Optimization of Field Development Scheduling and Well Placement Design”, paper
SPE 49055 presented at the SPE Annual Technical Conference and Exhibition, New Orleans, Louisiana, September 27-30, (1998).
[8] Johnson, V. M., and Rogers, L. L.,“Applying Soft Computing Methods to Improve the Computational Tractability of a Surface Simulation-Optimization Problem”, Journal of Petroleum Science and Engineering, pp 153-175, (2001).
[9] Cruz, P. S., Horne, R. N., Deutsch, C. V.: “The Quality Map: A Tool for Reservoir Uncertainty Quantification and Decision Making”, SPE 56578, SPE Annual Technical Conference and Exhibition, Houston, TX, U.S.A., Oct. 3-6, (1999).
[10] Handels, M., Zandvlier, M., Brouwer, D., and Jansen, J. “Adjoint-Based Well- Placement Optimization Under Production Constraints”, paper SPE 105797 presented at the SPE Reservoir Simulation Symposium, Houston, Texas, 26-28 February.(2007).
[11] Wang, P. Litvak, M., Aziz K., “Optimization of Productions in Petroleum Fields”, SPE 77658, Stanford University; BP, Society of Petroleum Engineers incorporation. October 2, (2002).
[12] Nogueira, P. and Schiozer, D. “An Efficient Methodology of Production Strategy Optimization Based on Genetic Algorithms”, paper SPE 122031 presented at the SPE Latin American and Caribbean Petroleum Engineering Conference, Cartagena, Colombia, 31 May-3 June, (2009).
[13] WesternGeco, Data Processing Report for Statoil Block 6608/10 (Norne) ST0113, ST0103, ST0305, ST0409, ST0603 2006 4D processing, (2007).
[14] Verlo, S. B. and Hetland, M., "Development of a field case with real production and 4D data" Norne Field as a benchmark case for future reservoir simulation models testing. Master’s Thesis, NTNU, (2008).
[15] Odinukwe., J., and Correia C., History Matching and Uncertainty Assessment of the Norne Field E-Segment Using Petrel RE”Master’s Thesis in Reservoir Engineering, Department of Petroleum Engineering and Applied Geosciences, Norwegian University of Science and Technology, Trondheim, June, (2010).
[16] Statoil, "PL 128 Plan for Development and Operation Reservoir Geology Support Documentation" June,(1994).
[17] Cape Economics, “Petroleum Project Economics Econ210D Presentation 4 Petroleum Project”, Cape economics classes; unit 1 paper 2, .June 2010. www.slideshare.net/edwardbahaw/presentation-4-4002151
JOURNAL OF MULTIDISCIPLINARY ENGINEERING SCIENCE AND TECHNOLOGY (JMEST)
ISSN: 3159-0040
VOL. 2 ISSUE 1, JANUARY - 2015
www.jmest.org
JMESTN42350321 97
[18] Norwegian Petroleum Directorate/Ministry of Petroleum and Energy with the Norwegian Petroleum, “NPD Facts pages on Norne field”
Norwegian petroleum sector, collective from (1997- 2010).
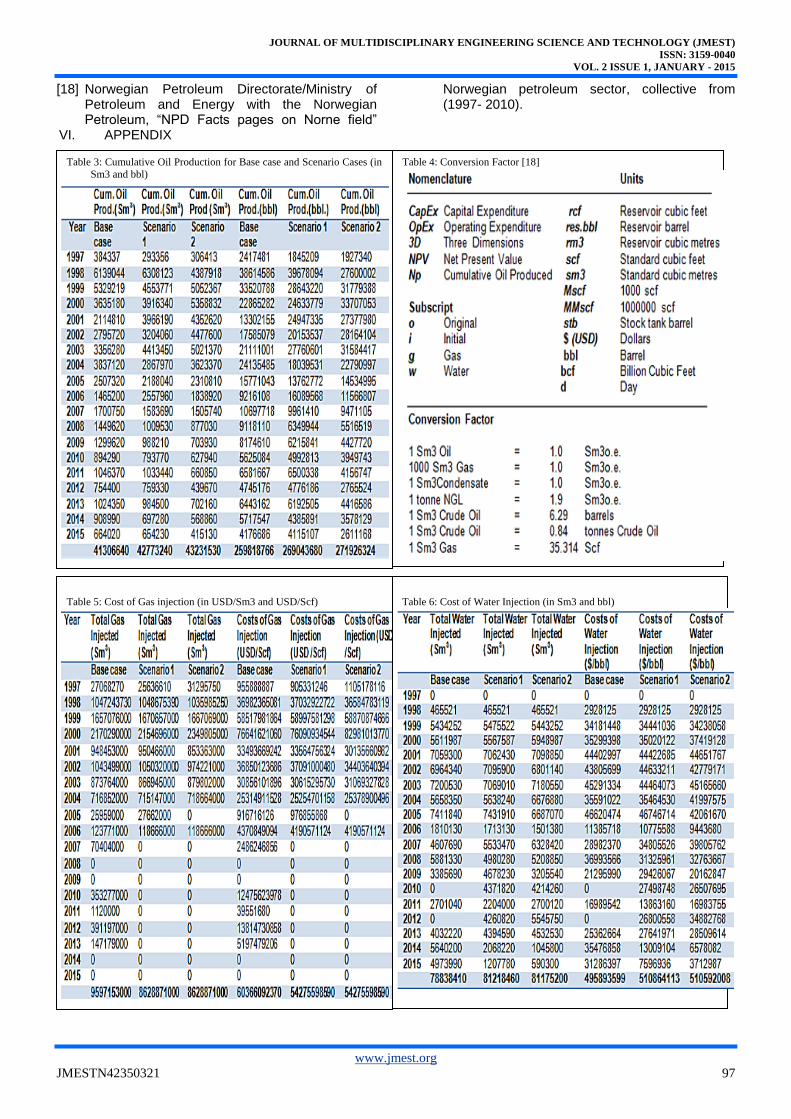
VI. APPENDIX
Table 3: Cumulative Oil Production for Base case and Scenario Cases (in
Sm3 and bbl)
Table 4: Conversion Factor [18]
Table 5: Cost of Gas injection (in USD/Sm3 and USD/Scf)
Table 6: Cost of Water Injection (in Sm3 and bbl)
JOURNAL OF MULTIDISCIPLINARY ENGINEERING SCIENCE AND TECHNOLOGY (JMEST)
ISSN: 3159-0040
VOL. 2 ISSUE 1, JANUARY - 2015
www.jmest.org
JMESTN42350321 98
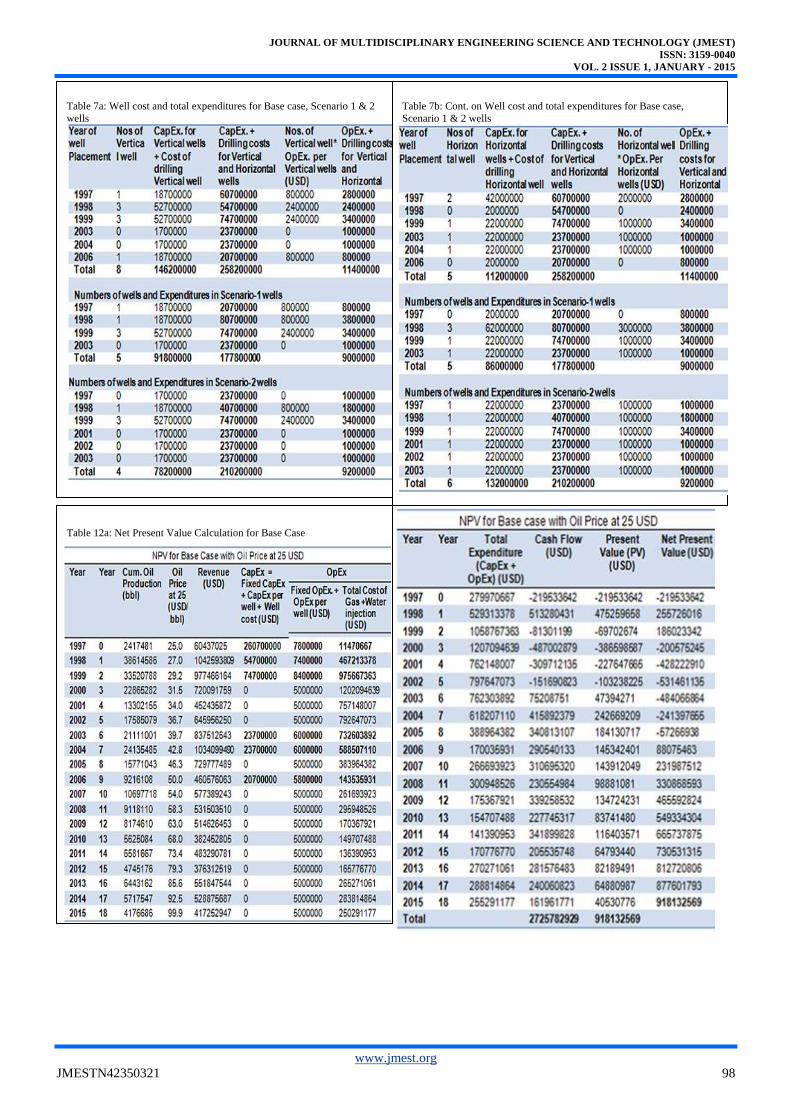
Table 7a: Well cost and total expenditures for Base case, Scenario 1 & 2
wells
Table 12a: Net Present Value Calculation for Base Case
Table 7b: Cont. on Well cost and total expenditures for Base case,
Scenario 1 & 2 wells
JOURNAL OF MULTIDISCIPLINARY ENGINEERING SCIENCE AND TECHNOLOGY (JMEST)
ISSN: 3159-0040
VOL. 2 ISSUE 1, JANUARY - 2015
www.jmest.org
JMESTN42350321 99
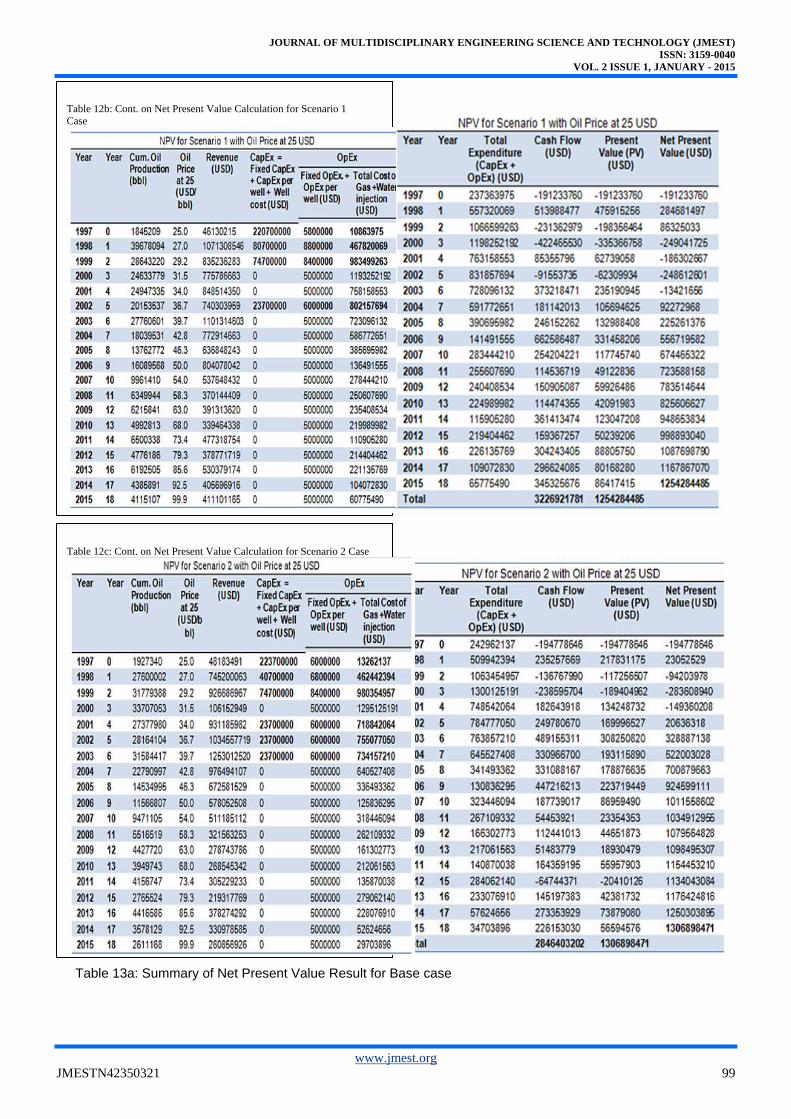
Table 13a: Summary of Net Present Value Result for Base case
Table 12b: Cont. on Net Present Value Calculation for Scenario 1
Case
Table 12c: Cont. on Net Present Value Calculation for Scenario 2 Case
JOURNAL OF MULTIDISCIPLINARY ENGINEERING SCIENCE AND TECHNOLOGY (JMEST)
ISSN: 3159-0040
VOL. 2 ISSUE 1, JANUARY - 2015
www.jmest.org
JMESTN42350321 100
Table 13a: Summary of Net Present Value Result for Base case
Table 13b:Cont. on Summary of Net Present Value Result for scenario 1
Table 13c: Cont. on Summary of Net Present Value Result for Scenario 2
case