Embed Size (px)
Citation preview
MC/INF/282 Original: English 17 October 2006
NINETY SECOND SESSION ___________________________________________________________________________
HUMAN RESOURCES REPORT
MC/INF/282 Page i
CONTENTS
Page I. INTRODUCTION ….……………………………………….………..……… 1 II. HUMAN RESOURCES POLICIES ….……...…………….………..……… 2 III. SELECTION AND RECRUITMENT PRACTICES…………………….… 2
Recruitment ….………..…………….……………………………………… 2 Secondments …..…………………………………………………………… 2 Associate Experts ……..……………………………………………….…… 3 Internship Programme ……..………………..……………………………… 3
IV. CURRENT PRACTICES AND RECENT DEVELOPMENTS IN WORKING CONDITIONS ………………………………………….……… 3 V. OCCUPATIONAL HEALTH ………………….………………….………… 4 VI. HUMAN RESOURCES MANAGEMENT SYSTEM (PRISM) ……...…... 5 VII. STAFF DEVELOPMENT AND LEARNING…..…….……….…………… 5 VIII. PERFORMANCE DEVELOPMENT SYSTEM ……………….………… 6 IX. JOB CLASSIFICATION ………..……………………….………………… 6 X. STAFF RELATIONS ….……..……………………………………………… 6 ANNEX - Statistical Overview
MC/INF/282 Page 1
HUMAN RESOURCES REPORT I. INTRODUCTION 1. In 2006, the Human Resources Management (HRM) division continued to shift administrative and recruitment functions to the Manila Human Resources Operations (MHRO) at the Manila Administrative Centre in a process that is to be completed in the course of 2007. 2. Key HRM developments during the reporting period included: • the assumption by the new Director of HRM of her duties; • the roll-out of the computerized human resources management system, Processes and
Resources, Integrated Systems Management (PRISM); • targeted efforts to address key policy issues relating to mobility, contract duration and
occupational groups; • the development of proposals for improving the recruitment of nationals of unrepresented
Member States; and, • training preceding the roll-out of the new Performance Development System (PDS)
between July 2005 and February 2006. 3. The number of staff employed by the Organization and the number of IOM offices and locations around the world continued to grow during the year. Total staff numbered 5,341 at the end of June 2006, representing an increase of 8 per cent since the previous report. The number of field locations increased from 248 to 290 during the same period. 4. The significant growth of the Organization, particularly in the number of projects and staff, poses major HRM challenges. In order to manage this growth within the constraints of Zero Nominal Growth, the Administration has delocalized several back-office human resources functions and streamlined a number of processes. PRISM was successfully rolled out, but the essential core structure required to formulate policy and set strategy and direction is at a bare minimum; it is not sufficient to deal with the constantly growing, complex array of human resources challenges such as staff mobility, career development, review of rules and regulations, staff training, staff retention and succession planning. The development and timely roll-out of other new human resources tools are essential at this stage. Without adequate resources, HRM will continue to have difficulty achieving its objectives in the key areas of staff management and development, and it will not be able effectively to address some of the valid concerns repeatedly expressed by the Staff Association Committee (SAC). Continued pressure on the core structure over a long period of time owing to limited resources could seriously jeopardize the Organization’s capacity to provide the high-calibre services that enable its membership to deal with the multi-faceted challenges of migration management.
MC/INF/282 Page 2
II. HUMAN RESOURCES POLICIES 5. As highlighted by the SAC in its last statement to the Executive Committee, IOM's continued growth, evolving priorities and staffing needs call for a more systematic approach to key human resources policy issues such as career management, mobility and succession planning. 6. The Administration has therefore decided to accelerate consideration and consolidation of these key policy issues with the aim of producing a roadmap and concrete policy recommendations for implementation by the end of this year. III. SELECTION AND RECRUITMENT PRACTICES Recruitment 7. The Staffing Unit (STU) has delocalized many of its administrative functions to the Manila Administrative Centre. Since January 2006, it has been the job of human resources staff in Manila to pre-screen and rate applications received in response to published vacancy notices, to submit the relevant recruitment documents to IOM Missions, and to recruit consultants. The delocalization effort has shortened the period between the issuing of a vacancy notice and the filling of a vacant post. It has also enabled STU to provide fast, high-quality pre-screening of candidates and timely contingency planning for complex emergency and post-conflict operations. With the help of PRISM, STU has accelerated and is able to monitor the recruitment process by tracking the progress of vacancy notices, contracts, personnel actions and other important human resources information and processes. 8. In response to a request by Member States that the composition of IOM’s staff more closely reflect the membership, a task group has been developing proposals on how to improve the recruitment of nationals from unrepresented Member States. The corresponding plan of action, currently under discussion, will be implemented in the last quarter of 2006 and in 2007. 9. During the reporting period, the number of short-term appointments remained high because of several emergency and post-conflict operations, particularly in Afghanistan, the Middle East and South-East Asia. STU undertook two steps to further improve its recruitment services. First, while it continued to use its internal roster for emergency recruitment, it launched the process of transferring and maintaining the roster in the integrated electronic system (PRISM). Second, STU has expanded its emergency recruitment network by utilizing the services of specialized recruitment agencies and their online databases. Secondments 10. STU continued to cooperate with government agencies on staff secondments. Since July 2005, 14 staff members have been seconded to and by IOM. IOM staff have been seconded to the United Nations Office for the Coordination of Humanitarian Affairs (OCHA), the World Bank, the United Nations Development Programme (UNDP) and the United Nations Joint Logistics Centre. In turn, staff have been seconded to IOM from the Danish Refugee Council, the Norwegian Refugee Council, the Swedish International Development Cooperation Agency (SIDA), the Government of Italy, the UK Department for International Development (DFID) and
MC/INF/282 Page 3 Ecuador. The seconded staff made an important contribution to the successful implementation of IOM’s programmes in several regions. Associate Experts 11. Eight new Associate Experts were employed in IOM, and a total of 24 worked during the period under review. Administrative procedures are being finalized for two newly appointed Associate Experts. IOM was able to retain seven Associate Experts during the reporting period on IOM contracts. Contributions to this programme currently come from eight Member States: Austria, Belgium, Germany, Italy, Japan, the Netherlands, Sweden and the United States of America. Internship Programme 12. IOM’s internship programme continued to expand both at Headquarters and in the Field. 344 interns were hosted by IOM worldwide during the reporting period: 67 at Headquarters and 277 in Field Missions. As previously reported, IOM regularly receives interns from Georgetown University, Syracuse University, the Fulbright Commission and the Carlo Schmidt Programme of the German Academic Exchange Service (DAAD.) New agreements for participation in IOM’s internship programme were signed with the Syni Programme1 and the Ministry of Foreign Affairs of El Salvador. IV. CURRENT PRACTICES AND RECENT DEVELOPMENTS IN
WORKING CONDITIONS 13. During the period under review, HRM continued to work with IOM Missions to harmonize conditions of service, improve staff access to medical services, and prepare the transition from the IOM Provident Fund to the United Nations Joint Staff Pension Fund (UNJSPF). To ensure the smooth running of IOM’s programmes, HRM streamlined the procedure for contracting service providers and consultants. 14. Acting on its commitment to simplify social security and other human resources practices and to promote equal treatment/non-discriminatory policy, HRM helped implement Staff Rules and Regulations (SRRs) in IOM Missions in Panama and Ireland and reviewed and updated SRRs in Armenia, Georgia and Hungary. The Medical Services Plan (MSP) was introduced in Georgia, Hungary, Kosovo, Panama, Sudan and Uganda, increasing the total number of participants by 301 since the last report. This harmonization effort has helped lower the number of grievances and reduce the costs associated with the administration and maintenance of different systems across the Organization. 15. In the beginning of 2006, Missions participating in the Provident Fund began preparations for joining the UNJSPF. To facilitate this process, HRM issued instructions to Missions on how to modify current contributions to the Provident Fund to align them with the requirements of the UNJSPF, which IOM will join at the beginning of next year. HRM revised the IOM salary scales and introduced, where relevant, a gross pensionable salary scale on the basis of which UNJSPF contributions will be calculated. 1 SYNI is funded and commissioned by the Swiss State Secretariat for Economic Affairs (SECO) and Lausanne City Council.
MC/INF/282 Page 4
16. In addition, in order to streamline the outsourcing of services, HRM reviewed and classified different types of IOM contracts with individuals and with third parties and prepared guidelines on their use for all IOM Missions. As part of the same effort, HRM undertook a study to identify the best contractual arrangements in high-risk locations. V. OCCUPATIONAL HEALTH 17. To improve occupational health in the Organization and help reduce the effects of hardship assignments on staff health, the Occupational Health Unit (OHU) developed a variety of stress management tools, raised awareness about diseases through improved standard examinations and information campaigns, prepared recommendations to prevent work-related accidents, and made it possible for more IOM field staff to have health insurance. In the framework of interagency cooperation, OHU participated in the common UN Avian Influenza Preparedness working group and offered occupational health services to external organizations. 18. OHU regularly provided detailed travel and medical preparedness advice, and assessed health issues relating to the environment in which staff work and live. The travel and medical preparedness advice provided to a number of EU Election Observers has helped reduce occupational illnesses and accidents among that group. OHU also provided advice on medical insurance for staff and dependents and on procedures for the medical examinations performed when staff assumed their duties in Colombia and Haiti. All staff in these Missions received advice on stress reduction, ergonomics and office set-up, and non-occupational illnesses. 19. OHU has raised staff awareness of the importance of managing personal health, in particular of being periodically screened for potentially hazardous diseases such as prostate and breast cancer. It has been promoting a smoke-free working environment in Missions by distributing anti-smoking information materials. Moreover, medical supplies including items such as medical kits, malaria prophylaxis, mosquito nets and individual medication, were sent to staff working in countries with inadequate health infrastructures. As a result, the number of cases of falciparum malaria among staff fell. In October 2005, OHU started to use the new 3-drug regimen included in the HIV post-exposure prophylactic kits, applying the decision taken in coordination with UN agencies. To protect staff from HIV/AIDS infection, OHU also distributed HIV/AIDS prevention materials. 20. As part of the internal Pandemic Influenza Preparedness Group, OHU has helped prepare and distribute IOM Medical Guidelines for Staff and Families. It is also actively helping staff prepare for a pandemic on an international basis through its work with various UN agencies, such as the Critical Incident Stress Management Unit. The result was the production of two annexes to the UN Medical Services Staff Contingency Plan Guidelines for an Influenza Pandemic, one on the mechanisms for coordinating and implementing psychosocial support/activities for staff during all phases of pandemics, the other on guidelines for managers.
MC/INF/282 Page 5 VI. HUMAN RESOURCES MANAGEMENT SYSTEM (PRISM) 21. The HR component of PRISM has begun its first phase of implementation, allowing for a more systematic approach to personnel management, particularly in e-Recruitment, Payroll and Personnel Administration. 22. Since January 2006 PRISM has introduced new concepts, such as Employee Self Service (ESS), Manager Self Service (MSS), and e-Recruitment, all accessible via the Internet or the Intranet. ESS allows staff members with salaries currently processed by PRISM to check their pay slips online and to update their personal data. e-Recruitment allows staff worldwide to update their application forms and apply for existing vacancies online. MSS delivers data from various sources to managers' fingertips and supports them in their HR-related administrative and planning tasks. 23. Currently the PRISM payroll population consists of IOM’s professional staff worldwide and general service staff in Geneva and Bern. The project team is working on developing the PRISM payroll function for general service staff in Manila and will gradually introduce this function to other Missions, making PRISM the IOM Enterprise Resource Planning (ERP) system. It is expected that this function will be rolled out for Manila in January 2007. In the second half of 2006, HRM promoted a more strategic use of the PRISM system by training staff on the system’s advanced functions. PRISM has the capability to automate talent management, workforce process management and workforce deployment, thus increasing HRM efficiency and freeing up time and resources for the accelerated HRM policy review and development process planned for the second half of 2006 and for 2007. VII. STAFF DEVELOPMENT AND LEARNING 24. During the reporting period, SDL produced a training and certification package for project managers, supported decentralization of training expertise in key areas, and provided advice on designing migration management learning tools. 25. The specialized training and certification package for project managers is currently in its pilot phase. The first group of IOM project managers will complete the programme before the end of 2006. The new package will be mandatory for all staff with the title of Project/Programme Developer/Manager, and is intended to enhance their abilities to manage IOM’s programmes more effectively from design and development to implementation.
26. SDL actively supports the decentralization of training expertise in project development, resource management and specialized migration topics. Training-of-trainers events were organized in 2005 and the first half of 2006 on these topics for staff members both in IOM Field Missions and at Headquarters. SDL provided continuous support to the newly created trainers’ networks on the Essentials of Migration Management (EMM), Resource Management and Project Development. 27. SDL also continues to provide the specialized curriculum development and training expertise needed to design specialized migration management learning tools, such as the delivery of EMM-based courses worldwide.
MC/INF/282 Page 6
VIII. PERFORMANCE DEVELOPMENT SYSTEM 28. The new Performance Development System (PDS) was officially launched in August 2006. The system is expected to facilitate delivery of IOM’s goals by serving as an aid for the development of staff competencies and by preparing staff to take on new functions in line with the needs of the Organization and its stakeholders. PDS will ensure synergy between various HRM processes and validate career development, succession planning and other investments in staff development.
29. Between July 2005 and February 2006, SDL organized training sessions for all MRFs, Missions with more than 50 staff members, and most HQ staff. The PDS training sessions were aimed at introducing the new system and ensuring proper understanding of the process and the skills required for a constructive outcome. MRFs and Missions are encouraged to cascade the training at mission level to ensure in-depth understanding of the principles that will guarantee a meaningful process. IX. JOB CLASSIFICATION
30. Between 1 July 2005 and 30 June 2006, 21 positions (16 officials and 5 employees) were rated and three desk audits were carried out. X. STAFF RELATIONS 31. Between April and June 2006, the Administration took a proactive approach to dealing with issues of concern raised by the SAC. As a result, concrete measures will be taken during the second half of 2006 to address critical policy issues such as mobility, contract duration and job profiles. 32. The Administration met with representatives of the SAC within the JASAC (Joint Administration/Staff Association Committee) on two occasions to discuss matters of common interest. Cooperation between the Administration and the SAC continued through Personnel Meetings, the Appointment and Postings Board (APB), the Working Group on Social Security (WGSS) and various other consultative processes. Frequent contacts were also maintained with members of SAC to discuss matters of common interest for the staff members and the Organization. 33. Between 1 July 2005 and 30 June 2006, the APB, in which the Staff Association participates, held 13 meetings and made recommendations on 88 cases. The Director General approved the recommendations in 83 cases. 34. Concerning staff grievances, between 1 July 2005 and 30 June 2006 three appeals were received by the Joint Administrative Review Board (JARB), and two appeals were lodged with the ILO Administrative Tribunal.
MC/INF/282 Annex (English only) Page 1
Annex
Statistical Overview
IOM STAFF COMPOSITION ………………………………………………………………………….. 2 1. IOM field locations, 2002-2006 ……………………………………………………..……….. 2 2. IOM staffing trends, 2002-2006 …………………………………………………………….... 2 3. Staff by category, location and gender, June 2006 ……………………………………...……. 2 4. Officials - distribution by gender and category/grade, 2003-2006 ……………………..…….. 3 5. Evolution of the representation of women among officials, 2003-2006 ……………..….…… 4 6. Officials - category/grade distribution and gender, June 2006 ………………………….….. 4 7. Officials by country of nationality and category/grade, June 2006……………………..….…. 5 8. Headquarters employees by country of nationality and gender, June 2006 …………..…….... 7 9. Field employees by country of nationality and gender, June 2006 ……………….………….. 8
RECRUITMENT AND SELECTION ………………………………………………………………….. 9 10. Vacancy notices issued for officials, 2002-June 2006 ……………………………………….. 9 11. Officials appointed through vacancy notices, 2002-June 2006 ……………………………… 10 12. Officials appointed through vacancy notices by gender, 2002-June 2006 ………………...… 10 13. Mobility of internal staff, 2002-June 2006.…………………………………………………… 10 14. Officials appointed through vacancy notices by country of nationality, 2002-June 2006….… 11 15. Vacancy notices issued for employees at Headquarters, 2002-June 2006 …….…….……..... 12 16. Summary of temporary recruitment and selection, 2002-June 2006………………………….. 13
ALTERNATIVE STAFFING RESOURCES …………………………………………………….…... 13
17. Associate Experts by nationality, 2002-June 2006…………………………………………… 13
OTHER CATEGORIES ……………………………………………………………………………….. 14 18. Interns by gender and duty station, July 2005-June 2006………………...………….………. 14
STAFF DEVELOPMENT AND LEARNING ………………………………………………..……… 16 19. Staff development and learning activities, 2002-June 2006………………………………….. 16 20. Staff trained by gender, 2002-June 2006 …………………………………………………….. 16 21. Staff trained by location, 2002-June 2006 …………………………………………………… 16 22. Staff trained by category, 2002-June 2006 ………………………………………………….. 17 23. Staff trained by areas of training and development activity ………………………………… 17
MC/INF/282 Annex (English only) Page 2
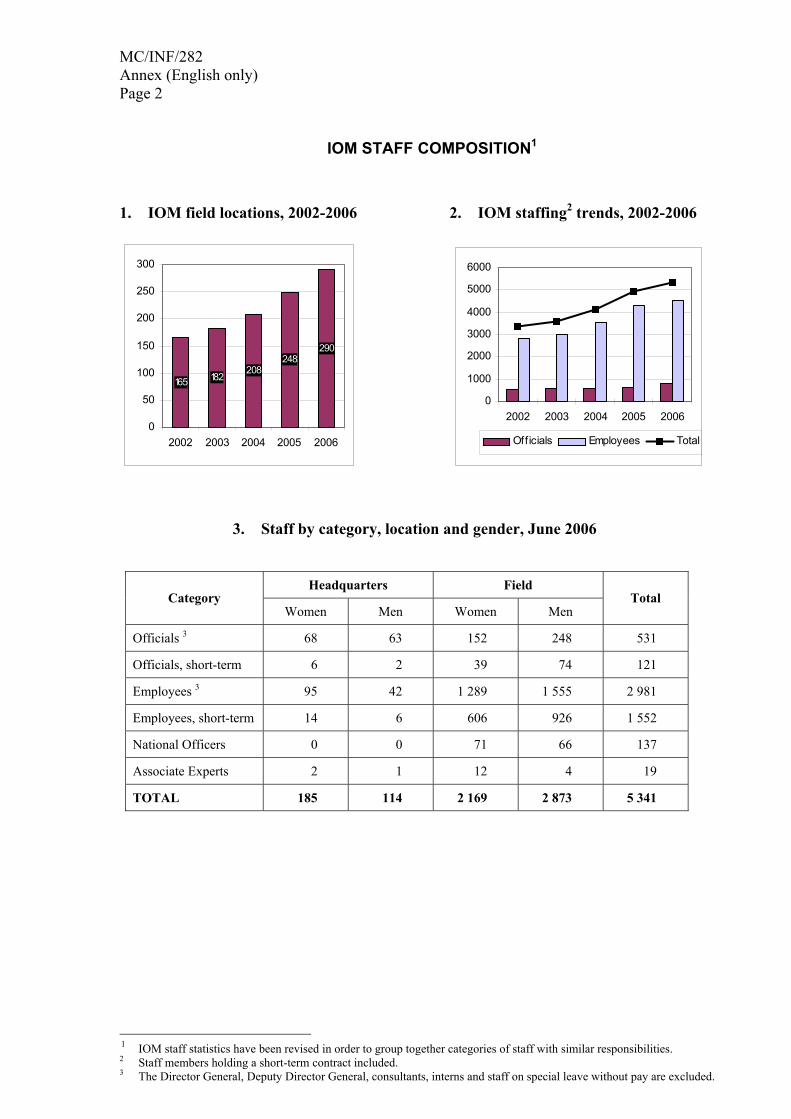
IOM STAFF COMPOSITION1 1. IOM field locations, 2002-2006 2. IOM staffing2 trends, 2002-2006
165 182208
248290
0
50
100
150
200
250
300
2002 2003 2004 2005 2006
0
1000
2000
3000
4000
5000
6000
2002 2003 2004 2005 2006
Officials Employees Total
3. Staff by category, location and gender, June 2006
Headquarters Field Category
Women Men Women Men Total
Officials 3 68 63 152 248 531
Officials, short-term 6 2 39 74 121
Employees 3 95 42 1 289 1 555 2 981
Employees, short-term 14 6 606 926 1 552
National Officers 0 0 71 66 137
Associate Experts 2 1 12 4 19
TOTAL 185 114 2 169 2 873 5 341
1 IOM staff statistics have been revised in order to group together categories of staff with similar responsibilities. 2 Staff members holding a short-term contract included. 3 The Director General, Deputy Director General, consultants, interns and staff on special leave without pay are excluded.
MC/INF/282 Annex (English only) Page 3
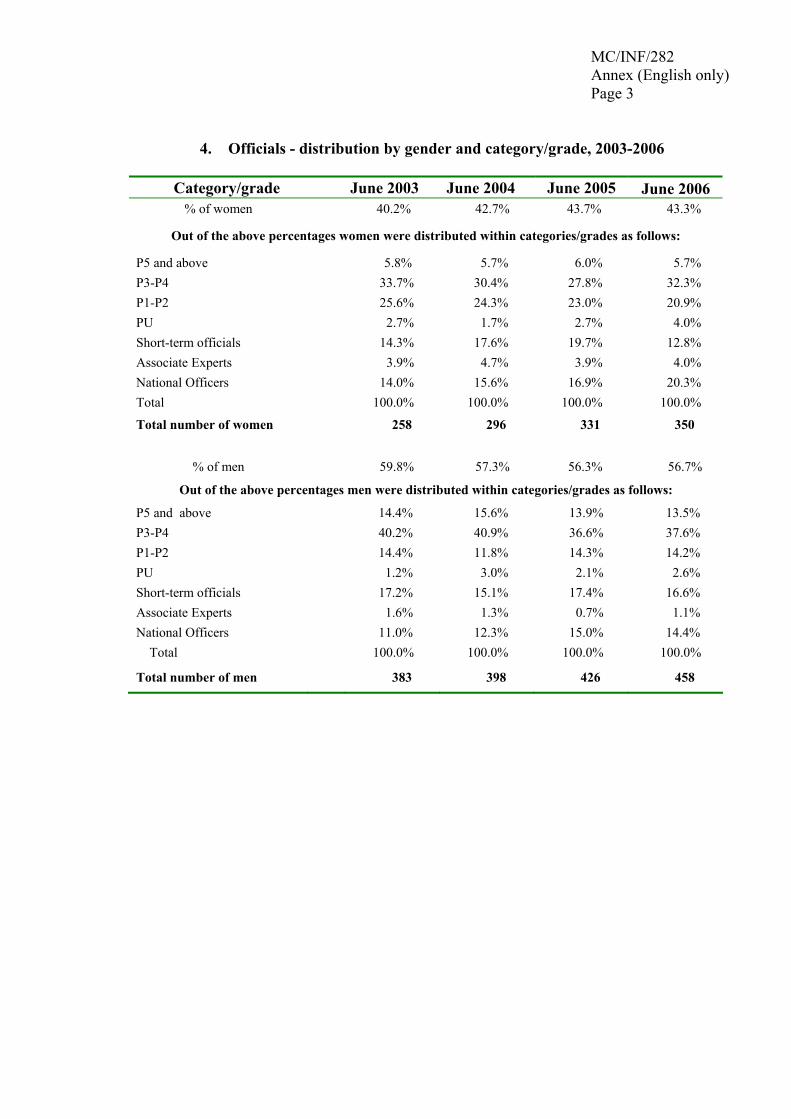
4. Officials - distribution by gender and category/grade, 2003-2006
Category/grade June 2003 June 2004 June 2005 June 2006 % of women 40.2% 42.7% 43.7% 43.3%
Out of the above percentages women were distributed within categories/grades as follows:
P5 and above 5.8% 5.7% 6.0% 5.7% P3-P4 33.7% 30.4% 27.8% 32.3% P1-P2 25.6% 24.3% 23.0% 20.9% PU 2.7% 1.7% 2.7% 4.0% Short-term officials 14.3% 17.6% 19.7% 12.8% Associate Experts 3.9% 4.7% 3.9% 4.0% National Officers 14.0% 15.6% 16.9% 20.3% Total 100.0% 100.0% 100.0% 100.0%
Total number of women 258 296 331 350
% of men 59.8% 57.3% 56.3% 56.7%
Out of the above percentages men were distributed within categories/grades as follows:
P5 and above 14.4% 15.6% 13.9% 13.5% P3-P4 40.2% 40.9% 36.6% 37.6% P1-P2 14.4% 11.8% 14.3% 14.2% PU 1.2% 3.0% 2.1% 2.6% Short-term officials 17.2% 15.1% 17.4% 16.6% Associate Experts 1.6% 1.3% 0.7% 1.1% National Officers 11.0% 12.3% 15.0% 14.4% Total 100.0% 100.0% 100.0% 100.0%
Total number of men 383 398 426 458
MC/INF/282 Annex (English only) Page 4
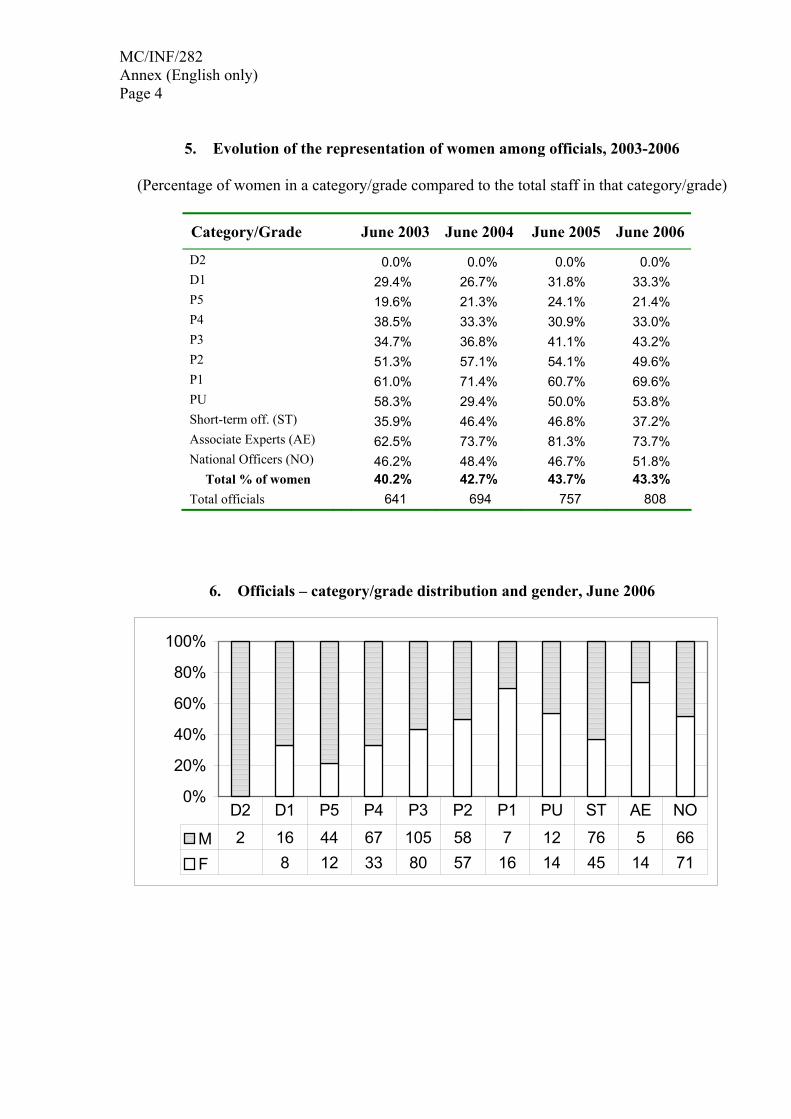
5. Evolution of the representation of women among officials, 2003-2006
(Percentage of women in a category/grade compared to the total staff in that category/grade)
Category/Grade June 2003 June 2004 June 2005 June 2006
D2 0.0% 0.0% 0.0% 0.0% D1 29.4% 26.7% 31.8% 33.3% P5 19.6% 21.3% 24.1% 21.4% P4 38.5% 33.3% 30.9% 33.0% P3 34.7% 36.8% 41.1% 43.2% P2 51.3% 57.1% 54.1% 49.6% P1 61.0% 71.4% 60.7% 69.6% PU 58.3% 29.4% 50.0% 53.8% Short-term off. (ST) 35.9% 46.4% 46.8% 37.2% Associate Experts (AE) 62.5% 73.7% 81.3% 73.7% National Officers (NO) 46.2% 48.4% 46.7% 51.8%
Total % of women 40.2% 42.7% 43.7% 43.3% Total officials 641 694 757 808
6. Officials – category/grade distribution and gender, June 2006
0%
20%
40%
60%
80%
100%
M 2 16 44 67 105 58 7 12 76 5 66F 8 12 33 80 57 16 14 45 14 71
D2 D1 P5 P4 P3 P2 P1 PU ST AE NO
MC/INF/282 Annex (English only) Page 5
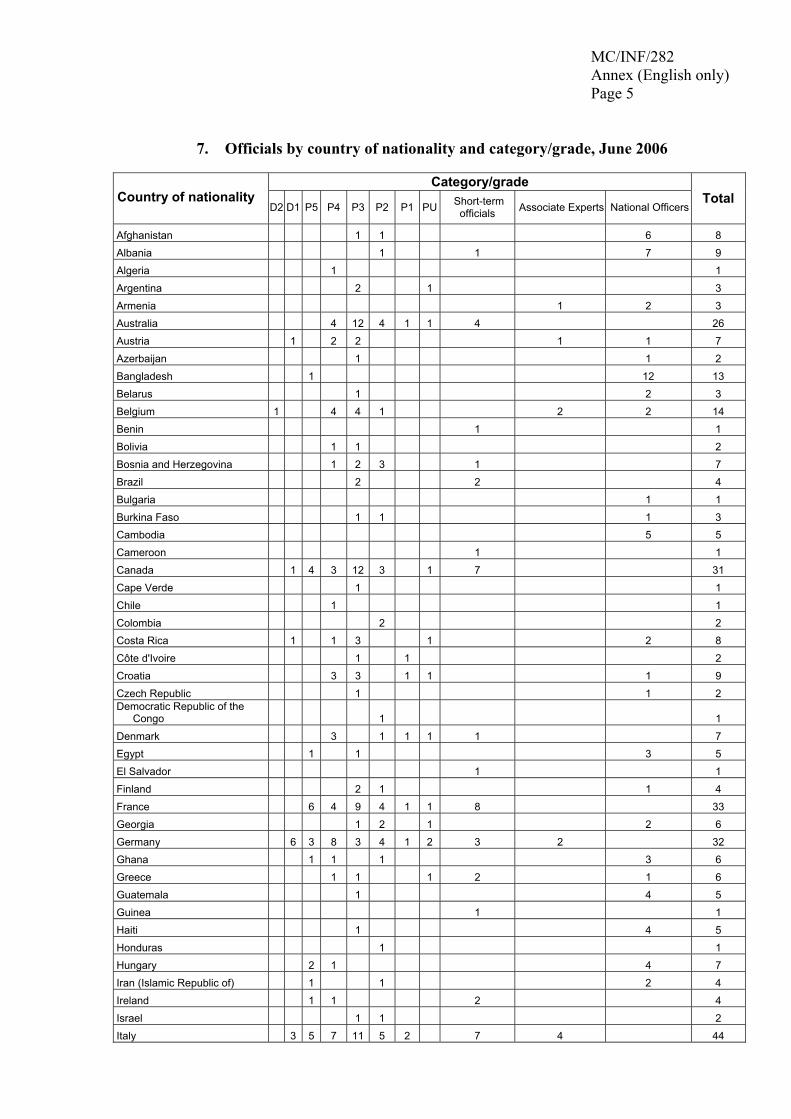
7. Officials by country of nationality and category/grade, June 2006 Category/grade
Country of nationality
D2 D1 P5 P4 P3 P2 P1 PU Short-term officials Associate Experts National Officers
Total
Afghanistan 1 1 6 8 Albania 1 1 7 9 Algeria 1 1 Argentina 2 1 3 Armenia 1 2 3 Australia 4 12 4 1 1 4 26 Austria 1 2 2 1 1 7 Azerbaijan 1 1 2 Bangladesh 1 12 13 Belarus 1 2 3 Belgium 1 4 4 1 2 2 14 Benin 1 1 Bolivia 1 1 2 Bosnia and Herzegovina 1 2 3 1 7 Brazil 2 2 4 Bulgaria 1 1 Burkina Faso 1 1 1 3 Cambodia 5 5 Cameroon 1 1 Canada 1 4 3 12 3 1 7 31 Cape Verde 1 1 Chile 1 1 Colombia 2 2 Costa Rica 1 1 3 1 2 8 Côte d'Ivoire 1 1 2 Croatia 3 3 1 1 1 9 Czech Republic 1 1 2 Democratic Republic of the Congo 1 1 Denmark 3 1 1 1 1 7 Egypt 1 1 3 5 El Salvador 1 1 Finland 2 1 1 4 France 6 4 9 4 1 1 8 33 Georgia 1 2 1 2 6 Germany 6 3 8 3 4 1 2 3 2 32 Ghana 1 1 1 3 6 Greece 1 1 1 2 1 6 Guatemala 1 4 5 Guinea 1 1 Haiti 1 4 5 Honduras 1 1 Hungary 2 1 4 7 Iran (Islamic Republic of) 1 1 2 4 Ireland 1 1 2 4 Israel 1 1 2 Italy 3 5 7 11 5 2 7 4 44
MC/INF/282 Annex (English only) Page 6
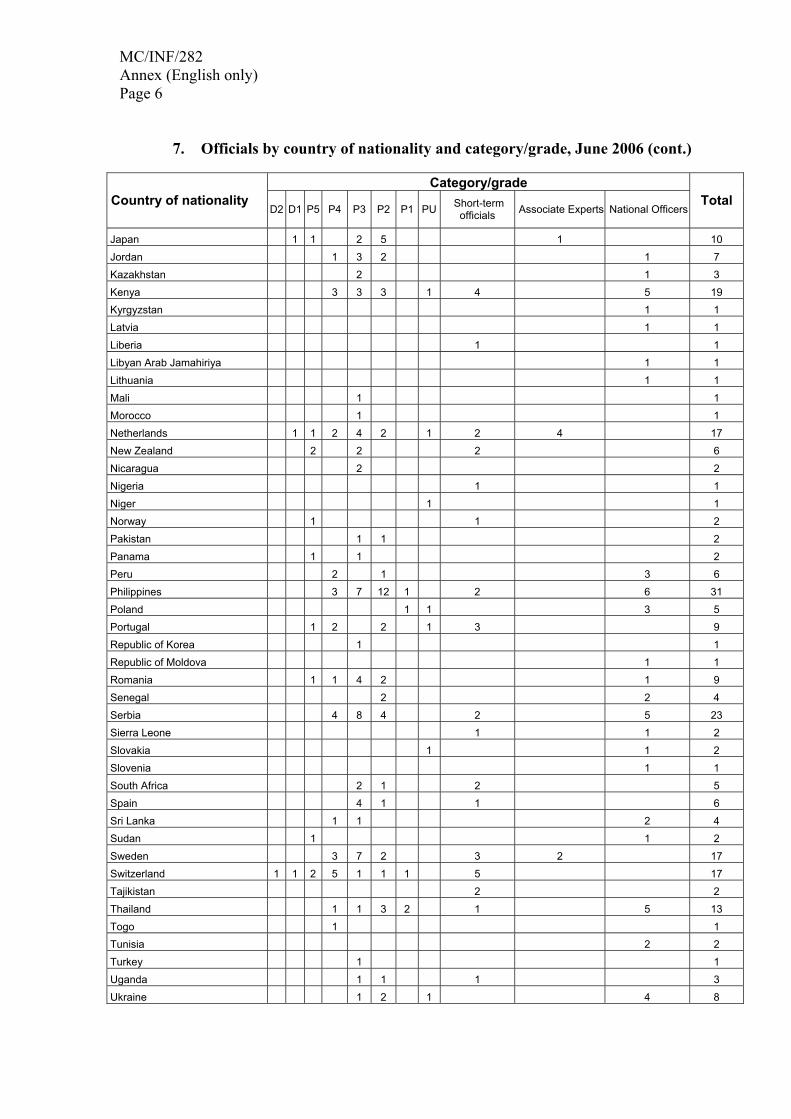
7. Officials by country of nationality and category/grade, June 2006 (cont.)
Category/grade Country of nationality
D2 D1 P5 P4 P3 P2 P1 PU Short-term officials Associate Experts National Officers
Total
Japan 1 1 2 5 1 10 Jordan 1 3 2 1 7 Kazakhstan 2 1 3 Kenya 3 3 3 1 4 5 19 Kyrgyzstan 1 1 Latvia 1 1 Liberia 1 1 Libyan Arab Jamahiriya 1 1 Lithuania 1 1 Mali 1 1 Morocco 1 1 Netherlands 1 1 2 4 2 1 2 4 17 New Zealand 2 2 2 6 Nicaragua 2 2 Nigeria 1 1 Niger 1 1 Norway 1 1 2 Pakistan 1 1 2 Panama 1 1 2 Peru 2 1 3 6 Philippines 3 7 12 1 2 6 31 Poland 1 1 3 5 Portugal 1 2 2 1 3 9 Republic of Korea 1 1 Republic of Moldova 1 1 Romania 1 1 4 2 1 9 Senegal 2 2 4 Serbia 4 8 4 2 5 23 Sierra Leone 1 1 2 Slovakia 1 1 2 Slovenia 1 1 South Africa 2 1 2 5 Spain 4 1 1 6 Sri Lanka 1 1 2 4 Sudan 1 1 2 Sweden 3 7 2 3 2 17 Switzerland 1 1 2 5 1 1 1 5 17 Tajikistan 2 2 Thailand 1 1 3 2 1 5 13 Togo 1 1 Tunisia 2 2 Turkey 1 1 Uganda 1 1 1 3 Ukraine 1 2 1 4 8
MC/INF/282 Annex (English only) Page 7
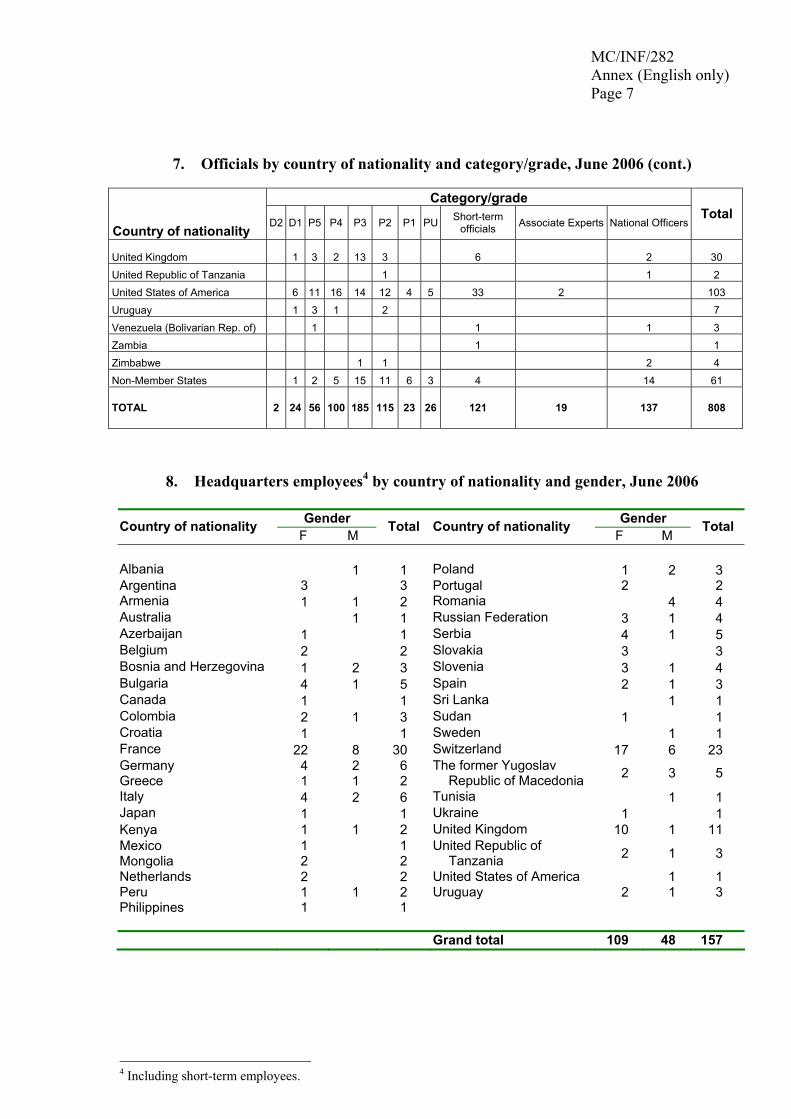
7. Officials by country of nationality and category/grade, June 2006 (cont.)
Category/grade
Country of nationality D2 D1 P5 P4 P3 P2 P1 PU Short-term
officials Associate Experts National OfficersTotal
United Kingdom 1 3 2 13 3 6 2 30 United Republic of Tanzania 1 1 2 United States of America 6 11 16 14 12 4 5 33 2 103 Uruguay 1 3 1 2 7 Venezuela (Bolivarian Rep. of) 1 1 1 3 Zambia 1 1 Zimbabwe 1 1 2 4 Non-Member States 1 2 5 15 11 6 3 4 14 61
TOTAL 2 24 56 100 185 115 23 26 121 19 137 808
8. Headquarters employees4 by country of nationality and gender, June 2006
Gender Gender Country of nationality F M
Total Country of nationality F M
Total
Albania 1 1 Poland 1 2 3 Argentina 3 3 Portugal 2 2 Armenia 1 1 2 Romania 4 4 Australia 1 1 Russian Federation 3 1 4 Azerbaijan 1 1 Serbia 4 1 5 Belgium 2 2 Slovakia 3 3 Bosnia and Herzegovina 1 2 3 Slovenia 3 1 4 Bulgaria 4 1 5 Spain 2 1 3 Canada 1 1 Sri Lanka 1 1 Colombia 2 1 3 Sudan 1 1 Croatia 1 1 Sweden 1 1 France 22 8 30 Switzerland 17 6 23 Germany 4 2 6 Greece 1 1 2
The former Yugoslav Republic of Macedonia 2 3 5
Italy 4 2 6 Tunisia 1 1 Japan 1 1 Ukraine 1 1 Kenya 1 1 2 United Kingdom 10 1 11 Mexico 1 1 Mongolia 2 2
United Republic of Tanzania 2 1 3
Netherlands 2 2 United States of America 1 1 Peru 1 1 2 Uruguay 2 1 3 Philippines 1 1 Grand total 109 48 157
4 Including short-term employees.
MC/INF/282 Annex (English only) Page 8
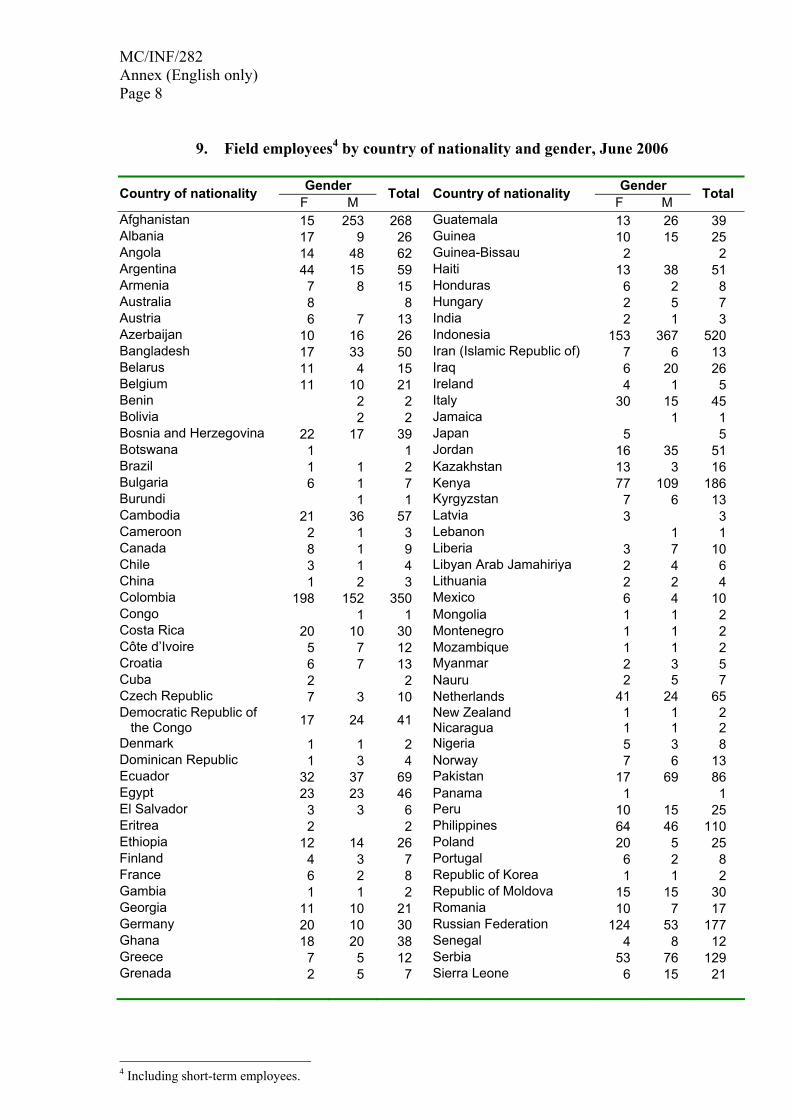
9. Field employees4 by country of nationality and gender, June 2006
Gender Gender Country of nationality F M
Total Country of nationality F M
Total
Afghanistan 15 253 268 Guatemala 13 26 39 Albania 17 9 26 Guinea 10 15 25 Angola 14 48 62 Guinea-Bissau 2 2 Argentina 44 15 59 Haiti 13 38 51 Armenia 7 8 15 Honduras 6 2 8 Australia 8 8 Hungary 2 5 7 Austria 6 7 13 India 2 1 3 Azerbaijan 10 16 26 Indonesia 153 367 520 Bangladesh 17 33 50 Iran (Islamic Republic of) 7 6 13 Belarus 11 4 15 Iraq 6 20 26 Belgium 11 10 21 Ireland 4 1 5 Benin 2 2 Italy 30 15 45 Bolivia 2 2 Jamaica 1 1 Bosnia and Herzegovina 22 17 39 Japan 5 5 Botswana 1 1 Jordan 16 35 51 Brazil 1 1 2 Kazakhstan 13 3 16 Bulgaria 6 1 7 Kenya 77 109 186 Burundi 1 1 Kyrgyzstan 7 6 13 Cambodia 21 36 57 Latvia 3 3 Cameroon 2 1 3 Lebanon 1 1 Canada 8 1 9 Liberia 3 7 10 Chile 3 1 4 Libyan Arab Jamahiriya 2 4 6 China 1 2 3 Lithuania 2 2 4 Colombia 198 152 350 Mexico 6 4 10 Congo 1 1 Mongolia 1 1 2 Costa Rica 20 10 30 Montenegro 1 1 2 Côte d’Ivoire 5 7 12 Mozambique 1 1 2 Croatia 6 7 13 Myanmar 2 3 5 Cuba 2 2 Nauru 2 5 7 Czech Republic 7 3 10 Netherlands 41 24 65
New Zealand 1 1 2 Democratic Republic of the Congo 17 24 41 Nicaragua 1 1 2 Denmark 1 1 2 Nigeria 5 3 8 Dominican Republic 1 3 4 Norway 7 6 13 Ecuador 32 37 69 Pakistan 17 69 86 Egypt 23 23 46 Panama 1 1 El Salvador 3 3 6 Peru 10 15 25 Eritrea 2 2 Philippines 64 46 110 Ethiopia 12 14 26 Poland 20 5 25 Finland 4 3 7 Portugal 6 2 8 France 6 2 8 Republic of Korea 1 1 2 Gambia 1 1 2 Republic of Moldova 15 15 30 Georgia 11 10 21 Romania 10 7 17 Germany 20 10 30 Russian Federation 124 53 177 Ghana 18 20 38 Senegal 4 8 12 Greece 7 5 12 Serbia 53 76 129 Grenada 2 5 7 Sierra Leone 6 15 21
4 Including short-term employees.
MC/INF/282 Annex (English only) Page 9
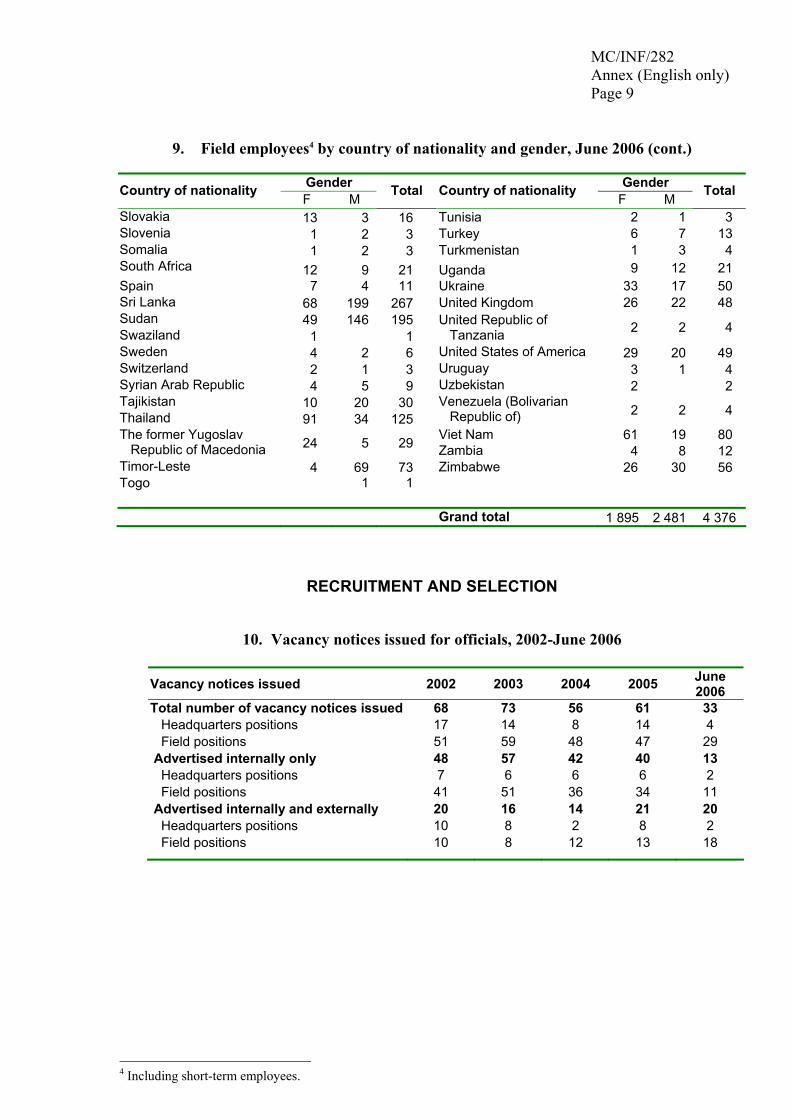
9. Field employees4 by country of nationality and gender, June 2006 (cont.)
Gender Gender Country of nationality F M Total Country of nationality F M Total
Slovakia 13 3 16 Tunisia 2 1 3 Slovenia 1 2 3 Turkey 6 7 13 Somalia 1 2 3 Turkmenistan 1 3 4 South Africa 12 9 21 Uganda 9 12 21 Spain 7 4 11 Ukraine 33 17 50 Sri Lanka 68 199 267 United Kingdom 26 22 48 Sudan 49 146 195 Swaziland 1 1
United Republic of Tanzania 2 2 4
Sweden 4 2 6 United States of America 29 20 49 Switzerland 2 1 3 Uruguay 3 1 4 Syrian Arab Republic 4 5 9 Uzbekistan 2 2 Tajikistan 10 20 30 Thailand 91 34 125
Venezuela (Bolivarian Republic of) 2 2 4
Viet Nam 61 19 80 The former Yugoslav Republic of Macedonia 24 5 29 Zambia 4 8 12 Timor-Leste 4 69 73 Zimbabwe 26 30 56 Togo 1 1 Grand total 1 895 2 481 4 376
RECRUITMENT AND SELECTION
10. Vacancy notices issued for officials, 2002-June 2006
Vacancy notices issued 2002 2003 2004 2005 June 2006
Total number of vacancy notices issued 68 73 56 61 33 Headquarters positions 17 14 8 14 4 Field positions 51 59 48 47 29 Advertised internally only 48 57 42 40 13 Headquarters positions 7 6 6 6 2 Field positions 41 51 36 34 11 Advertised internally and externally 20 16 14 21 20 Headquarters positions 10 8 2 8 2 Field positions 10 8 12 13 18
4 Including short-term employees.
MC/INF/282 Annex (English only) Page 10
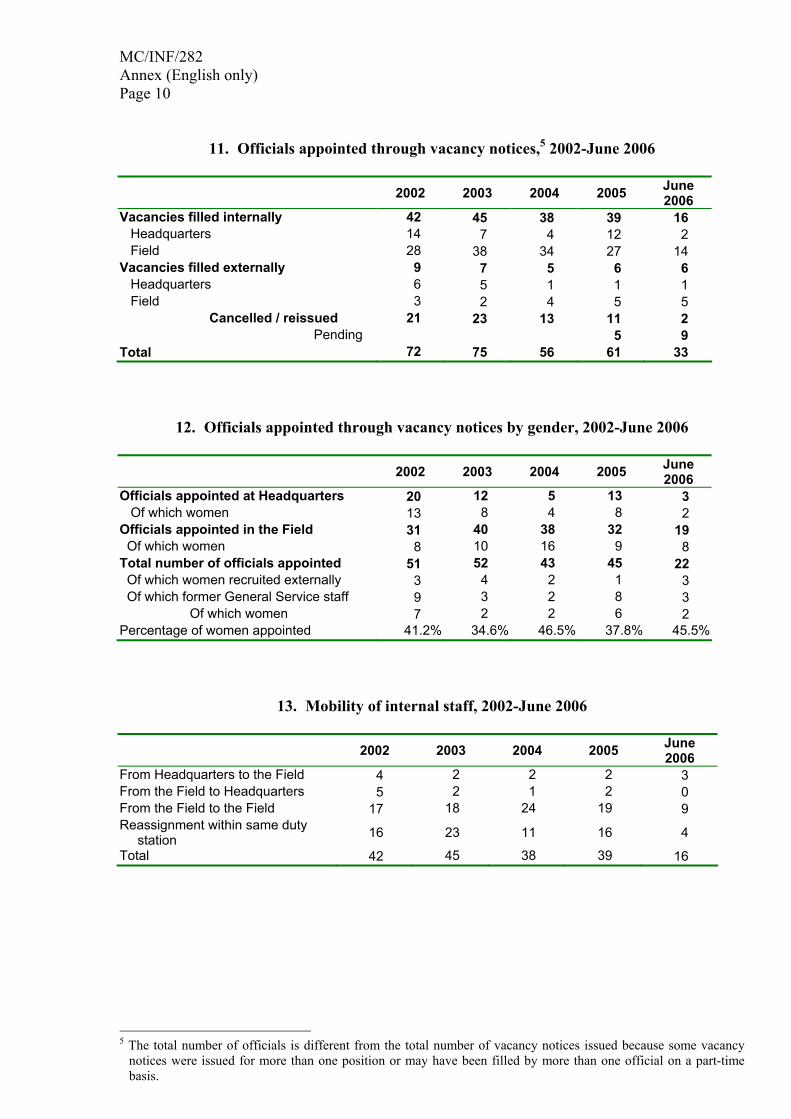
11. Officials appointed through vacancy notices,5 2002-June 2006
2002 2003 2004 2005 June 2006
Vacancies filled internally 42 45 38 39 16 Headquarters 14 7 4 12 2 Field 28 38 34 27 14 Vacancies filled externally 9 7 5 6 6 Headquarters 6 5 1 1 1 Field 3 2 4 5 5
Cancelled / reissued 21 23 13 11 2 Pending 5 9
Total 72 75 56 61 33
12. Officials appointed through vacancy notices by gender, 2002-June 2006
2002 2003 2004 2005 June
2006 Officials appointed at Headquarters 20 12 5 13 3 Of which women 13 8 4 8 2 Officials appointed in the Field 31 40 38 32 19 Of which women 8 10 16 9 8 Total number of officials appointed 51 52 43 45 22 Of which women recruited externally 3 4 2 1 3 Of which former General Service staff 9 3 2 8 3 Of which women 7 2 2 6 2 Percentage of women appointed 41.2% 34.6% 46.5% 37.8% 45.5%
13. Mobility of internal staff, 2002-June 2006
2002 2003 2004 2005 June 2006
From Headquarters to the Field 4 2 2 2 3 From the Field to Headquarters 5 2 1 2 0 From the Field to the Field 17 18 24 19 9 Reassignment within same duty
station 16 23 11 16 4
Total 42 45 38 39 16
5 The total number of officials is different from the total number of vacancy notices issued because some vacancy
notices were issued for more than one position or may have been filled by more than one official on a part-time basis.
MC/INF/282 Annex (English only) Page 11
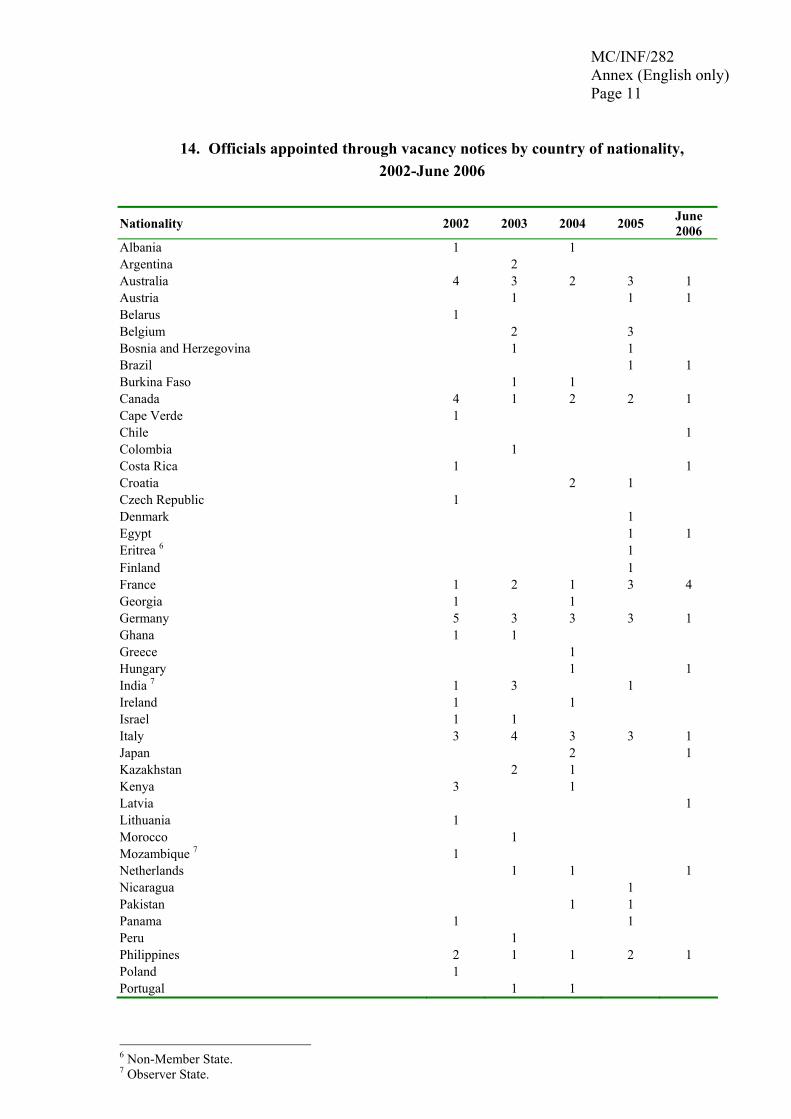
14. Officials appointed through vacancy notices by country of nationality, 2002-June 2006
Nationality 2002 2003 2004 2005 June 2006
Albania 1 1 Argentina 2 Australia 4 3 2 3 1 Austria 1 1 1 Belarus 1 Belgium 2 3 Bosnia and Herzegovina 1 1 Brazil 1 1 Burkina Faso 1 1 Canada 4 1 2 2 1 Cape Verde 1 Chile 1 Colombia 1 Costa Rica 1 1 Croatia 2 1 Czech Republic 1 Denmark 1 Egypt 1 1 Eritrea 6 1 Finland 1 France 1 2 1 3 4 Georgia 1 1 Germany 5 3 3 3 1 Ghana 1 1 Greece 1 Hungary 1 1 India 7 1 3 1 Ireland 1 1 Israel 1 1 Italy 3 4 3 3 1 Japan 2 1 Kazakhstan 2 1 Kenya 3 1 Latvia 1 Lithuania 1 Morocco 1 Mozambique 7 1 Netherlands 1 1 1 Nicaragua 1 Pakistan 1 1 Panama 1 1 Peru 1 Philippines 2 1 1 2 1 Poland 1 Portugal 1 1
6 Non-Member State. 7 Observer State.
MC/INF/282 Annex (English only) Page 12
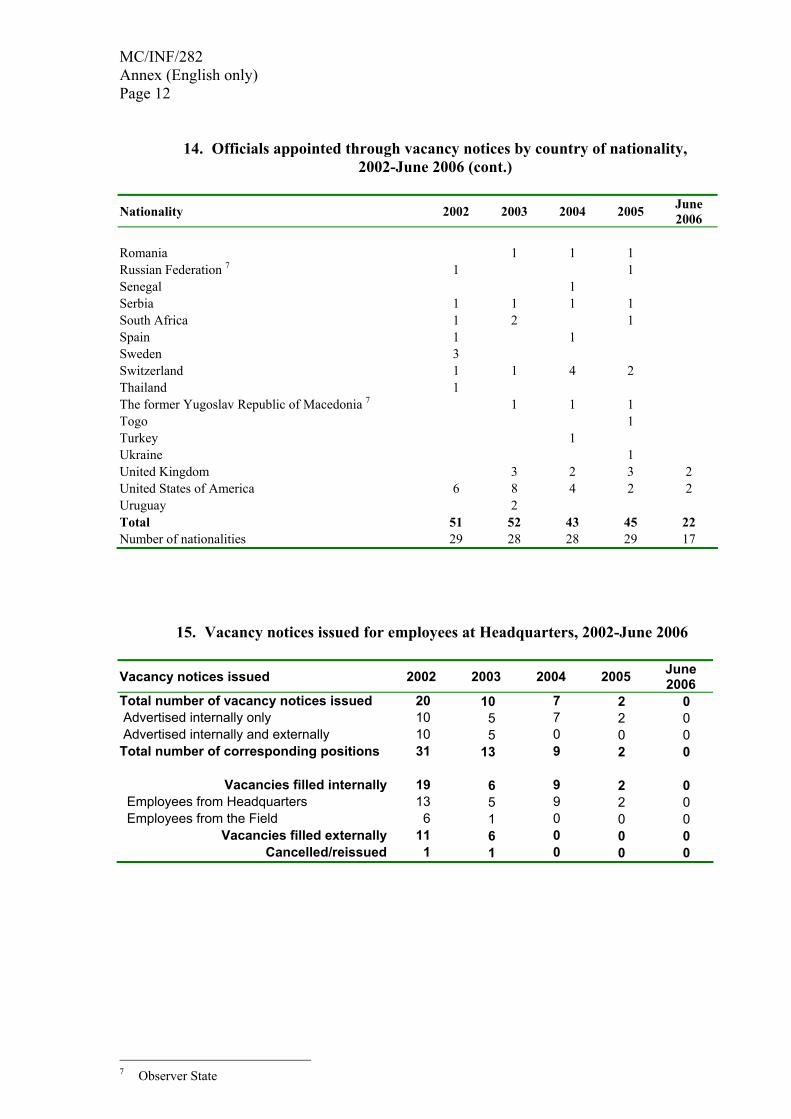
14. Officials appointed through vacancy notices by country of nationality, 2002-June 2006 (cont.)
Nationality 2002 2003 2004 2005 June
2006 Romania 1 1 1 Russian Federation 7 1 1 Senegal 1 Serbia 1 1 1 1 South Africa 1 2 1 Spain 1 1 Sweden 3 Switzerland 1 1 4 2 Thailand 1 The former Yugoslav Republic of Macedonia 7 1 1 1 Togo 1 Turkey 1 Ukraine 1 United Kingdom 3 2 3 2 United States of America 6 8 4 2 2 Uruguay 2 Total 51 52 43 45 22 Number of nationalities 29 28 28 29 17
15. Vacancy notices issued for employees at Headquarters, 2002-June 2006
Vacancy notices issued 2002 2003 2004 2005 June 2006
Total number of vacancy notices issued 20 10 7 2 0 Advertised internally only 10 5 7 2 0 Advertised internally and externally 10 5 0 0 0 Total number of corresponding positions 31 13 9 2 0
Vacancies filled internally 19 6 9 2 0
Employees from Headquarters 13 5 9 2 0 Employees from the Field 6 1 0 0 0
Vacancies filled externally 11 6 0 0 0 Cancelled/reissued 1 1 0 0 0
7 Observer State
MC/INF/282 Annex (English only) Page 13
16. Summary of temporary recruitment and selection, 2002-June 2006
2002 2003 2004 2005 June 2006
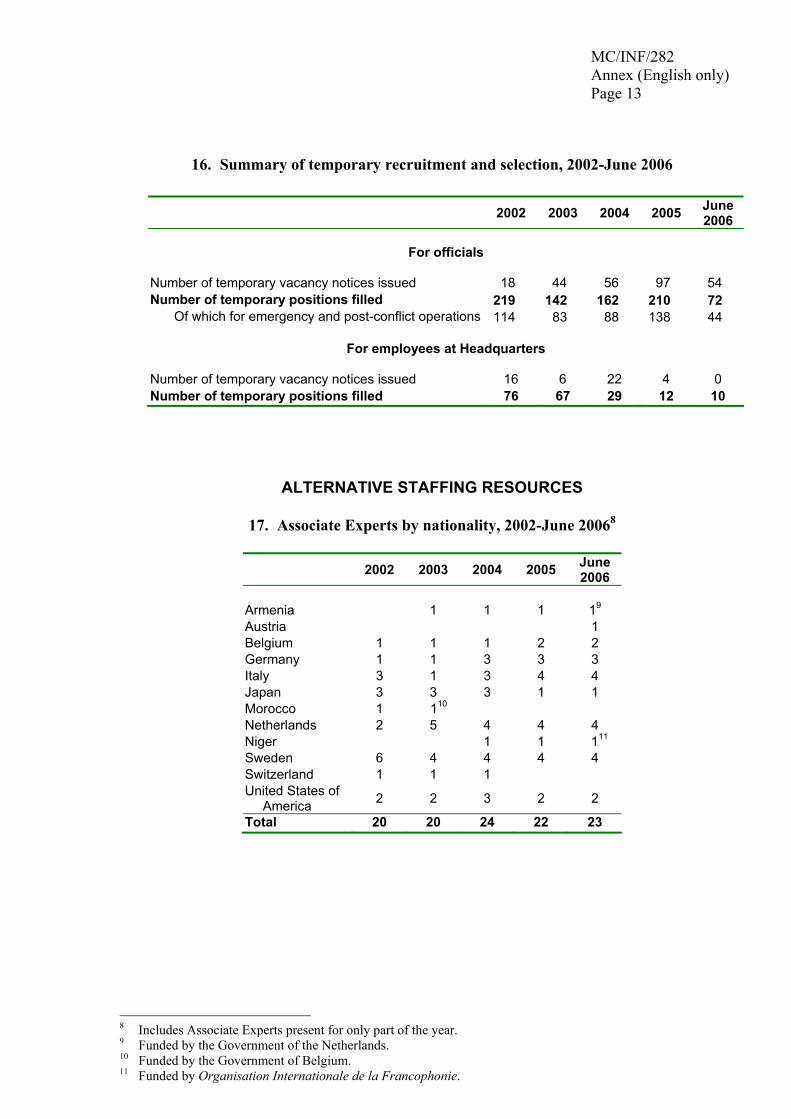
For officials
Number of temporary vacancy notices issued 18 44 56 97 54 Number of temporary positions filled 219 142 162 210 72
Of which for emergency and post-conflict operations 114 83 88 138 44
For employees at Headquarters
Number of temporary vacancy notices issued 16 6 22 4 0 Number of temporary positions filled 76 67 29 12 10
ALTERNATIVE STAFFING RESOURCES
17. Associate Experts by nationality, 2002-June 20068
2002 2003 2004 2005 June 2006
Armenia 1 1 1 19 Austria 1 Belgium 1 1 1 2 2 Germany 1 1 3 3 3 Italy 3 1 3 4 4 Japan 3 3 3 1 1 Morocco 1 110 Netherlands 2 5 4 4 4 Niger 1 1 111 Sweden 6 4 4 4 4 Switzerland 1 1 1 United States of
America 2 2 3 2 2
Total 20 20 24 22 23
8 Includes Associate Experts present for only part of the year. 9 Funded by the Government of the Netherlands. 10 Funded by the Government of Belgium. 11 Funded by Organisation Internationale de la Francophonie.
MC/INF/282 Annex (English only) Page 14
OTHER CATEGORIES
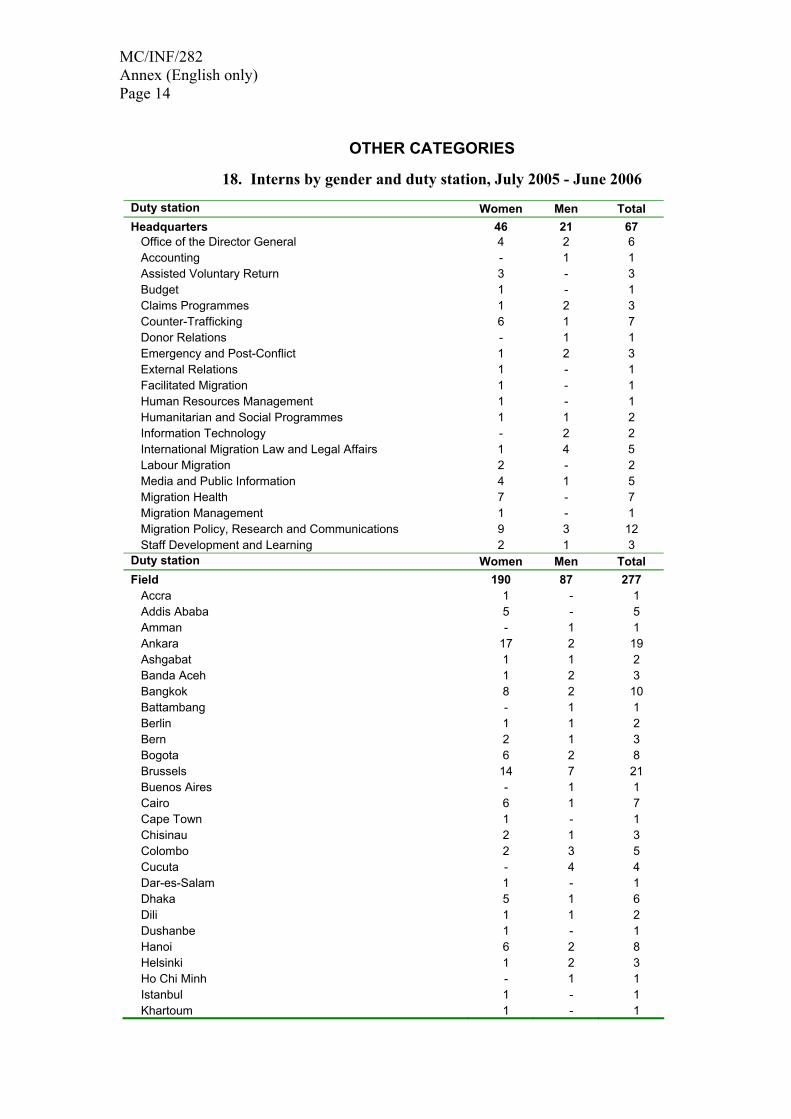
18. Interns by gender and duty station, July 2005 - June 2006
Duty station Women Men Total Headquarters 46 21 67 Office of the Director General 4 2 6 Accounting - 1 1 Assisted Voluntary Return 3 - 3 Budget 1 - 1 Claims Programmes 1 2 3 Counter-Trafficking 6 1 7 Donor Relations - 1 1 Emergency and Post-Conflict 1 2 3 External Relations 1 - 1 Facilitated Migration 1 - 1 Human Resources Management 1 - 1 Humanitarian and Social Programmes 1 1 2 Information Technology - 2 2 International Migration Law and Legal Affairs 1 4 5 Labour Migration 2 - 2 Media and Public Information 4 1 5 Migration Health 7 - 7 Migration Management 1 - 1 Migration Policy, Research and Communications 9 3 12 Staff Development and Learning 2 1 3 Duty station Women Men Total Field 190 87 277
Accra 1 - 1 Addis Ababa 5 - 5 Amman - 1 1 Ankara 17 2 19 Ashgabat 1 1 2 Banda Aceh 1 2 3 Bangkok 8 2 10 Battambang - 1 1 Berlin 1 1 2 Bern 2 1 3 Bogota 6 2 8 Brussels 14 7 21 Buenos Aires - 1 1 Cairo 6 1 7 Cape Town 1 - 1 Chisinau 2 1 3 Colombo 2 3 5 Cucuta - 4 4 Dar-es-Salam 1 - 1 Dhaka 5 1 6 Dili 1 1 2 Dushanbe 1 - 1 Hanoi 6 2 8 Helsinki 1 2 3 Ho Chi Minh - 1 1 Istanbul 1 - 1 Khartoum 1 - 1
MC/INF/282 Annex (English only) Page 15
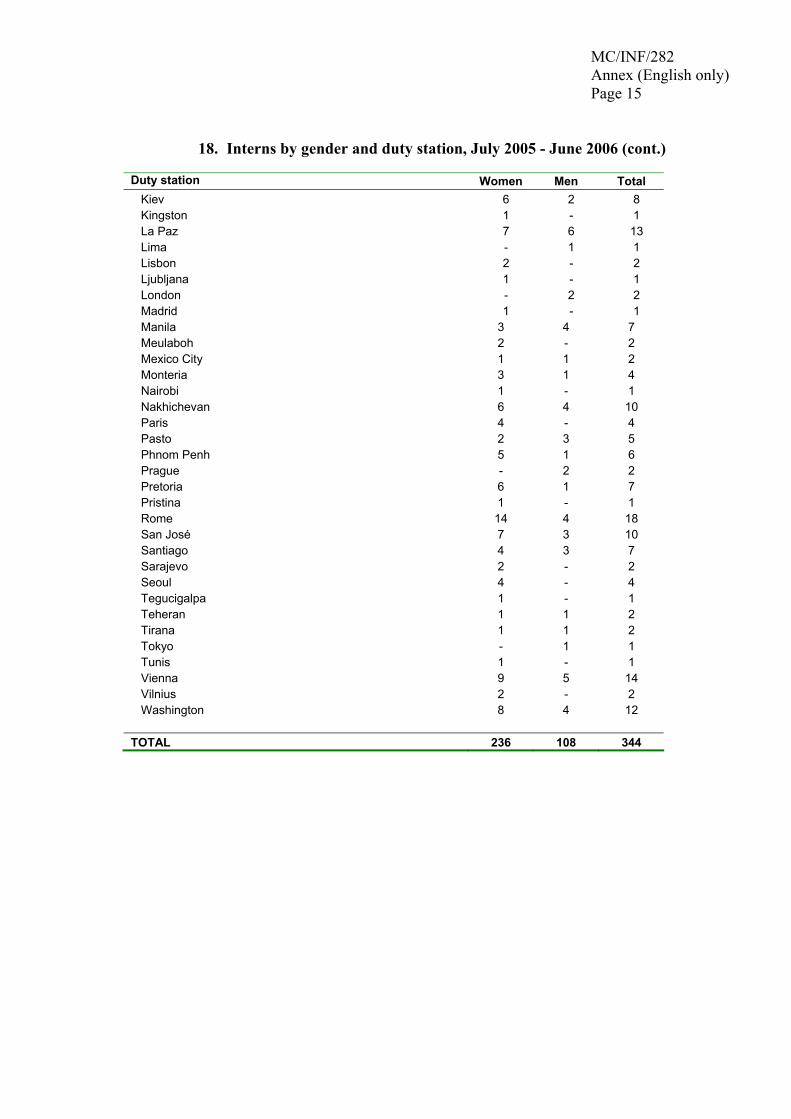
18. Interns by gender and duty station, July 2005 - June 2006 (cont.)
Duty station Women Men Total Kiev 6 2 8 Kingston 1 - 1 La Paz 7 6 13 Lima - 1 1 Lisbon 2 - 2 Ljubljana 1 - 1 London - 2 2 Madrid 1 - 1 Manila 3 4 7 Meulaboh 2 - 2 Mexico City 1 1 2 Monteria 3 1 4 Nairobi 1 - 1 Nakhichevan 6 4 10 Paris 4 - 4 Pasto 2 3 5 Phnom Penh 5 1 6 Prague - 2 2 Pretoria 6 1 7 Pristina 1 - 1 Rome 14 4 18 San José 7 3 10 Santiago 4 3 7 Sarajevo 2 - 2 Seoul 4 - 4 Tegucigalpa 1 - 1 Teheran 1 1 2 Tirana 1 1 2 Tokyo - 1 1 Tunis 1 - 1 Vienna 9 5 14 Vilnius 2 - 2 Washington 8 4 12
TOTAL 236 108 344
MC/INF/282 Annex (English only) Page 16
STAFF DEVELOPMENT AND LEARNING
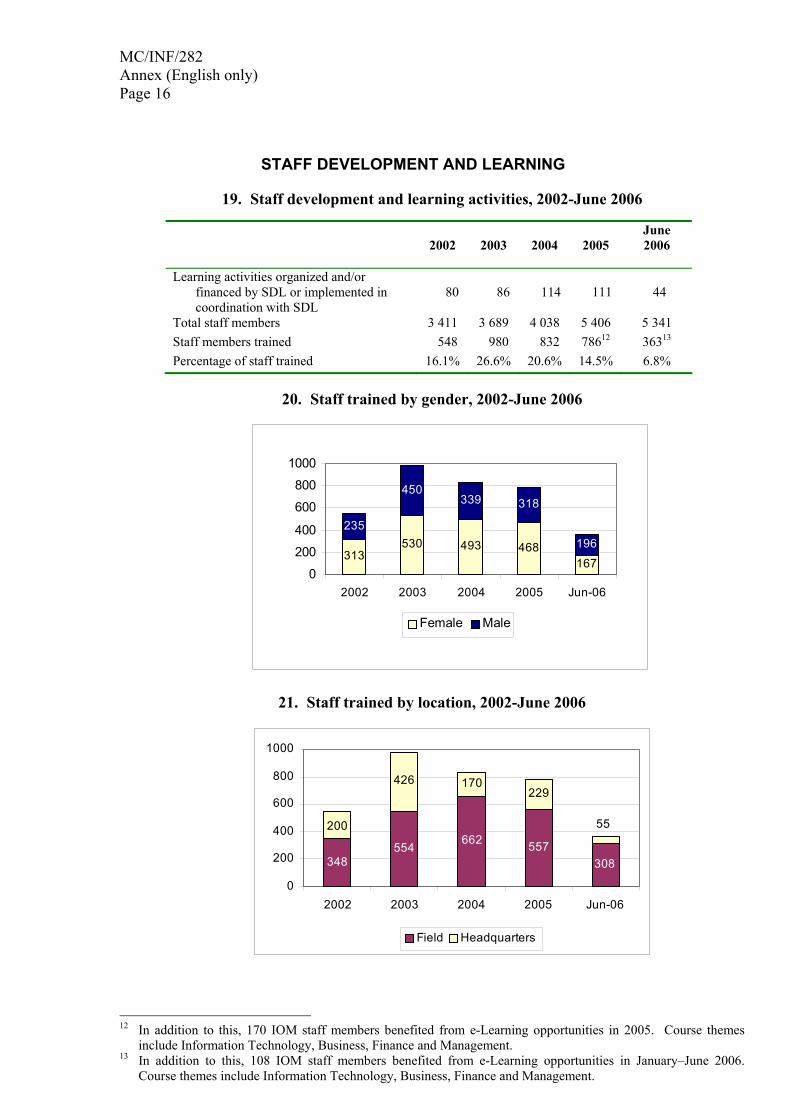
19. Staff development and learning activities, 2002-June 2006
2002 2003 2004 2005 June 2006
Learning activities organized and/or
financed by SDL or implemented in coordination with SDL
80
86
114 111
44
Total staff members 3 411 3 689 4 038 5 406 5 341 Staff members trained 548 980 832 78612 36313 Percentage of staff trained 16.1% 26.6% 20.6% 14.5% 6.8%
20. Staff trained by gender, 2002-June 2006
313530 493 468
167
450339 318
196235
0
200
400
600
800
1000
2002 2003 2004 2005 Jun-06
Female Male
21. Staff trained by location, 2002-June 2006
348554
662 557
426 170229
308
55200
0
200
400
600
800
1000
2002 2003 2004 2005 Jun-06
Field Headquarters
12 In addition to this, 170 IOM staff members benefited from e-Learning opportunities in 2005. Course themes
include Information Technology, Business, Finance and Management. 13 In addition to this, 108 IOM staff members benefited from e-Learning opportunities in January–June 2006.
Course themes include Information Technology, Business, Finance and Management.
MC/INF/282 Annex (English only) Page 17
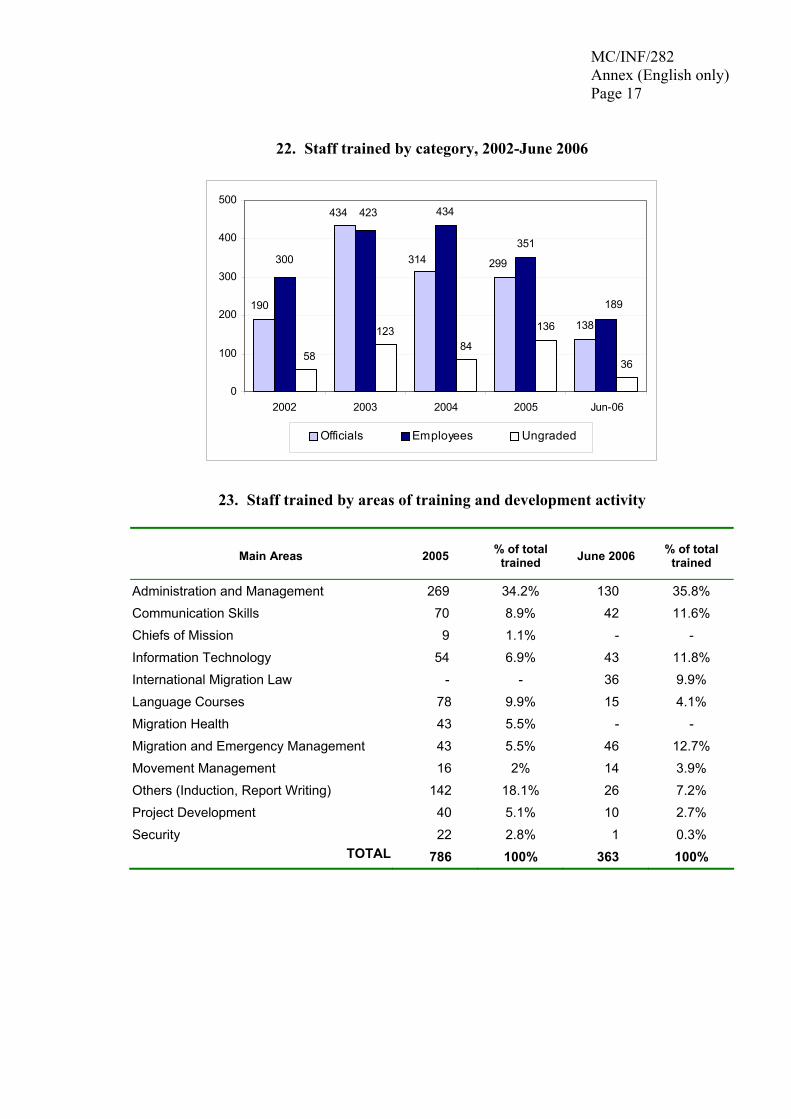
22. Staff trained by category, 2002-June 2006
138
434
351
12384
136
36
299314
434
190 189
423
300
58
0
100
200
300
400
500
2002 2003 2004 2005 Jun-06
Officials Employees Ungraded
23. Staff trained by areas of training and development activity
Main Areas 2005 % of total trained June 2006 % of total
trained
Administration and Management 269 34.2% 130 35.8% Communication Skills 70 8.9% 42 11.6% Chiefs of Mission 9 1.1% - -
Information Technology 54 6.9% 43 11.8% International Migration Law - - 36 9.9%
Language Courses 78 9.9% 15 4.1% Migration Health 43 5.5% - -
Migration and Emergency Management 43 5.5% 46 12.7% Movement Management 16 2% 14 3.9%
Others (Induction, Report Writing) 142 18.1% 26 7.2% Project Development 40 5.1% 10 2.7%
Security 22 2.8% 1 0.3% TOTAL 786 100% 363 100%