Embed Size (px)
Citation preview
Means-tested and universal approaches to poverty: international evidence and how the UK compares CRSP Working paper 640 Dimitri Gugushvili and Donald Hirsch August 2014


CONTENTS 1 UNIVERSALISM VS. SELECTIVISM: A BRIEF OVERVIEW 1 2 ARE UNIVERSAL BENEFITS MORE EFFECTIVE IN REDUCING 7 POVERTY THAN MEANS-TESTED ONES? 3 HOW DOES THE U.K. COMPARE WITH OTHER WELFARE STATES? 15 4 SUMMARY OF MAIN FINDINGS 20 5 REFERENCES 22
1
1 UNIVERSALISM VS. SELECTIVISM: A BRIEF OVERVIEW
All advanced welfare states use a mix of universal and means-tested programmes to
meet particular needs of their citizens. However, the balance between the two varies
considerably across welfare regime types, as well as across countries with similar
systems. The relative weight of universal and means-tested benefits in overall
welfare provision has considerable implications for income redistribution, and more
importantly, for poverty (Esping-Andersen and Myles, n.d.; Smeeding, 2005).
However, the effects of the institutional set-up of welfare states are rather complex
and difficult to discern precisely, hence it comes as no surprise that scholars and
policy practitioners have long debated which of the two types of schemes is more
effective in reducing poverty. This debate has helped to identify multiple limitations
of both approaches, which we will briefly review below. Box 1 clarifies the
terminology used in this analysis.
Box 1 Definitions of main concepts and terms Selective benefits – cash transfers and services limited to individuals or households with limited resources. The selectivity may either involve direct means-testing or be applied by other measures intended to target the benefit on deprived groups, such as selectivity by deprived area. Means-tested benefit - type of selective benefit the access to which requires checking applicants’ resources (incomes, assets, or both). Universal benefits - cash transfers or services that are available to all citizens/residents (e.g. primary education), or large categories of citizens (e.g. pensioners) without a means-testing requirement or other form of selectivity. Note therefore that ‘universal’ encompasses some benefits that to do not go to everybody – they may be demographically targeted or dependent on prior contributions, without being specifically targeted at less well-off households. Contribution-based benefits – universal cash transfers and services, access to which requires a certain minimum period of contributions, usually by paying income tax and/or national insurance contributions. Earnings-related benefits - type of contribution-based transfer in which the level of transfer is related to the amount of earnings-contingent contributions made. Targeting - method for selecting beneficiaries of particular transfers or services. Benefits may be targeted through various criteria: age, geographic location, labour market status, family composition, income, etc. Thus targeting can be ‘selective’ or
2
can define which groups receive a ‘universal’ benefit. Redistribution/redistributive impact - the difference made in the distribution of household incomes by government intervention through taxes and transfers. Redistribution can be horizontal or vertical. Horizontal redistribution implies redistributing income across each individual’s lifetime in order to smooth consumption (e.g. between working age and retirement). In contrast, the aim of vertical redistribution is to reduce inequalities by shifting resources from higher income to low-income groups. However, vertical redistribution does not necessarily benefit poor households if a large share of redistribution takes place between upper and middle income groups. Size of redistributive budget - the amount of resources redistributed by the government. This is usually measured in one of two ways: the share of public social spending in national GDP; or the share of social transfers and services in the average household’s disposable income. Progressivity - the extent to which a tax and benefit system redistributes from upper to lower income groups. Unlike the size of the redistributive budget, this takes account of which groups are its net beneficiaries. It can be measured in two ways: - Through the net transfers to and from government of each income group in
turn. The system is progressive to the extent that these are higher, relative to income, for low income groups;
- Overall by a concentration coefficient. This measures the overall extent to which transfers are redistributive across groups. Like the Gini coefficient, which sums up the income distribution in a single figure (with low value signifying greater equality), the concentration coefficient sums up the distribution of transfers (with low value signifying that a greater proportion of these transfers goes to people with lower pre-distribution income).
One of the primary defects of means-testing is the stigma it entails (Titmuss, 1968;
Sen, 1995; Rothstein, 2001; Stuber and Schlesinger, 2006). In order to qualify for
means-tested benefits, applicants have to demonstrate that their own or their family’s
income or capital is below a threshold level. In western societies, where self-
sufficiency and individual responsibility are highly valued personal qualities, coming
forward for public assistance suggests conceding individual failure, which negatively
affects a person’s social standing (van Oorschot, 2002). This stigma, together with
complex and invasive procedures that means-testing often entails, discourages
many potential beneficiaries from applying (Sen, 1995; Mkadawire, 2005). This
helps explain the generally low level of take-up of means-tested benefits. For
example, according to official estimates, discussed below, in 2009/10 only 64 per
cent of eligible individuals received Working Tax Credit, and only 62 to 69 per cent
3
claimed Council Tax Benefit (Figures 3.b and 3.c). In practice means-testing can
never be perfect, so inclusion/exclusion errors are inevitable (Sen, 1995;
Mkandawire, 2005). In other words, some ‘truly needy’ are bound to be excluded
from the schemes, while part of the benefits will definitely leak out to those not in
need. Moreover, means-testing is a costly procedure, considerably exceeding the
administration costs of universal programmes and reducing the amount of resources
allocated for redistribution (van Oorschot, 2002).
Another critical issue concerns the effect of means-testing on recipients’ behaviour,
especially with regard to savings and employment. By providing extra support to
pensioners with few or no savings, those pension systems which operate mainly on
a means-tested basis should in theory prompt rational individuals on low working
incomes to spend all of their earnings rather than setting some aside for pension
savings. However, since assets and savings that people possess when reaching
retirement age generally reflect their lifetime earnings, and given uncertainties about
the level of pension supplements in a long-term perspective, means-tested pensions
should not have a significant effect on individual decisions concerning savings. More
tangible and of immediate concern is the negative effect on employment, usually
referred to as a ‘poverty trap’. Since eligibility to means-tested assistance depends
on low income, the support is usually gradually withdrawn as the targeting unit’s
income starts grow. This is usually referred to as the ‘taper rate’. At the same time,
the person has to start paying income tax and social insurance contributions.
Furthermore, increased income usually also implies a loss of eligibility to other
targeted benefits or services, such as council housing, education fee waivers and
free prescriptions. Hence in practice it is possible for recipients of means-tested
support to face effective marginal tax rates approaching 100 per cent (Deacon and
Bradshaw, 1983; van Oorschot, 2002), and even to make them worse off as a result
of working, or of working more hours, once the loss of free or discounted services
and additional costs associated with working are taken into account. For example,
Hirsch (2013) showed how childcare costs can potentially discourage additional
hours except at an above-average wage. Moreover, as van Oorschot (2002) notes,
this type of poverty trap is not confined to unemployed recipients of means-tested
assistance, but affects low earners in general.
4
In assessing the combined limitations of means-tested benefits, many authors are
highly critical of their desirability. For example, van Oorschot (2002) argues that
means-testing by default conflicts with the core objectives of a welfare state: social
integration, justice and overcoming dependency. While universal and contributory
benefits avoid many of the problems inherent in means-tested schemes, especially
those related to stigma and low take-up, they are not without problems either. The
main drawback is of course the associated high costs, which account for most of the
massively expanded social spending in advanced welfare states, which in turn may
have negative effects on their global competitiveness. Moreover, from a purely
poverty reduction point of view, universalism is potentially the least efficient strategy
for reaching poor households (Barry, 1990). In order to reach poor households who
constitute a relatively small share of the population in many OECD countries, the
government would need to spend considerably more on non-poor ones if it opted for
a universal arrangement.
Another alleged defect of universal transfers is that they may provide more support
to the better-off than to low income households. This is most pronounced in case of
earnings-related transfers (classified as universal here because they are not tested
against current family income, but rather based on historic contributions - see Box 1).
While many of the contribution-based transfers are to an extent redistributive
because of ceilings placed on the benefits of the highest earners, nevertheless the
whole essence of these transfers is horizontal redistribution, i.e. redistribution across
the lifecycle, not between richer and poorer groups (Esping-Andersen and Myles,
n.d.). Hence these schemes in general are not conducive for those with low
earnings and unstable employment records. In the U.K., the relatively small
earnings-related element of for example the state pension compared to many other
social security systems makes this less of an issue than elsewhere. However, even
a flat-rate pension funded by earnings-related contributions can have limited
redistributive potential because of the difference in average life expectancy of
different income groups: poor households will not only get a smaller transfer if the
pension is based on previous earnings and/or contributions, but they will also receive
them for a considerably shorter period of time than the better-off. The increasing
gap in life expectancy will most likely further aggravate this problem. Overall,
5
universal transfers and services account for a lion’s share of social spending, whose
overall level is widely criticised, but this is often missed by the general public.
As with transfers, universal services are often alleged to disproportionately benefit
middle and upper income groups. While there is a general consensus that many
services, especially healthcare and education, need to be provided universally
because of moral and pragmatic considerations, some analysts have critically
scrutinized to what extent these services benefit poor households vis-a-vis the better
off. In a pioneering study exploring the use of universal services by different income
groups, Le Grand (1982, p.128) came to a striking conclusion:
‘most public expenditure on the social services in Britain (and elsewhere) is ... distributed in a manner that broadly favours the higher social groups, whether ‘higher’ is defined in terms of income or occupation’.
However, in a more recent study of the changes in the distribution of ‘social wages’,
Tom Sefton (2002) found that social services in the U.K. are in general markedly pro-
poor, though some services, especially higher education, indeed benefit the upper
income groups more.
The above difficulties with both universal and selective benefits partly reflect the
difficulties in designing policies to achieve intended consequences. However, the
tensions are also related to the fundamental issue of what types of state actions
attract political support. It has been argued that because means-tested benefits in
essence are only for low-income families, there is no sound rationale for the middle
and upper classes to support such programmes, especially given that they fund
these benefits through taxes (Korpi and Palme, 1998). Hence sharp means-testing
undermines a potential coalition between the middle and working class. Together
with low costs, this makes selective benefits particularly attractive for the political
right, who are often the champions of means-testing. It also makes these benefits
easier to cut or abolish (Nelson, 2007) and more difficult to expand (van Oorschot,
2002). Lack of a broad base of support also has implications for the level and quality
of benefits; as Sen (1995, p.14) has famously stated, ‘benefits meant exclusively for
the poor often end up being poor benefits’. On the other hand, voters do not always
act solely as self-interested individuals; rather they are guided by a combination of
6
self-interest and moral sentiments which can lead to different electoral outcomes
depending on the context (Rothstein, 2001). It may also turn out difficult to convince
the electorate that to benefit poor households the state should give more to the
better-off (Green-Pedersen, 2003), especially during times of austerity. Moreover,
as Paul Pierson (1994) has argued, the large size of universal programmes makes
them a natural target for dramatic cuts by governments with radical agendas for
downsizing the welfare state. These may partially explain why a means-tested
approach has become more popular even among the left-wing parties who have
traditionally supported universal measures.
In sum, both types of welfare programmes have considerable technical and political
limitations. Our main research interest in this case though is to establish which type
is more effective in terms of reducing poverty. For this purpose next we turn to
examining the empirical evidence from comparative studies.
7
2 ARE UNIVERSAL BENEFITS MORE EFFECTIVE IN REDUCING POVERTY THAN MEANS-TESTED ONES?
While there have been a number of influential studies exploring the effects of
universal and means-tested benefits on redistribution and poverty in various OECD
countries (see for example, Le Grand, 1982; Goodin and Le Grand, 1987), the first
large-scale comparative study covering a large number of advanced welfare regimes
was carried out by Walter Korpi and Joakim Palme in 1998. By producing
counterintuitive, but coherent and convincingly interpreted findings, this seminal
study revitalised the debate and served as a useful reference point for further
comparative research. The underlying notion of Korpi and Palme’s theory is that
popular support for the welfare state is strongly influenced by the degree to which
various groups consider it to be benefitting them. That is because while welfare
states are shaped by the interests of various politically mobilised groups, once in
place, the institutional set-up of a welfare state becomes an important factor on its
own that ‘influences the long-term development of definitions of interests and
coalition formation among citizens’ (p.665). This in turn will have a significant effect
on the volume and extent of redistribution and consequently on poverty and
inequality.
To test this hypothesis the authors first classified 18 OECD countries into several
distinctive clusters based on institutional structures of old-age pensions and sickness
cash benefits. In practice these clusters closely resemble a continuum between
targeted and universal regimes. As expected, the more universal the welfare
regime, the higher the share of GDP allocated for social spending (excluding
education expenditure). However, since in a universal system much spending may
simply move resources around without redistributing much from richer to poor
groups, the authors then considered the relationship between high spending on
social programmes and the actual redistributive effect. Specifically, they measured
correlation between the relative size of the redistributive budget and income
redistribution achieved1 in 11 countries for which the Luxembourg Income Series
(LIS) data was available. They found a very strong positive correlation between the
1 Measured as the difference between Gini coefficients of market and disposable incomes divided by Gini coefficient of market income.
8
two, indicating that the higher the average share of transfers, the larger the
redistribution achieved: the countries with the largest redistribution budgets -
Sweden and the Netherlands - were also the most successful in reducing inequality.
Moreover, the study showed an inverse correlation between the level of targeting of
low-income groups and redistribution achieved: the countries which were making
extensive use of targeting (Australia, the U.S.A. and Switzerland) were much less
successful in overall redistribution than those where targeting was limited (again
Sweden and the Netherlands, but also Germany). This is explained by the fact that
higher reliance on targeting was also correlated with smaller redistributive budgets.
Another important finding was that while earnings-related old-age pensions are
indeed less redistributive than means-tested or universal flat-rate ones, the overall
inequality among the elderly was the lowest precisely in those countries which have
extensive earnings-related retirement schemes. This might be explained by the
greater role of private pension arrangements for those who can afford it in countries
where public pensions are not considered adequate.
In sum, the findings of the study point to ‘the paradox of redistribution’: in the
authors’ words, ‘the more we target benefits at the poor only and the more
concerned we are with creating equality via equal public transfers to all, the less
likely we are to reduce poverty and inequality’ (pp.681-682).
They argue that three closely interrelated factors are critical for understanding this
paradox. First, the amount of resources allocated for redistribution is not fixed: it
depends on the types of existing coalitions between various income groups, which in
turn is affected by the institutional set-up of the welfare regime. In other words, more
inclusive welfare states generate larger budgets. Second, small benefits cannot
provide adequate earning replacement, hence they discourage middle and upper
income groups from participating in these schemes; this also reduces their
willingness to finance these programmes through taxes. Third, where the better-off
opt for private welfare arrangements, the overall outcomes tend to be much more
unequal than under earnings-related public schemes.
Results of this pioneering study have also been supported by several other studies
with different research objectives, but also considering the link between the volume
9
of social spending and poverty in affluent nations. For example, Cantillon and
colleagues (2003) found a strong negative correlation between social expenditure
and the incidence of poverty among the working-age population in 12 OECD
countries. Similarly, exploring the anti-poverty effect of taxes and transfers in eight
affluent nations, Smeeding (2005) has found that higher social spending contributes
to lower poverty incidence. More recently, examining poverty trends in OECD
countries using the LIS data, Nolan and Marx (2009, pp. 329-330) have affirmed that
the ‘strong relationship at country level between the level of social spending and the
incidence of poverty... [is] arguably one of the most robust findings in comparative
poverty research’. More recently, Brady and Barrow (2012) have demonstrated that
universal social policies have a larger effect on single-mother poverty than the
targeted ones. We should note though that these authors have stressed important
caveats when presenting their findings. Cantillon and colleagues warn that simply
increasing social spending under the existing institutional set-up will not
automatically result in less poverty. Using the LIS data they projected how poverty
rates would change in nine European countries if social spending was increased up
to 22 per cent of GDP (the level of expenditure of the second highest spender in the
sample, Finland), but the existing arrangements were not altered. They found in
some countries, particularly Spain and Italy, this would even have small negative
effects. Smeeding too has pointed out that large spending is not the only effective
way of reducing poverty - it can also be achieved by more accurate targeting.
As discussed earlier, in addition to potentially being more redistributive than the
means-tested ones, universal programmes may also be more resilient to spending
cuts amidst austerity. A study by Kenneth Nelson (2007) provides some empirical
evidence in support of this thesis. In his study Nelson examined the changes in the
level of benefits of three forms of social insurance (old-age pensions, sickness
insurance and unemployment insurance) and the main means-tested programmes in
18 OECD countries between 1990 and 2002. He found that both types of
programme experienced considerable retrenchment: despite increases in real terms,
since the mid-1990s their indexation has lagged far behind the increase in wages.
However, the average erosion was slightly lower for social insurance transfers and
its downward trend was reversed in 2001, while means-tested programmes
continued to follow the sliding trajectory. In addition to comparing the aggregate
10
changes in the average values of benefits, Nelson also examined how the levels of
means-tested benefits have changed in relation to each of the three insurance
programmes in each of the countries on a yearly basis. Again, he found that for
most of the years in most countries, social insurance programmes were more
resilient to erosion than means-tested ones: in the majority of cases their levels
increased by more than for the targeted benefit. However, this difference was most
pronounced in the case of old-age pensions, and less substantial for sickness and
insurance benefits. Furthermore, in several countries (Austria, Denmark, Ireland,
and Switzerland) means-tested benefits have fared better than the social insurance
ones. Inspecting the correlation between the vulnerability of means-tested benefits
and the welfare regime type, Nelson found that means-tested benefits were more
likely to be retrenched in more universal welfare regimes than in more basic welfare
models.
We should note though that Nelson’s study has an important limitation as readily
acknowledged by the author himself. While the changes in the largest means-tested
programmes are indeed an important development, this alone is not sufficient for
capturing the general trend concerning all targeted benefits. While the value of the
main ‘safety-net’ means-tested benefit (the equivalent of Income Support in the UK)
may have eroded and eligibility criteria may have become stricter, other targeted
benefits, such as housing benefits, tax credits, etc. may have become more
generous and inclusive. Moreover, the analysis ignores the changes in the coverage
of the programmes. It may well be that while the level of benefits had diminished
compared to wages, the coverage of means-tested programmes has expanded,
especially where some universal programmes have become selective.
A number of studies using more recent data however have produced results that are
at odds with the underlying assumption of previous studies that more universal
approaches reduce poverty more than selective approaches. Particularly important
is a study conducted by Peter Whiteford (2008) which covered a larger sample of 28
OECD countries using data from the mid-2000s. This study looked both at the
amount of money that is redistributed and the extent to which it is reallocated from
richer to poorer groups: the size and progressivity of the redistributive budget as
11
explained in Box 1. Importantly, it found a negative relationship between the two: the
more that is spent on social programmes, the less progressively it is redistributed.
Overall, Whiteford found that cash transfer systems in all OECD countries are
progressive in the sense that they lead to a more equal distribution of income than
the one generated by the market. However, the extent of progressivity varied
considerably across the countries, as well as between different age groups and
types of programmes. The most progressive systems were identified in Australia,
New Zealand, Denmark and the U.K., while the least progressive were those of
Turkey, Portugal and Poland. With a few exceptions, cash benefits for working age
people were more progressive than those for the elderly. Within the social
programmes, the most progressive were housing and social assistance benefits,
followed by unemployment transfers and family benefits. Another important factor
determining the extent of achieved redistribution was taxes, though its effect was
about half of the cash transfer system. Progressivity of tax systems differed
considerably from that of cash transfer system, but the variation across countries
was less pronounced. The most progressive tax systems were identified in Ireland
and the U.S.A. and the least progressive in Switzerland and Iceland.
Moreover, looking at the overall progressivity of a system across the income range
(through the ‘concentration index’ - see Box 1) does not distinguish its effect on
poverty - to what extent the lowest income groups benefit from redistribution.
Whiteford therefore also measured specifically what share of transfers accrued to the
bottom quintile in each of the countries. Again the results showed large differences
across countries, with those more reliant on means-testing - Australia, Denmark,
New Zealand and U.K., distinguished as providing the largest support to poor
households. Scandinavian countries also transferred large amounts to the bottom
quintile, but this was partially offset by a considerable amount of taxes that poor
households paid.
In sum, the structure of spending appears to be no less important than the overall
size of the redistributive budget in its impact on poverty. Australia spent only two-
thirds of what Norway allocated for social spending, but it achieved the same effect
in supporting the bottom quintile through a more progressive tax and benefit system.
12
Other studies that have specifically sought to re-examine ‘the paradox of
redistribution’ theory by using the same sample and data source as previous studies,
with updated figures, also suggest that the correlation between universality and
larger redistribution may not hold true anymore. Kenworthy (2011) used the same
methodology for comparing Korpi and Palme’s original 11 OECD countries at five-
year intervals between 1980 and 2005. He found that while between 1980 and 1990
the positive association between universalism and redistribution was indeed strong,
it became much weaker in 1995, before disappearing completely from the year 2000.
He also re-examined Nelson’s thesis about universal programmes being more
resilient to cuts by measuring the changes in redistributive size of budgets in 11
OECD countries from the mid-1980s to the mid-2000s. Again, he found that ‘the
degree to which a country’s public transfers are universal does not appear to have
had an impact on shifts in its redistributive generosity’ (ibid, p.61). Overall, even in
those cases when the institutional set-up of the welfare regime was considerably
altered, no significant changes occurred either in terms of the overall size of
redistributive budget or its impact on income distribution. For example, the U.S.A.
becoming more universal (because of the growing share of earnings-related public
pensions in total social spending, but also due to providing more support to the lower
middle class, mainly through expanding the Earned Income Tax Credit programme)
did not result in it having a larger social spending or being more redistributive, while
the increased reliance on targeting in Denmark has not diminished its spending and
redistributive capacities. These findings prompted Kenworthy to hypothesize that an
important effect of universalism on redistribution is that it fosters the general
perception of the welfare state being an instrument for insuring against social risks,
such as old-age and disability, rather than a mechanism for redistribution in favour of
poor households. Long-established positive public perceptions enable committed
policy makers ‘to make extensive use of targeting in other programs, because those
programs will be seen by the middle class as subsidiary’ (ibid, p.62). But this does
not mean that introducing a new form of universal programme where there is no
such tradition is the best way to combat poverty.
Whiteford’s and Kenworthy’s main findings were confirmed by another
comprehensive study that also sought to replicate Korpi and Palme’s analysis by
13
using data from the mid-2000s. In their study Marx and colleagues (2013) used the
same methodology as in the previous studies described above, and included a large
sample of 25 OECD countries. Similar to Whiteford they found that all cash transfers
systems were pro-poor, but to a widely varying degree. The largest overall
redistributive impact, measured as the difference in Gini coefficients between market
and disposable incomes, was observed in Finland and Sweden, but the most pro-
poor benefit systems were identified in Australia, Denmark and the U.K. More
importantly, similar to Kenworthy, they found that there was no clear relationship
between targeting and redistributive impact.
Marx and colleagues took the analysis further by decomposing the concentration
coefficient for different categories of cash transfers. Unsurprisingly, they found that
social assistance transfers (safety-net benefits which are by definition targeted at the
groups with little or no market income) are much more redistributive than any other
benefit. More importantly, they account for a significant portion of systems’ overall
progressivity. Indeed, when these safety-net benefits are excluded, there is no clear
correlation between the extent of targeting and a system’s redistributive impact. This
study did find a positive correlation between universalism and generosity, as
predicted by Korpi and Palme, but much weaker than anticipated.
Marx and colleagues point out that the larger size of the sample definitely had an
effect on the key finding of their study - the disappearance of the correlation between
universalism and redistributive impact. The additional countries, especially the
southern European ones had rather large social spending, but much weaker
targeting than the countries included in the original analysis. This alone however is
not sufficient for explaining this considerable shift. The authors consider that part of
the answer lies in recent changes in many means-tested programmes. In response
to harsh criticisms about the perverse behavioural incentives of means-tested
schemes, policy makers have used a combination of sticks (e.g. limits on duration of
benefits) and carrots (e.g. lower tapering rate) to encourage beneficiaries to work.
More importantly, many programmes have been expanded to encompass not just
unemployed, but also employed, people on low incomes. Together these factors
have resulted in more positive attitudes towards some means-tested programmes
14
and arguably more funding. Moreover, expansion of the programmes has most likely
protected many low-income employed households from sliding into poverty.
Another important issue that needs to be taken into account when exploring the link
between social spending and poverty is that gross social spending is not a very
accurate measure of government’s social efforts. Some countries rely more heavily
on mandating private welfare arrangements than others, but this is not reflected in
social expenditure figures (Kwon, 1997). Also, in some countries social transfers are
taxed, hence the net amount received by beneficiaries may be considerably lower
than implied by the gross figure. Moreover, despite considerable similarities in the
level of economic development, there are important differences in demographic and
macroeconomic characteristics within the OECD, and even within western European,
countries. These also have important implications as larger spending may simply
reflect a higher unemployment or a larger proportion of elderly. A recent study by
Caminada and colleagues (2010) tries to address these problems by using net social
spending and controlling for the effects of unemployment, ratio of elderly, and GDP
per capita, when assessing the correlation between welfare spending and poverty.
Using this more refined methodology and LIS, OECD and SOCX data, the authors
assert that: ‘the familiar claim that higher social expenditure goes along with lower
poverty levels does not hold across the 28 examined countries’ (ibid, p.27).
15
3 HOW DOES THE U.K. COMPARE WITH OTHER WELFARE STATES?
In the light of these findings it is interesting to explore how the U.K. compares with
the other advanced welfare states in three important aspects: the size of
redistributive budget, the level of targeting and the achieved reduction in poverty.
On the first dimension the U.K. scores below the average. According to Whiteford
(2008), cash benefits accounted for 14.5 per cent of an average British household’s
disposable income, while the OECD average was 21.9 per cent. Also, in Marx and
colleagues’ analysis, Britain scored one of the lowest in social transfers as a
percentage of gross income.
While total spending on transfers is thus relatively low, Britain is quite successful in
targeting it on poor households. Whiteford identified the British system as one of the
most progressive in both transfer provision and taxation. Because of this the U.K.
achieved the same level of redistribution as Germany, where social transfers
constitute almost twice as high a share of households’ disposable income (28.2 per
cent). In his analysis the UK was also among the leaders in targeting resources at
poor households as 31 per cent of all transfers went to the bottom quintile. Similarly,
Maitre and colleagues (2005) pointed out that 97.6 per cent of pre-transfer British
poor households received some form of cash transfers. Marx and colleagues also
identified the UK as one of the top performers in redistributing towards poor
households and pointed out that British social assistance transfers accounted for
more than half of this effect.
Another way of assessing the progressivity of the British tax and benefit system is to
examine the national data. The Office for National Statistics (ONS) provides relevant
data disaggregated at the level of income quintiles for each major cash transfer,
social service and tax. In 2012 21.3 per cent of British people were estimated to be
poor (after housing costs) against the conventional 60 per cent of the equivalised
median income (IFS, 2012). Hence the bottom quintile almost fully corresponds to
the share of poor households in the country, after redistribution.
16
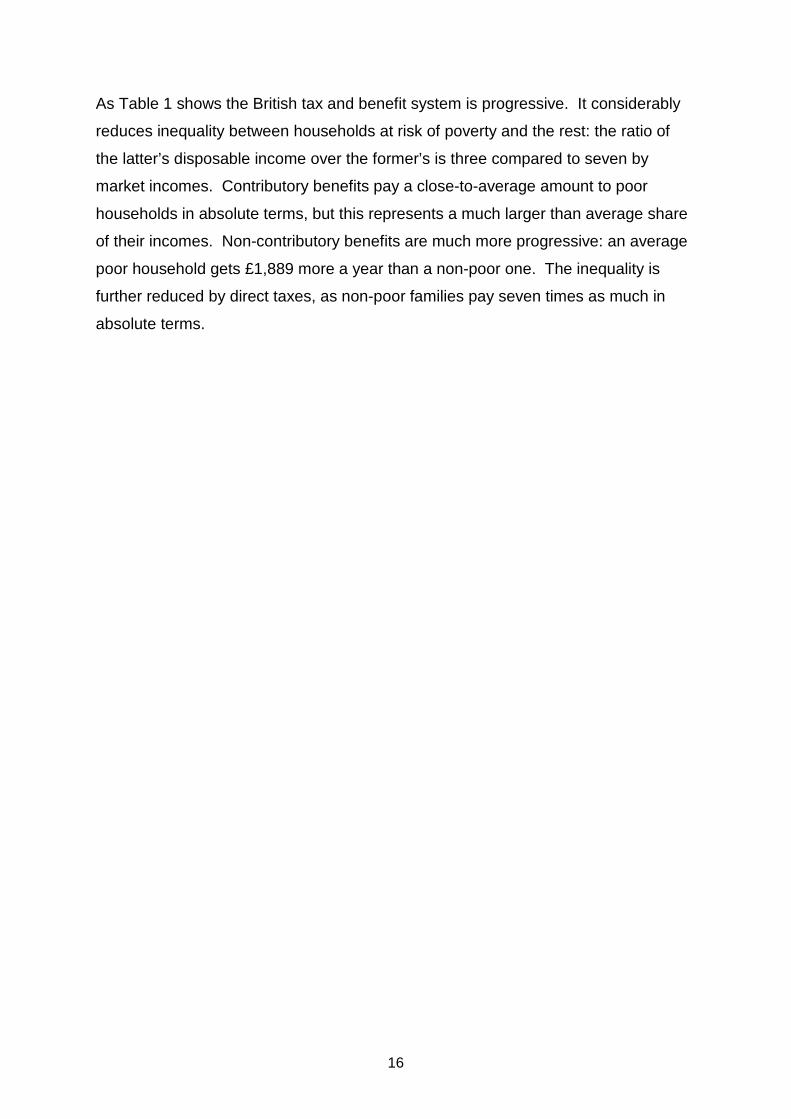
As Table 1 shows the British tax and benefit system is progressive. It considerably
reduces inequality between households at risk of poverty and the rest: the ratio of
the latter’s disposable income over the former’s is three compared to seven by
market incomes. Contributory benefits pay a close-to-average amount to poor
households in absolute terms, but this represents a much larger than average share
of their incomes. Non-contributory benefits are much more progressive: an average
poor household gets £1,889 more a year than a non-poor one. The inequality is
further reduced by direct taxes, as non-poor families pay seven times as much in
absolute terms.
17
Table 1 The average value of cash transfers received by different income groups, 2011/2012, £
Bottom quintile Other quintiles (average) Average Absolute % of
disposable income
Absolute % of disposable
income
Absolute % of gross disposable
income Market income 5436 42.2% 37987 87.1% 31477 84.0% Contributory transfers 2884 22.4% 3000 6.9% 2976 7.9% Non-contributory transfers 4535 35.2% 2620 6.0% 3003 8.0% Gross income 12885 100.0% 43607 100.0% 37456 100.0% Taxes 1306 10.1% 8959 20.5% 7428 19.8% Disposable income 11549 89.6% 34648 79.5% 30028 80.2%
Source: ONS (2013)
18
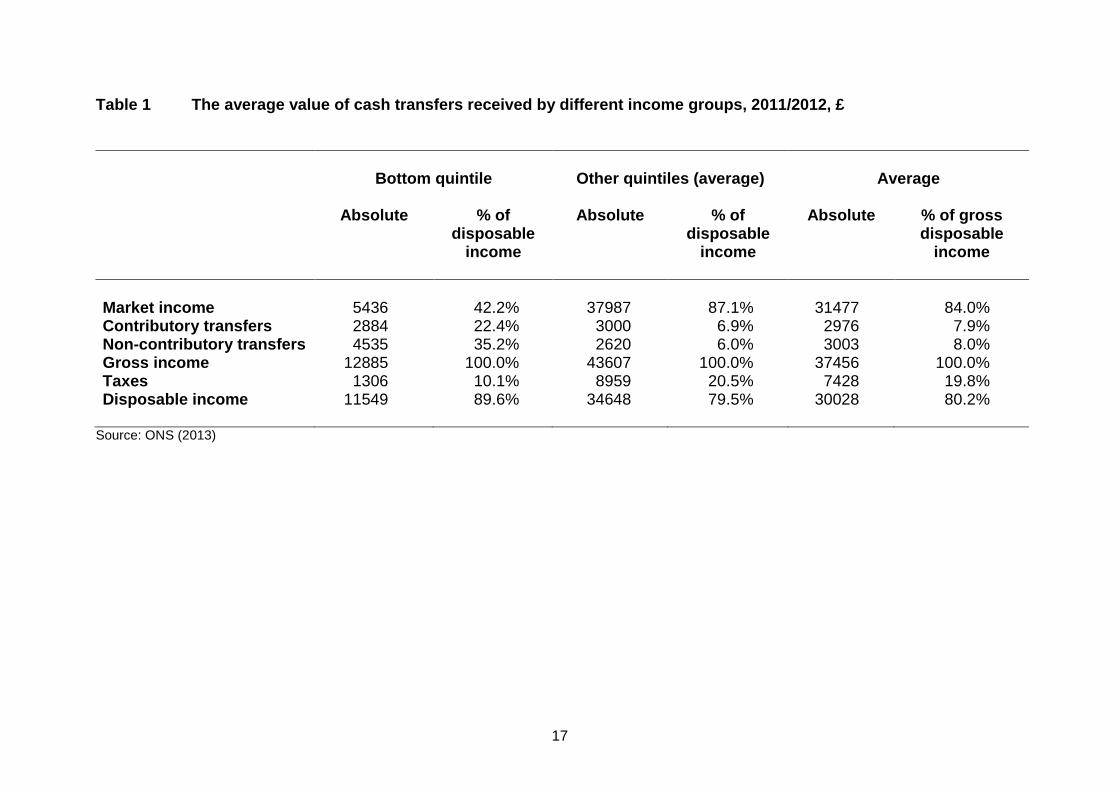
The ONS data also allow us to compare the average value of different transfers and
to what extent they are weighted toward poor households (Figure 1). All four means-
tested programmes - Income Support/Pension Credit, Housing benefit, income-
based Job Seeker’s Allowance and tax credits - are clearly pro-poor. Particularly
important are housing benefits and tax credits, each accounting for over ten per cent
of poor households’ disposable incomes. The three main transfers in Figure 1 that
are not income-tested show different patterns. Child Benefit and the state pension
pay similar average amounts, in absolute terms, to poor and non-poor households.
But Incapacity Benefit paid on average nearly twice as much to the former than to
the latter, reflecting the fact that it goes to individuals who are not working - although
some may have high household income from other sources.
Figure 1 The average values of selected cash transfers, 2011/2012, £
2 Source: ONS (2013)
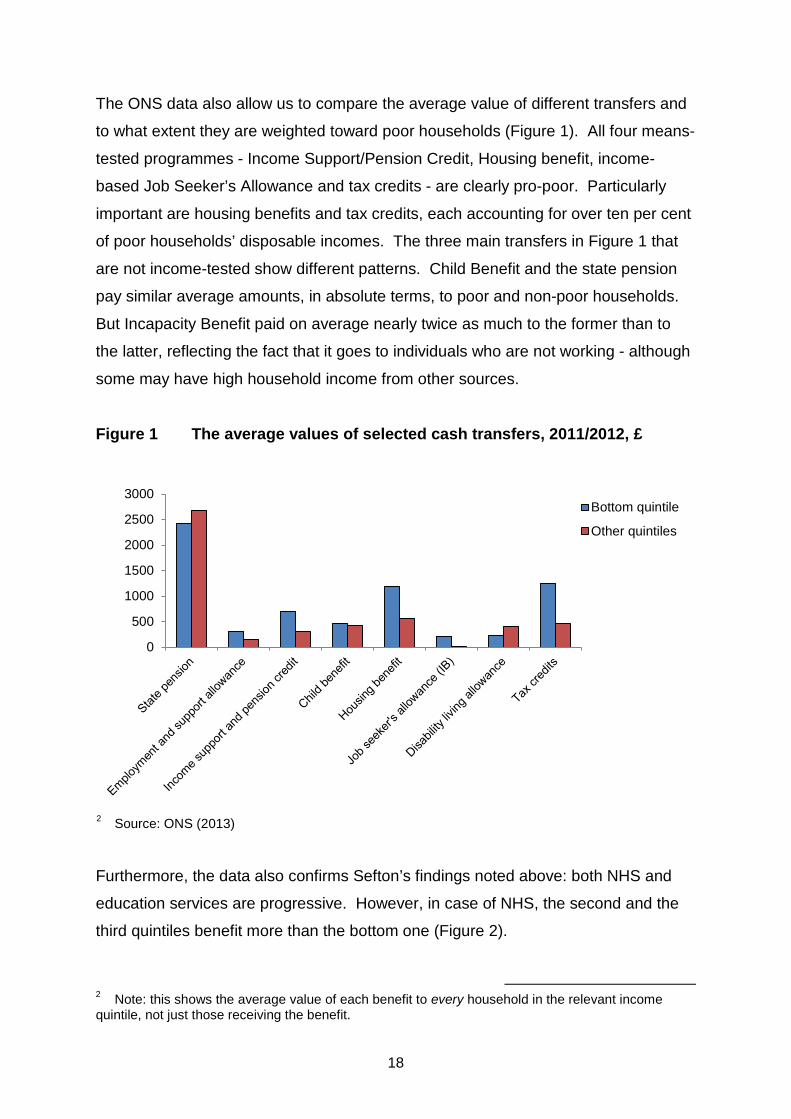
Furthermore, the data also confirms Sefton’s findings noted above: both NHS and
education services are progressive. However, in case of NHS, the second and the
third quintiles benefit more than the bottom one (Figure 2).
2 Note: this shows the average value of each benefit to every household in the relevant income quintile, not just those receiving the benefit.
0
500
1000
1500
2000
2500
3000Bottom quintile
Other quintiles
19
Figure 2 The average values of health and education services, 2011/2012, £
Source: ONS (2013)
Finally, the most important issue is to what extent cash transfers reduce poverty in
the UK. This is determined by the size of redistributive budget/social spending and
targeting, but a third factor is also important - the pre-tax-transfer poverty rate and
gap. Britain’s poverty rate before government intervention is very close to the OECD
average (OECD, 2013). According to Smeeding’s (2005) analysis, the British
welfare system reduced relative poverty (measured against 50 per cent of median
income) from 31.8 to 12.3 per cent (p. 974). This was much higher than the average
of the eight OECD countries included in the sample. Maitre and colleagues (2005)
showed that social transfers lifted 43 per cent of poor households from poverty. This
was higher than in southern European countries and Germany, but considerably
lower than in Scandinavian and several continental European countries. According
to the latest OECD (2013) data, in 2010 taxes and transfers halved the relative
poverty rate (measured against 60 per cent of median income) from 35.4 to 17.2 per
cent.
0500
100015002000250030003500400045005000
Bottomquintile
2ndquintile
3rdquintile
4thquintile
Topquintile
Average
Education
National health service
20
4 SUMMARY OF MAIN FINDINGS
This brief review of relevant literature and data allows us to draw several broad
conclusions:
1 Despite the considerable volume of up-to-date research, the universal vs.
means-tested debate is far from resolved. However, more recent studies appear to
suggest that the previously established positive correlation between the universal
systems, larger spending and higher redistribution may not hold true anymore. At
present it is not very clear why this should be so, but three factors may help to
partially explain it. Firstly, the original thesis developed by Korpi and Palme was
certainly influenced by the small number of cases included in the analysis.
Secondly, the earlier analysis ignored the tax systems, which, when taken into
account, considerably alter the redistributional profiles of different welfare states.
Thirdly, as Marx and colleagues speculate, stricter conditionalities and expanding the
coverage to incorporate low-earners has improved the reputation and more
importantly the funding of means-tested programmes. Nevertheless, whatever the
reasons are, this has a major implication for the strategies of pro-poor interest
groups: simply lobbying for more universal measures may not yield the anticipated
progress in reducing poverty.
2 Considerable differences persist in the level of redistribution and poverty
reduction achieved by different advanced economies. To some extent these
differences can be explained by welfare regime types. For example, Nordic
countries are clearly more effective than other countries with a similar level of social
spending. Nevertheless, in almost every study two countries stand out as particularly
successful in redistribution - Australia and Denmark - which are complete opposites
according to major taxonomies of welfare regimes. For example, in Esping-
Andersen’s seminal study (1990) Denmark is placed in the most advanced ‘social-
democratic’ group, while Australia belongs to the least generous ‘liberal’ welfare
cluster. Similarly, Frank Castles and Deborah Mitchell (1993) identify the Danish
system with the ‘non-right hegemony’ regimes, shaped by strong labour movements
and left-wing parties, while Australia is assessed as a ‘radical’ type, distinguished by
the inability of left-wing parties to dominate government. Despite the general
21
differences, what makes these countries similarly effective in redistribution is an
extensive use of means-testing. There is other evidence too that the level of
targeting is no less important than the size of redistributive budget. For example, the
U.K. achieves almost the same level of redistribution and is more effective in
reducing poverty than Germany which has a considerably larger spending.
3 There is also evidence that simply increasing social spending within existing
systems may not necessarily result in large poverty reduction. That is because the
redistributional profiles of different cash transfers matter. Despite all their limitations,
selective transfers, especially the social assistance ones (which by definition are
means-tested), are the most redistributive and account for a large proportion of the
overall progressivity of the systems. Also, as Marx and colleagues point out, the
better targeted the social assistance transfers are, the more redistribution is
achieved. In contrast, targeting of other transfers does not necessarily lead to more
redistribution. Looking at cash transfers from a functional prism, targeting of family
benefits in general leads to more redistribution, but the same is not true for old-age
pensions or other active age transfers, such as sickness or unemployment transfers.
Whiteford also points out that means-tested benefits, such as housing benefits and
social assistance transfers, are clearly more progressive than other benefits.
4 Compared to other countries, the UK is a medium performer in reducing
poverty. Its relative size of redistributive budget is smaller than the OECD average,
but this is compensated by better-than-average targeting of poor households. In
addition, the direct taxes in Britain are more progressive than in most other
countries. Overall, the cash transfer system reaches almost all of poor households,
but it manages to lift only four out of ten above the poverty line.
Looking specifically at distributional effects of the main cash benefits, most transfers
are progressive in the sense that the average amount received by the bottom quintile
(which roughly corresponds to the share of poor in population) is higher than the
average received by the rest. However, the most progressive programmes are
housing benefits and tax credits, with each accounting for almost ten per cent of the
bottom quintile’s disposable income. We should also note that no matter which
threshold is used, the overall level of poverty in the UK remains large.
22
5 REFERENCES Barry, B. (1990). The welfare state versus the relief of poverty. In: Needs and Welfare. Sage Modern Politics Series. Sage Publications, pp. 73-103. Brady, D. and Burroway, R. (2012) Targeting, universalism, and single-mother poverty: a multi-level analysis across 18 affluent democracies. Demography (49), 710-746. Caminada, C., Goudswaard, K. and Koster, F. (2010). Social income transfers and poverty alleviation in OECD countries. Leiden University. Cantillon, B., Marx, I. and Van Den Bosch, K. (2003). The Puzzle of Egalitarianism: About the Relationships between Employment, Wage Inequality, Social Expenditures and Poverty [Online]. Available from: http://www.sfi.dk/graphics/ESPAnet/papers/Cantillonmarx.pdf [Accessed 06/09/2013]. Castles, F. G. and Mitchell, D. (1993). Worlds of Welfare and Families of Nations. In: Castles, F. G. ed. Families of Nations: Patterns of Public Policy in Western Democracies. Aldershot: Dartmouth. Deacon, A. and Bradshaw, J. (1983). Reserved for the poor: the means test in British social policy. Oxford: B. Blackwell and M. Robertson. Esping-Andersen, G. (1990). The three worlds of welfare capitalism. Cambridge: Polity. Esping-Andersen, G. and Myles, J. (n.d.). The Welfare State and Redistribution [Online]. Available from: http://dcpis.upf.edu/~gosta-esping-andersen/articles.htm [Accessed 03/09/2013]. Goodin, R. E. and Le Grand, J. eds. (1987). Not Only the Poor: The Middle Classes and the Welfare State. London: Allen & Unwin. Green-Pedersen, C. (2003). Still there but for how Long? the Counter-Intuitiveness of the Universal Welfare Model and the Development of the Universal Welfare State in Denmark. [Online]. Available from: http://www.epa.aau.dk/fileadmin/user_upload/ime/CCWS/workingpapers/2003-31-Still-there-but-for-how-long-cgp.pdf [Accessed 05/09/2013]. Hirsch, D (2013). The cost of a child in 2013. London: Child Poverty Action Group. Institute of Fiscal Studies (2012). Living standards, poverty and inequality in the UK: 2012. London: IFS. Kenworthy, L. (2011). Progress for the Poor. Oxford: Oxford University Press.
23
Korpi, W. and Palme, J. (1998). The paradox of redistribution and strategies of equality: welfare state institutions, inequality, and poverty in the Western countries. American Sociological Review, 63(5), 661-687. Kwon, H. (1997). Beyond European welfare regimes: comparative perspectives on east Asian welfare systems. Journal of Social Policy, 26(4), 467-484. Le Grand, J. (1982). The strategy of equality: redistribution and the social services. London: G. Allen & Unwin. Maître, B., Nolan, B. and Whelan, C. T. (2005). Research note: welfare regimes and household income packaging in the European Union. Journal of European Social Policy, 15(2), 157-171. Marx, I., Salanauskaite, L. and Verbist, G. (2013). The paradox of redistribution revisited: and that it may rest in peace?. Bonn: IZA. Marx, I. and Nelson, K. (2013), Minimum income protection in flux Hampshire: Palgrave Macmillan. Mkandawire, T. (2005). Targeting and universalism in poverty reduction. UNRISD Social Policy and Development Programme Paper #23. Nelson, K. (2007) Universalism versus targeting: the vulnerability of social insurance and means-tested minimum income protection in 18 countries, 1990-2002. International Social Security Review, 60(1), 33-58. Nolan, B. and Marx, I. (2009). Inequality, poverty and social exclusion. In: Salverda, W., Nolan, B. and Smeeding, T. eds. Oxford Handbook of Economic Inequality. Oxford: Oxford University Press. OECD (2013). Government Social Spending [Online]. Available from: http://www.oecd-ilibrary.org/social-issues-migration-health/government-social-spending_20743904-table1 [Accessed 15/05/2013]. ONS (2013). The Effects of Taxes and Benefits on Household Income 2011/12 [Online]. Available from: http://www.ons.gov.uk/ons/rel/household-income/the-effects-of-taxes-and-benefits-on-household-income/2011-2012/etb-stats-bulletin-2011-12.html [Accessed 20/09/2013]. Pierson, P. (1994). Dismantling the Welfare State? Reagan, Thatcher, and the Politics of Retrenchment. Cambridge: Cambridge University Press. Rothstein, B. (2001). The universal welfare state as a social dilemma. Rationality and Society, 13(2), 213-234. Sefton, T. (2002). Recent Changes in the Distribution of the Social Wage [Online]. Available from: http://eprints.lse.ac.uk/6377/1/Recent_Changes_in_the_Distribution_of_the_Social_Wage.pdf [Accessed 03/09/2013].
24
Sen, A. (1995). The political economy of targeting. In: Van de Walle, D. and Nead, K. eds. Public Spending and the Poor: theory and Evidence. Baltimore: Johns Hopkins University Press. Smeeding, T. M. (2005). Public policy, economic inequality, and poverty: the United States in comparative perspective. Social Science Quarterly, 86(Supp), 955-983. Stuber, J. and Schlesinger, M. (2006). Sources of stigma for means-tested government programs. Social Science and Medicine, 63(4), 933-945. Titmuss, R. M. (1968). Commitment to welfare. Allen & Unwin. van Oorschot, W. (2002). Targeting welfare: on the functions and dysfunctions of means-testing in social policy. In: Townsend, P., and Gordon, D., eds. World Whiteford, P. (2008). How much redistribution do governments achieve? The role of cash transfers and household taxes. In: OECD ed. Growing Unequal?. Paris: OECD.