Embed Size (px)
Citation preview
1/8
Measurement of Plasma Density Produced by Pulsed Voltage using 94-GHz Microwave
Interferometry*
2004년도한국물리학회가을학술논문발표회Oct. 22, 2004제주대학교
(제주도제주시)* Supported by KSTAR Project at KBSI.
정진현정진현, , 배영순배영순, , 조무현조무현, , 남궁남궁원원
PohangPohang University of Science and TechnologyUniversity of Science and Technology
2/8
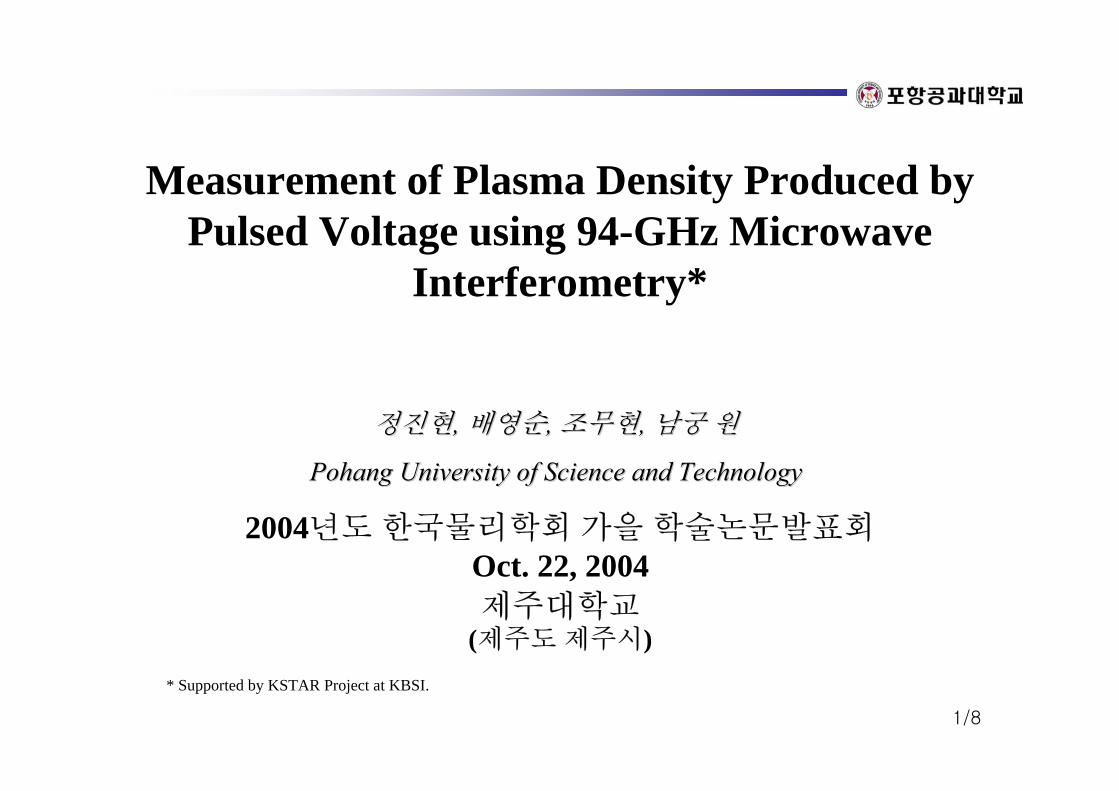
The microwave interferometer system is a well-
established technique for the measurements of
line-integrated plasma densities without
perturbing plasmas. A 94-GHz microwave
interferometer system was used to investigate the
transient behavior of the pulsed plasma produced
by a sudden step voltage in the order of -500 V
applied to an electrode. The microwave
interferometry data in Argon plasma density is in
the order of 1010 ~ 1011 cm-3 with the pressure in
the range of 100 mTorr. It is observed that the
time dependence of the plasma density depends
on the gas pressure and the flat-top voltage of the
pulse. It is also observed that the time constants of
plasma density build up and decay have different
characteristics.
• * Work supported by KSTAR Project at KBSI.
Abstract
The wavelength in the plasma is always longer than in vacuum
.
The phase difference between when there is a plasma and when not is then
.
Schematics of Microwave Interferometers
1 12 ( )po p
Lφ πλ λ
∆ = −
21/ 2
2(1 )pp o
ωλ λ
ω−= −
pL
Plasma
Source( )
gλ
pλ
gL 2 ( )g p
g p
L Lφ π
λ λ= −
oλSplitter
detector
3/8
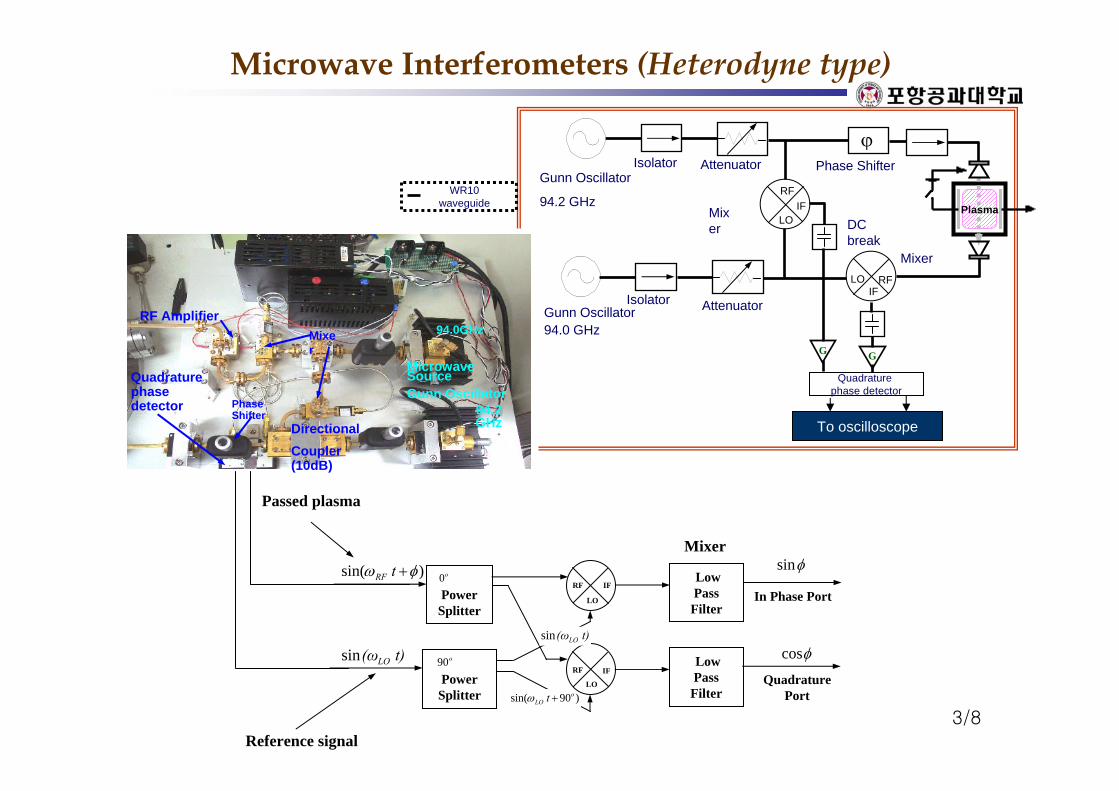
Microwave Interferometers (Heterodyne type)
WR10 waveguide
ϕ
Quadraturephase detector
To oscilloscope
Gunn Oscillator
94.2 GHz
Gunn Oscillator94.0 GHz
Attenuator
Attenuator
Mixer
Mixer
Phase Shifter
DC break
Isolator
Isolator
Plasma
RF
LOIF
RFLOIF
G GMicrowave SourceGunn Oscillator
94.2 GHz
94.0GHz
Phase Shifter
Quadraturephase detector
Mixer
DirectionalCoupler (10dB)
RF Amplifier
Mixer
Passed plasma
o0Power Splitter
o90Power Splitter
) sin( φω +tRF
t)(ωLOsin
)90 sin( oLO t +ω
RF
LO
IF
RF
LO
IF
Low Pass
Filter
Low Pass
Filter
In Phase Port
QuadraturePort
φsin
φcos t)(ωLOsin
Reference signal
4/8
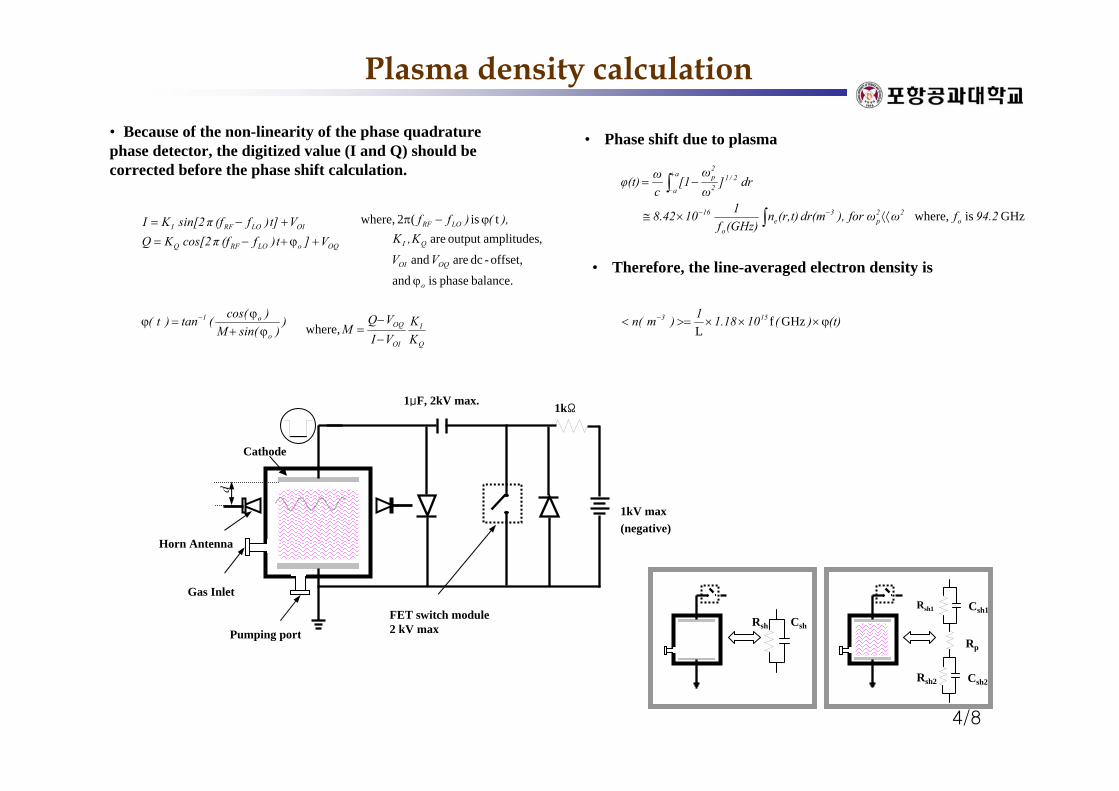
• Phase shift due to plasma
GHz is where, 2.94fωω for ),dr(m t)(r,n(GHz)f
1108.42
dr ]ωω
[1cωφ(t)
o22
p3
eo
16
2/1a
a 2
2p
⟨⟨×≅
−=
−−
+
−
∫
∫
OQoLORFQ
OILORFI
V]t)f(fπcos[2KQ Vt])f(fπsin[2KI
+ϕ+−=+−=
balance. phase is and
offset,-dc are and
,amplitudesoutput are t is (2 where,
VV
K,K ),()ff
o
OQOI
QI
LORF
ϕ
ϕ−π
))sin(M
)cos((tan)t( o
o1
ϕ+ϕ
=ϕ −
Q
I
OI
OQ
KK
VIVQ
M−
−=where,
Plasma density calculation
• Because of the non-linearity of the phase quadraturephase detector, the digitized value (I and Q) should be corrected before the phase shift calculation.
(t))(10.1811)mn( 153 ϕ×××>=< − GHzf L
• Therefore, the line-averaged electron density is
Cathode
d
Horn Antenna
FET switch module2 kV max
1kV max(negative)
Gas Inlet
Pumping port
1μF, 2kV max. 1kΩ
Rsh1 Csh1
Rsh2 Csh2
Rp
Rsh Csh
5/8
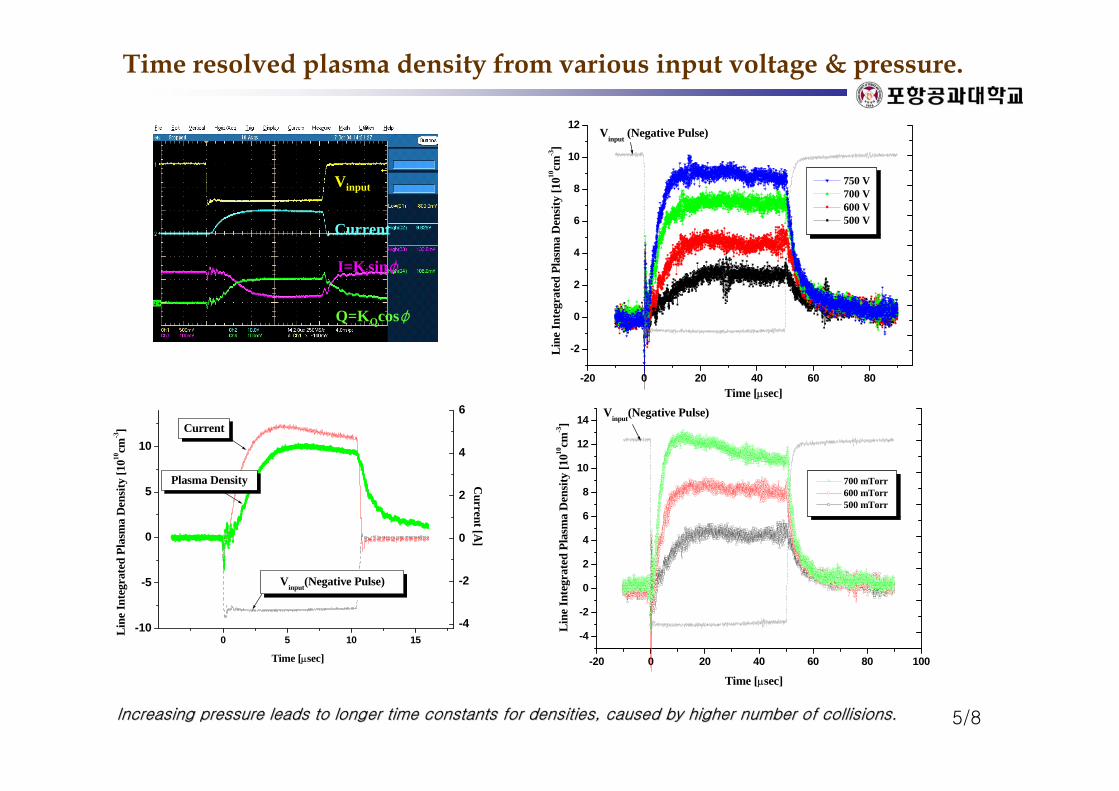
Vinput
Current
Q=KQcosφ
I=Kisinφ
0 5 10 15-10
-5
0
5
10
Plasma Density
Vinput(Negative Pulse)
Line
Inte
grat
ed P
lasm
a D
ensit
y [1
010cm
-3]
Current [A
]Time [µsec]
Current
-4
-2
0
2
4
6
-20 0 20 40 60 80
-2
0
2
4
6
8
10
12
Time [µsec]
Line
Inte
grat
ed P
lasm
a D
ensi
ty [1
010cm
-3]
750 V 700 V 600 V 500 V
Vinput (Negative Pulse)
-20 0 20 40 60 80 100
-4
-2
0
2
4
6
8
10
12
14
Time [µsec]
Line
Inte
grat
ed P
lasm
a D
ensit
y [1
010cm
-3]
700 mTorr 600 mTorr 500 mTorr
Vinput(Negative Pulse)
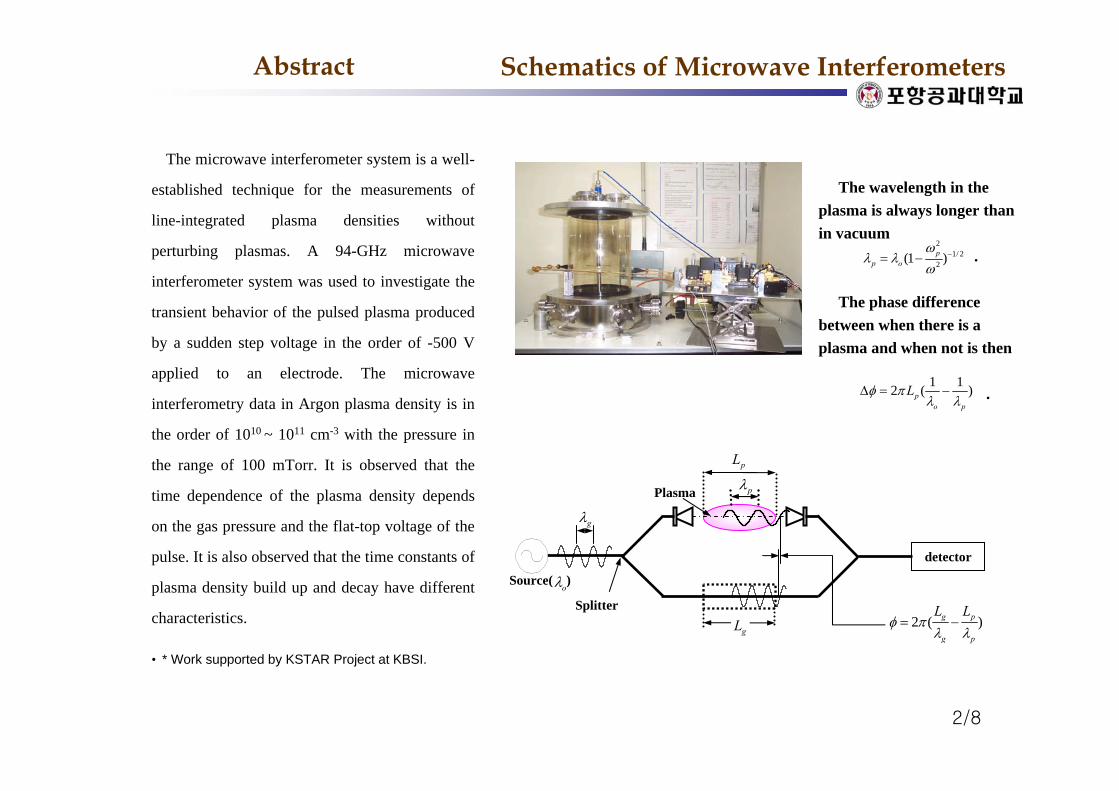
Time resolved plasma density from various input voltage & pressure.
Increasing pressure leads to longer time constants for densitiesIncreasing pressure leads to longer time constants for densities, caused by higher number of collisions., caused by higher number of collisions.
6/8
10 15 20 25 30 35-0.8
-0.7
-0.6
-0.5
-0.4
-0.3
-0.2
-0.1
0.0
0.1
Vin
put [k
V]
Time [µsec]
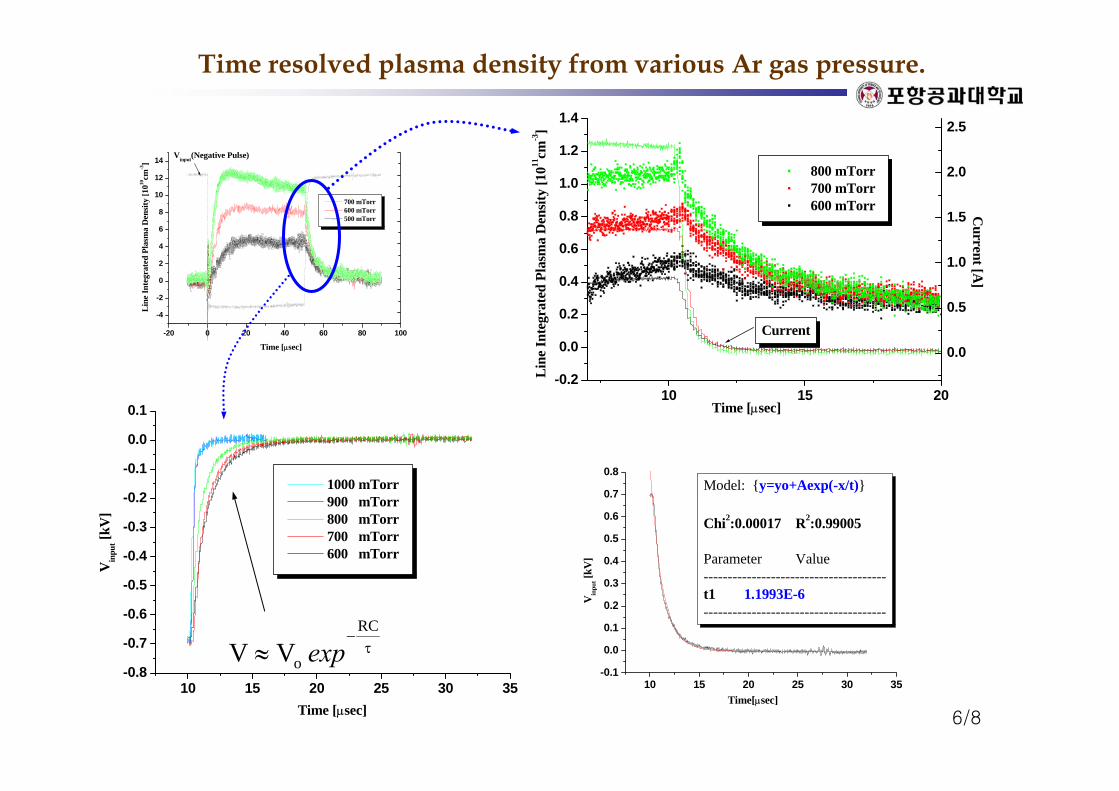
1000 mTorr 900 mTorr 800 mTorr 700 mTorr 600 mTorr
-20 0 20 40 60 80 100
-4
-2
0
2
4
6
8
10
12
14
Time [µsec]
Line
Inte
grat
ed P
lasm
a D
ensit
y [1
010cm
-3]
700 mTorr 600 mTorr 500 mTorr
Vinput(Negative Pulse)
10 15 20-0.2
0.0
0.2
0.4
0.6
0.8
1.0
1.2
1.4
Current
Line
Inte
grat
ed P
lasm
a D
ensit
y [1
011cm
-3]
Time [µsec]
800 mTorr 700 mTorr 600 mTorr
0.0
0.5
1.0
1.5
2.0
2.5C
urrent [A]
τ−
≈RC
oVV exp10 15 20 25 30 35
-0.1
0.0
0.1
0.2
0.3
0.4
0.5
0.6
0.7
0.8
Time[µsec]
Model: y=yo+Aexp(-x/t) Chi2:0.00017 R2:0.99005
Parameter Value--------------------------------------t1 1.1993E-6--------------------------------------
Vin
put [k
V]
Time resolved plasma density from various Ar gas pressure.
7/8
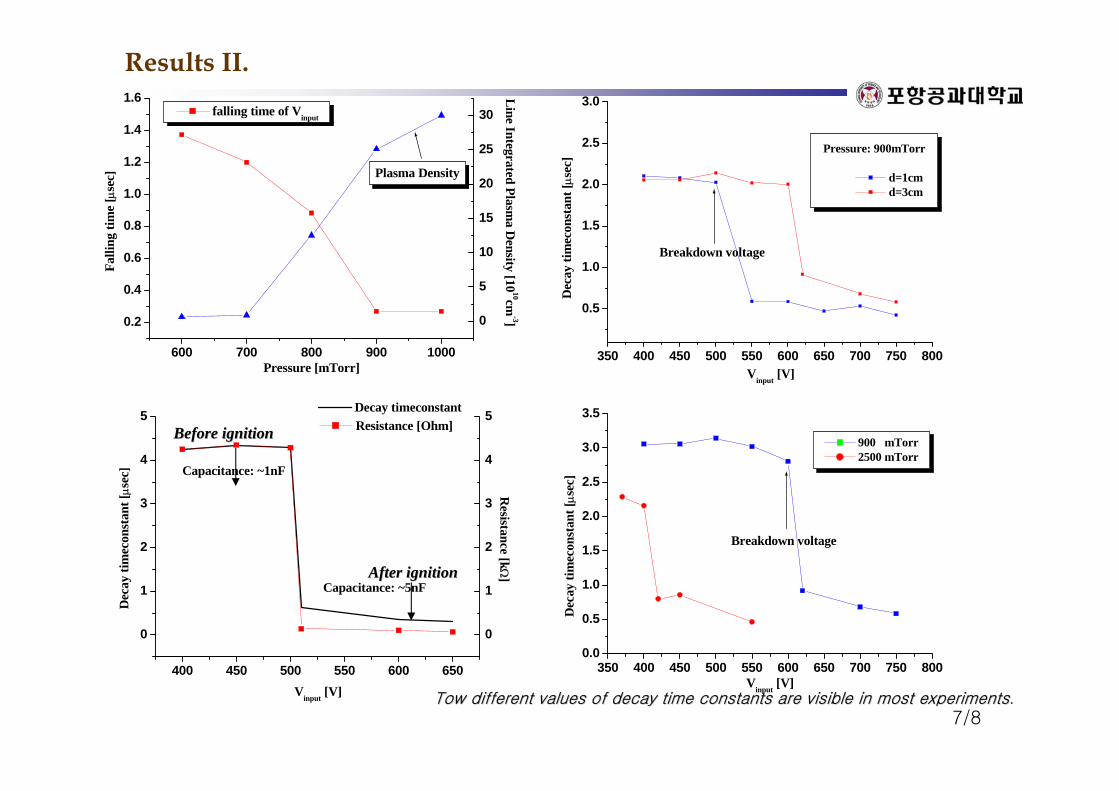
400 450 500 550 600 650
0
1
2
3
4
5
Capacitance: ~5nF
Capacitance: ~1nF
Vinput [V]
Dec
ay ti
mec
onst
ant [µs
ec]
Decay timeconstant
0
1
2
3
4
5
Resistance [kΩ
]
Resistance [Ohm]
600 700 800 900 1000
0.2
0.4
0.6
0.8
1.0
1.2
1.4
1.6
Pressure [mTorr]
Line Integrated Plasma D
ensity [1010cm
-3]
Falli
ng ti
me
[µse
c] Plasma Density
falling time of Vinput
0
5
10
15
20
25
30
Results II.
Before ignitionBefore ignition
After ignitionAfter ignition
350 400 450 500 550 600 650 700 750 800
0.5
1.0
1.5
2.0
2.5
3.0
Breakdown voltage
Vinput [V]
Dec
ay ti
mec
onst
ant [µs
ec]
Pressure: 900mTorr d=1cm d=3cm
350 400 450 500 550 600 650 700 750 8000.0
0.5
1.0
1.5
2.0
2.5
3.0
3.5
Breakdown voltage
Vinput [V]
Dec
ay ti
mec
onst
ant [µs
ec]
900 mTorr 2500 mTorr
Tow different values of decay time constants are visible in mostTow different values of decay time constants are visible in most experimentsexperiments.
8/8
We have studied the fundamental properties of the pulsed plasma generated from negative voltage.
• At the beginning of the pulse, the plasma density rises slower than the pulse rise time and reaches the peak value and after that, the density settles down at steady state.
• The time that plasma density reaches a maximum point is determined by pressure & input voltage.
• We measured the decay time constants in the after glow for Ar gas at various plasma conditions. As a results, increasing pressure leads to longer time constants for densities and shorter time constants for voltages caused by higher number of collisions and ionizations.
•Tow different values of decay time constants are visible in most experiments. It means that, after ignition, resistance of plasma increase while capacitance of plasma decrease exponentially.
Summary & Conclusions