Embed Size (px)
Citation preview
QT Interval MeasurementKautzner
Measurement of the QT Interval: Do We Know WhatWe Are Doing?
Josef KautznerDepartment of Cardiology, Institute for Clinical andExperimental Medicine, Prague, Czech Republic
Since the early days of electrocardiography, the QTinterval has been associated with duration of ventricu-lar electrical systole, i.e., with the time required forcompletion of both ventricular depolarization and repo-larization [1]. It was introduced in 1913 by Einthovenand de~ned as the interval measured from the begin-ning of the QRS complex to the end of the T wavewithout elaborating exact measurement points on thetracing [2]. Almost a century later, we are left with nomore precise de~nition, although much more informa-tion is available on the genesis of T and U waves, andabout dif~culties with QT interval measurements.Therefore, it is timely to address the most importantproblems that diminish clinical utility of the QT inter-val.
Determinants of QT(U) Interval
The practice of using the whole QT interval as amarker of repolarization abnormalities re_ects theview that repolarization starts in some regions of themyocardium before depolarization has been completedin other areas [3]. Whilst the early recovering cells arebelieved to start inscription of the T wave, the laterecovering cells should mark its offset. However, muchless is known about the origin of the “normal” and“abnormal” U wave. Some early observations alreadydiscussed its association with late repolarization [2,4].More recent studies have provided evidence for theexistence of several electrophysiologically distinctmyocyte types resulting in heterogeneity in the elec-trical behavior of the ventricular myocardium [5]. Itappears that the so-called M cells in the deeper layer ofthe myocardium (the midmyocardium of the free walland deep layers of endocardial structures) could con-tribute, together with Purkinje ~bers, to the genesis ofthe U waves even under normal conditions [6]. Thedevelopment of afterdepolarization in the M cells and/or in Purkinje ~bers is believed to further accentuatethe U waves and create unusual morphologic patternsof the T(U) waves noticed predominantly in long QTsyndromes. To make things even more complicated,individual speci~c mutants of cardiac ion channel genesthat encode abnormal channel proteins in congenitallong QT syndromes were suggested to produce distinctelectrocardiographic TU patterns [7]. Similarly, func-tional impairment of ionic channels was related to ad-
ditional T wave “humps” observed both in congenitaland acquired long QT syndromes [8]. Quite recently,the origin of such split T waves and “pathological”large U waves has been explained as a result of twoopposing voltage gradients (epicardium-the M regionand the M region-endocardium) [9]. These observa-tions imply that all abnormal shapes of the T-U wavesre_ect increased heterogeneity within myocardial walland/or throughout different regions of the heart andput into question our de~nition of the T and U wave aswell as the utility of techniques devised to separate Tfrom U waves (such as measurement of the end of theT wave at the nadir between the T and U waves ortechniques based on slope features of the descendingarm of the T wave). Needless to say that even muchless is known about the morphology of the T(U) wavesin structural heart diseases. As compared with pri-mary repolarization abnormalities, various structuralheart diseases may impair repolarization process indifferent ways, producing secondary changes due toimpaired intraventricular conduction or abnormalhemodynamics. Therefore, our incomplete under-standing of the normal and abnormal repolarizationprocess and its projection onto body surface is the ma-jor limitation of reliable measurement of the QT(U)interval and its diagnostic utility in different clinicalsituations.
Having no exact de~nition of the end of repolariza-tion, the measurements of the end of QT(U) intervalare performed using questionable arbitrary criteriaand individual judgement. The situation is easier whennormal recordings are analyzed. However, in the pres-ence of abnormal shapes of the T(U) waves this ap-proach necessarily leads to signi~cant interobservervariability in the classi~cation of the pattern of theT(U) waves [10] and consequently, to interobserverdifferences in QT interval measurements (and in QTdispersion). Not surprisingly, even larger variability inmeasurements of the QT interval can be expectedwhen using automatic measurement techniques in car-diac patients [11].
It is apparent from the above discussion that the
Address for correspondence to: Josef Kautzner, M.D., Ph.D., De-partment of Cardiology, Institute for Clinical and ExperimentalMedicine, Vídenská 1958/9, 140 21 Prague 4, Czech Republic.E-mail: [email protected]
302
Cardiac Electrophysiology Review 1999;3:302–305
© 2000 Kluwer Academic Publishers. Printed in the Netherlands.
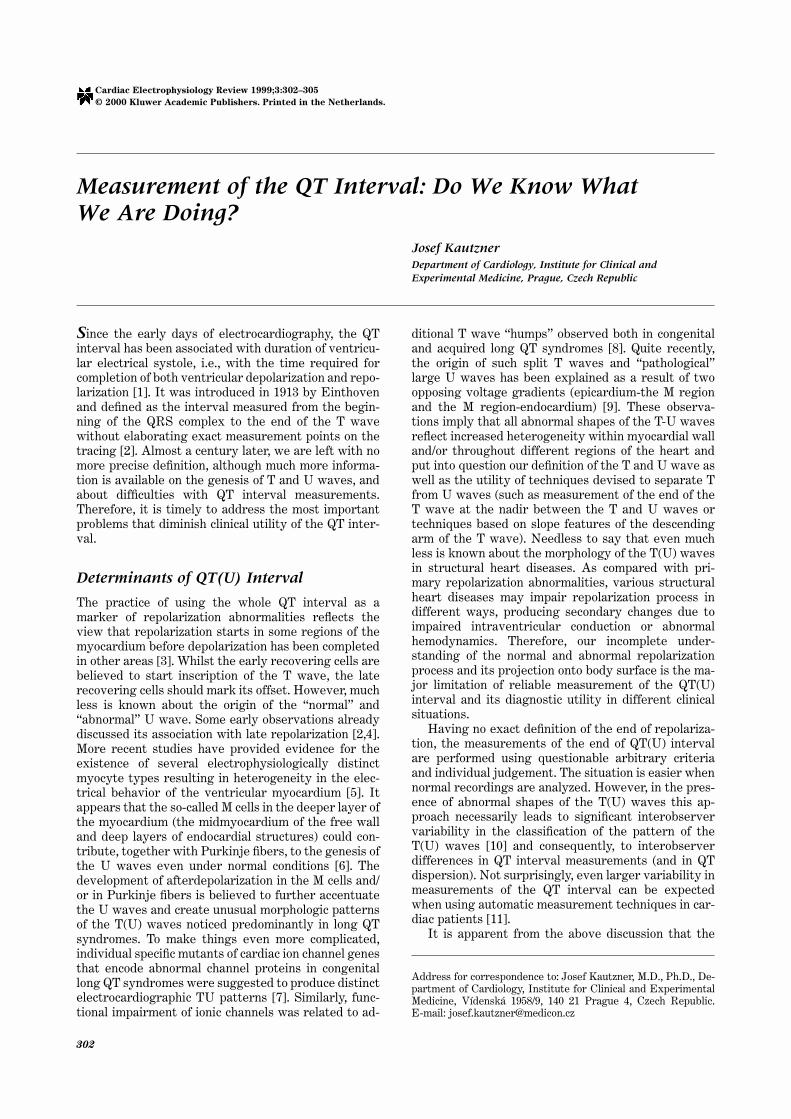
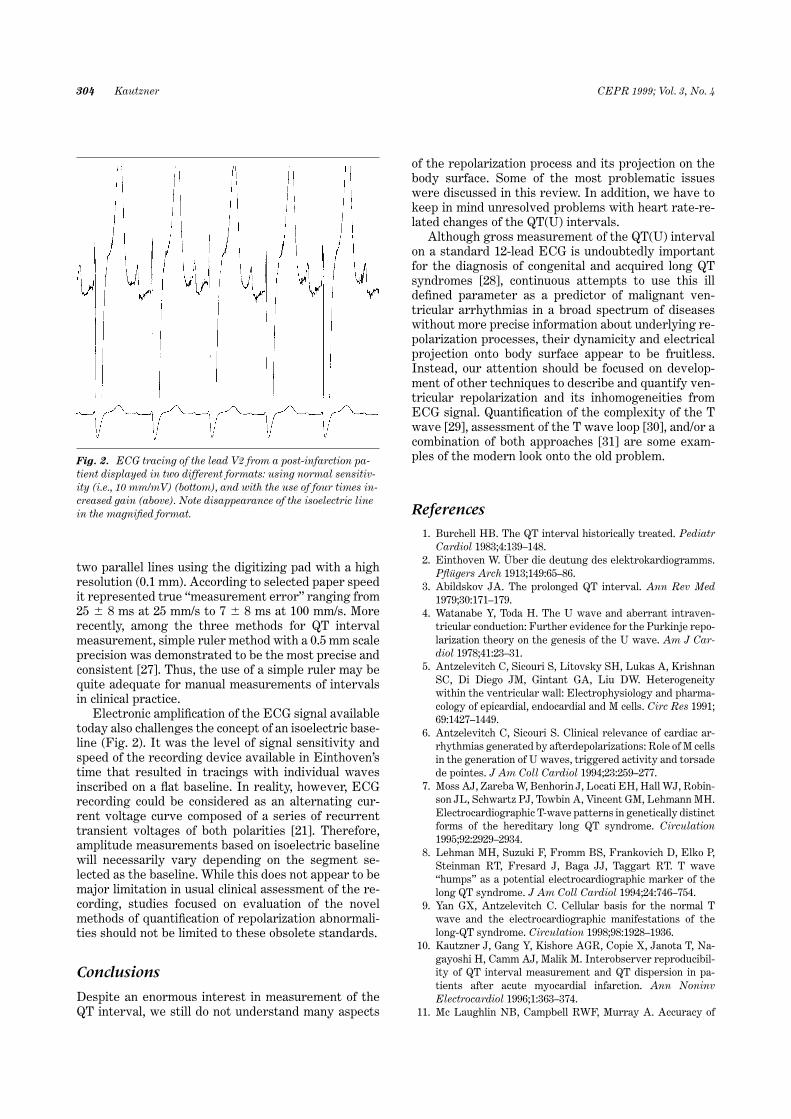
problem with reliable determination of the end of theT wave cannot be solved by the use of surrogate inter-val measured from the beginning of the QRS complexto the peak of the T wave [12]. Such interval correlatesonly weakly with QT interval even in healthy subjects[13], and it is to be expected much worse in the pres-ence of more complicated T(U) patterns such as bipha-sic or _at T waves and/or T wave “humps” (Fig. 1).
Problem of Appropriate ECGLead Selection
Regardless the imprecise de~nition of the end of theT(U) wave, another problem with clinical assessment ofthe QT interval re_ects uncertainty about the selectionof the most appropriate ECG lead for measurement.Interlead variability in duration of the QT interval instandard electrocardiogram has been appreciated formany years. This variation was found to be mainly dueto variability in timing of the end of the T wave [14,15].More recently, interlead variability in QT interval dura-tion was suggested to re_ect natural dispersion ofrefractoriness [16]. Consequently, increased heteroge-neity in repolarization within the myocardium was as-sumed to be responsible for increased differences in QTinterval duration among individual ECG leads at thebody surface (i.e., increased QT dispersion). Despite alack of sound experimental data and documented poorreproducibility of QT dispersion, multiple studies sug-gested this parameter as a reliable predictor of malig-nant arrhythmias in a broad spectrum of conditions [17].However, this notion was not con~rmed by many otherstudies [17], even when using elaborate body surfacemapping [18]. More importantly, recent experimentalresults showed poor correlation between cardiac sur-face activation-recovery intervals and QT intervals to-gether with the low sensitivity of QT intervals to detectregional shortening of the repolarization in the pres-ence of prolonged repolarization elsewhere [19]. Thesedata rather support the view that interlead variabilityin QT duration is primarily secondary due to differentvectorial orientations of individual ECG leads. Since thevectorcardiographic T loop is characterized by its am-plitude and width, then small and wide (pathologic) Tloops tend to produce larger interlead QT differencesthan large, narrow (normal) loops [20]. This is consistentwith our view of the problem. In previous studies innormals subjects we noticed the shortest QT intervalsin leads with axis perpendicular to the axis of the normalT wave (e.g., aVL or V1) and thus, with the low T waveamplitude [13].
Technical Factors
Concerns about interobserver variability in interpre-tation of electrocardiograms due to instrumentationwere already expressed more than 30 years ago [21]. Inhis review, Caceres demonstrated that differences in
measured values of the PR interval can be explainedby different magni~cation of the tracings. In otherwords, the greater the magni~cation of the tracing themore likely the observer to see details and measure theduration of the particular interval. The same holds truefor measurement of the QT interval as shown by sev-eral studies [22,23]. In one of them, the QT intervalsmeasured using electronic calipers were found longerwith higher ampli~cation [22]. Similarly, QT intervalmeasurements were in_uenced by different paperspeed, being shorter with higher speed [22]. Althoughfaster paper speed was recommended by some re-searchers to increase accuracy of measurements [24],other studies have shown that this is not necessarilyhelpful as the T wave is a low frequency de_ection andsubjective determination of its offset becomes moredif~cult at higher speed [25]. We found a signi~cantin_uence of both paper speed and ampli~er gain on QTinterval and dispersion measurements in differentgroups of patients [26]. Speci~cally, proportional de-crease in QT dispersion, especially among patientswith long QT syndrome was noted when highest am-pli~er gain and paper speed were used. Although sug-gestions to use increased gain of electrocardiographicrecordings in order to improve the accuracy of meas-urements were made [21], no general agreement hasbeen accepted.
From technical point of view, measurements of ECGintervals are performed using a ruler, manual or elec-tronic calipers and/or a digitizing pad with an elec-tronic pen. Although many researchers believe the lat-ter is more accurate, this may not be the case. In oneof our studies [23], we revealed consistent operator’smeasurement error (0.6–0.75 mm on average) whenattempting to measure repeatedly distance between
Fig. 1. ECG recordings (lead II) of a 66-year-old femaletreated with sotalol for recurrent atrial tachycardia. Uppertracing obtained early morning shows biphasic T wave withsubsequent U wave, while distinct “hump” appears between thepeak of the T and U wave in the second tracing recorded in theevening. The analysis of the QT peak interval or some attemptsto separate T and U wave using tangential interpolation willbe dif~cult to apply in this recording.
CEPR 1999; Vol. 3, No. 4 QT Interval Measurement 303
two parallel lines using the digitizing pad with a highresolution (0.1 mm). According to selected paper speedit represented true “measurement error” ranging from25 6 8 ms at 25 mm/s to 7 6 8 ms at 100 mm/s. Morerecently, among the three methods for QT intervalmeasurement, simple ruler method with a 0.5 mm scaleprecision was demonstrated to be the most precise andconsistent [27]. Thus, the use of a simple ruler may bequite adequate for manual measurements of intervalsin clinical practice.
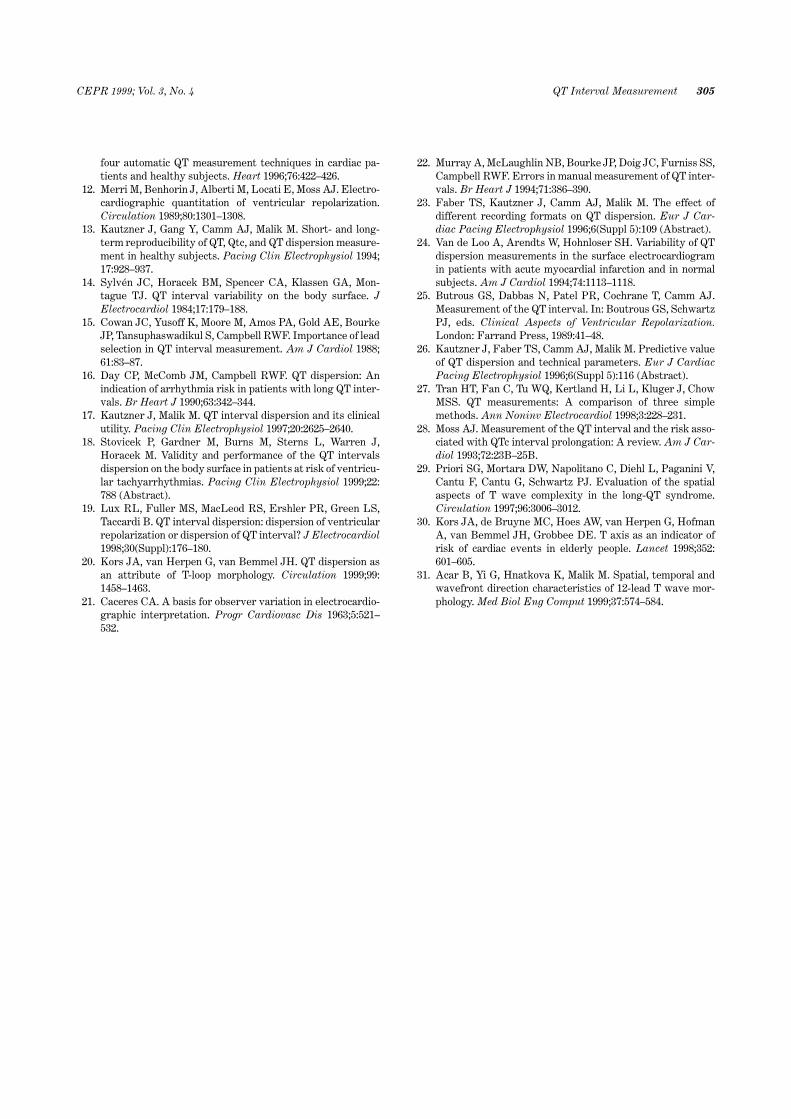
Electronic ampli~cation of the ECG signal availabletoday also challenges the concept of an isoelectric base-line (Fig. 2). It was the level of signal sensitivity andspeed of the recording device available in Einthoven’stime that resulted in tracings with individual wavesinscribed on a _at baseline. In reality, however, ECGrecording could be considered as an alternating cur-rent voltage curve composed of a series of recurrenttransient voltages of both polarities [21]. Therefore,amplitude measurements based on isoelectric baselinewill necessarily vary depending on the segment se-lected as the baseline. While this does not appear to bemajor limitation in usual clinical assessment of the re-cording, studies focused on evaluation of the novelmethods of quanti~cation of repolarization abnormali-ties should not be limited to these obsolete standards.
Conclusions
Despite an enormous interest in measurement of theQT interval, we still do not understand many aspects
of the repolarization process and its projection on thebody surface. Some of the most problematic issueswere discussed in this review. In addition, we have tokeep in mind unresolved problems with heart rate-re-lated changes of the QT(U) intervals.
Although gross measurement of the QT(U) intervalon a standard 12-lead ECG is undoubtedly importantfor the diagnosis of congenital and acquired long QTsyndromes [28], continuous attempts to use this illde~ned parameter as a predictor of malignant ven-tricular arrhythmias in a broad spectrum of diseaseswithout more precise information about underlying re-polarization processes, their dynamicity and electricalprojection onto body surface appear to be fruitless.Instead, our attention should be focused on develop-ment of other techniques to describe and quantify ven-tricular repolarization and its inhomogeneities fromECG signal. Quanti~cation of the complexity of the Twave [29], assessment of the T wave loop [30], and/or acombination of both approaches [31] are some exam-ples of the modern look onto the old problem.
References
1. Burchell HB. The QT interval historically treated. PediatrCardiol 1983;4:139–148.
2. Einthoven W. Über die deutung des elektrokardiogramms.P_ügers Arch 1913;149:65–86.
3. Abildskov JA. The prolonged QT interval. Ann Rev Med1979;30:171–179.
4. Watanabe Y, Toda H. The U wave and aberrant intraven-tricular conduction: Further evidence for the Purkinje repo-larization theory on the genesis of the U wave. Am J Car-diol 1978;41:23–31.
5. Antzelevitch C, Sicouri S, Litovsky SH, Lukas A, KrishnanSC, Di Diego JM, Gintant GA, Liu DW. Heterogeneitywithin the ventricular wall: Electrophysiology and pharma-cology of epicardial, endocardial and M cells. Circ Res 1991;69:1427–1449.
6. Antzelevitch C, Sicouri S. Clinical relevance of cardiac ar-rhythmias generated by afterdepolarizations: Role of M cellsin the generation of U waves, triggered activity and torsadede pointes. J Am Coll Cardiol 1994;23:259–277.
7. Moss AJ, Zareba W, Benhorin J, Locati EH, Hall WJ, Robin-son JL, Schwartz PJ, Towbin A, Vincent GM, Lehmann MH.Electrocardiographic T-wave patterns in genetically distinctforms of the hereditary long QT syndrome. Circulation1995;92:2929–2934.
8. Lehman MH, Suzuki F, Fromm BS, Frankovich D, Elko P,Steinman RT, Fresard J, Baga JJ, Taggart RT. T wave“humps” as a potential electrocardiographic marker of thelong QT syndrome. J Am Coll Cardiol 1994;24:746–754.
9. Yan GX, Antzelevitch C. Cellular basis for the normal Twave and the electrocardiographic manifestations of thelong-QT syndrome. Circulation 1998;98:1928–1936.
10. Kautzner J, Gang Y, Kishore AGR, Copie X, Janota T, Na-gayoshi H, Camm AJ, Malik M. Interobserver reproducibil-ity of QT interval measurement and QT dispersion in pa-tients after acute myocardial infarction. Ann NoninvElectrocardiol 1996;1:363–374.
11. Mc Laughlin NB, Campbell RWF, Murray A. Accuracy of
Fig. 2. ECG tracing of the lead V2 from a post-infarction pa-tient displayed in two different formats: using normal sensitiv-ity (i.e., 10 mm/mV) (bottom), and with the use of four times in-creased gain (above). Note disappearance of the isoelectric linein the magni~ed format.
304 Kautzner CEPR 1999; Vol. 3, No. 4
four automatic QT measurement techniques in cardiac pa-tients and healthy subjects. Heart 1996;76:422–426.
12. Merri M, Benhorin J, Alberti M, Locati E, Moss AJ. Electro-cardiographic quantitation of ventricular repolarization.Circulation 1989;80:1301–1308.
13. Kautzner J, Gang Y, Camm AJ, Malik M. Short- and long-term reproducibility of QT, Qtc, and QT dispersion measure-ment in healthy subjects. Pacing Clin Electrophysiol 1994;17:928–937.
14. Sylvén JC, Horacek BM, Spencer CA, Klassen GA, Mon-tague TJ. QT interval variability on the body surface. JElectrocardiol 1984;17:179–188.
15. Cowan JC, Yusoff K, Moore M, Amos PA, Gold AE, BourkeJP, Tansuphaswadikul S, Campbell RWF. Importance of leadselection in QT interval measurement. Am J Cardiol 1988;61:83–87.
16. Day CP, McComb JM, Campbell RWF. QT dispersion: Anindication of arrhythmia risk in patients with long QT inter-vals. Br Heart J 1990;63:342–344.
17. Kautzner J, Malik M. QT interval dispersion and its clinicalutility. Pacing Clin Electrophysiol 1997;20:2625–2640.
18. Stovicek P, Gardner M, Burns M, Sterns L, Warren J,Horacek M. Validity and performance of the QT intervalsdispersion on the body surface in patients at risk of ventricu-lar tachyarrhythmias. Pacing Clin Electrophysiol 1999;22:788 (Abstract).
19. Lux RL, Fuller MS, MacLeod RS, Ershler PR, Green LS,Taccardi B. QT interval dispersion: dispersion of ventricularrepolarization or dispersion of QT interval? J Electrocardiol1998;30(Suppl):176–180.
20. Kors JA, van Herpen G, van Bemmel JH. QT dispersion asan attribute of T-loop morphology. Circulation 1999;99:1458–1463.
21. Caceres CA. A basis for observer variation in electrocardio-graphic interpretation. Progr Cardiovasc Dis 1963;5:521–532.
22. Murray A, McLaughlin NB, Bourke JP, Doig JC, Furniss SS,Campbell RWF. Errors in manual measurement of QT inter-vals. Br Heart J 1994;71:386–390.
23. Faber TS, Kautzner J, Camm AJ, Malik M. The effect ofdifferent recording formats on QT dispersion. Eur J Car-diac Pacing Electrophysiol 1996;6(Suppl 5):109 (Abstract).
24. Van de Loo A, Arendts W, Hohnloser SH. Variability of QTdispersion measurements in the surface electrocardiogramin patients with acute myocardial infarction and in normalsubjects. Am J Cardiol 1994;74:1113–1118.
25. Butrous GS, Dabbas N, Patel PR, Cochrane T, Camm AJ.Measurement of the QT interval. In: Boutrous GS, SchwartzPJ, eds. Clinical Aspects of Ventricular Repolarization.London: Farrand Press, 1989:41–48.
26. Kautzner J, Faber TS, Camm AJ, Malik M. Predictive valueof QT dispersion and technical parameters. Eur J CardiacPacing Electrophysiol 1996;6(Suppl 5):116 (Abstract).
27. Tran HT, Fan C, Tu WQ, Kertland H, Li L, Kluger J, ChowMSS. QT measurements: A comparison of three simplemethods. Ann Noninv Electrocardiol 1998;3:228–231.
28. Moss AJ. Measurement of the QT interval and the risk asso-ciated with QTc interval prolongation: A review. Am J Car-diol 1993;72:23B–25B.
29. Priori SG, Mortara DW, Napolitano C, Diehl L, Paganini V,Cantu F, Cantu G, Schwartz PJ. Evaluation of the spatialaspects of T wave complexity in the long-QT syndrome.Circulation 1997;96:3006–3012.
30. Kors JA, de Bruyne MC, Hoes AW, van Herpen G, HofmanA, van Bemmel JH, Grobbee DE. T axis as an indicator ofrisk of cardiac events in elderly people. Lancet 1998;352:601–605.
31. Acar B, Yi G, Hnatkova K, Malik M. Spatial, temporal andwavefront direction characteristics of 12-lead T wave mor-phology. Med Biol Eng Comput 1999;37:574–584.
CEPR 1999; Vol. 3, No. 4 QT Interval Measurement 305


![No QTc Prolongation with Semaglutide: A Thorough QT Study ...endpoints: the uncorrected QT interval, QTcL (the linear regression HR-corrected QT interval), QTcF [13] and QTcB (Bazett’s](https://img.pdfslide.net/doc/110x75/5e4eddf812886155d5594a28/no-qtc-prolongation-with-semaglutide-a-thorough-qt-study-endpoints-the-uncorrected.jpg)


![NUPLAZID. -------------------------------CONTRAINDICATIONS · Parkinson’s disease psychosis [see Boxed Warning]. 5.2 QT Interval Prolongation NUPLAZID prolongs the QT interval](https://img.pdfslide.net/doc/110x75/5d0dae3288c9936c438b659b/nuplazid-contraindications-parkinsons-disease.jpg)