Embed Size (px)
Citation preview
SLAC-R-697 UC-414
Measurement of the Spin Structure Function of the Neutron G1(N) from Deep Inelastic Scattering of Polarized Electrons from Polarized Neutrons in He-3 *
James A. Dunne
Stanford Linear Accelerator Center Stanford University Stanford, CA 94309
SLAC-Report-697 1995
Prepared for the Department of Energy under contract number DE-AC03-76SF00515
Printed in the United States of America. Available from the National Technical Information Service, U.S. Department of Commerce, 5285 Port Royal Road, Springfield, VA 22161.
* Ph.D. thesis, American University, Washington DC, 20016
MEASUREMENT OF THE SPIN STRUCTURE FUNCTION OF THE NEUTRON g,"
FROM DEFf INELASTIC SCATTERING OF POLARIZED ELECTRONS FROM .,?
POLARIZED NEUTRONS IN 'He
by
4ames A Dunne
submitted to the Faculty of the College of.Arts and Sciences
of the American University
in Partial Fulfillment of
the Requirements for the Degree
of
Doctor of Philosophy
Date
in
Physics
Signatures of Committ
Chair
I995 The American University Wahington, D <' 200 16
7 7 w
,
1
MEASUREMENT OF THE SPIN STRVCTURE FUNCTION OF THE NEUTRON g,"
FROM DEEP INELASTIC SCATTERP~G OF POLARIZED ELECTRONS FROM * _
, ?
P O L Y ' E D MUTRONS IN 'He -
FROM DEEP INELASTIC SCATTERP~G OF POLARIZED ELECTRONS FROM * _
, ?
P O L Y ' E D MUTRONS IN 'He -
by . c
JarnesA Dunne
Q ABSTRACT
Polarized electrons of energies 19 42, 22 67, and 25 5 GeV were scattered off a
polarized 'He target at SLAC's End Station A to measure the spin asymmetry of the'neutron t
From this asymmetry, the spin dependent structure hnction g,"(x) was d e t e k n e d over, a
range in x from 0 03 to 0 6 with an average @ of 2 (GeVIC)' The value of the integral of
g,* over x is Jg,"(x)& = -0 036 * 0 009 The results were interpreted in the frame work
of the Quark Parton Model (QPM) and used to test the Ellis-JaiXe and Bjorken sum rules
1
0
The value of the integral is 2 6 standard deviations fiom the Ellis-JaRe prediction wtule the
Bjorken sum rule was found to be in agreement with ths datq and proton data fiom SMC and
E- 143
F
ACKNOWLEDGMENTS . \
I would lige to thank ail the members of the E-t42 collaboration and the SLAC d . -
technicians fo'r making thts experiment possible' They are a talented group of people I
would especially like to thank Zein-Eddine Meziani Charlie Young, Jim Johnson,. Henry
Band, and Emlyn Hughes for taking the time to answer questions, give guid;mce, and for just
,
/ being there to talk It was also a pleasure workmg with my fellow graduate students, Michael
Spenios, David Kawall, Yves Roblin, James Xu, and Hunter Middleton 5. ,
A great deal of credit is due to my advisors, Ray Amold, Peter Bosted, Steve Rock, a t .
and Zen Szalata fiom the American University I learned a tremendous amount fiom each of
them They answered all of my many questions during my tenure at SLAC I t d y benefitted 4
fiom the collaborative analysis mektings we had They hold a seemingly limitless knowledge
of physics and computers I believe 1 now possess a sound background in physics and that
is attributed pnmanly to them
I would like to extend my thanks to the profess& at the American University for
teachng me the fbndamentals of physics and math I genubely etjoyid my time back at AU
Special thanks is owed to Dr Segnan, Dr Reiss, Dr day, Dr Schot, Dr Casey, and Dr
Bruce Flanders Looking back on my first year, I guess 1 have come a long way since my first
a .
exam in Intro to Quantum
I have made a lot of lasting friendships during the last few y e a p My social sanity is
. . . I l l
I. .
I
due to people like Jim Talamonti, Mervyn Naidoo, Jeff Ffllbaum, Thia Keppel, Bany
Hellman, Rolf Ent, Rad Antonov, Dave Reyna, and Robih Erbacher But most of all t o
Michael and Effie Spengos They are great people and great neighbors I am indebted for
/
life to Effie and her cooking (especially her fish) They made life in Califomia truly enjoyable
I worked very closely with Michael and I have tremendous respect for him, his family and his * physics Thanks for everything
%
c
A huge amount of thanks is due to my family for the support given during my many
years as a student But the most gratitude is due to my wife who had to put up with-me
during the writing of this document She has helped me in countless ways and probably now
knows (against her will) more about spin physics than most We have spent some very long
days'and nights trying to produce this final document and that alone deems her worthy of all
my gratitude But it goes beyond that, she is my best friend, she is my life And for those
reasons, I dedicate this thesis to her, Demi b
9
iv
1
,
i
TAEiiE OF CONTENTS
* ABSTRACT 11
ACKNOWLEDGMENTS 111
LIST OF TABLES X
a'
LIST OF ILLUSTRATIONS a xiii
CHAPTER 1 INTRODUCTION 1
Structure Functions
Unpolarized Structure fimctions
Polarized Structure Functions
Asymmetries
Lepton-Nucleon Asymmetry
3 Virtual Photon-Nucleon Asymmetry
Quark Parton Model
Sum Rules
Bjorken Sum Rule
The Ellis-Jaffe Sum Rules
The Burithart-Cottingham Sum Rule
Motivation
3 &
2
7
1 1
1 1
12
17
17
19
20
21
r-.
V
". ,
,
v * CHAPTER 2 EXPERIMENTAL SETUP
Beam transport and monitoring
a
I The Polarized Target
Spectrometers
Detectors.
Cerenkov
Shower Counter
Hodoscope
Trigger Electronics
Shower Signals
Cerenkov Signals
Hodoscope Signals
Lucite Signals
Main Trigger
Eficiency Triggers
Trigger OR
Hodogate
Beam Gate
Data Acquisition
The Run Plan
25 .
25 f
". 36
41
. h 41 '-
44
45
48
52
53
55
56
56
57
58
60
61 4
61
62
64
vi
CHAPTER 3 . DATA ANALYSIS 6 5
Shower Analysis 65 \
Clustering Algorithm
Shower Calibration
65 1
66
.a Shower Cuts 70 \ .
Ghost Cut ' @ 7 0 '
71
71 \ . Dead Block Cut
Overlap cut *I
Neural Network Cut : 72
Efficiency Dm 73
7 6.
76
Beam Analysis Lv
Beam cuts <
Beam Polarization Cuts 77
Beam Polarization measurement 79
Tracking h s i y s i s
Tracking Algorithm
81
81
Efficiency 83
Cerenkov Analysis 85
Target Polarization 86
E+ent Selection t
Main Cut Definition
87
88
Binning , 88 I
1
Pion Analysis
t ,
88
'- 4
92 I -. Positron Aqalys~s
Dead-time Cdmection c
95
Radiative Corrections 99
Internal corrections c I O 0
I a: \ i
* - / *
External Radiative Corrections ~ 104
Models- ' I07
1 / r
Dilution Factor 110
Method 1
od II "i
fi Term
1 1 1
113
115
Resolution Correction 116
119 CHAPTER 4 RESULTS AND CONCLUSIONS
Systematic Uncertainties I19
False Asymmetries 124
Raw Asymmetries I26
Electron-nucleon asymmetries A,, and A , 127
The longitudinal and transverse electron-nucleon asymmetries of the neutron 1 34
The virtual ph~ ton-~He asymmetries A I "lC and Az3'" 140
The virtual photon-neutron asymmetries A," and A,"
The g," structure hnction 153
I43
I47 dependence of A," and ,q,/F,
... VI11
Extrapolations 159 I
. .
Low x extrapolation
High x extrapolation
Summary ofg,” Results -
Implications
’ 159
1 6 f
I64
164 . Bjorken sum rule coinpanson with E-I43 A b
Bjorken sum rule comparison with SMC 168 ’
167 * ,
Conclusion
APPENDIX A
Introduction
‘ 1 69
171
171
New Analysis . 172 - 1
New Corrections and Factors 175
Comparison of kallY4 and @rick Analysis 181
Low x point
Options
APPENDIX B
Resonance Region Asymmetries
REFERENCES
I85
187
207
,207
210
I X
1.
.2.
3.
4.
5.
6.
7.
8.
9.
10.
11.
12.
13.
14.
IS.
16.
17.
18.
B
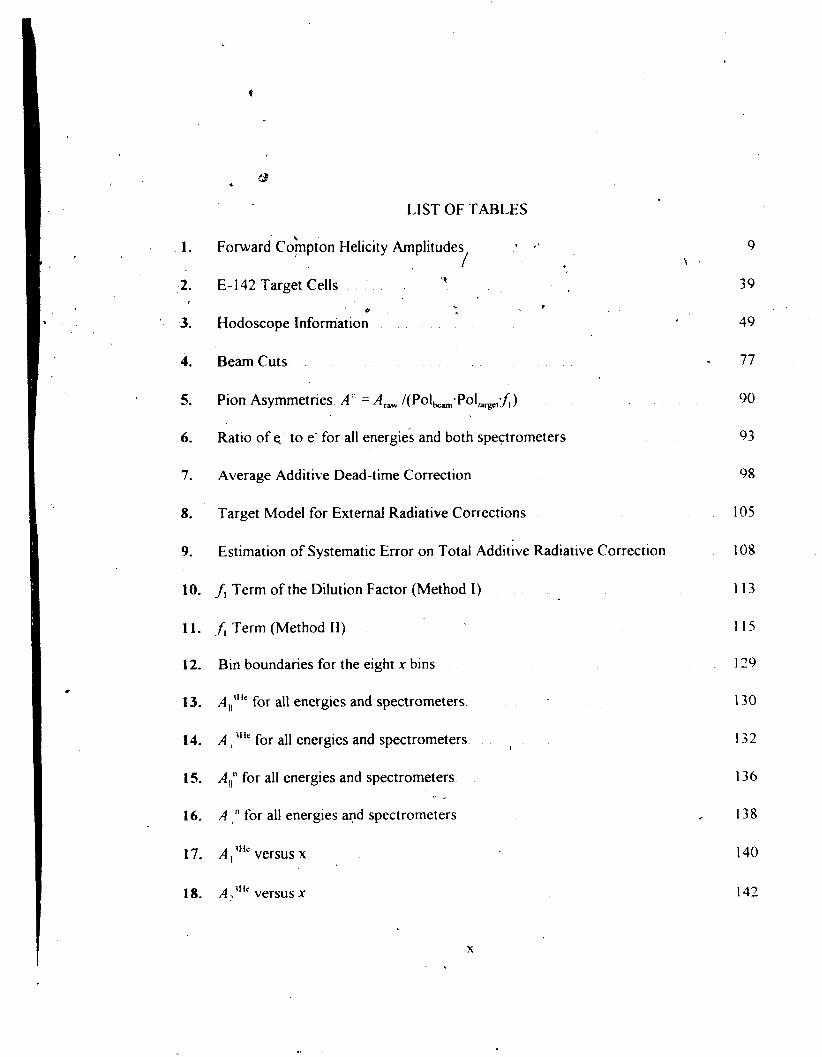
LIST OF TABLES
Forward Co\mpton Helicity Amplitudes * .+ 1
Y E- 142 Target Cells
Hodoscope Infomiation
Beam Cuts
h *
Pion Asymmetries AT = A,,, /(Pol,;Pol~J,)
Ratio of to e- for all energies and both spectrometers
Average Additive Dead-time Correction
Target Model for External Radiative Corrections
Estimation of Systematic Error on Total Additive Radiative Correction
f, Term of the Dilution Factor (Method I)
f, Term (Method 11)
Bin boundaries for the eight x bins
AllJife for all energies and spectrometers
A , we for all energies and spectrometers I
A,," for all energies and spectrometers
A i n for all energies and spectrometers . ..
A , "le versus x
9
39
49
77
90
93
98
105
108
1 I3
1 IS
129
130
132
136
138
140
142
X
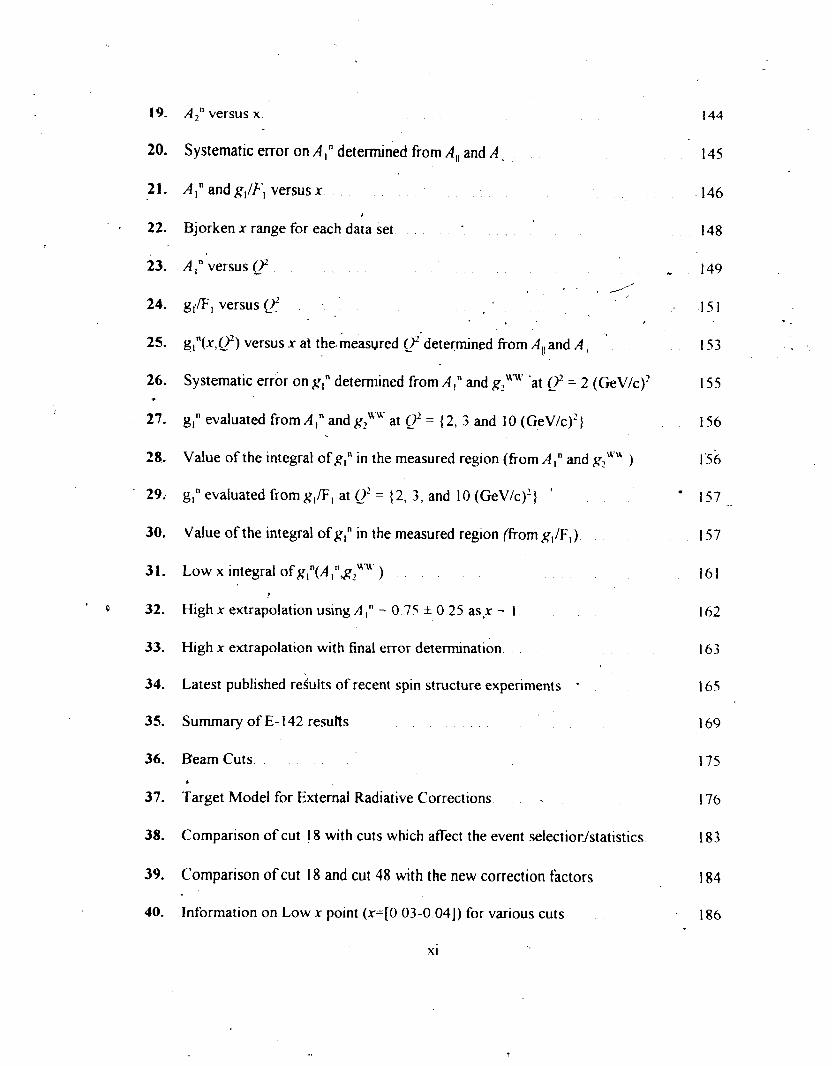
19. Azn versus x 144
20. 145
21. A," and g,/k', versus x I46
22. Bjorken x range for each data set 148
Systematic error on A," determined fiom A,, and A ,
?
23. A," versus (_)' ~ 149 . //'
* 151
I53
3 .
24. g,4Fl versus Qz
25. g1"(x,Q2) versus x at the.measured (_)"determined from A p and A , *
26.
27.
28.
Systematic error on g," determined from k !" and gZuu' 'at = 2 (GeVIc)' I55
156
1-56
I
g," evaluated from A," and gZNw at 0' = (2, 3 and 10 (GeV/c)?}
Value of the integral ofg," in the measured region (from A," and g2WU )
29, g," evaluated from gJF, at QZ = 12, 3, and 10 (GeV/c)'} ' I57
30. Value of the integral of g," in the measured region (fiom g,/F,) I57
31. Low x integral ofg,"(A,",g2Uu' ) 161 P
' 0 32. High x extrapolation using A In - 0 75 f 0 25 as,x - 1
33. High x extrapolation with final error determination
162
163
34. Latest published redults of recent spin structure experiments * 165
35.
36. Beam Cuts
Summary of E- 142 results
&
37. Target Model for External Radiative Corrections
169
175
I76
38. Comparison of cut 18 with cuts which affect the event selectiorlstatistics 183
39.
40.
Comparison of cut I8 and cut 48 with the new correction factors
Information on Low x point (x=[O 03-0 041) for various cuts
184
186
XI
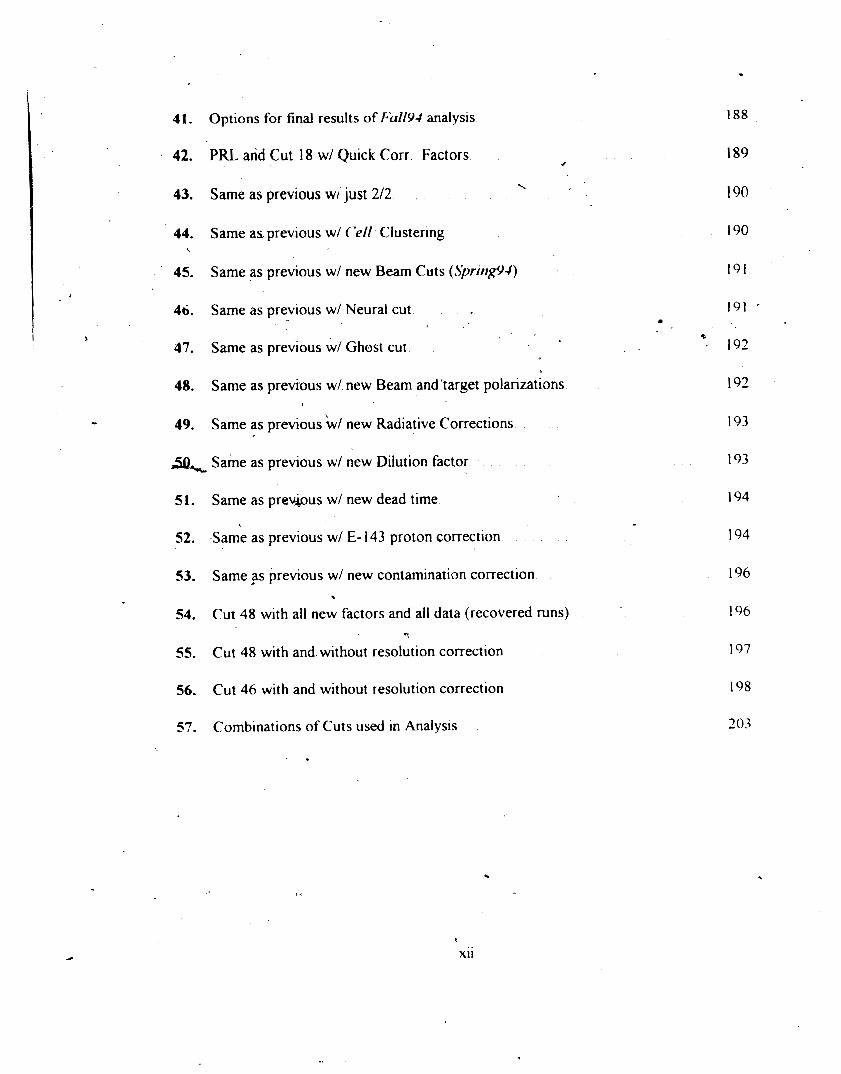
41. Options for final results of FbII9.I analys~s
42. PRL and Cut 18 wl Quick Corr Factors
43. Same as previous W I just 212
44. Same as. previous w/ (-e// Clustering
45. Same as previous w/ new Beam Cuts (LSpr~ng94)
..
46.
47.
48.
Same as previous w/ Neural cut
Same as previous w/ Ghost cut
Same as previous w/ new Beam and’target polarizations
I ’ e 49. Same as previous wl new Radiative Corrections
% Same as previous wl new Dilution factor
5 1. Same as preious w/ new dead time
52. ,Same as previous w/ E- 143 proton correction
53.
54.
55.
Same ,as previous w/ new contamination correction
Cut 48 with all new factors and all data (recovered runs)
Cut 48 with and. without resolution correction
. .\
56. Cut 46 with and without resolution correction
57. Combinations of Cuts used in Analysis
i88
i89
I90
i90
191
191 *
% ‘ 192
192
193
193
194
194
196
196
197
198
203
.
t
xii
c
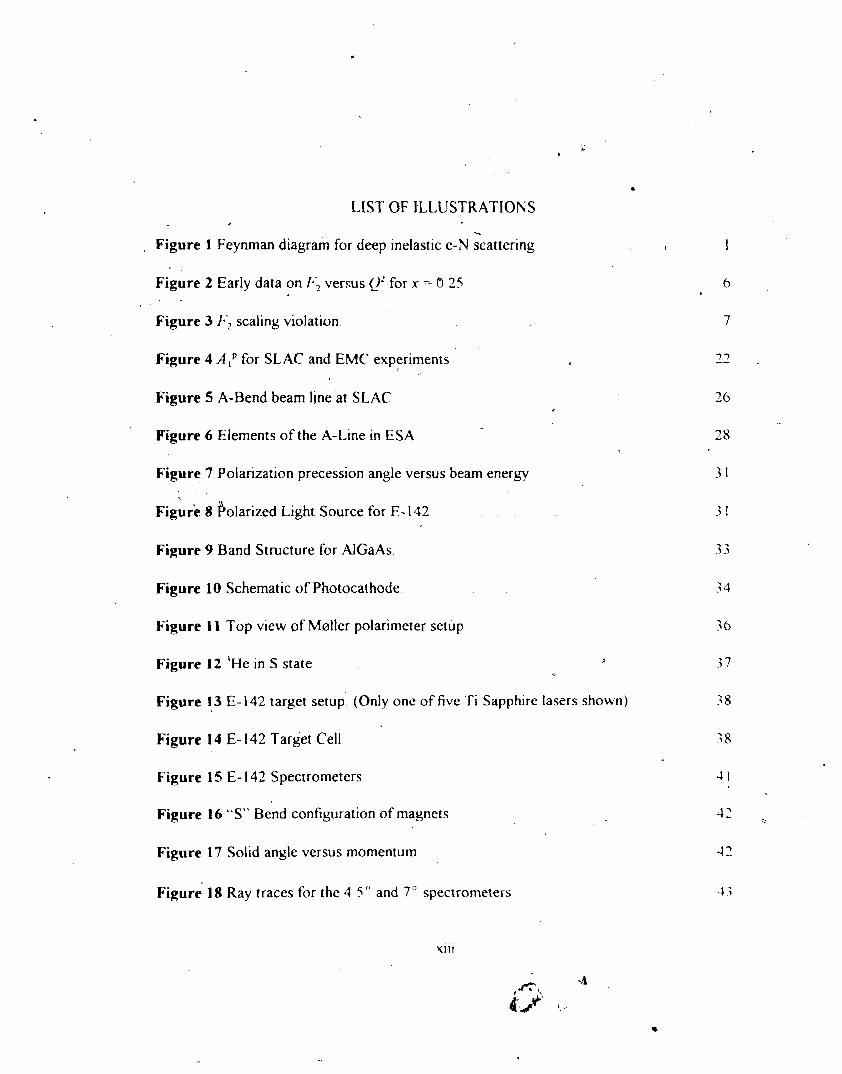
LIST OF ILLUSTRATIONS .
, Figure 1 Feynman diagram for deep inelastic e-N scattering \ 1
6 Figure 2 Eady data on 1.2 versus Q’ for x = 0 25 , .
Figure 3 /*; scaling violation 7
33 Figure 4 A , P for SLAC and EMC experiments --
Figure 5 A-Bend beam line at SLAC 26
Figure 6 Elements of the A-Line in ESA 28
Figure 7 Polarization precession angle versus beam energy
Figure 8 polarized Light Source for E- I42
Figure 9 Band Structure for AlGaAs
Figure 10 Schematic of Photocathode
3 -3
-3 4
Figure 11 Top view of Mraller polarimeter setup 36
a Figure 12 ‘He in S state -3 7
Figure 13 E-142 target setup (Only one of five Ti Sapphire lasers shown) 3 8
-7 8 Figure 14 E- 142 Target Cell
Figure 15 E- 142 Spectrometers
Figure 16 “S” Bend configuration of magnets
Figure 17 Solid angle versus momentum
Figure’ 18 Ray traces for the 4 5 I’ and 7 I’ spectrometers
41
‘I2
42
4 3
,
Figure 19
Figure 20
Figure 22
Figure 23 @.
Figure 24
Figure 25
Figure 26
Figure 27 &
Figure 28
Figure 29
Figure 30
Figure 31
Figure 32
Figure 33
Figure 34
Detectors (Top View, not to scale)
Cerenkov detector
0
Shower counter
Leati glass block
Hodoscope fingers ( 2 / 3 overlap)
Lucite ,planes
Trigger schematic legend
Saclay splitter
Shower counfer schematic
Cerenkov trigger schematic
Lucite coincidence and Pion trigger
Main trigger
Efficiency triggers
Trigger OR and the Saclay Trigger Divider
Hodogate
Beam Gate schematic
, Figure 35 Data Acquisition schematic
Figure 36 Cluster block numbering around central block
Figure 37 Fractional energy distribution in a non-edge cluster
Figure 38 Neural network output for pions and electrons
Figure 39 Neural network ( N N 4 95) effect on E/P
Figure 40 Neural Networh etliciency versus energy f o r the 4 5'' at I9 GeV
44
45
47
48
50
5 1
53
54
5 5
56
57
58
59
60
61
62
63
67
69
73
73
74 .
YIV
Figure 41 Neural Network efficiency versus energy for the 7" at 19 GeV 74
75
75
Figure 42 Neural Network efficiency versus energy for the 4 5" at 22 GeV
Figure 43 Neural Network efficiency versus energy for the 7" at 22 GeV
Figure 44 Neural Network efficiency versus energy for the 4 5" at 25 GeV 75
Figure 45 Neural Network efficiency versus energy for the 7" at 25 GeV 75
76
76
Figure 46 Neural Network efficiency versus Trigger OR rate for the 4 5 " at 22 GeV
Figure 47 Neural Network efficiency versus Trigger OR rate for the 7" at 22 GeV
Figure 48 Gate widths where polarization bits are valid 78
Figure 49 4 5 " Trigger OR distribution for 2/2 case and 2/2 but not 3/3
Figure SO 7" Trigger OR distribution for 2/2 case and 212 but not 313
79
79
5,
Figure -51 Measured Msller asymmetry and background 80
Figure 52 Beam polarization versus run number
Figure 53 Tracking algorithm flow chart )i
Figure 54 4 5 O tracking efficiency versus E '
Figure 55 7" tracking efficiency versus E '
Figure 56 4 5 " tracking efficiency versus Trigger Or Rate
Figure 57 7" tracking efficiency versus Trigger Or Rate
Figure 58 ADC spectra for channels -, 25 from the Cerenkov detectors
81
83
84
84
85
85
86
Figure 59 'He and water NMR signals for the polarization measurbment 87
91 Figure 60 Pion asymmetries A - = A,,, / ( / ) o / h c a m / ' o / , ~ ~ , : f , )
Figure 61 Ratio of e ' to e' for all energies in each spectrometer as a hnction of x 94
Figure 62 Measured trigger OR dead-time
x v
98
t
Figure 63 Feynman diagrams of higher order radiative processes
Figure 64 Additive Internal Radiative Correction to A,,3HC for the 4 5 O spectrometer
Figure 65 Additive Internal Radiative Correction to A,,3t'' for the 7" spectrometer
Figure 66 Elastic and quasi-elastic radiative tail contribution to A,,"" for the 4 5"
Figure 67 Elastic and quasi-elastic radiative tail contribution to A,,31ic for the 7"
Figure 68 Schematic of 'He target with NMR pickup coils (not to scale)
Figure 69 Additive Internal +External Radiative Corfection to All3"' for the 4 5 " )
-
Figure 70 Additive Internal + External Radiative Correction to for the 7"
Figure 7 1 Smearing of the momentum spectrum
Figure 72 Resolution corrections for 4 5 " and 7" data versus E '
Figure 73 Comparison of /*> from the FZNMC parameterization versus data
Figure 74 A," averaged over E' and 8 vs x with positivity copstraint, h? and A 2 w u
A
. Figure 75 Left / right beam pulse position and size differences for all A, , runs
Figure 76 Electron rate binned versus beam position and size at the target
Figure 77 A,,"" for each energy and spectrometer
Figure 78 A , "'' for each energy and spectrometer
Figure 79 A,," for each energy and spectrometer
. Figure 80 A ," for each energy and spectrometer
Figure 81 A,'"' virtual photon-'He asymmetry versus x at the measured average cp
Figure 82 A2"" versus x at the measured average (_)'
F'igure 83 A ," versus x at the measured average Q'
Figure 84 f i / i q ' , versus x at the measured average Q'
i00
103
i03
103
103
106
106
106
117
118
123
124
125
126
13 1
133
137
139
141
142
146
147
xvi
4
Figure 85 A I versus Qz
Figure 86 ,q,/b'l versus Q2 (statistical errors only) 5
150
152
Figure 87 g," determined fiom the measured e,, and A , at the measured average Q* 154
Figure 88 g," from A," and glUW at 0' = 2 (GeV/c)' 158
Figure 89 g)" from g,/I*', at Qz = 2 (GeV/c)' 158
163
177
Figure 90 Fit to A ," used in high x extrapolation &
Figure 9 1 Radiative Correction Comparison (rough approximation of errors)
Figure 92 Bel Difference between method 1 and method 2
Figure 93 Comparison of dilution factors for the 4 5: used in the @trick and I+b//Y-l.
179
179
180
181
181
Figure 94 Gate widths where polarization bits are valid
Figure 95 4 5 " Trigger OR distribution for 2/2 case and 2/2 but not 313
Figure 96 7" Trigger OR distribution for 2/2 case and 2/2 but not Y3
Figure 97 PRL with Cut 18 w/ Quick Corr Factors
Figure 98 Same as previou$w/ 2/2 pol . ' Figure 99 Same as previous w/ ( 'ell Clustering
Figure 100 Same as previous w/ new Beam Cuts (.Ypri~igW)
Figure 101 Same as previous w/ Neural cut
Figure 102 Same as previous w/ Ghost cut
Figure 103 Same as previous w/ new Beam and Target polarizations
Figure 104 Same as previous w/ new Radiative Corrections
Figure 105 Same as previous w/ new Dilution factor
Figure 106 Same as previous w/ new dead time 3
189
190
190
191
191
192
192
193
193
194
xvii
1
Figure 107 Same as previous w/ E- 143 proton correction
Figure 108 Same as previous wl new contamination correction
Figure 109 Cut 18 wl (_)trick corrections & Cut 48 w/ all new factors and all data
I94
195
195
Figure 110 A," at x = 0 035 for vanous cuts
Figure I 1 1 Integral of g , of vanous cuts (measured regon)
Figure 112 Cut 48 with and without resolution correction
Figure 113 Cut 46 versus Cut 48 (both without resolution correction)
Figure 1 14 4 5 O I9 GeV Neural Network efficiency
Figure 115 4 5" 22 GeV Neural Network efficiency
Figure 116 4 5 25 GeV Neural Network efficiency
Figure 1 17 7" 19 GeV Neural Network efficiency
Figure 118 7" 22 GeV Neural Network efficiency
Figure 119 7" 25 GeV Neural Network efficiency
196
196
197
198
199
199
200
200
20 1
20 1
I
Figure 120 Smearing of momentum spectrum by using the shower energy resolution 202
xviii
![Measurement of spin-orbital angular momentum interactions …angular momentum. The spin alignment of a vector meson is described by a 3 × 3 Hermitian spin-density matrix [12]. The](https://img.pdfslide.net/doc/110x75/606ad0c03b271d2923649ae1/measurement-of-spin-orbital-angular-momentum-interactions-angular-momentum-the.jpg)