Embed Size (px)
Citation preview
Measuring and Interpreting World Economic Performance 1500-2001
By Angus Maddison ©
Macro-measurement started in the seventeenth century, but did not emerge as a basic analytical tool
for policy analysts and economic historians until the 1940s. In the past 60 years there has been an explosion
in the sophistication of policy analysis and the interpretation of history. The explosion started in 1940 with
two seminal works: Keynes’ How to Pay for the War which demonstrated its usefulness as a tool of
macroeconomic management, and Colin Clark’s Conditions of Economic Progress which demonstrated its
value in interpreting economic history. Dissemination and development of techniques of macro-measurement
was a major objective of the founding fathers of the International Association for Research in Income and
Wealth (IARIW). The initiative came from Simon Kuznets (1901-85), the pioneer of quantitative economic
history. Milton Gilbert (1909-79) and Richard Stone (1913-1991) were strategic partners with enormous
international leverage in creating and diffusing standard procedures for construction of comparable national
accounts by official statistical offices.
In the past half-century, I have followed the Kuznetsian approach, augmenting the historical accounts
and broadening their geographic scope with my own research, using it to interpret economic performance with
a similar analytical toolkit and the same emphasis on transparent description of source material, encouraging
graduate students to follow the same path, and creating networks of scholars active in this brand of
quantitative economic history. Now we have fairly comprehensive coverage for the whole of the capitalist
epoch from 1820 onwards. There are of course gaps in the evidence and scope for improving its quality, but
the new challenge, which I have taken up in recent years, is to push the quantitative record further back in
time.
This chapter surveys the development and impact of macro-measurement in three epochs:
a) since the 1940s, its main purpose has been to illuminate policy options to improve growth performance
at the national level, to analyse inter-country divergence in real income levels and to help devise policies for
catch-up. We now have official estimates of growth and levels for the vast bulk of the world economy from
1
1950 onwards. Macro-measurement contributed to much more articulate and successful macro-management.
In 1950-2001, world per capita GDP rose 2.1 per cent a year, twice as fast as in 1900-1950.
b) For the Kuznetsian epoch of “modern economic growth” back to 1820, quantitative historians have
made great progress in measuring growth performance and interpreting its causes. There is still a need to fill
gaps and crosscheck existing estimates, but the broad contours of world development in this period are not
under serious challenge.
c) until recently, serious quantitative investigation of the “merchant capitalist” epoch, 1500-1820, was
neglected for three reasons: i) growth was much slower than in the last two centuries; ii) the evidence is
weaker and there is greater reliance on clues and conjecture; iii) many (under the influence of Malthus)
thought and think that it was a period of stagnation interrupted by catastrophe. Like Adam Smith, I take a
much more positive view of what happened. I explain the derivation of my estimates of performance for
1500-1820 and my reasons for disagreeing with the pessimism of the real-wage pundits.
Finally I give my interpretation of the nature of the transition from merchant capitalism to modern
economic growth. The roots of modernity were not a sudden “take-off”, but a long apprenticeship, and the
divergence in income levels between the West and the rest of the world started well before 1820.
` I
Development of Macro-measurement as a Tool of Economic Policy, 1950-2001
(i) Standardised Estimates of GDP Growth
Standardised national accounts provide a coherent macroeconomic framework covering the whole
economy, which can be crosschecked in three ways. From the income side, they are the total of wages, rents
and profits. On the demand side, they are the sum of final expenditures by consumers, investors and
government. From the production side, the sum of value added in different sectors (agriculture, industry and
services) net of duplication. In all three dimensions these measures need to be adjusted to eliminate changes
in the price level in the period they cover, so that they show changes in volume.
Milton Gilbert was responsible for the official US accounts during the war and from 1950 to 1961
was head of statistics and national accounts in OEEC. The Marshall Plan required criteria for aid allocation,
and NATO needed them for its burden-sharing exercises. Gilbert met these requirements by pushing official
statistical offices of the 16 OEEC member countries to adopt the standardised system of national accounts
(SNA) designed by Richard Stone.
Stone set up a programme in Cambridge to train official European statisticians to implement the
standardised system. A set of handbooks was prepared to explain the problems of adjusting national
2
estimates to conform to the standardised system. A first comparative set of accounts for the 16 OEEC
member countries for 1938 and 1947-52 was published in 1954, with extensive notes explaining the
adjustments which had been made to achieve comparability.
In 1953, Stone became chairman of a United Nations commission which established a standardised
system of accounts for worldwide application. The UN could not exert as much leverage on its member
countries to conform as was possible in OEEC. The communist countries used the Soviet MPS (material
product system) which took a narrower view of the scope of economic activity than the SNA. MPS excluded
many service activities which were considered “non-productive” (passenger transport, housing, health,
education, entertainment, banking, insurance, personal services, government and party administration and the
military). MPS involved double counting (measuring gross output without deducting inter-sector transfers of
inputs) and exaggerated economic growth. The price system and tax-structures were different from those in
capitalist countries, and measurement conventions gave incentives to exaggerate quality change when new
products were introduced. Abram Bergson (1914-2003) pioneered procedures for re-estimation of Soviet
GDP on a basis corresponding approximately to Western conceptions in coverage, inclusion of the ignored
activities, elimination of double-counting, and repricing on an “adjusted factor cost” basis with imputation
for capital costs which were not considered in Soviet-style accounting. These corrective procedures were
applied to Soviet statistics by a team of CIA Sovietologists in Washington. In New York, Thad Alton and his
colleagues did the same for Bulgaria, Czechoslovakia, East Germany, Poland, Romania and Yugoslavia. This
work was financed for intelligence purposes, but was publicly available in annual reports to the US Congress
(see Maddison, 1998b).
In the 1990s most of the former communist countries adopted the standardised SNA system in
principle, but implementation was complicated by the massive change in ownership, in the level and structure
of prices, allocation of resources between consumption and investment, and statistical reporting procedures.
It will take some years before these problems can be fully resolved. The IMF continues to use exaggerated
measures of GDP growth for these countries (see Maddison, 2003a, p. 231). As a result, it shows a growth in
world GDP averaging 3.9 percent a year for 1970-2001, compared with my estimate of 3.3 percent. For
China it shows growth averaging 8.5 per cent a year, whereas my adjusted measure shows a growth rate of
6.5 per cent
Another area of weakness is the national accounts for African countries, where there was and still is a
great shortage of skills and money for such work. The gap in estimates of GDP growth was filled in
substantial degree by the OECD Development Centre which compiled annual estimates of real GDP growth
3
1950-90 for 51 African countries. The Centre benefited from the expertise of Derek Blades, who had been
chief statistician in Malawi for eight years, and by David Roberts who had similar experience in Gambia.
A third problem in the assessment of GDP growth performance in the higher income countries derives
from recent changes in measurement conventions from 1995 onwards, involving adoption of hedonic indexes
to adjust for assumed changes in quality of product, use of chain indices, and treatment of computer software
as investment.
Hedonic indices are perfectly respectable in small doses, but one can be skeptical about the
widespread assumption that quality changes have been so large and monotonically positive. In the USA,
where the switch to hedonics was most significant, their net impact was to raise the measured rate of growth
to a somewhat greater degree than in western Europe and Japan. US official estimates go back to 1929, and
the changes in measurement technique had their biggest impact for 1929-50, raising the GDP growth rate for
that period from 2.6 percent a year to 3.5. There was no counterpart to this long retrospective readjustment in
other countries, and I have continued to use the earlier US official measure for 1929-50 (for reasons
explained in Maddison, 2001, p. 138, and Maddison, 2003a, pp.79-80). More than 40 years ago, Milton
Gilbert warned that such adjustments could open Pandora’s box: “In the end, they would make it impossible
to construct measures of output and price changes that are useful to the study of economic growth” (Gilbert,
1961, p. 287). The danger which arises from an overdose of hedonics is discussed in Appendix 3.
Ed Denison (1915-1992) opposed changes in national accounting which treat accretions of knowledge
as investment. He considered this a “misclassification” which made “growth analysis chaotic” (see
Denison, 1989, p. 10). A major justification for his complaint was that his growth accounts included “human
capital”, i.e. increments in the quality of the labour force due to increases in the level of education. In fact,
the only form of knowledge which is now treated as investment is computer software. It is odd to treat this
rapidly depreciating knowledge as investment, whilst ignoring the more durable influence of books and
education.
(ii) Purchasing Power Converters for Cross-country Comparison of GDP Levels
Once standardised accounts of real GDP growth were available, the next step in inter-country
comparison of economic performance and multi-country aggregation was the development of purchasing
power parity converters (PPPs) to measure real GDP levels, rather than relying on exchange rate comparison.
As noted above, measures of economic growth over time must be corrected to exclude the impact of inter-
temporal price change. The purpose of PPP conversion is precisely analogous: The elimination of inter-
country differences in price level, so that differences in the volume of economic activity can be compared
4
across countries. By merging the time series for economic growth with the cross-country estimates of GDP
levels now available we can make a coherent set of space-time comparisons.
OEEC initiated official estimates of purchasing parity and inter-country differences in the level of
GDP. The first study was co-authored by Milton Gilbert and Irving Kravis (1954) and a second, by Gilbert
and Associates (1958). They estimated 1950 and 1955 PPPs in order to compare real expenditure levels in
seven west European countries and the USA. Irving Kravis, Alan Heston and Robert Summers (1975, 1978
and 1982) followed this up with more ambitious studies in their International Comparison Project (ICP) at
the University of Pennsylvania from 1968 onwards. They involved collection of carefully specified price
information by statistical offices for more than two thousand representative items of consumption,
investment and government services (1).
The OEEC studies were binary comparisons of differences in price levels between pairs of countries.
The three options were i) a Paasche PPP, with “own-country” quantity weights; ii) a Laspeyres PPP with the
quantity weights of the numeraire country-the United States; iii) a compromise geometric (Fisher) average of
the first two measures. The corresponding measures of real expenditure were: i) Laspeyres comparisons of
GDP levels based on the prices (unit values) of the numeraire country; ii) Paasche level comparisons based
on “own-country” prices (unit values); iii) a Fisher geometric average of the two measures. Binary
comparisons, e.g. Germany/USA and UK/USA, could then be linked with the USA as the star country. Such
star comparisons could provide a proxy Germany/UK comparison, but it was not “transitive” (i.e. the result
would not be identical to that derived from a direct Germany/UK comparison). This was not a great
drawback for OEEC countries where the inter-country deviation in performance levels was not too wide. But
Kravis, Heston and Summers were engaged in comparisons over a much wider range of countries. They
therefore adopted the Geary-Khamis (G-K) method, invented by Roy Geary (1896-1983) and Salem Khamis,
which multilateralised the results, provided transitivity and other desirable properties. They used it in
conjunction with the commodity product dummy method (CPD), invented by Robert Summers, for filling
holes in the basic dataset. Their masterpiece was their third study, the 1982 volume World Product and
Income, which contained estimates for 34 countries (in Africa, the Americas, Asia and Europe) in 1975
prices and international Geary-Khamis dollars. These countries accounted for 64 per cent of world GDP in
2001.
The UN Statistical Office extended the ICP work and had covered 84 countries by 1985. UNSO then
dropped this endeavour, though some of the regional UN bodies continued with it. The OECD recommenced
5
its comparisons on a regular basis in 1982. Its latest work covered the 28 OECD countries (see OECD 2002)
and 20 others in Eastern Europe, the 15 successor states of the USSR, and Mongolia (see OECD, 2000).
Since 1978, Alan Heston and Robert Summers have produced short-cut estimates of PPPs and real
income levels for countries for which full-scale ICP type measures are not available. The latest version of their
Penn World Tables (PWT 6.1 October, 2002) can be found on their website (2) As a result, we now have
reasonably acceptable PPP adjusted measures available for over 99 percent of world GDP.
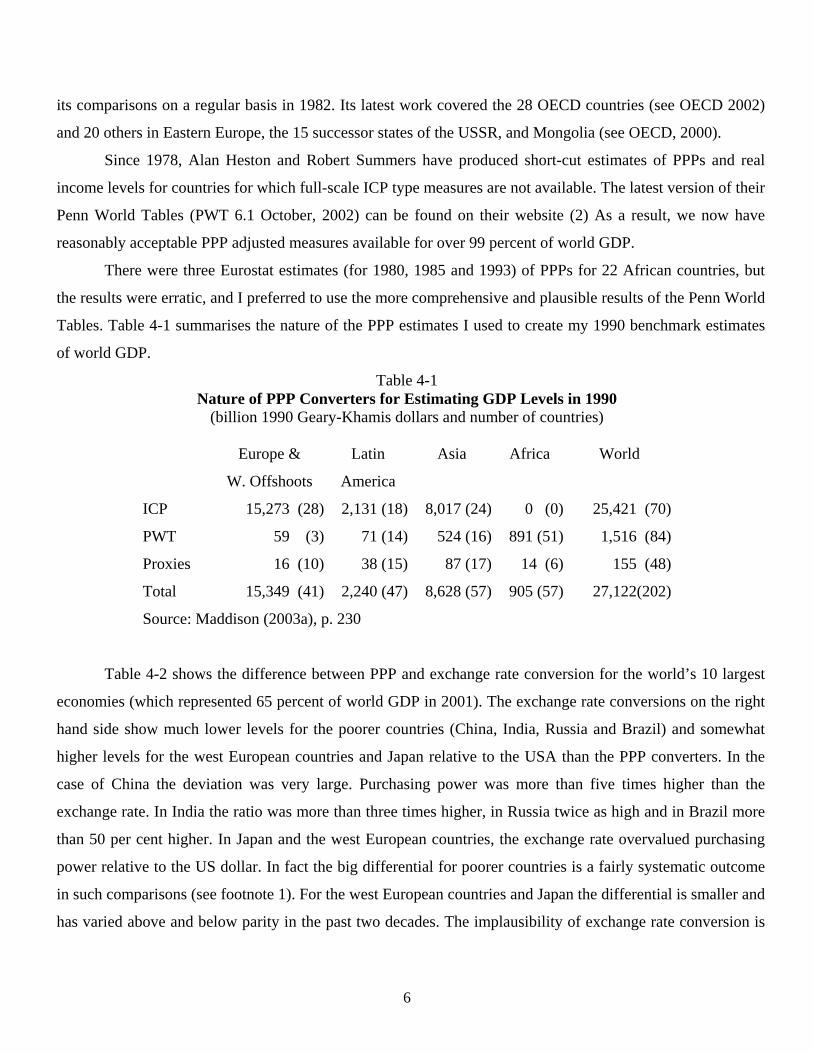
There were three Eurostat estimates (for 1980, 1985 and 1993) of PPPs for 22 African countries, but
the results were erratic, and I preferred to use the more comprehensive and plausible results of the Penn World
Tables. Table 4-1 summarises the nature of the PPP estimates I used to create my 1990 benchmark estimates
of world GDP.
Table 4-1 Nature of PPP Converters for Estimating GDP Levels in 1990
(billion 1990 Geary-Khamis dollars and number of countries)
Europe &
W. Offshoots
Latin
America
Asia Africa World
ICP 15,273 (28) 2,131 (18) 8,017 (24) 0 (0) 25,421 (70)
PWT 59 (3) 71 (14) 524 (16) 891 (51) 1,516 (84)
Proxies 16 (10) 38 (15) 87 (17) 14 (6) 155 (48)
Total 15,349 (41) 2,240 (47) 8,628 (57) 905 (57) 27,122(202)
Source: Maddison (2003a), p. 230
Table 4-2 shows the difference between PPP and exchange rate conversion for the world’s 10 largest
economies (which represented 65 percent of world GDP in 2001). The exchange rate conversions on the right
hand side show much lower levels for the poorer countries (China, India, Russia and Brazil) and somewhat
higher levels for the west European countries and Japan relative to the USA than the PPP converters. In the
case of China the deviation was very large. Purchasing power was more than five times higher than the
exchange rate. In India the ratio was more than three times higher, in Russia twice as high and in Brazil more
than 50 per cent higher. In Japan and the west European countries, the exchange rate overvalued purchasing
power relative to the US dollar. In fact the big differential for poorer countries is a fairly systematic outcome
in such comparisons (see footnote 1). For the west European countries and Japan the differential is smaller and
has varied above and below parity in the past two decades. The implausibility of exchange rate conversion is
6
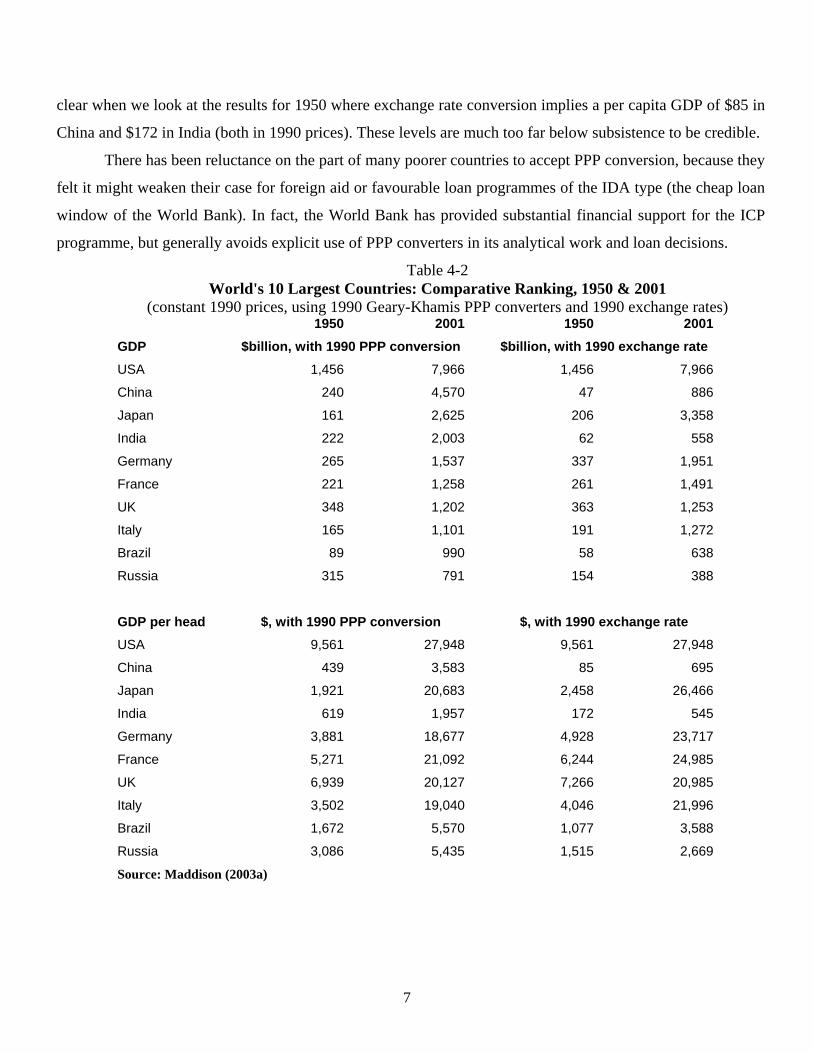
clear when we look at the results for 1950 where exchange rate conversion implies a per capita GDP of $85 in
China and $172 in India (both in 1990 prices). These levels are much too far below subsistence to be credible.
There has been reluctance on the part of many poorer countries to accept PPP conversion, because they
felt it might weaken their case for foreign aid or favourable loan programmes of the IDA type (the cheap loan
window of the World Bank). In fact, the World Bank has provided substantial financial support for the ICP
programme, but generally avoids explicit use of PPP converters in its analytical work and loan decisions.
Table 4-2 World's 10 Largest Countries: Comparative Ranking, 1950 & 2001
(constant 1990 prices, using 1990 Geary-Khamis PPP converters and 1990 exchange rates) 1950 2001 1950 2001GDP $billion, with 1990 PPP conversion $billion, with 1990 exchange rate USA 1,456 7,966 1,456 7,966
China 240 4,570 47 886
Japan 161 2,625 206 3,358
India 222 2,003 62 558
Germany 265 1,537 337 1,951
France 221 1,258 261 1,491
UK 348 1,202 363 1,253
Italy 165 1,101 191 1,272
Brazil 89 990 58 638
Russia 315 791 154 388
GDP per head $, with 1990 PPP conversion $, with 1990 exchange rate USA 9,561 27,948 9,561 27,948
China 439 3,583 85 695
Japan 1,921 20,683 2,458 26,466
India 619 1,957 172 545
Germany 3,881 18,677 4,928 23,717
France 5,271 21,092 6,244 24,985
UK 6,939 20,127 7,266 20,985
Italy 3,502 19,040 4,046 21,996
Brazil 1,672 5,570 1,077 3,588
Russia 3,086 5,435 1,515 2,669
Source: Maddison (2003a)
7
In spite of the creeping acceptance of PPP adjusted estimates, there continues to be significant error in
comparative economic analysis because of ignorance of the pitfalls of exchange rate conversion. This is true in
journalism, in political discourse, and also amongst some economists. Newspapers frequently refer to Japan as
the world’s second largest economy, though its GDP is less than 60% of the Chinese, and some British
politicians continue to believe that their economy is bigger than China’s (3) In this situation, it is highly
desirable that statistical offices be more vigorous in explaining the merits of PPP adjustment and in pushing
for reinvigoration of this work on a worldwide basis.
(iii) Reasons for Worldwide Adoption of Macro-measurement since 1950
The main reason for the massive increase in coverage and quality of official national accounts from
1950 onwards was the realisation of their usefulness as a tool of macroeconomic policy. Denison, Gilbert,
Kaldor, Kuznets, Ruggles, Stone, and others in the UK and USA, knew from personal experience that such
accounts were also an extremely important tool for resource mobilisation in wartime (4)
In the 1950s, Keynesian analysis had a powerful influence on economic policy in many Western
countries and its fundamental concern was with macroeconomic magnitudes (Keynes was the godfather of the
first British accounts created by his pupils, Meade and Stone). Harold Macmillan discovered national accounts
in 1956, when he became Chancellor of the Exchequer. He compared them to a railway timetable, without
which you wouldn’t know when the trains were running.
This new macroeconomic perspective was very different from that of Hayek and Schumpeter. The
latter considered “total output a figment which, unlike the price level, would not as such exist at all, were
there no statisticians to create it. We seem indeed to be faced by a meaningless heap---for most purposes, a
highly inconvenient composite” (Schumpeter, 1939, pp. 484, 561).
The operational significance of national accounts became obvious in OEEC, when Milton Gilbert
became responsible for economic policy analysis from 1955 to 1961, and greatly improved its quality.
National accounts became the bedrock on which analysis of comparative growth performance was based. It
provided a yardstick for assessing the success of policy which had never existed before. We served as the
secretariat for a new Group of Economic Experts which included Otmar Emminger from the Bundesbank,
Etienne Hirsch, head of the French Plan, Jan Tinbergen from the Netherlands, Arthur Burns, chairman of the
US Council of Economic Advisors, and Robert Hall, chief advisor to the UK Treasury. In 1955, Hall
described the significance of their work as follows: “These meetings are really something quite exceptional
for economists and I should think are quite new in the history of the world, in the sense that economic experts,
if they existed at all as Government advisers, were not generally very important people until Keynes's ideas
8
had been commonly accepted in the West. So that there were not the people to meet as we do: now we have 7
or 8 or 9 people who are by and large the chief professional advisers of the main Western Governments --- all
have more or less the same professional training in that they understand how to maintain the level of activity
and what forces operate on it.” (Cairncross, 1991, p.35).
II
Quantifying and Interpreting World Economic Growth in the Capitalist Epoch
Simon Kuznets (1901-85) did more than anyone else to push back the quantitative time horizon
beyond 1950 by promoting the development of historical evidence on “modern” economic growth and
interpreting its driving forces. He revolutionised the analytical scope of economic history by giving it a
quantitative underpinning.
In the 1930s and 1940s, he made a massive scholarly contribution to the macroeconomic history of the
USA (growth and structure of GDP, capital stock, employment, immigration, distribution of income and
foreign trade), and made the first official US national accounts. In the 1950s and 1960s he played a major role
in encouraging construction of similar accounts for other countries. He did this in IARIW sessions, was a
driving force in creating the Yale Growth Center, whose graduate students produced growth studies on
Argentina, Egypt, Korea, Sri Lanka, Taiwan and the USSR, and he chaired a Social Science Research Council
Committee which provided financial support for construction of basic historical accounts for China, France,
Germany and Italy, and a subsequent project on factors influencing economic growth in France, Germany,
Italy, Sweden and the USSR. He synthesised the international evidence on economic growth in four volumes
containing 43 interpretive essays published between 1953 and 1989.
Kuznets spent more than four decades as a university teacher. He convinced many of his distinguished
students, and an international network of scholars, that comparative research in quantitative economic history
was feasible, exciting and important. His persuasive power and influence stemmed mainly from his
professional integrity and depth of scholarship. He was free from partisanship, avoided polemical
confrontations, open to new ideas and willing to comment sympathetically in detail on the work of others. His
influence was reinforced by his style of analysis-use of ideas and concepts that could be clearly expressed in
literary form, implementable with relatively simple statistical techniques.
9
His technique of exposition virtually never made use of algebra or regressions. The approach was
basically inductive. He was a cautious “interpreter” of economic growth, very sensitive to the quality of the
quantitative evidence, and the multilayered complexity of causality. He did not try to “explain” economic
growth with the exactitude to which econometricians and growth accountants often aspire. He stuck to
respectable macroeconomic measures whose scope and significance were clear and well defined. His
estimating procedures were fully and transparently described. He had no time for proxy measures, metaphors,
stylised facts, leading sector analysis, or real wage indicators and was sometimes overly fastidious. However,
he was not averse to what Paul David (1967) called controlled conjectures.
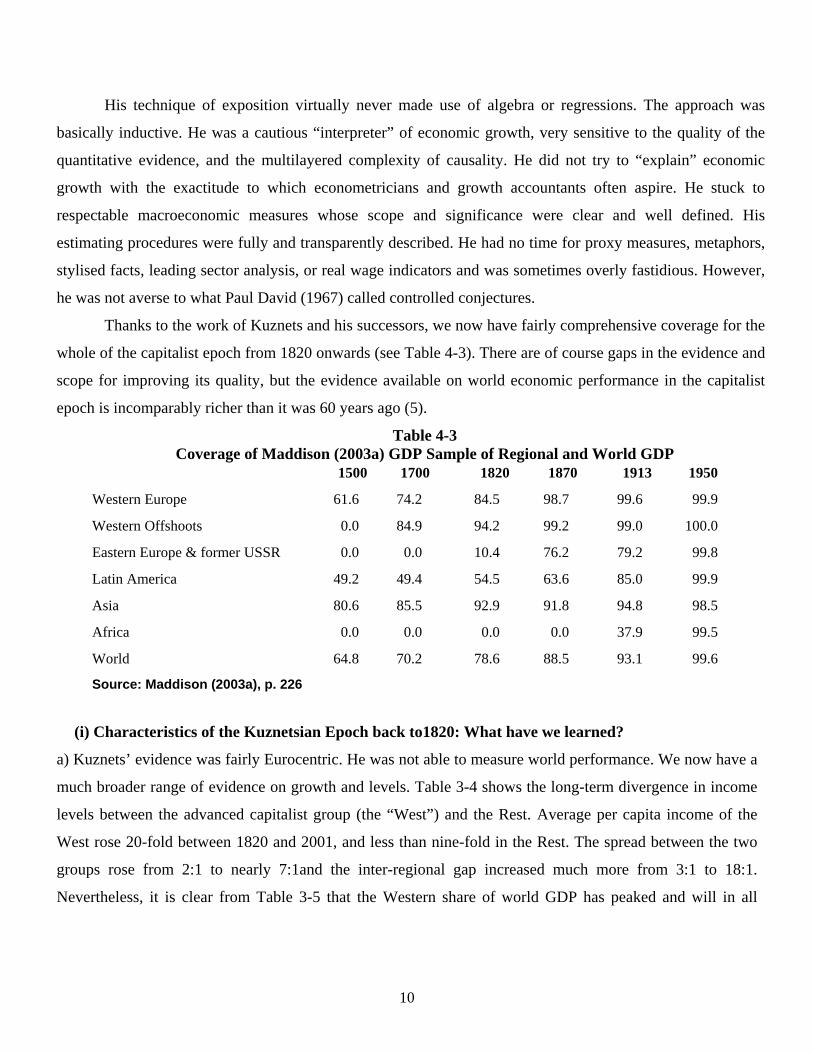
Thanks to the work of Kuznets and his successors, we now have fairly comprehensive coverage for the
whole of the capitalist epoch from 1820 onwards (see Table 4-3). There are of course gaps in the evidence and
scope for improving its quality, but the evidence available on world economic performance in the capitalist
epoch is incomparably richer than it was 60 years ago (5).
Table 4-3 Coverage of Maddison (2003a) GDP Sample of Regional and World GDP
1500 1700 1820 1870 1913 1950
Western Europe 61.6 74.2 84.5 98.7 99.6 99.9
Western Offshoots 0.0 84.9 94.2 99.2 99.0 100.0
Eastern Europe & former USSR 0.0 0.0 10.4 76.2 79.2 99.8
Latin America 49.2 49.4 54.5 63.6 85.0 99.9
Asia 80.6 85.5 92.9 91.8 94.8 98.5
Africa 0.0 0.0 0.0 0.0 37.9 99.5
World 64.8 70.2 78.6 88.5 93.1 99.6
Source: Maddison (2003a), p. 226
(i) Characteristics of the Kuznetsian Epoch back to1820: What have we learned?
a) Kuznets’ evidence was fairly Eurocentric. He was not able to measure world performance. We now have a
much broader range of evidence on growth and levels. Table 3-4 shows the long-term divergence in income
levels between the advanced capitalist group (the “West”) and the Rest. Average per capita income of the
West rose 20-fold between 1820 and 2001, and less than nine-fold in the Rest. The spread between the two
groups rose from 2:1 to nearly 7:1and the inter-regional gap increased much more from 3:1 to 18:1.
Nevertheless, it is clear from Table 3-5 that the Western share of world GDP has peaked and will in all
10
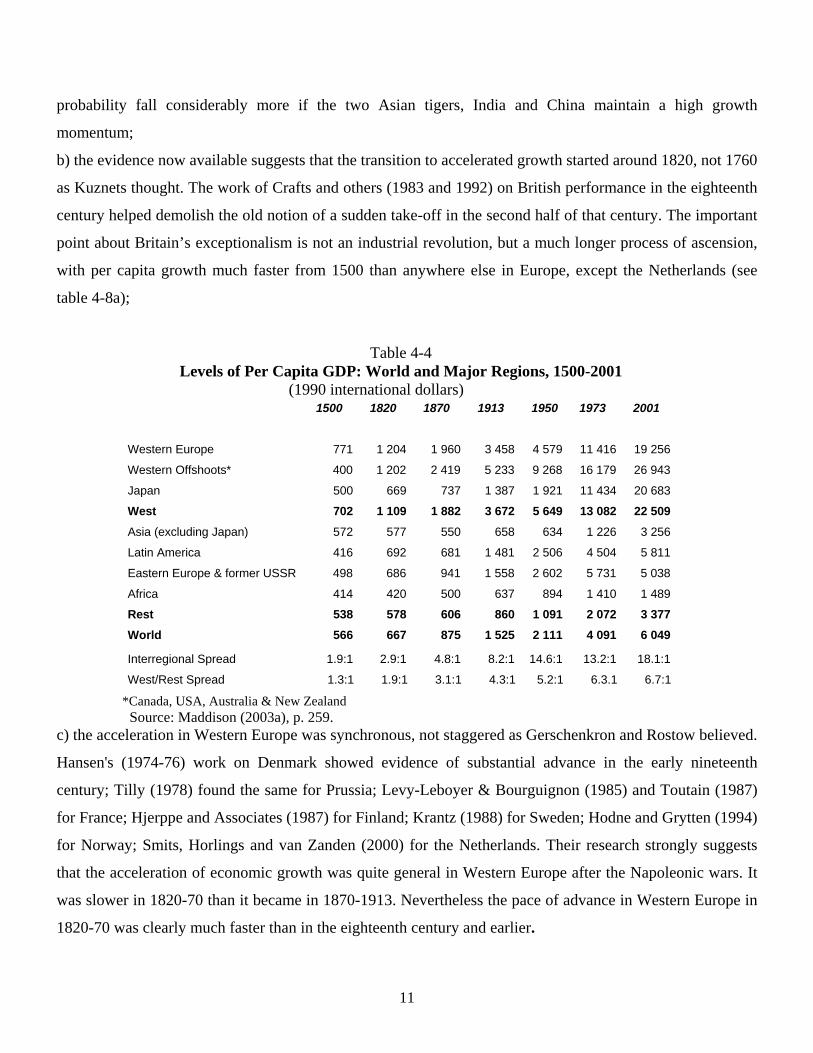
probability fall considerably more if the two Asian tigers, India and China maintain a high growth
momentum;
b) the evidence now available suggests that the transition to accelerated growth started around 1820, not 1760
as Kuznets thought. The work of Crafts and others (1983 and 1992) on British performance in the eighteenth
century helped demolish the old notion of a sudden take-off in the second half of that century. The important
point about Britain’s exceptionalism is not an industrial revolution, but a much longer process of ascension,
with per capita growth much faster from 1500 than anywhere else in Europe, except the Netherlands (see
table 4-8a);
Table 4-4 Levels of Per Capita GDP: World and Major Regions, 1500-2001
(1990 international dollars) 1500 1820 1870 1913 1950 1973 2001
Western Europe 771 1 204 1 960 3 458 4 579 11 416 19 256
Western Offshoots* 400 1 202 2 419 5 233 9 268 16 179 26 943
Japan 500 669 737 1 387 1 921 11 434 20 683
West 702 1 109 1 882 3 672 5 649 13 082 22 509 Asia (excluding Japan) 572 577 550 658 634 1 226 3 256
Latin America 416 692 681 1 481 2 506 4 504 5 811
Eastern Europe & former USSR 498 686 941 1 558 2 602 5 731 5 038
Africa 414 420 500 637 894 1 410 1 489
Rest 538 578 606 860 1 091 2 072 3 377 World 566 667 875 1 525 2 111 4 091 6 049
Interregional Spread 1.9:1 2.9:1 4.8:1 8.2:1 14.6:1 13.2:1 18.1:1
West/Rest Spread 1.3:1 1.9:1 3.1:1 4.3:1 5.2:1 6.3.1 6.7:1
*Canada, USA, Australia & New Zealand Source: Maddison (2003a), p. 259. c) the acceleration in Western Europe was synchronous, not staggered as Gerschenkron and Rostow believed.
Hansen's (1974-76) work on Denmark showed evidence of substantial advance in the early nineteenth
century; Tilly (1978) found the same for Prussia; Levy-Leboyer & Bourguignon (1985) and Toutain (1987)
for France; Hjerppe and Associates (1987) for Finland; Krantz (1988) for Sweden; Hodne and Grytten (1994)
for Norway; Smits, Horlings and van Zanden (2000) for the Netherlands. Their research strongly suggests
that the acceleration of economic growth was quite general in Western Europe after the Napoleonic wars. It
was slower in 1820-70 than it became in 1870-1913. Nevertheless the pace of advance in Western Europe in
1820-70 was clearly much faster than in the eighteenth century and earlier.
11
d) Kuznets (1930) demolished the Kondratieff notion of long cycles and Kuznets (1940) found Schumpeter’s
cyclical schema unacceptable: “The failure to follow articulate methods of time series analysis reduces the
statistical methods to a mere recording of impressions of charts, impressions with which it is often difficult to
agree.” (p. 269) Technical progress did not come in big Schumpeterian waves, but was a smoother more
diffused process: “flowing in a continuous stream, a stream magnified in a constant proportion by the efforts
of imitators” (p. 263). This way of thinking he transmitted to his students, Fogel (1964) and Schmookler
(1966), who gave it fuller articulation.
12
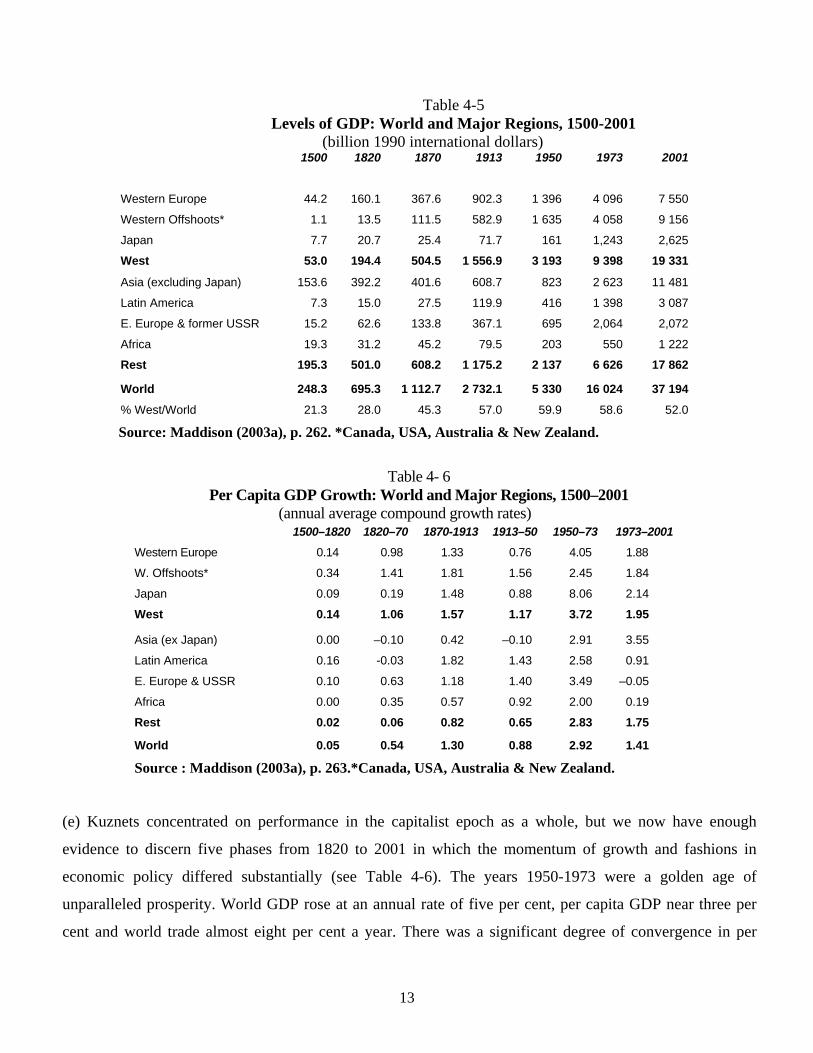
Table 4-5 Levels of GDP: World and Major Regions, 1500-2001
(billion 1990 international dollars) 1500 1820 1870 1913 1950 1973 2001
Western Europe 44.2 160.1 367.6 902.3 1 396 4 096 7 550
Western Offshoots* 1.1 13.5 111.5 582.9 1 635 4 058 9 156
Japan 7.7 20.7 25.4 71.7 161 1,243 2,625
West 53.0 194.4 504.5 1 556.9 3 193 9 398 19 331
Asia (excluding Japan) 153.6 392.2 401.6 608.7 823 2 623 11 481
Latin America 7.3 15.0 27.5 119.9 416 1 398 3 087
E. Europe & former USSR 15.2 62.6 133.8 367.1 695 2,064 2,072
Africa 19.3 31.2 45.2 79.5 203 550 1 222
Rest 195.3 501.0 608.2 1 175.2 2 137 6 626 17 862
World 248.3 695.3 1 112.7 2 732.1 5 330 16 024 37 194
% West/World 21.3 28.0 45.3 57.0 59.9 58.6 52.0
Source: Maddison (2003a), p. 262. *Canada, USA, Australia & New Zealand.
Table 4- 6
Per Capita GDP Growth: World and Major Regions, 1500–2001 (annual average compound growth rates)
1500–1820 1820–70 1870-1913 1913–50 1950–73 1973–2001 Western Europe 0.14 0.98 1.33 0.76 4.05 1.88
W. Offshoots* 0.34 1.41 1.81 1.56 2.45 1.84
Japan 0.09 0.19 1.48 0.88 8.06 2.14
West 0.14 1.06 1.57 1.17 3.72 1.95
Asia (ex Japan) 0.00 –0.10 0.42 –0.10 2.91 3.55
Latin America 0.16 -0.03 1.82 1.43 2.58 0.91
E. Europe & USSR 0.10 0.63 1.18 1.40 3.49 –0.05
Africa 0.00 0.35 0.57 0.92 2.00 0.19
Rest 0.02 0.06 0.82 0.65 2.83 1.75
World 0.05 0.54 1.30 0.88 2.92 1.41
Source : Maddison (2003a), p. 263.*Canada, USA, Australia & New Zealand.
(e) Kuznets concentrated on performance in the capitalist epoch as a whole, but we now have enough
evidence to discern five phases from 1820 to 2001 in which the momentum of growth and fashions in
economic policy differed substantially (see Table 4-6). The years 1950-1973 were a golden age of
unparalleled prosperity. World GDP rose at an annual rate of five per cent, per capita GDP near three per
cent and world trade almost eight per cent a year. There was a significant degree of convergence in per
13
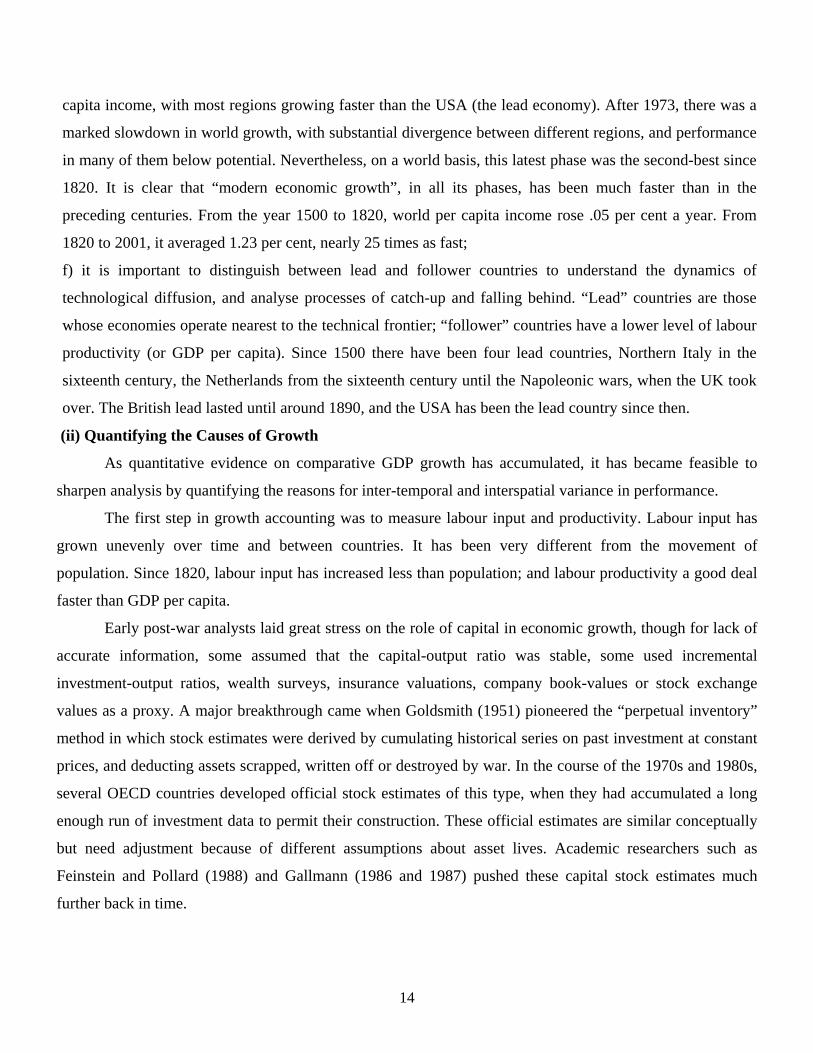
capita income, with most regions growing faster than the USA (the lead economy). After 1973, there was a
marked slowdown in world growth, with substantial divergence between different regions, and performance
in many of them below potential. Nevertheless, on a world basis, this latest phase was the second-best since
1820. It is clear that “modern economic growth”, in all its phases, has been much faster than in the
preceding centuries. From the year 1500 to 1820, world per capita income rose .05 per cent a year. From
1820 to 2001, it averaged 1.23 per cent, nearly 25 times as fast;
f) it is important to distinguish between lead and follower countries to understand the dynamics of
technological diffusion, and analyse processes of catch-up and falling behind. “Lead” countries are those
whose economies operate nearest to the technical frontier; “follower” countries have a lower level of labour
productivity (or GDP per capita). Since 1500 there have been four lead countries, Northern Italy in the
sixteenth century, the Netherlands from the sixteenth century until the Napoleonic wars, when the UK took
over. The British lead lasted until around 1890, and the USA has been the lead country since then.
(ii) Quantifying the Causes of Growth
As quantitative evidence on comparative GDP growth has accumulated, it has became feasible to
sharpen analysis by quantifying the reasons for inter-temporal and interspatial variance in performance.
The first step in growth accounting was to measure labour input and productivity. Labour input has
grown unevenly over time and between countries. It has been very different from the movement of
population. Since 1820, labour input has increased less than population; and labour productivity a good deal
faster than GDP per capita.
Early post-war analysts laid great stress on the role of capital in economic growth, though for lack of
accurate information, some assumed that the capital-output ratio was stable, some used incremental
investment-output ratios, wealth surveys, insurance valuations, company book-values or stock exchange
values as a proxy. A major breakthrough came when Goldsmith (1951) pioneered the “perpetual inventory”
method in which stock estimates were derived by cumulating historical series on past investment at constant
prices, and deducting assets scrapped, written off or destroyed by war. In the course of the 1970s and 1980s,
several OECD countries developed official stock estimates of this type, when they had accumulated a long
enough run of investment data to permit their construction. These official estimates are similar conceptually
but need adjustment because of different assumptions about asset lives. Academic researchers such as
Feinstein and Pollard (1988) and Gallmann (1986 and 1987) pushed these capital stock estimates much
further back in time.
14
I made standardised estimates of fixed non-residential capital for France, Germany, Japan, the
Netherlands, UK and USA in Maddison (1995c) broken down into structures, and machinery. This is a very
pertinent distinction, as the rate of growth of the latter component has been much faster than the former, and
technical progress is probably more rapidly embodied in machinery investment than in structures.
Schultz (1961) suggested that inputs of “human capital” should also be regarded as a factor of
production. The main component he had in mind was the increase in formal education, but improvements in
skill through working with sophisticated equipment, and improvements in health are also relevant. The idea
proved attractive and measures of joint factor productivity were soon constructed in which education was
treated as part of factor input. In growth accounts, the normal procedure is to treat increases in education as
an improvement in labour quality, rather than as an independent factor of production analogous with physical
capital (6). Denison (1962) created expanded growth accounts to explain twentieth-century American
economic performance. In 1967 he applied the technique to explain differences in growth rates and levels of
achievement in eight west European countries and the USA for 1950-64. Denison and Chung (1976)
incorporated Japan into the sample.
Tables 4-7a and -7-b present accounts for the two successive lead countries, the UK and USA, back to
1820, and Japan, the most successful catch-up country, for the whole period of its “modern economic
growth”. The accounts show:
a) A huge increase in the stock of physical capital, significant for non-residential structures, but
sensational for machinery and equipment. The ratio of the latter to GDP rose 16-fold in the UK and USA
between 1820 and 2001, and in Japan from 1890 to 2001. This increase was linked to the acceleration of
technical progress, much of which had to be embodied in machinery;
b) The education level rose eightfold in the UK and more than eleven-fold in the USA and Japan.
This increase in human capital, measured by years of formal educational experience of those in employment
(weighted by the earnings differential associated with years of primary, secondary and tertiary) was also
linked to technical progress. The increasing complexity of production processes required better educated
people to make it operational, and the involvement of educated people in R&D helped institutionalise the
process of innovation.;
c) Labour input per head of population dropped by 45 percent in Japan, nearly 40 percent in the UK
and 20 percent in the USA;
15
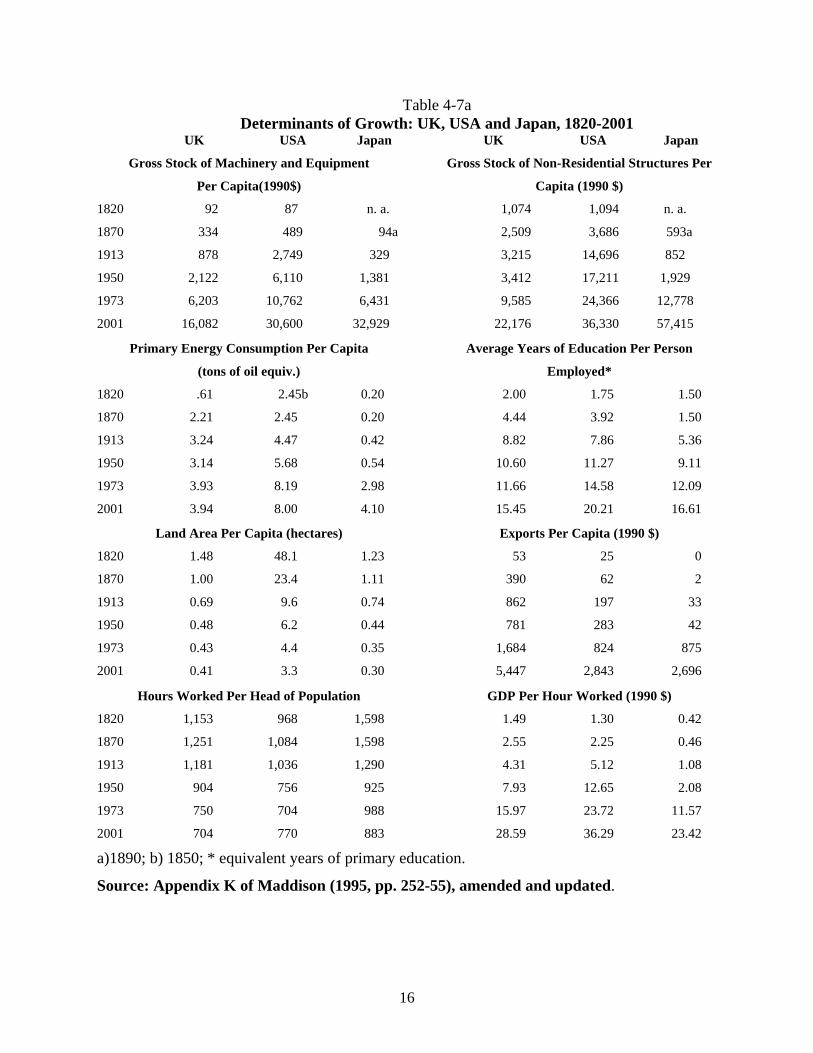
Table 4-7a Determinants of Growth: UK, USA and Japan, 1820-2001
UK USA Japan UK USA Japan
Gross Stock of Machinery and Equipment
Per Capita(1990$)
Gross Stock of Non-Residential Structures Per
Capita (1990 $)
1820 92 87 n. a. 1,074 1,094 n. a.
1870 334 489 94a 2,509 3,686 593a
1913 878 2,749 329 3,215 14,696 852
1950 2,122 6,110 1,381 3,412 17,211 1,929
1973 6,203 10,762 6,431 9,585 24,366 12,778
2001 16,082 30,600 32,929 22,176 36,330 57,415
Primary Energy Consumption Per Capita
(tons of oil equiv.)
Average Years of Education Per Person
Employed*
1820 .61 2.45b 0.20 2.00 1.75 1.50
1870 2.21 2.45 0.20 4.44 3.92 1.50
1913 3.24 4.47 0.42 8.82 7.86 5.36
1950 3.14 5.68 0.54 10.60 11.27 9.11
1973 3.93 8.19 2.98 11.66 14.58 12.09
2001 3.94 8.00 4.10 15.45 20.21 16.61
Land Area Per Capita (hectares) Exports Per Capita (1990 $)
1820 1.48 48.1 1.23 53 25 0
1870 1.00 23.4 1.11 390 62 2
1913 0.69 9.6 0.74 862 197 33
1950 0.48 6.2 0.44 781 283 42
1973 0.43 4.4 0.35 1,684 824 875
2001 0.41 3.3 0.30 5,447 2,843 2,696
Hours Worked Per Head of Population GDP Per Hour Worked (1990 $)
1820 1,153 968 1,598 1.49 1.30 0.42
1870 1,251 1,084 1,598 2.55 2.25 0.46
1913 1,181 1,036 1,290 4.31 5.12 1.08
1950 904 756 925 7.93 12.65 2.08
1973 750 704 988 15.97 23.72 11.57
2001 704 770 883 28.59 36.29 23.42
a)1890; b) 1850; * equivalent years of primary education.
Source: Appendix K of Maddison (1995, pp. 252-55), amended and updated.
16
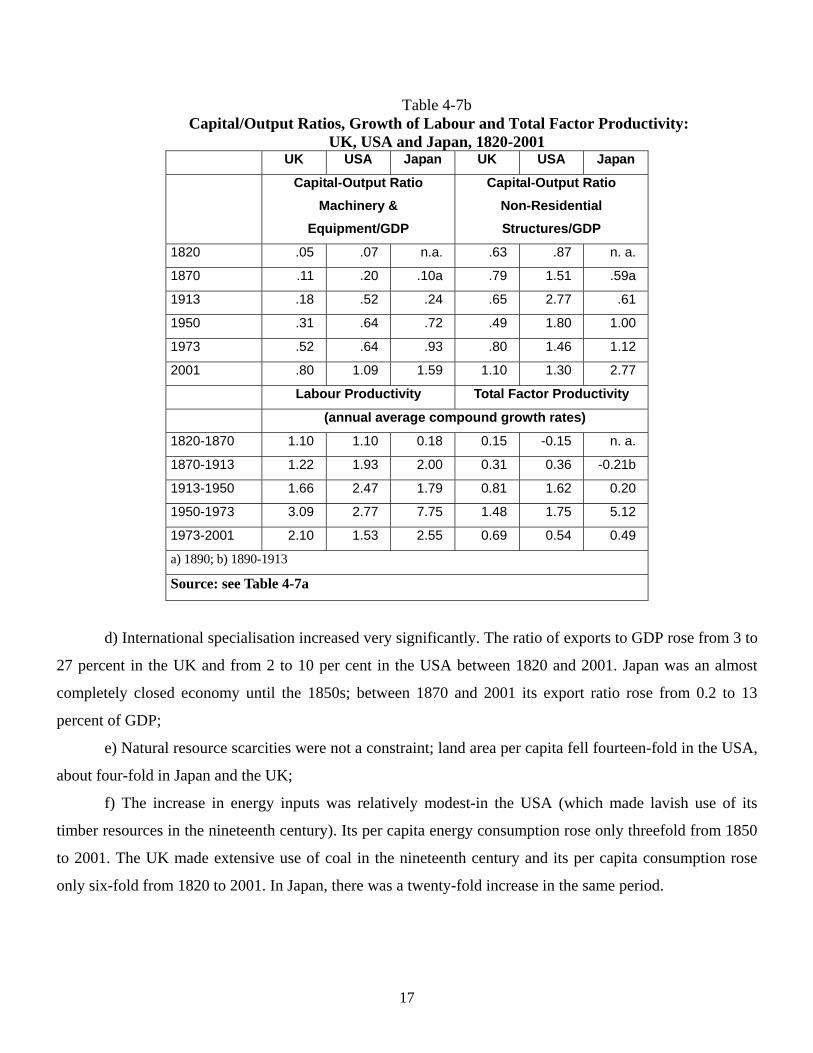
Table 4-7b Capital/Output Ratios, Growth of Labour and Total Factor Productivity:
UK, USA and Japan, 1820-2001 UK USA Japan UK USA Japan
Capital-Output Ratio Machinery &
Equipment/GDP
Capital-Output Ratio Non-Residential Structures/GDP
1820 .05 .07 n.a. .63 .87 n. a.
1870 .11 .20 .10a .79 1.51 .59a
1913 .18 .52 .24 .65 2.77 .61
1950 .31 .64 .72 .49 1.80 1.00
1973 .52 .64 .93 .80 1.46 1.12
2001 .80 1.09 1.59 1.10 1.30 2.77
Labour Productivity Total Factor Productivity
(annual average compound growth rates)
1820-1870 1.10 1.10 0.18 0.15 -0.15 n. a.
1870-1913 1.22 1.93 2.00 0.31 0.36 -0.21b
1913-1950 1.66 2.47 1.79 0.81 1.62 0.20
1950-1973 3.09 2.77 7.75 1.48 1.75 5.12
1973-2001 2.10 1.53 2.55 0.69 0.54 0.49
a) 1890; b) 1890-1913
Source: see Table 4-7a
d) International specialisation increased very significantly. The ratio of exports to GDP rose from 3 to
27 percent in the UK and from 2 to 10 per cent in the USA between 1820 and 2001. Japan was an almost
completely closed economy until the 1850s; between 1870 and 2001 its export ratio rose from 0.2 to 13
percent of GDP;
e) Natural resource scarcities were not a constraint; land area per capita fell fourteen-fold in the USA,
about four-fold in Japan and the UK;
f) The increase in energy inputs was relatively modest-in the USA (which made lavish use of its
timber resources in the nineteenth century). Its per capita energy consumption rose only threefold from 1850
to 2001. The UK made extensive use of coal in the nineteenth century and its per capita consumption rose
only six-fold from 1820 to 2001. In Japan, there was a twenty-fold increase in the same period.
17
III
Economic Performance in the Merchant Capitalist Epoch: 1500-1820
Quantitative investigation for this earlier period has been relatively neglected for three reasons a) it is
clear that growth was much slower than it has been in the last two centuries; b) quantitative evidence is
harder to find, and c) many thought the results would be uninteresting-a long litany of stagnation interrupted
by catastrophe.
(i) Divergent Interpretations of Merchant Capitalist Epoch 1500-1820
There were already two very different views on growth performance at the end of the eighteenth
century. Adam Smith (1776) took a mildly euphoric position and Malthus (1798) was deeply pessimistic.
Positive: Adam Smith (1776), argued that the discovery of the Americas and southern route to Asia opened
up new and significant opportunities for economies of scale and specialisation through international trade.
Though these possibilities were not fully exploited because of mutually hostile trade restrictions, Smith was
mildly euphoric about progress achieved. He did not quantify growth performance explicitly, but arrayed
countries in descending level of achievement: Netherlands, England, France, North American colonies,
Spanish America, China, Bengal and Africa. For him, policy and institutions were a major reason for this
inter-country variance.
Negative: Robert Malthus’ (1798) growth schema had only two factors of production-natural resources
and labour-with no allowance for technical progress, capital formation or gains from international
specialisation. He portrayed the general situation of humanity as one where population pressure put such
strains on the ability of natural resources to produce subsistence that equilibrium was attained only by various
catastrophes-wars, famine, and disease-which brought premature death on a large scale and which he
described as “positive” checks. The only policy measures he envisaged to check catastrophe were
“preventive” checks to lower the birth rate. His influence has been strong and persistent, largely because his
forceful rhetoric and primitive argument appeal to simple minds.
The dichotomy between positive and negative views persists. Kuznets (1965), Landes (1969),
Cipolla (1976), Jones (1981), Jan de Vries (1993 &1994) and Maddison (2001) take a view similar to
Smith’s, but there has been a raft of latter-day pessimists.
LeRoy Ladurie, a French Malthusian (1966 & 1978), thought the French economy was stagnant from
1300 to 1720. “Real wage” pundits are more pessimistic. Phelps Brown and Hopkins (1956) suggested that
English living standards in 1820 were 44 per cent lower than in 1500. Wilhelm Abel (1978) suggested that
such a drop was characteristic for the whole of Western Europe. These judgements were endorsed by
18
Bairoch, Braudel, Wrigley and Schofield, but later they switched sides. A new wave of real wage pessimism
has been launched by Robert Allen (2001) and Jan Luiten van Zanden (1999 & 2002). Allen finds negative
per capita growth for 1500-1820, van Zanden less than half the growth I find (see Appendix 1).
Most of the pessimist literature is Eurocentric, but Susan Hanley (1997) and Kenneth Pomeranz
(2000) claim, respectively, that Japan and China had living standards equal to those in the UK early in the
19th century They imply or suggest that there was no significant European ascension in 1500-1820 (7).
(ii) Nature of the Quantitative Evidence on Economic Performance 1500-1820
In 1965, Kuznets advanced an influential conjecture about the rate of population and per capita GDP
growth in western Europe from the end of the fifteenth to the second half of the eighteenth century. Judging
from the demographic evidence then available (Carr-Saunders, 1936 and Urlanis, 1941), the work of Deane
and Cole (1962) on British per capita income growth in the eighteenth century, and adjusting for the
likelihood of better-than average performance in the UK, which had also had faster demographic advance, he
“set the possible (and perhaps maximum) long-term growth in per capita product for 1500-1750 in
developed countries of Western Europe at about 0.2 per cent per year” (Kuznets, 1973, p. 139). He felt that a
higher rate was unlikely as the 1750 level was low, and that a lower growth rate was plausible. Kuznets did
not advance a conjecture about growth rates in the rest of the world, but he clearly thought that they were
lower than in western Europe, and that their 1750 level was lower than that in Europe.
Maddison (2001) involved a major effort to test the Kuznets’ conjecture and muster quantitative
evidence on world economic performance before 1820, as summarised below:
a) for western Europe: I encouraged other researchers to extend their time horizon backward by interactive
networking of the type which proved so fruitful in building up evidence for 1820 onwards. Between 1985 and
1994, I organized six workshops on quantitative economic history (two at the University of Groningen, two at
IARIW conferences, and two at sessions of the International Economic History Association).
Most of the papers involved exploration of pre-modern growth in Western Europe and the evidence
was mainly from production and expenditure side.. As can be seen in Table 4-8a, the estimates show per
capita growth averaging 0.14% a year between 1500-1820, significantly slower than Kuznets’ (1965)
hypothesised. Details of the estimation procedure and the conjectures used to fill gaps in the GDP database
are shown in Maddison (2001), Appendix B.
19
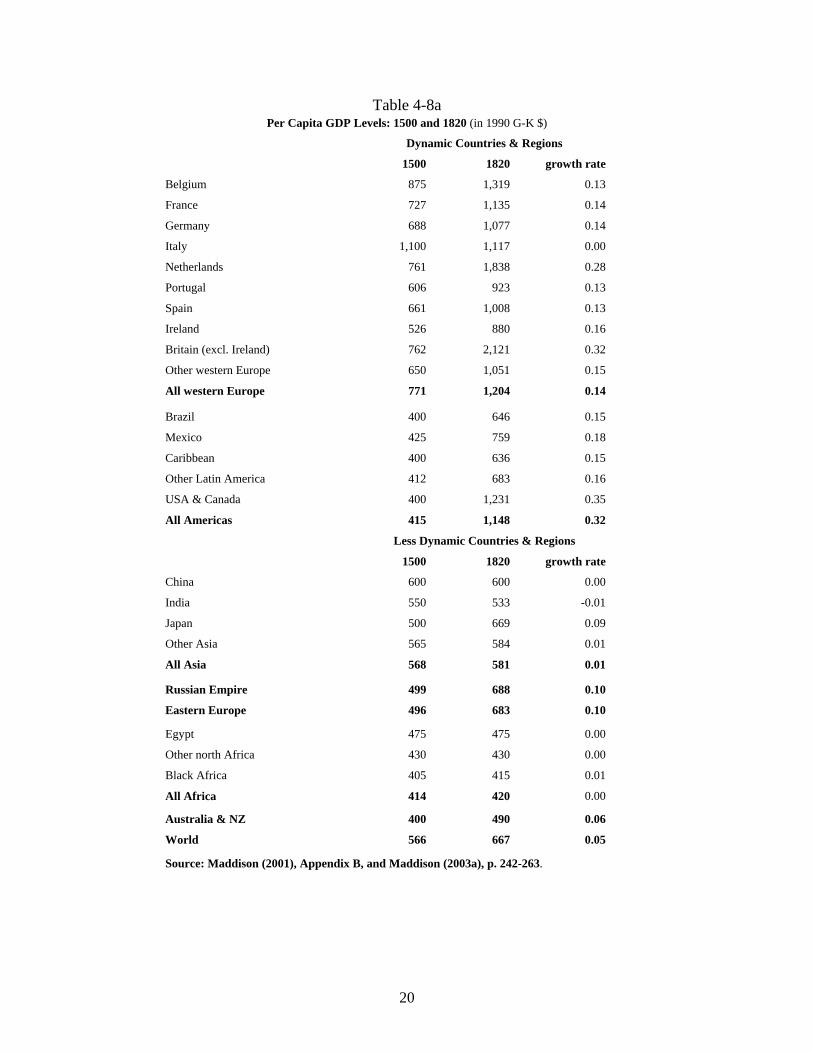
Table 4-8a Per Capita GDP Levels: 1500 and 1820 (in 1990 G-K $)
Dynamic Countries & Regions
1500 1820 growth rate
Belgium 875 1,319 0.13
France 727 1,135 0.14
Germany 688 1,077 0.14
Italy 1,100 1,117 0.00
Netherlands 761 1,838 0.28
Portugal 606 923 0.13
Spain 661 1,008 0.13
Ireland 526 880 0.16
Britain (excl. Ireland) 762 2,121 0.32
Other western Europe 650 1,051 0.15
All western Europe 771 1,204 0.14
Brazil 400 646 0.15
Mexico 425 759 0.18
Caribbean 400 636 0.15
Other Latin America 412 683 0.16
USA & Canada 400 1,231 0.35
All Americas 415 1,148 0.32
Less Dynamic Countries & Regions
1500 1820 growth rate
China 600 600 0.00
India 550 533 -0.01
Japan 500 669 0.09
Other Asia 565 584 0.01
All Asia 568 581 0.01
Russian Empire 499 688 0.10
Eastern Europe 496 683 0.10
Egypt 475 475 0.00
Other north Africa 430 430 0.00
Black Africa 405 415 0.01
All Africa 414 420 0.00
Australia & NZ 400 490 0.06
World 566 667 0.05
Source: Maddison (2001), Appendix B, and Maddison (2003a), p. 242-263.
20
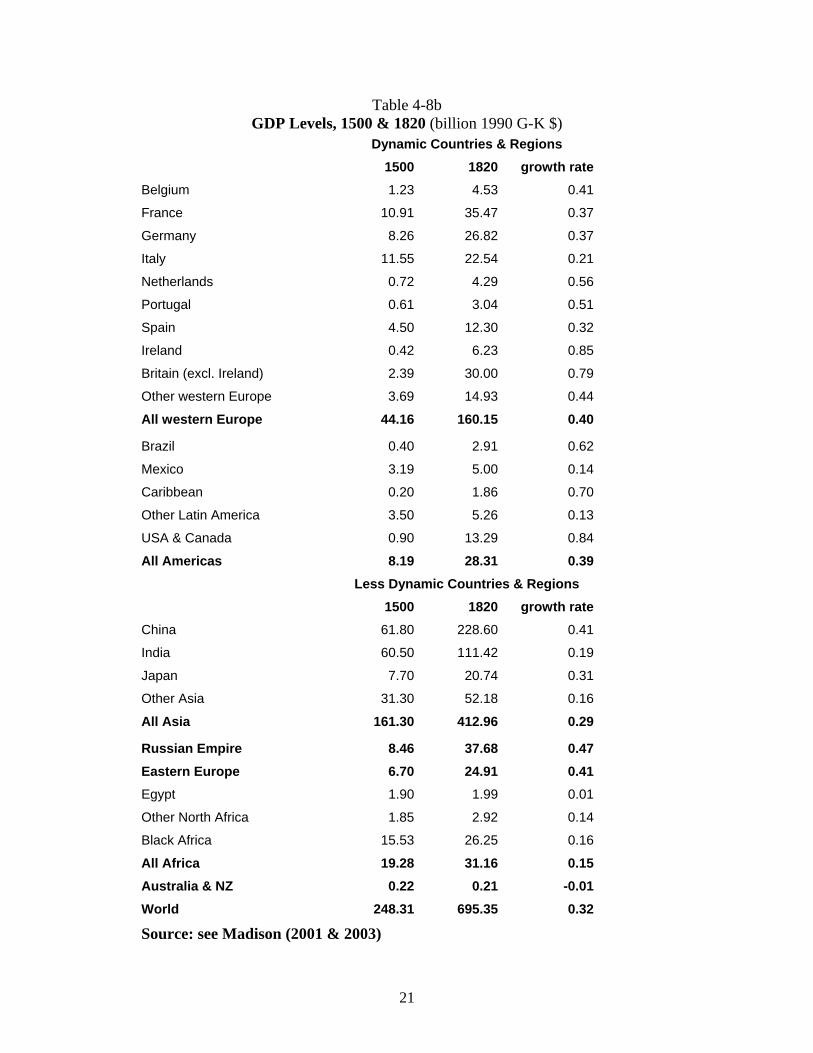
Table 4-8b GDP Levels, 1500 & 1820 (billion 1990 G-K $)
Dynamic Countries & Regions 1500 1820 growth rate Belgium 1.23 4.53 0.41
France 10.91 35.47 0.37
Germany 8.26 26.82 0.37
Italy 11.55 22.54 0.21
Netherlands 0.72 4.29 0.56
Portugal 0.61 3.04 0.51
Spain 4.50 12.30 0.32
Ireland 0.42 6.23 0.85
Britain (excl. Ireland) 2.39 30.00 0.79
Other western Europe 3.69 14.93 0.44
All western Europe 44.16 160.15 0.40
Brazil 0.40 2.91 0.62
Mexico 3.19 5.00 0.14
Caribbean 0.20 1.86 0.70
Other Latin America 3.50 5.26 0.13
USA & Canada 0.90 13.29 0.84
All Americas 8.19 28.31 0.39 Less Dynamic Countries & Regions 1500 1820 growth rate China 61.80 228.60 0.41
India 60.50 111.42 0.19
Japan 7.70 20.74 0.31
Other Asia 31.30 52.18 0.16
All Asia 161.30 412.96 0.29
Russian Empire 8.46 37.68 0.47 Eastern Europe 6.70 24.91 0.41 Egypt 1.90 1.99 0.01
Other North Africa 1.85 2.92 0.14
Black Africa 15.53 26.25 0.16
All Africa 19.28 31.16 0.15 Australia & NZ 0.22 0.21 -0.01 World 248.31 695.35 0.32
Source: see Madison (2001 & 2003)
21
Thanks to the work of modern demographic historians, the quality and coverage of estimates of
population levels and movement have been greatly improved, and also yield useful corroborative evidence on
changes in urbanisation and life expectation-where European exceptionalism is clear.
Jan de Vries (1984, 1993 & 1994) made a major contribution to analysis of this period in three
dimensions: the comparative study of European urbanisation; the changing structure of European
expenditure patterns; and the demonstration that in this period per capita labour inputs rose, and productivity
grew more slowly than per capita income. He called this latter phenomenon an “industrious” revolution, in
contrast to the long-term trend to reduced working hours in the course of the nineteenth and twentieth
centuries.
b) for the USA & Canada; Australia & New Zealand; Brazil & Mexico, I adopted what Noel Butlin
(1986) called a “multicultural” estimate, making separate estimates for the indigenous population, slaves,
and white settlers. For the first two groups I used a stylised per capita income for 1500 of $400 intended to
represent an income at near-subsistence level.
c) for the Caribbean, with its highly specialised export economies, I based the estimates on commodity
production and exports. For the Americas as a whole, per capita GDP growth was faster than in western
Europe.
d) for Africa, there was a sharp division north and south of the Sahara. Egypt’s production potential was
favoured because of the Nile provided a regular and abundant water supply and an easily navigable transport
route. The Maghreb had a higher degree of urbanisation and literacy, more sophisticated economic and
political institutions, and a greater participation in international trade than black Africa. In spite of losses due
to the slave trade, demographic expansion was faster in black Africa, because agriculturalists were replacing
hunter-gatherers, and had new crops-maize and manioc from the Americas.
e) For China, India and Japan, the estimates are based on production, expenditure patterns, and
demographic evidence. Japanese per capita performance was better than Chinese or Indian, but for Asia as a
whole, income levels were stagnant. It is clear however, that China had “extensive” growth in this period. It
sustained a large increase in population, without a fall in living standards, and its GDP growth rate was as the
same as that of western Europe.
China: China had a strong physiocratic bureaucracy which kept printed records on population and
agricultural performance back to the ninth century. There is also a great deal of scholarly work which I used
in Maddison (1998). This includes Needham (1954-97 and 1970) on the development of Chinese technology,
Ho (1959) on Chinese demography, the interpretative analysis of Balazs (1931-33), Elvin (1973) on the
22
economic history of the Tang and Sung dynasties, and Perkins (1969) on agricultural development from
1368. Grain output rose about fivefold from 1400 to 1820-in line with population. The cultivated area rose
threefold and yields about 80 per cent. Ester Boserup (1965) demonstrated that this was achieved by
increased labour inputs per capita, and more intensive use of land by double-cropping, improved seeds,
fastidious collection and application of manure and the introduction of new crops from the Americas.
Rozman’s (1973) analysis of the demographic records shows no significant change in the relative size of the
urban population over this period. Earlier, it is clear that that China did experience a growth in per capita
agricultural output and GDP in the Sung dynasty (960-1280).
India: Maddison (1971) contained an analysis of the social structure and institutions of the Moghul
empire and the British raj. For the Moghul period, I relied heavily on the economic survey made by Abul
Fazl for the emperor Akbar in the sixteenth century (see Jarrett and Sarkar, 1949). Between 1600 and the
1860s, the quantitative evidence is not so good, but the two leading historians of Moghul India, Irfan Habib
and Shireen Moosvi (at Aligarh Muslim University), adduce evidence which led them to conclude, I think
rightly, that there was some decline in per capita income after the collapse of the Moghul Empire and the
takeover by the East India Company.
Japan modelled its economy, society, literature and institutions on China from the seventh century.
The official commitment to catch up with the West started in 1867, but the Chinese model was abandoned in
the eighteenth century, at about the time Japan had caught up with China. In 1720 the shogun lifted the ban
on European books, and translations of Dutch learning (rangaku) had a significant impact in transmitting
knowledge of European science and technology. (see Maddison, 2001, pp. 204-206 and 252-260).
(iii) Proximate Causes of Growth in the Merchant Capitalist Epoch
In analysing the causes of growth in the merchant capitalist period, it is not possible to present the
same kind of growth accounts as in Tables 7a and 7b. However, Boserup (1965) and de Vries (1994) have
shown that labour input per head of population increased in this period, instead of declining, as it did later.
We also know that there was a big increase in capital formation in shipping, an improvement in human capital
and knowledge. It is clear that the process of globalisation was very important.
a) International Trade: dramatic progress in western shipping and navigation permitted a 20-fold
increase in world trade between 1500 and 1820. It brought gains from specialization of the type stressed by
Adam Smith. It provided European consumers with new products-tea, coffee, cacao. sugar, potatoes, tobacco,
porcelain, silk and cotton textiles. In relative terms this globalisation process was a more important
component of growth in these centuries than in the twentieth. European countries were also able to extract a
23
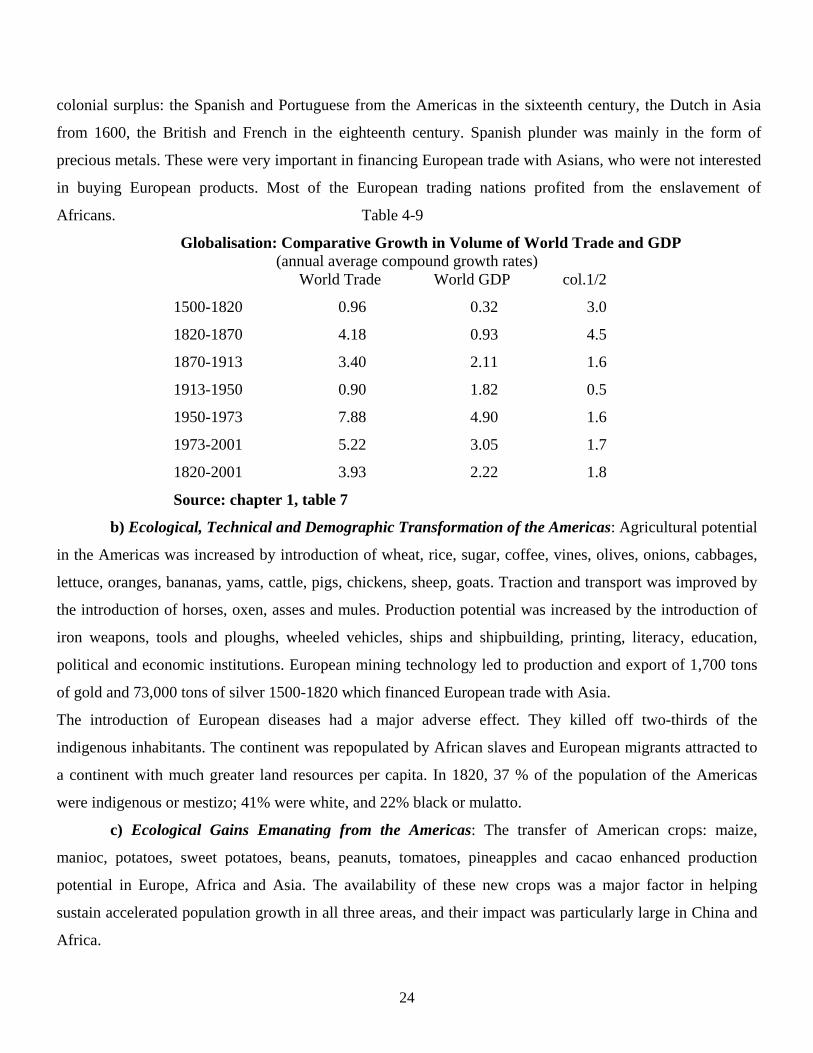
colonial surplus: the Spanish and Portuguese from the Americas in the sixteenth century, the Dutch in Asia
from 1600, the British and French in the eighteenth century. Spanish plunder was mainly in the form of
precious metals. These were very important in financing European trade with Asians, who were not interested
in buying European products. Most of the European trading nations profited from the enslavement of
Africans. Table 4-9
Globalisation: Comparative Growth in Volume of World Trade and GDP (annual average compound growth rates)
World Trade World GDP col.1/2
1500-1820 0.96 0.32 3.0
1820-1870 4.18 0.93 4.5
1870-1913 3.40 2.11 1.6
1913-1950 0.90 1.82 0.5
1950-1973 7.88 4.90 1.6
1973-2001 5.22 3.05 1.7
1820-2001 3.93 2.22 1.8
Source: chapter 1, table 7
b) Ecological, Technical and Demographic Transformation of the Americas: Agricultural potential
in the Americas was increased by introduction of wheat, rice, sugar, coffee, vines, olives, onions, cabbages,
lettuce, oranges, bananas, yams, cattle, pigs, chickens, sheep, goats. Traction and transport was improved by
the introduction of horses, oxen, asses and mules. Production potential was increased by the introduction of
iron weapons, tools and ploughs, wheeled vehicles, ships and shipbuilding, printing, literacy, education,
political and economic institutions. European mining technology led to production and export of 1,700 tons
of gold and 73,000 tons of silver 1500-1820 which financed European trade with Asia.
The introduction of European diseases had a major adverse effect. They killed off two-thirds of the
indigenous inhabitants. The continent was repopulated by African slaves and European migrants attracted to
a continent with much greater land resources per capita. In 1820, 37 % of the population of the Americas
were indigenous or mestizo; 41% were white, and 22% black or mulatto.
c) Ecological Gains Emanating from the Americas: The transfer of American crops: maize,
manioc, potatoes, sweet potatoes, beans, peanuts, tomatoes, pineapples and cacao enhanced production
potential in Europe, Africa and Asia. The availability of these new crops was a major factor in helping
sustain accelerated population growth in all three areas, and their impact was particularly large in China and
Africa.
24
(iv) Intellectual and Institutional Changes underlying Western Ascension
Looking beyond the proximate and measurable elements of causality, we can discern four intellectual
and institutional changes which were important in Western economic ascension and which had no counterpart
elsewhere.
a) Development of Secular Knowledge and Science: From about 1500 there is evidence of a new
awareness of human capacity to transform the forces of nature through rational investigation and experiment.
The first European university was created in Bologna in 1080. By 1500 there were 70 such centres of secular
learning in Western Europe (see Goodman and Russell, 1991, p. 25). Until the mid-fifteenth century, most of the
instruction was oral, and the learning process was similar to that in ancient Greece. Things changed after
Gutenberg printed his first book in Mainz in 1455. By 1500 220 printing presses were in operation throughout
Western Europe and had produced eight million books (see Eisenstein, 1993, pp.13-17). The productivity of
universities and their openness to new ideas was greatly enlarged.
Venetian publishers regularly had a print-run of 1,000 copies or more. By the middle of the sixteenth
century, they had produced some 20,000 titles, including music scores, maps, books on medical matters, and a
flood of new secular learning. Before printing, books were cherished for their artistic or iconic value, and their
content mainly reflected the wisdom and dogma of the past. Printing made books much cheaper. Publishers
were much more willing to risk dissemination of new ideas and to provide an outlet for new authors. The
proportion of the population with access to books was greatly increased, and there was a much greater
incentive to acquire literacy. With the exception of China, the European printing revolution had no counterpart
in most other parts of the world until the beginning of the nineteenth century. The major difference between
Europe and China was the competitive character of European publishing, and the international trade in books.
Fundamental changes in intellectual horizons occurred between the sixteenth and seventeenth centuries,
when medieval notions of an earth-centred universe were abandoned. Thanks to the Renaissance, the seventeenth
century scientific revolution and the eighteenth century enlightenment, Western elites gradually abandoned
superstition, magic, and submission to religious authority. The scientific approach gradually impregnated the
educational system. Circumscribed horizons were abandoned. A Promethean quest for progress was unleashed.
The impact of science was reinforced by the creation of scientific academies and observatories which
inaugurated empirical research and experiment. Systematic recording of experimental results and their
diffusion in written form were a key element in their success.
b) Emergence of an Urban Bourgeoisie and Protection of Property Rights: In the eleventh and
twelfth centuries, important urban trading centres emerged in Flanders and Northern Italy with autonomous
25
property rights. This fostered entrepreneurship and abrogated feudal constraints on the purchase and sale of
property. Development of accountancy helped make contracts enforceable. New financial institutions and
instruments provided access to credit and insurance, facilitated risk assessment and large scale business
organisation.
c) Changes in the Nature of the Family, Marriage and Inheritance: Adoption of Christianity as a
state religion in 380 AD led to basic changes in nature of European marriage, inheritance and kinship. The
Papacy imposed a pattern which was dramatically different from that prevailing earlier in Greece, Rome and
Egypt and later in the Islamic world. Marriage was to be strictly monogamous, with a ban on concubinage,
adoption, divorce, remarriage of widows or widowers, consanguineous marriage with siblings, ascendants,
descendants, including first, second, and third cousins, or relatives of siblings by marriage. A Papal decision in
AD 385 imposed priestly celibacy. The primary intention of the new regime was to channel assets to the
church which became a property owner on a huge scale, but it had much wider ramifications. Inheritance
limited to close family members and widespread adoption of primogeniture broke down loyalties to clan, tribe
or caste, promoted individualism and accumulation, and reinforced the sense of belonging to a nation state (see
Goody, 1983 and Lal, 2001).
d) Emergence of a system of Nation States: A fourth distinctive feature was the emergence of a
system of nation-states in close propinquity, with significant trading relations and relatively easy intellectual
interchange in spite of linguistic differences. This benign fragmentation stimulated competition and innovation.
Migration to or refuge in a different culture and environment were options open to adventurous and innovative
minds. Mercantilist commercial policies of the leading European countries were mutually discriminatory and
restrictive, and often led to wars. However, the balance of advantage lay with Europe, if one compares their
regime with that of the Ottoman, Moghul or Chinese empires.
IV
The Roots of Modernity, “Takeoff” or Long Apprenticeship?
Having considered the quantitative evidence on macroeconomic performance in the epochs of modern
economic growth and merchant capitalism, and the differences in the driving forces which determined their
growth momentum, it is useful to consider the nature of the transition between merchant capitalism and
modern economic growth. There is in fact a sharp divergence of views on the “roots of modernity”, which
echoes the divergence already noted between the Smithian and Malthusian interpretations of what happened
in the merchant capitalist epoch.
26
a) Sudden“Takeoff”
There is a school of thought which attributes modern economic growth to an “industrial revolution”
in Manchester, preceded by centuries of Malthusian stagnation. The metaphor was first popularised by
Arnold Toynbee in 1884, and has continuing resonance, e.g. in Rostow’s (1960) “take-off”, and Mokyr’s
(2002) history of technology: “most techniques before 1800 emerged as a result of chance
discoveries…Before the industrial revolution the economy was subject to negative feed back…..the best
known of these negative feedback mechanisms are Malthusian traps.” (pp. 31-32). Nordhaus (1997) and
DeLong (1998) overdosing on hedonics, have constructed fairytale scenarios which greatly exaggerate
progress since 1800, before which they seem to believe that people lived like cavemen (see Appendix 3).
These views are fundamentally wrong.
b) or Long Apprenticeship?
In 1500, Western Europe already had 70 universities. Education and diffusion of knowledge were
revolutionised by printing. Venetian publishers regularly had a print-run of 1,000 copies or more. By mid
16th century, they had produced 20,000 titles, with a flood of new secular learning. Forty years earlier, a
scribe would have taken a year to produce one volume.
By the end of the eighteenth century, great progress had been made in the design of ships and
rigging, in gunnery, in meteorological and astronomical knowledge and in the precision of navigational
instruments. Mariners acquired logarithmic tables, sextants, naval almanacs and accurate watches. Maps
were enormously improved and supplemented by detailed coastal surveys, knowledge of winds and currents.
Sailing had become safer, the duration of voyages more predictable, the incidence of shipwreck had fallen,
disease mortality was greatly reduced on long voyages.
These changes were the result of scientific endeavour. In 1543 Copernicus rejected the notion that
the earth was the centre of the universe. Kepler and Galileo made detailed observation of celestial bodies, the
nature and mutability of their orbits. Newton in 1687 showed that the whole universe was subject to the laws
of motion and gravitation. Progress in astronomy and physics was accompanied by major advances in
mathematics and design of telescopes, microscopes, micrometers, thermometers, barometers, air pumps,
clocks and watches and the steam engine.
These developments in Europe were an essential prelude to the much faster economic development
that occurred in the 19th and 20th centuries. They had no counterpart elsewhere.
27
Endnotes (1) OEEC experimented with an alternative technique, measuring comparative performance levels
from the production side (see Paige and Bombach, 1959). This approach is particularly useful in comparisons of productivity. It has been neglected by international agencies, but I have made and promoted estimates of this kind for a large number of countries. Maddison (1970) was a comparative survey of growth experience in the six biggest OECD countries, the USSR and 22 developing countries for 1870-1968 representing about 75 per cent of world GDP. The biggest statistical challenge was the absence of comparative measures of GDP levels at that time. I constructed benchmark estimates for 1965, with measurement of real value added by sector at US prices. Output of farm, fishery, and forestry products was derived from detailed FAO data, with deduction of feed seed and non-farm inputs. For mining, manufacturing and utilities, I used Shinohara (1966). He had a sample of 70 commodities, weighted by value added derived from the US Census of Manufactures. For services, direct measurement was not possible, so I used estimates of employment and a conjectured level of labour productivity, assumed to be related systematically to that in the commodity sector (i.e. agriculture plus industry). In Maddison (1998a), I used the industry-of-origin approach to make a much more elaborate comparison of the Chinese GDP level in 1990 compared with that of the USA. Maddison (1983) was a confrontation of the Maddison (1970) results, by the product method, with the expenditure estimates of Kravis, Heston and Summers (1982). For the advanced countries, my results were on average about 4 per cent lower. For developing countries the divergence was much bigger. The expenditure approach yielded per capita GDPs averaging 16.7% of the USA, the product method 11.3%. The difference arose primarily from the treatment of comparison-resistant services. For teachers and civil servants, they assumed average labour productivity in developing countries to be about the same as in the USA, whereas my average was one third of the US level. When I returned to academic life, I set up the ICOP programme (International Comparisons of Output and Productivity) at the University of Groningen in 1983. It has since produced more than 80 research papers, a dozen Ph. D. theses, and established a world-wide network of researchers in this field. The overall results of the ICOP project are surveyed in Maddison and van Ark (2002). The only whole-economy results as yet available on an ICOP basis are for Brazil, Mexico, Korea, Japan and the United States for 1975. The average per capita GDP for these 4 countries relative to the USA was 34.8 per cent for the ICOP measure against 36.9 for ICP, a much smaller discrepancy than I found in my 1983 confrontation. However, confrontation/reconciliation of the two methods needs to be done more rigorously and for a larger number of countries.
(2) See http://www.pwt.econ.upenn.edu/(3) Christopher Patten, the last British governor of Hong Kong, stated in an article in the Economist
newspaper of 4th January 1997 that “Britain’s GDP today is almost twice the size of China’s”. If he had been briefed on PPP converters, he might have said that Britain’s GDP was one third the size of the Chinese.
(4) Kaldor (1946) concluded that “Germany made no serious attempt to exploit her own war potential fully, except for a brief period in August and September 1944, when it was too late to be of any consequence”. Galbraith (1971) made the same point. Kaldor’s analysis was drawn from material gathered as a staff member of the US Strategic Bombing Survey (1945), and interrogation of Karl Otto Saur, Albert Speer’s deputy in the Armaments Ministry. The survey team was directed by Galbraith, and included Paul Baran, Ed Denison, Burton Klein, and Tibor Scitovsky (under the nom-de-guerre “Thomas Dennis”). Kaldor and Scitovsky interrogated Saur in Austria, the day the war ended (see Scitovsky, 1999). He indicated where they could find the wartime production records, and they whisked them away just before the Russians arrived. Denison and Haraldson made a detailed estimate of German GNP, 1936-44, to put military mobilization in perspective. Richard Ruggles served with the US Office of Strategic Services in London, inferred German production of tanks, trucks, and planes by decoding information on serial numbers of captured equipment (see Tobin, 2001). Stone worked with British intelligence and predicted the date of Italian entry in the war, by tracking
28
movement of ships in the Mediterranean. Kuznets used national accounting to help organise the massive expansion of US military output in the Planning Committee of the War Production Board (see Kapuria-Foreman and Perlman 1995, with help from Moe Abramovitz. The moral of this digression is that the initial stage in construction of national and historical accounts is not a boring bureaucratic business. It requires detective work and imagination, and can be as exciting as the adventures of Sherlock Holmes.
(5) Colin Clark (1940) had estimates (some of them very rough) of GDP growth for 16 countries, with an average coverage of 19 years for the period since 1820. We now have historical accounts for a much wider range of countries and for these 16 countries we have better quality accounts for an average of 151 years. At that time there were only ten countries with some kind of official national accounts. In 2001 there were 179 countries producing official estimates, using standardised SNA guidelines.
(6) Estimation of the stock of human capital is analogous to the procedure for physical capital. A useful starting point is scrutiny of successive population censuses where respondents report the age at which their formal education ended (see estimates for 19 countries by gender and age-cohort in OECD, 1975, vol. 1, pp. 31-108). These can be updated by annual cumulation of increments to the stock, (see annual school enrolment in OECD, Education at a Glance and its predecessor volumes), and deduction for people who retire from the labour force. The value of the stock can be derived from estimates of earnings of people with primary, secondary and higher education (see Psacharopoulos, 1975). This is the procedure I used in growth accounts for advanced OECD countries (see Maddison, 1987) and for 22 developing counties (Maddison, 1970, pp.45-50).
(7) Kenneth Pomeranz (2000) asserted that China was ahead of Europe until 1800. He suggests that Western Europe was “a non-too-unusual economy: it became a fortunate freak only when unexpected and significant discontinuities in the late eighteenth and especially nineteenth centuries enabled it to break through the fundamental constraints of energy and resource availability that had previously limited everyone’s horizons”. I explained my disagreement at length in Maddison (2003, pp. 248-251). Hanley had a similar view about Japan, see my comment in Maddison (1999). Appendix 1 Real Wage Revivalists-Robert Allen and Jan Luiten van Zanden
In an extensive review of Maddison (2001), Giovanni Federico (2002) suggested that I may have
exaggerated West European performance in the merchant capitalist epoch, citing alternative estimates of
Robert Allen which imply that aggregate West European income per capita actually fell in this period, and
those of Jan Luiten van Zanden which imply a growth rate of only 0.06 per cent a year. I do not regard their
gloomier conclusions as an effective challenge to my estimates for the reasons explained below.
Allen (2001) presents real wage estimates for Europe, 1500-1913. He shows nominal wages (in grams
of silver per day) for building craftsmen and labourers in 18 European towns, and consumer price indices
based on 12 items, two-thirds of which were bread, beer and meat. The results are presented for fifty-year
time segments. His basic data are for daily wages, which he converts to an annual basis by assuming a
working year of 250 days (this multiplier was apparently applied uniformly to his inter-temporal and cross-
country data). For the 14 towns where he has results for craftsmen for both 1500-49 and 1750-99, the average
real wage in the latter period was 66 per cent of that in 1500-49, London was the only case where the real
wage was higher, with a rise of less than 1 percent. In the 12 towns for which he had results for building
29
labourers for the two periods, there was a rise of about 3 per cent in Amsterdam and a fall everywhere else.
The average real wage for labourers was 76 percent of the 1500-49 level in the end period (p. 428). This is
less gloomy than Phelps Brown, but the clear implication is that living standards in western Europe declined
substantially from 1500 to 1800. Allen (2000) was “an exercise in historical reconstruction based on simple
economic theory” which presented estimates of the movement in agricultural output per capita for nine
countries for 1500-1800. He shows a fall in all nine countries between these two points of time, and in most
cases they are very substantial. For England, he shows a 32 per cent drop (see p. 19). This is very different
from Wrigley’s estimate that English agricultural output per capita doubled in the shorter period 1600 to
1800. It also differs substantially from the estimates presented by van Zanden and Horlings (1999, p. 28).
Allen does not measure agricultural output directly. He derives it econometrically from his estimates of
occupational structure and the assumption that his real wage measures are a valid proxy for total output per
capita.
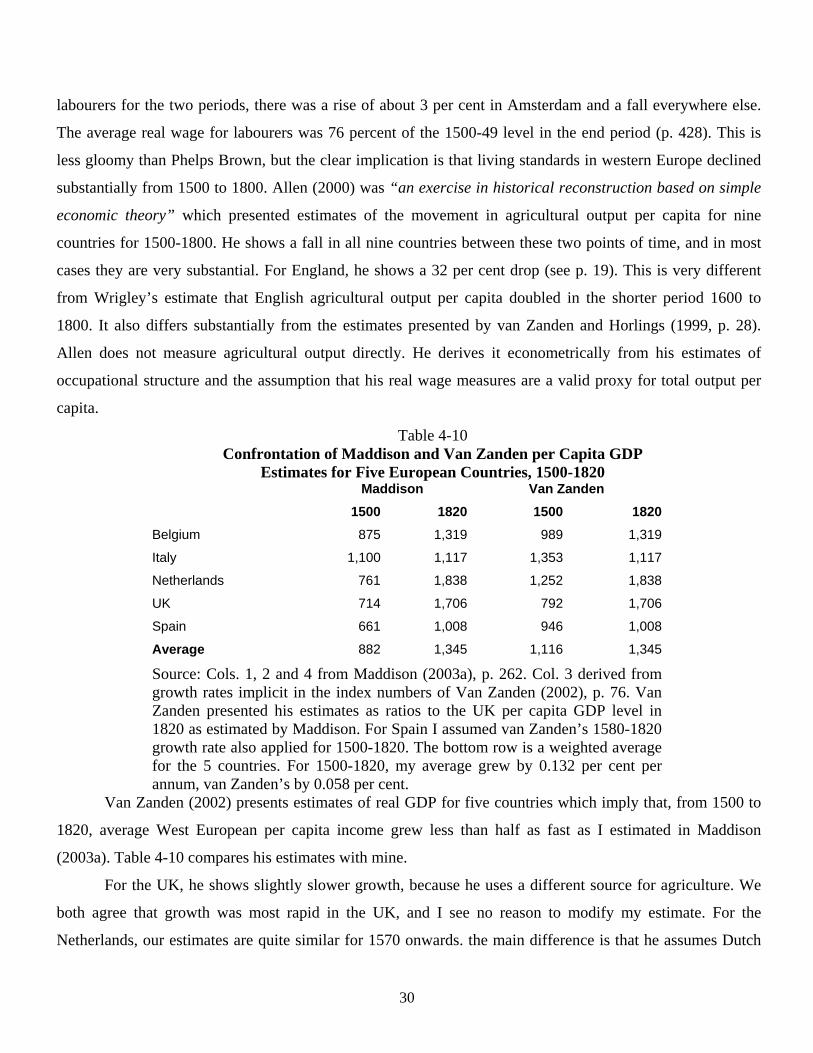
Table 4-10 Confrontation of Maddison and Van Zanden per Capita GDP
Estimates for Five European Countries, 1500-1820 Maddison Van Zanden 1500 1820 1500 1820
Belgium 875 1,319 989 1,319
Italy 1,100 1,117 1,353 1,117
Netherlands 761 1,838 1,252 1,838
UK 714 1,706 792 1,706
Spain 661 1,008 946 1,008
Average 882 1,345 1,116 1,345
Source: Cols. 1, 2 and 4 from Maddison (2003a), p. 262. Col. 3 derived from growth rates implicit in the index numbers of Van Zanden (2002), p. 76. Van Zanden presented his estimates as ratios to the UK per capita GDP level in 1820 as estimated by Maddison. For Spain I assumed van Zanden’s 1580-1820 growth rate also applied for 1500-1820. The bottom row is a weighted average for the 5 countries. For 1500-1820, my average grew by 0.132 per cent per annum, van Zanden’s by 0.058 per cent.
Van Zanden (2002) presents estimates of real GDP for five countries which imply that, from 1500 to
1820, average West European per capita income grew less than half as fast as I estimated in Maddison
(2003a). Table 4-10 compares his estimates with mine.
For the UK, he shows slightly slower growth, because he uses a different source for agriculture. We
both agree that growth was most rapid in the UK, and I see no reason to modify my estimate. For the
Netherlands, our estimates are quite similar for 1570 onwards. the main difference is that he assumes Dutch
30
per capita income have been stagnant from 1500 to 1570, whereas I assume a substantial increase. Between
1470 and 1570 the Dutch merchant fleet increased nearly fourfold - a growth rate of 1.4 per cent a year (see
Maddison, 2001, p. 77), and urbanisation was increasing substantially.
Van Zanden agrees with me that Dutch per capita income in 1500 was lower than in what is now
Belgium. Nevertheless his estimates show the opposite situation in 1500. To mitigate this he adjusted the
Blomme-van der Wee (1994) growth rate for Belgium downward, whereas I accepted it. Van Zanden and I
agree that Italy was the highest income country in 1500, but he assumes an 18 fall in per capita GDP from
1500 to 1820, whereas I assumed stagnation. He quotes Malanima’s (1994) estimate for northern Italy as his
source. In fact, Malanima (1994 and 1995) suggested a fall of 7 per cent, but van Zanden’s estimate is near
that of Malanima (2003), and shows a fall of about a fifth. The evidence for Italy as a whole is not very good
and there are two schools of thought on performance in this period. Malanima’s judgement resembles that of
Cipolla (1976), whereas Rapp (1976) and Sella (1979) argued that per capita income was stagnant from 1500
to 1820. I lean towards their judgement, but as the urbanisation rate was slightly higher in 1800 than in 1500,
I assumed a very slight rise. For Spain, van Zanden shows a growth rate of 0.02 per cent a year for 1570-
1820, which he derives by modifying the estimate of Yun (1994) for Castile, 1580-1800. In fact, Yun’s
estimate (p. 105) shows growth twice as fast as this. In Maddison (2001, p. 249), I explained my reasons for
modifying Yun’s estimate, which omits the years 1500-80 when Spain’s economy received a major boost
from the conquest of the Americas.
Van Zanden (1999) presented real wage estimates for unskilled building labourers in 14 European
cities/regions, using cereal prices (rye or wheat) as a deflator. He shows a fall in all the 10 cases where he had
estimates for 1500-20 and 1780-1800, the average for the latter period was 60 per cent of that in 1500-20, an
annual average change of -0.17 per cent a year. This is more pessimistic than the Allen (2001) results for
labourers, but is similar to the findings of Phelps Brown and Hopkins (1956, p.29-30) for English building
craftsmen for the same period. Van Zanden feels that real wage estimates are “an important source of
information on living standards” (p. 178), even though they are in sharp conflict with a large body of other
evidence. He suggests that a reconciliation may be possible. His estimates are for daily wages, and he
suggests that there may have been a substantial increase in average annual working time of labourers over the
period covered and that their family income may have been supplemented by increased labour force activity
of women and children. It seems likely that there were changes in this direction as indicated in de Vries
(1993), but van Zanden does not attempt to quantify them, and it is highly doubtful that their effect would be
31
big enough to achieve a reconciliation. Van Zanden’s desire for reconciliation may have introduced a
downward bias in his (2002) estimates of real per capita GDP for 1500-1820.
The founder of real wage analysis, Thorold Rogers (1823-90), was professor of economics in Oxford
and a liberal member of parliament who argued that the condition of English wage earners could be improved
by extending the franchise and encouraging trade union activity. For him, low wages were the result of
exploitation of the labourer by the ruling elite. He made a sharp distinction between wage income and
national income, as is clear from his citation of Gregory King’s estimates of inequality in 1688 (Rogers, 1884,
pp. 463-465). He summarised his position, saying (p.355): “society may make noticeable progress in wealth,
and wages remain low …relatively speaking, the working man of today is not so well off as he was in the
fifteenth century”.
Some of the real wage revivalists have forgotten this and use real wages for a small group of workers
as a proxy for GDP per head, without considering their representativity in macroeconomic analysis. Lindert
and Williamson (1982, p. 393) show that only 5.3 per cent of families derived their livelihood from the
building trades in 1688. In the Phelps Brown-Hopkins study, whose sources were meticulously documented,
there were about 3 wage quotations a year for building labourers, and for 1500 to 1800 there were 82 years
without an estimate. The real wage enthusiasts do not discuss changes in the nature of building work. Over
such a long period there were big changes for those whose wages are recorded, with a shift from decorative
ecclesiastical stonework to bricklaying.
Appendix 2 Joel Mokyr and the “Industrial Revolution”
The most recent and sophisticated devotee of the “industrial revolution” metaphor is Joel Mokyr
(2002) who considers that modern economic growth derived from a sudden leap in industrial technology. He
provides a detailed, erudite, illuminating but complex history of the interaction of “propositional” and
“prescriptive” (useful) knowledge since the mid eighteenth century, with a more cursory acknowledgement of
what happened earlier. He suggests (pp.31-2) that “most techniques before 1800 emerged as a result of
chance discoveries, trial and error”. He makes a grudging acknowledgement of the importance of printing
(p.8), and only a fleeting reference to advances in shipping and navigation technology but is dismissive about
their impact: “those earlier mini-industrial revolutions had always petered out before their effects could
launch the economies into sustainable growth. Before the Industrial Revolution, the economy was subject to
negative feedback; each episode of growth ran into some obstruction or resistance that put an end to it…The
best known of these negative feedback mechanisms are Malthusian traps, in which rising income creates
population growth and pressure on fixed natural resources” (p. 31). He is very insistent on the narrowness of
32
the “epistemic base” before 1800, and argues that positive feedbacks between the two types of knowledge
have increased hugely in the course of three “industrial revolutions” since the eighteenth century. There has
been a cascading interaction (p. 100) and we have now arrived at a point where modern information
technology has produced “an immensely powerful positive feedback effect from prescriptive to propositional
knowledge” (p. 115). His analysis of the economic impact of this new knowledge is based on assertions rather
than quantitative evidence. They are presented with characteristic fervour, e.g. his assessment of the impact of
his second “industrial revolution”: “The pivotal breakthrough in the propositional knowledge set was the
identification of the structure of the benzene molecule by the German chemist August von Kekulé in
1865…the discovery of the chemical structure is a paradigmatic example of a broadening of the epistemic
base of an existing technique” (p. 85). My problem with Mokyr’s analysis is with his judgement on the
impact of science and not with his model which can be useful in explaining why the scientific revolution of
the 17th century had a delayed payoff, and why the innovative impact of science and technology accelerated
in the past two centuries. The problem is that he assumes no net improvement in living standards before 1800,
and a constantly accelerating cornucopia since then. This contradicts the quantitative findings of historical
national accounts in the Kuznetsian tradition for the period before and after 1800. Mokyr is of course aware
of this. In his defence (pp. 116-117) he suggests that “aggregate output figures and their analysis in terms of
productivity growth may be of limited use in understanding economic growth over long periods. The full
economic impact of some of the most significant inventions over the past two centuries would be entirely
missed in that way.” Instead he opts for the Silicon-valley serendipity of DeLong (see Appendix 3).
Appendix 3 Hallucigenic History (Nordhaus and DeLong)
Nordhaus (1997) was an ambitious attempt to measure long-term changes in the price of light using
the hedonic approach. He estimated that the “true” i.e. hedonic price of artificial light fell by 4.2 per cent a
year (about 3,450-fold) between 1800 and 1992 in the USA, whereas the annual rise, using the conventional
consumer price approach, was 1.2 per cent a year. He neglects the fact that the supply of daylight did not
change between 1800 and 1992. If had assessed the degree to which natural light had been augmented, the
impact of artificial light would seem a good deal more modest. At the beginning of his analysis, he says that
“unobstructed daylight provides about 10,000 lux, while the level of illuminance of an ordinary home is
about one hundred lux. In the candle age, a room lit by two candles would enjoy about 5 lux” (p. 31). Thus
there was a 20-fold increase in artificial light per house, but daylight had been augmented only 1 per cent
since 1800! The augmentation of moonlight and the invention of spectacles were obviously more significant
but are not described.
33
He illustrates the implications of his approach in measuring real wages. The conventional measure
showed a 13-fold increase between 1800 and 1992. The “true” rise, he suggests, was between 40 and 190
fold. He derived this result by converting conventional price indices into hedonics for three economic sectors.
For “run-of-the-mill” activities, where the characteristics of goods and services have changed relatively little,
he adjusted conventional price indices downward to eliminate “bias”- assumed to be 0.5 per cent a year. For
“seismic” sectors where the goods and services of 1800 have changed, but are still recognisable, conventional
price indices received a downward adjustment equal to half of his measure of bias for light. For “tectonic”
sectors, where the nature of the good or service has changed drastically, or did not exist in 1800, he applied
his bias adjustment for light. He assumed that 75 per cent of goods and services were in the first category in
1800, and that this proportion fell to 28 per cent in 1992, when 36 per cent were seismic and 37 per cent
tectonic. I estimate that US per capita GDP rose 21-fold from $1,087 in 1800 to $23,169 in 1992.An increase
of 190 fold would mean an 1800 level of $122 which would be well below subsistence.
Taking his cue from Nordhaus, DeLong (1998) rather cavalierly suggested that my estimate of the rise
in world GDP per capita involved massive understatement because of uncaptured quality improvements
(which he does not specify). To correct the alleged mismeasurement he assigned “somewhat arbitrarily…an
additional fourfold multiplication to output per capita since 1800”. He shows a 35-fold increase in world
GDP per capita from 1800 to 2000, against my 9-fold increase.
Bibliography This is an extended bibliography which is not confined to references in the text, but is also intended to be a
guide to the broader literature on macro-measurement.
Abel, W. (1978), Agrarkrisen und Agrarkonjunktur, Parey, Hamburg. Abrams, P. and E. A. Wrigley (eds) (1978), Towns in Societies: Essays in Economic History and
Historical Sociology, Cambridge University Press. Abramovitz, M. (1956), “Resource and Output Trends in the United States since 1870”, American
Economic Review, May, pp.5-23. Abramovitz, M. (1986), “Simon Kuznets, 1901-1985”, Journal of Economic History, March, pp. 241-
246. Abramovitz, M. (1989), Thinking About Growth, Cambridge University Press. Abramovitz, M. (2000), “Days Gone by: a Memoir for my Family”, Stanford. Abu-Lughod, J. L. (1989), Before European Hegemony: The World System, AD 1250-1350, Oxford
University Press, New York. Aldcroft, D. H. and A. Sutcliffe (eds) (1999), Europe in the International Economy, 1500-to 2000, Elgar,
Cheltenham. Allen, R.C. (2000), “Economic Structure and Agricultural Productivity in Europe, 1300-1800”,
European Review of Economic History, 3, pp. 1-26.
34
Allen, R.C. (2001), “The Great Divergence in European Wages and Prices from the Middle Ages to the First World War”, Explorations in Economic History, 38, pp. 411–447.
Balazs, S. (1931-1933), “Beiträge zur Wirtschaftsgeschichte der T’ang-Zeit (618-906)”, in Mitteilungen des Seminars für Orientalische Sprachen, 34, 35, 36.
Beckerman, W. (1966), International Comparison of Real Incomes, OECD, Paris. Blomme, J. and H. van der Wee (1994), “The Belgian Economy in a Long-term Historical Perspective:
Economic Development in Flanders and Brabant, 1500-1812”, in Maddison and van der Wee. Boomgaard, P.(1993), “Economic Growth in Indonesia, 500-1990”, in Szirmai, van Ark and Pilat. Booth, A. W. J. O’Malley and A. Weideman (eds) (1990) Indonesian Economic History in the Dutch
Colonial Era, Yale University Southeast Asia Studies. Boserup, E. (1965), The Conditions of Agricultural Growth, Allen and Unwin, London. Boserup, E. (1981), Population and Technology, Blackwell, Oxford. Braudel, F. P. and F. Spooner (1967), “Prices in Europe from 1450 to 1750” in Rich and Wilson. Braudel, F. (1985), Civilisation and Capitalism:15th-18th Century, vol. 3, Fontana, London. Brewer, J. and R. Porter (eds.) (1993), Consumption and the World of Goods, Routledge, London. Butlin, N.G. (1983), Our Original Aggression, Allen and Unwin, Sydney. Butlin, N. G. (1993), The Economics of the Dreamtime: A Hypothetical History, Cambridge University
Press. Cairncross, A. (ed) (1991), The Robert Hall Diaries 1954-61, Unwin Hyman, London. Carr-Saunders, A. M. (1936), World Population, Past Growth and Present Trends, Oxford University
Press. Cipolla, C.M. (1974), The Economic History of World Population, Penguin, London. Cipolla, C.M. (1976), Before the Industrial Revolution: European Society and Economy, 1000–1700,
Norton, New York. Clark, C. (1940), The Conditions of Economic Progress, 1st edition, Macmillan, London. Clark, C. (1957), The Conditions of Economic Progress, 3rd edition, Macmillan, London. Clark, C, and M. Haswell (1970), The Economics of Subsistence Agriculture, Macmillan, London. Clark, C. (1977), Population Growth and Land Use, 2nd ed, Macmillan, London. Cole, A.H. and R. Crandall (1964), “The International Scientific Committee on Price History”, Journal
of Economic History, September, pp. 381–388. Crafts, N.F.R. (1983), “British Economic Growth, 1700–1831: A Review of the Evidence”, Economic History
Review, May, pp. 177–199. Crafts N.F.R. AND C.K. Harley (1992), “Output Growth and the British Industrial Revolution: A Restatement
of the Crafts–Harley View”, Economic History Review, November, pp. 703–730. Crosby, A.W. (1972), The Columbian Exchange :Biological and Cultural Consequences of 1492,
Greenwood Press, Westport. David, P.(1967), “The Growth of Real Product in the United states Before !840: New Evidence,
Controlled Conjectures”, Journal of Economic History, June Deane, P. and W. A. Cole (1962), British Economic Growth, 1688-1959, Cambridge University Press.
Delbeke, J. and H. van der Wee (1983), “Quantitative Research in Economic History in Europe after 1945”, in Fremdling and O’ Brien.
35
DeLong, J. B. (1998), “Estimating World GDP, One Million BC-Present” http://www.j-bradford-delong.net
DeLong, J. B. (2000), “Cornucopia: Increasing Wealth in the Twentieth Century” http://www.j-bradford-delong.net
Denevan, W.M. (ed.) (1976), The Native Population of the Americas in 1492, University of Wisconsin. Denison, E.F. (1947), "Report on Tripartite Discussions of National Income Measurement", in Studies in Income and Wealth, Vol.10, NBER, New York.
Denison, E. F. (1962), The Sources of Economic Growth in the United States, Supplementary Paper No. 13, Committee for Economic Development, Washington DC.
Denison, E.F. (1967), Why Growth Rates Differ, Brookings, Washington, D.C. Denison, E. F. (1969), “Some Major Issues in Productivity Analysis: An Examination of Estimates by
Jorgenson and Griliches”, Survey of Current Business, May, pp. 1-27. Denison, E.F. (1989), Estimates of Productivity Change by Industry, Brookings, Washington D.C.. Denison, E. F. (1993), “The Growth Accounting Tradition and Proximate Sources of Growth”, in
Szirmai, van Ark and Pilat, pp. 37-64. Denison, E.F. and W. K. Chung (1976), How Japan’s Economy Grew So Fast, Brookings, Washington,
D.C. Eisenstein, E. L. (1993), The Printing Revolution in Early Modern Europe, Cambridge University Press. Elvin, M. (1973), The Pattern of the Chinese Past, Methuen, London. Federico, G. (2002), “The World Economy 0-2000: A Review Article”, European Review of Economic
History, 6, pp. 111-121. Feinstein, C.H. and S. Pollard (1988), Studies in Capital Formation in the United Kingdom: 1750-1920,
Oxford University Press. Fogel, R. W. (1964), Railroads and American Economic Growth, Johns Hopkins University Press,
Baltimore. Fremdling, R. and P. K. O’Brien (eds) (1983), Productivity in the Economies of Europe, Klett-Cotta, Speyer. Galbraith, J.K., et al. (1945), The Effects of Strategic Bombing on the German War Economy, US Strategic Bombing Survey, Washington D.C.
Galbraith, J. K. (1971), “A Retrospect on Albert Speer”, in Economics, Peace and Laughter, Deutsch, London.
Gallman, R.E. (1986), “The United States Capital Stock in the Nineteenth Century”, in Engerman, S.L. and R.E. Gallman, eds, Long Term Factors in American Economic Growth, University of Chicago Press.
Gallman, R.E. (1987), “Investment Flows and Capital Stocks: US Experience in the Nineteenth Century”, in Kilby, P. (ed), Quantity and Quiddity: Essays in US Economic History, Wesleyan University Press, Middletown.
Gerschenkron, A. (1965), Economic Backwardness in Historical Perspective, Praeger, New York. Gilbert, M. (1961), “Quality Changes and Index Numbers”, in Hoselitz, pp.287-294. Gilbert, M. and I. B. Kravis (1954), An International Comparison of National Products and Purchasing
Power of Currencies, OEEC, Paris. Gilbert, M. and Associates (1958), Comparative National Products and Price Levels, OEEC, Paris.
36
Glass, D.V. and D.E.C. Eversley (eds) (1965), Population in History: Essays in Historical Demography, Arnold, London.
Goldsmith, R. W. (1951), “A Perpetual Inventory of National Wealth” in Gainsburgh, M. R., Studies in Income and Wealth, vol. 14, Princeton University Press.
Goldsmith, R. W. (1961), “The Economic Growth of Tsarist Russia, 1860-1913”, Economic Development and Cultural Change, April.
Goodman, D. and C. A. Russell (eds) (1991), The Rise of Scientific Europe, 1500-1800, Hodder and Stoughton, London.
Goody, J. (1971), Technology, Tradition and the State in Africa, Oxford University Press. Goody, J. (1983), The Development of the Family and Marriage in Europe, Cambridge University Press. Habib, I. (1978–9), “The Technology and Economy of Moghul India”, Indian Economic and Social
History Review, vol. XVII, No. 1, pp. 1–34. Habib, I. (1995), Essays in Indian History, Tulika, New Delhi. Hanley, S. (1997), Everyday Things in Premodern Japan, University of California, Berkeley. Hansen, S. A. (1974-6), Økonomisk vaekst i Danmark, 2 vols, Institute of Economic History,
Copenhagen. Heikkinen, S. and J.L. van Zanden (2004), Explorations in Economic Growth, Aksant, Amsterdam. Heston, A. (1983), “National Income”, in Kumar and Desai, Cambridge Economic History of India, vol.
2, pp. 376-462. Heston, A. , R. Summers and B. Aten (2002), PWT Version 6.1 (CICUP),
http://www.pwt.econ.upenn.edu Hjerppe, R. and Associates (1987), “Förändringar I levnadsstandarden I Finland, 1750-1913”, in G.
Karlsson (ed), Levestandarden i Norden 1750-1914, Reykavik Hofman, A. A. (2000), The Economic Development of Latin America in the Twentieth Century, Elgar,
Cheltenham. Ho, P. T. (1959) Studies on the Population of China, 1368-1953, Columbia University Press, New York. Hodne, O. and O. H. Grytten (1994), “Gross Domestic Product of Norway, 1835-1915”, Occasional
Papers in Economic History, Umeä University. Hoselitz, B. F. (ed) (1961), “Essays in the Quantitative Study of Economic Growth presented to Simon
Kuznets on his Sixtieth Birthday”, Economic Development and Cultural Change, April. Hulten, C. R. (2003), “Price Hedonics: A Critical Review”, Federal Reserve Bank of New York Policy
Review, September, pp. 5-15. Jarrett, H. S. and J. N. Sarkar (1949), ‘Ain–I–Akbari of Abul Fazl–I–‘Allami, Royal Asiatic Society of
Bengal, Calcutta. Jones, E.L. (1981), The European Miracle, Cambridge University Press. Jones, E.L. (1988), Growth Recurring: Economic Change in World History, Clarendon Press, Oxford. Jones, E.L. (2001), The Record of Global Economic Development, Elgar, Cheltenham. Jorgenson, D. W. and Z. Griliches (1969), “The Explanation of Productivity Change”, Survey of Current
Business, May, pp. 249-282. Jorgenson, D. W. and Z. Griliches (1972), “Issues in Growth Accounting: A Reply to Edward F.
Denison”, Survey of Current Business, May, pp.65-94.
37
Kaldor, N. (1945-6), “The German War Economy”, Review of Economics and Statistics, vol. XIII, (1). Kapuria-Forman, V. and M. Perlman (1995), “An Economic Historian’s Economist: Remembering
Simon Kuznets”, Economic Journal, November, pp.1524-1547. Kendrick, J. W. (1961), Productivity Trends in the United States, Princeton University Press. Keynes. J. M. (1940), How to Pay for the War, Macmillan, London. Kim, K. S. and S. D. Hong (1997), Accounting for Rapid Economic Growth in Korea, 1963-1995, Korea
Development Institute, Seoul. Krantz, O. (1988), “New estimates of Swedish Historical GDP since the beginning of the Nineteenth
Century”, Review of Income and Wealth, June. Kravis, I., A. Heston and R. Summers (1975), A System of International Comparisons of Gross Product
and Purchasing Power, Johns Hopkins University Press, Baltimore and London. Kravis, I., A. Heston and R. Summers (1978), International Comparisons of Real Product and
Purchasing Power, Johns Hopkins University Press, Baltimore and London. Kravis, I., A. Heston and R. Summers (1982), World Product and Income: International Comparisons of
Real Gross Product, Johns Hopkins University Press, Baltimore and London. Kremer, M. (1993), “Population Growth and Technological Change, One Million BC to 1990”, Quarterly
Journal of Economics, August, pp. 681-716. Kuznets, S. (1930), Secular Movements in Production and Prices, Houghton Mifflin, Boston. Kuznets, S. (1940), “Schumpeter’s Business Cycles”, American Economic Review XXX, June, pp. 250-
271. Kuznets, S. (1956-67), “Quantitative Aspects of the Economic Growth of Nations”, 10 articles in
Economic Growth and Cultural Change. Kuznets, S. (1961), Capital in the American Economy, NBER, Princeton. Kuznets, S. (1965), “Capital formation in Modern Economic Growth” paper presented to third
International Conference of Economic History, reprinted in Kuznets (1973), pp. 121-164. Kuznets, S. (1971), Economic Growth of Nations: Total Output and Production Structure, Harvard
University Press. Kuznets, S. (1973), Population, Capital and Growth: Selected Essays, Norton, New York. Kuznets, S. (1989), Economic Development, the Family and Income Distribution: Selected Essays,
Cambridge University Press. Lal, D. (1988), The Hindu Equilibrium, Oxford University Press. Lal, D. (2001), Unintended Consequences, MIT Press, Cambridge, Mass. Landes, D.S. (1969), The Unbound Prometheus, Cambridge University Press. Landes, D.S. (1998), The Wealth and Poverty of Nations, Little, Brown and Company, London. LeRoy Ladurie, E. (1966), Les paysans de Languedoc, Mouton, Paris, LeRoy Ladurie, E. (1978), “L'histoire immobile”, Le territoire de l'historien, vol. II, Gallimard, Paris. Levy-Leboyer, M. and F. Bourguignon (1985), L’economie française au XIX siècle, Economica, Paris. Li, B. (1998), Agricultural Development in Jiangnan, 1620-1850, Macmillan, London. Lin, J. Y. (1995), “The Needham Puzzle: Why the Industrial Revolution did not Originate in China”,
Economic Development and Cultural Change, January.
38
Lindert, P. H. and J. G. Williamson (1982), “Revising England’s Social Tables, 1688-1812”, Explorations in Economic History, 19, pp. 385-408.
Macfarlane, A. (1997), The Savage Wars of Peace: England, Japan and the Malthusian Trap, Blackwell, Oxford.
Maddison, A. (1952), “Productivity in an Expanding Economy”, Economic Journal, September. Maddison, A. (1964), Economic Growth in the West, Allen & Unwin, London, and Norton, New York. Maddison, A. (1969), Economic Growth in Japan and the USSR, Allen & Unwin, London, and Norton,
New York. Maddison, A. (1970), Economic Progress and Policy in Developing Countries, Allen & Unwin, London
and Norton, New York. Maddison, A. (1971), Class Structure and Economic Growth: India and Pakistan Since the Moghuls,
Allen and Unwin, London. Maddison, A. (1972), “Explaining Economic Growth”, Banca Nazionale del Lavoro Quarterly Review,
September, pp. 211-62. Maddison, A. (1983), “A Comparison of Levels of GDP Per Capita in Developed and Developing
Countries, 1700-1980”, Journal of Economic History, March, pp. 27-41. Maddison, A. (1985), “Alternative Estimates of the Real Product of India, 1900-46”, Indian Economic
History Review, April-June. Maddison, A. (1987a), “Growth and Slowdown in Advanced Capitalist Countries: Techniques of
Quantitative Assessment”, Journal of Economic Literature, June, pp. 649-98. Maddison, A. (1987b), “Recent Revisions to British and Dutch Growth, 1700–1870 and their Implications for Comparative Levels of Performance”, in Maddison and van der Meulen.
Maddison, A. (1988), “Ultimate and Proximate Growth Causality: A Critique of Mancur Olson on the Rise and Decline of Nations”, Scandinavian Economic History Review, no. 2, pp. 25-29, reproduced in Maddison (1995b).
Maddison, A. (1989a), The World Economy in the Twentieth Century, OECD, Paris. Maddison, A. (1989b), “Dutch Income in and from Indonesia 1700-1938”, Modern Asian Studies, pp.
645–70.. Maddison, A. (1991a), Dynamic Forces in Capitalist Development, Oxford University Press. Maddison, A. (1991b), “A Revised Estimate of Italian Economic Growth, 1861-1989”, Banca Nazionale
del Lavoro Quarterly Review, June, pp. 225-241. Maddison, A. (1992), “Brazilian Development Experience, 1500 to 1929”, see website
http://www.eco.rug.nl/~Maddison/Maddison, A. (1995a), Monitoring the World Economy, 1820-1992, OECD, Paris. Maddison, A. (1995b), Explaining the Economic Performance of Nations: Essays in Time and Space,
Elgar, Aldershot. Maddison, A. (1995c), “Standardised Estimates of Fixed Capital Stock: A Six Country Comparison”, in
Maddison (1995b). Maddison, A. (1995d), “The Historical Roots of Modern Mexico: 1500–1940”, in Maddison (1995b). Maddison, A. (1998a), Chinese Economic Performance in the Long Run, Development Centre Studies,
OECD, Paris.
39
Maddison, A. (1998b), “Measuring the Performance of A Communist Command Economy: An Assessment of the CIA Estimates for the USSR”, Review of Income and Wealth, September.
Maddison, A. (1999), Review of Hanley (1997), Journal of Japanese and International Economies. Maddison, A. (2001), The World Economy: A Millennial Perspective, Development Centre Studies,
OECD, Paris. Maddison, A. (2003a), The World Economy: Historical Statistics, Development Centre Studies, OECD,
Paris. Maddison, A. (2003b), “Growth Accounts, Technological Change, and the Role of Energy in Western
Growth” in Economia e Energia Secc. XIII-XVIII, Instituto Internazionale di Storia Economica “E. Datini”, Prato.
Maddison, A. (2004a), “Quantifying and Interpreting World Development: Macro-measurement before and after Colin Clark”, Australian Economic History Review, March.
Maddison, A. (2004b), “When and Why did the West get Richer than the Rest”, in Heikkinen and van Zanden (2004).
Maddison, A (2004c), website http://www.eco.rug.nl/~Maddison/Maddison, A. (2005), Growth and Interaction in the World Economy: The Roots of Modernity, Wendt
Lecture, American Enterprise Institute, Washington DC. Maddison, A. and B. van Ark (1988), “Comparisons of Real Output in Manufacturing”, World Bank
Working Paper WPS5, Washington DC, pp. 1-132. Maddison, A. and B. van Ark (1989), “International Comparison of Purchasing Power, Real Output and
Labour Productivity: A Case Study of Brazilian, Mexican and US Manufacturing, 1975”, Review of Income and Wealth, 35, pp.31-55.
Maddison, A. and B. van Ark (2002), “The International Comparison of Real Product and Productivity” in Maddison, Prasada Rao and Shepherd.
Maddison, A. and Associates (1992), The Political Economy of Poverty Equity and Growth: Brazil and Mexico, Oxford University Press, New York.
Maddison, A. and H. van Ooststroom (1995), “The International Comparison of Value Added, Productivity and Purchasing Power Parities in Agriculture” in Maddison (1995b).
Maddison, A. and G. Prince (eds) (1989), Economic Growth in Indonesia, 1820-1940, Foris, Dordrecht. Maddison, A., D. S. Prasada Rao and W. Shepherd (eds) (2002), The Asian Economies in the Twentieth
Century, Elgar, Cheltenham. Maddison, A. and H. van der Meulen (eds.) (1987), Economic Growth in Northwestern Europe: The Last 400 Years, Research Memorandum 214, Institute of Economic Research, University of Groningen.
Maddison, A. and H. van der Wee (eds.) (1994), Economic Growth and Structural Change: Comparative Approaches over the Long Run, Proceedings of the Eleventh International Economic History Congress, Milan, Universitá Bocconi, September.
Malanima, P. (1994), “Italian Economic Performance, 1600-1800”. in Maddison and van der Wee. Malanima, P. (1995), Economia Preindustriale, Mondadori, Milan. Malanima, P. (1998), “Italian Cities 1300-1800: A Quantitative Approach”, Revista di Storia Economica
XVI, August, pp. 91-126. Malanima, P. (2002), L’economia Italiana, il Mulino, Milan.
40
Malanima, P. (2003), “Measuring the Italian Economy, 1300-1861”, Rivista di Storia Economica XIX, December, pp. 265-295.
Malthus, T. R. (1798), Essay on the Principle of Population as it Affects the Future Improvement of Society, Johnson, London.
Manarungsan, S. (1989), Economic Development of Thailand, 1850-1950, Ph. D thesis, University of Groningen.
Mathias, P. and M. M. Postan (eds) (1978), Cambridge Economic History of Europe, vol VII, I, Cambridge University Press.
McDonald, J. and G. D. Snooks (1986), Domesday Economy: A New Approach to Anglo-Norman History, Clarendon Press, Oxford.
McEvedy, C. (2002), The New Penguin Atlas of Ancient History, Penguin. London. McEvedy, C. (1995), The Penguin Atlas of African History, 2nd ed., Penguin, London. McEvedy, C. and R. Jones (1978), Atlas of World Population History, Penguin, London Mokyr, J. (2002), The Gifts of Athena: Historical Origins of the Knowledge Economy, Princeton
University Press. Moosvi, S. (1987), The Economy of the Moghul Empire c.1595: A Statistical Study, Oxford University
Press, New Delhi. Mulder, N. (2002), Economic Performance in the Americas: the Role of the Service Sector in Brazil,
Mexico and the USA, Elgar, Cheltenham. Needham, J. (1954–97), Science and Civilisation in China, Cambridge University Press. Needham, J. (1970), Clerks and Craftsmen in China and the West, Cambridge University Press. Nordhaus, W.D. (1997), “Do Real-Wage Measures Capture Reality? The Evidence of Lighting Suggests
Not”, in Bresnahan, T.F. and R.J. Gordon (1997), The Economics of New Goods, NBER and University of Chicago Press.
North, D.C. (1990), Institutions, Institutional Change and Economic Performance, Cambridge University Press.
North, D.C. and R. P. Thomas (1973), The Rise of the Western World, Cambridge University Press.. OECD (1964), The Residual Factor and Economic Growth, Conference papers by Ed. Denison, Ingvar
Svennilson, Jan Tinbergen, John Vaizey, John Kendrick and Tibor Scitovsky. Discussants included Erik Lundberg, Edmond Malinvaud, Trygve Haavelmo, Nicholas Kaldor, Thomas Balogh, Amartya Sen, John Kendrick and Harry Johnson.
OECD (1975) Education, Inequality and Life Chances, 2 vols. Paris. OECD (2000), A PPP Comparison for the NIS, Centre for Cooperation with Non-Members document
CCNM/STD (2000), 2, Paris OECD (2002), Purchasing Power Parities and Real Expenditures, 1999 Benchmark Year, Paris. Olson, M. (1982), The Rise and Decline of Nations, Yale University Press. Özmucur, S. and S. Pamuk (2002), “Real Wages and Standards of Living in the Ottoman Empire, 1489–
1914”, Journal of Economic History, June, pp. 293–321. Paige, D. and G. Bombach (1959), A Comparison of the National Output and Productivity of the UK and
USA, OEEC, Paris.
41
Perkins, D. H. (1969), Agricultural Development in China, 1368-1968, Aldine, Chicago. Persson, K.G. (1988), Preindustrial Economic Growth, Blackwell, Oxford Phelps Brown, H. and S. V. Hopkins (1956), “Seven Centuries of the Price of Consumables, Compared
with Builders’ Wage Rates”, Economica , November, reprinted in their (1981) Perspective on Wages and Prices, Methuen, London.
Pilat, D. (1994), The Economics of Rapid Growth: The Experience of Japan and Korea, Elgar, Aldershot. Pomeranz, K. (2000), The Great Divergence: China, Europe and the Making of the Modern World
Economy, Princeton University Press, New Jersey. Psacharopoulos, G. (1975), Earnings and Education in OECD Countries, OECD, Paris. Rapp, R. T.(1976), Industry and Economic Decline in Seventeenth Century Venice, Harvard University
Press, Cambridge, MA. Raychaudhuri, T. and I. Habib (1982), The Cambridge Economic History of India, c.1200–1750, vol. I,
Cambridge University Press. Ren, R. (1997), China’s Economic Performance in International Perspective, OECD, Paris.
Rich, E.E. and C.H. Wilson (eds.) (1967), Cambridge Economic History of Europe, Vol. IV, Cambridge University Press.
Rostas, L. (1948), Comparative Productivity in British and American Industry, Cambridge University Press.
Rostow, W. W. (1960), The Stages of Economic Growth: A Non-Communist Manifesto, Cambridge University Press.
Rostow, W. W. (ed) (1963), The Economics of Take-Off into Sustained Growth, Macmillan, London Rozman, G. (1973), Urban Networks in Ch’ing China and Tokugawa Japan, Princeton University Press. Samuels, L. H. (ed) (1963), African Studies in Income and Wealth, Bowes and Bowes, London. Schmookler, J. (1966), Invention and Economic Growth, Harvard University Press. Schultz, T. W. (1961), “Investment in Human Capital”, American Economic Review, March. Schumpeter, J. A. (1939), Business Cycles: A Theoretical, Historical, and Statistical Analysis of the
Capitalist Process, McGraw-Hill, New York. Scitovsky, T. (1999),”A Proud Hungarian, Excerpts from a Memoir”, Part 2, The Hungarian Quarterly,
156, Winter, pp. 24-43 (excerpt from “Egy büszke magyar emlékiratai”, Közgazdasági Szemle Alapítvány, Budapest, 1997).
Sella, D. (1979), Crisis and Continuity, The Economy of Spanish Lombardy in the Seventeenth Century, Harvard University Press, Cambridge MA.
Shinohara, M. (1966), Japan’s Industrial Level in International Perspective, Ministry of Foreign Affairs, Tokyo.
Singer, C., E.J. Holmyard, A.R. Hall and T.I. Williams (eds.) (1954-8), A History of Technology, 5 vols, Clarendon Press, Oxford.
Sivasubramonian, S. (2000), The National Income of India in the Twentieth Century, Oxford University Press, New Delhi.
Sivasubramonian, S. (2004), The Sources of Economic Growth in India, 1950-1 to 1999-2000, Oxford University Press, New Delhi.
Smil, V. (1994), Energy in World History, Westview Press, Boulder and Oxford.
42
Smits, J-P., E. Horlings and J.L. van Zanden (2000), Dutch GDP and its Components, 1800-1913, University of Groningen.
Smith, A. (1776), An Inquiry into the Nature and Causes of the Wealth of Nations, University of Chicago, Reprint, 1976.
Snooks, G.D. (1990), “Economic Growth During the Last Millennium: A Quantitative Perspective”, Working Papers in Economic History, No. 140, Australian National University, Canberra.
Snooks, G.D. (1993), Economics Without Time, Macmillan, London. Snooks, G.D. (1996), The Dynamic Society: Exploring the Sources of Global Change, Routledge,
London. Snooks, G.D. (1997), The Ephemeral Civilisation, Routledge, London. Solow, R. M. (1956), “A Contribution to the Theory of Economic Growth”, Quarterly Journal of
Economics, February. Stone, R. (1997b), Some British Empiricists in the Social Sciences 1650–1900, Cambridge University
Press. Studenski, P. (1958), The Income of Nations: Theory, Measurement and Analysis: Past and Present, New
York University Press. Szirmai, A., B. van Ark and D. Pilat (eds.) (1993), Explaining Economic Growth: Essays in Honour of
Angus Maddison, North Holland, Amsterdam. Thorold Rogers, J. E. (1862-1892), A History of Agriculture and Prices in England, 7 vols. Clarendon
Press, Oxford. Thorold Rogers, J. E (1884), Six Centuries of Work and Wages, Swan Sonnenschein, London. Tilly, R. H. (1978), “Capital Formation in Germany in the Nineteenth Century” in Mathias and Postan. Tinbergen, J. (1942), "Zur Theorie der langfristigen Wirtschaftsentwicklung", Weltwirtschaftliches
Archiv, (55). Tobin, J. (2001), “In Memoriam: Richard Ruggles (1916-2001)”, Review of Income and Wealth,
september, pp.405-8. Toutain, J-C. (1987), Le produit intérieur de la France de 1789 a 1982, Presses Universitaires de
Grenoble. Urlanis, B. Ts (1941), Rost Naselenie v Evrope, Ogiz, Moscow. Van Ark, B. and N. Crafts (eds) (1996), Quantitative Aspects of Post-war European Economic Growth,
Cambridge University Press. Van der Eng, P. (1993), Agricultural Growth in Indonesia since 1880, Groningen University Press. Van Zanden, J.L. (1993), “The Dutch Economy in the Very Long Run, 1500-1805”, in Szirmai, van Ark
and Pilat. Van Zanden, J.L. (1999), “Wages and the Standard of Living in Europe, 1500-1800”, European Review
of Economic History, August, pp. 175-198. Van Zanden, J.L. (2002a), “Early Modern Economic Growth: A Survey of the European Economy, 1500-
1800”, in M. Prak (ed), Early Modern Capitalism, Routledge, London. Van Zanden, J.L. (2002b), “Taking the Measure of the Early Modern Economy: Historical National
Accounts for Holland in 1510/14”, European Review of Economic History, 6, pp. 131-163.
43
Van Zanden, J.L. (2003), “Rich and Poor before the Industrial Revolution: A Comparison between Java and the Netherlands at the beginning of the 19th Century”, Explorations in Economic History, 40, pp. 1-23.
Van Zanden, J.L. (forthcoming), “Economic Growth in Java, 1815–1939: Reconstruction of the Historical National Accounts of a Colonial Economy” (http://iisg.nl/research/jvz-reconstruction.pdf).
Van Zanden, J.L. and E. Horlings (1999 ), “The Rise of the European Economy 1500–1800”, in Aldcroft and Sutcliffe.
Vries, J. de (1984), European Urbanization 1500–1800, Methuen, London. Vries, J. de (1993), “Between Purchasing Power and the World of Goods: Understanding the Household
Economy in Early Modern Europe” in Brewer and Porter (1993). Vries, J. de (1994),”The Industrial Revolution and the Industrious Revolution”, Journal of Economic
History, June, pp. 249-270. Vries, J. de and A. van der Woude (1997), The First Modern Economy; Success, Failure and
Perseverance of the Dutch Economy, 1500–1815, Cambridge University Press, Cambridge. Williamson, J.G. (1995), “The Evolution of Global Labor Markets since 1830: Background Evidence and
Hypotheses”, Explorations in Economic History, 32, pp. 141–196. Wrigley, E. A. (1987), People, Cities and Wealth, Blackwell, Oxford. Wrigley, E.A. (1988), Continuity, Chance and Change, Cambridge. Wrigley, E. A. (2004), Poverty, Progress and Population, Cambridge University Press. Wrigley, E.A. and R.S. Schofield (1981), The Population History of England 1541–1871, Arnold,
London. Wrigley, E. A., R. S. Davies, J. E. Oeppen and R. S. Schofield (1997), English Population History from
Family Reconstitution 1580–1837, Cambridge University Press. Yun, B. (1994), “Proposals to Quantify Long–Term Performance in the Kingdom of Castile, 1580-1800”,
in Maddison and van der Wee.
44