Embed Size (px)
Citation preview
Physica B 329–333 (2003) 1582–1585
Measuring nuclear magnetization in strong magnetic fields
Akira Harita, Takashi Tayama, Takahiro Onimaru, Toshiro Sakakibara*
Institute for Solid State Physics, University of Tokyo, Kashiwa 277-8581, Japan
Abstract
Al nuclear magnetization has been measured in magnetic fields up to 100 kOe; by use of a capacitive Faradaymagnetometer installed in a dilution refrigerator. The sample employed was an Al0:98Si0:02 alloy prepared from high
purity (6N) elements. The Si doping was essential in suppressing the de Haas-van Alphen oscillations of conduction
electrons. Fine Curie’s law was observed at temperatures below 3 K down toB60 mK; in several magnetic fields in therange 30–100 kOe: The measurement opens a new route towards primary thermometry at low temperature and highmagnetic field region.
r 2003 Elsevier Science B.V. All rights reserved.
Keywords: Thermometry; Nuclear magnetization; High magnetic field
1. Introduction
Cryogenic thermometry in high magnetic fields has
been a difficult challenge, in particular at low tempera-
tures accessible by dilution refrigerators. In most cases,
resistance thermometers such as ruthenium oxide thick
film resistors or zirconium oxynitride thin film resistors
are used in these conditions since they offer the
possibility of relatively small temperature errors in
magnetic field. For precise temperature measurements,
these resistors need to be calibrated in magnetic fields
because of their non-simple magnetoresistance at low
temperatures [1,2].
Regarding primary thermometry, various types of
nuclear magnetic thermometers have been used at vary
low temperatures and low magnetic fields [3–5]. How-
ever not much work has been done in high magnetic
fields. Candela et al. reported Pt NMR thermometry in
high magnetic field of 80 kOe [6]. Very recently,
Coulomb blockade based thermometer has been claimed
to provide absolute thermometry that is virtually
insensitive to magnetic fields [7].
In this paper, we report on an attempt to extend the
nuclear magnetic thermometry to high magnetic fields.
By use of the Faraday method, DC magnetization of Al
nuclear spins could be measured with high resolution at
temperatures below 100 mK in magnetic fields up to
100 kOe:
2. Experimental
2.1. Magnetometer design
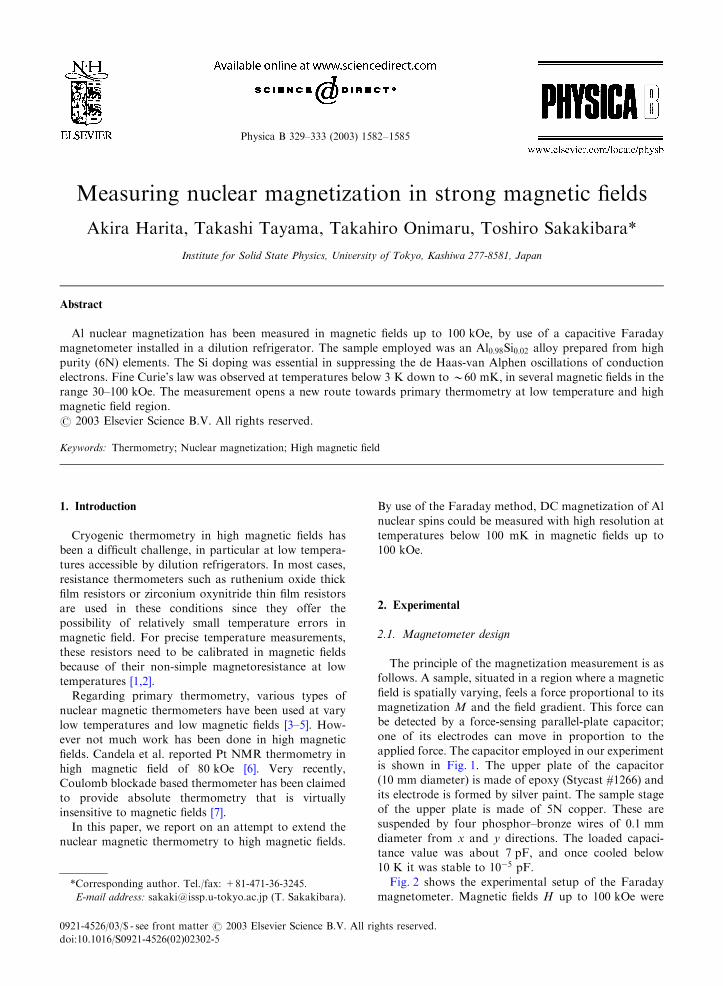
The principle of the magnetization measurement is as
follows. A sample, situated in a region where a magnetic
field is spatially varying, feels a force proportional to its
magnetization M and the field gradient. This force can
be detected by a force-sensing parallel-plate capacitor;
one of its electrodes can move in proportion to the
applied force. The capacitor employed in our experiment
is shown in Fig. 1. The upper plate of the capacitor
(10 mm diameter) is made of epoxy (Stycast #1266) and
its electrode is formed by silver paint. The sample stage
of the upper plate is made of 5N copper. These are
suspended by four phosphor–bronze wires of 0:1 mmdiameter from x and y directions. The loaded capaci-
tance value was about 7 pF; and once cooled below10 K it was stable to 10�5 pF:Fig. 2 shows the experimental setup of the Faraday
magnetometer. Magnetic fields H up to 100 kOe were*Corresponding author. Tel./fax: +81-471-36-3245.
E-mail address: [email protected] (T. Sakakibara).
0921-4526/03/$ - see front matter r 2003 Elsevier Science B.V. All rights reserved.
doi:10.1016/S0921-4526(02)02302-5
produced by a superconducting solenoids whose homo-
geneity at the sample position is 10�4 over a 10 mm-
diameter spherical volume. A vertical field gradient
dH=dz of 800 Oe=cm was generated by gradient coils
wound inside the magnet. The capacitor was cooled by a
dilution refrigerator via a thermal link of Ag wires
connected to the mixing chamber.
We used a calibrated ruthenium oxide thermometer
(RO-600, Scientific Instruments Inc.) mounted on the
capacitor. The resistance measurements were made with
a low power AC resistance bridge (AVS-47, RV-
Electroniikka). In this experiment, we tentatively cor-
rected a magnetic field effect on the thermometer using a
simple equation provided by the company: Tn=TnðHÞ ¼
1þ 1:31� 10�3H � 2:93� 10�6H2; where Tn is a cor-
rected temperature and TnðHÞ is an apparent tempera-ture reading of the thermometer in magnetic field H
(kOe).
In a normal operation, we made two sweeps of
temperature or field for each measurement, first with the
gradient coils switched on and second with no current in
the gradient coils. Taking a difference between these two
capacitance data, we could eliminate the effects of a
magnetic torque or a field inhomogeneity of the main
solenoids. More details of the measurement method are
given in Ref. [8]. The resolution of the magnetometer
was better than 10�5 emu in a field of 100 kOe: Absolutesensitivity was calibrated by measuring a Ni standard
sample with 1% accuracy.
2.2. Sample preparation
Various metals have been used as magnetic thermo-
meters at very low temperatures [3–6]. Among these,
aluminum (27Al; I ¼ 5=2) would be most favorable forthe present purpose. One of the merits of using Al is that
it has a large value of the unit-mass Curie constant
ð2:55� 10�8 emu �K=gÞ; a factor of 5 larger comparedto Cu. This is a significant advantage for the Faraday
magnetometer. We first attempted the measurements
with high-purity (6N) Al metal, and the magnetization
curve obtained at 0:4 K is shown in Fig. 3 by open
circles. Unfortunately, we observed a strong de Haas-
van Alphen (dHvA) oscillations in spite of a polycrys-
talline sample, and could not detect the nuclear
contribution.
In order to suppress the dHvA oscillations, we
prepared a 2-at% Si doped Al–Si alloy by arc melting
the high-purity (6N) materials. The dots in Fig. 3 are the
magnetization of the Al–Si alloy, indicating that the
dHvA oscillations are completely wiped out by the non-
magnetic ‘impurity’ scatterings. Magnetically, Si does
not contribute to the Curie constant because of the small
Fig. 1. The force-sensing capacitor for the Faraday magneto-
meter.
Ag wires
Gradient coils
Main solenoids
Capacitance cell
Sample
Mixing chamber
RO2 thermometer
Fig. 2. The experimental setup for the magnetization measure-
ment.
0.000
0.010
0.020
0.030
0.040
0.050
0.060
0.070
0 2 4 6 8
Al-2%Si
6N Al (polycrystal)
M (
emu/
g)
H (10 kOe)
0.4 K
Fig. 3. Magnetization curves of the 6N polycrystalline Al (open
circles) and the Al–2%Si alloy (dots), obtained at 0:4 K:
A. Harita et al. / Physica B 329–333 (2003) 1582–1585 1583
nuclear spin of 29Si ðI ¼ 1=2Þ and its poor natural
abundance (4.7%). The Si doping might cause a
quadrupolar splitting of the 27Al nuclear spins due to
locally destructing a cubic symmetry, but this effect on
the nuclear spin susceptibility would be small in the
temperature range of interest ð> 10 mKÞ: The linearmagnetization of the Al–Si alloy observed in Fig. 3
mainly comes from Pauli paramagnetism of conduction
electrons. We precisely determined the linear paramag-
netic susceptibility at 2 K to be 6:18� 10�7 emu=g;through the magnetization measurement up to 70 kOe
using a commercial SQUID magnetometer (MPMS,
Quantum Design). This susceptibility can be decom-
posed into the Pauli term of w0 ¼ 6:06� 10�7 emu=g
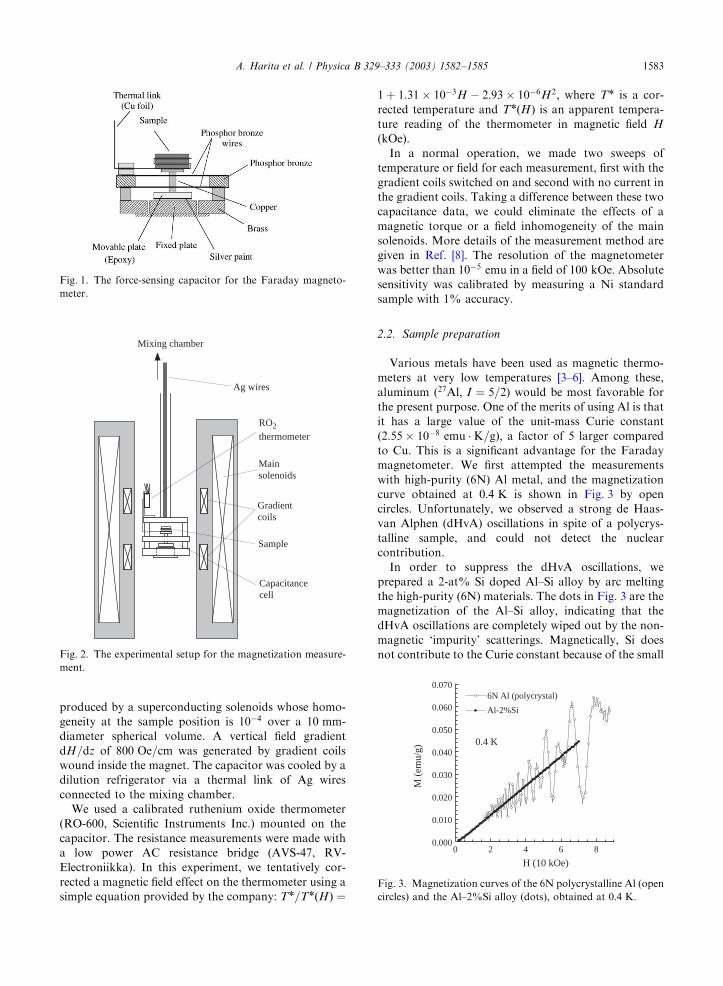
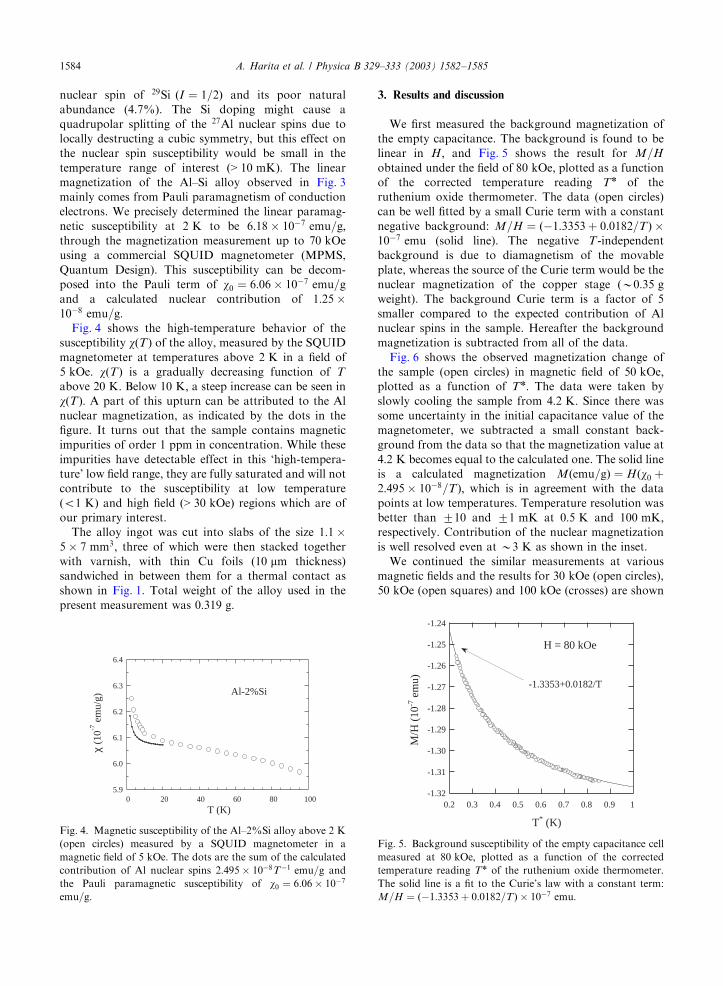
and a calculated nuclear contribution of 1:25�10�8 emu=g:Fig. 4 shows the high-temperature behavior of the
susceptibility wðTÞ of the alloy, measured by the SQUIDmagnetometer at temperatures above 2 K in a field of
5 kOe: wðTÞ is a gradually decreasing function of T
above 20 K: Below 10 K; a steep increase can be seen inwðTÞ: A part of this upturn can be attributed to the Alnuclear magnetization, as indicated by the dots in the
figure. It turns out that the sample contains magnetic
impurities of order 1 ppm in concentration. While these
impurities have detectable effect in this ‘high-tempera-
ture’ low field range, they are fully saturated and will not
contribute to the susceptibility at low temperature
ðo1 KÞ and high field ð> 30 kOeÞ regions which are ofour primary interest.
The alloy ingot was cut into slabs of the size 1:1�5� 7 mm3; three of which were then stacked togetherwith varnish, with thin Cu foils (10 mm thickness)
sandwiched in between them for a thermal contact as
shown in Fig. 1. Total weight of the alloy used in the
present measurement was 0:319 g:
3. Results and discussion
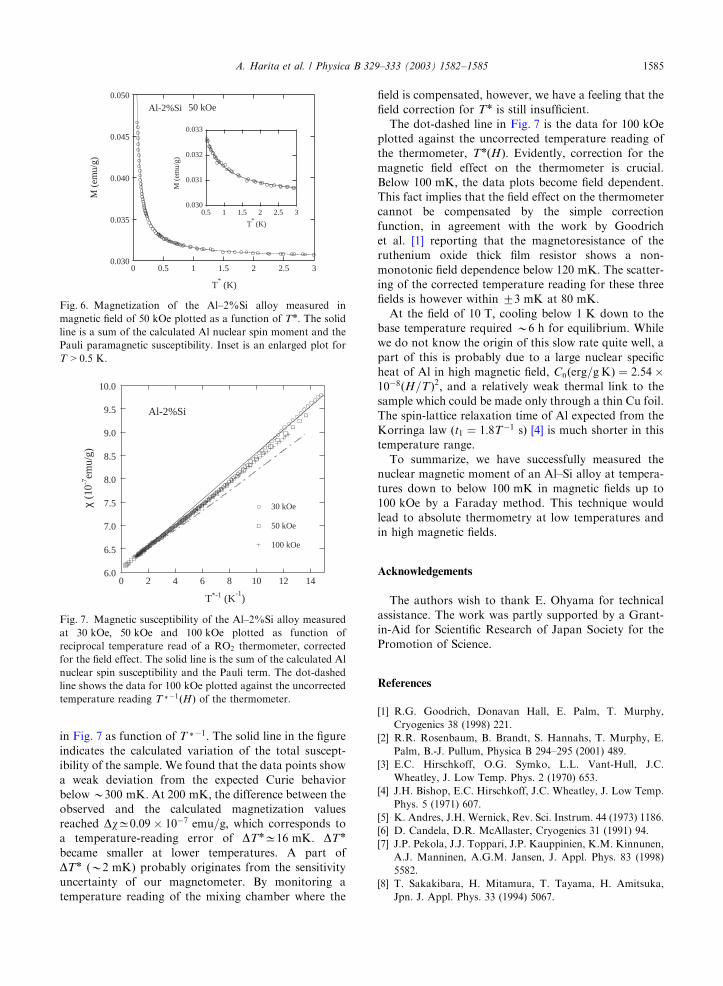
We first measured the background magnetization of
the empty capacitance. The background is found to be
linear in H; and Fig. 5 shows the result for M=H
obtained under the field of 80 kOe; plotted as a functionof the corrected temperature reading Tn of the
ruthenium oxide thermometer. The data (open circles)
can be well fitted by a small Curie term with a constant
negative background: M=H ¼ ð�1:3353þ 0:0182=TÞ �10�7 emu (solid line). The negative T-independent
background is due to diamagnetism of the movable
plate, whereas the source of the Curie term would be the
nuclear magnetization of the copper stage (B0:35 gweight). The background Curie term is a factor of 5
smaller compared to the expected contribution of Al
nuclear spins in the sample. Hereafter the background
magnetization is subtracted from all of the data.
Fig. 6 shows the observed magnetization change of
the sample (open circles) in magnetic field of 50 kOe;plotted as a function of Tn: The data were taken byslowly cooling the sample from 4:2 K: Since there wassome uncertainty in the initial capacitance value of the
magnetometer, we subtracted a small constant back-
ground from the data so that the magnetization value at
4:2 K becomes equal to the calculated one. The solid lineis a calculated magnetization Mðemu=gÞ ¼ Hðw0 þ2:495� 10�8=TÞ; which is in agreement with the datapoints at low temperatures. Temperature resolution was
better than 710 and 71 mK at 0:5 K and 100 mK;respectively. Contribution of the nuclear magnetization
is well resolved even at B3 K as shown in the inset.
We continued the similar measurements at various
magnetic fields and the results for 30 kOe (open circles),
50 kOe (open squares) and 100 kOe (crosses) are shown
5.9
6.0
6.1
6.2
6.3
6.4
0 20 40 60 80 100
χ (1
0-7 e
mu/
g)
T (K)
Al-2%Si
Fig. 4. Magnetic susceptibility of the Al–2%Si alloy above 2 K
(open circles) measured by a SQUID magnetometer in a
magnetic field of 5 kOe: The dots are the sum of the calculatedcontribution of Al nuclear spins 2:495� 10�8T�1 emu=g andthe Pauli paramagnetic susceptibility of w0 ¼ 6:06� 10
�7
emu=g:
-1.32
-1.31
-1.30
-1.29
-1.28
-1.27
-1.26
-1.25
-1.24
0.2 0.3 0.4 0.5 0.6 0.7 0.8 0.9 1
M/H
(10
-7 e
mu)
T* (K)
-1.3353+0.0182/T
H = 80 kOe
Fig. 5. Background susceptibility of the empty capacitance cell
measured at 80 kOe; plotted as a function of the correctedtemperature reading Tn of the ruthenium oxide thermometer.
The solid line is a fit to the Curie’s law with a constant term:
M=H ¼ ð�1:3353þ 0:0182=TÞ � 10�7 emu:
A. Harita et al. / Physica B 329–333 (2003) 1582–15851584
in Fig. 7 as function of T *�1: The solid line in the figureindicates the calculated variation of the total suscept-
ibility of the sample. We found that the data points show
a weak deviation from the expected Curie behavior
belowB300 mK: At 200 mK; the difference between theobserved and the calculated magnetization values
reached DwC0:09� 10�7 emu=g; which corresponds toa temperature-reading error of DTnC16 mK: DTn
became smaller at lower temperatures. A part of
DTn ðB2 mKÞ probably originates from the sensitivity
uncertainty of our magnetometer. By monitoring a
temperature reading of the mixing chamber where the
field is compensated, however, we have a feeling that the
field correction for Tn is still insufficient.
The dot-dashed line in Fig. 7 is the data for 100 kOe
plotted against the uncorrected temperature reading of
the thermometer, TnðHÞ: Evidently, correction for themagnetic field effect on the thermometer is crucial.
Below 100 mK; the data plots become field dependent.This fact implies that the field effect on the thermometer
cannot be compensated by the simple correction
function, in agreement with the work by Goodrich
et al. [1] reporting that the magnetoresistance of the
ruthenium oxide thick film resistor shows a non-
monotonic field dependence below 120 mK: The scatter-ing of the corrected temperature reading for these three
fields is however within 73 mK at 80 mK:At the field of 10 T; cooling below 1 K down to the
base temperature required B6 h for equilibrium. Whilewe do not know the origin of this slow rate quite well, a
part of this is probably due to a large nuclear specific
heat of Al in high magnetic field, Cnðerg=gKÞ ¼ 2:54�10�8ðH=TÞ2; and a relatively weak thermal link to thesample which could be made only through a thin Cu foil.
The spin-lattice relaxation time of Al expected from the
Korringa law ðt1 ¼ 1:8T�1 sÞ [4] is much shorter in thistemperature range.
To summarize, we have successfully measured the
nuclear magnetic moment of an Al–Si alloy at tempera-
tures down to below 100 mK in magnetic fields up to
100 kOe by a Faraday method. This technique would
lead to absolute thermometry at low temperatures and
in high magnetic fields.
Acknowledgements
The authors wish to thank E. Ohyama for technical
assistance. The work was partly supported by a Grant-
in-Aid for Scientific Research of Japan Society for the
Promotion of Science.
References
[1] R.G. Goodrich, Donavan Hall, E. Palm, T. Murphy,
Cryogenics 38 (1998) 221.
[2] R.R. Rosenbaum, B. Brandt, S. Hannahs, T. Murphy, E.
Palm, B.-J. Pullum, Physica B 294–295 (2001) 489.
[3] E.C. Hirschkoff, O.G. Symko, L.L. Vant-Hull, J.C.
Wheatley, J. Low Temp. Phys. 2 (1970) 653.
[4] J.H. Bishop, E.C. Hirschkoff, J.C. Wheatley, J. Low Temp.
Phys. 5 (1971) 607.
[5] K. Andres, J.H. Wernick, Rev. Sci. Instrum. 44 (1973) 1186.
[6] D. Candela, D.R. McAllaster, Cryogenics 31 (1991) 94.
[7] J.P. Pekola, J.J. Toppari, J.P. Kauppinien, K.M. Kinnunen,
A.J. Manninen, A.G.M. Jansen, J. Appl. Phys. 83 (1998)
5582.
[8] T. Sakakibara, H. Mitamura, T. Tayama, H. Amitsuka,
Jpn. J. Appl. Phys. 33 (1994) 5067.
0.030
0.035
0.040
0.045
0.050
0 0.5 1 1.5 2 2.5 3
M (
emu/
g)
T* (K)
Al-2%Si 50 kOe
0.030
0.031
0.032
0.033
0.5 1 1.5 2 2.5 3
M (
emu/
g)
T* (K)
Fig. 6. Magnetization of the Al–2%Si alloy measured in
magnetic field of 50 kOe plotted as a function of Tn: The solidline is a sum of the calculated Al nuclear spin moment and the
Pauli paramagnetic susceptibility. Inset is an enlarged plot for
T > 0:5 K:
6.0
6.5
7.0
7.5
8.0
8.5
9.0
9.5
10.0
0 2 4 6 8 10 12 14
30 kOe
50 kOe
100 kOe
χ (1
0-7em
u/g)
T*-1 (K-1
)
Al-2%Si
Fig. 7. Magnetic susceptibility of the Al–2%Si alloy measured
at 30 kOe; 50 kOe and 100 kOe plotted as function of
reciprocal temperature read of a RO2 thermometer, corrected
for the field effect. The solid line is the sum of the calculated Al
nuclear spin susceptibility and the Pauli term. The dot-dashed
line shows the data for 100 kOe plotted against the uncorrected
temperature reading T *�1ðHÞ of the thermometer.
A. Harita et al. / Physica B 329–333 (2003) 1582–1585 1585