Embed Size (px)
Citation preview
April 2011 | Argonne National Laboratory, USA
Measuring Radionuclides in the Environment
Dr. Bob JohnsonArgonne National Laboratory
April 2011 | Argonne National Laboratory, USA
IDN and ENVIRONET Training Course
Decision-Making Requires Data
Instrumentation and analytical methods are the sources of data:
“Real-time” versus more traditional methods
Radionuclide-specific versus gross activity measurements
In situ versus ex situ measurements
“Cheap, fast, qualitative” versus “expensive, slow, definitive”
April 2011 | Argonne National Laboratory, USA
IDN and ENVIRONET Training Course
Ionizing Emissions Serve as the Basis for Most Radionuclide Measurement Systems
Radioactive decay can involve a variety of emissions, including alpha particles, beta particles, and gamma rays
Gamma rays are typically the preferred emissions for measuring activity concentrations in soils because they are easiest to measure
Radionuclides that are not gamma emitters are often mixed with other radionuclides that are, and can be used as surrogates
For the decay of a particular radionuclide of concern, such as radium-226 or its daughter products, emissions are characterized by their specific energy and abundance
April 2011 | Argonne National Laboratory, USA
IDN and ENVIRONET Training Course
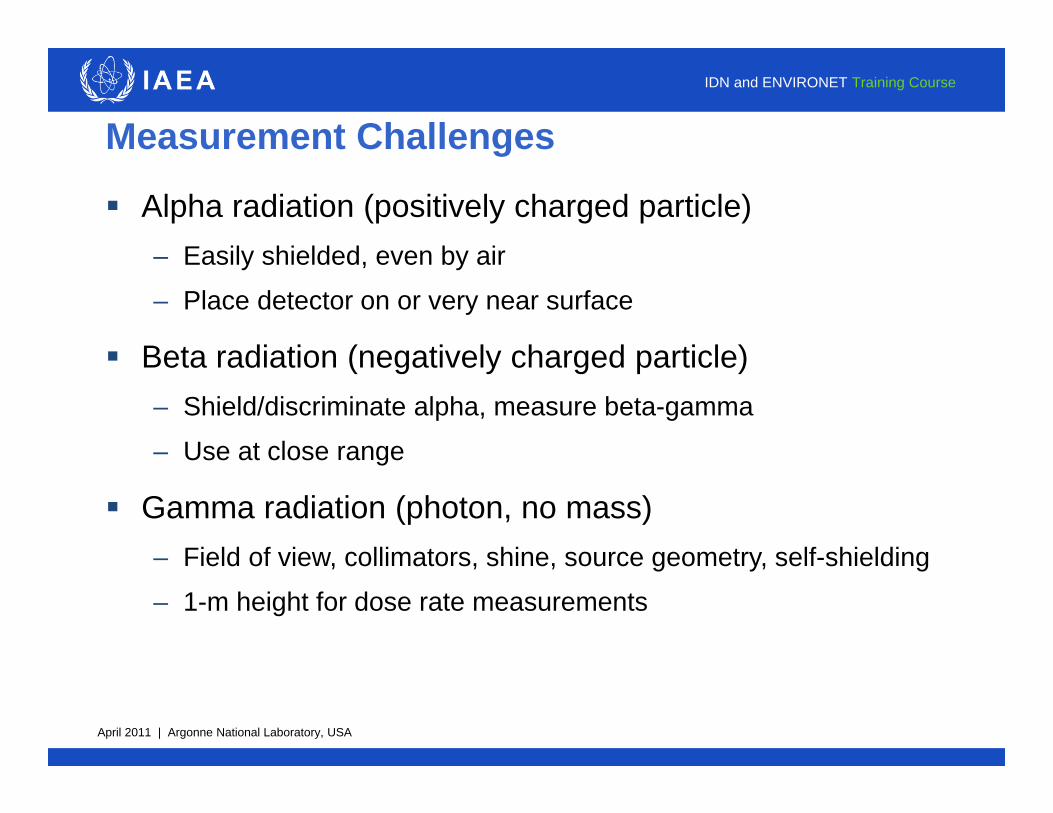
Measurement Challenges
Alpha radiation (positively charged particle)– Easily shielded, even by air
– Place detector on or very near surface
Beta radiation (negatively charged particle)– Shield/discriminate alpha, measure beta-gamma
– Use at close range
Gamma radiation (photon, no mass)– Field of view, collimators, shine, source geometry, self-shielding
– 1-m height for dose rate measurements
April 2011 | Argonne National Laboratory, USA
IDN and ENVIRONET Training Course
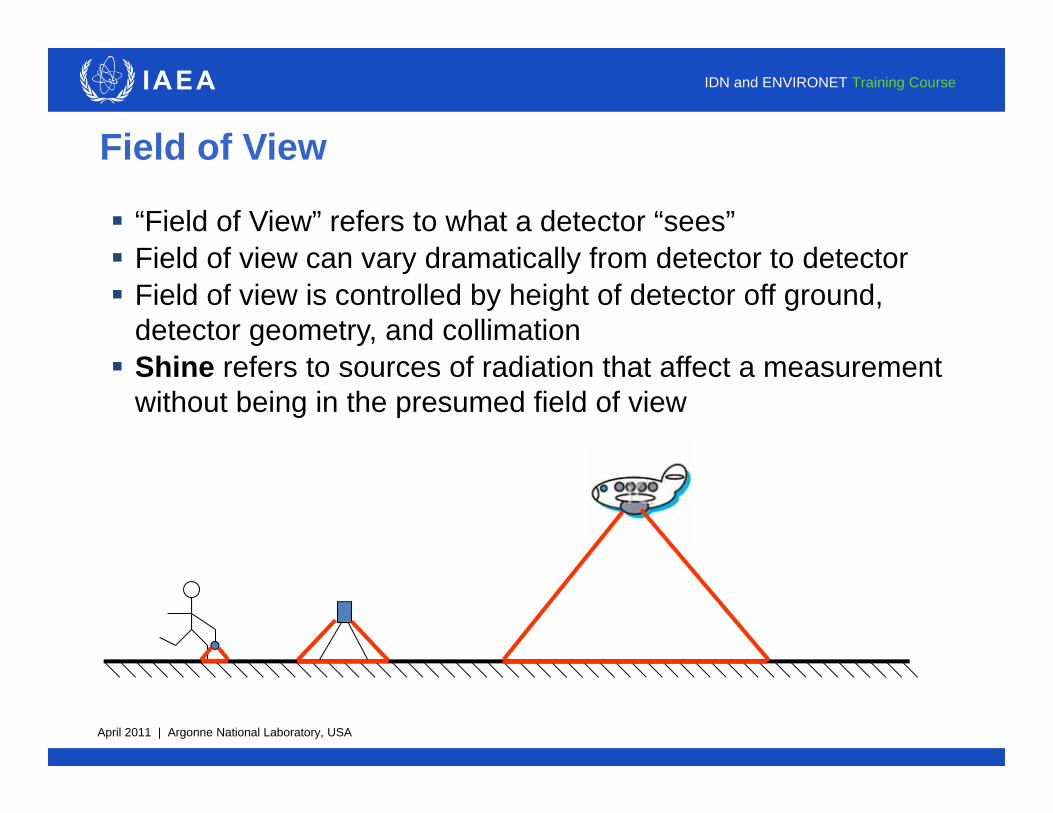
Field of View
“Field of View” refers to what a detector “sees” Field of view can vary dramatically from detector to detector Field of view is controlled by height of detector off ground,
detector geometry, and collimation Shine refers to sources of radiation that affect a measurement
without being in the presumed field of view
April 2011 | Argonne National Laboratory, USA
IDN and ENVIRONET Training Course
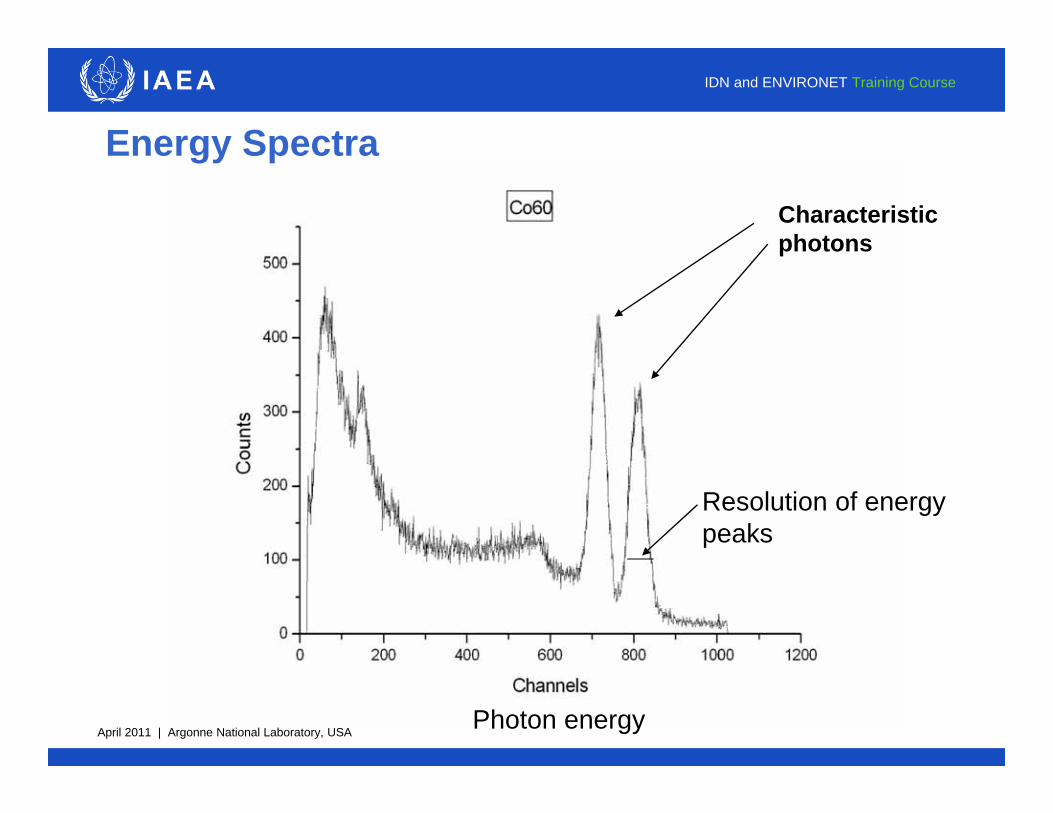
Energy Spectra
Photon energy
Characteristicphotons
Resolution of energypeaks
April 2011 | Argonne National Laboratory, USA
IDN and ENVIRONET Training Course
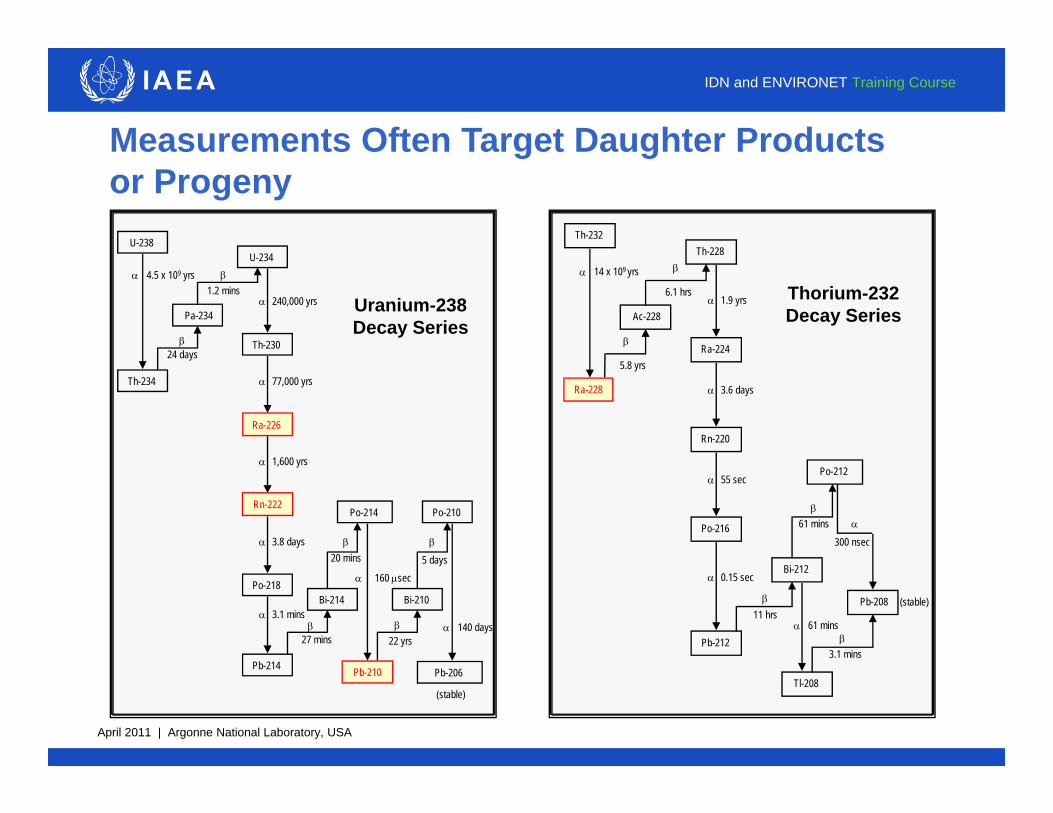
Measurements Often Target Daughter Products or Progeny
Pb-210
U-238
Th-234
U-234
Th-230
Ra-226
Po-218
Pb-214
Bi-214
Po-214
Bi-210
Po-210
22 yrs27 mins140 days
160 sec5 days20 mins
3.1 mins
3.8 days
1,600 yrs
77,000 yrs
240,000 yrs1.2 mins
24 days
4.5 x 10⁹ yrs
Pa-234
Pb-206
(stable)
Rn-222
Uranium-238Decay Series
Thorium-232Decay Series
Th-232
Ra-228
Th-228
Ra-224
Rn-220
Po-216
Pb-212
Bi-212
Po-212
Tl-208
3.1 mins
11 hrs61 mins
300 nsec61 mins
0.15 sec
55 sec
3.6 days
1.9 yrs6.1 hrs
5.8 yrs
14 x 109 yrs
Ac-228
Pb-208
(stable)
April 2011 | Argonne National Laboratory, USA
IDN and ENVIRONET Training Course
Secular Equilibrium Assumptions Are Often Important
Secular equilibrium: decay products are at the same activity concentration as parents
Occurs when undisturbed in-growth has taken place over several half-lives for daughter products
If assumption holds, allows one to measure a daughter and infer the activity concentration of the parent radionuclide
A very common assumption made by laboratory gamma spec
Can be an issue when daughters are mobile and samples are disturbed (e.g., Ra-226 decay chain)
For data quality reviews, important to understand exactly what a lab is measuring
April 2011 | Argonne National Laboratory, USA
IDN and ENVIRONET Training Course
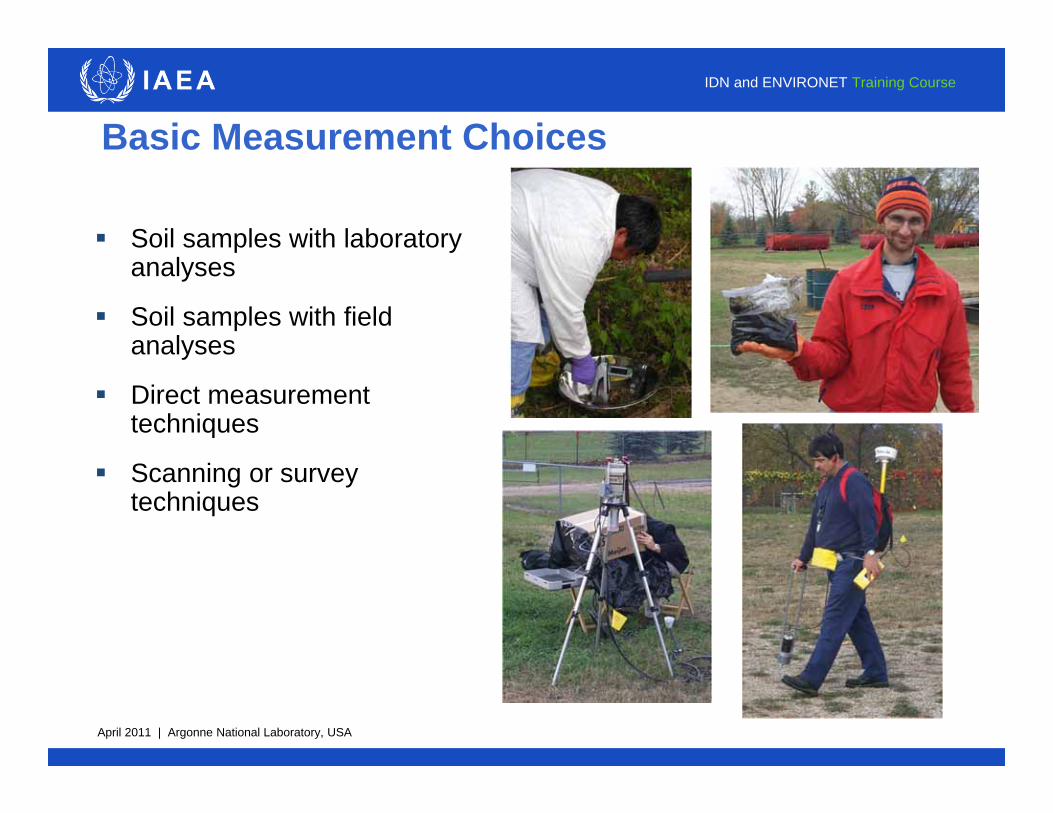
Basic Measurement Choices
Soil samples with laboratory analyses
Soil samples with field analyses
Direct measurement techniques
Scanning or survey techniques
April 2011 | Argonne National Laboratory, USA
IDN and ENVIRONET Training Course
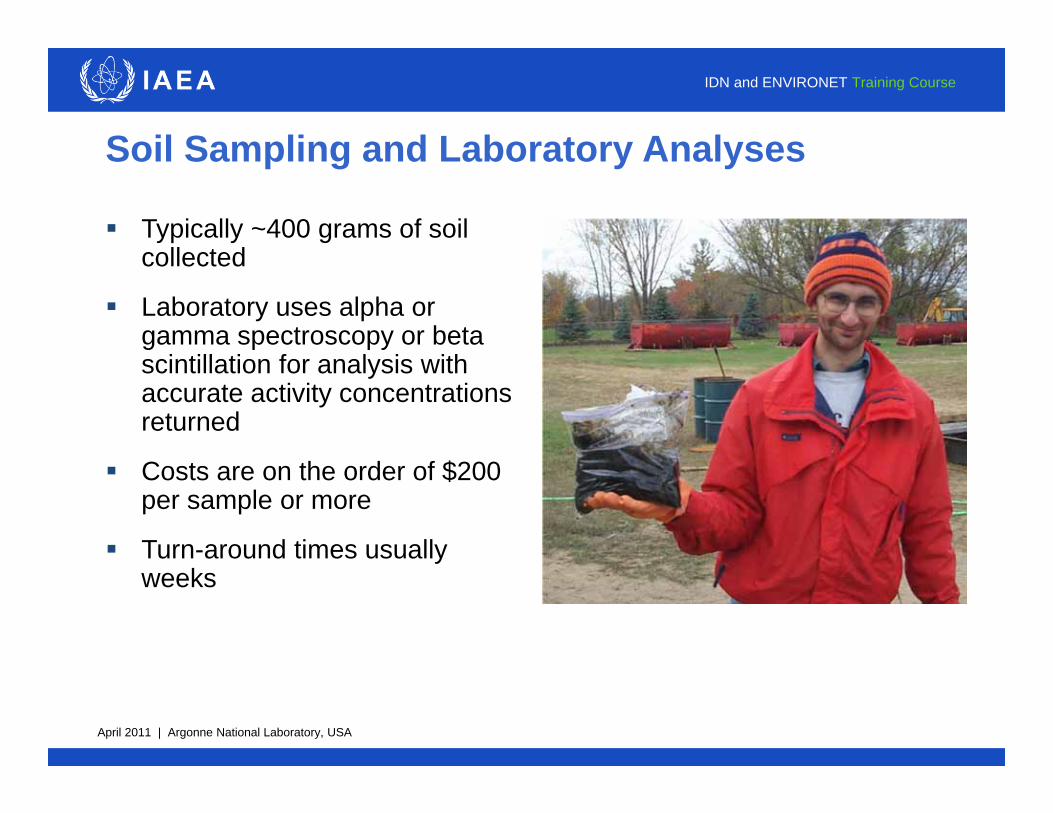
Soil Sampling and Laboratory Analyses
Typically ~400 grams of soil collected
Laboratory uses alpha or gamma spectroscopy or beta scintillation for analysis with accurate activity concentrations returned
Costs are on the order of $200 per sample or more
Turn-around times usually weeks
April 2011 | Argonne National Laboratory, USA
IDN and ENVIRONET Training Course
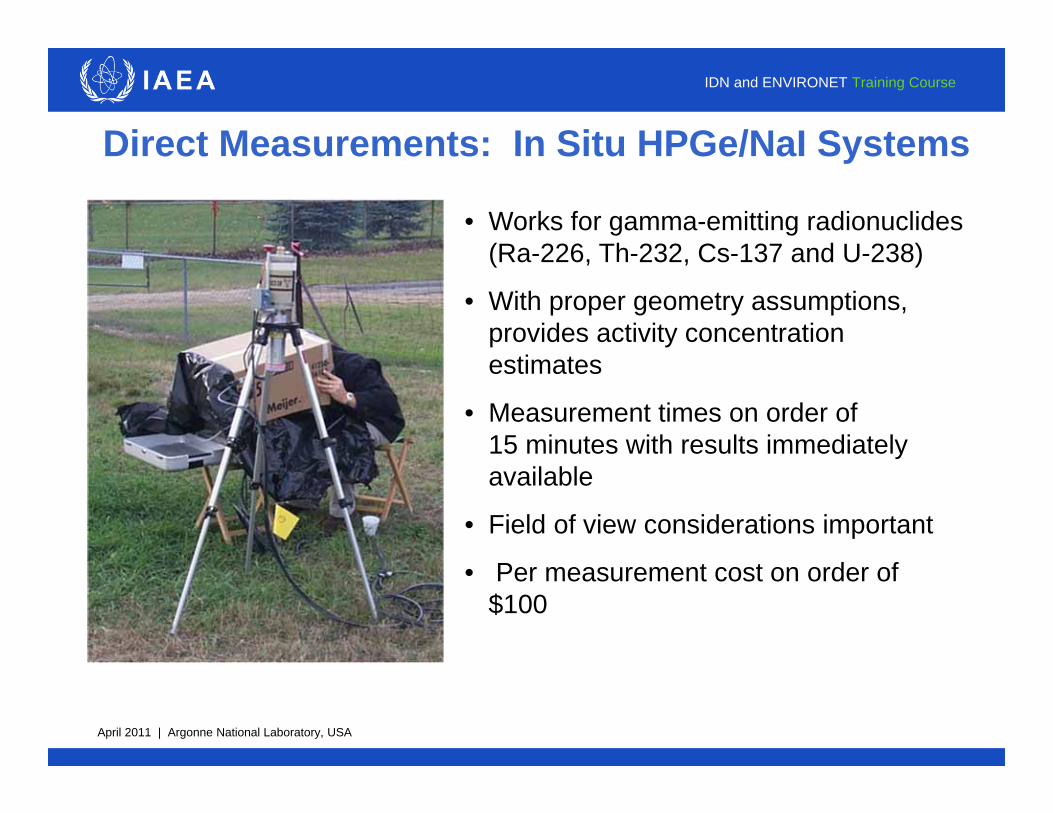
Direct Measurements: In Situ HPGe/NaI Systems
• Works for gamma-emitting radionuclides (Ra-226, Th-232, Cs-137 and U-238)
• With proper geometry assumptions, provides activity concentration estimates
• Measurement times on order of 15 minutes with results immediately available
• Field of view considerations important
• Per measurement cost on order of $100
April 2011 | Argonne National Laboratory, USA
IDN and ENVIRONET Training Course
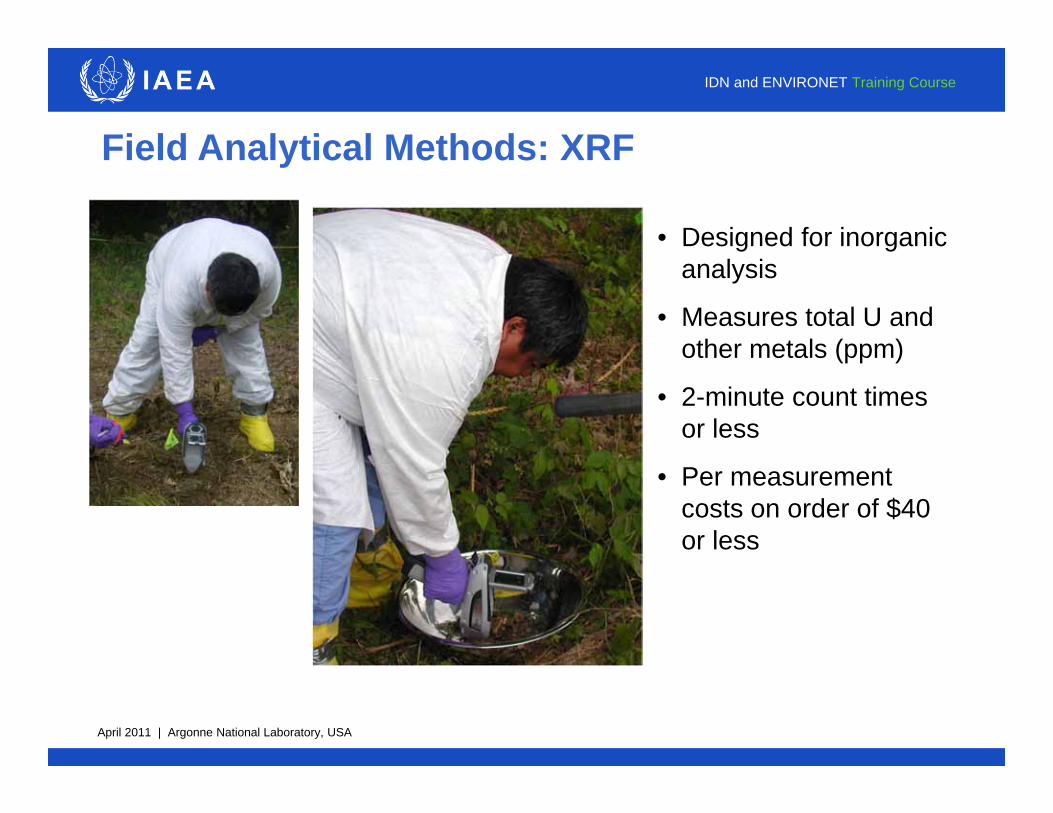
Field Analytical Methods: XRF
• Designed for inorganic analysis
• Measures total U and other metals (ppm)
• 2-minute count times or less
• Per measurement costs on order of $40 or less
April 2011 | Argonne National Laboratory, USA
IDN and ENVIRONET Training Course
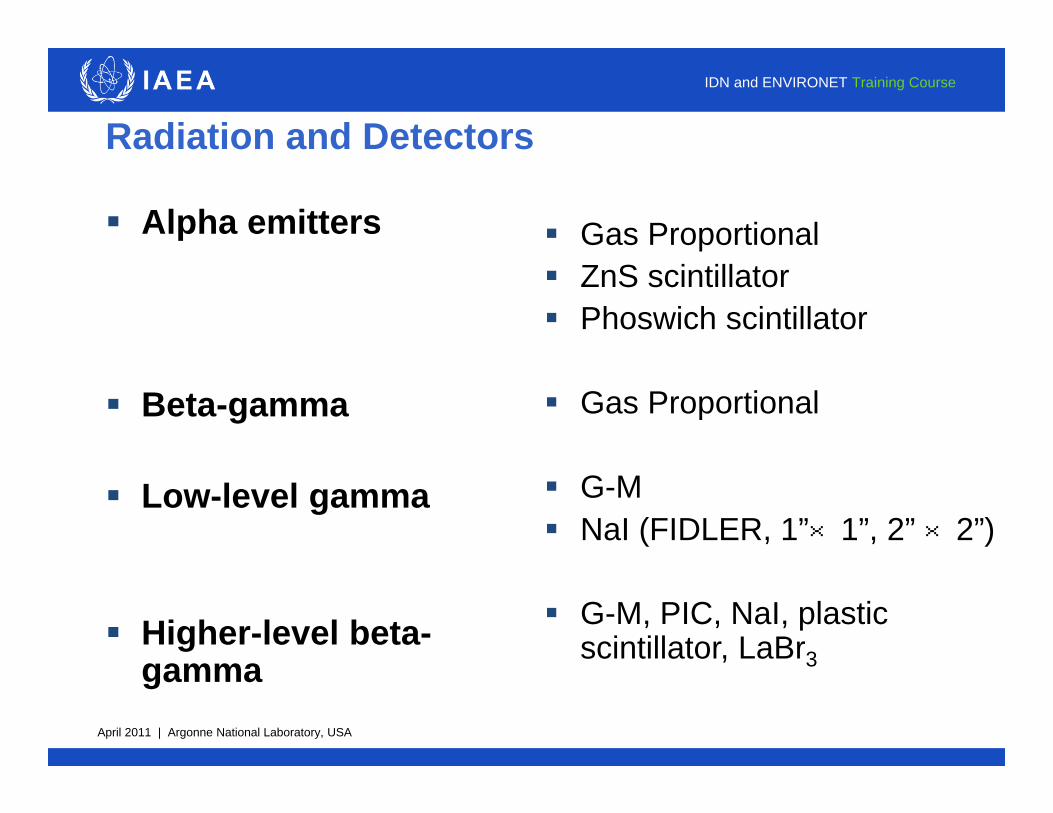
Radiation and Detectors
Alpha emitters
Beta-gamma
Low-level gamma
Higher-level beta-gamma
Gas Proportional ZnS scintillator Phoswich scintillator
Gas Proportional
G-M NaI (FIDLER, 1”×1”, 2” ×2”)
G-M, PIC, NaI, plastic scintillator, LaBr3
April 2011 | Argonne National Laboratory, USA
IDN and ENVIRONET Training Course
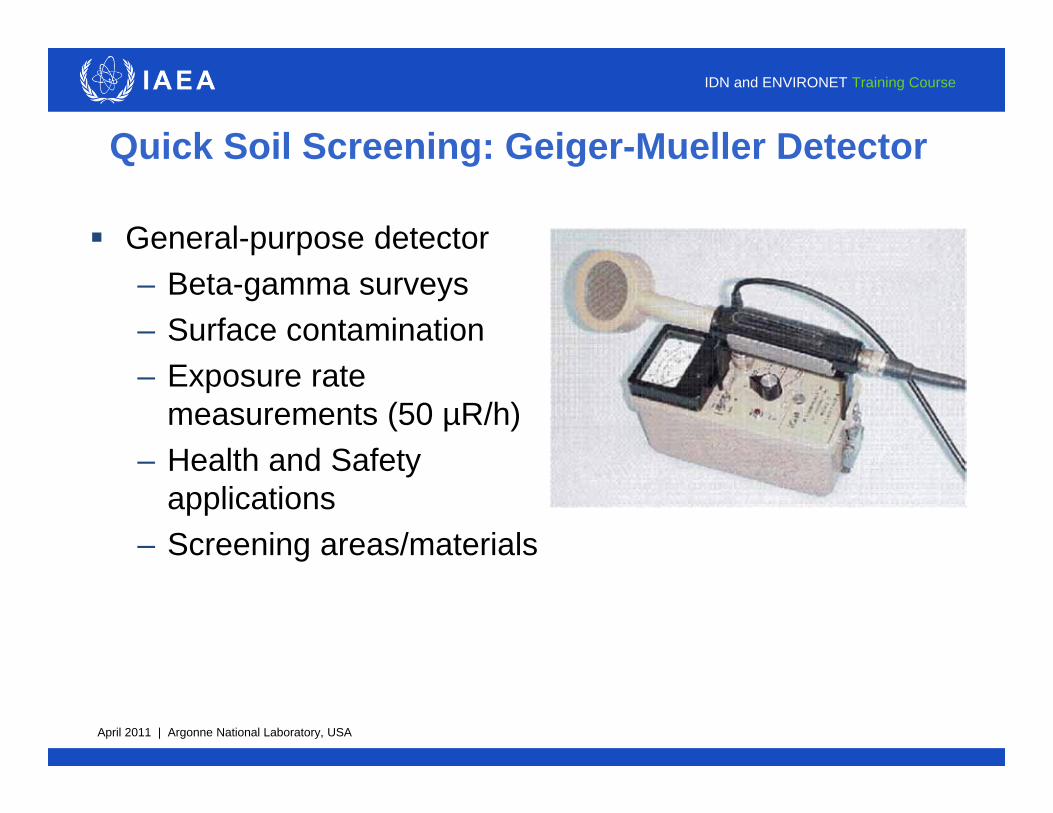
Quick Soil Screening: Geiger-Mueller Detector
General-purpose detector– Beta-gamma surveys– Surface contamination– Exposure rate
measurements (50 µR/h)– Health and Safety
applications– Screening areas/materials
April 2011 | Argonne National Laboratory, USA
IDN and ENVIRONET Training Course
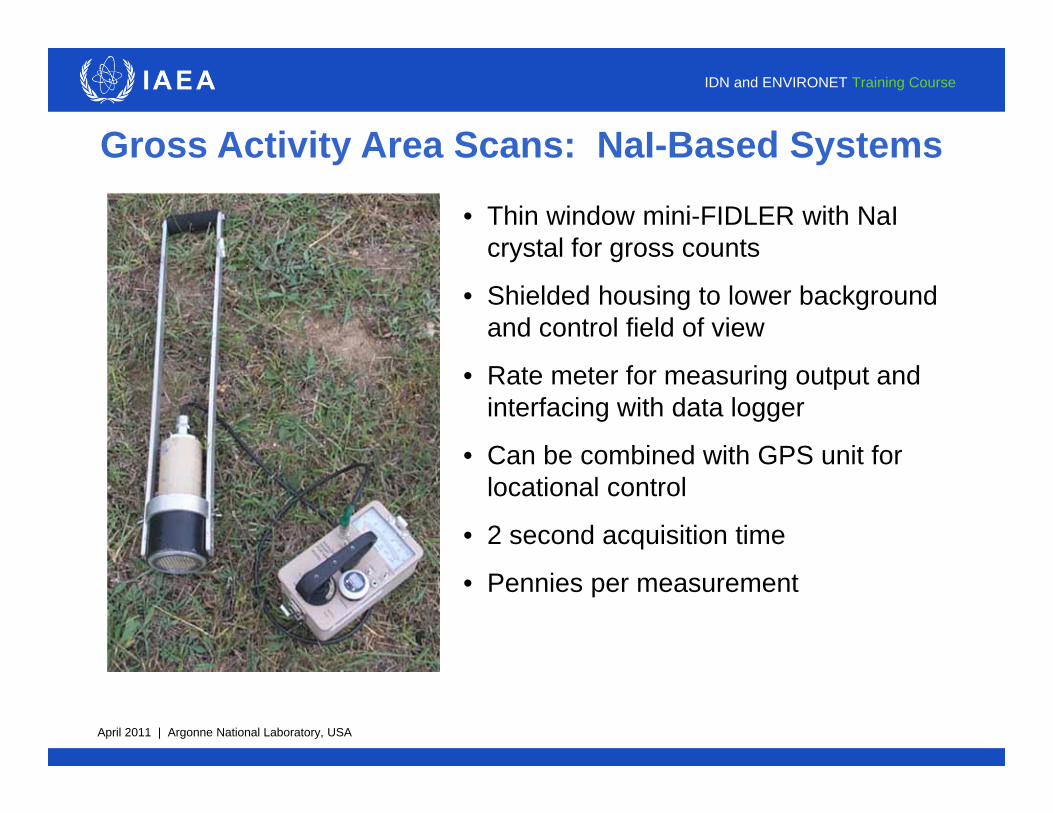
Gross Activity Area Scans: NaI-Based Systems
• Thin window mini-FIDLER with NaI crystal for gross counts
• Shielded housing to lower background and control field of view
• Rate meter for measuring output and interfacing with data logger
• Can be combined with GPS unit for locational control
• 2 second acquisition time
• Pennies per measurement
April 2011 | Argonne National Laboratory, USA
IDN and ENVIRONET Training Course
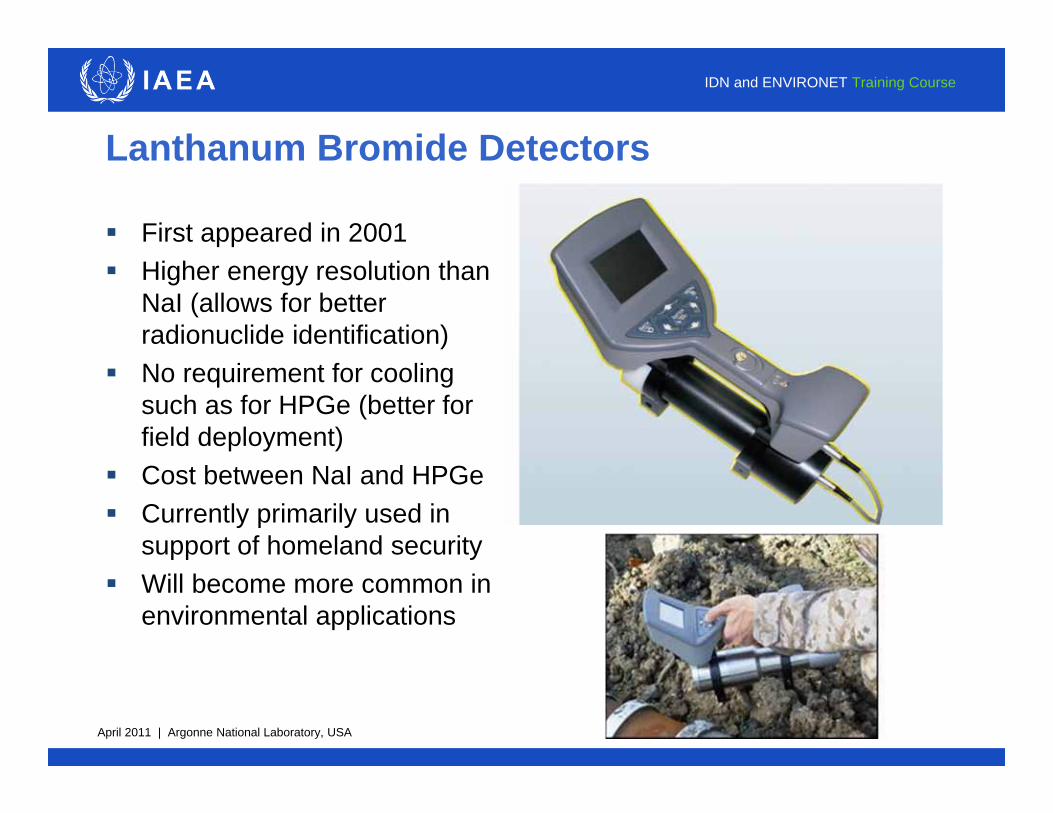
Lanthanum Bromide Detectors
First appeared in 2001 Higher energy resolution than
NaI (allows for better radionuclide identification)
No requirement for cooling such as for HPGe (better for field deployment)
Cost between NaI and HPGe Currently primarily used in
support of homeland security Will become more common in
environmental applications
April 2011 | Argonne National Laboratory, USA
IDN and ENVIRONET Training Course
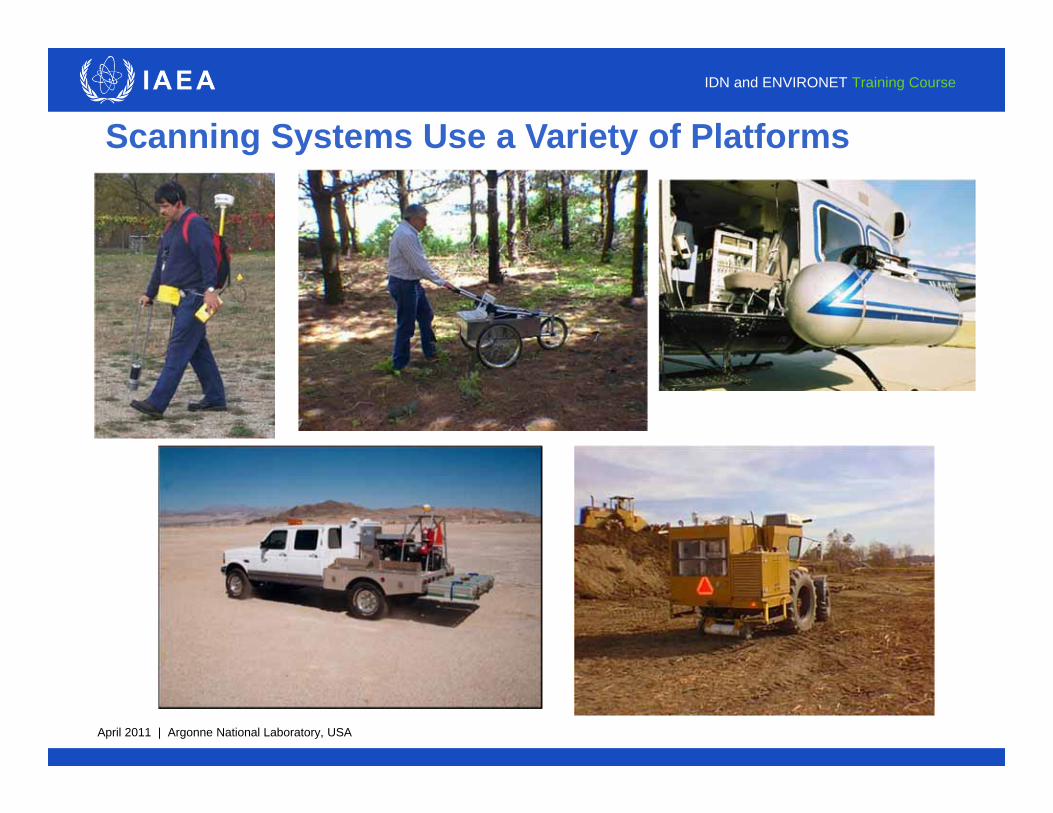
Scanning Systems Use a Variety of Platforms
April 2011 | Argonne National Laboratory, USA
IDN and ENVIRONET Training Course
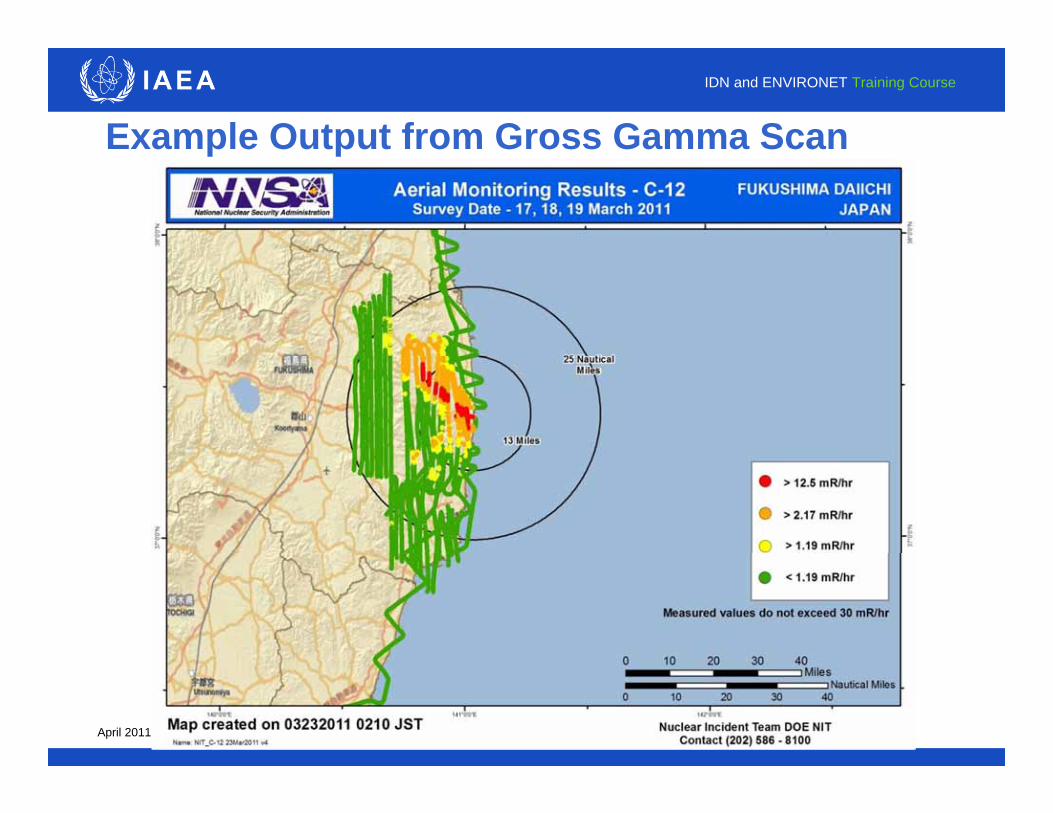
Example Output from Gross Gamma Scan
April 2011 | Argonne National Laboratory, USA
IDN and ENVIRONET Training Course
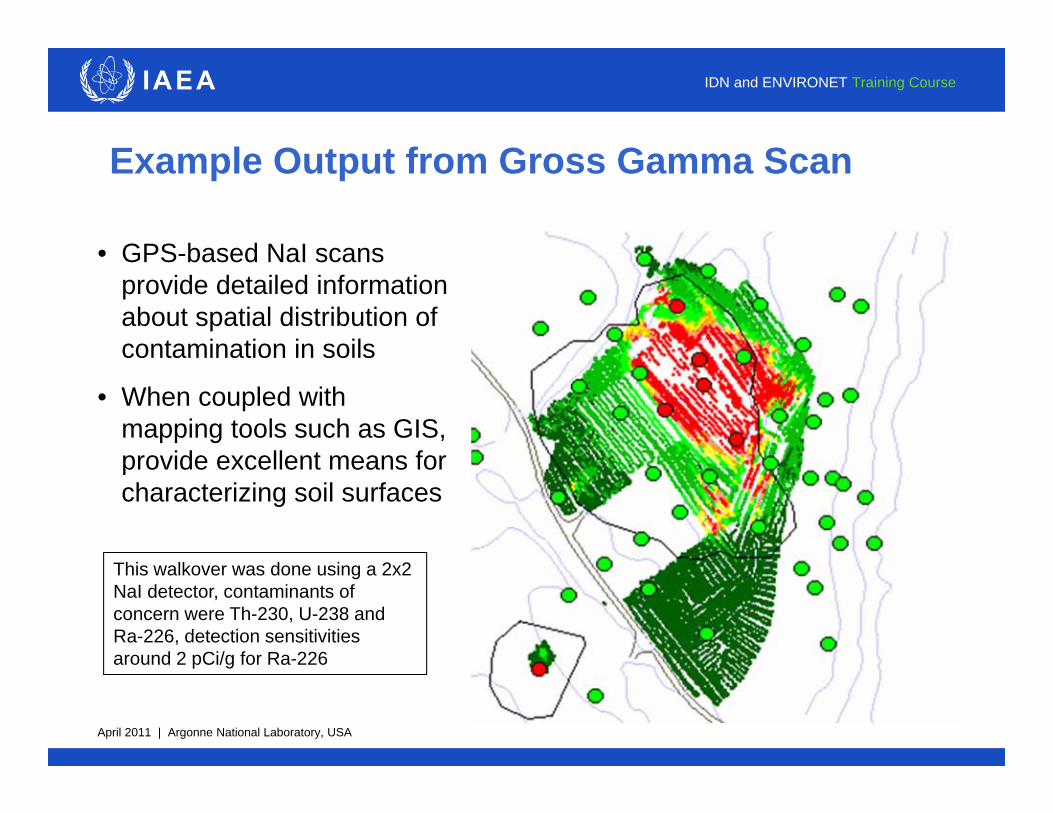
Example Output from Gross Gamma Scan
• GPS-based NaI scans provide detailed information about spatial distribution of contamination in soils
• When coupled with mapping tools such as GIS, provide excellent means for characterizing soil surfaces
This walkover was done using a 2x2 NaI detector, contaminants of concern were Th-230, U-238 and Ra-226, detection sensitivities around 2 pCi/g for Ra-226
April 2011 | Argonne National Laboratory, USA
IDN and ENVIRONET Training Course
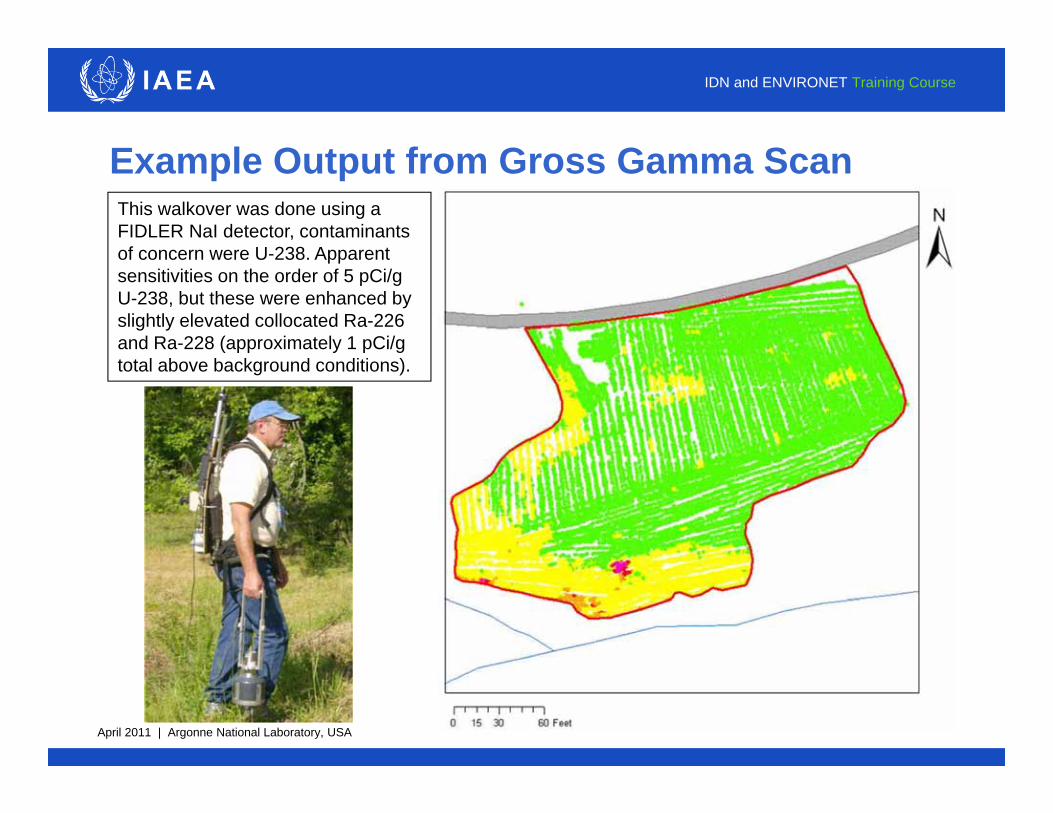
Example Output from Gross Gamma ScanThis walkover was done using a FIDLER NaI detector, contaminants of concern were U-238. Apparent sensitivities on the order of 5 pCi/g U-238, but these were enhanced by slightly elevated collocated Ra-226 and Ra-228 (approximately 1 pCi/g total above background conditions).
April 2011 | Argonne National Laboratory, USA
IDN and ENVIRONET Training Course
Example Output from Gross Gamma Scan
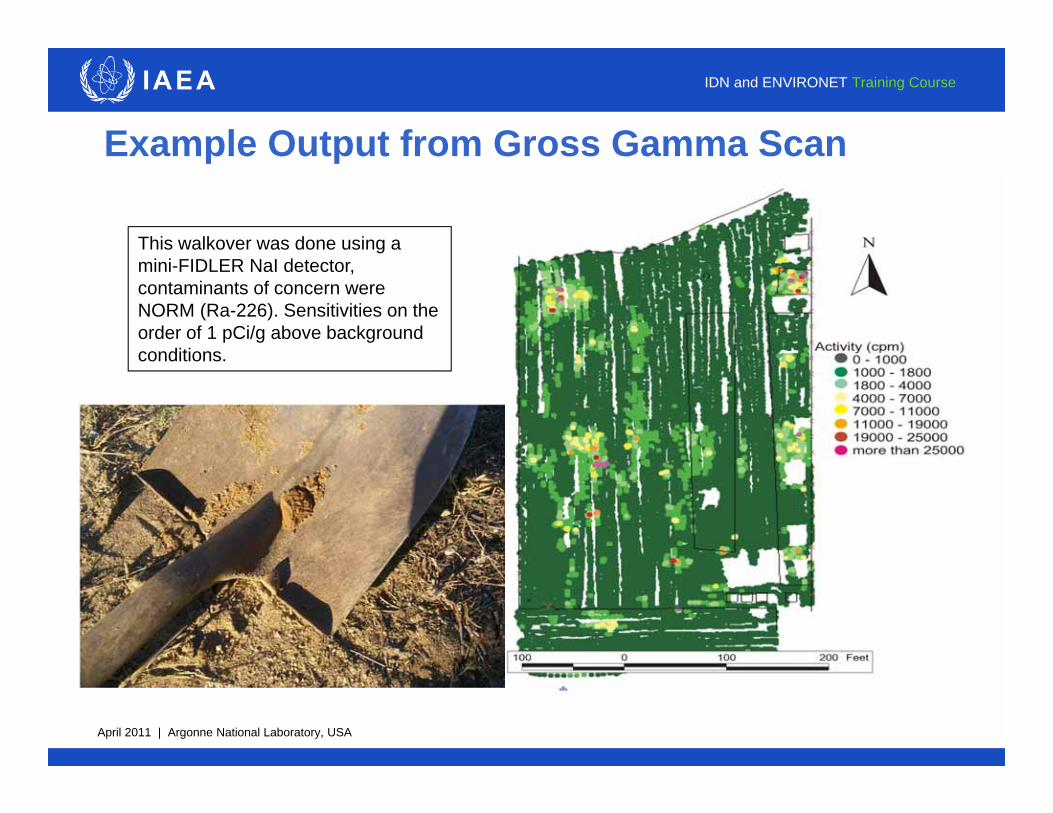
This walkover was done using a mini-FIDLER NaI detector, contaminants of concern were NORM (Ra-226). Sensitivities on the order of 1 pCi/g above background conditions.
April 2011 | Argonne National Laboratory, USA
IDN and ENVIRONET Training Course
Example Output from Gross Gamma Scan
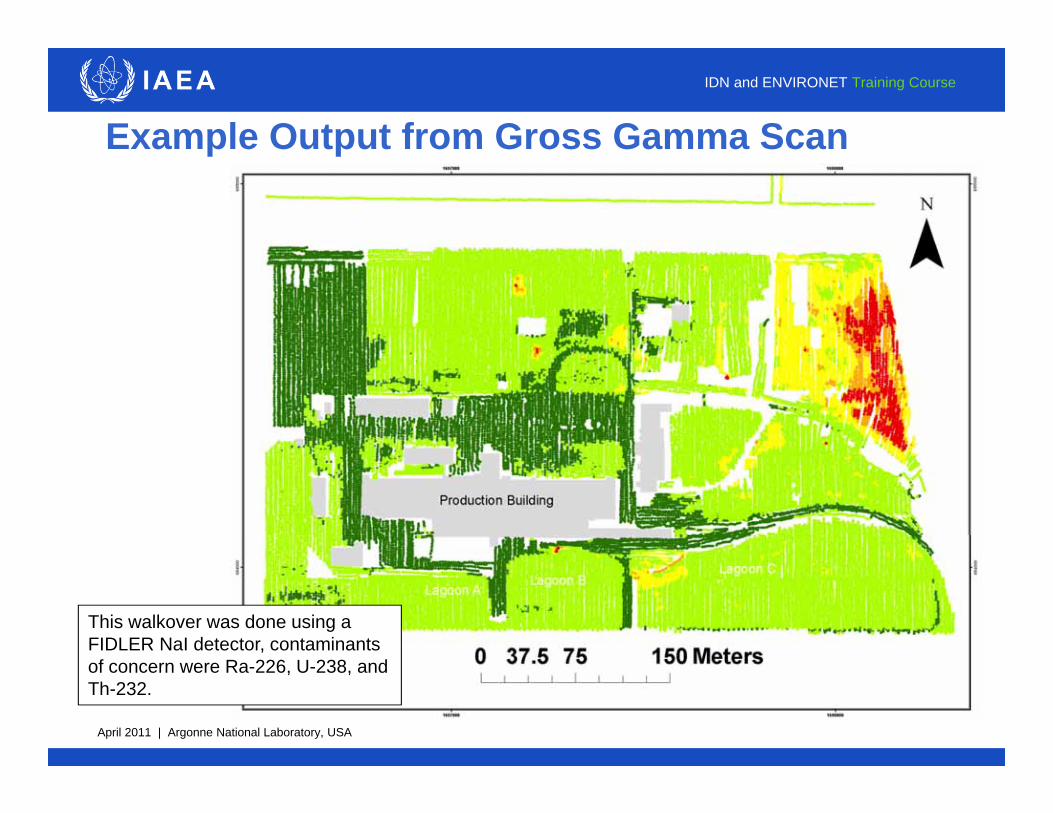
This walkover was done using a FIDLER NaI detector, contaminants of concern were Ra-226, U-238, and Th-232.
April 2011 | Argonne National Laboratory, USA
IDN and ENVIRONET Training Course
Concept of sensitivity, or detection limits, applies both to laboratory radionuclide-specific analyses and scanning measurements
Basic concept hinges on the idea that a “detection” should correspond to a result that one is confident is not “zero” or the absence of contamination
In the case of a laboratory measurement, this means a measurement result that is indicative of the presence of a particular radionuclide
In the case of a scanning measurement, this means a measurement result that is inconsistent with background readings
Measurement Sensitivities
April 2011 | Argonne National Laboratory, USA
IDN and ENVIRONET Training Course
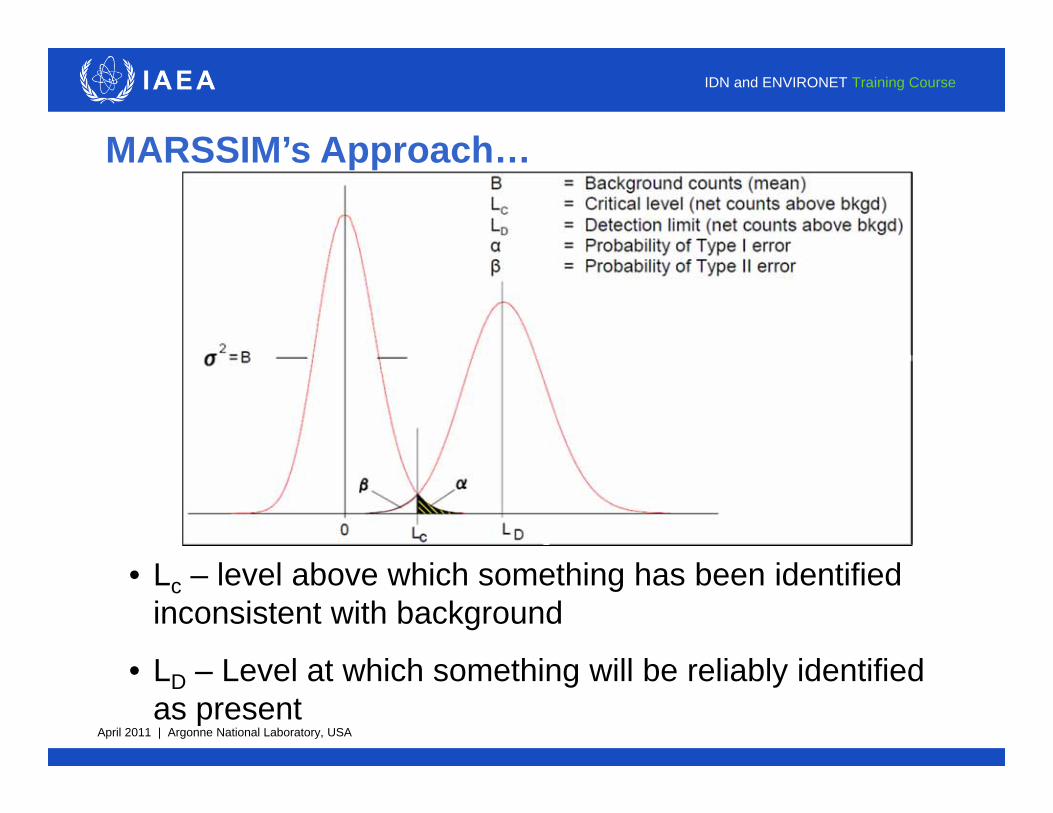
MARSSIM’s Approach…
• Lc – level above which something has been identified inconsistent with background
• LD – Level at which something will be reliably identified as present
April 2011 | Argonne National Laboratory, USA
IDN and ENVIRONET Training Course
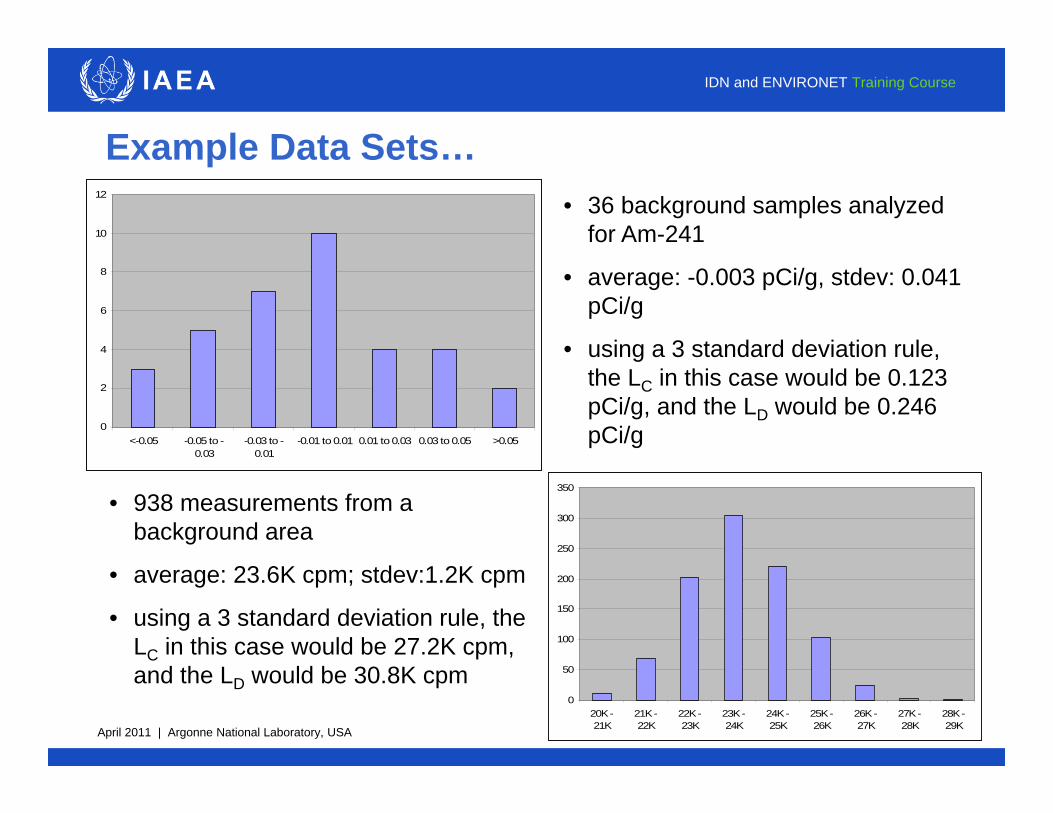
Example Data Sets…• 36 background samples analyzed
for Am-241
• average: -0.003 pCi/g, stdev: 0.041 pCi/g
• using a 3 standard deviation rule, the LC in this case would be 0.123 pCi/g, and the LD would be 0.246 pCi/g0
2
4
6
8
10
12
<-0.05 -0.05 to -0.03
-0.03 to -0.01
-0.01 to 0.01 0.01 to 0.03 0.03 to 0.05 >0.05
0
50
100
150
200
250
300
350
20K -21K
21K -22K
22K -23K
23K -24K
24K -25K
25K -26K
26K -27K
27K -28K
28K -29K
• 938 measurements from a background area
• average: 23.6K cpm; stdev:1.2K cpm
• using a 3 standard deviation rule, the LC in this case would be 27.2K cpm, and the LD would be 30.8K cpm
April 2011 | Argonne National Laboratory, USA
IDN and ENVIRONET Training Course
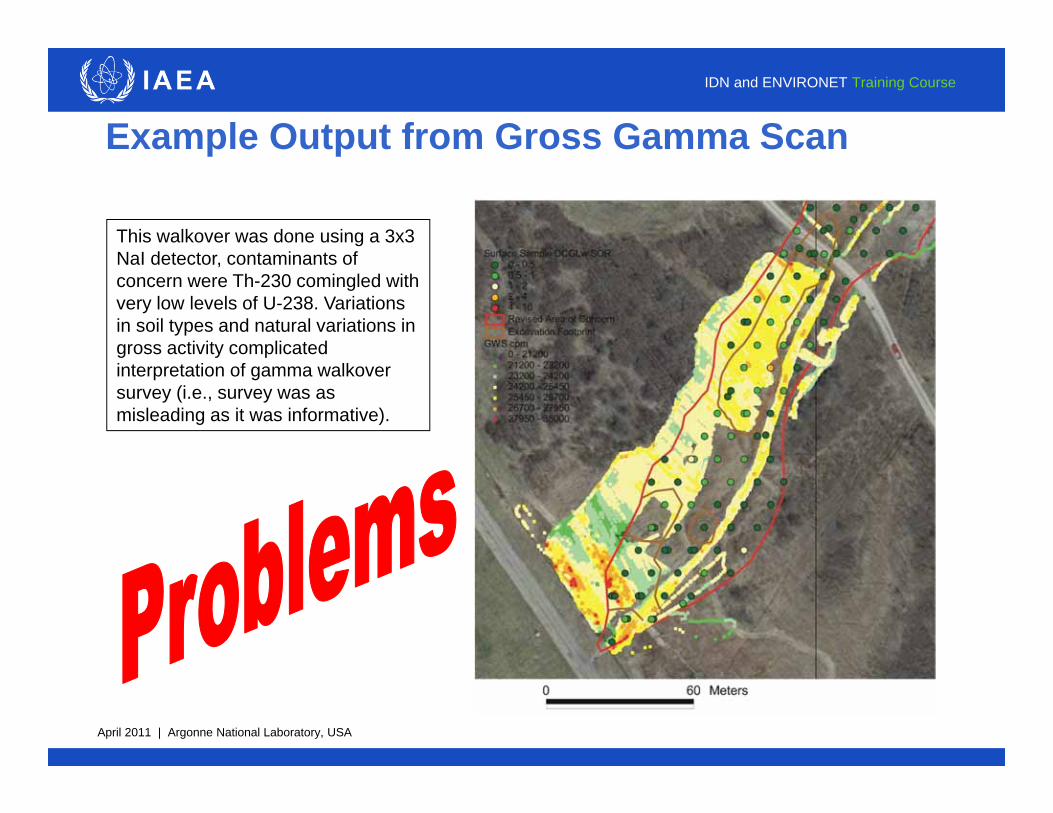
Example Output from Gross Gamma Scan
This walkover was done using a 3x3 NaI detector, contaminants of concern were Th-230 comingled with very low levels of U-238. Variations in soil types and natural variations in gross activity complicated interpretation of gamma walkover survey (i.e., survey was as misleading as it was informative).
April 2011 | Argonne National Laboratory, USA
IDN and ENVIRONET Training Course
Reducing Detection Limits…
For laboratory measurements, this means increasing measurement times and/or using better detectors and/or switching analytical methods
– Rule of thumb: should try to achieve a detection limit that is 10% of either background or DCGL standards
For scans, this means reducing background “noise”
– Switching detectors
– Collimating detectors
– Differentiating between different types of background materials
– Increasing measurement time typically has little beneficial impact for gross activity measurements
April 2011 | Argonne National Laboratory, USA
IDN and ENVIRONET Training Course