Embed Size (px)
Citation preview
Measuring regional science networks in China:a comparison of international and domestic bibliographicdata sources
S. Hennemann • T. Wang • I. Liefner
Received: 10 January 2011 / Published online: 18 May 2011� Akademiai Kiado, Budapest, Hungary 2011
Abstract Bibliographic databases are frequently used and analysed for the purpose of
assessing the capacity and performance of individual researchers or entire research sys-
tems. Many of the advantages and disadvantages are the subject of continued discussion in
the relevant literature, although only rarely with respect to the regional dimension of
scientific publication activity. The importance of the regional dimension of science is
reflected in many theoretical concepts, ranging from innovation system theories to terri-
torial cluster concepts and learning regions. This article makes use of the extensive
information found in bibliographic data and assesses the reliability of this information as a
proxy indicator for the spatial dimension of scientific collaboration in emerging economies.
This is undertaken using the example of the emerging field of biotechnology in China from
2000 onwards. Two data sets have been prepared: (1) the frequently used ISI Web ofKnowledge database (SCI-Expanded) and (2) the domestic Chinese Chongqing VIPdatabase. Both data sources were analysed using a variety of bibliometric and network
scientific methods. The structural and topological similarity of networks, built from co-
authorship data, is apparent between the two databases. At an abstract level, general
network forces are present, resulting in similar network sizes, clustering, or assortativity.
However, introducing additional complexity through regional subdivision reveals many
differences between the two data sources that must be accounted for in the analytic design
of future scientometric research in dynamic spaces.
Keywords China � Spatial scientometrics � Database comparison �Regional science networks � Biotechnology
Mathematics Subject Classification (2000) 62-07 � 62-09 � 05C82 � 91D30
S. Hennemann (&) � I. LiefnerDepartment of Geography, Economic Geography, Justus Liebig University of Giessen,Senckenbergstrasse 1, 35390 Giessen, Germanye-mail: [email protected]
T. WangSchool of Geography Science, Nanjing Normal University, 1 Wenyuan Road, Nanjing 210046, China
123
Scientometrics (2011) 88:535–554DOI 10.1007/s11192-011-0410-1
JEL Classification I23 � D85
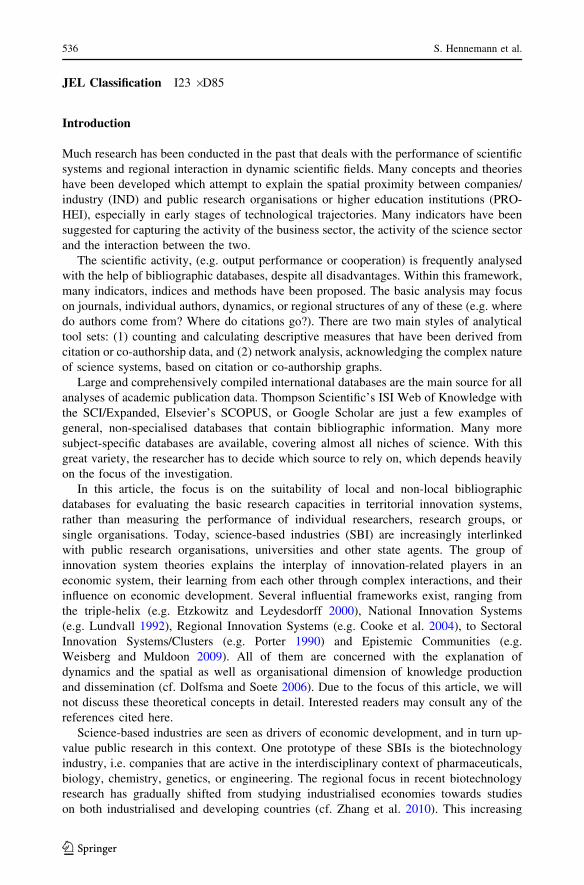
Introduction
Much research has been conducted in the past that deals with the performance of scientific
systems and regional interaction in dynamic scientific fields. Many concepts and theories
have been developed which attempt to explain the spatial proximity between companies/
industry (IND) and public research organisations or higher education institutions (PRO-
HEI), especially in early stages of technological trajectories. Many indicators have been
suggested for capturing the activity of the business sector, the activity of the science sector
and the interaction between the two.
The scientific activity, (e.g. output performance or cooperation) is frequently analysed
with the help of bibliographic databases, despite all disadvantages. Within this framework,
many indicators, indices and methods have been proposed. The basic analysis may focus
on journals, individual authors, dynamics, or regional structures of any of these (e.g. where
do authors come from? Where do citations go?). There are two main styles of analytical
tool sets: (1) counting and calculating descriptive measures that have been derived from
citation or co-authorship data, and (2) network analysis, acknowledging the complex nature
of science systems, based on citation or co-authorship graphs.
Large and comprehensively compiled international databases are the main source for all
analyses of academic publication data. Thompson Scientific’s ISI Web of Knowledge with
the SCI/Expanded, Elsevier’s SCOPUS, or Google Scholar are just a few examples of
general, non-specialised databases that contain bibliographic information. Many more
subject-specific databases are available, covering almost all niches of science. With this
great variety, the researcher has to decide which source to rely on, which depends heavily
on the focus of the investigation.
In this article, the focus is on the suitability of local and non-local bibliographic
databases for evaluating the basic research capacities in territorial innovation systems,
rather than measuring the performance of individual researchers, research groups, or
single organisations. Today, science-based industries (SBI) are increasingly interlinked
with public research organisations, universities and other state agents. The group of
innovation system theories explains the interplay of innovation-related players in an
economic system, their learning from each other through complex interactions, and their
influence on economic development. Several influential frameworks exist, ranging from
the triple-helix (e.g. Etzkowitz and Leydesdorff 2000), National Innovation Systems
(e.g. Lundvall 1992), Regional Innovation Systems (e.g. Cooke et al. 2004), to Sectoral
Innovation Systems/Clusters (e.g. Porter 1990) and Epistemic Communities (e.g.
Weisberg and Muldoon 2009). All of them are concerned with the explanation of
dynamics and the spatial as well as organisational dimension of knowledge production
and dissemination (cf. Dolfsma and Soete 2006). Due to the focus of this article, we will
not discuss these theoretical concepts in detail. Interested readers may consult any of the
references cited here.
Science-based industries are seen as drivers of economic development, and in turn up-
value public research in this context. One prototype of these SBIs is the biotechnology
industry, i.e. companies that are active in the interdisciplinary context of pharmaceuticals,
biology, chemistry, genetics, or engineering. The regional focus in recent biotechnology
research has gradually shifted from studying industrialised economies towards studies
on both industrialised and developing countries (cf. Zhang et al. 2010). This increasing
536 S. Hennemann et al.
123
interest in developing countries such as India and China poses new questions as to the
validity of bibliographic databases.
One significant problem is the international bias that is inherent to the large databases.
Cultural factors, language barriers, and strategic and political behaviour, however, may
lead to different analytical patterns, especially in non-English-speaking innovation sys-
tems. It is mainly international analyses and the impact of S&T systems in different
countries on the global community which can be traced, but when it comes to sub-national
spatial scales, most of the SCI data may deliver distorted pictures of the main origin of
regional knowledge production.
The aim of this article is to compare two databases—one being international, one having
a domestic focus—on three levels of abstraction in a network produced from co-authorship
data: (1) the systemic level of the network and its topology, (2) the individual node
characteristics, and (3) spatial analysis on the node level and regionally grouped aggregates
of centralities in the networks.
This will be done in order to assess the range of application of bibliometric network
analysis in the context of developing economies and their integration into the global
knowledge system. Furthermore, this article acknowledges two major trends: (1) the
increasing relevance of large developing countries on the global science system, and (2)
the increasing use of network science methods and tools in scientometrics (cf. Otte and
Rousseau 2002). It thus contributes to the recent discussion of spatial scientometrics (cf.
Frenken et al. 2009).
Although many authors highlight the great reliability and the true social network
characteristics of co-authorship networks (Newman and Park 2003, p. 036122-6), there is
still considerable debate as to the pros and cons of this data. This article will not concern
itself with the disadvantages of bibliographic data in general or of co-authorship data as a
proxy indicator for collaboration and knowledge production, as this has been extensively
discussed elsewhere (cf. Royle et al. 2007; Katz and Martin 1997; Laudel 2002; Lundberg
et al. 2006, among others). However, the number of papers that use bibliographic data is, in
itself, a qualification for this method (Royle et al. 2007, p. 64).
The remainder of the article is organised as follows: In ‘‘Bibliographic database com-
parison, co-publication and regional analyses of the Chinese science system’’ section, the
existing literature on relevant topics will be briefly examined, followed by an introduction
to the regional specifics of the Chinese science and technology (S&T) system in general
and the biotechnology sector in particular to enable the reader to follow the interpretation
of the results. ‘‘Data and methods’’ section will explain the data and methods. In ‘‘Results’’
section, all results will be presented, which are then discussed and summarised in ‘‘Dis-
cussion and conclusion’’ section. Finally, we will provide some ideas for further research
on this topic and draw conclusions from our results.
Bibliographic database comparison, co-publication and regional analysesof the Chinese science system
Although many Chinese journals are increasingly indexed in international databases (Wang
et al. 2007; Basu 2010), there is still a significant difference between international and
domestic databases with respect to the regional dimension of knowledge production. This
is the case even despite the trend to include Chinese language articles in the SCI-index (Lin
and Zhang 2007, p. 558). Over time, there has generally been significant reorganisation in
the data structure of international databases. Chinese and other non-English-language
Measuring regional science networks in China 537
123
journals were successively added to the SCI-Expanded. The Scopus index also contains
many non-English-language journals in an attempt to compensate for Anglo-Saxon biases
and to improve the comprehensiveness of the indices. The two databases form the
benchmark with respect to coverage, as recently evaluated by Norris and Oppenheim
(2007). However, Meho and Yang (2007) note that the difference between the two dat-
abases is significant when the impact of citations is analysed. Therefore, coverage and
comparability of sources are important prerequisites for the validity and reliability of
bibliometric calculations, especially with respect to regionally oriented research questions.
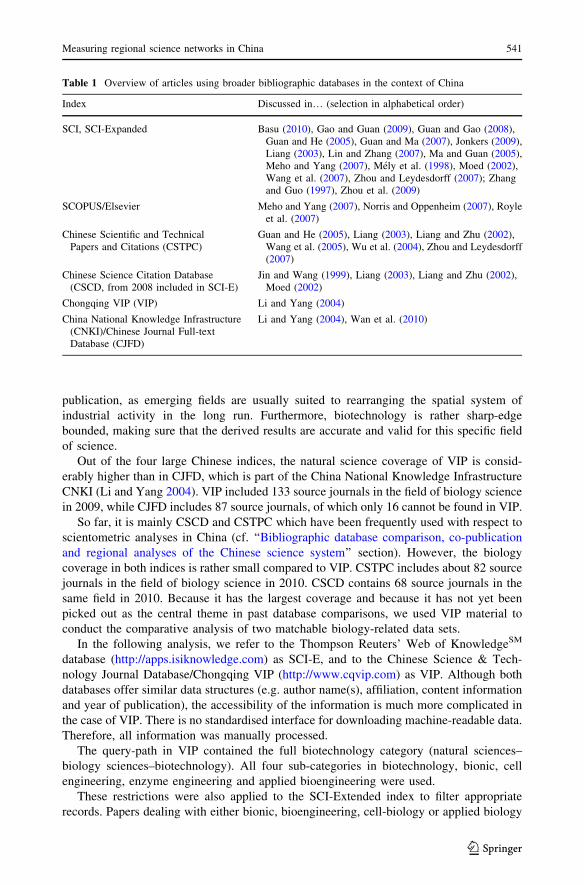
In the last decade, there were a significant number of studies concerned with the state
and development of the scientific knowledge production in China, both with a domestic
Chinese focus and with a focus on the international integration of China into the global
science system (Table 1).
Zhang and Guo (1997) were two of the first authors to perform an analysis of collab-
oration activity and international integration of Chinese scholars on a larger scale based on
SCI data. They made distinctions between a wide range of disciplines and found minor
differences in basic features of co-authorships (e.g. mean number of authors, single author
papers). They also made distinctions in the organisational level, i.e. co-authorships from
the same institute were separated from those involving different institutes. In the same
way, Wang et al. (2007) performed a classical bibliometric analysis (i.e. journal analysis)
based on ten of China’s English-language scientific journals indexed in the SCI-Expanded
to draw conclusions on strategies for publishers and authors in terms of the international
visibility of their work. They used indicators such as impact factors and citation fre-
quencies, and found that even though these journals potentially address global authorship
and readership communities, the international acceptance of the journals is nevertheless
marginal due to reasons including specific (= local) titles or policy directives to publish in
international journals. The relevance of international collaboration activity for the overall
international visibility of Chinese researchers had been investigated previously by Ma and
Guan (2005) based on analyses of SCI-Expanded data. They provided a thematic focus on
molecular biology and concluded that foreign collaboration contributes significantly to the
improvement of the connectivity and international visibility of the Chinese science system.
Basu (2010) builds upon this idea by assessing the impact of the number of indexed
journals in the ISI-Expanded on bibliometrically derived performance indicators of
national science systems. Basu found that the number of papers that are published on
average in a given national journal positively influences national science productivity
measures. In the case of China, this indicator is almost twice as high as the world average.
Based on this result, the author challenges the overall increase of the performance of the
Chinese science system.
Guan and Ma (2007) as well as Lin and Zhang (2007) used the emerging field of nano-
sciences to show the increasing integration of China into the global knowledge system in a
young, dynamic and interdisciplinary field of science. Both articles are based on ISI-
Expanded data. Guan and Gao (2008) benchmark China against the US, UK, Germany,
Japan and India in the field of bioinformatics. Their main finding is the gradual integration
into the international science arena. Of the six countries, however, China is the least cited
nation. Lin and Zhang (2007) are concerned with relations between language preference,
publication patterns and community formation in international nano-science journals. Their
interesting result is the newly emerging bias in the SCI-Expanded index towards Chinese
language journals compared to other non-English languages. Recently, Thompson Scien-
tific has even enhanced its index by including a large number of Chinese journals that
exclusively publish in Chinese in order to improve the overall coverage. Whether or not
538 S. Hennemann et al.
123
this may affect the validity and reliability of bibliometric regional science studies will not
be part of the main focus of this article.
Regional innovation studies based on bibliographic data are gaining importance with the
increasing availability of data on the one hand, and with the improvement of the analytical
tool set on the other hand. Frenken et al. (2009) discuss concepts for the agenda of spatial
scientometrics in general. However, there are still only a small number of contributions
that deal explicitly with regional innovation or science system studies from a Chineseperspective. One of these examples is the paper by Gao and Guan (2009). A second is the
work of Jonkers (2009), and a third example is from Zhou et al. (2009). A fourth example
by Liefner and Hennemann (2011) goes beyond classical bibliometrics in employing
bibliographic data in a regional innovation network perspective, i.e. on a sub-national
level. All three articles use SCI-Expanded data to assess the international presence of
China in the global science arena in different scientific fields (e.g. Jonkers) or seek to
evaluate the regional contribution within this internationalisation process (Liefner and
Hennemann). Gao and Guan (2009) introduce a scale adjustment into citation indicators
and reveal the overall weak relative performance (i.e. impact) of the Chinese system on
global science. Zhou et al. (2009) use SCI-E data for their comprehensive analysis of the
regional contributions and international collaboration patterns in the Chinese academic
system and found highly skewed contributions across the Chinese provinces.
Jonkers (2009) evaluates the changing patterns of co-publication activity of Chinese
researchers with their foreign counterparts. In the field of molecular life sciences, the
geographic variation in international co-publications is largely determined by the size of
the Chinese community in the respective country. This result shows strong features of
networking activity and the power of social ties over larger distances. In most science sub-
systems, epistemic communities, i.e. groups of researchers who share a common intel-
lectual and cultural background, seem to interact with and exert influence on the spatial
reach of cooperation ties (Haas 1992). Royle et al. (2007) approach the same topic with
Elsevier databases and arrive at comparable results, but add an explicit political dimension
to their explaining factors of international co-authorship determinants.
Apart from studies about the internationalisation of the Chinese science system, Chinese
policy makers and scholars are becoming increasingly interested in domestic spatial pat-
terns and their variation over time. However, there are few internationally published
examples of comparative science system studies based on bibliometric analyses working
on sub-national levels, although this is also part of the focus of Chinese researchers. They
usually employ simple bibliometric measures such as counting article contributions to
journals, only seldom attributing this to spatial scales (one of the few exceptions is Deng
and He 2004). Interestingly, the authors use SCI-E data to reveal intra-country structures in
China. One central finding is that the inter-provincial collaboration activity is greater than
the intra-provincial activity.
Domestic Chinese bibliographic indices
There are several bibliographic full-text databases available in China. Two of these have
been used predominantly in bibliometric studies so far. The first is the Chinese Science
Citation Database (CSCD) that is discussed in Jin and Wang (1999). The CSCD was
created by the Documentation and Information Center of the Chinese Academy of Sci-
ences, and has been included in the SCI-Expanded since 2008 (cf. press release of
Thompson Reuters from 4 December 2007). The second index is compiled by the Institute
of Scientific and Technical Information of China. Detailed information about the Chinese
Measuring regional science networks in China 539
123
Science and Technical Papers and Citations Index (CSTPC) can be found in Wu et al.
(2004).
Today, two other indices are more frequently used. The first is the Chinese Journal Full-
text Database (CJFD), and the second is the Chinese Science and Technology Journal
Database Chongqing VIP (VIP). The CJFD was created by the Tsinghua University Beijing
in 1999. The VIP Database was established by the CQVIP Corporation in 1989.
Liang and Zhu (2002) use data from the CSTPC and CSCD and found different patterns
to those revealed by international databases (p. 290f.). According to their results, intra-
regional papers are more common (*70%, p. 298) than inter-regional ones. This share
reflects results found some years later by Wang et al. (2005) using the same data source
(CSTPC). The intra-regional effect is decreasing slightly over time, but most of the activity
is intra-organisational anyway (e.g. co-publication within the same university/department),
rather than crossing organisational boundaries. Zhou and Leydesdorff (2007) undertake a
comparison between CSTPC and SCI databases with respect to citations. They employ a
network approach and find large structural dissimilarities between the two sources, but do
not reflect on sub-national patterns. The focus of the comparison of the SCI index and the
CSTPC index by Guan and He (2005) was on the fields of computer sciences, automation
and software. They used several techniques based on the impact factor to evaluate index
differences in science performance indication. However, they did not evaluate their
analysis with respect to spatial factors and conditions. Previously, Liang (2003) had
compared the SCI to two Chinese indices (CSTPC, CSCD) and concluded that with respect
to research performance evaluation, there is a strong regional pattern difference between
national and international databases, with national sources providing a much less dispersed
picture of regional activity (measured by simple paper count frequencies). Based on this,
Liang concludes that the SCI is the much more sensitive indicator for evaluating regional
research performance.
In summary, Moed (2002) as well as Ren and Rousseau (2002) already mentioned that it
is important to use domestic Chinese and international databases according to the research
focus. An analysis with a purely national perspective would need to use data from domestic
databases such as the CSCD. Comprehensive pictures of the situation would only be pos-
sible with a combination of indices (ibid., p. 295). Mely et al. (1998) suggest that the SCI
database is best suited for evaluating research activity of an international standard. How-
ever, although SCI-Expanded has included the CSCD since 2008, the structural and regional
co-authorship patterns and networks derived from co-authorships are still very different,
especially with respect to regional research foci, as our analysis will show.
Data and methods
We decided to restrict the data compilation to the field of biotechnology for several
reasons. Firstly, this field is a continually emerging one, i.e. the dynamics in publication
activity offer great insight into evolutionary aspects of sciences. This is a crucial and
frequently investigated part of academic knowledge production in conjunction with
regional development. Bibliometrics are often used for this purpose, also in the analysis of
S&T systems in developing countries such as China (cf. Zhou and Leydesdorff 2006).
Moreover, biotechnology offers great potential for university-industry linkages. The
regional dimension of basic research results, inherent to scientific papers, is of interest for
policy makers, or at least the collaboration activity behind the outcome in the form of a
540 S. Hennemann et al.
123
publication, as emerging fields are usually suited to rearranging the spatial system of
industrial activity in the long run. Furthermore, biotechnology is rather sharp-edge
bounded, making sure that the derived results are accurate and valid for this specific field
of science.
Out of the four large Chinese indices, the natural science coverage of VIP is consid-
erably higher than in CJFD, which is part of the China National Knowledge Infrastructure
CNKI (Li and Yang 2004). VIP included 133 source journals in the field of biology science
in 2009, while CJFD includes 87 source journals, of which only 16 cannot be found in VIP.
So far, it is mainly CSCD and CSTPC which have been frequently used with respect to
scientometric analyses in China (cf. ‘‘Bibliographic database comparison, co-publication
and regional analyses of the Chinese science system’’ section). However, the biology
coverage in both indices is rather small compared to VIP. CSTPC includes about 82 source
journals in the field of biology science in 2010. CSCD contains 68 source journals in the
same field in 2010. Because it has the largest coverage and because it has not yet been
picked out as the central theme in past database comparisons, we used VIP material to
conduct the comparative analysis of two matchable biology-related data sets.
In the following analysis, we refer to the Thompson Reuters’ Web of KnowledgeSM
database (http://apps.isiknowledge.com) as SCI-E, and to the Chinese Science & Tech-
nology Journal Database/Chongqing VIP (http://www.cqvip.com) as VIP. Although both
databases offer similar data structures (e.g. author name(s), affiliation, content information
and year of publication), the accessibility of the information is much more complicated in
the case of VIP. There is no standardised interface for downloading machine-readable data.
Therefore, all information was manually processed.
The query-path in VIP contained the full biotechnology category (natural sciences–
biology sciences–biotechnology). All four sub-categories in biotechnology, bionic, cell
engineering, enzyme engineering and applied bioengineering were used.
These restrictions were also applied to the SCI-Extended index to filter appropriate
records. Papers dealing with either bionic, bioengineering, cell-biology or applied biology
Table 1 Overview of articles using broader bibliographic databases in the context of China
Index Discussed in… (selection in alphabetical order)
SCI, SCI-Expanded Basu (2010), Gao and Guan (2009), Guan and Gao (2008),Guan and He (2005), Guan and Ma (2007), Jonkers (2009),Liang (2003), Lin and Zhang (2007), Ma and Guan (2005),Meho and Yang (2007), Mely et al. (1998), Moed (2002),Wang et al. (2007), Zhou and Leydesdorff (2007); Zhangand Guo (1997), Zhou et al. (2009)
SCOPUS/Elsevier Meho and Yang (2007), Norris and Oppenheim (2007), Royleet al. (2007)
Chinese Scientific and TechnicalPapers and Citations (CSTPC)
Guan and He (2005), Liang (2003), Liang and Zhu (2002),Wang et al. (2005), Wu et al. (2004), Zhou and Leydesdorff(2007)
Chinese Science Citation Database(CSCD, from 2008 included in SCI-E)
Jin and Wang (1999), Liang (2003), Liang and Zhu (2002),Moed (2002)
Chongqing VIP (VIP) Li and Yang (2004)
China National Knowledge Infrastructure(CNKI)/Chinese Journal Full-textDatabase (CJFD)
Li and Yang (2004), Wan et al. (2010)
Measuring regional science networks in China 541
123
and permutations of any of these were included in the analysis.1 Furthermore, at least one
of the authors had to be affiliated with a Chinese organisation to ensure comparability
between the two data sets. Both databases recorded only a small number of papers before
the year 2000. This reflects the immaturity of the selected field in China before 2000.
Hence, the comparison of the two databases was restricted to the time period from 2000 to
2009.
The raw data was further processed and cleaned in order to be able to identify co-
authored papers and to localise the affiliation. A node in the network is defined by the
affiliation, rather than by an individual author. Hence, an edge between any two organi-
sations is defined if researchers from those organisations co-authored a paper. Conse-
quently, papers co-authored only by members of a single organisation were not included.
The publication data for a specific year was used in an evolving way for interpreting
collaboration, i.e. a co-authored paper was assumed to open a ‘‘window of cooperation’’ for
a certain period of time (in this case three years), even though no other paper may have
been written in the following years. After three years without a jointly written paper, the
link was removed from the network. This was also done to smooth the fluctuating data,
especially in the first years of the analysis.
For the spatial analysis, all affiliations had to be geo-coded using the Google-Maps API.
Instead of identifying the actual location of the organisation, which would have been
extremely complex and fault-prone, only the city centres were used. Consequently, the
spatial accuracy is limited to the typical sizes of cities, around 10–20 km.
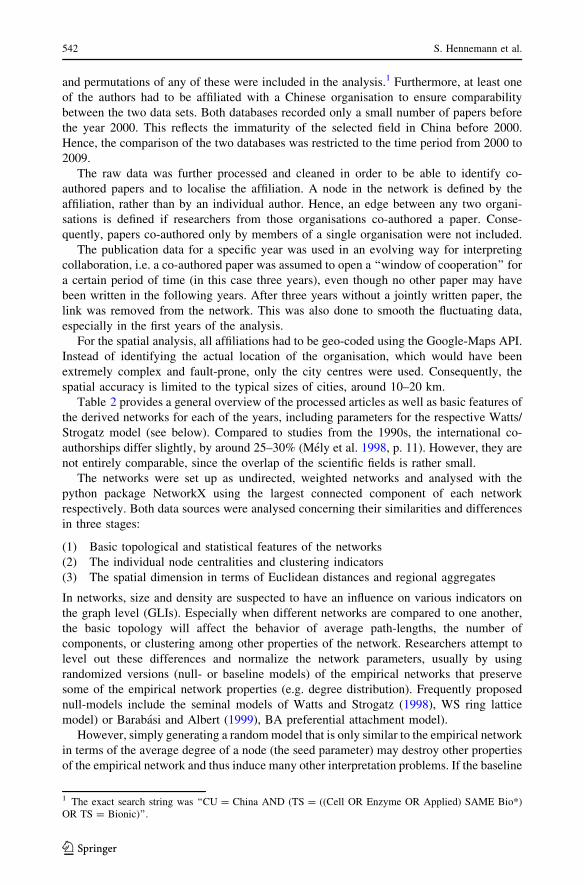
Table 2 provides a general overview of the processed articles as well as basic features of
the derived networks for each of the years, including parameters for the respective Watts/
Strogatz model (see below). Compared to studies from the 1990s, the international co-
authorships differ slightly, by around 25–30% (Mely et al. 1998, p. 11). However, they are
not entirely comparable, since the overlap of the scientific fields is rather small.
The networks were set up as undirected, weighted networks and analysed with the
python package NetworkX using the largest connected component of each network
respectively. Both data sources were analysed concerning their similarities and differences
in three stages:
(1) Basic topological and statistical features of the networks
(2) The individual node centralities and clustering indicators
(3) The spatial dimension in terms of Euclidean distances and regional aggregates
In networks, size and density are suspected to have an influence on various indicators on
the graph level (GLIs). Especially when different networks are compared to one another,
the basic topology will affect the behavior of average path-lengths, the number of
components, or clustering among other properties of the network. Researchers attempt to
level out these differences and normalize the network parameters, usually by using
randomized versions (null- or baseline models) of the empirical networks that preserve
some of the empirical network properties (e.g. degree distribution). Frequently proposed
null-models include the seminal models of Watts and Strogatz (1998), WS ring lattice
model) or Barabasi and Albert (1999), BA preferential attachment model).
However, simply generating a random model that is only similar to the empirical network
in terms of the average degree of a node (the seed parameter) may destroy other properties
of the empirical network and thus induce many other interpretation problems. If the baseline
1 The exact search string was ‘‘CU = China AND (TS = ((Cell OR Enzyme OR Applied) SAME Bio*)OR TS = Bionic)’’.
542 S. Hennemann et al.
123
Ta
ble
2G
ener
ald
escr
ipti
on
of
the
two
dat
ase
tsan
dth
en
etw
ork
s
Yea
rIS
IJo
urn
alo
fC
ho
ng
qin
gV
IP
Nu
mb
ero
fp
aper
s(r
aw)
Co
-auth
.%
wit
hfo
reig
nco
ntr
ibu
tors
Net
wo
rkL
arg
est
con
nec
ted
com
po
nen
t
Wat
ts–
Str
og
atz
rew
irin
gp
rob
abil
ity
a
Nu
mb
ero
fp
aper
s(r
aw)
Co-a
uth
.%
wit
hfo
reig
nco
ntr
ibuto
rs
Net
wo
rkL
arg
est
con
nec
ted
com
po
nen
t
Wat
ts–
Str
og
atz
rew
irin
gp
rob
abil
ity
a
No
des
Ed
ges
No
des
Ed
ges
kp
No
des
Ed
ges
No
des
Ed
ges
kp
20
00
14
37
32
18
98
41
21
52
.50
.196
49
76
52
10
86
47
61
.71
–
20
01
16
48
91
51
88
20
05
16
82
.67
0.3
17
56
57
00
19
21
32
18
17
1.8
9–
20
02
21
61
04
15
26
33
31
17
62
57
2.9
20
.457
76
11
13
03
15
23
81
22
12
62
.07
0.0
23
20
03
23
31
17
12
28
43
92
20
43
15
3.0
80
.536
96
81
79
34
23
39
92
20
26
72
.43
0.2
12
20
04
33
51
65
22
33
64
96
26
04
36
3.3
50
.681
1.2
27
25
85
52
96
26
38
14
97
2.6
10
.301
20
05
45
42
60
21
44
27
46
38
36
95
3.6
30
.812
1.5
26
35
60
76
79
61
57
98
45
2.9
20
.459
20
06
60
73
57
18
57
81
.13
75
24
1.0
91
4.1
60
.042
1.7
77
45
10
94
41
.266
73
11
.130
3.0
90
.545
20
07
73
74
42
20
72
71
.66
46
65
1.6
17
4.8
60
.215
2.0
15
58
01
1.1
10
1.6
51
90
71
.513
3.3
40
.665
20
08
95
65
71
18
84
92
.10
38
03
2.0
68
5.1
50
.290
2.9
14
64
10
1.3
60
2.0
22
1.1
03
1.8
53
3.3
60
.675
20
09
1.1
01
69
31
71
.008
2.5
84
95
92
.549
5.3
20
.330
3.2
24
45
35
1.4
79
2.0
69
1.1
36
1.8
53
3.2
60
.635
So
urc
eO
wn
calc
ula
tion
and
dat
apro
cess
ing
bas
edon
dat
afr
om
Thom
son
Reu
ters
ISI
Web
of
Know
ledgeS
Man
dC
ho
ng
qin
gV
IPa
Th
eW
SM
od
elw
asse
tu
pw
ith
the
nu
mb
ero
fn
od
esn
and
the
aver
age
deg
ree
kfo
rth
ela
rges
tco
mp
on
ent
of
the
empir
ical
net
wo
rks
Measuring regional science networks in China 543
123
models, such as the WS-model, are used to control for size effects, it is necessary to use one
common baseline model for the networks being compared. Following van Wijk et al.
(2010), an optimization of the empirical networks according to the WS model produces
different rewiring probabilities (the only adjustable parameter in the model with a given
number of nodes n and a given average degree k) for the networks (cf. Table 2). That is, the
empirical networks are not based on the same theoretical model and do not share a similar
topology, not to mention the overall question of the adequacy of the chosen baseline model
(does a WS model really capture the empirical network?). Van Wijk et al. (2010) doubt the
overall adequacy of such simple corrections and modeling. They present a comprehensive
analysis of different methods of normalizing networks for comparison (e.g. WS normali-
zation, rewiring, ERGM/p*-fitting) and conclude that there is no one satisfactory method of
correcting for size and connectivity. However, a rewiring of edges or the fitting of a p*
model seem to allow for basic comparisons. Anderson et al. (1999, p. 258) do not even think
that these effects should always be eliminated or that GLIs should be abandoned completely
from the analysis. This is even more relevant for node level comparisons.
However, a detailed evaluation of this issue is far beyond the scope of this paper. In this
analysis, we followed a rewiring strategy adopted by Maslov and Sneppen (2002) to
evaluate the significance of the network properties against each other. The proposed
randomization algorithm preserves exactly the degree of the individual nodes, the degree
distribution and the symmetry of the empirical network (cf. Ponten et al. 2010). All
randomized networks were shuffled five times the number of edges in the empirical net-
work in order to achieve a profound randomized representation of the empirical network.
This was repeated 100 times to build a sample of random networks. The parameter values
of this sample were used to calculate the standard deviation and error of the parameters.
For the VIP networks of the years 2000 and 2001, it was not possible to produce ran-
domized representation due to small networks.
Results
Basic topology and statistics
The size of both networks, SCI-E and VIP, tends to increase roughly linearly, indicating a
steady and continuing growth, but far from being an exponential growth, as suggested for
many other scientific fields in China (e.g. Zhou and Leydesdorff 2006). Here, however, the
largest complete connected component of a co-authorship network is analysed, rather than
simple publication number counts. Therefore, this result points to some broad initial
insights from our data. Obviously, the scientific output increases broadly and indepen-
dently of specific network and attachment preferences. The network appears to be still in
its early, fragmented stages, with many small components and without pronounced link-
ages to existing members of the network. However, it may well also be the case that the
fragmentation is a feature of the domestic data set, even for mature scientific fields.
With respect to the comparison between the two data sets, we find a stronger concen-
tration on existing nodes in the SCI-E data set, expressed in a lower number of nodes and a
higher and increasing number of edges (cf. Table 2).
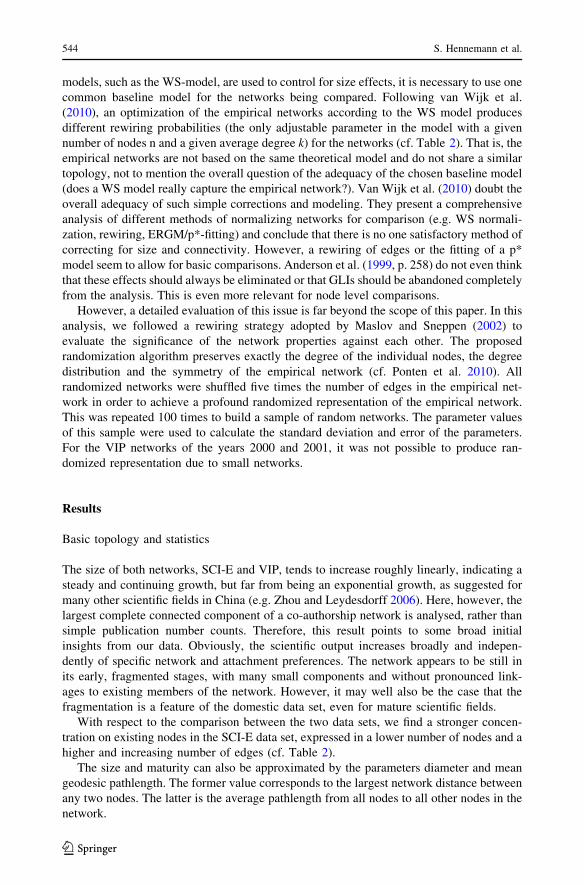
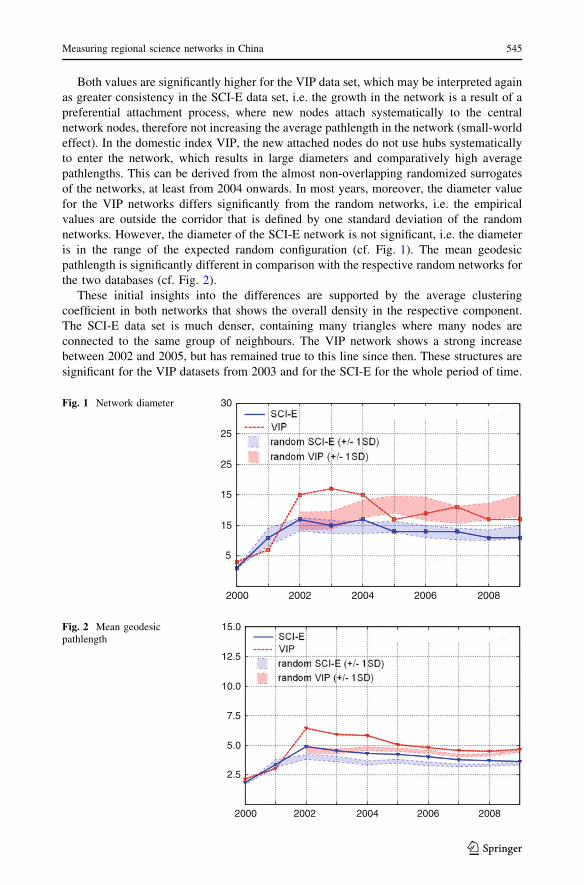
The size and maturity can also be approximated by the parameters diameter and mean
geodesic pathlength. The former value corresponds to the largest network distance between
any two nodes. The latter is the average pathlength from all nodes to all other nodes in the
network.
544 S. Hennemann et al.
123
Both values are significantly higher for the VIP data set, which may be interpreted again
as greater consistency in the SCI-E data set, i.e. the growth in the network is a result of a
preferential attachment process, where new nodes attach systematically to the central
network nodes, therefore not increasing the average pathlength in the network (small-world
effect). In the domestic index VIP, the new attached nodes do not use hubs systematically
to enter the network, which results in large diameters and comparatively high average
pathlengths. This can be derived from the almost non-overlapping randomized surrogates
of the networks, at least from 2004 onwards. In most years, moreover, the diameter value
for the VIP networks differs significantly from the random networks, i.e. the empirical
values are outside the corridor that is defined by one standard deviation of the random
networks. However, the diameter of the SCI-E network is not significant, i.e. the diameter
is in the range of the expected random configuration (cf. Fig. 1). The mean geodesic
pathlength is significantly different in comparison with the respective random networks for
the two databases (cf. Fig. 2).
These initial insights into the differences are supported by the average clustering
coefficient in both networks that shows the overall density in the respective component.
The SCI-E data set is much denser, containing many triangles where many nodes are
connected to the same group of neighbours. The VIP network shows a strong increase
between 2002 and 2005, but has remained true to this line since then. These structures are
significant for the VIP datasets from 2003 and for the SCI-E for the whole period of time.
30
25
25
15
15
5
2000 2002 2004 2006 2008
Fig. 1 Network diameter
15.0
12.5
10.0
7.5
5.0
2.5
2000 2002 2004 2006 2008
Fig. 2 Mean geodesicpathlength
Measuring regional science networks in China 545
123
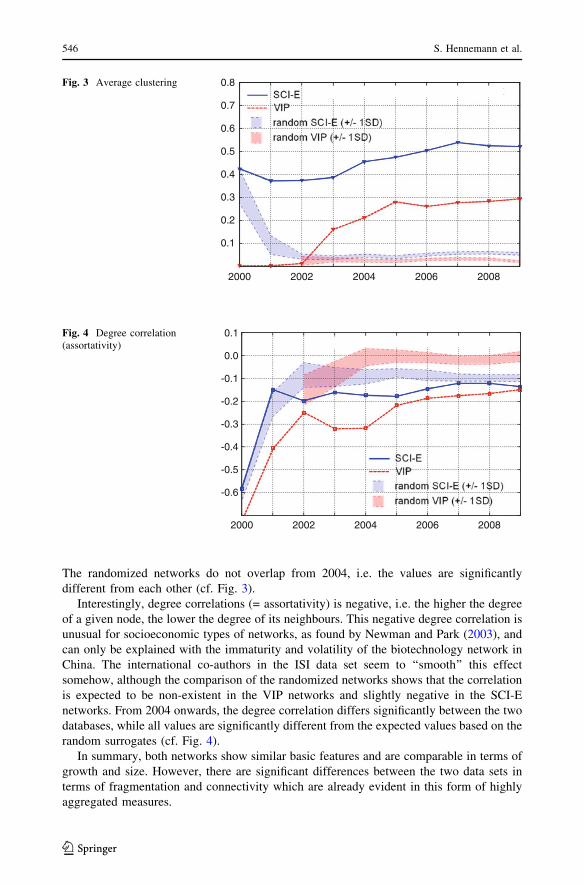
The randomized networks do not overlap from 2004, i.e. the values are significantly
different from each other (cf. Fig. 3).
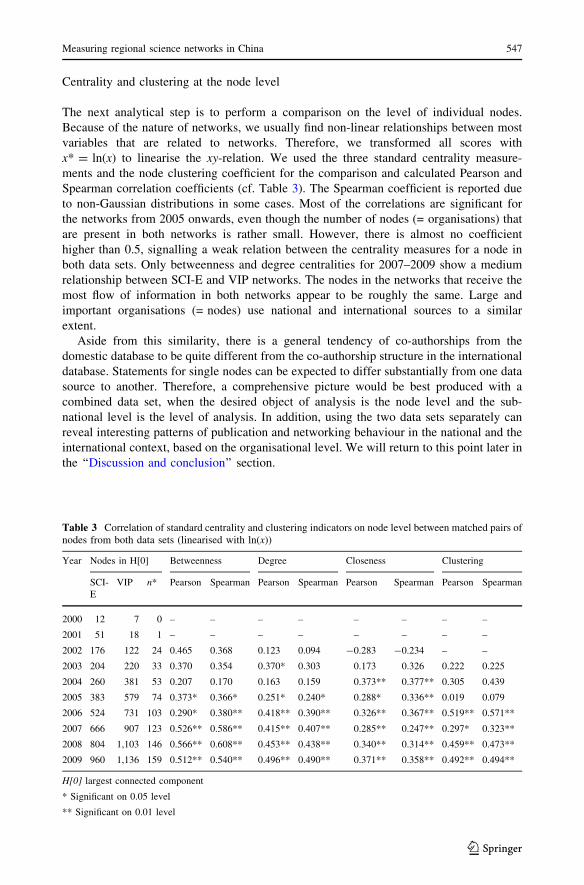
Interestingly, degree correlations (= assortativity) is negative, i.e. the higher the degree
of a given node, the lower the degree of its neighbours. This negative degree correlation is
unusual for socioeconomic types of networks, as found by Newman and Park (2003), and
can only be explained with the immaturity and volatility of the biotechnology network in
China. The international co-authors in the ISI data set seem to ‘‘smooth’’ this effect
somehow, although the comparison of the randomized networks shows that the correlation
is expected to be non-existent in the VIP networks and slightly negative in the SCI-E
networks. From 2004 onwards, the degree correlation differs significantly between the two
databases, while all values are significantly different from the expected values based on the
random surrogates (cf. Fig. 4).
In summary, both networks show similar basic features and are comparable in terms of
growth and size. However, there are significant differences between the two data sets in
terms of fragmentation and connectivity which are already evident in this form of highly
aggregated measures.
0.8
0.7
0.6
0.5
0.4
0.3
0.2
0.1
2000 2002 2004 2006 2008
Fig. 3 Average clustering
0.1
0.0
-0.1
-0.2
-0.3
-0.4
-0.5
-0.6
2000 2002 2004 2006 2008
Fig. 4 Degree correlation(assortativity)
546 S. Hennemann et al.
123
Centrality and clustering at the node level
The next analytical step is to perform a comparison on the level of individual nodes.
Because of the nature of networks, we usually find non-linear relationships between most
variables that are related to networks. Therefore, we transformed all scores with
x* = ln(x) to linearise the xy-relation. We used the three standard centrality measure-
ments and the node clustering coefficient for the comparison and calculated Pearson and
Spearman correlation coefficients (cf. Table 3). The Spearman coefficient is reported due
to non-Gaussian distributions in some cases. Most of the correlations are significant for
the networks from 2005 onwards, even though the number of nodes (= organisations) that
are present in both networks is rather small. However, there is almost no coefficient
higher than 0.5, signalling a weak relation between the centrality measures for a node in
both data sets. Only betweenness and degree centralities for 2007–2009 show a medium
relationship between SCI-E and VIP networks. The nodes in the networks that receive the
most flow of information in both networks appear to be roughly the same. Large and
important organisations (= nodes) use national and international sources to a similar
extent.
Aside from this similarity, there is a general tendency of co-authorships from the
domestic database to be quite different from the co-authorship structure in the international
database. Statements for single nodes can be expected to differ substantially from one data
source to another. Therefore, a comprehensive picture would be best produced with a
combined data set, when the desired object of analysis is the node level and the sub-
national level is the level of analysis. In addition, using the two data sets separately can
reveal interesting patterns of publication and networking behaviour in the national and the
international context, based on the organisational level. We will return to this point later in
the ‘‘Discussion and conclusion’’ section.
Table 3 Correlation of standard centrality and clustering indicators on node level between matched pairs ofnodes from both data sets (linearised with ln(x))
Year Nodes in H[0] Betweenness Degree Closeness Clustering
SCI-
E
VIP n* Pearson Spearman Pearson Spearman Pearson Spearman Pearson Spearman
2000 12 7 0 – – – – – – – –
2001 51 18 1 – – – – – – – –
2002 176 122 24 0.465 0.368 0.123 0.094 -0.283 -0.234 – –
2003 204 220 33 0.370 0.354 0.370* 0.303 0.173 0.326 0.222 0.225
2004 260 381 53 0.207 0.170 0.163 0.159 0.373** 0.377** 0.305 0.439
2005 383 579 74 0.373* 0.366* 0.251* 0.240* 0.288* 0.336** 0.019 0.079
2006 524 731 103 0.290* 0.380** 0.418** 0.390** 0.326** 0.367** 0.519** 0.571**
2007 666 907 123 0.526** 0.586** 0.415** 0.407** 0.285** 0.247** 0.297* 0.323**
2008 804 1,103 146 0.566** 0.608** 0.453** 0.438** 0.340** 0.314** 0.459** 0.473**
2009 960 1,136 159 0.512** 0.540** 0.496** 0.490** 0.371** 0.358** 0.492** 0.494**
H[0] largest connected component
* Significant on 0.05 level
** Significant on 0.01 level
Measuring regional science networks in China 547
123
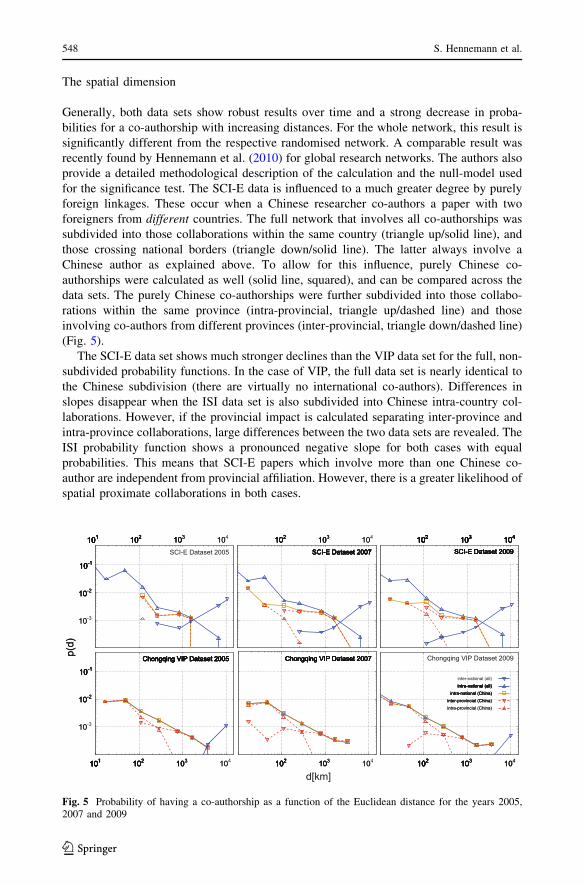
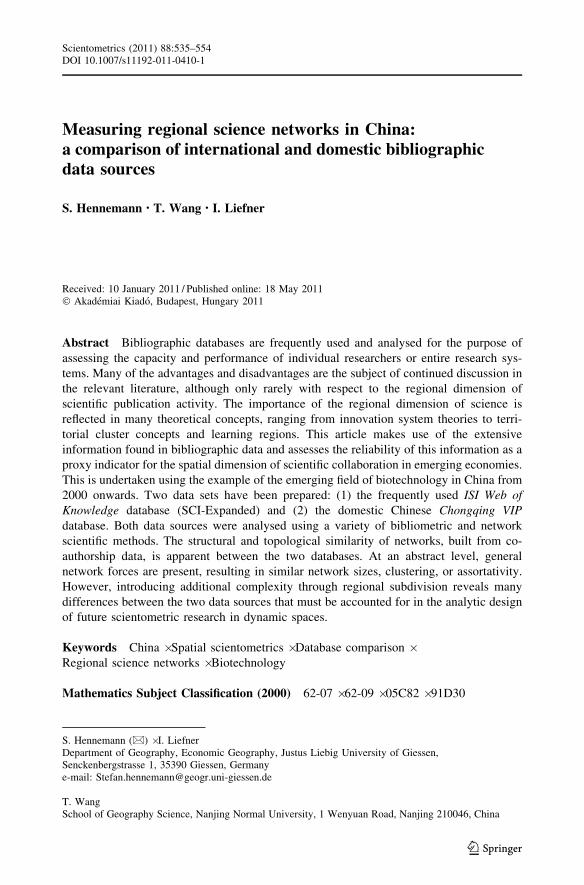
The spatial dimension
Generally, both data sets show robust results over time and a strong decrease in proba-
bilities for a co-authorship with increasing distances. For the whole network, this result is
significantly different from the respective randomised network. A comparable result was
recently found by Hennemann et al. (2010) for global research networks. The authors also
provide a detailed methodological description of the calculation and the null-model used
for the significance test. The SCI-E data is influenced to a much greater degree by purely
foreign linkages. These occur when a Chinese researcher co-authors a paper with two
foreigners from different countries. The full network that involves all co-authorships was
subdivided into those collaborations within the same country (triangle up/solid line), and
those crossing national borders (triangle down/solid line). The latter always involve a
Chinese author as explained above. To allow for this influence, purely Chinese co-
authorships were calculated as well (solid line, squared), and can be compared across the
data sets. The purely Chinese co-authorships were further subdivided into those collabo-
rations within the same province (intra-provincial, triangle up/dashed line) and those
involving co-authors from different provinces (inter-provincial, triangle down/dashed line)
(Fig. 5).
The SCI-E data set shows much stronger declines than the VIP data set for the full, non-
subdivided probability functions. In the case of VIP, the full data set is nearly identical to
the Chinese subdivision (there are virtually no international co-authors). Differences in
slopes disappear when the ISI data set is also subdivided into Chinese intra-country col-
laborations. However, if the provincial impact is calculated separating inter-province and
intra-province collaborations, large differences between the two data sets are revealed. The
ISI probability function shows a pronounced negative slope for both cases with equal
probabilities. This means that SCI-E papers which involve more than one Chinese co-
author are independent from provincial affiliation. However, there is a greater likelihood of
spatial proximate collaborations in both cases.
Fig. 5 Probability of having a co-authorship as a function of the Euclidean distance for the years 2005,2007 and 2009
548 S. Hennemann et al.
123
In contrast to this finding, the VIP data set shows strong features of provincial
dependence in collaboration. Usually, papers are written by co-authors from the same
province, but not from the same organisation, as this was excluded from the data. Inter-
estingly, there is no spatial dependence for collaborations crossing provincial borders.
Once the provincial border is crossed, it does not matter at all where the co-author resides
(at least for recent years).
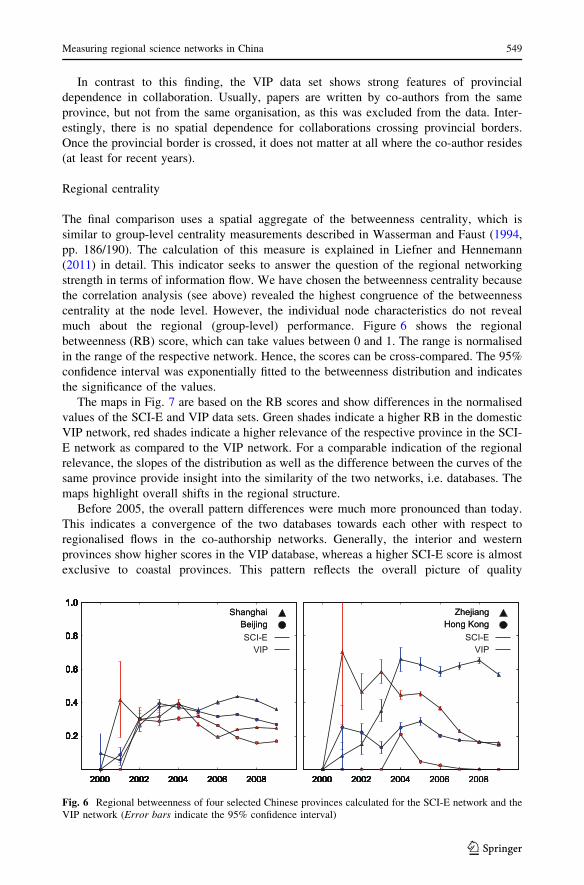
Regional centrality
The final comparison uses a spatial aggregate of the betweenness centrality, which is
similar to group-level centrality measurements described in Wasserman and Faust (1994,
pp. 186/190). The calculation of this measure is explained in Liefner and Hennemann
(2011) in detail. This indicator seeks to answer the question of the regional networking
strength in terms of information flow. We have chosen the betweenness centrality because
the correlation analysis (see above) revealed the highest congruence of the betweenness
centrality at the node level. However, the individual node characteristics do not reveal
much about the regional (group-level) performance. Figure 6 shows the regional
betweenness (RB) score, which can take values between 0 and 1. The range is normalised
in the range of the respective network. Hence, the scores can be cross-compared. The 95%
confidence interval was exponentially fitted to the betweenness distribution and indicates
the significance of the values.
The maps in Fig. 7 are based on the RB scores and show differences in the normalised
values of the SCI-E and VIP data sets. Green shades indicate a higher RB in the domestic
VIP network, red shades indicate a higher relevance of the respective province in the SCI-
E network as compared to the VIP network. For a comparable indication of the regional
relevance, the slopes of the distribution as well as the difference between the curves of the
same province provide insight into the similarity of the two networks, i.e. databases. The
maps highlight overall shifts in the regional structure.
Before 2005, the overall pattern differences were much more pronounced than today.
This indicates a convergence of the two databases towards each other with respect to
regionalised flows in the co-authorship networks. Generally, the interior and western
provinces show higher scores in the VIP database, whereas a higher SCI-E score is almost
exclusive to coastal provinces. This pattern reflects the overall picture of quality
Fig. 6 Regional betweenness of four selected Chinese provinces calculated for the SCI-E network and theVIP network (Error bars indicate the 95% confidence interval)
Measuring regional science networks in China 549
123

differences among scientific organisations in China. However, this pattern is not as clear as
for other socio-economic disparity indicators. Furthermore, there are significant changes on
the province level over time.
The four provinces Guangdong, Hong Kong, Beijing and Shaanxi show similar
dynamics, but rather different levels of centrality between the two networks. Beijing
occupies the most similar position in both networks, whereas Hong Kong and Guangdong
show much stronger centrality in the international network. On the contrary, Shaanxi is
much more present in the network that is based on the VIP database. Strong differences
between SCI-E and VIP can be found with the examples of Zhejiang, Shanghai and Anhui.
All three provinces start from higher relevancies in the VIP network and completely
reverse this pattern from about 2004 towards a much higher presence in the SCI-E network.
The strongest crossover in these dynamics can be found in the Zhejiang province,
south-east of Shanghai. In the years from 2001 to 2003, the VIP network position was
Fig. 7 Differences between the SCI-E and the VIP regional betweenness score of Chinese provinces. NotePositive values indicate that the VIP score is higher than the SCI-E score and vice versa
550 S. Hennemann et al.
123
significantly higher than the SCI-E network position. After 2004, the ratio changes rapidly
towards a much stronger position in the SCI-E network (cf. Fig. 6). This reverse trend can
be explained by political and strategic changes in China’s education and science system
(e.g. merger of universities, publication principles shifted towards SCI-listed journals, cf.
Zhao and Guo 2002). In 2000, the Zhejiang University decided to encourage their aca-
demic staff to write more high-level articles and publish them in international journals
indexed in the SCI-E. This political initiative led to an enormous increase in SCI-E
publications from the Zhejiang University, from 346 in 1998 to 3,358 in 2008 (Gu 2009).
In summary, the differences in regional aggregates of network centralities are very
pronounced between the SCI-E-based network and the VIP network. Therefore, it is dif-
ficult to imagine any case in which regional comparisons can be based on either of these
databases. Generally, the provinces assumed to be weaker have their focus on the domestic
S&T system, while the socio-economically strong provinces focus on international pub-
lications. However, both types of provinces influence the domestic knowledge production
in China.
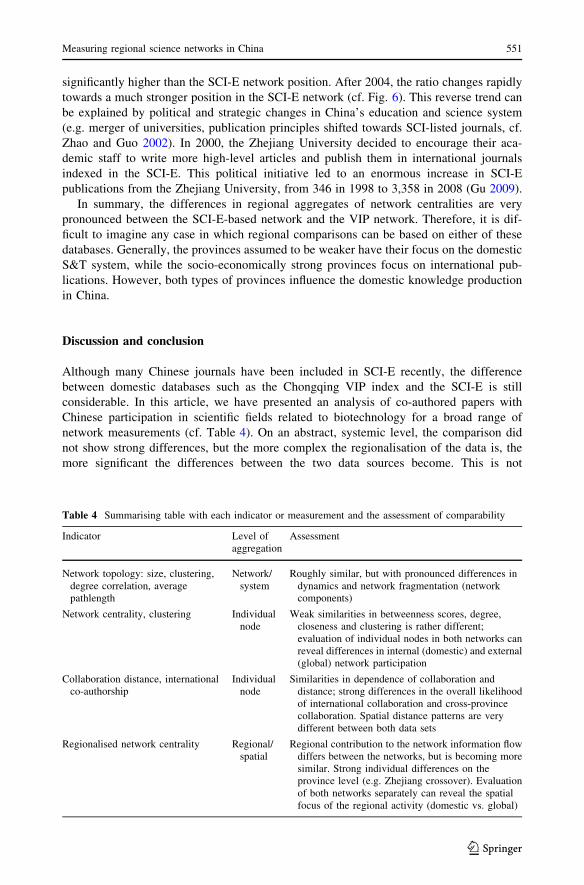
Discussion and conclusion
Although many Chinese journals have been included in SCI-E recently, the difference
between domestic databases such as the Chongqing VIP index and the SCI-E is still
considerable. In this article, we have presented an analysis of co-authored papers with
Chinese participation in scientific fields related to biotechnology for a broad range of
network measurements (cf. Table 4). On an abstract, systemic level, the comparison did
not show strong differences, but the more complex the regionalisation of the data is, the
more significant the differences between the two data sources become. This is not
Table 4 Summarising table with each indicator or measurement and the assessment of comparability
Indicator Level ofaggregation
Assessment
Network topology: size, clustering,degree correlation, averagepathlength
Network/system
Roughly similar, but with pronounced differences indynamics and network fragmentation (networkcomponents)
Network centrality, clustering Individualnode
Weak similarities in betweenness scores, degree,closeness and clustering is rather different;evaluation of individual nodes in both networks canreveal differences in internal (domestic) and external(global) network participation
Collaboration distance, internationalco-authorship
Individualnode
Similarities in dependence of collaboration anddistance; strong differences in the overall likelihoodof international collaboration and cross-provincecollaboration. Spatial distance patterns are verydifferent between both data sets
Regionalised network centrality Regional/spatial
Regional contribution to the network information flowdiffers between the networks, but is becoming moresimilar. Strong individual differences on theprovince level (e.g. Zhejiang crossover). Evaluationof both networks separately can reveal the spatialfocus of the regional activity (domestic vs. global)
Measuring regional science networks in China 551
123
necessarily bad, but must be taken into account when bibliographic information is used in
regionally oriented research.
The most severe problem on the sub-national level, especially in developing countries
such as China, is the volatile dynamics that frequently show reverse trends between the two
databases. This is a clear sign of strategic and policy-initiated shifts in the regional science
systems. These fluctuating situations are opposed by quite stable relations and congruent
trends in other regions (e.g. Shanghai, Beijing, Jiangsu). That unpredictable behaviour
makes decisions to use one data set or another quite arbitrary. However, this is both
positive and negative at the same time. Therefore, one suggestion to cope with these
insufficiencies is the separate usage of the two data sets in order to reveal these differences.
This would be more relevant to assessments of the domestic structures and dynamics of
the regional science systems. A comparative/complementary use will certainly reveal
interesting and distinct patterns on the node level. This also has an impact on the regional
aggregate level and can deliver insight into policy strategies on the sub-national level.
Political measures can have surprisingly immediate effects, as is shown by the case of
Zhejiang. Consequently, results such as these can inform policy makers and lead to
adjustments to science and education policy.
A second suggestion from our results is to combine the two data sets and analyse them
simultaneously. This is especially relevant to network-based evaluations of the interna-
tional integration and the regional contribution. The complete picture of the position of
national science systems such as China in the global science system can, at best, be
approximated using a combination of sources. Ideally, one would have to produce a
network based on all papers produced worldwide on a specific topic. A reason for this is
that complex systems such as networks can produce unexpected effects from this com-
plexity in providing short cuts to otherwise unconnected network nodes.
The maturity and the global dynamics of a scientific field may also influence the
comparativeness of sources. In dynamic and recently emerging fields, the differences are
greater than in later stages of the development of sciences. Another possible factor of
influence is the difference in network fragmentation, which has a large impact on the
systemic features of the network. However, it is still unclear as to whether fragmentation
and the development of network components is a result of the immaturity of the index, the
scientific field, or whether it is a systemic feature of less developed domestic science
systems with a spearhead of few globally competitive organisations.
All scholars to have previously pointed out the necessity of adequate data for each
research question (cf. Moed 2002) are still right, although most international indices have
been comprehensively updated with local bibliographic information.
With respect to further research, there are several suggestions based on critical reflec-
tions of our own presented analysis. One shortcoming that must be worked on is the
comparison with other scientific fields in different stages of development. Only with more
examples also focusing on different national systems can a comprehensive picture of the
ability of domestic and international databases to produce accurate pictures of the science
system be assessed. This should be enhanced with qualitative assessments from experts in
the respective scientific fields.
Another enhancement for qualifying and assessing sub-national patterns can be found in
other data. In the example presented here, we have focused on scientific publications as a
proxy indicator for assessing the structure and the development of the science-based end
of a national innovation system. Bibliographic information derived from patents, both
national (China Intellectual Property Net) and international (e.g. US PTO, EPO), can
enrich this picture as well. One would need to consider new ways of combining and
552 S. Hennemann et al.
123
weighting different data sources. However, this effort seems promising from the per-
spective of innovation systems research and would further contribute towards a compre-
hensive framework for spatial scientometrics.
Acknowledgments Wang Tao appreciates a travel grant from the German Academic Exchange Service(DAAD). This research was supported by the National Science Foundation of China (NSFC) under grant#40971069. The authors thank two anonymous reviewers for their helpful comments.
References
Anderson, B. S., Butts, C., & Carley, K. (1999). The interaction of size and density with graph-level indices.Social Networks, 21(3), 239–267.
Barabasi, A.-L., & Albert, R. (1999). Emergence of scaling in random networks. Science, 286(5439),509–512.
Basu, A. (2010). Does a country’s scientific ‘productivity depend’ critically on the number of countryjournals indexed? Scientometrics, 82(3), 507–516.
Cooke, P., Heidenreich, M., & Braczyk, H.-J. (Eds.). (2004). Regional innovation systems. London:Routledge.
Deng, M., & He, T. W. (2004). Science-metrics analysis of collaborative characters of basic research ofbiochemistry and molecular biology in China. Science of Science and Management of S&T, 25(9),10–12 (in Chinese).
Dolfsma, W., & Soete, L. (Eds.). (2006). Understanding the dynamics of a knowledge economy. Chelten-ham: Edward Elgar.
Etzkowitz, H., & Leydesdorff, L. (2000). The dynamics of innovation: From National Systems and ‘‘mode2’’ to a triple helix of university–industry–government relations. Research Policy, 29(2), 109–124.
Frenken, K., Hardeman, S., & Hoekman, J. (2009). Spatial scientometrics: Towards a cumulative researchprogram. Journal of Informetrics, 3(3), 222–232.
Gao, X., & Guan, J. (2009). A scale-independent analysis of the performance of the Chinese innovationsystem. Journal of Informetrics, 3(4), 321–331.
Gu, J. M. (2009). Analysis of the policy on the professional development of academic staff: A case study ofZhejiang University. China Higher Education Research, 5, 52–54.
Guan, J., & Gao, X. (2008). Comparison and evaluation of Chinese research performance in the field ofbioinformatics. Scientometrics, 75(2), 357–379.
Guan, J., & He, Y. (2005). Comparison and evaluation of domestic and international outputs in InformationScience & Technology Research of China. Scientometrics, 65(2), 215–244.
Guan, J. C., & Ma, N. (2007). China’s emerging presence in nanoscience and nanotechnology. A com-parative bibliometric study of several nanoscience ‘giants’. Research Policy, 36(6), 880–886.
Haas, P. M. (1992). Introduction: Epistemic communities and international policy coordination. Interna-tional Organization, 46(1), 1–35.
Hennemann, S., Rybski, D., & Liefner, I. (2010). The myth of global science. Paper presented at the ERSAconference 2010, Jonkoping, Sweden.
Jin, B. H., & Wang, B. (1999). Chinese science citation database: Its construction and application.Scientometrics, 45(2), 325–332.
Jonkers, K. (2009). Emerging ties: Factors underlying China‘s co-publication patterns with WesternEuropean and North American research systems in three molecular life science subfields. Sciento-metrics, 80(3), 775–795.
Katz, J. S., & Martin, B. R. (1997). What is research collaboration? Research Policy, 26(1), 1–18.Laudel, G. (2002). What do we measure by co-authorships? Research Evaluation, 11(1), 3–15.Li, L., & Yang, G. (2004). Comparative study of two Chinese full-text journal databases. Modern Infor-
mation, 5, 2–7 (in Chinese).Liang, L. (2003). Evaluating China’s research performance: How do SCI and Chinese indexes compare?
Interdisciplinary Science Reviews, 28(1), 38–43.Liang, L., & Zhu, L. (2002). Major factors affecting China’s inter-regional research collaboration: Regional
scientific productivity and geographical proximity. Scientometrics, 55(2), 287–316.Liefner, I., & Hennemann, S. (2011). Structural holes and new dimensions of distance: The spatial con-
figuration of the Scientific Knowledge Network of China‘s Optical Technology Sector. Environmentand Planning A. doi:10.1068/a43100.
Measuring regional science networks in China 553
123
Lin, M.-W., & Zhang, J. (2007). Language trends in nanoscience and technology: The case of Chinese-language publications. Scientometrics, 70(3), 555–564.
Lundberg, J., Tomson, G., Lundkvist, I., Skor, J., & Brommels, M. (2006). Collaboration uncovered:Exploring the adequacy of measuring university–industry collaboration through co-authorship andfunding. Scientometrics, 69(3), 575–589.
Lundvall, B.-A. (Ed.). (1992). National systems of innovation: Towards a theory of innovation and inter-active learning. London: Pinter.
Ma, N., & Guan, J. C. (2005). An exploratory study on collaboration profiles of Chinese publications inmolecular biology. Scientometrics, 65(3), 343–355.
Maslov, S., & Sneppen, K. (2002). Specificity and stability in topology of protein networks. Science,296(5569), 910–913.
Meho, L. I., & Yang, K. (2007). Impact of data sources on citation counts and rankings of LIS faculty: Webof science versus Scopus and Google scholar. Journal of the American Society for Information Scienceand Technology, 58(13), 2105–2125.
Mely, B., El Kader, A., Dudognon, G., & Okubo, Y. (1998). Scientific publications of China in 1994:Evolution of revolution? Scientometrics, 42(1), 3–16.
Moed, H. F. (2002). Measuring China’s research performance using the Science Citation Index. Sciento-metrics, 53(3), 281–296.
Newman, M. E. J., & Park, J. (2003). Why social networks are different from other types of networks.Physical Review E, 68(3), 036122.
Norris, M., & Oppenheim, C. (2007). Comparing alternatives to the Web of Science for coverage of thesocial sciences’ literature. Journal of Informetrics, 1(2), 161–169.
Otte, E., & Rousseau, R. (2002). Social network analysis: A powerful strategy, also for the informationsciences. Journal of Information Science, 28(6), 441–453.
Ponten, S. C., Daffertshofer, A., Hillebrand, A., & Stam, C. J. (2010). The relationship between structuraland functional connectivity: Graph theoretical analysis of an EEG neural mass model. NeuroImage, 52,985–994.
Porter, M. E. (1990). The competitive advantage of nations. New York: The Free Press.Ren, S., & Rousseau, R. (2002). International visibility of Chinese scientific journals. Scientometrics, 53(3),
389–405.Royle, J., Coles, L., Williams, D., & Evans, P. (2007). Publishing in international journals—An examination
of trends in Chinese co-authorship. Scientometrics, 71(1), 59–86.van Wijk, B. C. M., Stam, C. J., & Daffertshofer, A. (2010). Comparing brain networks of different size and
connectivity density using graph theory. PLoS ONE, 5(10), e13701.Wan, J.-k., Hua, P.-h., Rousseau, R., & Sun, X.-k. (2010). The journal download immediacy index (DII):
experiences using a Chinese full-text database. Scientometrics, 82(3), 555–566.Wang, S., Wang, H., & Weldon, P. R. (2007). Bibliometric analysis of English-language academic journals
of China and their internationalization. Scientometrics, 73(3), 331–343.Wang, Y., Wu, Y. S., Pan, Y. T., Ma, Z., & Rousseau, R. (2005). Scientific collaboration in China as
reflected in co-authorship. Scientometrics, 62(2), 183–198.Wasserman, S., & Faust, K. (1994). Social network analysis: Methods and applications. Cambridge:
Cambridge University Press.Watts, D. J., & Strogatz, S. H. (1998). Collective dynamics of ‘small-world’ networks. Nature, 393, 440–442.Weisberg, M., & Muldoon, R. (2009). Epistemic landscapes and the division of cognitive labor. Philosophy
of Science, 76(4), 225–252.Wu, Y., Pan, Y., Zhang, Y., Ma, Z., Pang, J., Guo, H., et al. (2004). China Scientific and Technical Papers
and Citations (CSTPC): History, impact and outlook. Scientometrics, 60(3), 385–397.Zhang, F., Cooke, P., & Wu, F. (2010). State-sponsored research and development: A case study of China’s
Biotechnology. Regional Studies (online first).Zhang, H., & Guo, H. (1997). Scientific research collaboration in China. Scientometrics, 38(2), 309–319.Zhao, J., & Guo, J. (2002). The restructuring of China’s higher education: An experience for market
economy and knowledge economy. Educational Philosophy and Theory, 34(2), 207–222.Zhou, P., & Leydesdorff, L. (2006). The emergence of China as a leading nation in science. Research
Policy, 35(1), 83–104.Zhou, P., & Leydesdorff, L. (2007). A comparison between the china scientific and technical papers and
citations database and the Science Citation Index in terms of Journal Hierarchies and InterjournalCitation Relations. Journal of the American Society for Information Science and Technology, 58(2),223–236.
Zhou, P., Thijs, B., & Glanzel, W. (2009). Regional analysis on Chinese scientific output. Scientometrics,81(3), 839–857.
554 S. Hennemann et al.
123