Embed Size (px)
Citation preview
Steffen Kinkel
Rahimaniah Titis Dewanti
Peter Zimmermann
Rosemary Coates
Measuring Reshoring
Trends in the EU and the US
The Reshoring Institute is a contributing member of Makers Europe
Authors
D4.1 Measuring reshoring trends in the EU and the US
©MAKERS 2017
MAKERS
Deliverable 4.1
Measuring reshoring trends in the EU and the
US
Task 4.2 Conceptualise drivers and dynamics of reshoring and onshoring trends
Task 4.3 Explore EUROSTAT and national databases to map reshoring and onshoring trends
Coordinated by Karlsruhe University of Applied Sciences
Authors:
Steffen Kinkel, ILIN Institute for Learning and Innovation in Networks, Karlsruhe University
of Applied Sciences, [email protected]
Rahimaniah Titis Dewanti, ILIN Institute for Learning and Innovation in Networks, Karlsruhe
University of Applied Sciences, [email protected]
Peter Zimmermann, ILIN Institute for Learning and Innovation in Networks, Karlsruhe
University of Applied Sciences, [email protected]
Rosemary Coates, Reshoring Institutes, University of San Diego, US,
Ref. Ares(2018)64134 - 05/01/2018
D4.1 Measuring reshoring trends in the EU and the US
1
©MAKERS 2017
List of Contents
1. Introduction: Paper content and structure ............................................................ 2
2. Definition of reshoring and some theory ............................................................... 2
3. Surveying reshoring in the EU .............................................................................. 5
3.1 Eurostat survey data on international sourcing .............................................. 5
3.2 Survey results across several EU member states ....................................... 12
3.3 Survey results on single country level ......................................................... 17
3.4 Comparison and discussion of survey results and approaches ................... 22
4. Measuring the interrelation between reshoring and the use of Industry 4.0
technologies ....................................................................................................... 24
5. Measuring reshoring in the US ........................................................................... 27
5.1 Data of the Reshoring Initiative ................................................................... 29
5.2 Data of the Reshoring Institute .................................................................... 32
5.3 Conclusions on US reshoring and comparison with EU patterns ................ 35
6. Measuring Reshoring with Trade data and Input-Output-Tables ........................ 36
6.1 Trade data ................................................................................................... 36
6.2 Input-Output-Tables ..................................................................................... 38
7. MAKERS conclusions and avenues for further research .................................... 43
8. References ......................................................................................................... 49
D4.1 Measuring reshoring trends in the EU and the US
2
©MAKERS 2017
1. INTRODUCTION: PAPER CONTENT AND STRUCTURE
Policy makers and academics are increasingly aware of the so called reshoring or
backshoring of once offshored manufacturing capacities back to the home country
(Kinkel, 2012). The current debate on re-industrialisation (Pisano and Shih, 2009,
2012) in the US and Europe is to some extent based on expectations that reshoring
activities of manufacturing companies might help to restore industrial
competitiveness in high-wage countries. It is fuelled by the assumption that cost
advantages of important low-wage countries, in particular China, may be gradually
eroded by higher wage increases in the next five to ten years (BCG 2011). Other
reasons for back-shoring operations stem from lack of knowledge about the foreign
destination and from lack of systematic location planning (Kinkel, 2012; Kinkel and
Maloca 2009). However, empirical evidence on reshoring and foreign divestments is
relatively scarce and calls for more knowledge about its drivers, effects, and about its
likely evolution (Fratocchi et al., 2016, 2014; Kinkel, 2014).
In this paper, we first define reshoring and its different forms and describe it briefly
from the lenses of the most relevant theories (section 2). In the following, we analyse
and compare different surveys that measure reshoring activities in the EU and single
European countries (section 3) und outline some evidence how reshoring relates to
the use of Industry 4.0 technologies in manufacturing (section 4). In section 5 we
analyse existing approaches that measure reshoring activities in the US and
compare the results with European evidence. Section 6 looks at trade data and Input-
Output-Tables as suitable approaches to measure offshoring and reshoring
tendencies. Finally, we draw conclusions on the reshoring evidence in Europe and
the US and the potentials and limitations of the existing approaches to measure the
reshoring phenomenon (section 7).
2. DEFINITION OF RESHORING AND SOME THEORY
Reshoring or backshoring is the decision to relocate manufacturing activities back to
the home country of the parent company (Kinkel & Maloca, 2009; Arlbjørn &
Mikkelsen, 2014; Fratocchi et al., 2014;Foerstl et al., 2016). Reshoring or
backshoring can origin from and be relocated to wholly owned production sites of the
company (captive mode) as well as from foreign suppliers or to home-baes suppliers
(outsourced mode), thus covering different ownership modes of manufacturing in the
offshore and home country. In this context, Gray et al. (2013) distinguish four
different reshoring options (see Figure 1): (a) in-house reshoring, when a company is
relocating manufacturing activities being performed in wholly owned offshore facilities
back to wholly owned facilities in the home country; (b) reshoring for outsourcing,
when a company is relocating manufacturing activities being performed in wholly
owned offshore facilities back to home-based suppliers; (c) reshoring for insourcing,
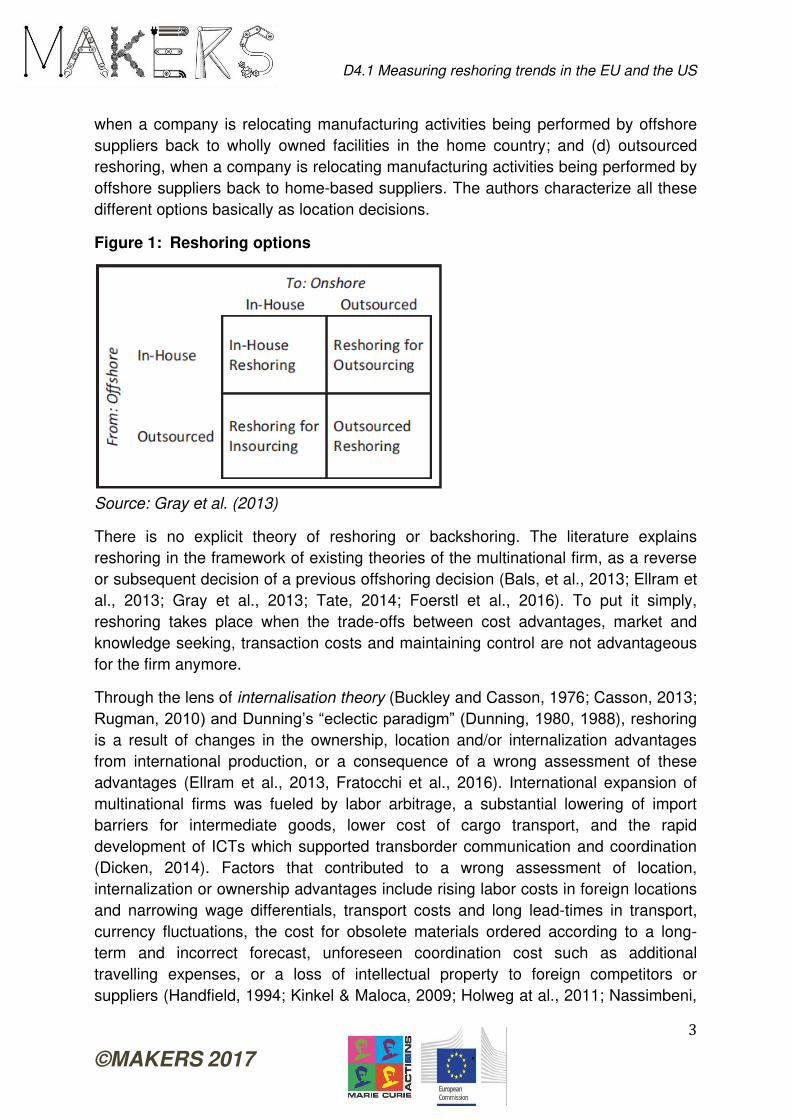
D4.1 Measuring reshoring trends in the EU and the US
3
©MAKERS 2017
when a company is relocating manufacturing activities being performed by offshore
suppliers back to wholly owned facilities in the home country; and (d) outsourced
reshoring, when a company is relocating manufacturing activities being performed by
offshore suppliers back to home-based suppliers. The authors characterize all these
different options basically as location decisions.
Figure 1: Reshoring options
Source: Gray et al. (2013)
There is no explicit theory of reshoring or backshoring. The literature explains
reshoring in the framework of existing theories of the multinational firm, as a reverse
or subsequent decision of a previous offshoring decision (Bals, et al., 2013; Ellram et
al., 2013; Gray et al., 2013; Tate, 2014; Foerstl et al., 2016). To put it simply,
reshoring takes place when the trade-offs between cost advantages, market and
knowledge seeking, transaction costs and maintaining control are not advantageous
for the firm anymore.
Through the lens of internalisation theory (Buckley and Casson, 1976; Casson, 2013;
Rugman, 2010) and Dunning’s “eclectic paradigm” (Dunning, 1980, 1988), reshoring
is a result of changes in the ownership, location and/or internalization advantages
from international production, or a consequence of a wrong assessment of these
advantages (Ellram et al., 2013, Fratocchi et al., 2016). International expansion of
multinational firms was fueled by labor arbitrage, a substantial lowering of import
barriers for intermediate goods, lower cost of cargo transport, and the rapid
development of ICTs which supported transborder communication and coordination
(Dicken, 2014). Factors that contributed to a wrong assessment of location,
internalization or ownership advantages include rising labor costs in foreign locations
and narrowing wage differentials, transport costs and long lead-times in transport,
currency fluctuations, the cost for obsolete materials ordered according to a long-
term and incorrect forecast, unforeseen coordination cost such as additional
travelling expenses, or a loss of intellectual property to foreign competitors or
suppliers (Handfield, 1994; Kinkel & Maloca, 2009; Holweg at al., 2011; Nassimbeni,
D4.1 Measuring reshoring trends in the EU and the US
4
©MAKERS 2017
2006). Case studies have shown that some managers have offshored manufacturing
activities based on simple comparisons of easily measurable costs, in particular labor
costs (Kinkel & Maloca, 2009).
The resource-based view (RBV) of the firm (Wernerfelt, 1984; Prahalad & Hamel,
1990) can also be applied to explain reshoring strategies. Firms can develop
organisational processes and routines that cannot be acquired over markets,
enabling them to use resources and develop capabilities more efficiently and
effectively (Barney, 1991; Teece et al., 1997, 2002). Reshoring decisions thus may
result from the limited abilities of companies to sufficiently develop and maintain such
critical capabilities in foreign locations, or to exploit the host country’s resources in order to create competitive advantage for the multinational company as a whole
(Canham & Hamilton, 2013). Here, advanced production technologies also come into
play. Some organisations are able to adopt manufacturing processes to develop
unique and barely imitable competences at specific locations and to exploit these
resources in a specific and more effective way (Broedner et al., 2009; Grant, 1991).
Transaction cost theory (TCT) can also help to understand reshoring. High and
growing transaction and coordination costs can be strong arguments for re-
concentrating manufacturing activities via reshoring. TCT points to various reasons
for a wrong assessment of the ‘hidden’ costs of offshoring. Bounded rationality and
possible contingencies in transactions across companies and countries may lead to
inaccuracy of the projected cost and performance of manufacturing offshoring
decisions (Pisano, 1990; Pisano & Shih, 2009; Lewin et al., 2009; Cabral et al., 2013)
to higher than expected costs, poorer than expected quality, and higher than
expected efforts for the management of transborder activities (Fredriksson &
Jonsson, 2009; Tate et al., 2009). Biases in decision making such as the
“bandwagon effect” (Abrahamson & Rosenkopf, 1993), aiming at imitating competitor behavior and ‘following the herd’, can also be explained by bounded rationality
(Barthélemy, 2003).
The level of uncertainty is also influencing companies’ offshoring and reshoring
decisions. Foerstl et al. (2016) differentiate between environmental uncertainty,
supply chain complexity, and task uncertainty as possible drivers for reshoring
decisions. Environmental uncertainty encompasses the perceived degree of volatility
and unpredictability of a foreign market, including unforeseen cost increases, quality
and flexibility issues, raw material shortages, or currency fluctuations (Ellram et al.,
2013; Gray et al., 2013; Tate, 2014). Supply chain complexity includes vertical
complexity, horizontal complexity, geographic dispersion and length of the supply
chain (Choi & Hong, 2002). It can lead to excessive coordination and monitoring
efforts, rising transportation cost or high amounts of working capital in safety stock
(Lewin et al., 2009; Tate et al., 2011; Ritter & Sternfels, 2004). Task uncertainty is
another factor influencing offshoring and reshoring decisions. Here, to some extent
D4.1 Measuring reshoring trends in the EU and the US
5
©MAKERS 2017
uncertain potentials of technological innovations in manufacturing processes, e.g. by
an intensified use of Industry 4.0, come also into play. A higher Industry 4.0 adoption
might enable more flexible, autonomous and less labor intensive production modes,
giving advantages to reshoring decisions over low-wage manufacturing activities
(Handley & Benton Jr., 2013; Lasi et al., 2014). Asset specificity is also closely linked
to the implementation of new product or production technologies, e.g. Industry 4.0
technologies. It involves specific durable investments such as technology or
knowledge and skills that are required to realise efficient processes and transactions.
A high degree of asset specificity appears to be most critical for the integration of
manufacturing activities and their control under unified governance (Williamson,
1985), in particular in cases of high product or process complexity (McIvor, 2009).
The higher and more specific investments in advanced production technology are,
the higher the possibility to integrate the specific manufacturing operations at one
focal plant, favoring rather reshoring than additional offshoring activities.
3. SURVEYING RESHORING IN THE EU
3.1 Eurostat survey data on international sourcing
Eurostat has twice collected international business function sourcing data. The two
so-called “ad-hoc surveys” were carried out on a voluntary basis by the National
Statistical Institutes (NSIs) of 12 European countries in 2007 and 15 countries in
2012. The 2007 survey covers the period 2001–2006 (6 years), the 2012 survey
the period 2009-2011 (3 years). The international sourcing statistics cover NACE
Rev.1.1 (Statistical Classification of Economic Activities in the European Community)
sections C to I and K, that are basically non-financial market activities. The data
refers to enterprises with 100 or more persons employed. The focus was on these
larger enterprises, as these were considered to be the key drivers of international
sourcing.
The 2007 international sourcing survey covers the following 11 countries: the Czech
Republic, Denmark, Germany, Ireland, Italy, the Netherlands, Portugal, Slovenia,
Finland, Sweden, and the United Kingdom.
The 2012 international sourcing survey covers the following 15 countries: Belgium,
Bulgaria, Denmark, Estonia, Ireland, France, Latvia, Lithuania, the Netherlands,
Portugal, Romania, Slovakia, Finland, Sweden, and Norway.
The surveys cover the following business functions:
Core business function: Production of final goods or services intended for the
market/for third parties carried out by the enterprise and yielding income.
D4.1 Measuring reshoring trends in the EU and the US
6
©MAKERS 2017
Support business functions that are carried out in order to permit or facilitate
production of goods or services intended for the market/for third parties:
o Distribution and logistics
o Marketing, sales and after sales services
o ICT services
o Administrative and management functions
o Engineering and related technical services, incl. technical testing and design
o Research & Development
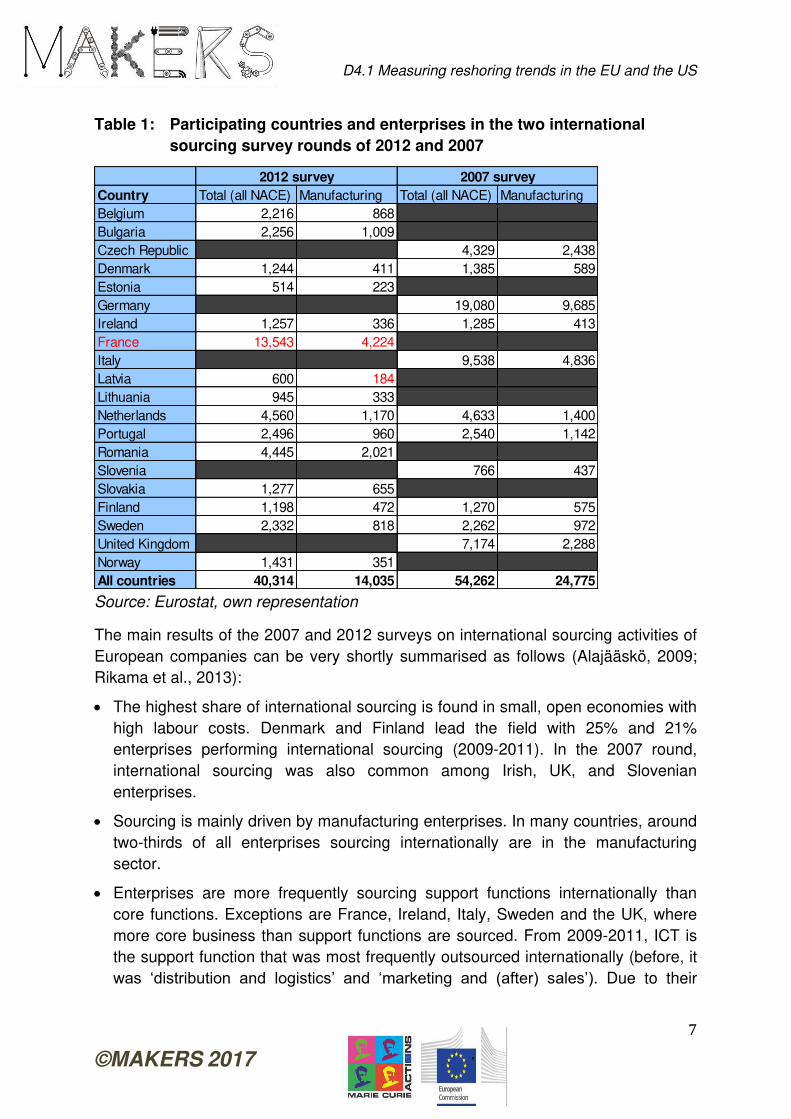
The number of participating enterprises per country for the two survey rounds is
depicted in Table 1, also differentiating between all NACE sectors covered and the
manufacturing industry. As shown, the data set of the 2012 survey round consists of
around 40,000 enterprises (including 14,000 from the manufacturing industry) from
the 15 participating countries, whereas the 2007 data set covers around 54,000
enterprises (including 25,000 from the manufacturing industry) from 11 participating
countries. This is due to the fact that in the 2007 survey round some large EU
countries participated that did not in the 2012 round (e.g. Germany, Italy, UK, Czech
Republic), whereas in the 2012 survey round more smaller countries joined (e.g.
Belgium, Bulgaria, Estonia, Latvia, Lithuania, Romania, Slovakia, Norway). The
number of participating enterprises is rather stable and similar in the seven countries
that participated in both survey rounds (Denmark, Ireland, the Netherlands, Portugal,
Finland, Sweden, and Norway), in all NACE sectors as well as in manufacturing.
D4.1 Measuring reshoring trends in the EU and the US
7
©MAKERS 2017
Table 1: Participating countries and enterprises in the two international
sourcing survey rounds of 2012 and 2007
Source: Eurostat, own representation
The main results of the 2007 and 2012 surveys on international sourcing activities of
European companies can be very shortly summarised as follows (Alajääskö, 2009;
Rikama et al., 2013):
The highest share of international sourcing is found in small, open economies with
high labour costs. Denmark and Finland lead the field with 25% and 21%
enterprises performing international sourcing (2009-2011). In the 2007 round,
international sourcing was also common among Irish, UK, and Slovenian
enterprises.
Sourcing is mainly driven by manufacturing enterprises. In many countries, around
two-thirds of all enterprises sourcing internationally are in the manufacturing
sector.
Enterprises are more frequently sourcing support functions internationally than
core functions. Exceptions are France, Ireland, Italy, Sweden and the UK, where
more core business than support functions are sourced. From 2009-2011, ICT is
the support function that was most frequently outsourced internationally (before, it
was ‘distribution and logistics’ and ‘marketing and (after) sales’). Due to their
Country Total (all NACE) Manufacturing Total (all NACE) Manufacturing
Belgium 2,216 868
Bulgaria 2,256 1,009
Czech Republic 4,329 2,438
Denmark 1,244 411 1,385 589
Estonia 514 223
Germany 19,080 9,685
Ireland 1,257 336 1,285 413
France 13,543 4,224
Italy 9,538 4,836
Latvia 600 184
Lithuania 945 333
Netherlands 4,560 1,170 4,633 1,400
Portugal 2,496 960 2,540 1,142
Romania 4,445 2,021
Slovenia 766 437
Slovakia 1,277 655
Finland 1,198 472 1,270 575
Sweden 2,332 818 2,262 972
United Kingdom 7,174 2,288
Norway 1,431 351
All countries 40,314 14,035 54,262 24,775
2012 survey 2007 survey
D4.1 Measuring reshoring trends in the EU and the US
8
©MAKERS 2017
digital character, ICT services can be conducted relatively easily from any location.
This trend is supported by the increase in the use of cloud computing.
The number of enterprises sourcing knowledge intensive support functions is
growing. Around 15% to 20% of enterprises carrying out international sourcing are
moving R&D and engineering functions abroad. However, over half (53%) of the
international sourcing of R&D and engineering functions is being moved to other
EU Member States.
Proximity is a major factor in sourcing, with domestic sourcing being more
prominent than international sourcing and with international sourcing mainly taking
place within Europe. Yet, China and India have both become important locations
for business function outsourcing. China is strong in attracting core business
functions in manufacturing, whereas India is strong in supplying support services
globally.
The main reason for enterprises to move functions abroad is to cut labour and
other costs. This is particularly important for enterprises in high labour costs
countries, such as the Nordic countries.
Direct employment consequences are limited but their cumulative and indirect
effects should not be underestimated.
Only the 2012 international sourcing survey round covers data on reshoring activities
of European enterprises. They are differentiated in so called “backsourcing” and
“international relocation” activities. In the respective questionnaire to the participating
enterprises, they are defined as follows:
1. International backsourcing is the movement of functions by your enterprise
back into your home country, which your enterprise has previously moved out of
the country.
2. International relocation other than backsourcing is the movement of functions
by your enterprise into your home country from abroad, which have been carried
out for your enterprise abroad but have not previously been moved out of your
home country by your enterprise.
For both modes surveyed, the following additional clarification is made: “The
functions have been moved from your affiliates abroad or from enterprises within or
outside of your enterprise group abroad. They have been moved to your enterprise or
to enterprises within or outside of your enterprise group in in your home country.”
Consequently, both modes can be understood as reshoring activities and cover all
four fields of Gray’s taxonomy displayed in Figure 1 (in-house reshoring, reshoring
for outsourcing, reshoring for insourcing, outsourced reshoring). They differ by the
fact that in the first mode the respective enterprise has offshored (or outsourced) the
activity out of the home country itself, whereas in second mode the activity has been
D4.1 Measuring reshoring trends in the EU and the US
9
©MAKERS 2017
performed abroad without being offshored (or outsourced) by the enterprise itself
before. Therefore, “international backsourcing” can also be characterized as “backshoring” and international relocation as “home-shoring”, as described in the MAKERS deliverable 4.2 (Pegoraro et al., 2017).
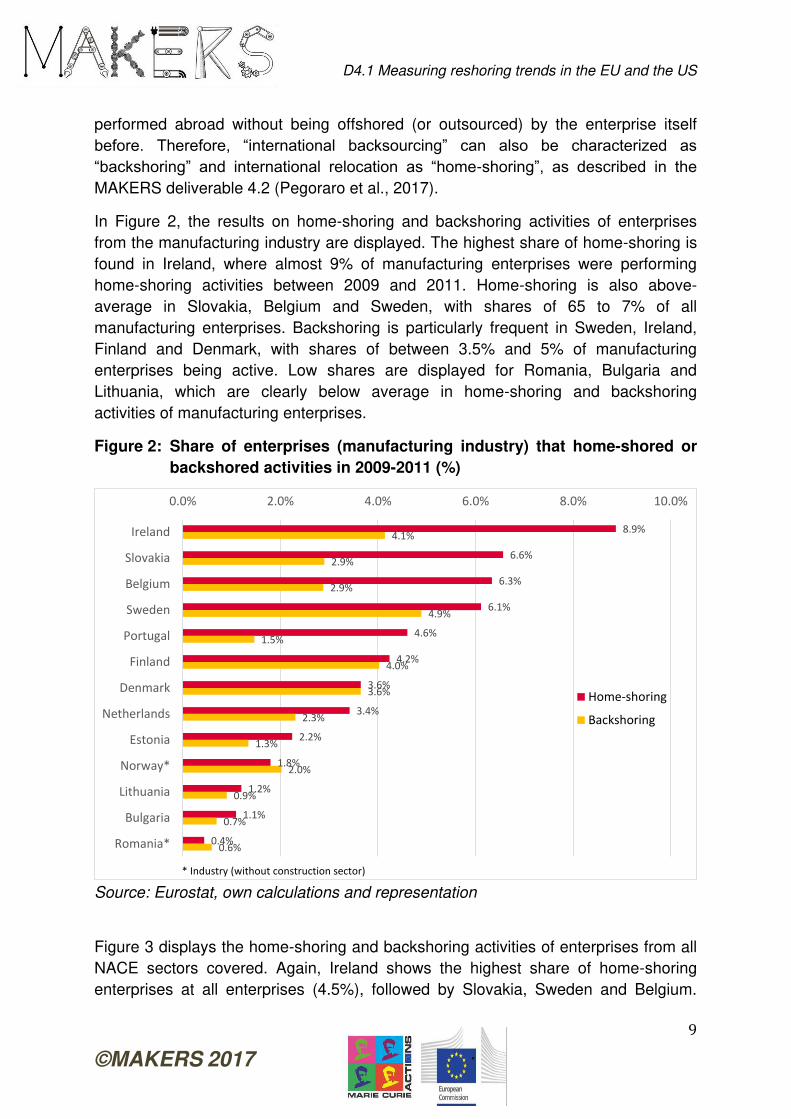
In Figure 2, the results on home-shoring and backshoring activities of enterprises
from the manufacturing industry are displayed. The highest share of home-shoring is
found in Ireland, where almost 9% of manufacturing enterprises were performing
home-shoring activities between 2009 and 2011. Home-shoring is also above-
average in Slovakia, Belgium and Sweden, with shares of 65 to 7% of all
manufacturing enterprises. Backshoring is particularly frequent in Sweden, Ireland,
Finland and Denmark, with shares of between 3.5% and 5% of manufacturing
enterprises being active. Low shares are displayed for Romania, Bulgaria and
Lithuania, which are clearly below average in home-shoring and backshoring
activities of manufacturing enterprises.
Figure 2: Share of enterprises (manufacturing industry) that home-shored or
backshored activities in 2009-2011 (%)
Source: Eurostat, own calculations and representation
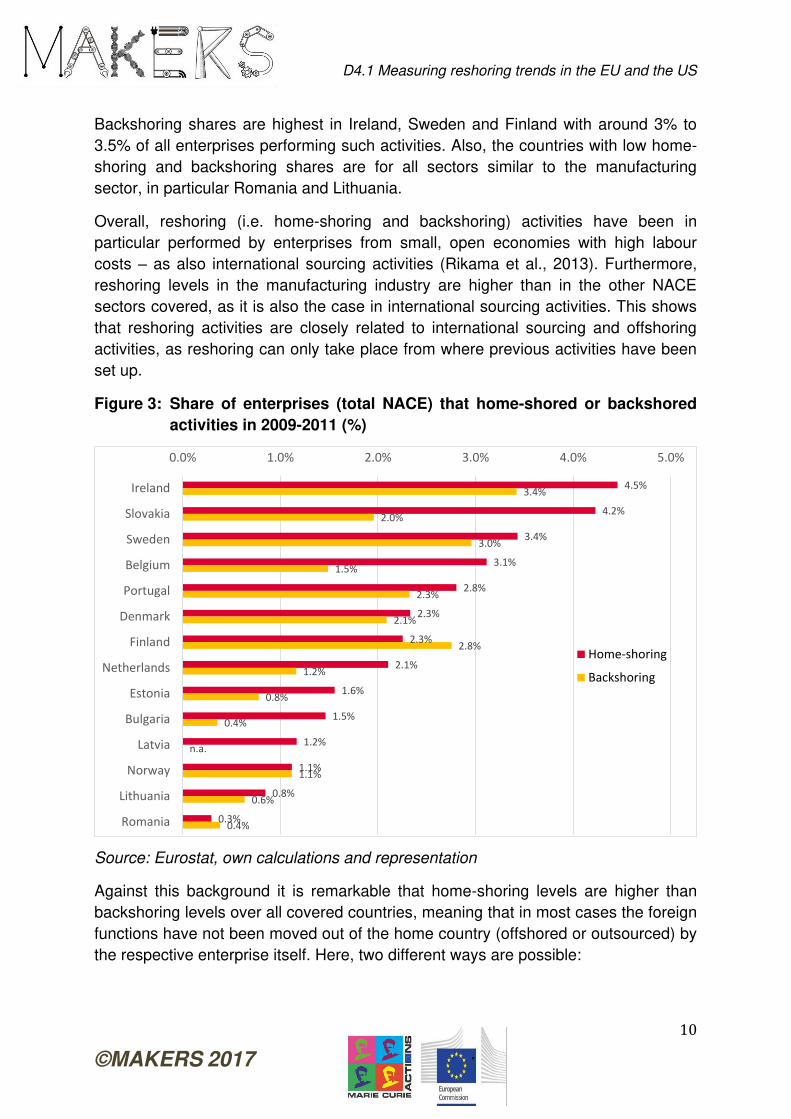
Figure 3 displays the home-shoring and backshoring activities of enterprises from all
NACE sectors covered. Again, Ireland shows the highest share of home-shoring
enterprises at all enterprises (4.5%), followed by Slovakia, Sweden and Belgium.
8.9%
6.6%
6.3%
6.1%
4.6%
4.2%
3.6%
3.4%
2.2%
1.8%
1.2%
1.1%
0.4%
4.1%
2.9%
2.9%
4.9%
1.5%
4.0%
3.6%
2.3%
1.3%
2.0%
0.9%
0.7%
0.6%
0.0% 2.0% 4.0% 6.0% 8.0% 10.0%
Ireland
Slovakia
Belgium
Sweden
Portugal
Finland
Denmark
Netherlands
Estonia
Norway*
Lithuania
Bulgaria
Romania*
Home-shoring
Backshoring
* Industry (without construction sector)
D4.1 Measuring reshoring trends in the EU and the US
10
©MAKERS 2017
Backshoring shares are highest in Ireland, Sweden and Finland with around 3% to
3.5% of all enterprises performing such activities. Also, the countries with low home-
shoring and backshoring shares are for all sectors similar to the manufacturing
sector, in particular Romania and Lithuania.
Overall, reshoring (i.e. home-shoring and backshoring) activities have been in
particular performed by enterprises from small, open economies with high labour
costs – as also international sourcing activities (Rikama et al., 2013). Furthermore,
reshoring levels in the manufacturing industry are higher than in the other NACE
sectors covered, as it is also the case in international sourcing activities. This shows
that reshoring activities are closely related to international sourcing and offshoring
activities, as reshoring can only take place from where previous activities have been
set up.
Figure 3: Share of enterprises (total NACE) that home-shored or backshored
activities in 2009-2011 (%)
Source: Eurostat, own calculations and representation
Against this background it is remarkable that home-shoring levels are higher than
backshoring levels over all covered countries, meaning that in most cases the foreign
functions have not been moved out of the home country (offshored or outsourced) by
the respective enterprise itself. Here, two different ways are possible:
4.5%
4.2%
3.4%
3.1%
2.8%
2.3%
2.3%
2.1%
1.6%
1.5%
1.2%
1.1%
0.8%
0.3%
3.4%
2.0%
3.0%
1.5%
2.3%
2.1%
2.8%
1.2%
0.8%
0.4%
n.a.
1.1%
0.6%
0.4%
0.0% 1.0% 2.0% 3.0% 4.0% 5.0%
Ireland
Slovakia
Sweden
Belgium
Portugal
Denmark
Finland
Netherlands
Estonia
Bulgaria
Latvia
Norway
Lithuania
Romania
Home-shoring
Backshoring
D4.1 Measuring reshoring trends in the EU and the US
11
©MAKERS 2017
1. The enterprise has built up additional capacities or acquired (parts of) a company
in some foreign country, without moving existing activities from the home country
there, and home-shored (some of) these capacities at a later time.
2. The enterprise is part (subsidiary) of a foreign parent company and reshored
some activities from other countries (maybe also the home country of the parent
company) to the country where the enterprise (subsidiary) has its seat.
The first option is assumed to be the more frequent one and seems to be a common
path of reshoring. Thus, it needs to be taken into account that reshoring activities do
not necessarily follow an own previous offshoring or outsourcing activity of the
respective enterprise, but also expansion capacities can be reshored at a later time.
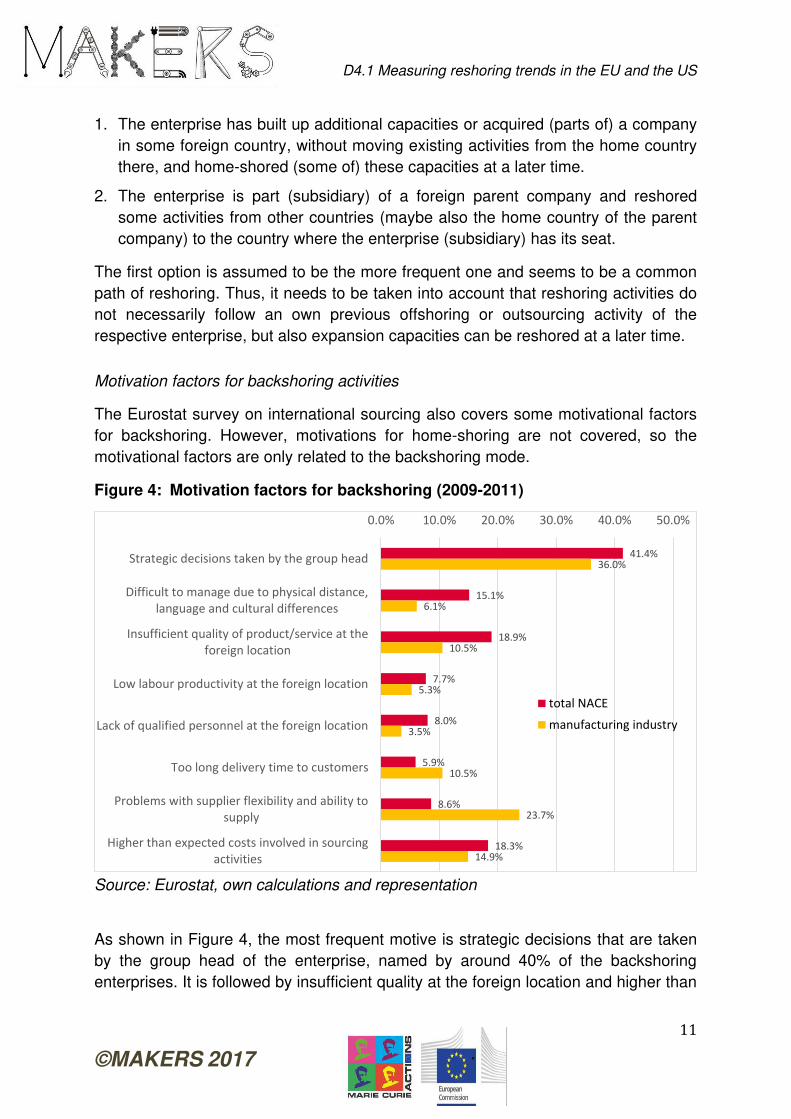
Motivation factors for backshoring activities
The Eurostat survey on international sourcing also covers some motivational factors
for backshoring. However, motivations for home-shoring are not covered, so the
motivational factors are only related to the backshoring mode.
Figure 4: Motivation factors for backshoring (2009-2011)
Source: Eurostat, own calculations and representation
As shown in Figure 4, the most frequent motive is strategic decisions that are taken
by the group head of the enterprise, named by around 40% of the backshoring
enterprises. It is followed by insufficient quality at the foreign location and higher than
41.4%
15.1%
18.9%
7.7%
8.0%
5.9%
8.6%
18.3%
36.0%
6.1%
10.5%
5.3%
3.5%
10.5%
23.7%
14.9%
0.0% 10.0% 20.0% 30.0% 40.0% 50.0%
Strategic decisions taken by the group head
Difficult to manage due to physical distance,
language and cultural differences
Insufficient quality of product/service at the
foreign location
Low labour productivity at the foreign location
Lack of qualified personnel at the foreign location
Too long delivery time to customers
Problems with supplier flexibility and ability to
supply
Higher than expected costs involved in sourcing
activities
total NACE
manufacturing industry
D4.1 Measuring reshoring trends in the EU and the US
12
©MAKERS 2017
expected costs involved in sourcing activities, named by 18% to 19% of the
backshoring enterprises. In the manufacturing industry, in particular problems with
supplier flexibility and ability supply with 24% and long delivery time to customers
with 11% seem to be significantly more important than in total NACE businesses.
Vice versa, insufficient quality and difficult to manage distances and cultural
differences are more important for other businesses than the manufacturing industry.
A further differentiation of the most important motives by the participating countries is
difficult, as numbers off backshoring enterprises are rather small and statistical
evidence does remain limited. Oberall, the most striking result is the dominant
importance of strategic group head decisions for backshoring activities. Here, one
major limitation of the Eurostat survey 2012 comes into play, as it mainly covers
small European countries. In such small countries, subsidiaries of companies from
larger foreign countries play a more important role for the overall economy then in
larger countries like Germany, France or the UK. It can be assumed that in those
large EU countries the population of national enterprises is higher and thus strategic
group head decisions might play a more limited role than in the covered small
economies. This needs to be taken into account when interpreting the results on
reshoring activities from the Eurostat survey.
Overall, the main limitations if the Eurostat survey(s) on international sourcing
regarding the analysis of reshoring activities in Europe are:
The previously mentioned lack of large countries in the survey round 2012, which
limits the results basically to small European economies,
the lack of comparability to the survey round of 2007, as reshoring (i.e.
backshoring and home-shoring) has only been surveyed in 2012 and only seven
smaller countries have participated in both survey rounds (Denmark, Ireland, the
Netherlands, Portugal, Finland, Sweden, and Norway),
no differentiation of reshoring activities in core and support business functions is
possible in the dataset provided by Eurostat, due to the low number of answering
reshoring companies in the participating countries.
3.2 Survey results across several EU member states
Most of the research on reshoring is still based on case studies or individual
reshoring decisions announced in the media. Some studies have been based on
secondary data collected from media reports on individual companies’ reshoring decisions, coupled with additional information (e.g. annual reports, balance sheets,
websites) on the respective companies (OECD, 2015; Uni-CLUB MoRe reshoring
dataset). However, “quantitative evidence on reshoring is still fragmented and often
of anecdotal nature” (OECD, 2015, p. 10). This makes it difficult to assess the
D4.1 Measuring reshoring trends in the EU and the US
13
©MAKERS 2017
magnitude of the phenomenon and analyse the main drivers and characteristics of
the underlying processes (Frattochi et al., 2014; Kinkel, 2014).
The OECD claims in its 2015 position paper that reshoring is a sensitive activity that
companies prefer not to disclose in great detail, as offshoring also is. But companies
might not be so cautious to speak publicly about reshoring, as they might create
rather positive publicity compared to offshoring, which is often loaded with political
pressures (OECD, 2015). However, from their longtime experience in researching the
phenomenon of reshoring, the authors of this report have evidence that there is also
a substantial downward bias in reporting on reshoring decisions, maybe even larger
than in offshoring decisions, as companies really do not want to talk about changes
in their internationalization strategies and the potential errors or misjudgements that
caused the strategy change (Kinkel and Maloca, 2009).
Dachs and Zanker (2014) present recent results on European companies’ backshoring activities based on data from the European manufacturing survey
(EMS)1. The data covers the period between 2010 and mid-2012 for 11 available
countries (Austria, Switzerland, Germany, Denmark, Spain, France, Hungary,
Portugal, Netherlands, Sweden and Slovenia). It shows that around 4% of all
companies in the survey sample have moved production activities to their
home country. In the same time period, there are more than three offshoring
companies for every backshoring company.
Backshoring is most frequent among medium-sized companies. The propensity
for backshoring is below 1.5% in small companies with less than 50 employees,
increases to 9% in companies with 150–249 employees and decreases to around 7%
for companies with 250 and more employees. In a sectoral perspective, the share of
backshoring companies is lowest in low-technology industries such as the
manufacturing of clothing, food and beverages, wood products, glass or bricks.
Advantages of offshoring locations seem to be largest in these sectors. In contrast,
backshoring is most frequent in high-technology industries. Here, the electrical
equipment and computer industry stand out.
Other EU countries (Western as well as Eastern Europe) represent almost two-thirds
of the source countries for backshoring by EU companies. In particular China and
India have become more important as source countries for backshoring over time,
1 The European Manufacturing Survey investigates technological and non-technological innovation in
European industry. In contrast to the Community Innovation Survey, it is more focused on technology
diffusion and organisational innovation (including offshoring, outsourcing, and reshoring). The survey is
organised by a consortium of research institutes and universities, coordinated by the Fraunhofer Institute
for Systems and Innovation Research ISI, and takes place every three years. More than 3,500 firms in 13
EU countries participated in the last available survey in 2012.
D4.1 Measuring reshoring trends in the EU and the US
14
©MAKERS 2017
accounting for more than 20% of all backshoring activities. This follows the increased
offshoring by EU companies to these countries in the years before.
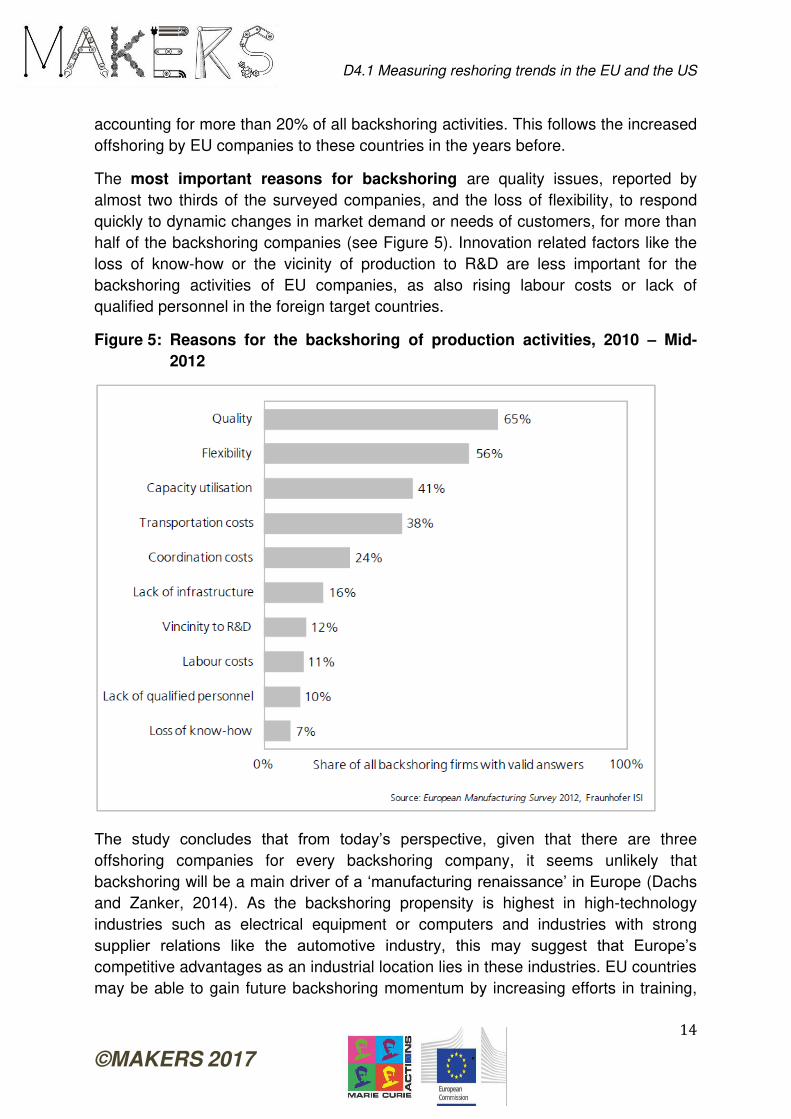
The most important reasons for backshoring are quality issues, reported by
almost two thirds of the surveyed companies, and the loss of flexibility, to respond
quickly to dynamic changes in market demand or needs of customers, for more than
half of the backshoring companies (see Figure 5). Innovation related factors like the
loss of know-how or the vicinity of production to R&D are less important for the
backshoring activities of EU companies, as also rising labour costs or lack of
qualified personnel in the foreign target countries.
Figure 5: Reasons for the backshoring of production activities, 2010 – Mid-
2012
The study concludes that from today’s perspective, given that there are three
offshoring companies for every backshoring company, it seems unlikely that
backshoring will be a main driver of a ‘manufacturing renaissance’ in Europe (Dachs
and Zanker, 2014). As the backshoring propensity is highest in high-technology
industries such as electrical equipment or computers and industries with strong
supplier relations like the automotive industry, this may suggest that Europe’s competitive advantages as an industrial location lies in these industries. EU countries
may be able to gain future backshoring momentum by increasing efforts in training,
D4.1 Measuring reshoring trends in the EU and the US
15
©MAKERS 2017
innovation, and new production processes, as e.g. Industry 4.0, to be able to further
increase production flexibility and quality, which proved to be the main drivers of
backshoring activities of European manufacturing companies.
Fratocchi et al. (2016) provide evidence on motivations of manufacturing reshoring,
based on a sample of 377 reshoring cases belonging to 322 companies. US and EU
companies are almost equally represented in the sample (47% and 51%). Data were
collected by the Uni-CLUB MoRe Reshoring Research Group2 from 2011 to the
beginning of 2014 through a keyword search in secondary data of the major
international and national business-related newspapers, magazines and reports (e.g.,
Wall Street Journal, Financial Times, The Economist, Time, Bloomberg, Business
Week, Spiegel online, and Il Sole 24 Ore), white papers of major consulting
companies (e.g. Boston Consulting Group, McKinsey, Accenture and internet search.
With respect to US companies, data collected by the Reshoring Initiative
(www.reshorenow.org) was also integrated. Results show that 59% of the reshoring
activities originate from China and 13% from other Asian countries, 12% from
Eastern European countries, 8% from Western European countries, and 5% from
Central and South America. China as a source country of reshoring is much more
important for US companies (75%) than for EU companies (44%), whereas Eastern
Europe and Western Europe are mainly relevant for EU companies (23% and 13%)
and almost negligible for US companies (0.5% and 3%). The most frequently
mentioned reshoring motivations were logistics costs (22%), delivery time (18%),
labor cost gap reduction (18%), Made in effect (18%), poor quality of offshored
production (17%), and total costs of sourcing (11%). All other of the identified 26
distinct reshoring motivations were mentioned in less than 10% of the reshoring
cases. On the other hand, some factors as e.g. the loss of know-how in the host
country or other manufacturing costs as e.g. energy costs seem to be less relevant
than in the related literature. Overall, factors of the external environment (in 70% of
the cases) appeared to be more relevant for reshoring decisions than internal factors
(44%). The authors conclude that both efficiency-driven as well as customer value-
driven motivations for reshoring are important and should be integrated into
sustainable ex ante evaluation schemes for offshoring initiatives.
An empirical study by Ancarani et al. (2015) provides evidence on reshoring activities
and the duration of prior foreign manufacturing ventures. The analysis is also based
on secondary data from the Uni Club MoRe, covering 249 reshoring cases from 2011
to the beginning of 2014. The database consists of 131 US and 109 EU cases. 90%
of the US cases were reshoring from Asia, compared to 61% of the EU cases,
whereas 26% of the EU cases moved back from Eastern Europe, which was no
2 The Uni-CLUB MoRe Reshoring Research Group is a team of management engineering scholars with an
active interest in tracking reshoring activities belonging to four Italian universities (Bologna, Catania,
L'Aquila, Udine). The group was established in 2009.
D4.1 Measuring reshoring trends in the EU and the US
16
©MAKERS 2017
factor for US reshoring at all. Total costs were the most important reshoring
motivation for both US (38%) and EU (36%) reshoring companies. Also quality
issues were similarly important for both US (21%) and EU (17%) companies.
However, delivery delays (21% vs. 12%) and proximity to customers (13% vs. 2%)
were significantly more important for US companies, whereas the Made-in effect was
a motivation especially for EU companies (13% vs. 20%). Regarding the duration of
the prior offshore experience, the paper shows that 75% of the companies have
reshored within 10 years when performing an offshore outsourcing mode, whereas
this drops to about 50% for firms with a captive offshoring strategy. In more detail,
the results show that
companies from the electronics and automotive sectors return earlier than other
industries, as they are characterised by high product specialisation and
customization, high levels of outsourcing and strong final producers (OEMs),
small and medium sized enterprises (SMEs) return earlier than large firms, as
they are more prone to strategic mistakes in the ex-ante evaluation of offshore
initiatives (Kinkel and Maloca, 2009) and exhibit higher vulnerability to
environmental changes, due to shortages of internal resources (information,
capital, managerial experience),
the duration of offshore ventures in China and other Asian countries is
significantly lower than in other countries, due to the rapid deterioration of
locational cost advantages over the past years, and due to cultural differences in
language, business approaches, political systems, or the coordination of work,
quality issues significantly decreases the duration abroad, as strategic assets
seeking is becoming key in explaining relocations,
reshoring due to “made-in” motivations is also associated with shorter durations offshore, but only for EU companies, which overall exhibit a shorter offshore
duration than US companies.
Ancarani et al. (2017) provide more recent evidence from the European Monitor of
Reshoring (EMR), a collaboration between EU Eurofound and a Consortium of Italian
Universities (Bologna, Catania, L'Aquila, and Udine) in order to identify and analyse
evidence on reshoring to the EU. It uses secondary sources, mainly based on a
broad media screening of more than 7,500 press releases, major daily newspapers,
local papers, trade journals, broadcaster websites, news agencies, etc., employing a
structured keyword search. The screening started in January 2016 and covered 93
backshoring cases until May 2017. UK, Italy and France account for 66% of the
collected cases, whereas Germany and Spain each represent only 5% of the sample.
The main source countries of backshoring activities were by far Western European
countries (36%) and China (34%), followed clearly behind by Eastern European
countries (10%), India (7%) and the USA (6%). The high proportion of reshoring from
D4.1 Measuring reshoring trends in the EU and the US
17
©MAKERS 2017
Western Europe seems to be motivated by exploitation of untapped capacity at home
or reorganisation of home-based production sites. The main motivations for
backshoring are related to business restructuring, that includes global
reorganization (38%), economic crisis (20%) and untapped capacity at home (17%),
followed by flexibility related factors like delivery time (26%) and proximity to
customers (25%), quality related factors like "Made in" effect (24%) and poor quality
of offshored production (20%), and the automation of production processes (22%)
and other product/process innovations (22%) at the home base.
Wan et al. (2017) provide evidence on reshoring entry modes based on a more
recent sample of the Uni Club MoRe dataset, consisting of 678 cross-industry and
cross-country reshoring projects. Data were collected from 2011 to 2016 through a
keyword search in secondary data of the major international and national business-
related newspapers, magazines and reports (e.g., Wall Street Journal, Financial
Times, The Economist, Time, Bloomberg, Business Week, Spiegel online, and Il Sole
24 Ore). Results show that entry modes of reshoring decisions are affected by
past experiences and thus not independent from the entry modes of the previous
offshoring decisions. An “insourcing entry mode” is almost always replicated in future relocations, whereas an “outsourcing offshore entry mode” has been changed in half of the cases towards an “insourcing reshore entry mode”. Companies belonging to
clothing industry are more likely to select outsourced reshoring whereas government
incentives are significantly and positively related to the insourcing mode of reshoring.
3.3 Survey results on single country level
Germany
The only longitudinal data on offshoring and backshoring activities is available for the
German manufacturing industry. The German Manufacturing Survey is part of the
European Manufacturing Survey (EMS), coordinated by the Fraunhofer Institute for
Systems and Innovation Research ISI, and includes around 1,150 to 1,650 answers
of German manufacturing companies in each survey round from 1997 to 2015 (1997,
1999, 2001, 2003, 2006, 2009, 2012, 2015). The distribution of the sample is
representative of the basic population of all German manufacturing companies.
German evidence on reshoring might be indicative of trends in other developed and
high-wage countries with strong capabilities in medium-high-tech manufacturing and
opportunities for innovations for global markets, e.g. in automotive, machinery and
equipment, electrical machinery, chemical industries (Brennan et al., 2015).
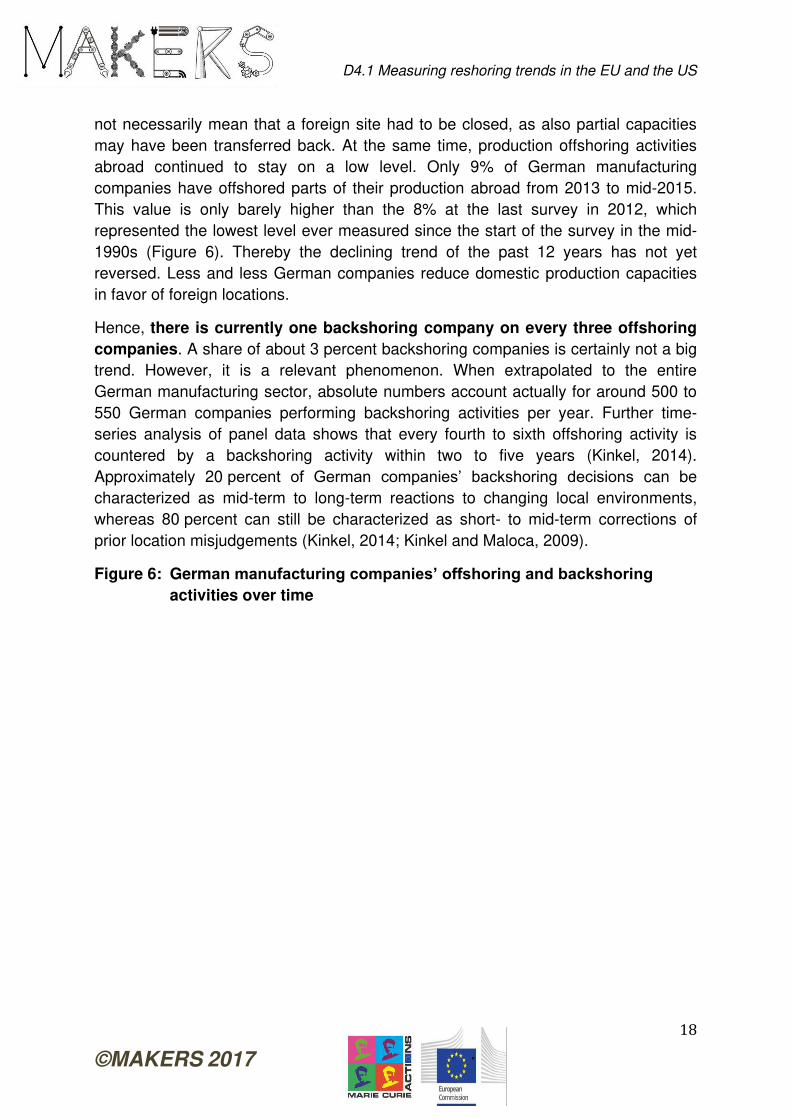
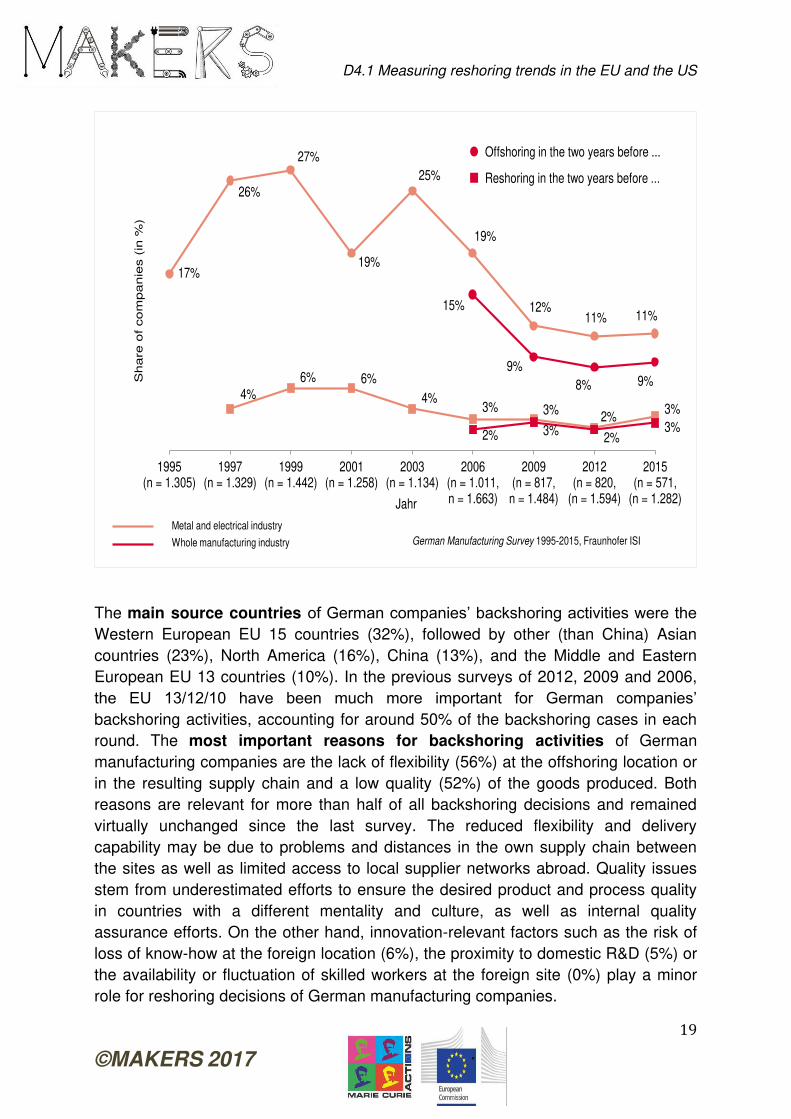
According to the most recent data from the survey round of 2015, backshoring of
production capacities has slightly risen compared to the 2012 survey results. From
2013 to mid-2015, about 3% of the German manufacturing companies have
shored parts of their foreign production capacities back to Germany. This does
D4.1 Measuring reshoring trends in the EU and the US
18
©MAKERS 2017
not necessarily mean that a foreign site had to be closed, as also partial capacities
may have been transferred back. At the same time, production offshoring activities
abroad continued to stay on a low level. Only 9% of German manufacturing
companies have offshored parts of their production abroad from 2013 to mid-2015.
This value is only barely higher than the 8% at the last survey in 2012, which
represented the lowest level ever measured since the start of the survey in the mid-
1990s (Figure 6). Thereby the declining trend of the past 12 years has not yet
reversed. Less and less German companies reduce domestic production capacities
in favor of foreign locations.
Hence, there is currently one backshoring company on every three offshoring
companies. A share of about 3 percent backshoring companies is certainly not a big
trend. However, it is a relevant phenomenon. When extrapolated to the entire
German manufacturing sector, absolute numbers account actually for around 500 to
550 German companies performing backshoring activities per year. Further time-
series analysis of panel data shows that every fourth to sixth offshoring activity is
countered by a backshoring activity within two to five years (Kinkel, 2014).
Approximately 20 percent of German companies’ backshoring decisions can be
characterized as mid-term to long-term reactions to changing local environments,
whereas 80 percent can still be characterized as short- to mid-term corrections of
prior location misjudgements (Kinkel, 2014; Kinkel and Maloca, 2009).
Figure 6: German manufacturing companies’ offshoring and backshoring activities over time
D4.1 Measuring reshoring trends in the EU and the US
19
©MAKERS 2017
The main source countries of German companies’ backshoring activities were the Western European EU 15 countries (32%), followed by other (than China) Asian
countries (23%), North America (16%), China (13%), and the Middle and Eastern
European EU 13 countries (10%). In the previous surveys of 2012, 2009 and 2006,
the EU 13/12/10 have been much more important for German companies’ backshoring activities, accounting for around 50% of the backshoring cases in each
round. The most important reasons for backshoring activities of German
manufacturing companies are the lack of flexibility (56%) at the offshoring location or
in the resulting supply chain and a low quality (52%) of the goods produced. Both
reasons are relevant for more than half of all backshoring decisions and remained
virtually unchanged since the last survey. The reduced flexibility and delivery
capability may be due to problems and distances in the own supply chain between
the sites as well as limited access to local supplier networks abroad. Quality issues
stem from underestimated efforts to ensure the desired product and process quality
in countries with a different mentality and culture, as well as internal quality
assurance efforts. On the other hand, innovation-relevant factors such as the risk of
loss of know-how at the foreign location (6%), the proximity to domestic R&D (5%) or
the availability or fluctuation of skilled workers at the foreign site (0%) play a minor
role for reshoring decisions of German manufacturing companies.
17%
26%
27%
19%
25%
19%
12%11% 11%
15%
9%
8% 9%4%
6% 6%
4%3% 3%
2%3%
2% 3%2%
3%
1995(n = 1.305)
1997(n = 1.329)
1999(n = 1.442)
2001(n = 1.258)
2003(n = 1.134)
2006(n = 1.011,n = 1.663)
2009(n = 817,
n = 1.484)
2012(n = 820,
(n = 1.594)
2015(n = 571,
(n = 1.282)
Share
of com
panie
s (
in %
)
Jahr
German Manufacturing Survey 1995-2015, Fraunhofer ISI
Metal and electrical industry
Whole manufacturing industry
Offshoring in the two years before ...
Reshoring in the two years before ...
D4.1 Measuring reshoring trends in the EU and the US
20
©MAKERS 2017
DACH countries
Dachs et al. (2017) provide evidence on backshoring activities in the so called DACH
countries (Germany, Austria and Switzerland), based on the European
Manufacturing Survey (EMS) 2015. The data set includes responses of 2,120
manufacturing companies (1,236 from Germany, 135 from Austria, 749 from
Switzerland) with at least 20 employees. Overall, 3.8% of all companies in the
sample performed backshoring activities during 2013-14. The most important
reasons for backshoring are the lack of flexibility and delivery issues (52%) at the
offshoring location or in the resulting supply chain and a low quality (45%) of the
goods produced, followed by unemployed capacities in the home country (42%). All
other factors follow clearly behind, with transportation and coordination cost (each
around 20%) on ranks four and five). High labour costs or innovation related factors
like proximity to R&D activities or a perceived loss of know-how are the least relevant
reasons for backshoring activities, each named by less than 10% of the surveyed
backshoring companies.
France
Fel and Griette (2016) conducted an online survey of 215 buyers and purchasing
managers from companies located in France (87%) and Western Europe (13%). They
find that 75% of the responding companies were sourcing in China, mainly to search for
low prices (90%). Among the companies sourcing in China, 48% have actually near-
reshored all, or part, of their Chinese supplies over the past few years, and 10% plan to
do so soon. Near-reshoring is most common in the textile (80%) and retail industry (75%)
and almost non-existent in the computer industry. 30% of the near-reshoring companies
– or 14% of all companies sourcing in China – were backshoring to France, all
others to other Western and Eastern European countries (incl. Turkey). Most of the near-
reshoring is relatively new, as 96% of the responding companies started during the past
5 years and 39% in the past year (2015) alone. The duration of the offshoring
strategy before reshoring was relatively short, reaching more than 10 years in only
20% of the cases and 5 years or less in 35% of the cases. The main motives for
reshoring were changes in business conditions with China (54%, e.g. higher wage costs
and the fall of the Euro against the US Dollar), followed by changes in the companies’ strategies (30%, e.g. moving upmarket, upgrading, lean management, CSR policy),
seeking to bring design and production closer together (40%) and correction of mistakes
in their ex ante judgment of the initial offshoring operations (15%). Most of the reshored
products were mid-range products (60%), followed by high-end (25%) and low-end
products (15%).
D4.1 Measuring reshoring trends in the EU and the US
21
©MAKERS 2017
UK
Bailey and De Propris (2014) discussed the evidence on backshoring to the United
Kingdom that is available from a variety of surveys. E.g., a survey by Business
Birmingham (2013) indicated that one-third of UK manufacturers were considering to
source more domestically. A survey of manufacturing firms in the Midlands of the UK
(Bailey and De Propris/ SGH Martineau, 2013) displayed that around 16% of the 80
responding companies were actually undertaking reshoring and 5% actively
considering it. A half of the companies have brought back operations from BRIC
(Brazil, Russia, India and China) countries, one third from Asia, and over one fifth
from Europe. The most important drivers for reshoring were transport costs (62%
of respondents) and quality issues (62%), followed by supply-chain resilience (39%),
exchange rate shifts (31%), rising wages overseas (31%), the need for rapid
turnaround (31%) and the need to offer a service alongside manufacturing (31%).
However, Bailey and De Propris (2014) also identified key barriers for further
backshoring to the UK like energy costs, regulation, access to finance, skills gaps,
etc..
Recently, Li et al. (2017) provided results of a survey of all UK-based manufacturers.
Of the responding companies, 262 have no missing values and thus were eligible for
analysis. The analysis distinguishes between direct reshoring, which refers to the
physical backshoring of previously offshored manufacturing activities back to the UK,
and indirect reshoring, that is “to keep or increase manufacturing activities in the UK
instead of moving them abroad after a serious consideration of foreign locations” (Li et al., 2017, p. 5). Results show that 13% of the responding companies have
directly reshored (backshored) manufacturing activities back to the UK within
the past 8 years (since 2008), whereas “indirect reshoring” has been significantly
more common among UK manufacturers, being performed by 52% of the surveyed
companies. The analysis also provides some evidence that offshoring companies
show a better cost performance in manufacturing, whereas reshoring (indirect or
direct) companies are better in terms of flexibility and delivery time.
Nordic countries
Heikkilä (2017) provides a comprehensive study on “Relocation of Nordic Manufacturing” in the so called Nordic countries Denmark, Finland and Sweden.
(Heikkilä, 2017). The research was conducted within the ROaMING research project
by the Tampere University of Technology (TUT), Lund University and the University
of Southern Denmark during 2015-17. They carried out a large survey on offshoring
and backshoring activities during 2010-15, containing responses of 847
manufacturing companies (373 from Sweden, 229 from Finland, 245 from Denmark).
D4.1 Measuring reshoring trends in the EU and the US
22
©MAKERS 2017
This rich data set allows for differentiating backshoring patterns and motives over the
three countries covered. Overall, 19% (n=160) of the surveyed companies answered
that they have performed backshoring activities during 2010-15, with the highest
backshoring propensity observed in Sweden (27%), followed by Finland (13%) and
Denmark (13%) with a quite similar frequency. The most active industries in
backshoring were basic metals (36%), electrical equipment (33%) and the chemical
industry (30%), whereas the timber industry is the most reluctant to backshoring
(9%). The main source countries of backshoring activities were other Nordic (26%)
and Western European countries (31%), followed by Eastern European countries
(17%), China (13%), and other Asian countries (9%). The most important drivers
for backshoring activities are quality (scoring 3.82 on a 5 point Likert scale),
followed by flexibility (3.73), lead time (3.56), access to skills and knowledge (3.48),
access to technology (3.24), other cost (3.21), logistics cost (3.12) and proximity to
R&D and product development (3.10). All other factors scored below the scale
median of 3.0. Labor cost is the most important factor for offshoring decisions (3.93),
but not for backshoring (2.43). Overall, in particular quality related, flexibility and time
related, innovation and knowledge related and to some extent (logistic) cost related
factors matter for backshoring decisions of Nordic manufacturing companies.
3.4 Comparison and discussion of survey results and approaches
Overall, the following conclusions can be drawn when analysing the patterns of
European companies’ reshoring activities:
Source countries for reshoring by European companies are in particular other
Western and Eastern European countries. China has emerged as the most
important single source country of European manufacturing companies’ backshoring activities, and also India has become more important over time.
The most important reasons for backshoring activities of European
manufacturing companies are quality issues, loss of flexibility and delivery time,
logistics costs, the “Made in” reputation effect, the reduction of labor cost gaps, and total costs of sourcing. Innovation-related factors like the loss of know-how or
the vicinity of production to R&D are less important for the backshoring activities
of European companies, as also some other manufacturing costs as e.g. energy
costs.
In Europe, the average share of companies active in reshoring at all
manufacturing companies is around 4%, varying significantly from around 1% in
Eastern European countries like Romania or Bulgaria over 3% in large industrial
countries like Germany, 10% in small Western economies like Belgium, 13% in
Ireland or Nordic countries like Denmark or Finland, up to around 15% in France
and the UK or even 27% in Sweden.
D4.1 Measuring reshoring trends in the EU and the US
23
©MAKERS 2017
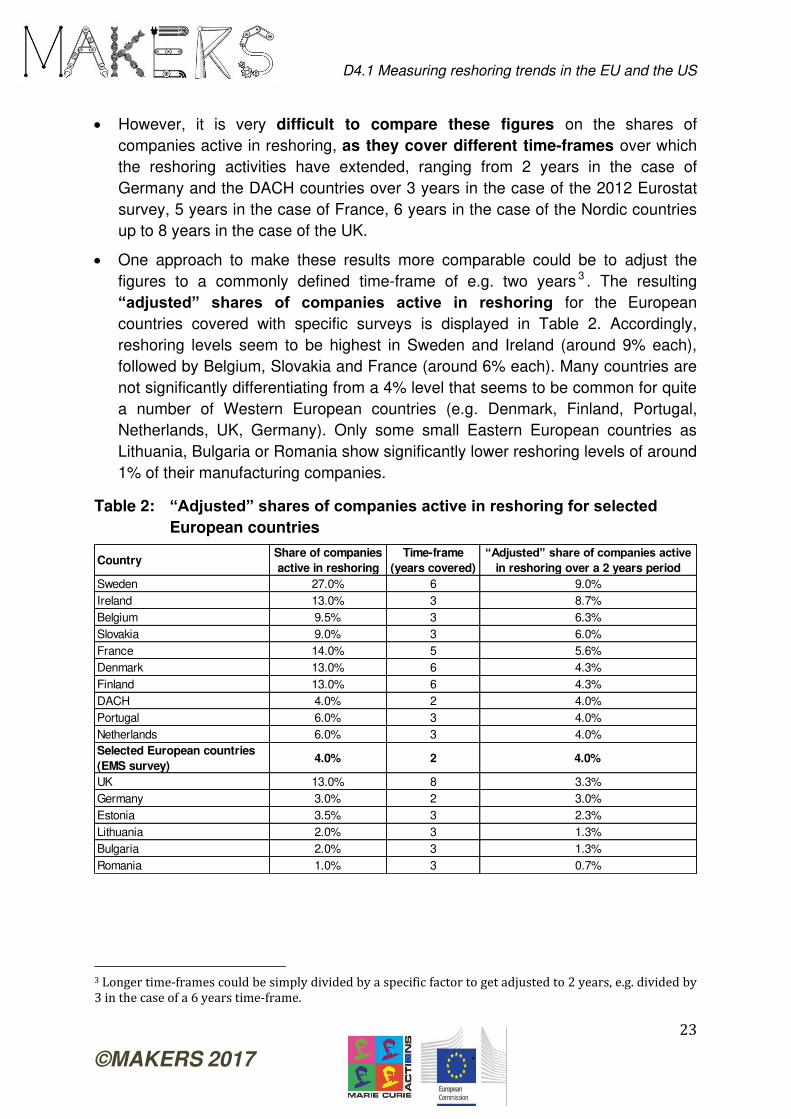
However, it is very difficult to compare these figures on the shares of
companies active in reshoring, as they cover different time-frames over which
the reshoring activities have extended, ranging from 2 years in the case of
Germany and the DACH countries over 3 years in the case of the 2012 Eurostat
survey, 5 years in the case of France, 6 years in the case of the Nordic countries
up to 8 years in the case of the UK.
One approach to make these results more comparable could be to adjust the
figures to a commonly defined time-frame of e.g. two years 3 . The resulting
“adjusted” shares of companies active in reshoring for the European
countries covered with specific surveys is displayed in Table 2. Accordingly,
reshoring levels seem to be highest in Sweden and Ireland (around 9% each),
followed by Belgium, Slovakia and France (around 6% each). Many countries are
not significantly differentiating from a 4% level that seems to be common for quite
a number of Western European countries (e.g. Denmark, Finland, Portugal,
Netherlands, UK, Germany). Only some small Eastern European countries as
Lithuania, Bulgaria or Romania show significantly lower reshoring levels of around
1% of their manufacturing companies.
Table 2: “Adjusted” shares of companies active in reshoring for selected European countries
3 Longer time-frames could be simply divided by a specific factor to get adjusted to 2 years, e.g. divided by
3 in the case of a 6 years time-frame.
CountryShare of companies
active in reshoring
Time-frame
(years covered)
“Adjusted” share of companies active in reshoring over a 2 years period
Sweden 27.0% 6 9.0%
Ireland 13.0% 3 8.7%
Belgium 9.5% 3 6.3%
Slovakia 9.0% 3 6.0%
France 14.0% 5 5.6%
Denmark 13.0% 6 4.3%
Finland 13.0% 6 4.3%
DACH 4.0% 2 4.0%
Portugal 6.0% 3 4.0%
Netherlands 6.0% 3 4.0%
Selected European countries
(EMS survey)4.0% 2 4.0%
UK 13.0% 8 3.3%
Germany 3.0% 2 3.0%
Estonia 3.5% 3 2.3%
Lithuania 2.0% 3 1.3%
Bulgaria 2.0% 3 1.3%
Romania 1.0% 3 0.7%
D4.1 Measuring reshoring trends in the EU and the US
24
©MAKERS 2017
However, also the “adjusted” shares of companies active in reshoring need to be
cautiously compared between different European countries and interpreted with
care. One reason is that the “adjustment” to a time-frame of 2 years by a simple
division can be problematic, as companies may have reshored more than once
over a longer period of time and therefore the real ratio tends to be
underestimated by the simple division. Also, company managers may be more
reminiscent of recent events than those completed some time ago.
Another issue is different points in time when the different surveys were
conducted, as reshoring decisions are heavily influenced by factors of the
external environment and these are changing quite significantly over time (e.g.
wages, economic and political conditions, etc.).
4. MEASURING THE INTERRELATION BETWEEN RESHORING AND
THE USE OF INDUSTRY 4.0 TECHNOLOGIES
A recent study by Kinkel and Jäger (2017) investigates the relationship between
backshoring of production activities and the use of digitization technologies in
manufacturing, also known as Industry 4.0 (I4.0). The analysis is based on German
data of the European Manufacturing Survey (EMS), covering 1,282 German
manufacturing companies. The selected sample is representative for the whole
German manufacturing industry.
The study analyzed the use of eight different digitization technologies that can be
understood as enabling technologies for digital networked production according to
the model of Industry 4.0. These were assigned to the following three technology
fields:
Digital management systems comprise two basic technologies for the
management of IT-related processes of production and product development:
o Software system for production planning and control (ERP)
o Product Lifecycle Management systems (PLM)
Wireless human-machine communication encompasses two workplace-
supporting IT implementations:
o Digital visualization in the workplace
o Mobile / wireless devices for the programming and operation of systems
Cyber-Physical-Systems encompass production-integrated enabler technologies
for industry 4.0:
o Digital exchange of disposition data with suppliers or customers (SCM)
D4.1 Measuring reshoring trends in the EU and the US
25
©MAKERS 2017
o Techniques for automation and control of internal logistics
o Real-time manufacturing execution system (MES)
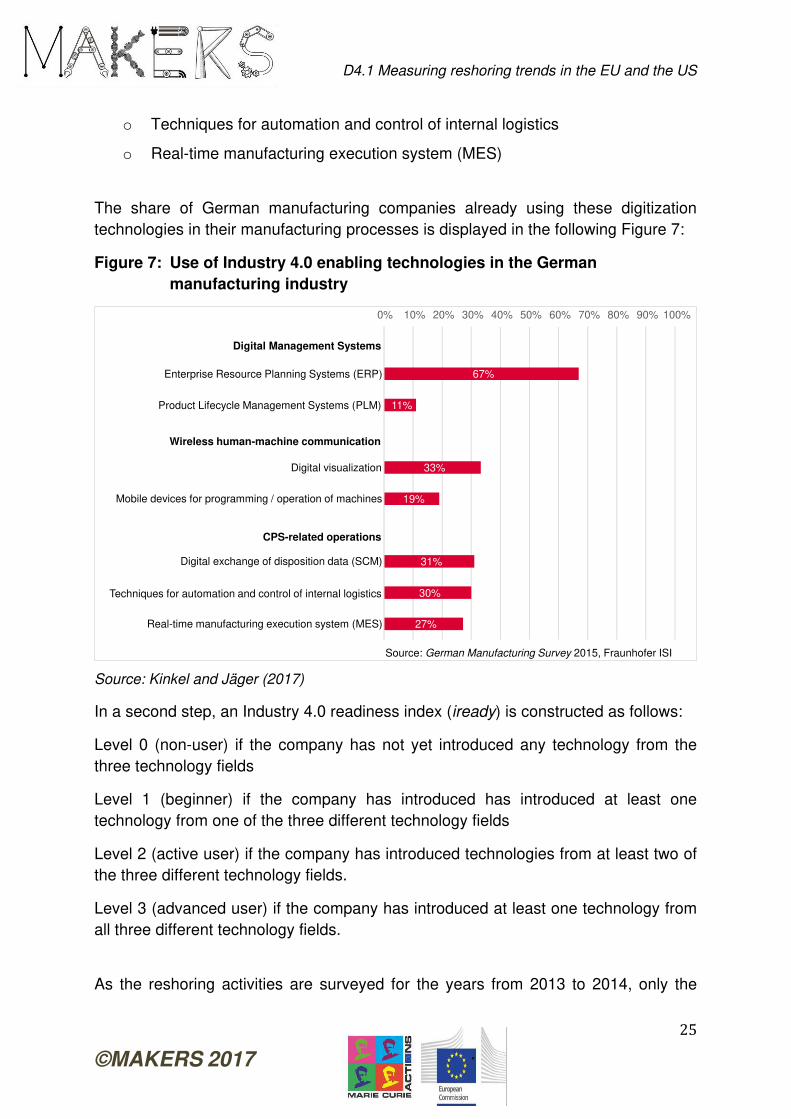
The share of German manufacturing companies already using these digitization
technologies in their manufacturing processes is displayed in the following Figure 7:
Figure 7: Use of Industry 4.0 enabling technologies in the German
manufacturing industry
Source: Kinkel and Jäger (2017)
In a second step, an Industry 4.0 readiness index (iready) is constructed as follows:
Level 0 (non-user) if the company has not yet introduced any technology from the
three technology fields
Level 1 (beginner) if the company has introduced has introduced at least one
technology from one of the three different technology fields
Level 2 (active user) if the company has introduced technologies from at least two of
the three different technology fields.
Level 3 (advanced user) if the company has introduced at least one technology from
all three different technology fields.
As the reshoring activities are surveyed for the years from 2013 to 2014, only the
67%
11%
33%
19%
31%
30%
27%
0% 10% 20% 30% 40% 50% 60% 70% 80% 90% 100%
Enterprise Resource Planning Systems (ERP)
Product Lifecycle Management Systems (PLM)
Digital visualization
Mobile devices for programming / operation of machines
Digital exchange of disposition data (SCM)
Techniques for automation and control of internal logistics
Real-time manufacturing execution system (MES)
Source: German Manufacturing Survey 2015, Fraunhofer ISI
Digital Management Systems
Wireless human-machine communication
CPS-related operations
D4.1 Measuring reshoring trends in the EU and the US
26
©MAKERS 2017
introduction of digitization technologies before 2013 is considered. As the descriptive
analysis shows, 33% of the German manufacturing industry did not use any of the
selected digitization technologies before 2013 (level 0). So, a relevant number of
German companies are still at the very beginning of the road towards industry 4.0.
The group of companies which introduced at least one technology in one of the
technology fields before 2013 (level 1) includes 21 per cent of the companies. 25% of
the companies belong to level 2 and another 21% to level 3. The level 3 "advanced
users" are at least already set up in such a way that they have already gained
experience with today's enabling technologies in all three technology fields relevant
to Industry 4.0. However, this group is relatively small.
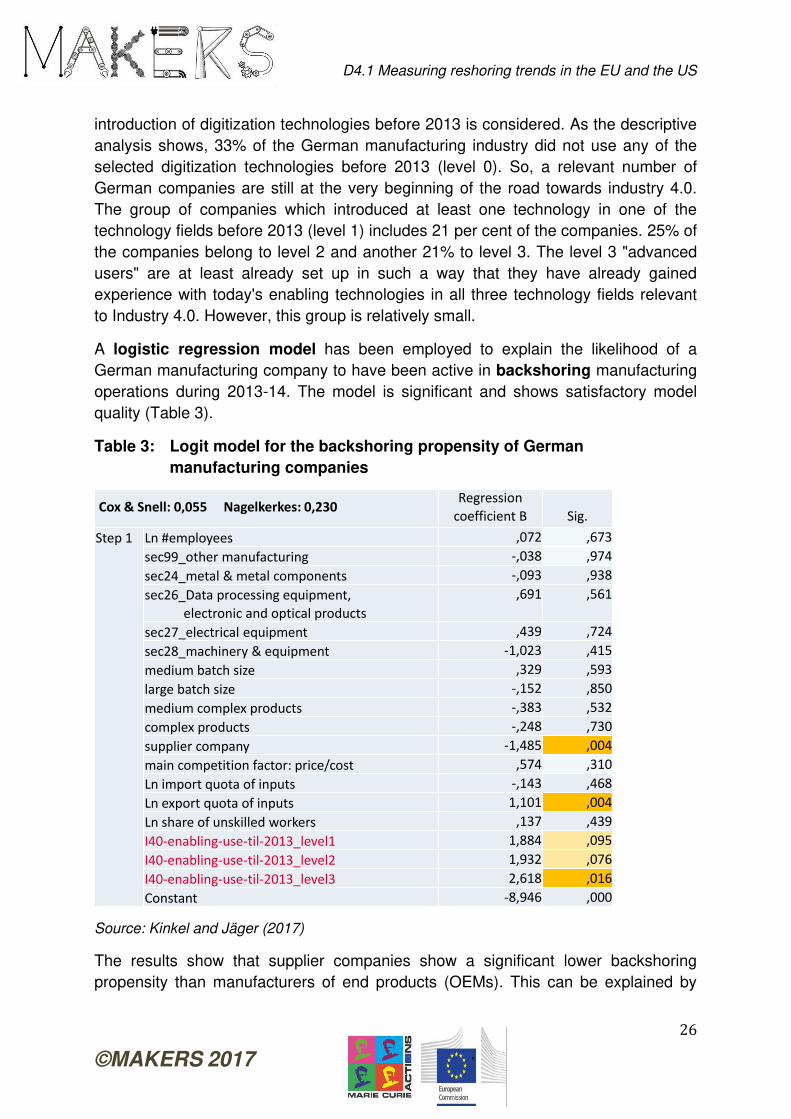
A logistic regression model has been employed to explain the likelihood of a
German manufacturing company to have been active in backshoring manufacturing
operations during 2013-14. The model is significant and shows satisfactory model
quality (Table 3).
Table 3: Logit model for the backshoring propensity of German
manufacturing companies
Source: Kinkel and Jäger (2017)
The results show that supplier companies show a significant lower backshoring
propensity than manufacturers of end products (OEMs). This can be explained by
Cox & Snell: 0,055 Nagelkerkes: 0,230Regression
coefficient B Sig.
Step 1 Ln #employees ,072 ,673
sec99_other manufacturing -,038 ,974
sec24_metal & metal components -,093 ,938
sec26_Data processing equipment,
electronic and optical products
,691 ,561
sec27_electrical equipment ,439 ,724
sec28_machinery & equipment -1,023 ,415
medium batch size ,329 ,593
large batch size -,152 ,850
medium complex products -,383 ,532
complex products -,248 ,730
supplier company -1,485 ,004
main competition factor: price/cost ,574 ,310
Ln import quota of inputs -,143 ,468
Ln export quota of inputs 1,101 ,004
Ln share of unskilled workers ,137 ,439
I40-enabling-use-til-2013_level1 1,884 ,095
I40-enabling-use-til-2013_level2 1,932 ,076
I40-enabling-use-til-2013_level3 2,618 ,016
Constant -8,946 ,000
D4.1 Measuring reshoring trends in the EU and the US
27
©MAKERS 2017
close ties with customer companies at the foreign location, which often have to be
supplied flexibly from short distance, so that proximity to the customer is
advantageous. In addition, the backshoring propensity increases with the export rate
of the companies. For German companies that rely on an export model, the quality
and flexibility of their production are decisive factors, which are also the most
important motives for backshoring activities. In addition, the label "Made in Germany"
is often helpful for these companies in order to successfully sell their premium
products abroad.
The results also display a significant positive correlation between the use of
digitization technologies in manufacturing and the backshoring propensity of
German manufacturing companies. "Advanced users" (level 3), which introduced at
least one technology from each of the three technology fields before 2013, have
significantly more often shifted foreign production activities back to the German
location as "non-users" (level 0) of digitization technologies. According to the
estimation model, “advanced users” of digitization technologies display on average a
10-times higher backshoring propensity (approx. 5%) than "non-users" of
digitalization digitization (approx. 0.5%). Also "beginners" (level 1) and "active users"
(level 2) are showing a higher backshoring propensity than "non-users" (level 0),
albeit at a lower 10% level of significance.
Two arguments can be used to explain this correlation: First, the use of digitization
technologies can lead to increased automation and productivity at the German
production site, so that the labor cost ratio becomes lower, labour arbitrage in low-
wage countries less appealing and economies of scale at the remaining factory sites
in developed countries more important. Second, the use of digitization technologies
can be used to increase the flexibility and ability for customized production in
small batches with very low marginal cost, which allows the efficient and timely
serving of individual customer requirements and offers incentives for companies to
bring back or hold the production close to their European customers ( local value
chains). According to both arguments, the intensive use of digitalization
technologies can significantly contribute to more attractive production
conditions with increased added value at the German location.
5. MEASURING RESHORING IN THE US
The debate on reshoring in the US was largely stimulated by the 2011 report “Made in America Again” of the Boston Consulting Group (BCG, 2011). This report and
some related follow-up work (BCG, 2012) estimated that US manufacturing could
create 2.5 to 5 million manufacturing and related services jobs by 2020.
D4.1 Measuring reshoring trends in the EU and the US
28
©MAKERS 2017
Largely due to the deteriorating cost competitiveness of China, it is argued that
several US industries might be close to a “tipping point” (BCG, 2012) after which
more and more companies will backshore manufacturing activities to the US. The
reports provide very detailed calculations of total landed costs and results of a survey
of around 200 US companies. They display that in 2013 more than half (54%) of the
surveyed executives were planning or considering reshoring activities, compared to
37% in 2012. Also harder evidence showed the rising relevance of reshoring, as
more than 20% of the surveyed executives in 2013 were actively engaged in
backshoring or about to backshore manufacturing in the near future, compared to
less than half of it in 2012. Based on this it is predicted that such reshoring of
activities from low cost countries will contribute to the future revival of US
manufacturing.
This arrival of a “manufacturing renaissance” in the US was questioned by other studies (e.g. Nager and Atkinson, 2015; Goldman Sachs, 2013; Morgan Stanley,
2013). A.T. Kearney (2014) has also taken a more sceptical look on reshoring to the
US. Based on an analysis of 700+ reshoring cases that have been announced in the
years 2010-14, it is argued that the growth in reshoring activities seems to have
slowed down. As at the same time many US companies are still offshoring activities
abroad, the impact of reshoring on aggregate indicators like production and jobs may
be doubted.
The collected reshoring cases are covering several sectors (A.T. Kearney, 2014).
They include sectors where reshoring was rather expected, as e.g. in appliances and
electrical equipment (15%), transportation equipment (15%) or computers and
electronics (10%), but also sectors that many thought would never return to the US,
such as apparel and textiles (12%).
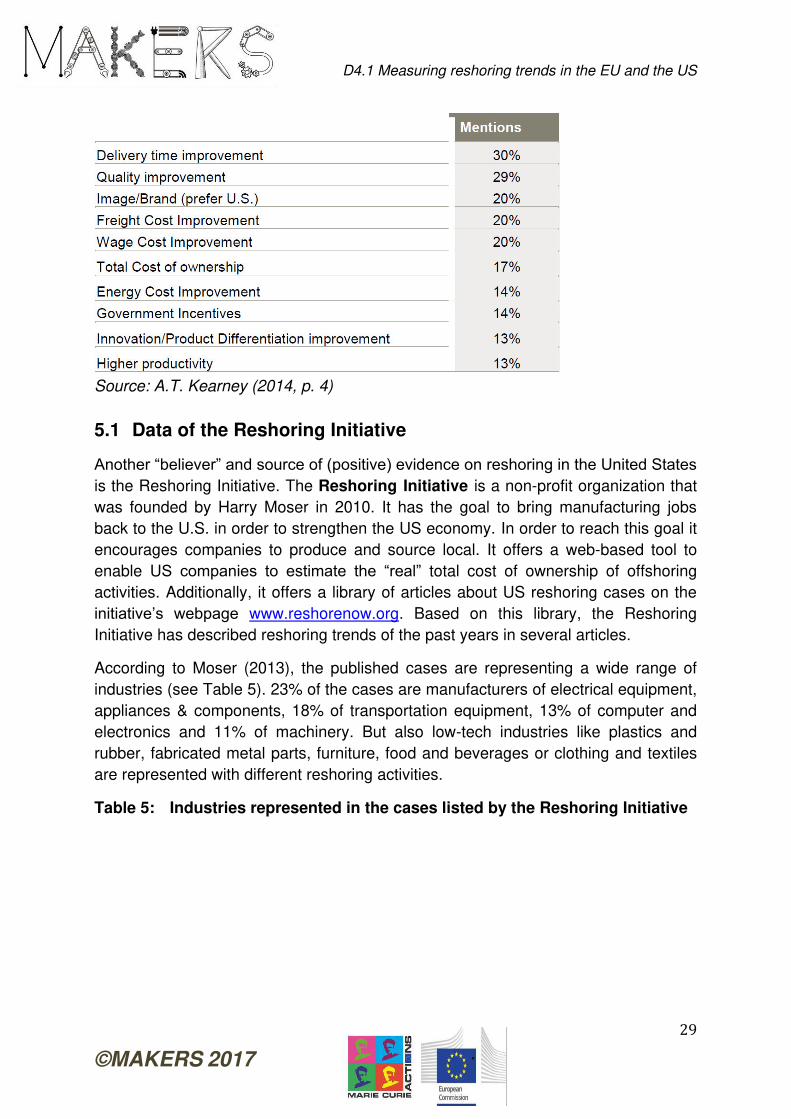
The most frequent reasons for reshoring of US companies (see Table 4) are delivery
time (30%), quality issues (30%) and several cost categories as freight costs, wages
or energy costs. In total, cost-related reshoring motivations sum up to around 70% of
the mentions. Innovation-related reasons are to a lesser extent featured in the top 10
reasons. Interestingly, “Made in USA” has become increasingly important over the years, moving further up in the ranking. However, it still needs to be seen if US
customers are really willing to pay the extra cost that most products with the “Made in USA” label are associated with (A.T. Kearney, 2014).
Table 4: Reasons for reshoring of US companies from A.T. Kearney’s Reshoring Database
D4.1 Measuring reshoring trends in the EU and the US
29
©MAKERS 2017
Source: A.T. Kearney (2014, p. 4)
5.1 Data of the Reshoring Initiative
Another “believer” and source of (positive) evidence on reshoring in the United States is the Reshoring Initiative. The Reshoring Initiative is a non-profit organization that
was founded by Harry Moser in 2010. It has the goal to bring manufacturing jobs
back to the U.S. in order to strengthen the US economy. In order to reach this goal it
encourages companies to produce and source local. It offers a web-based tool to
enable US companies to estimate the “real” total cost of ownership of offshoring
activities. Additionally, it offers a library of articles about US reshoring cases on the
initiative’s webpage www.reshorenow.org. Based on this library, the Reshoring
Initiative has described reshoring trends of the past years in several articles.
According to Moser (2013), the published cases are representing a wide range of
industries (see Table 5). 23% of the cases are manufacturers of electrical equipment,
appliances & components, 18% of transportation equipment, 13% of computer and
electronics and 11% of machinery. But also low-tech industries like plastics and
rubber, fabricated metal parts, furniture, food and beverages or clothing and textiles
are represented with different reshoring activities.
Table 5: Industries represented in the cases listed by the Reshoring Initiative
D4.1 Measuring reshoring trends in the EU and the US
30
©MAKERS 2017
Source: Own illustration according to Moser (2013), Reshoring Library as of 3/2013
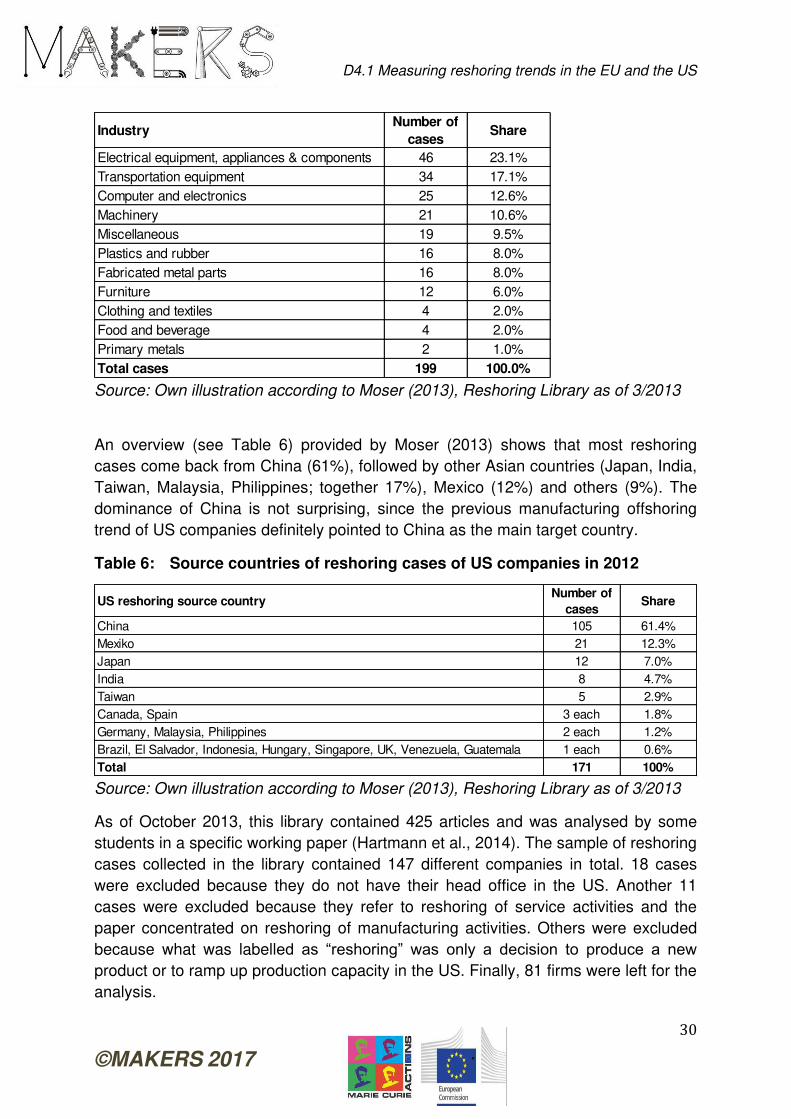
An overview (see Table 6) provided by Moser (2013) shows that most reshoring
cases come back from China (61%), followed by other Asian countries (Japan, India,
Taiwan, Malaysia, Philippines; together 17%), Mexico (12%) and others (9%). The
dominance of China is not surprising, since the previous manufacturing offshoring
trend of US companies definitely pointed to China as the main target country.
Table 6: Source countries of reshoring cases of US companies in 2012
Source: Own illustration according to Moser (2013), Reshoring Library as of 3/2013
As of October 2013, this library contained 425 articles and was analysed by some
students in a specific working paper (Hartmann et al., 2014). The sample of reshoring
cases collected in the library contained 147 different companies in total. 18 cases
were excluded because they do not have their head office in the US. Another 11
cases were excluded because they refer to reshoring of service activities and the
paper concentrated on reshoring of manufacturing activities. Others were excluded
because what was labelled as “reshoring” was only a decision to produce a new product or to ramp up production capacity in the US. Finally, 81 firms were left for the
analysis.
IndustryNumber of
casesShare
Electrical equipment, appliances & components 46 23.1%
Transportation equipment 34 17.1%
Computer and electronics 25 12.6%
Machinery 21 10.6%
Miscellaneous 19 9.5%
Plastics and rubber 16 8.0%
Fabricated metal parts 16 8.0%
Furniture 12 6.0%
Clothing and textiles 4 2.0%
Food and beverage 4 2.0%
Primary metals 2 1.0%
Total cases 199 100.0%
US reshoring source countryNumber of
casesShare
China 105 61.4%
Mexiko 21 12.3%
Japan 12 7.0%
India 8 4.7%
Taiwan 5 2.9%
Canada, Spain 3 each 1.8%
Germany, Malaysia, Philippines 2 each 1.2%
Brazil, El Salvador, Indonesia, Hungary, Singapore, UK, Venezuela, Guatemala 1 each 0.6%
Total 171 100%
D4.1 Measuring reshoring trends in the EU and the US
31
©MAKERS 2017
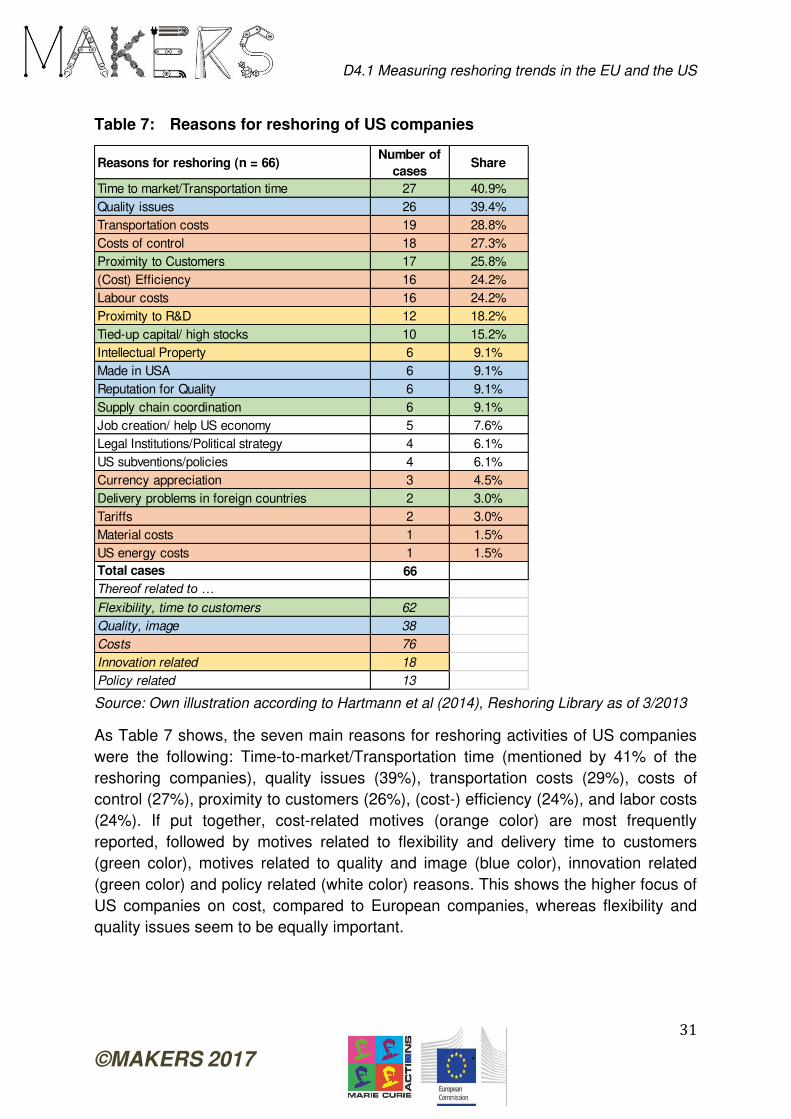
Table 7: Reasons for reshoring of US companies
Source: Own illustration according to Hartmann et al (2014), Reshoring Library as of 3/2013
As Table 7 shows, the seven main reasons for reshoring activities of US companies
were the following: Time-to-market/Transportation time (mentioned by 41% of the
reshoring companies), quality issues (39%), transportation costs (29%), costs of
control (27%), proximity to customers (26%), (cost-) efficiency (24%), and labor costs
(24%). If put together, cost-related motives (orange color) are most frequently
reported, followed by motives related to flexibility and delivery time to customers
(green color), motives related to quality and image (blue color), innovation related
(green color) and policy related (white color) reasons. This shows the higher focus of
US companies on cost, compared to European companies, whereas flexibility and
quality issues seem to be equally important.
Reasons for reshoring (n = 66)Number of
casesShare
Time to market/Transportation time 27 40.9%
Quality issues 26 39.4%
Transportation costs 19 28.8%
Costs of control 18 27.3%
Proximity to Customers 17 25.8%
(Cost) Efficiency 16 24.2%
Labour costs 16 24.2%
Proximity to R&D 12 18.2%
Tied-up capital/ high stocks 10 15.2%
Intellectual Property 6 9.1%
Made in USA 6 9.1%
Reputation for Quality 6 9.1%
Supply chain coordination 6 9.1%
Job creation/ help US economy 5 7.6%
Legal Institutions/Political strategy 4 6.1%
US subventions/policies 4 6.1%
Currency appreciation 3 4.5%
Delivery problems in foreign countries 2 3.0%
Tariffs 2 3.0%
Material costs 1 1.5%
US energy costs 1 1.5%
Total cases 66
Thereof related to …Flexibility, time to customers 62
Quality, image 38
Costs 76
Innovation related 18
Policy related 13
D4.1 Measuring reshoring trends in the EU and the US
32
©MAKERS 2017
5.2 Data of the Reshoring Institute
The most recent evidence on US reshoring activities is provided by the 2016 online
survey of global operations conducted by the Reshoring Institute and the University
of San Diego. It is intended for manufacturers in the USA that are reshoring now,
considering it, or planning to open new manufacturing facilities in the US. The online
survey consisted of 15 questions, was conducted from August to October 2016 and
had 65 participants. 80% of the participants state that their company‘s headquarter is located in the USA.
The results show that the main reason for the evaluation of reshoring options are
international logistic costs (see Figure 8). This is consistent, realizing that the share
of logistics costs in total costs is considerable. A 2008 study for Germany displays
16% for commercial and 7% for industrial enterprises [1]. Considering that about 45%
of the logistics costs in Europe 2016 were transportation expenses, this fits well to
the second most important reason that is proximity to customers and markets [2]. In
addition to transport cost reduction, other studies show companies can have
significant benefits of locations closer to customers and markets. They gain visibility,
get a clearer view of the market and are able to respond faster to customers’ needs
and requirements [3]. Referring to costs, also TCO evaluations (9%) and rising labor
costs (5%) are among the top ten reasons for evaluating reshoring. Besides costs,
flexibility (time to market and proximity to customers) and quality related reasons
seem to be in particular important. The social and political factors seem to be of
lesser importance for the companies to evaluate reshoring options. For example,
government incentives, even though they are directly relevant for cost
considerations, are only mentioned in 2.5% of the responses.
Figure 8: Reasons for the evaluation of reshoring (multiple answers possible,
n=51)
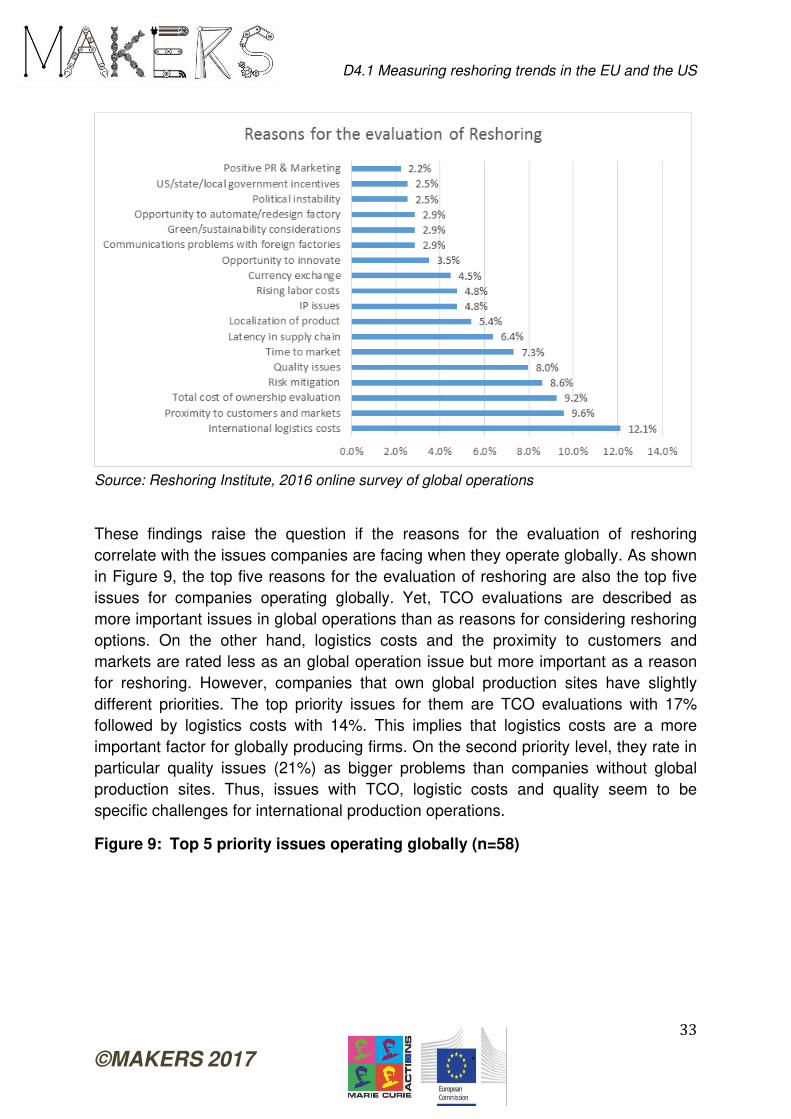
D4.1 Measuring reshoring trends in the EU and the US
33
©MAKERS 2017
Source: Reshoring Institute, 2016 online survey of global operations
These findings raise the question if the reasons for the evaluation of reshoring
correlate with the issues companies are facing when they operate globally. As shown
in Figure 9, the top five reasons for the evaluation of reshoring are also the top five
issues for companies operating globally. Yet, TCO evaluations are described as
more important issues in global operations than as reasons for considering reshoring
options. On the other hand, logistics costs and the proximity to customers and
markets are rated less as an global operation issue but more important as a reason
for reshoring. However, companies that own global production sites have slightly
different priorities. The top priority issues for them are TCO evaluations with 17%
followed by logistics costs with 14%. This implies that logistics costs are a more
important factor for globally producing firms. On the second priority level, they rate in
particular quality issues (21%) as bigger problems than companies without global
production sites. Thus, issues with TCO, logistic costs and quality seem to be
specific challenges for international production operations.
Figure 9: Top 5 priority issues operating globally (n=58)
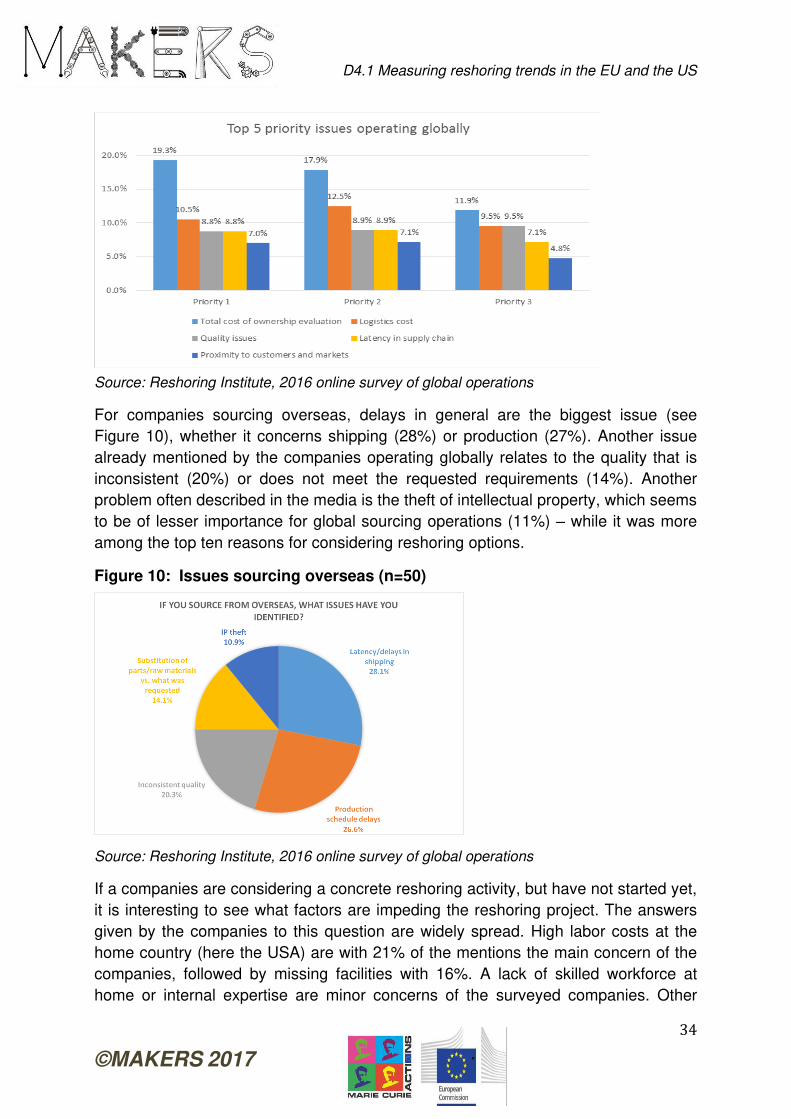
D4.1 Measuring reshoring trends in the EU and the US
34
©MAKERS 2017
Source: Reshoring Institute, 2016 online survey of global operations
For companies sourcing overseas, delays in general are the biggest issue (see
Figure 10), whether it concerns shipping (28%) or production (27%). Another issue
already mentioned by the companies operating globally relates to the quality that is
inconsistent (20%) or does not meet the requested requirements (14%). Another
problem often described in the media is the theft of intellectual property, which seems
to be of lesser importance for global sourcing operations (11%) – while it was more
among the top ten reasons for considering reshoring options.
Figure 10: Issues sourcing overseas (n=50)
Source: Reshoring Institute, 2016 online survey of global operations
If a companies are considering a concrete reshoring activity, but have not started yet,
it is interesting to see what factors are impeding the reshoring project. The answers
given by the companies to this question are widely spread. High labor costs at the
home country (here the USA) are with 21% of the mentions the main concern of the
companies, followed by missing facilities with 16%. A lack of skilled workforce at
home or internal expertise are minor concerns of the surveyed companies. Other
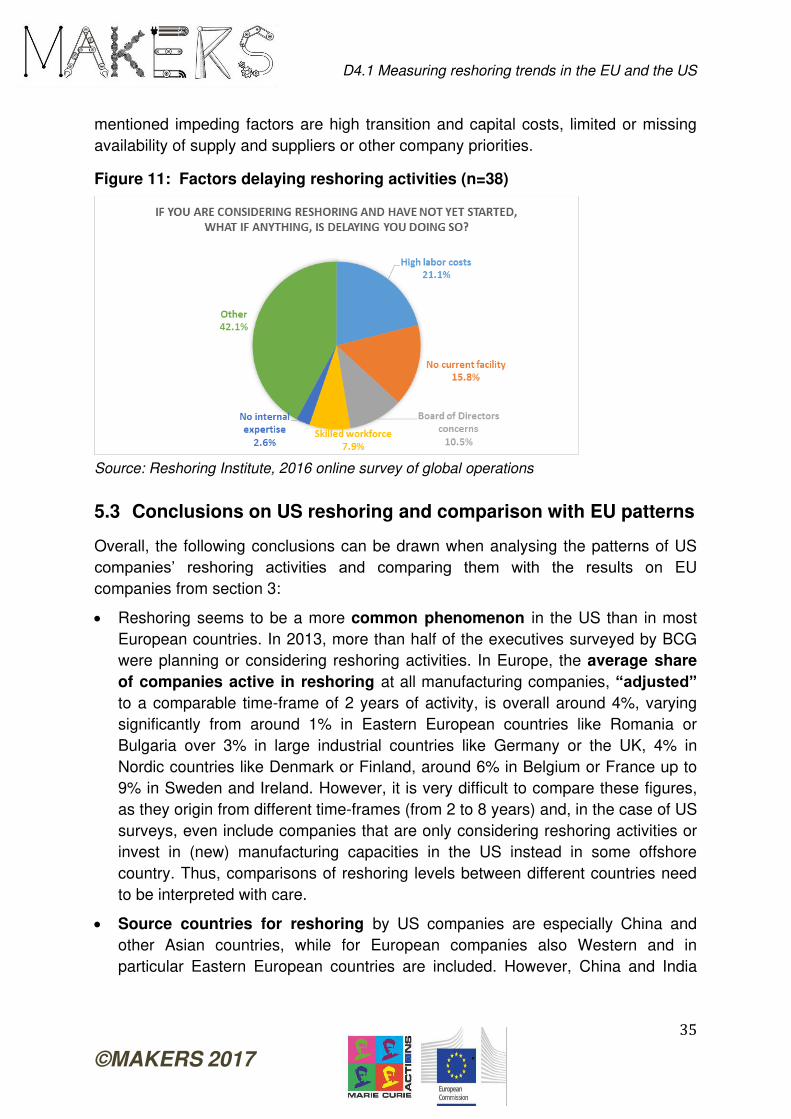
D4.1 Measuring reshoring trends in the EU and the US
35
©MAKERS 2017
mentioned impeding factors are high transition and capital costs, limited or missing
availability of supply and suppliers or other company priorities.
Figure 11: Factors delaying reshoring activities (n=38)
Source: Reshoring Institute, 2016 online survey of global operations
5.3 Conclusions on US reshoring and comparison with EU patterns
Overall, the following conclusions can be drawn when analysing the patterns of US
companies’ reshoring activities and comparing them with the results on EU
companies from section 3:
Reshoring seems to be a more common phenomenon in the US than in most
European countries. In 2013, more than half of the executives surveyed by BCG
were planning or considering reshoring activities. In Europe, the average share
of companies active in reshoring at all manufacturing companies, “adjusted” to a comparable time-frame of 2 years of activity, is overall around 4%, varying
significantly from around 1% in Eastern European countries like Romania or
Bulgaria over 3% in large industrial countries like Germany or the UK, 4% in
Nordic countries like Denmark or Finland, around 6% in Belgium or France up to
9% in Sweden and Ireland. However, it is very difficult to compare these figures,
as they origin from different time-frames (from 2 to 8 years) and, in the case of US
surveys, even include companies that are only considering reshoring activities or
invest in (new) manufacturing capacities in the US instead in some offshore
country. Thus, comparisons of reshoring levels between different countries need
to be interpreted with care.
Source countries for reshoring by US companies are especially China and
other Asian countries, while for European companies also Western and in
particular Eastern European countries are included. However, China and India
D4.1 Measuring reshoring trends in the EU and the US
36
©MAKERS 2017
have also become more important as source countries for European companies’ backshoring activities over time.
Different costs factors, like total cost of ownership (TCO), transportation costs,
rising labor costs, or costs of control, represent the most important motivations
for reshoring of US companies. Overall, the narrowing cost levels between
emerging and developed countries seems to be more important for US
companies than for European companies. Contrariwise, quality issues and losses
of flexibility and delivery time seem to be relatively more important for European
companies, albeit they are also among the most important reasons for US
companies’ reshoring activities. Also, the exploitation of the “made in” reputation effect is a significant driver for reshoring activities that seems to be more
important for European than for US manufacturers.
In addition, Fratocchi et al. (2015) draw some conclusions by using the Uni-CLUB
MoRe dataset to analyse the differences in reshoring between Europe and US
companies:
Backshoring seems to be a more common phenomenon than nearshoring,
particularly in the US, with 10 times more backshoring cases than nearshoring
cases in the US, and seven times more in Europe.
Reshoring in Europe goes back to the 1990s and even the 1980s, whereas it is
much more recent in the US.
Backshoring occurs across a broad range of manufacturing industries from low-
tech (clothing and footwear in Europe and furniture in the United States) to high-
tech (e.g. electronics, electrical appliances, automotive), whereas nearshoring
seems to be more concentrated, especially in the European textiles and clothing
industry.
6. MEASURING RESHORING WITH TRADE DATA AND INPUT-OUTPUT-TABLES
6.1 Trade data
As reshoring is not yet captured in official statistics, economic data can only be used
indirectly to analyse the extent of reshoring on a wider economy level (OECD, 2015).
One possible indicator is the “share of imports at domestic demand”. Increasing
backshoring should be reflected in a larger share of domestic production and a lower
share of imports at domestic demand. Data shows for example (OECD, 2015, p. 14-
15):
In most countries, the growth in the share of imports at domestic demand has
slowed down in recent years, but not necessarily reversed towards a decrease.
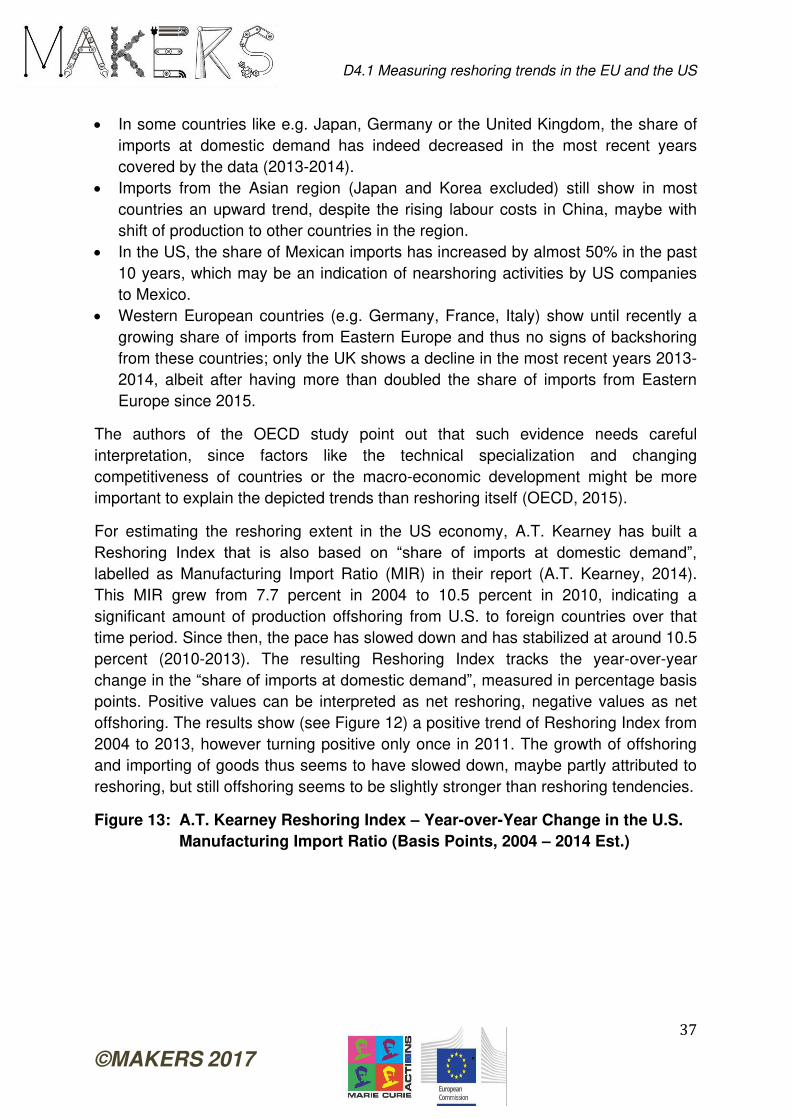
D4.1 Measuring reshoring trends in the EU and the US
37
©MAKERS 2017
In some countries like e.g. Japan, Germany or the United Kingdom, the share of
imports at domestic demand has indeed decreased in the most recent years
covered by the data (2013-2014).
Imports from the Asian region (Japan and Korea excluded) still show in most
countries an upward trend, despite the rising labour costs in China, maybe with
shift of production to other countries in the region.
In the US, the share of Mexican imports has increased by almost 50% in the past
10 years, which may be an indication of nearshoring activities by US companies
to Mexico.
Western European countries (e.g. Germany, France, Italy) show until recently a
growing share of imports from Eastern Europe and thus no signs of backshoring
from these countries; only the UK shows a decline in the most recent years 2013-
2014, albeit after having more than doubled the share of imports from Eastern
Europe since 2015.
The authors of the OECD study point out that such evidence needs careful
interpretation, since factors like the technical specialization and changing
competitiveness of countries or the macro-economic development might be more
important to explain the depicted trends than reshoring itself (OECD, 2015).
For estimating the reshoring extent in the US economy, A.T. Kearney has built a
Reshoring Index that is also based on “share of imports at domestic demand”, labelled as Manufacturing Import Ratio (MIR) in their report (A.T. Kearney, 2014).
This MIR grew from 7.7 percent in 2004 to 10.5 percent in 2010, indicating a
significant amount of production offshoring from U.S. to foreign countries over that
time period. Since then, the pace has slowed down and has stabilized at around 10.5
percent (2010-2013). The resulting Reshoring Index tracks the year-over-year
change in the “share of imports at domestic demand”, measured in percentage basis
points. Positive values can be interpreted as net reshoring, negative values as net
offshoring. The results show (see Figure 12) a positive trend of Reshoring Index from
2004 to 2013, however turning positive only once in 2011. The growth of offshoring
and importing of goods thus seems to have slowed down, maybe partly attributed to
reshoring, but still offshoring seems to be slightly stronger than reshoring tendencies.
Figure 13: A.T. Kearney Reshoring Index – Year-over-Year Change in the U.S.
Manufacturing Import Ratio (Basis Points, 2004 – 2014 Est.)
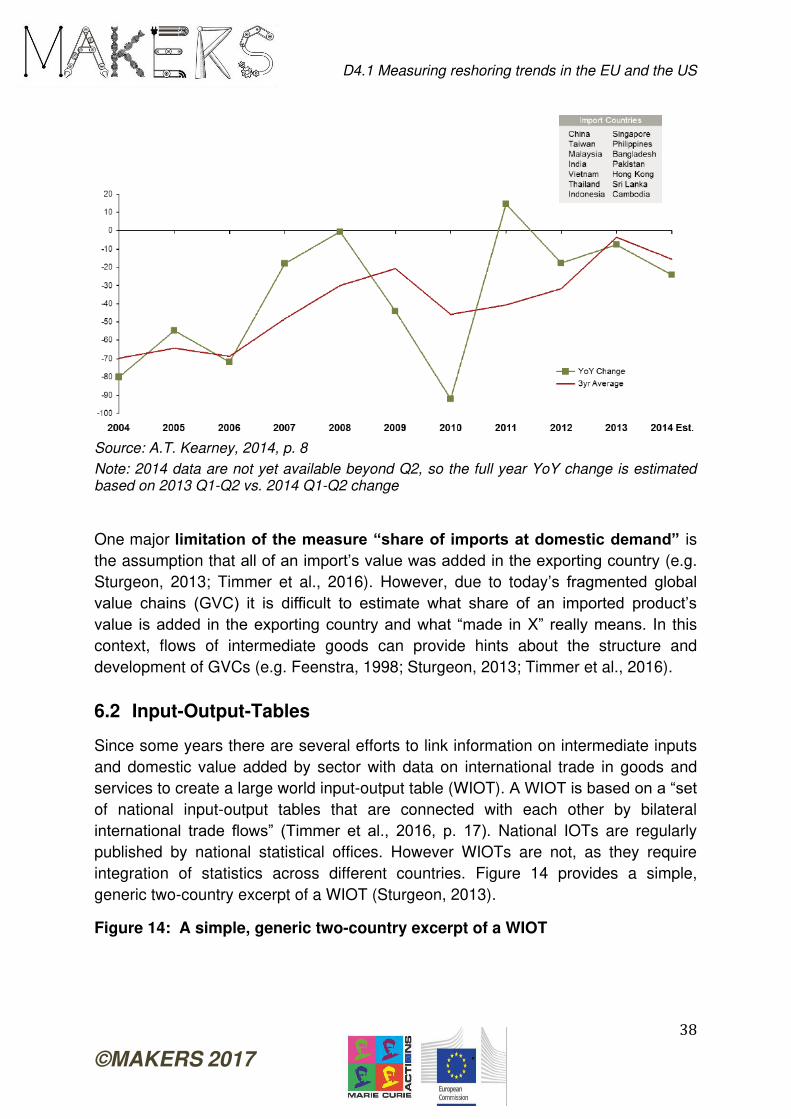
D4.1 Measuring reshoring trends in the EU and the US
38
©MAKERS 2017
Source: A.T. Kearney, 2014, p. 8
Note: 2014 data are not yet available beyond Q2, so the full year YoY change is estimated based on 2013 Q1-Q2 vs. 2014 Q1-Q2 change
One major limitation of the measure “share of imports at domestic demand” is
the assumption that all of an import’s value was added in the exporting country (e.g.
Sturgeon, 2013; Timmer et al., 2016). However, due to today’s fragmented global value chains (GVC) it is difficult to estimate what share of an imported product’s value is added in the exporting country and what “made in X” really means. In this
context, flows of intermediate goods can provide hints about the structure and
development of GVCs (e.g. Feenstra, 1998; Sturgeon, 2013; Timmer et al., 2016).
6.2 Input-Output-Tables
Since some years there are several efforts to link information on intermediate inputs
and domestic value added by sector with data on international trade in goods and
services to create a large world input-output table (WIOT). A WIOT is based on a “set of national input-output tables that are connected with each other by bilateral
international trade flows” (Timmer et al., 2016, p. 17). National IOTs are regularly
published by national statistical offices. However WIOTs are not, as they require
integration of statistics across different countries. Figure 14 provides a simple,
generic two-country excerpt of a WIOT (Sturgeon, 2013).
Figure 14: A simple, generic two-country excerpt of a WIOT
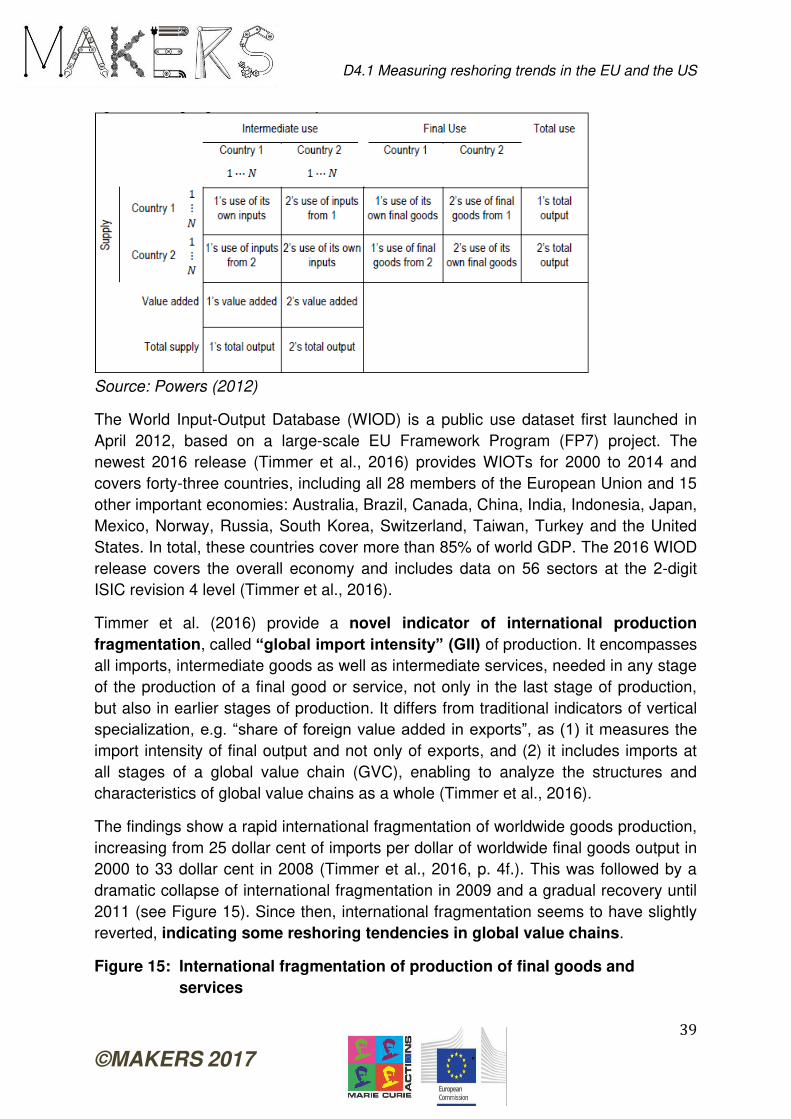
D4.1 Measuring reshoring trends in the EU and the US
39
©MAKERS 2017
Source: Powers (2012)
The World Input-Output Database (WIOD) is a public use dataset first launched in
April 2012, based on a large-scale EU Framework Program (FP7) project. The
newest 2016 release (Timmer et al., 2016) provides WIOTs for 2000 to 2014 and
covers forty-three countries, including all 28 members of the European Union and 15
other important economies: Australia, Brazil, Canada, China, India, Indonesia, Japan,
Mexico, Norway, Russia, South Korea, Switzerland, Taiwan, Turkey and the United
States. In total, these countries cover more than 85% of world GDP. The 2016 WIOD
release covers the overall economy and includes data on 56 sectors at the 2-digit
ISIC revision 4 level (Timmer et al., 2016).
Timmer et al. (2016) provide a novel indicator of international production
fragmentation, called “global import intensity” (GII) of production. It encompasses
all imports, intermediate goods as well as intermediate services, needed in any stage
of the production of a final good or service, not only in the last stage of production,
but also in earlier stages of production. It differs from traditional indicators of vertical
specialization, e.g. “share of foreign value added in exports”, as (1) it measures the
import intensity of final output and not only of exports, and (2) it includes imports at
all stages of a global value chain (GVC), enabling to analyze the structures and
characteristics of global value chains as a whole (Timmer et al., 2016).
The findings show a rapid international fragmentation of worldwide goods production,
increasing from 25 dollar cent of imports per dollar of worldwide final goods output in
2000 to 33 dollar cent in 2008 (Timmer et al., 2016, p. 4f.). This was followed by a
dramatic collapse of international fragmentation in 2009 and a gradual recovery until
2011 (see Figure 15). Since then, international fragmentation seems to have slightly
reverted, indicating some reshoring tendencies in global value chains.
Figure 15: International fragmentation of production of final goods and
services
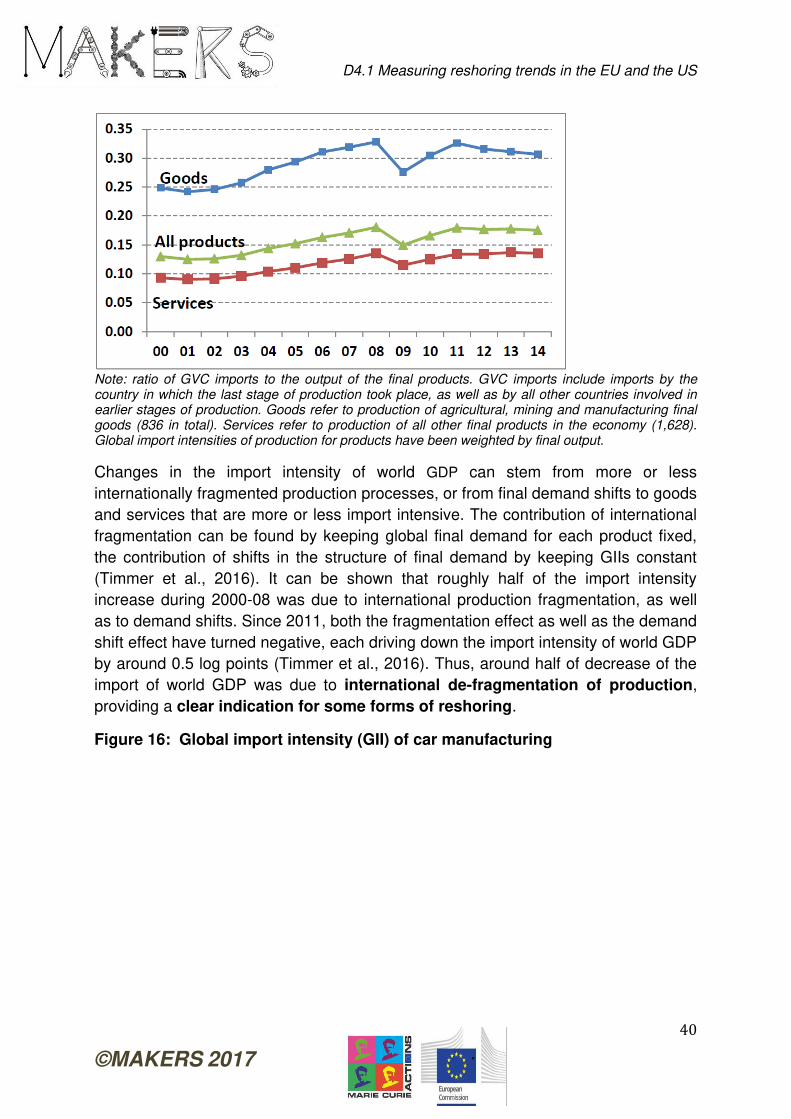
D4.1 Measuring reshoring trends in the EU and the US
40
©MAKERS 2017
Note: ratio of GVC imports to the output of the final products. GVC imports include imports by the country in which the last stage of production took place, as well as by all other countries involved in earlier stages of production. Goods refer to production of agricultural, mining and manufacturing final goods (836 in total). Services refer to production of all other final products in the economy (1,628). Global import intensities of production for products have been weighted by final output.
Changes in the import intensity of world GDP can stem from more or less
internationally fragmented production processes, or from final demand shifts to goods
and services that are more or less import intensive. The contribution of international
fragmentation can be found by keeping global final demand for each product fixed,
the contribution of shifts in the structure of final demand by keeping GIIs constant
(Timmer et al., 2016). It can be shown that roughly half of the import intensity
increase during 2000-08 was due to international production fragmentation, as well
as to demand shifts. Since 2011, both the fragmentation effect as well as the demand
shift effect have turned negative, each driving down the import intensity of world GDP
by around 0.5 log points (Timmer et al., 2016). Thus, around half of decrease of the
import of world GDP was due to international de-fragmentation of production,
providing a clear indication for some forms of reshoring.
Figure 16: Global import intensity (GII) of car manufacturing
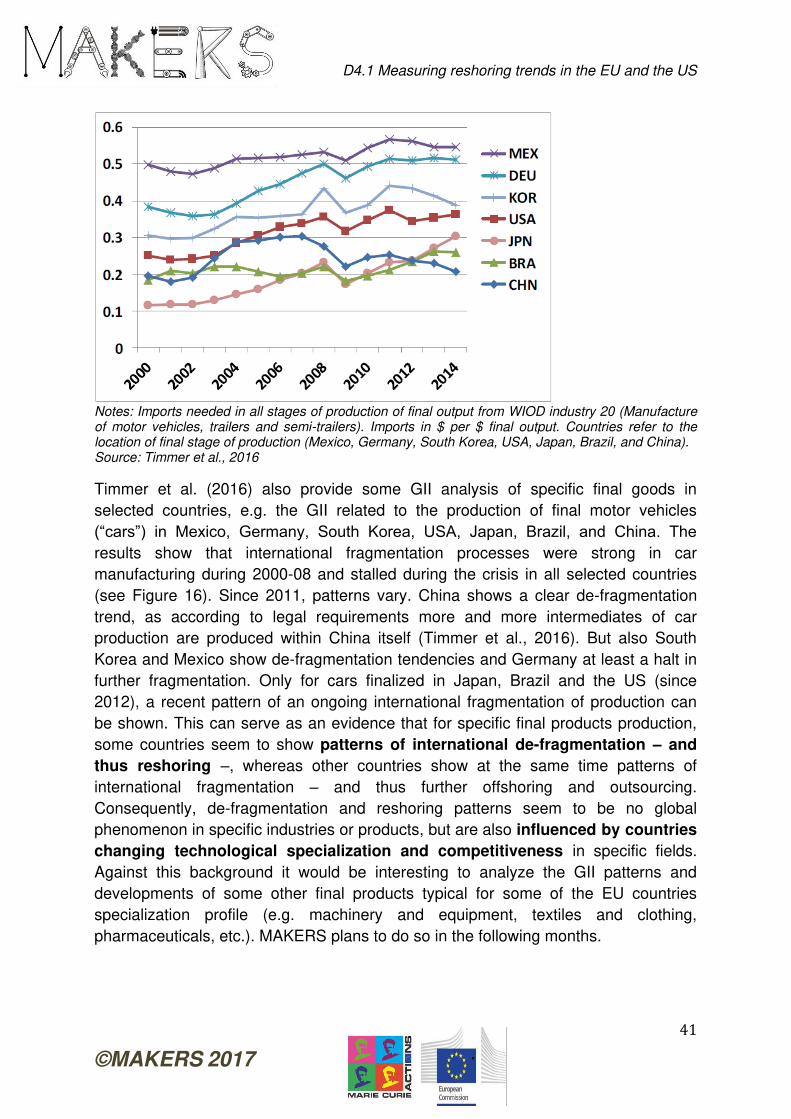
D4.1 Measuring reshoring trends in the EU and the US
41
©MAKERS 2017
Notes: Imports needed in all stages of production of final output from WIOD industry 20 (Manufacture of motor vehicles, trailers and semi-trailers). Imports in $ per $ final output. Countries refer to the location of final stage of production (Mexico, Germany, South Korea, USA, Japan, Brazil, and China). Source: Timmer et al., 2016
Timmer et al. (2016) also provide some GII analysis of specific final goods in
selected countries, e.g. the GII related to the production of final motor vehicles
(“cars”) in Mexico, Germany, South Korea, USA, Japan, Brazil, and China. The results show that international fragmentation processes were strong in car
manufacturing during 2000-08 and stalled during the crisis in all selected countries
(see Figure 16). Since 2011, patterns vary. China shows a clear de-fragmentation
trend, as according to legal requirements more and more intermediates of car
production are produced within China itself (Timmer et al., 2016). But also South
Korea and Mexico show de-fragmentation tendencies and Germany at least a halt in
further fragmentation. Only for cars finalized in Japan, Brazil and the US (since
2012), a recent pattern of an ongoing international fragmentation of production can
be shown. This can serve as an evidence that for specific final products production,
some countries seem to show patterns of international de-fragmentation – and
thus reshoring –, whereas other countries show at the same time patterns of
international fragmentation – and thus further offshoring and outsourcing.
Consequently, de-fragmentation and reshoring patterns seem to be no global
phenomenon in specific industries or products, but are also influenced by countries
changing technological specialization and competitiveness in specific fields.
Against this background it would be interesting to analyze the GII patterns and
developments of some other final products typical for some of the EU countries
specialization profile (e.g. machinery and equipment, textiles and clothing,
pharmaceuticals, etc.). MAKERS plans to do so in the following months.
D4.1 Measuring reshoring trends in the EU and the US
42
©MAKERS 2017
Despite the progress world input-output tables (WIOTs) represent for the possibilities
of statistical analysis of offshoring and reshoring, outsourcing and insourcing
patterns, they have some severe limitations (Sturgeon et al., 2013):
Lack of detail, timeliness, and accuracy that arises from estimation procedures
and cross-border harmonization. Usually, it takes up to 4 years before a new
edition of input-output tables (national or global) is provided.
As companies engaged in international trade source significantly more
intermediate inputs from abroad than other companies, it would be helpful to be
able to distinguish between exporting and non-exporting and importing and non-
importing companies in each industry covered, e.g. on the NACE 2 digit level.
D4.1 Measuring reshoring trends in the EU and the US
43
©MAKERS 2017
7. MAKERS CONCLUSIONS AND AVENUES FOR FURTHER
RESEARCH
This report analyses and compares the most important surveys on manufacturing
companies’ reshoring activities in the EU (Eurostat survey on international sourcing, European Manufacturing Survey (EMS), Uni-CLUB MoRe reshoring dataset,
ROaMING research project) and in the US (the Reshoring Initiative, the Reshoring
Institute) and draws conclusions on surveys as an adequate instrument to measure
the reshoring phenomenon. In addition, the possibilities and limitations of trade data
and input-output tables (WIOTs) for the statistical analysis and measurement of
offshoring and reshoring, outsourcing and insourcing patterns are analysed and
critically assessed.
From the critical analysis of the survey data of European and US companies’ reshoring activities, the following conclusions on detected patterns and shortcoming
of the measurement can be drawn:
Reshoring seems to be a more common phenomenon in the US than in most
European countries. In 2013, more than half of the executives surveyed by BCG
were planning or considering reshoring activities. In Europe, the average share
of companies active in reshoring at all manufacturing companies, “adjusted” to a comparable time-frame of 2 years of activity, is overall around 4%. This share
varies significantly from around 1% in Eastern European countries like Romania
or Bulgaria over 3% in large industrial countries like Germany or the UK, 4% in
Nordic countries like Denmark or Finland, around 6% in Belgium or France up to
9% in Sweden and Ireland.
However, it is very difficult to compare these figures, as they origin from
different time-frames (from 2 to 8 years) and, in the case of US surveys, even
include companies that are only considering reshoring activities or invest in (new)
manufacturing capacities in the US instead in some offshore country.
Also the “adjusted” shares of companies active in reshoring need to be cautiously
compared between different European countries and interpreted with care. One
reason is that the “adjustment” to a time-frame of 2 years by a simple
division can be problematic, as companies may have reshored more than once
over a longer period of time and therefore the real ratio tends to be
underestimated by the simple division. Also, company managers may be more
reminiscent of recent events than those completed some time ago.
Another issue is different points in time when the different surveys were
conducted, as reshoring decisions are heavily influenced by factors of the
external environment and these are changing quite significantly over time (e.g.
wages, economic and political conditions, etc.). Thus, comparisons of reshoring
levels between different countries need to be interpreted with great care.
D4.1 Measuring reshoring trends in the EU and the US
44
©MAKERS 2017
Source countries for reshoring by US companies are especially China and
other Asian countries, while for European companies also Western and in
particular Eastern European countries are included. However, China has
emerged as the most important single source country of European manufacturing
companies’ backshoring activities, and also India has become more important
over time.
Different costs factors, like total cost of ownership (TCO), transportation costs,
rising labor costs, or costs of control, represent the most important motivations
for reshoring of US companies. Overall, the narrowing cost levels between
emerging and developed countries seems to be more important for US
companies than for European companies. Contrariwise, quality issues and
losses of flexibility and delivery time seem to be relatively more important
for European companies, albeit they are also among the most important
reasons for US companies’ reshoring activities. Also, the exploitation of the “made in” reputation effect is a significant driver for reshoring activities that seems to be more important for European than for US manufacturers.
Backshoring seems to be a more common phenomenon than nearshoring,
particularly in the US, with 10 times more backshoring cases than nearshoring
cases in the US, and seven times more in Europe. However, some surveys to
not clearly distinguish between different modes of reshoring or cover
different modes than other surveys4, making cross-country comparisons at least
difficult or even impossible.
Overall, the survey results suggest that it seems not very likely that reshoring
initiatives of manufacturing companies will be a major lever to restore industrial work
in many high-wage countries. It is not easy, in some cases impossible, to restore
product and process competences outsourced some years ago. In many cases it
might be easier to build up capabilities for the next generation products or production
technology.
Here, the new digitization technologies for a smart, vertically and horizontally
integrated production, also known as Industry 4.0, carry promising potentials: Results
of a recent study in the German manufacturing industry (Kinkel and Jäger, 2017)
display a significant positive correlation between the use of digitization
technologies in manufacturing (or Industry 4.0 enabling technologies) and the
backshoring propensity of German manufacturing companies. Two arguments
4 E.g. backshoring and home-shoring in the Eurostat survey on international sourcing, backshoring and
backsourcing in the European Manufacturing Survey (EMS), backshoring and nearshoring in the Uni-CLUB
MoRe reshoring dataset, or direct and indirect reshoring in the UK and the US, with the latter defined as
keep or increase manufacturing activities in the UK/US instead of moving them abroad after a serious
consideration of foreign locations (Li et al., 2017, p. 5).
D4.1 Measuring reshoring trends in the EU and the US
45
©MAKERS 2017
can be used to explain this correlation: First, the use of digitization technologies can
lead to increased automation and productivity at the German production site, so
that the labor cost ratio becomes lower, labour arbitrage in low-wage countries less
appealing and economies of scale at the remaining factory sites in developed
countries more important. Second, the use of digitization technologies can be used to
increase the flexibility and ability for customized production in small batches
with very low marginal cost, which allows the efficient and timely serving of individual
customer requirements and offers incentives for companies to bring back or hold the
production close to their European customers ( local value chains). According to
both arguments, the intensive use of digitalization technologies in
manufacturing (Industry 4.0 enabling technologies) can significantly contribute
to more attractive production conditions with increased added value at the
German location.
Against the background of some severe gaps and shortcomings of surveys on
reshoring activities, we see the following approaches to improve the available
survey instruments:
In the reshoring surveys available, respondents were asked about sourcing
events that occurred during a specific time period, e.g. the past 2 years or 5
years. This approach has different shortcomings, as already mentioned above.
Survey results covering different time-frames are difficult to compare, even when
“adjusted” to a common time-frame, as companies may have reshored more than
once over a longer period of time and company managers may be more
reminiscent of recent events than those of some years ago. The surveys may
have also been conducted at different points in time, making comparisons difficult
because the external environment may have significantly changed. Therefore,
quantitative European panel data on companies’ reshoring activities, conducted yearly or every two years, could be an appropriate approach (e.g. Sturgeon,
2013) to support reliable analysis and (cross-country) comparison of specific
reshoring patterns and trends.
In the reshoring surveys available, respondents only provided responses whether
their company had reshored during a specific time period (yes or no), without
judging the magnitude of the reshored activities. Thus, future reshoring surveys in
Europe should also collect quantitative information on the value of the
reshored business (e.g. Sturgeon, 2013).
The reshoring surveys available do not always clearly distinguish between
different modes of reshoring (e.g. backshoring, home-shoring, nearshoring,
backsourcing, direct and indirect reshoring) or cover different modes, making
cross-country comparisons difficult. Thus, it is suggested to distinguish in future
surveys between four forms of reshoring, as proposed in the MAKERS
deliverable 4.2 (Pegoraro et al., 2017):
D4.1 Measuring reshoring trends in the EU and the US
46
©MAKERS 2017
o Backshoring, that is the move of an activity previously offshored to a foreign
location back to the home economy,
o Nearshoring, that is the move of an activity previously offshored to a foreign
location to an the economy near the home economy,
o Home-shoring, that is the move of an activity from a foreign location – but
NOT previously offshored to this foreign location by the company itself –
back to the home economy,
o Hop-shoring, that is the move of an activity previously offshored to a foreign
location to another foreign economy,
The surveying of all of these four forms should include internal, captive modes as
well as external, outsourced modes, covering all four reshoring options (In-In, In-
Out, Out-In, Out-Out, see also Figure 1) proposed by Gray et al (2013).
Some studies use trade date to measure offshoring and reshoring tendencies. One
popular indicator is the “share of imports at domestic demand”, which should be
decreasing if backshoring is increasing. Existing results show for example that the
share of imports at domestic demand has indeed decreased in some countries (e.g.
Japan, Germany, UK) in recent years. The Reshoring Index of A.T. Kearney is also
based on the “share of imports at domestic demand”, indicating that the growth of
offshoring and importing goods built by the US economy has indeed slowed down,
but offshoring activities still tend to be slightly stronger than reshoring tendencies.
One major limitation of this indicator is the assumption that all of an import’s value was added in the exporting country, however in today’s fragmented global value chains (GVC) this assumption might be rather naïve (e.g. Sturgeon, 2013; Timmer et
al., 2016). Therefore, since some years world input-output tables (WIOT) are created
and used for measuring offshoring and reshoring intensities of countries and
industries.
Based on a novel indicator, called “global import intensity” (GII), that encompasses all imports and intermediate goods needed in any stage for the
production of a final good, some interesting results on international production
fragmentation are provided (Timmer et al., 2016). It has been shown that after a
period of rapid international fragmentation of worldwide goods production during
2000-08, there was a dramatic collapse in 2009 and a gradual recovery until 2011,
and since then a slight decline in international fragmentation, indicating some
reshoring tendencies in global value chains.
A more detailed and specific look at car manufacturing displays recent (since 2011)
international de-fragmentation – and thus reshoring – tendencies for cars
finalized in South Korea and Mexico, and Germany shows at least a halt in further
D4.1 Measuring reshoring trends in the EU and the US
47
©MAKERS 2017
fragmentation, whereas in Japan, Brazil and the US an ongoing international
fragmentation of production can be shown. Consequently, de-fragmentation and
reshoring patterns seem to be no global phenomenon, but are influenced by
countries changing technological specialization and competitiveness in specific
industries. Thus, the MAKERS project plans to analyze GII patterns of some
other final products typical for selected EU countries specialization profiles (e.g.
machinery and equipment, textiles and clothing, pharmaceuticals, etc.) in the
following months.
Despite the progress world input-output tables (WIOTs) represent for the possibilities
of statistical analysis of offshoring and reshoring patterns, they still have some
severe limitations (Sturgeon et al., 2013):
Lack of detail, timeliness, and accuracy that arises from estimation procedures
and cross-border harmonization. Usually, it takes up to 4 years before a new
edition of input-output tables (national or global) is provided.
As companies engaged in international trade source significantly more
intermediate inputs from abroad than other companies, it would be helpful to be
able to distinguish between exporting and non-exporting and importing and non-
importing companies in each industry covered, e.g. on the NACE 2 digit level.
As these limitations clearly restrict the possibilities of a timely analysis of the
reshoring trends and drivers in the EU, it is suggested to accompany the creation and
analysis of suitable WIOTs by an additional, quantitative European panel survey,
conducted yearly or every two years as suggested above, to develop systematic and
up-to-date information on European companies’ reshoring activities. With such a data
base it would be possible to get answers or indications for important questions as
e.g.: How are dynamics and motives of backshoring activities evolving over different
countries over time? How do companies learn from offshoring failures and
backshoring experience, and how does it influence future location decisions? Does
supply chain complexity influence offshoring and backshoring modes and how?
Overall, the collected results so far suggest that companies are continuing to
internationalize their activities, but with greater sensitivity to critical factors than in the
past. The advantages of cost-based offshoring activities to low-wage countries seem
to diminish more and more, while market related expansion investments in emerging
markets, to get closer to the local customers and serve their needs in time, might
gain further significance. At the same time, partly because of the new potentials of
Industry 4.0 and smart digitized manufacturing technologies, companies are
increasing their focus on utilizing the strengths and potentials of their home base
in high-wage countries in Europe. Therefore, we might envisage the beginning of a
new strategic imperative of re-localized manufacturing (Brennan et al., 2015;
Kinkel, 2014) in important markets, with a strong focus on regional concentration and
D4.1 Measuring reshoring trends in the EU and the US
48
©MAKERS 2017
specialization of the necessary engineering and manufacturing competences.
Complete solution providing capabilities will be installed in all relevant markets,
bidding farewell to further slicing value chains over locations with least-cost
advantages, which has led to very complex, multi-stage global supply chains that
often comprise many different players and locations. Such global chains are also
vulnerable to damages in one of their links, endangering the reliability and
responsiveness of the whole chain, which is a crucial condition for the success of
companies in today's global economy.
D4.1 Measuring reshoring trends in the EU and the US
49
©MAKERS 2017
8. REFERENCES
A.T. Kearney. (2014): The Truth About Reshoring: Not What It’s Cracked Up to be!
Abrahamson, E., & Rosenkopf, L. (1993): Institutional and competitive bandwagons:
Using mathematical modeling as a tool to explore innovation diffusion. The
Academy of Management Review, 18: 487–517.
Alajääskö, P. (2009): Features of International Sourcing in Europe in 2001-2006.
Statistics in focus 73/2009, Eurostat.
Ancarani, A.; Di Mauro, C.; Fratocchi, L.; Orzes, G.; Sartor, M. (2015): Prior to
reshoring: A duration analysis of foreign manufacturing ventures. International
Journal of Production Economics 169 (2015), pp. 141-155.
Ancarani, A.; Barbieri, P.; Di Mauro, C.; Fratocchi, L.; Mascali, F.; Nassimbeni, G.;
Orzes, G.; Sartor, M. (2017): Manufacturing Reshoring: evidence from the
European Monitor of Reshoring. Paper presented on the MAKERS Workshop
“Reshoring and Industry 4.0”, Karlsruhe, May 3rd 2017.
Arlbjørn, J. & Mikkelsen, O. (2014): Backshoring manufacturing: notes on an
important but under-researched theme, Journal of Purchasing & Supply
Management, 20 (1): 60-62.
Bailey, D.; De Propris, L. (2014): Manufacturing reshoring and its limits: the UK
automotive case. Cambridge Journal of Regional Economic Sociology 7 (3), pp.
379-395.
Bailey, D., De Propris, L./SGH Martineau (2013): Report: Bringing Manufacturing
Back. Birmingham: SGH Martinueau.
Bals, L., Jensen, P. D. Ø., Larsen, M. M., & Pedersen, T. (2013): Exploring Layers of
Complexity in Offshoring Research and Practice. In T. Pedersen, L. Bals, P. D.
Ørberg Jensen, & Møller Larsen M. (Eds.), The Offshoring Challenge: Strategic
Design and Innovation for Tomorrow’s Organization: 1–18, London: Springer.
Barney, J. (1991): “Firm resources and sustained competitive advantage”, Journal of
Management, Vol. 17 No. 1, pp. 99–120.
Barthelemy, J. (2001): “The hidden costs of IT outsourcing”, Sloan Management
Review Vol. 42 No. 3, pp. 60–69.
BCG (2011): Made in America, Again. Why manufacturing will return to the U.S.
Available at: http://www.bcg.com/documents/file84471.pdf, accessed:
18.12.2013.
D4.1 Measuring reshoring trends in the EU and the US
50
©MAKERS 2017
BCG (2012): Made in America, Again: U.S. Manufacturing Nears the Tipping Point.,
The Boston Consulting Group, 2012.
Brennan, L., Ferdows, K., Godsell, J., Golini, R., Keegan, R., Kinkel, S., Srai, J.S., et
al. (2015): “Manufacturing in the world: Where next?”, International Journal of
Operations & Production Management, Vol. 35 No. 9, pp. 1253–1274.
Broedner, P., Kinkel, S. and Lay, G. (2009): “Productivity effects of outsourcing: New Evidence on the Strategic Importance of Vertical Integration Decisions”, International Journal of Operations & Production Management, Vol. 29 No. 2, pp.
127–150.
Buckley, P. J., & Casson, M. (1976): The future of multinational enterprise. London:
Macmillan.
Business Birmingham (2013): Jobs Boost Expected as British Manufacturers Source
More UK Components. Birmingham: Business Birmingham.
Cabral, S., Quelin, B., & Maia, W. (2013): Outsourcing failure and reintegration: the
influence of contractual and external factors. Long Range Planning, 47(6): 1-14.
Canham, S. & Hamilton, R.T. (2013): SME internationalisation: offshoring,
‘backshoring’, or staying at home in New Zealand. Strategic Outsourcing: An
International Journal, 6(3): 277-291.
Casson, M. (2013): Economic analysis of international supply chains: an
internalization perspective. Journal of Supply Chain Management, 49(2): 8-13.
Choi, T.Y. & Hong, Y. (2002): Unveiling the structure of supply networks: Case
studies in Honda, Acura, and DaimlerChrysler. Journal of Operations
Management, 20(5): 469-493.
Dachs, B., & C. Zanker, C. (2014): Backshoring of Production Activities in European
Manufacturing. European Manufacturing Survey (EMS) Bulletin No. 3, Karlsruhe.
Dachs, B.; Kinkel, S.; Jäger, A. (2017): Bringing it all back home? Backshoring of
manufacturing activities and the diffusion of Industry 4.0. Proceedings of the 24th
International Annual EurOMA Conference, Edinburgh, Scotland, July 3rd-5th 2017
Dicken, P. (2014): Global shift: Mapping the changing contours of the world
economy. London: Sage Publications.
Dunning, J.H. (1980): Towards an eclectic theory of international production: some
empirical tests. Journal of International Business Studies, 11(1): 9–31.
D4.1 Measuring reshoring trends in the EU and the US
51
©MAKERS 2017
Dunning, J.H. (1988): The eclectic paradigm of international production: a
restatement and some possible extensions. Journal of International Business
Studies 19(1): 1–31.
Ellram, L.M., Tate, W.L. & Petersen, K.J. (2013): Offshoring and reshoring: an update
on the manufacturing location decision, Journal of Supply Chain Management,
49(2): 14-22.
Feenstra, R. (1998): “Integration of trade and disintegration of production in the
global economy”, Journal of Economic Perspectives, 12(4), 31-50.
Fel, F. and Griette, E. (2016): Determinants for French firms’ reshoring decisions: A proposed typology. Proceedings of the 23rd International Annual EurOMA
Conference, Trondheim, Norway, June 19th-21st 2016
Foerstl, K., Kirchoff, J.F., & Bals, L. (2016): Reshoring and Insourcing: Drivers and
Future Research Directions, International Journal of Physical Distribution and
Logistics Management, 46(5): 492-515.
Fratocchi, L., Ancarani, A. Barbieri, P., Di Mauro, C., Nassimbeni, G., Sartor, M.,
Vignoli, M., & Zanoni, A. (2016): Motivations of manufacturing reshoring: an
interpretative framework. International Journal of Physical Distribution & Logistics
Management, 46(2): 98 – 127
Fratocchi, L., A. Ancari, P. Barbieri, C. Di Mauro, A. Troiano, M. Vgnoli and A. Zanoni
(2015): Manufacturing Back- and Near-Reshoring: A Comparison of European
and North American Evidence in J. Stentoft, G. Vastag and A. Paula (eds),
‘Research in the Decision Sciences for Innovations in Global Supply Chain
Networks: Best Papers from the 2014 Annual Conference’
Fratocchi, L., C. Di Mauro, P. Barbieri, G. Nassimbeni, & Zanoni A. (2014): When
manufacturing moves back: Concepts and questions. Journal of Purchasing and
Supply Management, 20(1): 54-59.
Fredriksson, A. & Jonsson, P. (2009): Assessing consequences of low‐cost sourcing
in China. International Journal of Physical Distribution & Logistics Management,
39(3): 227-249.
Goldman Sachs (2013): The US Manufacturing Renaissance: Fact or Fiction?, US
Economics Analyst, Issue No. 13/12.
Grant, R.M. (1991): The resource-based theory of competitive advantage:
implications for strategy formulation, California Management Review, 33: 114-
135.
D4.1 Measuring reshoring trends in the EU and the US
52
©MAKERS 2017
Gray, J.V., Skowronski, K., Esenduran, G. & Rungtusanatham, M. (2013): The
reshoring phenomenon: what supply chain academics ought to know and should
do. Journal of Supply Chain Management, 49(2): 27-33.
Handfield, R.B. (1994): US global sourcing: patterns of development. International
Journal of Operations & Production Management, 14(6): 40–51.
Handley, S.M. & Benton Jr., W.C. (2013): The influence of task- and location-specific
complexity on the control and coordination costs in global outsourcing
relationships. Journal of Operations Management, 31(3): 109-128.
Hartmann, A.K.; Penteker, L.; Prokott, F. (2014): Patterns of Reshoring to the U.S..
Paper presented at the University of Hohenheim, Faculty of Business,
Economics and Social Sciences, Lecture on “International Offshoring und Outsourcing”.
Heikkilä, J. (ed., 2017): Relocation of Nordic Manufacturing. Tampere University of
Technology.
Holweg, M., Reichhart, A., & Hong, E. (2011): On risk and cost in global sourcing“, International Journal of Production Economics, 131: 333–341
Kinkel, S. and Jäger, A. (2017): Auslandsverlagerungen, Rückverlagerungen und
Digitalisierungsverhalten in der deutschen Industrie. Trends und Auswirkungen
für den Produktionsstandort Deutschland. Hochschule Karlsruhe – Technik und
Wirtschaft.
Kinkel, S. & Maloca, S. (2009): Drivers and antecedents of manufacturing offshoring
and backshoring – a German perspective. Journal of Purchasing & Supply
Management, 15(3): 154-165.
Kinkel, S. (2012): Trends in production relocation and back-shoring activities –
changing patterns in the course of the global economic crisis. International
Journal of Operations & Production Management, 32(6): 696-720.
Kinkel, S. (2014): Future and impact of backshoring – some conclusions from 15
years of research on German practices. Journal of Purchasing & Supply
Management, 20(1): 63-65.
Lasi H., Fettke, P., Kemper H.G., Feld T., & Hoffmann, M. (2014): Industry 4.0.
Business and Information Systems Engineering, 6(4): 239-242.
Lewin, A. Y., Massini, S. & Peeters, C. (2009): Why Are Companies Offshoring
Innovation? The Emerging Global Race for Talent. Journal of International
Business Studies, 40(6): 901-925.
D4.1 Measuring reshoring trends in the EU and the US
53
©MAKERS 2017
Li, D.; Godsell, J.; Karatzas, A. (2017): The current state of manufacturing reshoring
in the UK. Proceedings of the 24th International Annual EurOMA Conference,
Edinburgh, Scotland, July 3rd-5th 2017
McIvor, R. (2009): How the transaction cost and resource-based theories of the firm
inform outsourcing evaluation. Journal of Operations Management, 27(1): 45-63.
Morgan Stanley (2013): US Manufacturing Renaissance: Is It a Masterpiece or a
(Head) Fake? Morgan Stanley Blue Paper, April 29, 2013.
Moser, H. (2013): Reshoring Initiative. Presentation at the CTMA. Available at:
http://ctma.com/wp-content/uploads/Reshoring-Initiative-Presentation-H_Moser-
Sept-18-2013-CTMA.pdf (accessed 22.12.2017).
Nager, A. and R.D. Atkinson (2015): The Myth of America’s Manufacturing Renaissance: The Real State of U.S. Manufacturing, The Information Technology
and Innovation Foundation, Jan. 12, 2015.
Nassimbeni, G. (2006): International sourcing: empirical evidence from a sample of
Italian firms. International Journal of Production Economics 103(2): 694–706.
OECD (2015): RESHORING: MYTH OR REALITY? Structural Change and the Next
Production Revolution. DSTI/IND (2015) 8, Paris.
Pegoraro, D.; De Propris, L.; Bailey, D. (2017): Paper on reshoring trends and drivers
of shorter value chains. MAKERS Deliverable 4.2, Birmingham Business School,
The University of Birmingham.
Pisano, G.P. (1990): The R&D boundaries of the firm: An empirical analysis”, Administrative Science Quarterly, 35(1): 153-176.
Pisano, G.P. & Shih, W.C. (2009): Restoring American competitiveness. Harvard
Business Review, 87(7/8): 2-14.
Pisano, G.P. and Shih, W.C. (2012): Producing Prosperity: Why America Needs a
Manufacturing Renaissance, Harvard Business Review Press, Boston, MA
Prahalad, C.K., Hamel, G. (1990): The core competence of the corporation. Harvard
Business Review, May/June: 79-91.
Rikama, S.; Nielsen, M.E.; Nielsen, P.B.; Alajääskö,P.; Roodhuijzen, A. (2013):
International sourcing of business functions. Statistics Explained, Eurostat.
Ritter, R. & Sternfels, R. (2004): When offshore manufacturing doesn’t make sense. The McKinsey Quarterly, 4: 124-127.
Rugman, A.M. (2010): Reconciling internalization theory and the eclectic paradigm.
Multinational Business Review, 18(2): 1-12.
D4.1 Measuring reshoring trends in the EU and the US
54
©MAKERS 2017
Sturgeon, T.J. (2013): Global Value Chains and Economic Globalization – Towards a
New Measurement Framework. Industrial Performance Center, Massachusetts
Institute of Technology.
Tate, W.L., Dooley, K. J. & Ellram, L. M. (2011): Transaction Cost and Institutional
Drivers of Supplier Adoption of Environmental Practices, Journal of Business
Logistics, 32(1): 6-16.
Tate, W.L., Ellram, L., Bals, L., & Hartmann, E. (2009): Offshore outsourcing of
services: An evolutionary perspective. International Journal of Production
Economics, 120(2): 512-524.
Tate, W.L. (2014): Offshoring and reshoring: U.S. insights and research challenges.
Journal of Purchasing and Supply Management, 20(1): 66-68.
Teece, D.J., Pisano, G. and Shuen, A. (1997): “Dynamic capabilities and strategic management”, Strategic Management Journal, Vol. 18 No. 7, pp. 509–533.
Teece, D.J., Pisano, G. and Shuen, A. (2002): “Dynamic capabilities and strategic management”, in Dosi, G., Nelson, R.R. and Winter, S.G. (Eds.), The Nature and
Dynamics of Organizational Capabilities, Oxford University Press, New York.
Timmer, M. P., Los, B., Stehrer, R. & De Vries, G. J. (2016): An Anatomy of the
Global Trade Slowdown based on the WIOD 2016 Release. GGDC Research
Memorandum 162, Groningen.
Wan, L.; Orzes, G.; Sartor, M.; Di Mauro, C.; Nassimbeni, G. (2017): Entry modes in
reshoring strategies: An empirical analysis. Proceedings of the 24th International
Annual EurOMA Conference, Edinburgh, Scotland, July 3rd-5th 2017
Wernerfelt, B. (1984): “A resource-based view of the firm”, Strategic Management
Journal, Vol. 5 No. 2, pp. 171–180.
Williamson, O.E. (1985): The Economic Institutions of Capitalism. New York: Free
Press.
D4.1 Measuring reshoring trends in the EU and the US
55
©MAKERS 2017
MAKERS - Smart Manufacturing for EU growth and prosperity is a project
funded by the Horizon 2020 Research and Innovation Staff Exchange Programme
under the Marie Sklodowska-Curie Actions - Grant agreement number 691192.