Embed Size (px)
Citation preview
Measuring the Effective Young’s Modulus of StructuralSilicone Sealant in Moment-Resisting Glazing Joints
Adam D. Leea,b,∗, Paul Shepherda, Mark C. Everndena, David Metcalfec
aDepartment of Architecture and Civil Engineering, University of Bath, Claverton Down,Bath, BA2 7AY, U.K.
bPTCC Facade Design, Telecom Plaza, 316 Senator Gil Puyat Ave., Makati City, MetroManila, 1200, Philippines.
cCentre for Window and Cladding Technology (CWCT), The Studio, Entry Hill, Bath,BA2 5LY, U.K.
Abstract
Structural silicone sealants are synthetic rubber adhesives used in the con-
struction industry to bond glass and other sheet infill materials to the frames of
windows and curtain walls. In this paper, two different algebraic expressions are
proposed to describe the way in which the rotational stiffness of the adhesive
connection – resistance to moments acting about the axis of the joint – varies
with the sealant’s cross-sectional dimensions and elastic modulus. Laboratory
testing of DC-983, a two-component structural silicone sealant used widely in
factory prefabricated glazing applications, has, with some caveats, validated the
mathematical models.
Keywords: facade design, structural silicone sealant, structural glazing,
elastic modulus, curtain wall, mullion,
1. Introduction1
In the middle of last century there began to emerge, hand in hand with2
the glass box architectural style, a new method of constructing tall buildings.3
First, a frame made up of columns and beams was erected, to support the4
∗Corresponding AuthorEmail addresses: [email protected] (Adam D. Lee), [email protected]
(Paul Shepherd), [email protected] (Mark C. Evernden), [email protected](David Metcalfe)
Preprint submitted to Elsevier “Construction & Building Materials” May 25, 2018
floors; then, to keep out the weather, the freestanding structure was enclosed5
with a lightweight, metal framed, skin [1, 2, 3]. Since that time, designers of6
these exterior “curtain walls” have been using the same set of assumptions when7
modelling the forces that are transferred from the sheet material covering the8
facade, which is often glass, to the members in the supporting frame. These9
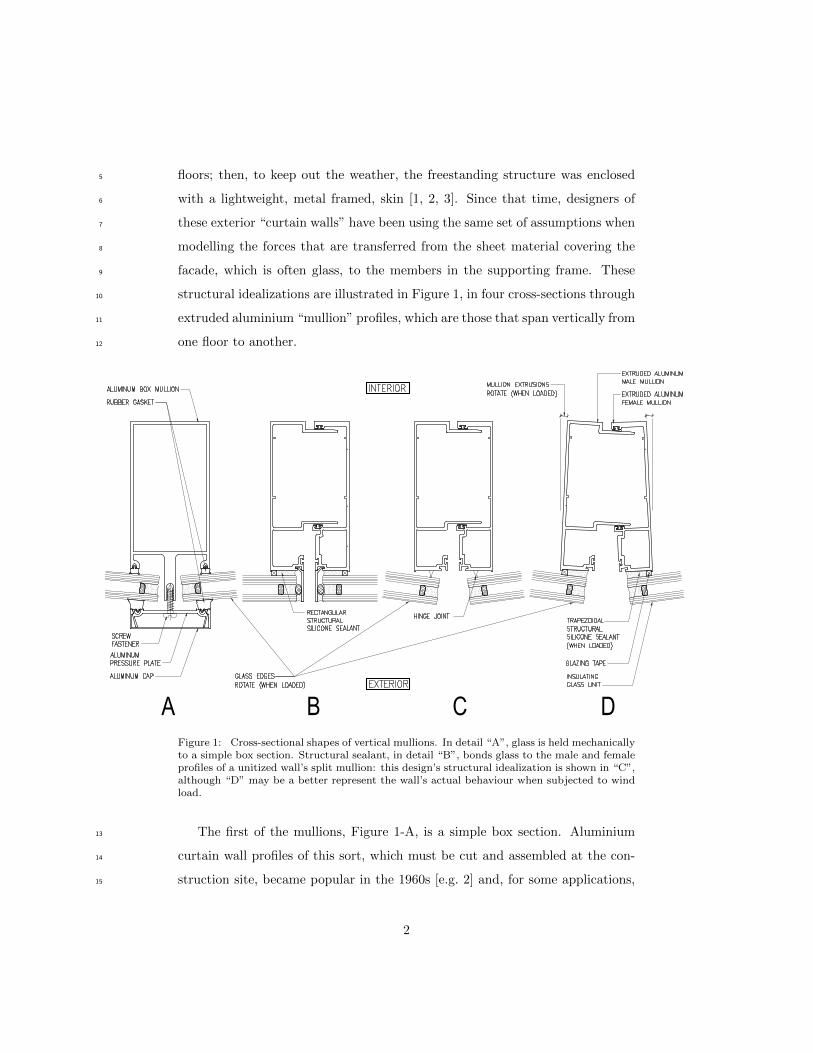
structural idealizations are illustrated in Figure 1, in four cross-sections through10
extruded aluminium “mullion” profiles, which are those that span vertically from11
one floor to another.12
A B C D
Figure 1: Cross-sectional shapes of vertical mullions. In detail “A”, glass is held mechanicallyto a simple box section. Structural sealant, in detail “B”, bonds glass to the male and femaleprofiles of a unitized wall’s split mullion: this design’s structural idealization is shown in “C”,although “D” may be a better represent the wall’s actual behaviour when subjected to windload.
The first of the mullions, Figure 1-A, is a simple box section. Aluminium13
curtain wall profiles of this sort, which must be cut and assembled at the con-14
struction site, became popular in the 1960s [e.g. 2] and, for some applications,15
2
are still in use today. Glass is retained at the face of the wall system using a me-16
chanical clamp. Rubber gaskets permit relative movement, in the plane of the17
wall, between the glass and the metal frame. So, the glass does not prevent the18
aluminium members from moving laterally. Also, the mechanical clamp at the19
edge of the glass permits rotation, as shown in Figure 1-A, so glass deflections20
do not cause the framing member to twist about its longitudinal axis.21
Another means of securing glass to its frame is to use an adhesive. This22
approach, known as “structural glazing” and shown in Figure 1-B, is relatively23
new. The first high-rise tower with a structurally glazed curtain wall was com-24
pleted as recently as 1986 [4, p. 53]. Since then, architects have embraced the25
new aesthetic, using the technology to create large, flat facades, without any26
metal components to the exterior of the glass. Structural glazing has become a27
common and conspicuous feature of large buildings around the world. Current28
structural design methods and usage guidelines for the adhesives – structural29
silicone sealants – are detailed in ASTM C1401 [5]. The reasons for inclusion of30
the “glazing tape” shown in Figures 1-B and 1-D, and the effect that this tape31
has upon structural performance, are explained in Section 7.3.32
Figure 1-B shows the E-shaped male and female extrusions that together33
form the split mullion of a modern unitized curtain wall. In such designs, the34
facade is made up of discrete panels that can be prefabricated. Because of this,35
and other, practical advantages [6 p. 4-5; 7 p. 86], the great majority of the36
world’s new curtain wall is of this type [8, p. 82]. From a structural standpoint37
however, the split mullion’s narrow profiles are, in torsion, less rigid than the38
box sections they replace (Figure 1-A). Consequently, it is frequently the case39
that prevention of buckling is the dominant concern for today’s facade engineers.40
Lateral torsional buckling (LTB) is the mode of structural failure caused and41
characterized by extreme axial rotation of a flexural member’s cross section. At42
the onset of failure by LTB, a glazing system’s profiles deflect in the manner43
shown in part D of Figure 1. The analysis of LTB is complex [e.g. 9, Chap-44
ter 5], and is affected by parameters aside from bending moment distribution,45
material properties, cross-sectional shape and distance between supports. Other46
3
significant particulars are the member’s initial straightness, and also the load47
eccentricities, which may themselves be functions of the profile’s rotation.48
If one of a member’s flanges is restrained to prevent it from rotating about its49
long axis, then LTB can be prevented. The moments that are transferred to such50
braces can be estimated analytically [e.g. 9, Equation 12.10], and the magnitude51
of the required torsional resistance is small. In a typical, unitized curtain wall52
system, the panes of glass or other sheet infill materials that are connected to53
the mullion’s outer flanges have ample structural capacity to serve a torsional54
braces. However, current design guides advise that, even in structurally glazed55
systems, glass and infill materials should not be considered to be restraints56
[e.g. 10]. Consequently, in structural analysis, mullions are modelled [as in 11,57
Part VIII, pp. 56-61] with the assumption that no moment is imparted to them58
by the glass. The structural idealization of the glass support is a hinge, as shown59
in Figure 1-C.60
In reality, because the structural sealant joint has stiffness, Figure 1-D might61
better describe a unitized mullion’s mid-span condition under wind load. In this62
diagram, positive wind pressure causes the glass to deflect toward the interior of63
the building and, as a consequence, moment is transferred through the structural64
silicone sealant to the mullion profiles, whose inner flanges move toward each65
other. The onset of LTB in the mullion profiles will, therefore, be affected by66
the moment resistance of the sealant joint.67
Facade engineers are interested in improving current methods of predicting68
LTB [12, 13] because, with continuing advances in the sizes of the panes that69
can be processed by glass fabricators, the structural members in exterior wall70
systems are becoming increasingly slender [10]. Research by others [e.g. 14]71
suggests that a structural silicone joint may provide sufficient support to pre-72
vent LTB in some cases, but a recent survey [12] showed that facade design73
professionals have insufficient information to assess whether an attachment to a74
glazing system’s frame will be effective as an LTB restraint. The analytical steps75
proposed in this present paper might therefore be incorporated in a more com-76
prehensive model, to predict the angle through which a framing extrusion will77
4
rotate when full design load is applied, and thus demonstrate that the frame’s78
resistance to LTB is adequate.79
Intuitively, it might seem dangerous to create structures using metal flexural80
members that remain stable only because they are supported by restraints made81
of glass. Glass is, after all, a brittle material, and building facades must be de-82
signed with the expectation that occasional breakages will occur. It is therefore83
worth explaining that the governing design loads acting upon a building’s facade84
are usually wind pressures. So, if breakage destroys a pane, it is true that its85
frame will no longer be restrained by the glass but, at the same time, the frame86
will no longer receive wind load. Therefore, failure of the glass will not cause a87
failure of the metal structure that it restrains.88
With greater understanding of the joint’s behaviour and with a more sophis-89
ticated structural model, it may be possible to reduce the mass of metal required90
to construct a curtain wall. The opportunity for metal savings exists because,91
in the design of modern mullion extrusion shapes, it is common that stability92
– in particular, resistance to lateral torsional buckling – is the governing struc-93
tural design consideration. If structural sealant joints can be shown to provide94
effective lateral or torsional restraint for their frames, then facade engineers will95
be able to make use of lighter profiles [e.g. 14]. The pursuit of efficient curtain96
wall design solutions is worthwhile, not only because of the cost savings that97
can be attained by reducing material usage, but also because, amongst common98
building materials, the embodied energy in aluminium is unusually high [15,99
p. 74] and so significant environmental benefit can be achieved by controlling100
metal content [16].101
The manner in which a mullion profile might be caused to rotate about102
its lengthwise axis is illustrated in Figure 1-D. When the magnitude of this103
rotation is sufficiently large then, aside from any structural consequences, other104
functions of the wall can be affected. For example, it is possible that the interior105
flanges of the male and female profiles will disengage, breaching the weather106
seal. Curtain wall system failures of this sort, caused by excessive rotation of a107
member about its extrusion axis, could be predicted during the design process108
5
if facade engineers were provided with a model of the relationship between109
moment and rotation in a structural silicone joint. For these two reasons –110
firstly to help curtain wall designers determine whether a particular structural111
sealant connection can provide torsional bracing for a mullion, and secondly to112
quantify the axial moment transmitted – the objective of the research described113
in this paper has been to develop a simple algebraic method to describe the114
rotational stiffness of a structural sealant joint, and to collect experimental115
data with which to validate the mathematical model.116
The terms “elastic modulus”, “Young’s modulus” and “modulus of elastic-117
ity” are equivalent, and may be used interchangeably. For a sealant, the pub-118
lished value of this property is usually that measured 14 days [e.g. 17] or 21 days119
[18] after creation of the sample. Research [17, p. 967] has, however, revealed120
that the Young’s modulus of a particular structural silicone sealant, DC-995,121
can rise dramatically during the 100 days following the assessment on day 14.122
In that single-component sealant – one that does not need to be mixed with a123
separate catalyst prior to application – the increase in elastic modulus “was in124
the range of 850-950 %”. If the results of this study are to be applied in practice125
then there is a need to understand the changes in Young’s modulus that occur126
as a sealant ages. Therefore, the rotational stiffness of a two-component sealant,127
DC-983 – a type that is commonly used when structurally glazed curtain wall128
panels are prefabricated in a factory – has been assessed at 14, 114 and 214129
days. Also, each sample’s indentation hardness was measured at 214 days.130
Apart from the rubber pads used in vibration-absorbing mountings, elas-131
tomeric materials are rarely encountered in building structures, and it may132
therefore be helpful to summarize their special properties. Structural silicone133
sealants are viscoelastic, meaning that an applied load causes damped elastic134
deflection, and so the magnitude of stress depends not just upon the magnitude135
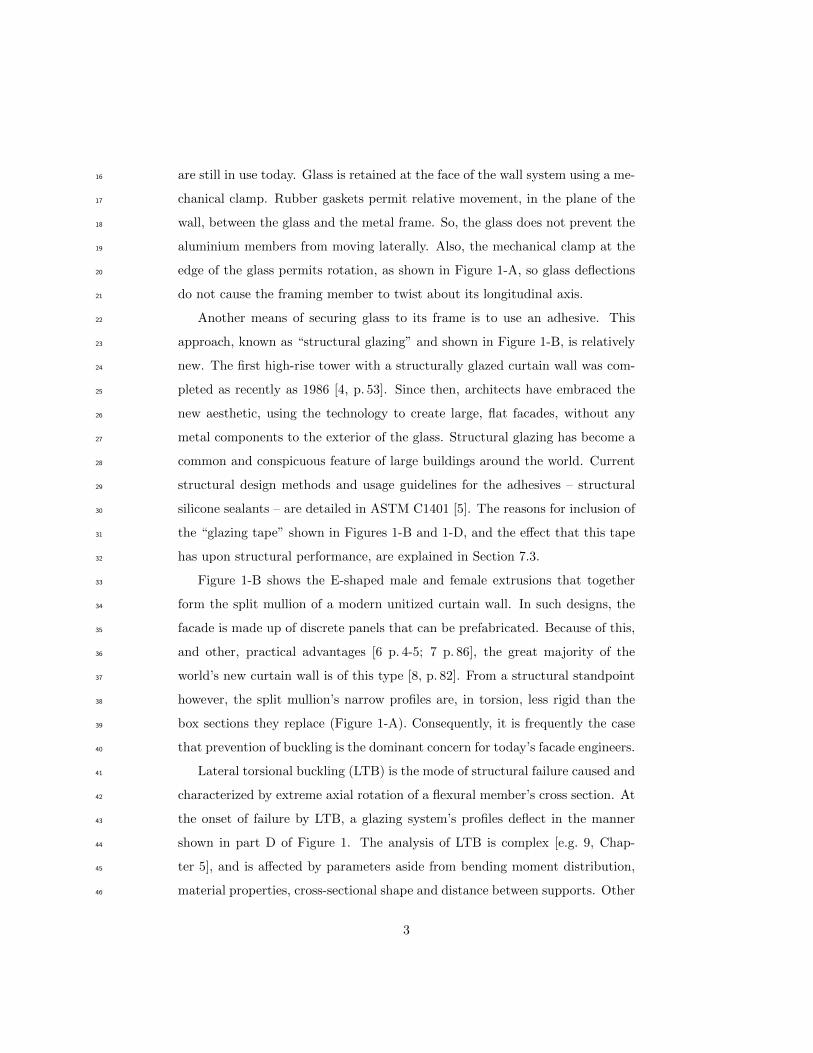
of strain, but also upon the rate of change in strain. Figure 2, shows the rela-136
tionship between tensile stress and strain [19, Table 1] for the particular sealant137
that has been tested in this study, DC-983. It can be seen that, even when138
strain is increased at a constant rate, in accordance with ASTM C1135 [18],139
6
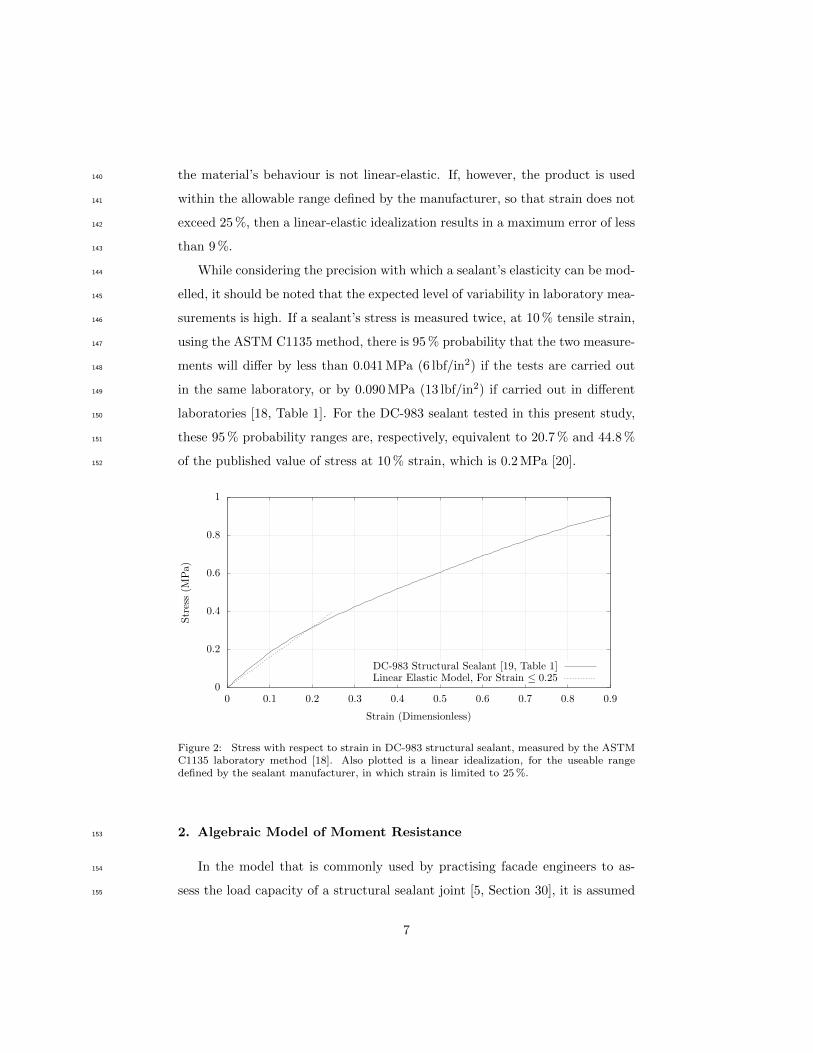
the material’s behaviour is not linear-elastic. If, however, the product is used140
within the allowable range defined by the manufacturer, so that strain does not141
exceed 25 %, then a linear-elastic idealization results in a maximum error of less142
than 9 %.143
While considering the precision with which a sealant’s elasticity can be mod-144
elled, it should be noted that the expected level of variability in laboratory mea-145
surements is high. If a sealant’s stress is measured twice, at 10 % tensile strain,146
using the ASTM C1135 method, there is 95 % probability that the two measure-147
ments will differ by less than 0.041 MPa (6 lbf/in2) if the tests are carried out148
in the same laboratory, or by 0.090 MPa (13 lbf/in2) if carried out in different149
laboratories [18, Table 1]. For the DC-983 sealant tested in this present study,150
these 95 % probability ranges are, respectively, equivalent to 20.7 % and 44.8 %151
of the published value of stress at 10 % strain, which is 0.2 MPa [20].152
0
0.2
0.4
0.6
0.8
1
0 0.1 0.2 0.3 0.4 0.5 0.6 0.7 0.8 0.9
Str
ess
(MP
a)
Strain (Dimensionless)
DC-983 Structural Sealant [19, Table 1]Linear Elastic Model, For Strain ≤ 0.25
Figure 2: Stress with respect to strain in DC-983 structural sealant, measured by the ASTMC1135 laboratory method [18]. Also plotted is a linear idealization, for the useable rangedefined by the sealant manufacturer, in which strain is limited to 25 %.
2. Algebraic Model of Moment Resistance153
In the model that is commonly used by practising facade engineers to as-154
sess the load capacity of a structural sealant joint [5, Section 30], it is assumed155
7
that the glass remains flat when wind pressure is applied, and that the sealant156
experiences only tensile or only compressive stress. Several researchers [e.g. 21]157
have carried out sealant analyses that take glass deflection and the sealant’s158
shear stresses into account. In these more sophisticated studies, solutions for159
particular design conditions have been obtained numerically, using finite differ-160
ence or finite element techniques. While the results obtained in this way are161
comprehensive – the entire stress field is revealed – the process of preparing162
numerical models is time consuming, making it impractical to use this approach163
to investigate the many and varied design cases that might be encountered in164
a real building’s facade. It has therefore been this present study’s aim to find,165
and to validate experimentally, a set of simple, closed-form algebraic expressions166
that may, in the future, be incorporated in a design code.167
For the sake of simplicity, here the assumption will be made that structural168
sealants obey Hooke’s law. The validity of this approach is discussed later,169
in Section 7.1. Adopting a linear-elastic model makes it possible to consider170
separately the different components of load, and to sum their effects using su-171
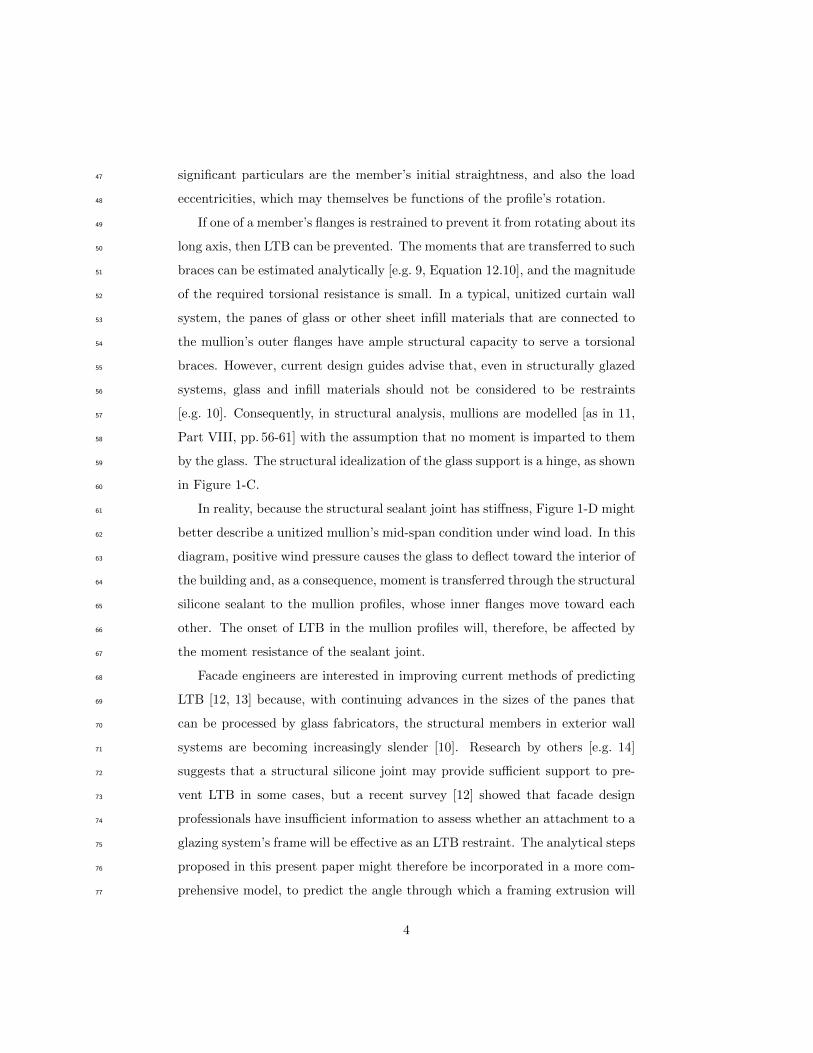
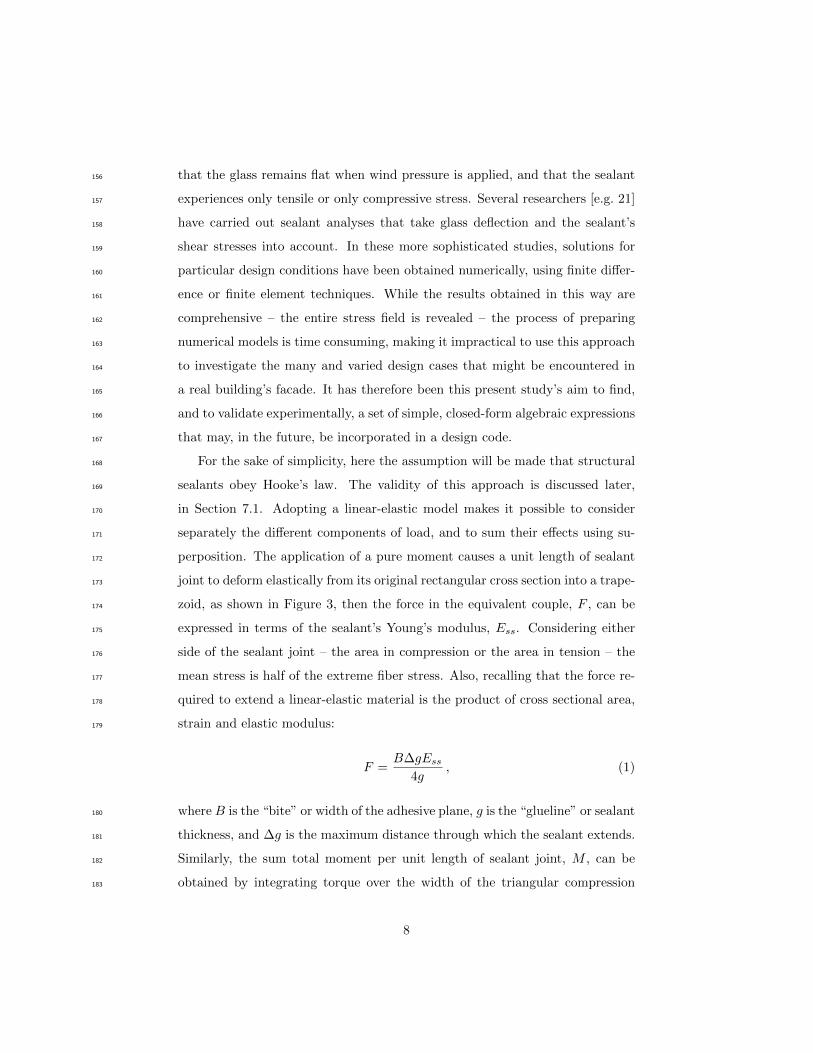
perposition. The application of a pure moment causes a unit length of sealant172
joint to deform elastically from its original rectangular cross section into a trape-173
zoid, as shown in Figure 3, then the force in the equivalent couple, F , can be174
expressed in terms of the sealant’s Young’s modulus, Ess. Considering either175
side of the sealant joint – the area in compression or the area in tension – the176
mean stress is half of the extreme fiber stress. Also, recalling that the force re-177
quired to extend a linear-elastic material is the product of cross sectional area,178
strain and elastic modulus:179
F =B∆gEss
4g, (1)
where B is the “bite” or width of the adhesive plane, g is the “glueline” or sealant180
thickness, and ∆g is the maximum distance through which the sealant extends.181
Similarly, the sum total moment per unit length of sealant joint, M , can be182
obtained by integrating torque over the width of the triangular compression183
8
and tension zones that have been shaded in Figure 3:184
M =2Ess
g
∫ B2
x=0
2x2∆g
Bdx, (2)
if the x-axis is horizontal in the right hand diagram of Figure 3. Hence:185
M =B2∆gEss
6g. (3)
If the eccentricity of F from the joint’s centreline is Q then M = 2FQ. Sub-186
stituting for F and M from Equations 1 and 3 gives the value of Q, which is187
B/3. This is, plainly, the standard result for a triangular load zone, in which188
the amplitude of force varies linearly with distance.189
Figure 3: The edges of a glass pane rotate (Left) under the action of wind pressure. A sectionthrough the loaded structural sealant joint (Right) shows its trapezoidal shape.
If the angle through which the glass edge rotates is α then, from Figure 3,190
tanα = 2∆g/B. These rotations are small – usually only a few degrees – and so191
α is a close approximation to tanα, when α is measured in radians. This small192
angle assumption is reasonable while α is less than 0.176 radians (10 degrees).193
9
In this range, α = 2∆g/B, and Equation 3 can be rewritten:194
M = αB3Ess
12g. (4)
3. A More Sophisticated Model of Moment Resistance195
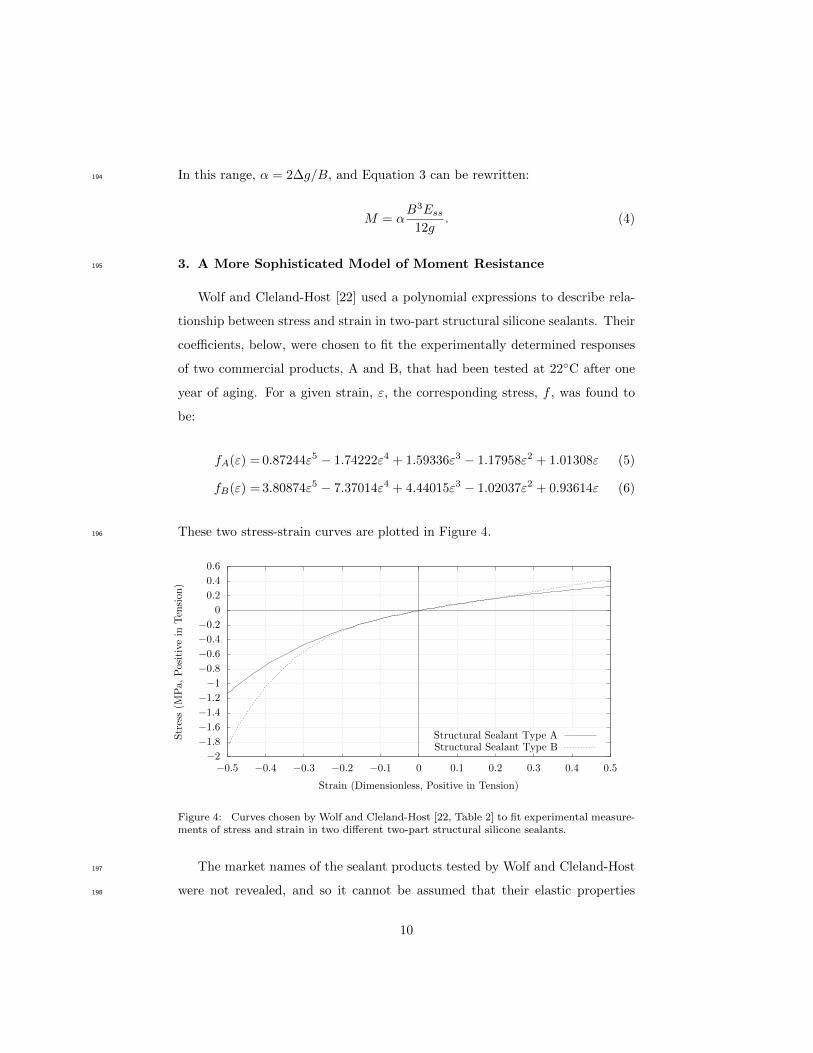
Wolf and Cleland-Host [22] used a polynomial expressions to describe rela-
tionship between stress and strain in two-part structural silicone sealants. Their
coefficients, below, were chosen to fit the experimentally determined responses
of two commercial products, A and B, that had been tested at 22◦C after one
year of aging. For a given strain, ε, the corresponding stress, f , was found to
be:
fA(ε) = 0.87244ε5 − 1.74222ε4 + 1.59336ε3 − 1.17958ε2 + 1.01308ε (5)
fB(ε) = 3.80874ε5 − 7.37014ε4 + 4.44015ε3 − 1.02037ε2 + 0.93614ε (6)
These two stress-strain curves are plotted in Figure 4.196
−2
−1.8
−1.6
−1.4
−1.2
−1
−0.8
−0.6
−0.4
−0.2
0
0.2
0.4
0.6
−0.5 −0.4 −0.3 −0.2 −0.1 0 0.1 0.2 0.3 0.4 0.5
Str
ess
(MP
a,P
osit
ive
inT
ensi
on)
Strain (Dimensionless, Positive in Tension)
Structural Sealant Type AStructural Sealant Type B
Figure 4: Curves chosen by Wolf and Cleland-Host [22, Table 2] to fit experimental measure-ments of stress and strain in two different two-part structural silicone sealants.
The market names of the sealant products tested by Wolf and Cleland-Host197
were not revealed, and so it cannot be assumed that their elastic properties198
10
will match those of the sealant tested in this study, or those of the sealant199
used in a given glazing system. However, in Figure 4 it can be seen that the200
sealants’ elastic moduli are greater in compression than they are in tension, and201
in this discussion the presumption is that such asymmetry is typical amongst all202
structural silicone sealants. A further supposition is that the stress-strain curve203
for any particular structural glazing sealant, or a reasonable approximation to204
it, can be obtained by applying a constant scaling factor to the stress function205
in Equation 5 or 6. Expressed another way, for a sealant Z:206
fZ(ε) ' kZfA(ε), (7)
where kZ is a constant.207
While formulating the previous rotational stiffness model, described in Sec-208
tion 2, the stress-strain curve from a tensile test was examined, and it was argued209
that, within the range between zero and 25 % strain, a linear-elastic approxima-210
tion is sufficiently accurate for engineering design purposes. A constant value211
of Young’s modulus was then assumed to apply in the sealant joint’s tension212
zone, and also in the compression zone. Because of its simplicity, that previous213
model still may be of interest to engineers, but, in reality, Young’s modulus is214
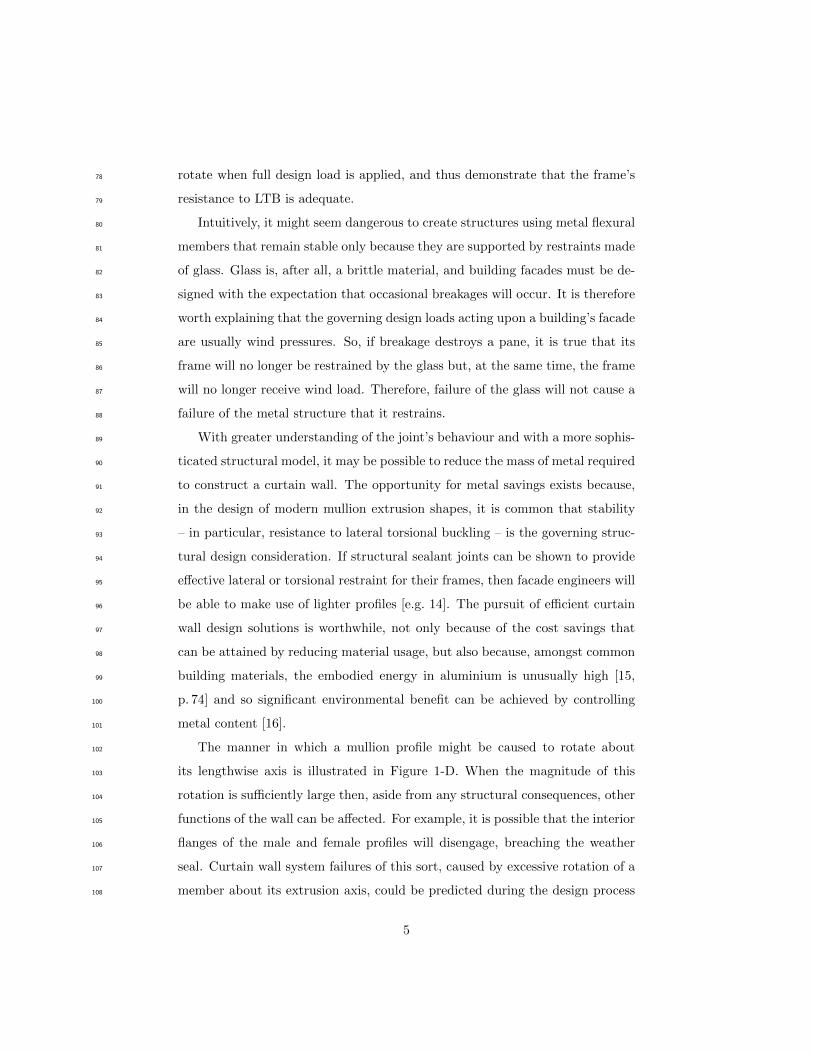
a function of strain, and is greater in compression than in tension. Therefore,215
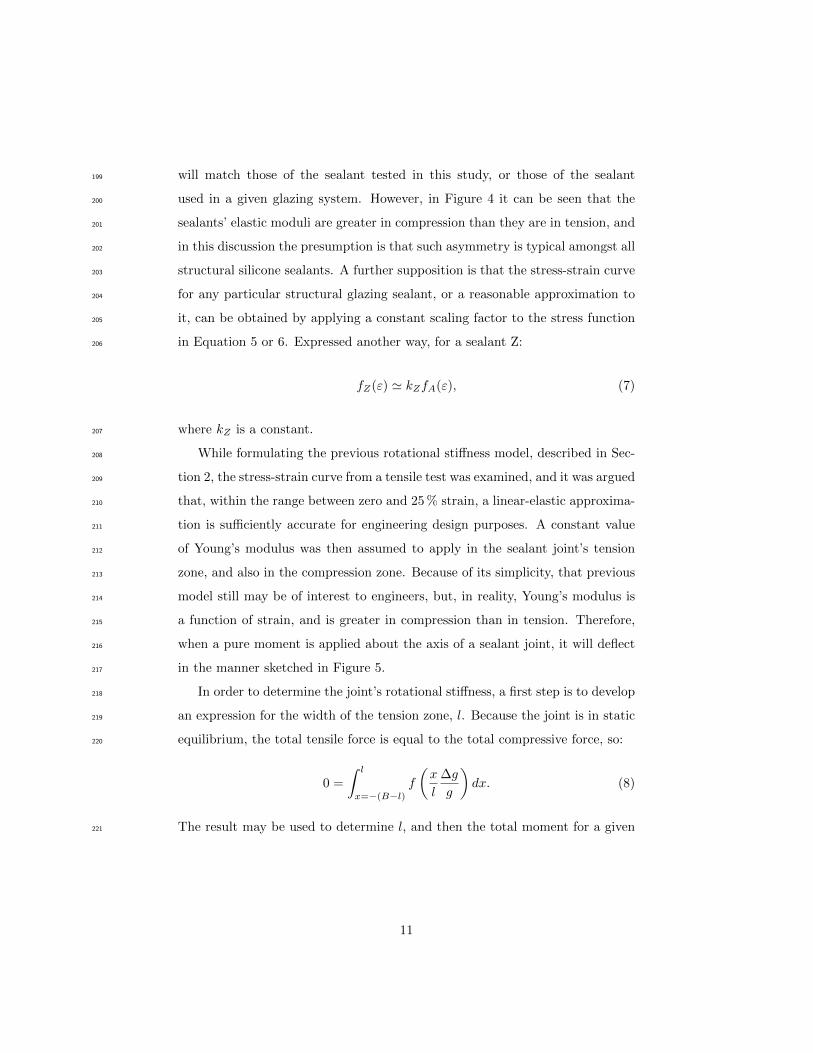
when a pure moment is applied about the axis of a sealant joint, it will deflect216
in the manner sketched in Figure 5.217
In order to determine the joint’s rotational stiffness, a first step is to develop218
an expression for the width of the tension zone, l. Because the joint is in static219
equilibrium, the total tensile force is equal to the total compressive force, so:220
0 =
∫ l
x=−(B−l)
f
(x
l
∆g
g
)dx. (8)
The result may be used to determine l, and then the total moment for a given221
11
Figure 5: Cross section through structural sealant deflecting solely because of a momentabout the joint’s axis, with asymmetric tension and compression zones (cf. Figure 3). Thepositions of equivalent concentrated forces are based on the premise that Young’s modulus isconstant in the tension zone and constant in the compression zone.
12
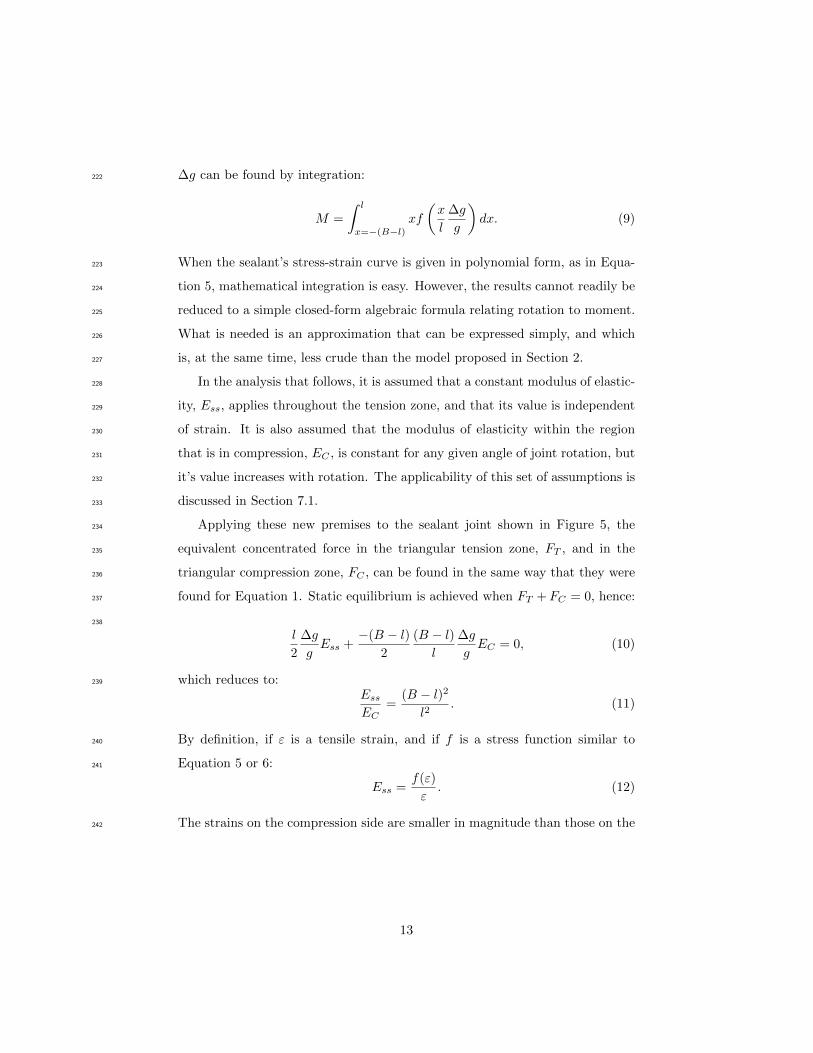
∆g can be found by integration:222
M =
∫ l
x=−(B−l)
xf
(x
l
∆g
g
)dx. (9)
When the sealant’s stress-strain curve is given in polynomial form, as in Equa-223
tion 5, mathematical integration is easy. However, the results cannot readily be224
reduced to a simple closed-form algebraic formula relating rotation to moment.225
What is needed is an approximation that can be expressed simply, and which226
is, at the same time, less crude than the model proposed in Section 2.227
In the analysis that follows, it is assumed that a constant modulus of elastic-228
ity, Ess, applies throughout the tension zone, and that its value is independent229
of strain. It is also assumed that the modulus of elasticity within the region230
that is in compression, EC , is constant for any given angle of joint rotation, but231
it’s value increases with rotation. The applicability of this set of assumptions is232
discussed in Section 7.1.233
Applying these new premises to the sealant joint shown in Figure 5, the234
equivalent concentrated force in the triangular tension zone, FT , and in the235
triangular compression zone, FC , can be found in the same way that they were236
found for Equation 1. Static equilibrium is achieved when FT +FC = 0, hence:237
238
l
2
∆g
gEss +
−(B − l)2
(B − l)l
∆g
gEC = 0, (10)
which reduces to:239
Ess
EC=
(B − l)2
l2. (11)
By definition, if ε is a tensile strain, and if f is a stress function similar to240
Equation 5 or 6:241
Ess =f(ε)
ε. (12)
The strains on the compression side are smaller in magnitude than those on the242
13
tension side, and ε is a tensile strain, so:243
EC =−f(
(B−l)l ε
)(B−l)
l ε. (13)
Substituting the above two expressions, for Ess and EC in Equation 11, and244
simplifying:245
f(ε) = −f(−(B − l)
lε
)(B − l)
l. (14)
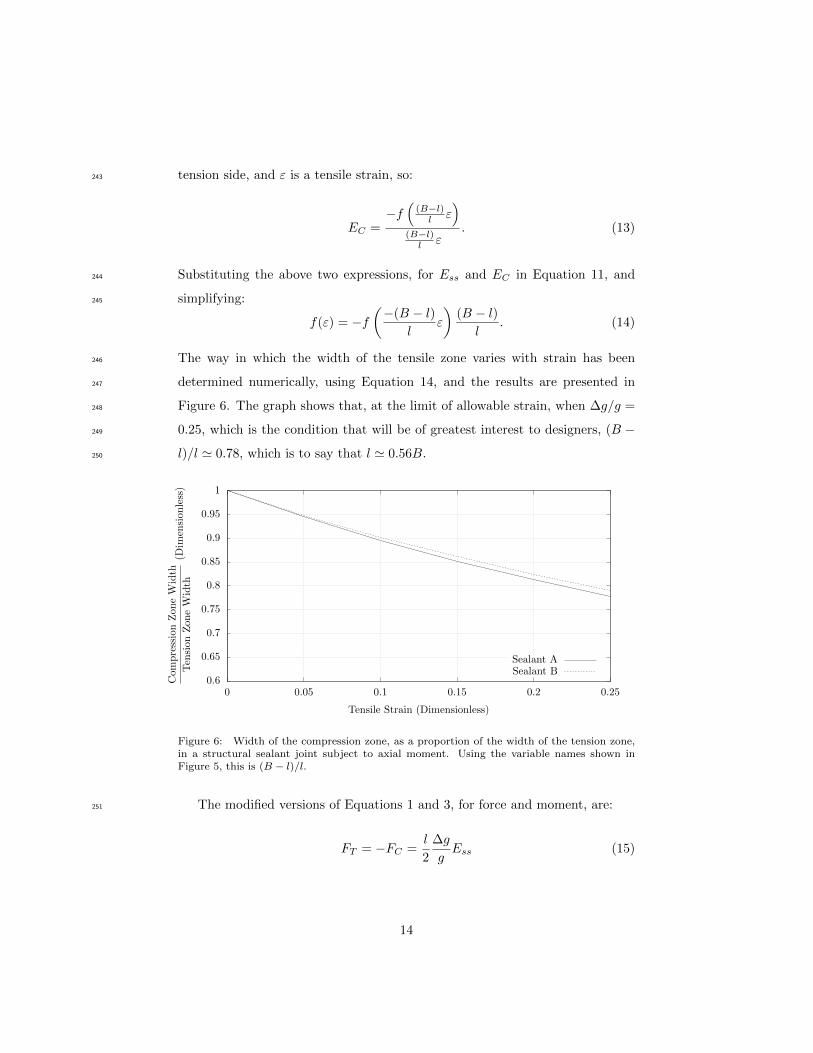
The way in which the width of the tensile zone varies with strain has been246
determined numerically, using Equation 14, and the results are presented in247
Figure 6. The graph shows that, at the limit of allowable strain, when ∆g/g =248
0.25, which is the condition that will be of greatest interest to designers, (B −249
l)/l ' 0.78, which is to say that l ' 0.56B.250
0.6
0.65
0.7
0.75
0.8
0.85
0.9
0.95
1
0 0.05 0.1 0.15 0.2 0.25
Com
pre
ssio
nZ
on
eW
idth
Ten
sion
Zon
eW
idth
(Dim
ensi
onle
ss)
Tensile Strain (Dimensionless)
Sealant ASealant B
Figure 6: Width of the compression zone, as a proportion of the width of the tension zone,in a structural sealant joint subject to axial moment. Using the variable names shown inFigure 5, this is (B − l)/l.
The modified versions of Equations 1 and 3, for force and moment, are:251
FT = −FC =l
2
∆g
gEss (15)
14
and,252
M =Bl
3
∆g
gEss. (16)
When the glass edge rotation is α then, from Figure 5, α = ∆g/l, where α253
is less than 0.176 radians. Equation 16 now can be rewritten:254
M = αBl2Ess
3g. (17)
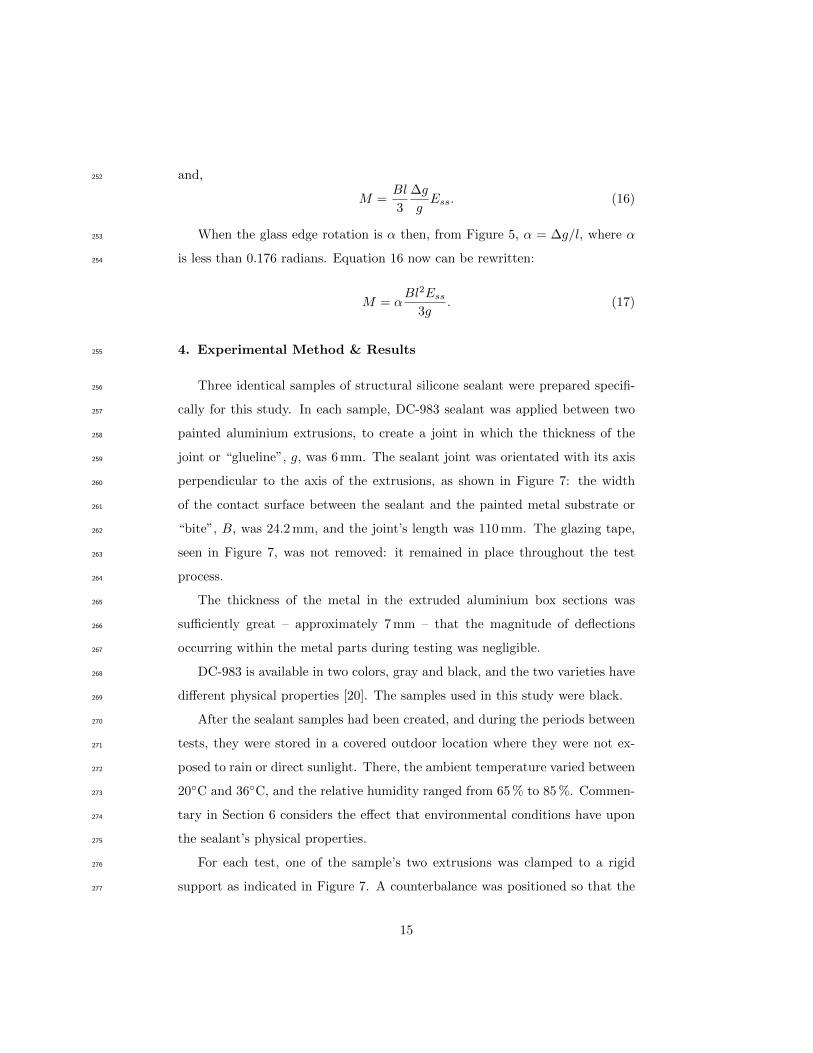
4. Experimental Method & Results255
Three identical samples of structural silicone sealant were prepared specifi-256
cally for this study. In each sample, DC-983 sealant was applied between two257
painted aluminium extrusions, to create a joint in which the thickness of the258
joint or “glueline”, g, was 6 mm. The sealant joint was orientated with its axis259
perpendicular to the axis of the extrusions, as shown in Figure 7: the width260
of the contact surface between the sealant and the painted metal substrate or261
“bite”, B, was 24.2 mm, and the joint’s length was 110 mm. The glazing tape,262
seen in Figure 7, was not removed: it remained in place throughout the test263
process.264
The thickness of the metal in the extruded aluminium box sections was265
sufficiently great – approximately 7 mm – that the magnitude of deflections266
occurring within the metal parts during testing was negligible.267
DC-983 is available in two colors, gray and black, and the two varieties have268
different physical properties [20]. The samples used in this study were black.269
After the sealant samples had been created, and during the periods between270
tests, they were stored in a covered outdoor location where they were not ex-271
posed to rain or direct sunlight. There, the ambient temperature varied between272
20◦C and 36◦C, and the relative humidity ranged from 65 % to 85 %. Commen-273
tary in Section 6 considers the effect that environmental conditions have upon274
the sealant’s physical properties.275
For each test, one of the sample’s two extrusions was clamped to a rigid276
support as indicated in Figure 7. A counterbalance was positioned so that the277
15
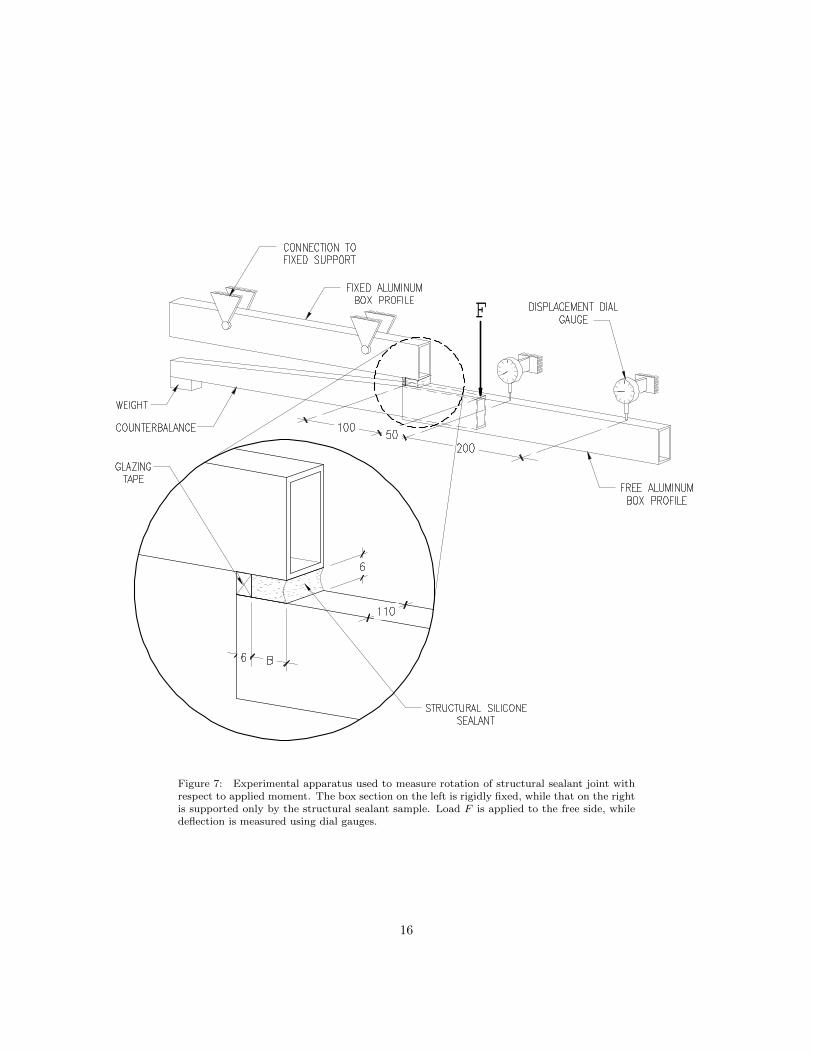
Figure 7: Experimental apparatus used to measure rotation of structural sealant joint withrespect to applied moment. The box section on the left is rigidly fixed, while that on the rightis supported only by the structural sealant sample. Load F is applied to the free side, whiledeflection is measured using dial gauges.
16
axis of the suspended extrusion, which was supported only by the structural278
silicone joint, was also horizontal. The load, which varied as a function of time,279
was applied to the suspended extrusion, at a distance of 100 mm from the sealant280
joint’s centreline. Force was increased by 3.2 N every 30 seconds until the free281
beam’s deflection was near to the maximum that the instruments could measure,282
or until the strain in the sealant was near to the 25 % limit established by the283
sealant’s manufacturer [20]. Thereafter, force was removed incrementally, at the284
same rate as it had been applied. Immediately prior to each change in load,285
the position of the moving side of the sample was measured using dial gauges,286
graduated in hundredths of a millimeter, located as shown in Figure 7.287
Each of the three sealant specimens was held and loaded, in sequence, in four288
different orientations, as shown in Table 1. Therefore, on each of the occasions289
that the samples’ properties were measured – after 14, 114 and 214 days – the290
test procedure described above was carried out twelve times in total.291
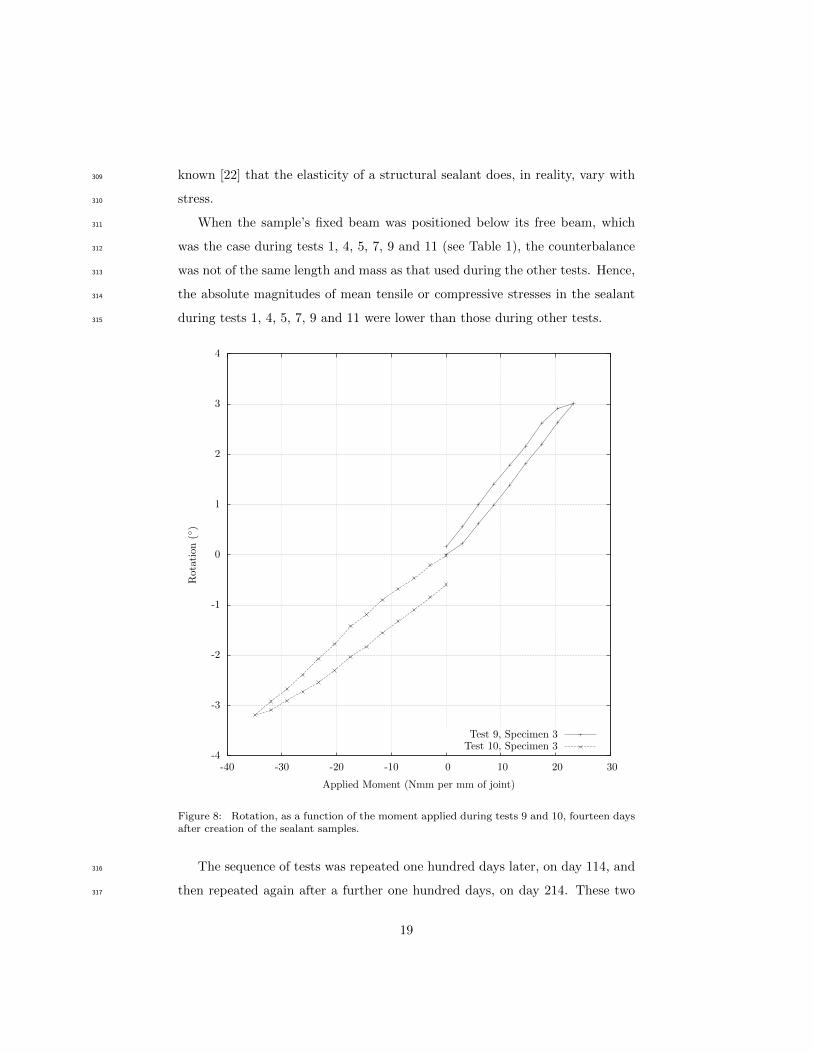
Figure 8 shows the magnitude of rotation about the axis of the sealant joint,292
plotted against applied moment, for two example sets of data – test numbers293
9 and 10. The readings presented are those recorded while the load was being294
increased and while the load was being reduced. The hysteresis patterns are295
typical of those seen in the other test results.296
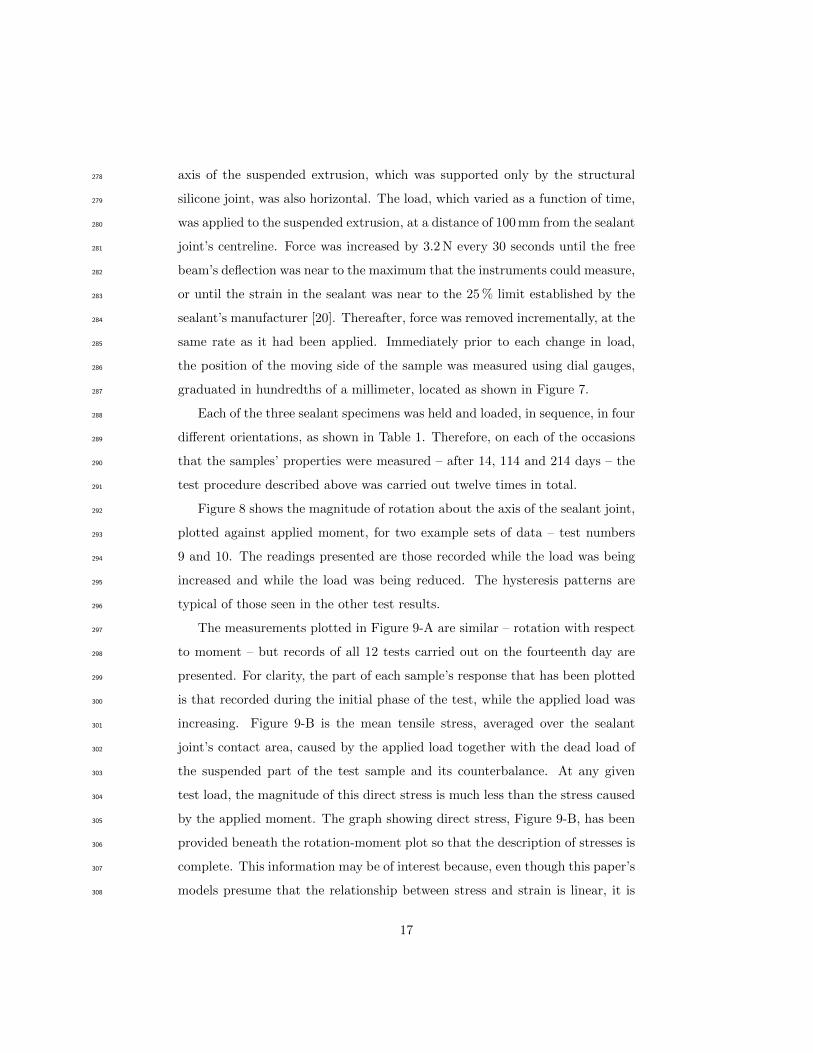
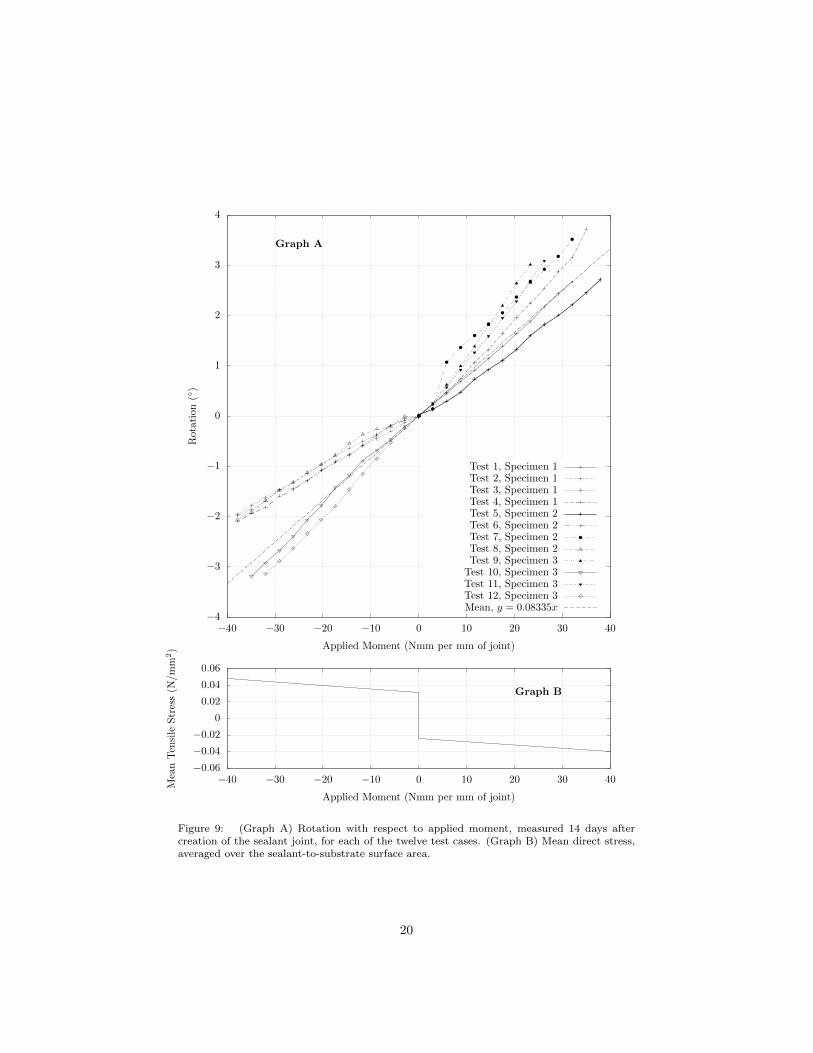
The measurements plotted in Figure 9-A are similar – rotation with respect297
to moment – but records of all 12 tests carried out on the fourteenth day are298
presented. For clarity, the part of each sample’s response that has been plotted299
is that recorded during the initial phase of the test, while the applied load was300
increasing. Figure 9-B is the mean tensile stress, averaged over the sealant301
joint’s contact area, caused by the applied load together with the dead load of302
the suspended part of the test sample and its counterbalance. At any given303
test load, the magnitude of this direct stress is much less than the stress caused304
by the applied moment. The graph showing direct stress, Figure 9-B, has been305
provided beneath the rotation-moment plot so that the description of stresses is306
complete. This information may be of interest because, even though this paper’s307
models presume that the relationship between stress and strain is linear, it is308
17
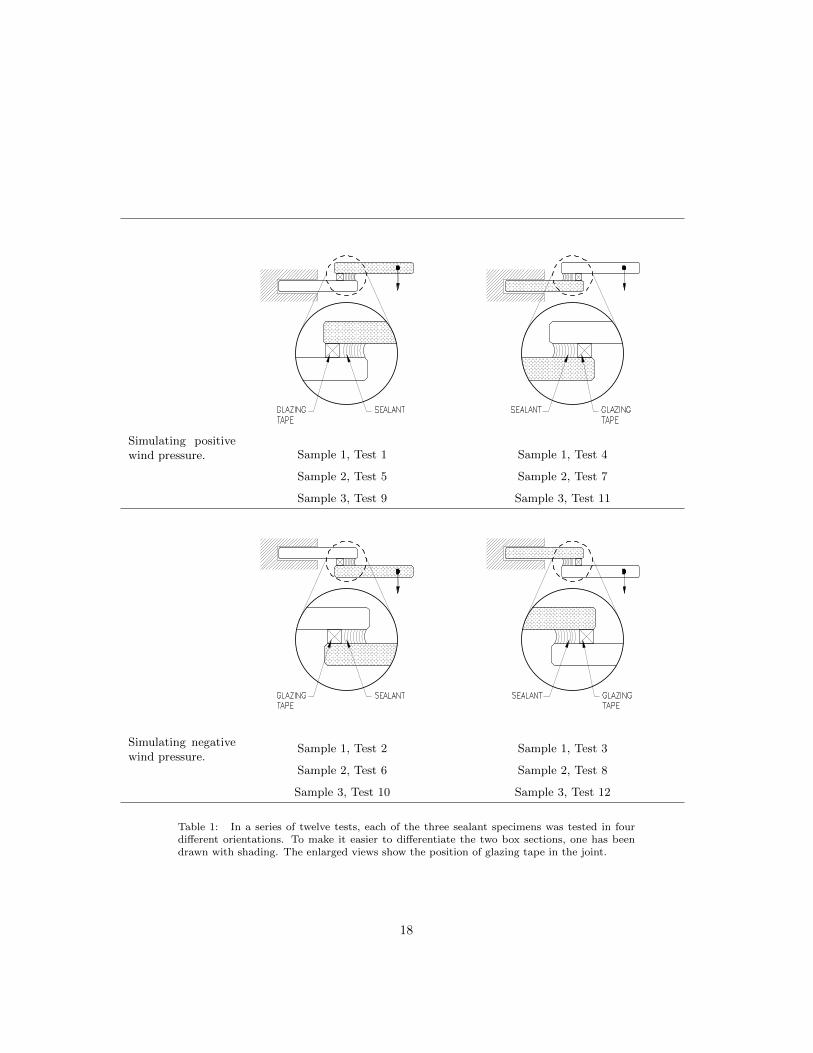
Simulating positivewind pressure. Sample 1, Test 1 Sample 1, Test 4
Sample 2, Test 5 Sample 2, Test 7
Sample 3, Test 9 Sample 3, Test 11
Simulating negativewind pressure.
Sample 1, Test 2 Sample 1, Test 3
Sample 2, Test 6 Sample 2, Test 8
Sample 3, Test 10 Sample 3, Test 12
Table 1: In a series of twelve tests, each of the three sealant specimens was tested in fourdifferent orientations. To make it easier to differentiate the two box sections, one has beendrawn with shading. The enlarged views show the position of glazing tape in the joint.
18
known [22] that the elasticity of a structural sealant does, in reality, vary with309
stress.310
When the sample’s fixed beam was positioned below its free beam, which311
was the case during tests 1, 4, 5, 7, 9 and 11 (see Table 1), the counterbalance312
was not of the same length and mass as that used during the other tests. Hence,313
the absolute magnitudes of mean tensile or compressive stresses in the sealant314
during tests 1, 4, 5, 7, 9 and 11 were lower than those during other tests.315
-4
-3
-2
-1
0
1
2
3
4
-40 -30 -20 -10 0 10 20 30
Rot
atio
n(◦
)
Applied Moment (Nmm per mm of joint)
Test 9, Specimen 3Test 10, Specimen 3
Figure 8: Rotation, as a function of the moment applied during tests 9 and 10, fourteen daysafter creation of the sealant samples.
The sequence of tests was repeated one hundred days later, on day 114, and316
then repeated again after a further one hundred days, on day 214. These two317
19
−4
−3
−2
−1
0
1
2
3
4
−40 −30 −20 −10 0 10 20 30 40
−0.06
−0.04
−0.02
0
0.02
0.04
0.06
−40 −30 −20 −10 0 10 20 30 40
Rot
atio
n(◦
)
Applied Moment (Nmm per mm of joint)
Graph A
Test 1, Specimen 1Test 2, Specimen 1Test 3, Specimen 1Test 4, Specimen 1Test 5, Specimen 2Test 6, Specimen 2Test 7, Specimen 2Test 8, Specimen 2Test 9, Specimen 3
Test 10, Specimen 3Test 11, Specimen 3Test 12, Specimen 3Mean, y = 0.08335x
Mea
nT
ensi
leS
tres
s(N
/mm
2)
Applied Moment (Nmm per mm of joint)
Graph B
Figure 9: (Graph A) Rotation with respect to applied moment, measured 14 days aftercreation of the sealant joint, for each of the twelve test cases. (Graph B) Mean direct stress,averaged over the sealant-to-substrate surface area.
20
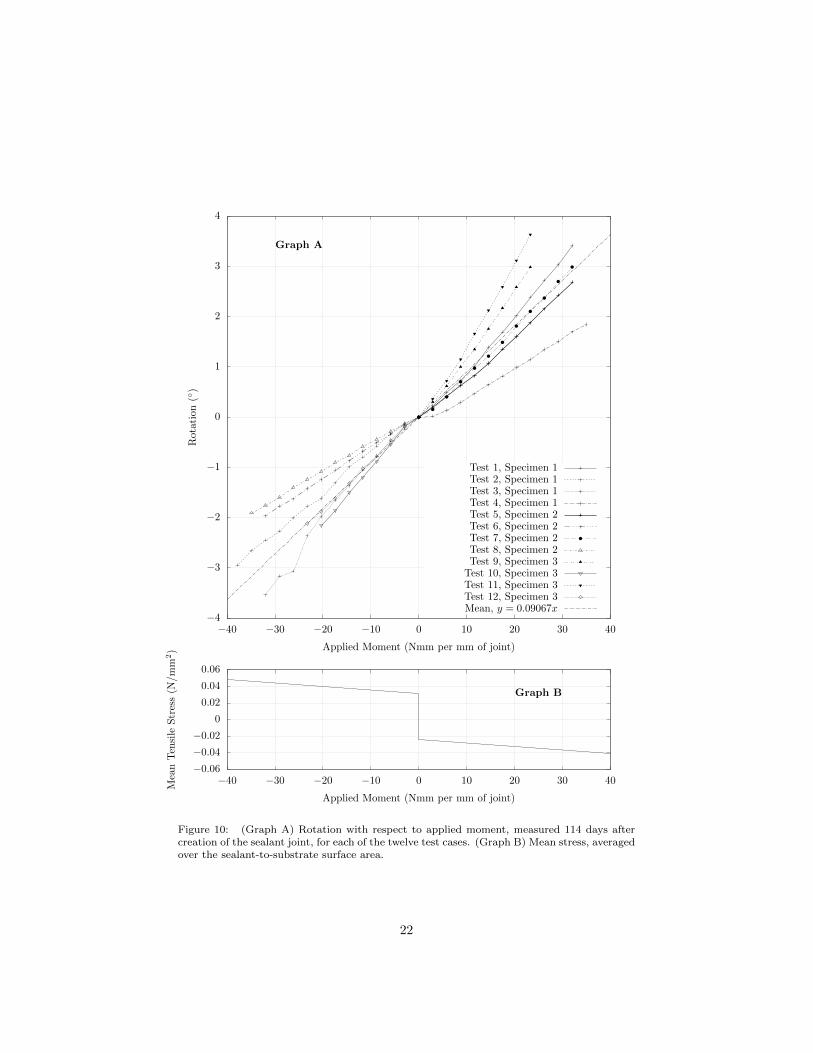
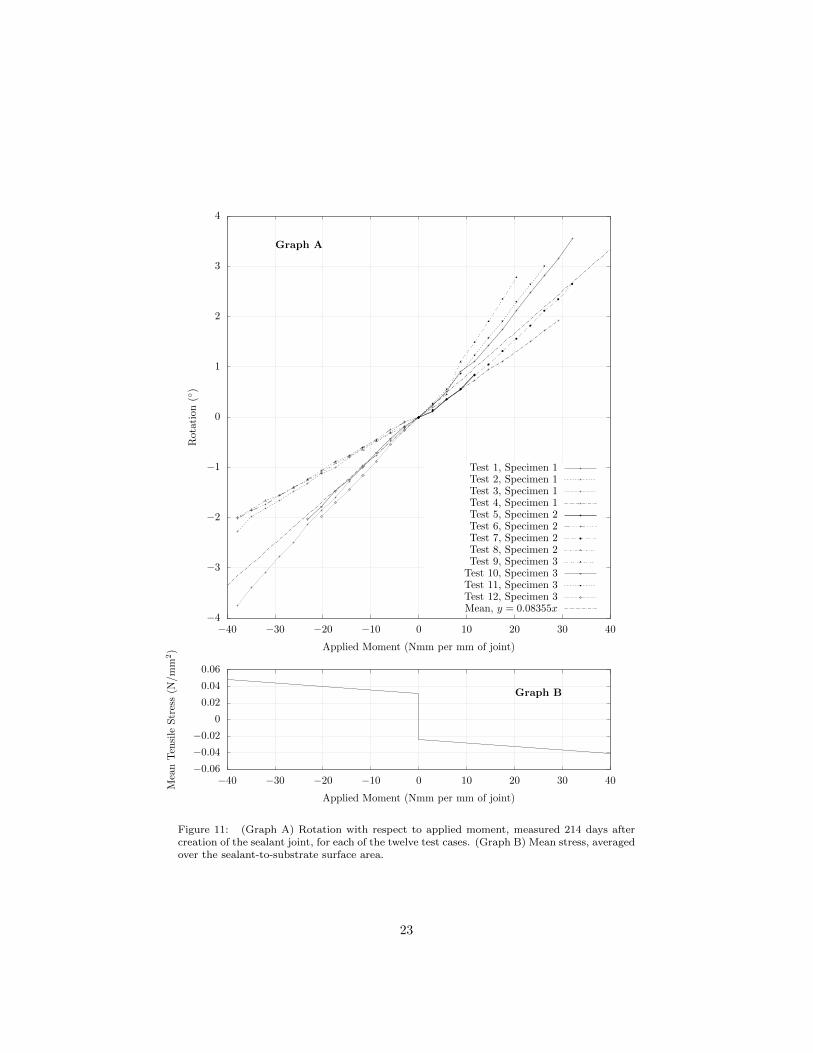
sets of rotation measurements, plotted against applied moment, are shown in318
Figures 10-A and 11-A respectively. For completeness, the corresponding direct319
stresses are given in Figures 10-B and 11-B.320
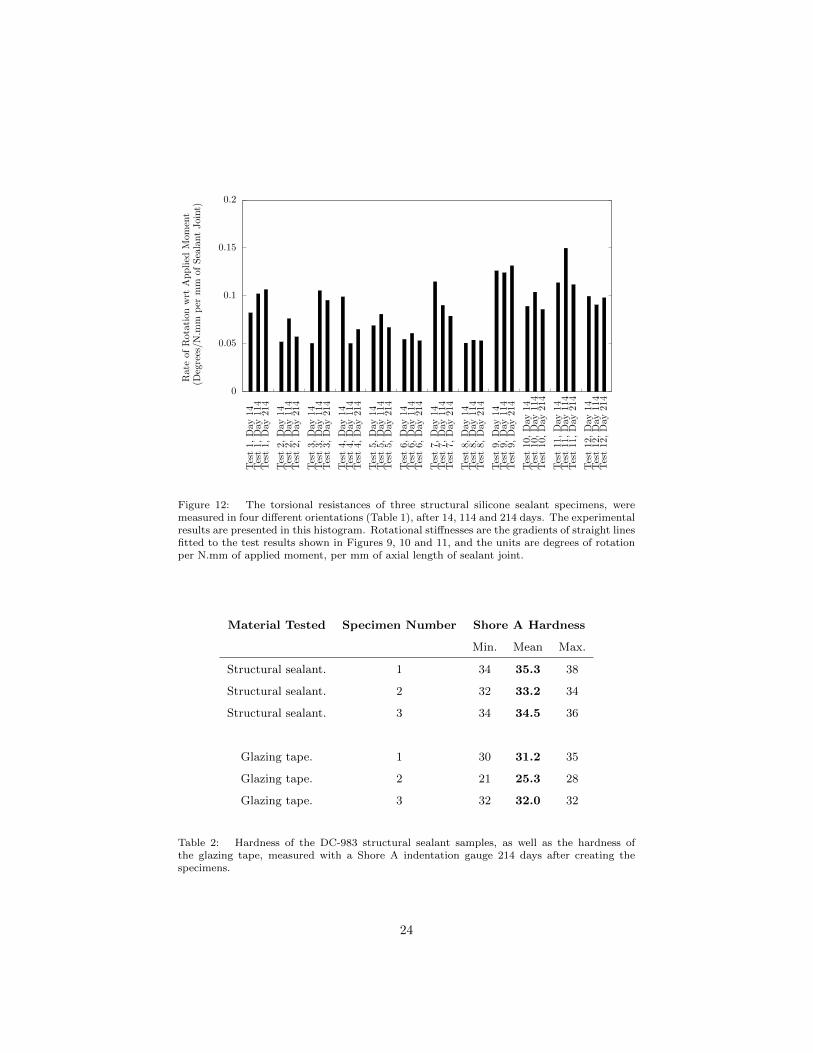
In summary, the torsional resistance of sealant joints has been measured in321
the laboratory. Each of three specimens was tested in four different orientations,322
as shown in Table 1, after 14, 114 and 214 days. All 36 measured rotational323
stiffness are presented, in the form of a histogram, in Figure 12.324
5. Young’s Modulus of Structural Silicone Sealant325
After rotational resistance had been measured for the third time, on day326
214, each specimen was partially disassembled by separating the sealant from327
one of its metal substrates using a sharp blade. At the newly-exposed surfaces328
of sealant and glazing tape, hardness was found using a Shore A indentation329
tester [23, 24]. For each of the three specimens, sealant hardness measurements330
were taken at six locations. For specimens 1 and 2, glazing tape hardness331
measurements were taken at six locations. As the glazing tape in specimen 3332
had been damaged when it was separated from its substrate, it was possible333
to measure its hardness in only one location. Minimum, mean and maximum334
values are shown in Table 2. Because the thickness of material tested was equal335
to the sealant joint’s glueline, 6 mm, it was not necessary to apply any correction336
to the gauge readings [25, Figure 3]. As the glazing tape is narrow – only 6 mm337
in width – the centre of the tip of the indentation tester could not be positioned338
more than 3 mm from the tape’s edge. The close proximity of the indenter339
to the edge is likely to have influenced the measurements but, as discussed in340
Section 7.3, the tape’s properties are not considered in this paper’s algebraic341
models of sealant joint behaviour.342
The behaviour of an elastic material under the tip of a hardness instrument’s343
indenter was considered by Gent [26], who proposed the following theoretical344
21
−4
−3
−2
−1
0
1
2
3
4
−40 −30 −20 −10 0 10 20 30 40
−0.06
−0.04
−0.02
0
0.02
0.04
0.06
−40 −30 −20 −10 0 10 20 30 40
Rot
atio
n(◦
)
Applied Moment (Nmm per mm of joint)
Graph A
Test 1, Specimen 1Test 2, Specimen 1Test 3, Specimen 1Test 4, Specimen 1Test 5, Specimen 2Test 6, Specimen 2Test 7, Specimen 2Test 8, Specimen 2Test 9, Specimen 3
Test 10, Specimen 3Test 11, Specimen 3Test 12, Specimen 3Mean, y = 0.09067x
Mea
nT
ensi
leS
tres
s(N
/mm
2)
Applied Moment (Nmm per mm of joint)
Graph B
Figure 10: (Graph A) Rotation with respect to applied moment, measured 114 days aftercreation of the sealant joint, for each of the twelve test cases. (Graph B) Mean stress, averagedover the sealant-to-substrate surface area.
22
−4
−3
−2
−1
0
1
2
3
4
−40 −30 −20 −10 0 10 20 30 40
−0.06
−0.04
−0.02
0
0.02
0.04
0.06
−40 −30 −20 −10 0 10 20 30 40
Rot
atio
n(◦
)
Applied Moment (Nmm per mm of joint)
Graph A
Test 1, Specimen 1Test 2, Specimen 1Test 3, Specimen 1Test 4, Specimen 1Test 5, Specimen 2Test 6, Specimen 2Test 7, Specimen 2Test 8, Specimen 2Test 9, Specimen 3
Test 10, Specimen 3Test 11, Specimen 3Test 12, Specimen 3Mean, y = 0.08355x
Mea
nT
ensi
leS
tres
s(N
/mm
2)
Applied Moment (Nmm per mm of joint)
Graph B
Figure 11: (Graph A) Rotation with respect to applied moment, measured 214 days aftercreation of the sealant joint, for each of the twelve test cases. (Graph B) Mean stress, averagedover the sealant-to-substrate surface area.
23
0
0.05
0.1
0.15
0.2
Tes
t1,
Day
14T
est
1,D
ay11
4T
est
1,D
ay21
4
Tes
t2,
Day
14T
est
2,D
ay11
4T
est
2,D
ay21
4
Tes
t3,
Day
14T
est
3,D
ay11
4T
est
3,D
ay21
4
Tes
t4,
Day
14T
est
4,D
ay11
4T
est
4,D
ay21
4
Tes
t5,
Day
14T
est
5,D
ay11
4T
est
5,D
ay21
4
Tes
t6,
Day
14T
est
6,D
ay11
4T
est
6,D
ay21
4
Tes
t7,
Day
14T
est
7,D
ay11
4T
est
7,D
ay21
4
Tes
t8,
Day
14T
est
8,D
ay11
4T
est
8,D
ay21
4
Tes
t9,
Day
14T
est
9,D
ay114
Tes
t9,
Day
214
Tes
t10
,D
ay14
Tes
t10
,D
ay11
4T
est
10,
Day
214
Tes
t11,
Day
14
Tes
t11
,D
ay114
Tes
t11
,D
ay21
4
Tes
t12
,D
ay14
Tes
t12
,D
ay11
4T
est
12,
Day
214
Rat
eof
Rot
ati
onw
rtA
pplied
Mom
ent
(Deg
rees
/N.m
mp
erm
mof
Sea
lant
Join
t)
Figure 12: The torsional resistances of three structural silicone sealant specimens, weremeasured in four different orientations (Table 1), after 14, 114 and 214 days. The experimentalresults are presented in this histogram. Rotational stiffnesses are the gradients of straight linesfitted to the test results shown in Figures 9, 10 and 11, and the units are degrees of rotationper N.mm of applied moment, per mm of axial length of sealant joint.
Material Tested Specimen Number Shore A Hardness
Min. Mean Max.
Structural sealant. 1 34 35.3 38
Structural sealant. 2 32 33.2 34
Structural sealant. 3 34 34.5 36
Glazing tape. 1 30 31.2 35
Glazing tape. 2 21 25.3 28
Glazing tape. 3 32 32.0 32
Table 2: Hardness of the DC-983 structural sealant samples, as well as the hardness ofthe glazing tape, measured with a Shore A indentation gauge 214 days after creating thespecimens.
24
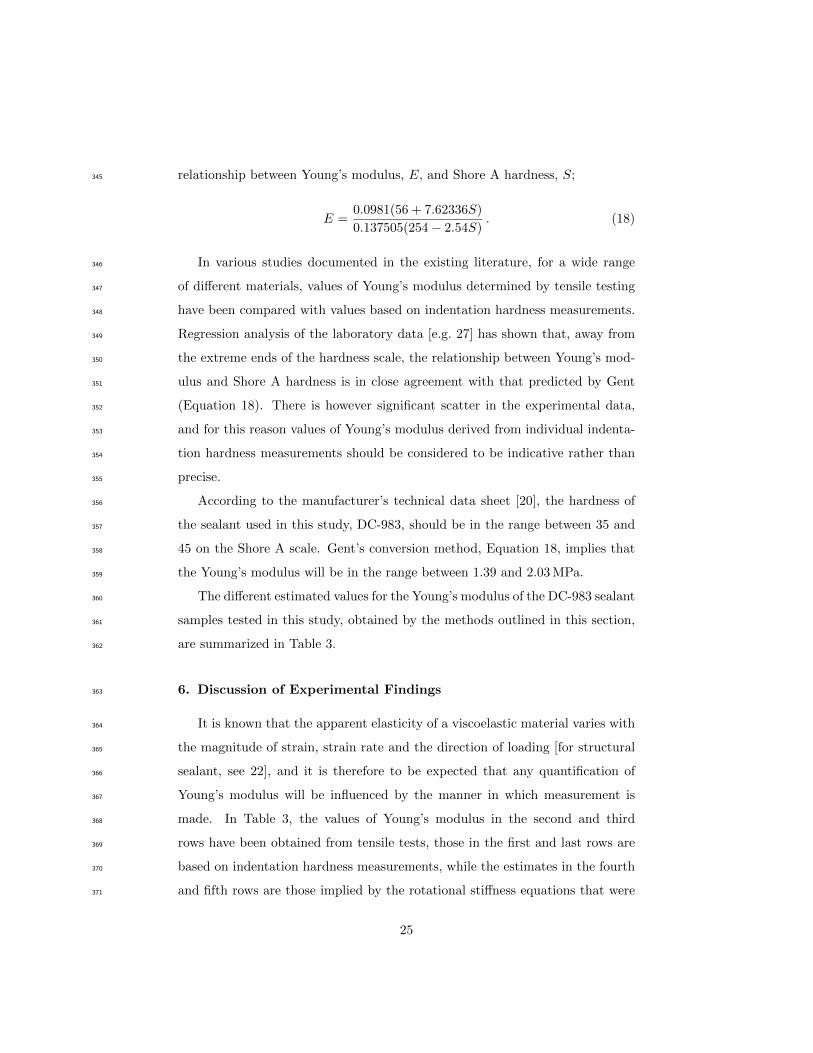
relationship between Young’s modulus, E, and Shore A hardness, S;345
E =0.0981(56 + 7.62336S)
0.137505(254− 2.54S). (18)
In various studies documented in the existing literature, for a wide range346
of different materials, values of Young’s modulus determined by tensile testing347
have been compared with values based on indentation hardness measurements.348
Regression analysis of the laboratory data [e.g. 27] has shown that, away from349
the extreme ends of the hardness scale, the relationship between Young’s mod-350
ulus and Shore A hardness is in close agreement with that predicted by Gent351
(Equation 18). There is however significant scatter in the experimental data,352
and for this reason values of Young’s modulus derived from individual indenta-353
tion hardness measurements should be considered to be indicative rather than354
precise.355
According to the manufacturer’s technical data sheet [20], the hardness of356
the sealant used in this study, DC-983, should be in the range between 35 and357
45 on the Shore A scale. Gent’s conversion method, Equation 18, implies that358
the Young’s modulus will be in the range between 1.39 and 2.03 MPa.359
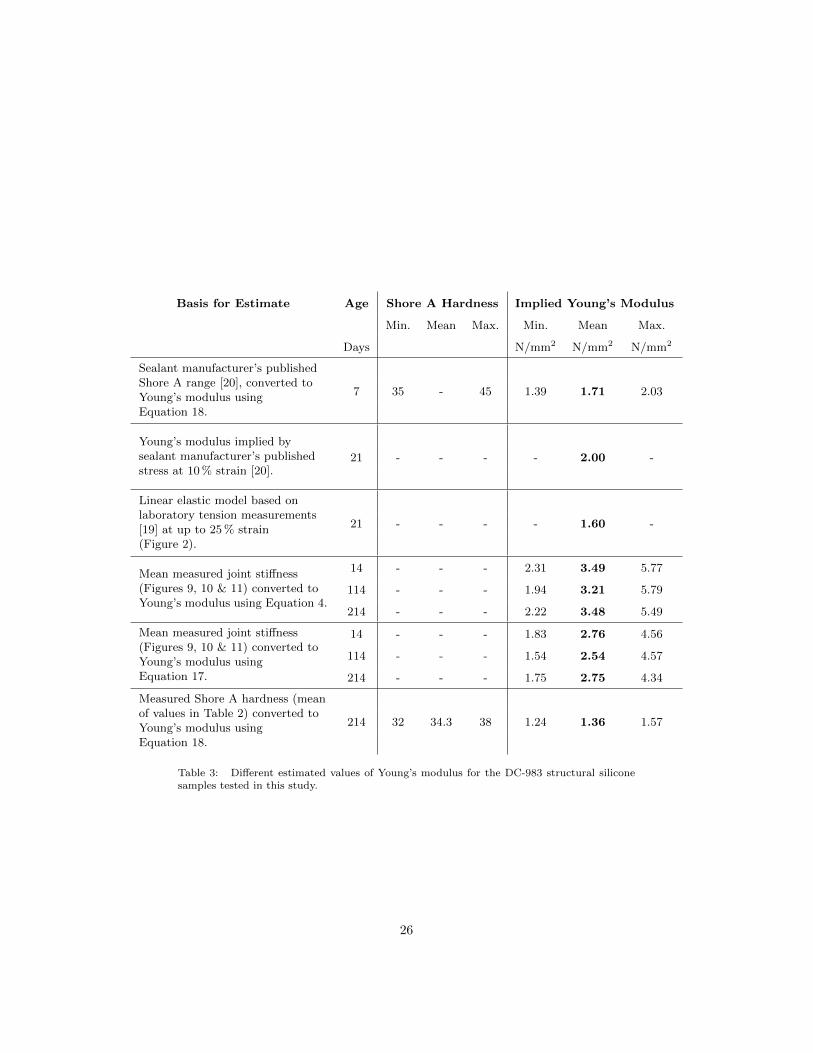
The different estimated values for the Young’s modulus of the DC-983 sealant360
samples tested in this study, obtained by the methods outlined in this section,361
are summarized in Table 3.362
6. Discussion of Experimental Findings363
It is known that the apparent elasticity of a viscoelastic material varies with364
the magnitude of strain, strain rate and the direction of loading [for structural365
sealant, see 22], and it is therefore to be expected that any quantification of366
Young’s modulus will be influenced by the manner in which measurement is367
made. In Table 3, the values of Young’s modulus in the second and third368
rows have been obtained from tensile tests, those in the first and last rows are369
based on indentation hardness measurements, while the estimates in the fourth370
and fifth rows are those implied by the rotational stiffness equations that were371
25
Basis for Estimate Age Shore A Hardness Implied Young’s Modulus
Min. Mean Max. Min. Mean Max.
Days N/mm2 N/mm2 N/mm2
Sealant manufacturer’s publishedShore A range [20], converted toYoung’s modulus usingEquation 18.
7 35 - 45 1.39 1.71 2.03
Young’s modulus implied bysealant manufacturer’s publishedstress at 10 % strain [20].
21 - - - - 2.00 -
Linear elastic model based onlaboratory tension measurements[19] at up to 25 % strain(Figure 2).
21 - - - - 1.60 -
Mean measured joint stiffness(Figures 9, 10 & 11) converted toYoung’s modulus using Equation 4.
14 - - - 2.31 3.49 5.77
114 - - - 1.94 3.21 5.79
214 - - - 2.22 3.48 5.49
Mean measured joint stiffness(Figures 9, 10 & 11) converted toYoung’s modulus usingEquation 17.
14 - - - 1.83 2.76 4.56
114 - - - 1.54 2.54 4.57
214 - - - 1.75 2.75 4.34
Measured Shore A hardness (meanof values in Table 2) converted toYoung’s modulus usingEquation 18.
214 32 34.3 38 1.24 1.36 1.57
Table 3: Different estimated values of Young’s modulus for the DC-983 structural siliconesamples tested in this study.
26
developed in Sections 2 and 3. Therefore it is true that, here, apples have not372
been compared with apples. However, the following observations can be made:373
(a) The behavioural model that underlies the estimates in the fourth row of374
Table 3, that is the basis for Equations 3 and 4, assumes that the relationship375
between stress and strain is the same whether the sealant is in tension or376
compression. The result of this simplification – that is to say, ignoring the377
increase in elastic modulus that occurs when the sealant is in compression378
– is an increase in the sealant’s apparent elastic modulus in tension.379
(b) Taking laboratory measurements of rotation with respect to moment, and380
finding the elastic moduli that are implied by the asymmetric tension-381
compression model that is the basis for Equation 16, leads to the val-382
ues shown in the fifth row. The mean of these implied elastic moduli is383
2.68 N/mm2, which is, in comparison to the elastic moduli obtained using384
Equations 3 and 4, closer to the value published by sealant manufacturer385
(2.00 N/mm2, in the second row of Table 3).386
As noted previously, the sealant samples were cured, stored, and tested in387
conditions ranging between 20◦C and 36◦C, and 65 % to 85 % relative humidity.388
This environment was therefore warmer and more humid than the reference389
conditions – a constant 25◦C and 50 % relative humidity – in which the sealant390
manufacturer’s own test specimens cured [20]. The manufacturer indicates [also391
20] that elevated temperatures do increase the rate of curing, but published392
test results [28, Table 1] suggest that the impact of the non-standard storage393
temperature and humidity upon the modulus of elasticity of this particular394
sealant, DC-983, is small. Also, it should be remembered that any deviation395
from the ideal laboratory conditions has been modest in comparison with the396
extremes that are experienced by structural sealants in service, where facade397
surface temperatures of -20◦C through +80◦C can be encountered.398
27
7. Validity of the Mathematical Model399
The rotation of an idealized structural sealant joint can be predicted using400
Equation 3. In this model, the relationship between stress and strain in the401
sealant is linear, and the glazing tape, shown in Figures 1-B, 1-D and 7, does402
not affect the moment resistance. It is worth revisiting these two premises in403
the light of the experimental findings.404
7.1. Variability of the Sealant’s Apparent Modulus of Elasticity405
The algebraic model presented in Section 2 is based upon the assumption406
that structural sealant obeys Hooke’s law. However, it has been noted already407
that actual stresses, measured in conditions of steadily increasing strain, differ408
from the linear-elastic ideal by around 9 % in the range of strain between zero409
and 25 %. Further deviation from the theoretical model is to be expected in410
service, where, in wind storms, the rate of change in pressure or the duration of411
load application might differ greatly from this study’s conditions. In addition,412
the material’s elastic modulus may be influenced by its cyclic loading history413
[29]. In short, a structural designer should be aware that the effective value414
of a structural sealant’s Young’s modulus may vary with factors such as age,415
temperature and loading history, and the range may be a large proportion of416
the mean. This is not to say, however, that a structural sealant cannot function417
effectively as a restraint for the metal member to which it is bonded.418
The mathematical representations of rotational resistance are based upon419
premises that are not perfectly consistent with each other. For example, in420
Section 3, the modulus of elasticity on the compressed side of joint is assumed421
to vary with glass rotation but, at the same time, it is assumed that elasticity422
at any given angle of rotation is constant within the triangular compression423
zone, even though strain varies in that region. There is therefore an element of424
arbitrariness in the formulation of the models. Rather than try to correct the425
inconsistencies or to create a more realistic and more complex model, a more426
practical approach might be to use an empirical constant to adjust the crude427
relationships, such as Equation 3, offered in Section2.428
28
7.2. Influence of Sealant Joint’s Cross Sectional Aspect Ratio429
Normally, when a piece of incompressible or partially compressible solid is430
stretched in one direction, there is a reduction in the area of its cross section431
in the perpendicular plane. This, of course, is Poisson’s effect. However, when432
sealant is bonded to a rigid substrate then, in the material adjacent to the433
contact surface, Poisson’s stresses are resisted by the adhesive connection. Be-434
cause changes in cross-sectional shape are inhibited in this way, in vicinity of435
the substrate, the sealant’s effective elasticity is reduced. Changing the shape436
of a sealant joint therefore effects the material’s apparent rigidity, Er. As the437
ratio of bite to glueline or, using the variable names shown in Figures 3 and 5,438
B/g, increases, so the sealant’s apparent rigidity will increase.439
The value of a sealant’s elastic modulus that is published by the product’s440
manufacturer is, commonly, determined by the ASTM C1135 method [18], using441
sealant specimens with a bite to glueline ratio of 1:1. Laboratory tests have442
shown [30, p. 42] that changing the joint’s aspect ratio from 1:1 to 2:1 “more than443
doubles” the apparent modulus of elasticity in a tensile test. Recently Descamps,444
Hayez and Chabih [31] studied the influence that aspect ratio has upon the445
rigidity of a particular, two-part, structural silicone sealant, DC-993, and they446
concluded that the relationship is described by the second order polynomial447
below;448
Er =
[0.1506
(B
g
)2
+ 0.3409B
g+ 1.0852
]E. (19)
The expressions for a sealant joint’s moment resistance, which were developed449
in Sections 2 and 3, can be modified to model the significance of joint shape450
by replacing Young’s modulus, E, with the effective rigidity of the sealant, Er,451
from Equation 19.452
The modulus of elasticity of the structural sealant used in this present453
study’s laboratory tests, DC-983, is similar to that of the product considered by454
Descamps et al. According to the technical data published by the manufacturer455
[32], the Shore A hardness of DC-993, measured after 7 days at 25◦C and 50 %456
relative humidity, is 40, while that of the DC-983 [20] tested in this investigation457
29
is in the range between 35 and 45. It might appear, therefore, that Equation 19458
could be applied to this current analysis. However, if the sealant’s modulus459
of elasticity is in the range between 1.36 and 2.0 MPa (see Table 3), then the460
modulus of rigidity of the joints tested in the laboratory (Section 4) will, from461
Equation 19, be in the range from 6.68 to 9.8 MPa. This range is well above462
the mean apparent value implied by the rotational stiffness test measurements,463
which is less than 3.5/,MPa (Table 3, row 4).464
It remains reasonable to argue that the apparent modulus of elasticity based465
on torsional rigidity measurement is greater than the modulus of elasticity in-466
ferred from indentation hardness measurements because the sealant joint sam-467
ples have a high bite to glueline ratio. However, Equation 19 was developed by468
Descamps and coauthors for the analysis of structural sealant joints in tension,469
and it appears to overestimate the rigidity of joint in which, as in this instance,470
the predominant load is torsion.471
7.3. The Influence of Glazing Tape472
The “glazing tape” adjacent to the sealant in the test specimens (see Fig-473
ures 1-D & 7) is an open-cell foam spacer, square in cross-section, with acrylic474
adhesive on the two sides in contact with the substrates. Its purpose is to475
maintain the required distance between the bonding surfaces while the sealant476
is being applied and while it is curing but, as is the usual practice in glazing477
systems, the tape was not subsequently removed from the joint.478
In the proposed mathematical models for the joint’s rotational stiffness, es-479
tablished in Sections 2 and 3, the glazing tape has been ignored. When the load480
applied to the test specimens caused tension in the sealant beside the glazing481
tape – during tests 3, 8 and 12 (see diagram in Table 1) – it was obvious from482
inspection that the tape’s adhesive held it to only one side of the joint, and the483
tape therefore played no part in the transfer of moment. This condition is out-484
lined in the left hand diagram of Figure 13. Conversely, during tests 4, 7 and 11,485
the glazing tape was placed in compression, in the manner shown in the right486
side of Figure 13. However, the test results do not show a consistent increase487
30
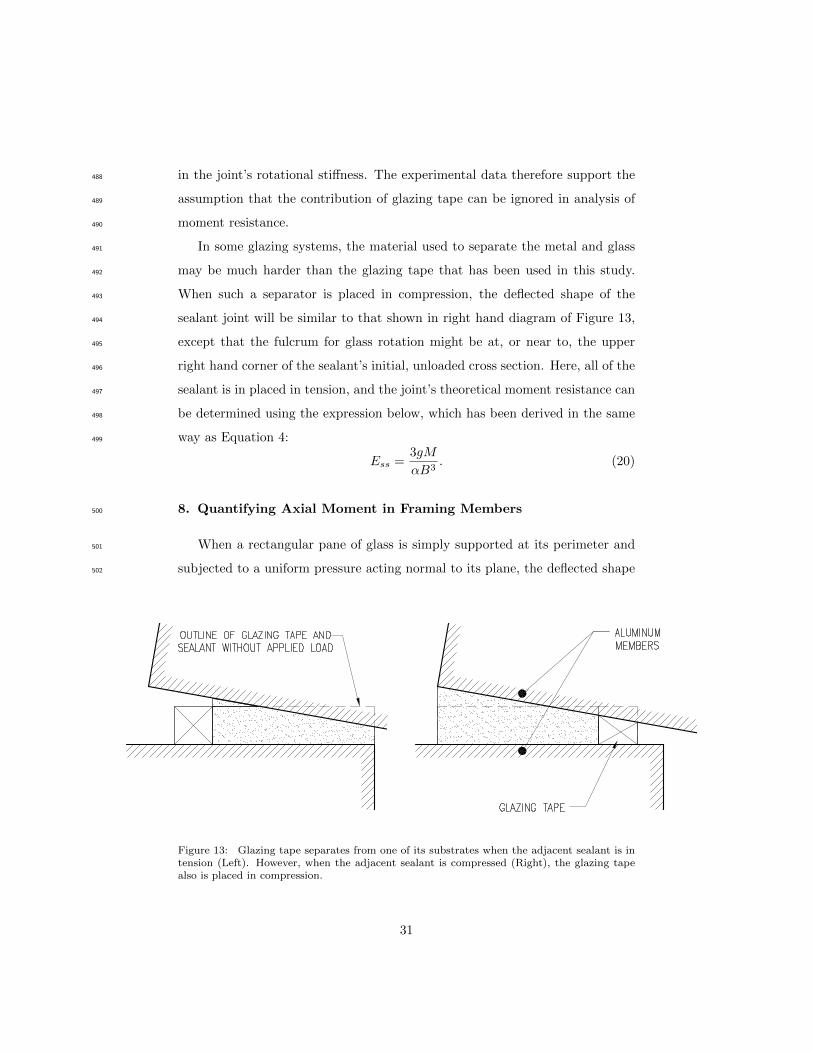
in the joint’s rotational stiffness. The experimental data therefore support the488
assumption that the contribution of glazing tape can be ignored in analysis of489
moment resistance.490
In some glazing systems, the material used to separate the metal and glass491
may be much harder than the glazing tape that has been used in this study.492
When such a separator is placed in compression, the deflected shape of the493
sealant joint will be similar to that shown in right hand diagram of Figure 13,494
except that the fulcrum for glass rotation might be at, or near to, the upper495
right hand corner of the sealant’s initial, unloaded cross section. Here, all of the496
sealant is in placed in tension, and the joint’s theoretical moment resistance can497
be determined using the expression below, which has been derived in the same498
way as Equation 4:499
Ess =3gM
αB3. (20)
8. Quantifying Axial Moment in Framing Members500
When a rectangular pane of glass is simply supported at its perimeter and501
subjected to a uniform pressure acting normal to its plane, the deflected shape502
Figure 13: Glazing tape separates from one of its substrates when the adjacent sealant is intension (Left). However, when the adjacent sealant is compressed (Right), the glazing tapealso is placed in compression.
31
of its surface, measured along any line parallel to an edge, is similar to one half503
period of a sinusoid [33, Equation 36] if the sides of the pane are not greatly504
different in length. It is to be noted that this approach will under-estimate edge505
rotations away from the centre of the sides of plates with higher aspect ratios506
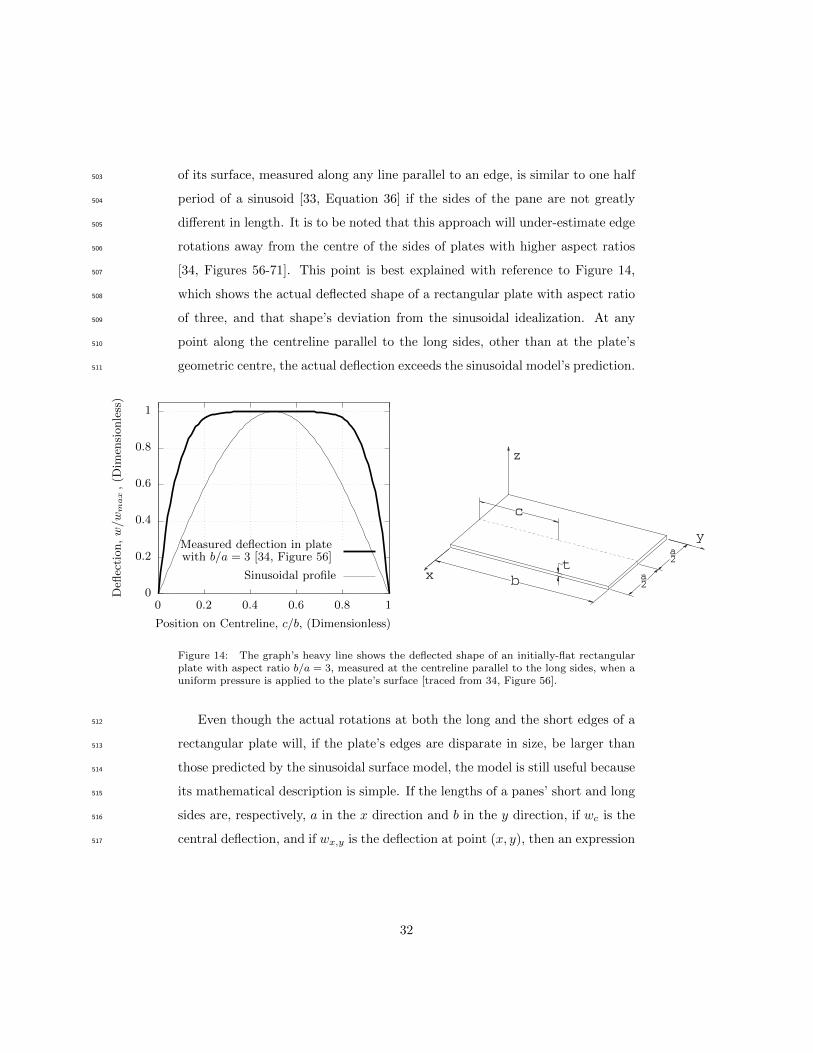
[34, Figures 56-71]. This point is best explained with reference to Figure 14,507
which shows the actual deflected shape of a rectangular plate with aspect ratio508
of three, and that shape’s deviation from the sinusoidal idealization. At any509
point along the centreline parallel to the long sides, other than at the plate’s510
geometric centre, the actual deflection exceeds the sinusoidal model’s prediction.511
0
0.2
0.4
0.6
0.8
1
0 0.2 0.4 0.6 0.8 1
Defl
ecti
on,w/w
max
,(D
imen
sionle
ss)
Position on Centreline, c/b, (Dimensionless)
Measured deflection in platewith b/a = 3 [34, Figure 56]
Sinusoidal profile
Figure 14: The graph’s heavy line shows the deflected shape of an initially-flat rectangularplate with aspect ratio b/a = 3, measured at the centreline parallel to the long sides, when auniform pressure is applied to the plate’s surface [traced from 34, Figure 56].
Even though the actual rotations at both the long and the short edges of a512
rectangular plate will, if the plate’s edges are disparate in size, be larger than513
those predicted by the sinusoidal surface model, the model is still useful because514
its mathematical description is simple. If the lengths of a panes’ short and long515
sides are, respectively, a in the x direction and b in the y direction, if wc is the516
central deflection, and if wx,y is the deflection at point (x, y), then an expression517
32
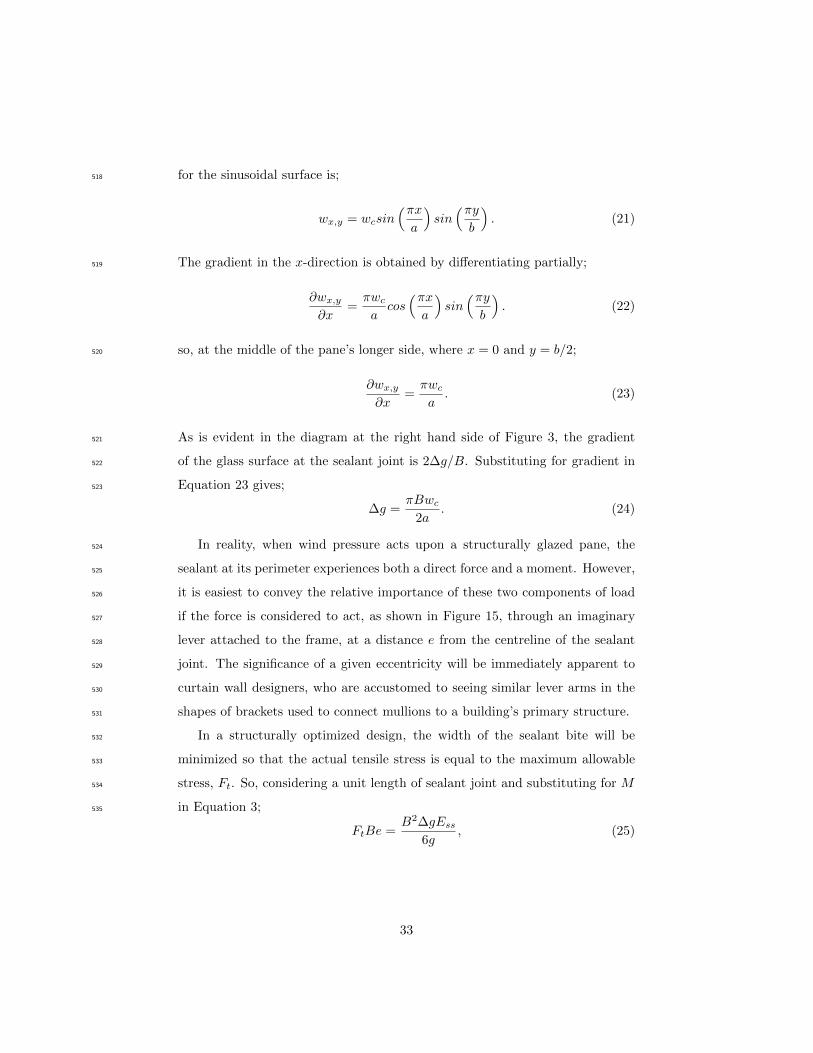
for the sinusoidal surface is;518
wx,y = wcsin(πxa
)sin(πyb
). (21)
The gradient in the x-direction is obtained by differentiating partially;519
∂wx,y
∂x=πwc
acos(πxa
)sin(πyb
). (22)
so, at the middle of the pane’s longer side, where x = 0 and y = b/2;520
∂wx,y
∂x=πwc
a. (23)
As is evident in the diagram at the right hand side of Figure 3, the gradient521
of the glass surface at the sealant joint is 2∆g/B. Substituting for gradient in522
Equation 23 gives;523
∆g =πBwc
2a. (24)
In reality, when wind pressure acts upon a structurally glazed pane, the524
sealant at its perimeter experiences both a direct force and a moment. However,525
it is easiest to convey the relative importance of these two components of load526
if the force is considered to act, as shown in Figure 15, through an imaginary527
lever attached to the frame, at a distance e from the centreline of the sealant528
joint. The significance of a given eccentricity will be immediately apparent to529
curtain wall designers, who are accustomed to seeing similar lever arms in the530
shapes of brackets used to connect mullions to a building’s primary structure.531
In a structurally optimized design, the width of the sealant bite will be532
minimized so that the actual tensile stress is equal to the maximum allowable533
stress, Ft. So, considering a unit length of sealant joint and substituting for M534
in Equation 3;535
FtBe =B2∆gEss
6g, (25)
33
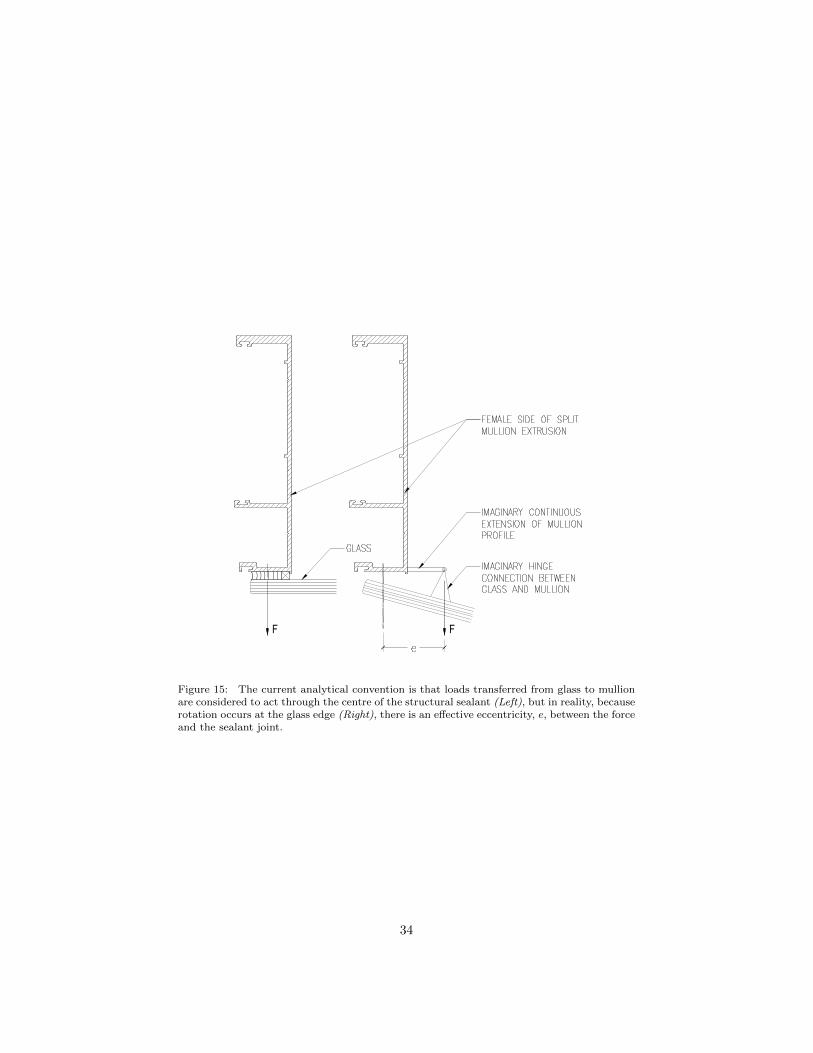
F F
Figure 15: The current analytical convention is that loads transferred from glass to mullionare considered to act through the centre of the structural sealant (Left), but in reality, becauserotation occurs at the glass edge (Right), there is an effective eccentricity, e, between the forceand the sealant joint.
34
then substituting for ∆g from Equation 24, and simplifying;536
e =πB2Esswc
12Ftag. (26)
In practice, the maximum allowable glass deflection is often specified as a pro-537
portion of the length of the pane’s shorter side. A limit commonly found in538
design codes and technical specifications for glazing – for example, the Aus-539
tralian design code for glass in buildings [35, Section 3.3.3] – is wc = a/60. At540
this deflection condition, Equation 26 becomes;541
e =πB2Ess
720Ftg. (27)
Typical numerical values can be assigned to the variables in Equation 27 in542
order to assess whether the magnitude of the turning moment – that imparted543
by the glass, through the structural sealant, to the glazing system’s metal frame544
– is of practical significance. Assuming that the structural sealant industry’s545
standard tensile stress limit is observed, Ft = 139 kPa [5, Section 27.5], and that546
the geometry and elastic modulus of the joint are similar to those in the samples547
that were tested in this study, with glueline g = 6 mm, bite B = 22.5 mm, and548
Ess = 4.0 MPa (see Table 3), then the eccentricity of the load, e, measured549
from the joint’s centreline, is 10.6 mm. The effect of the moment upon the550
glazing frame will of course depend upon the cross-sectional shape and span551
of the mullion profile, but it is probable that, in most cases, an eccentricity of552
this magnitude could safely be neglected by the framing designer. However,553
if the sealant’s elastic modulus were to be at the upper end of the range that554
has been observed in one-part structural silicones, say Ess = 20.0 MPa [e.g.555
17, Figure 6], then the value of e would be 53.0 mm. Such a large eccentricity556
certainly would concern the designer of a typical unitized curtain wall system557
with open, E-shaped mullion extrusions.558
35
9. Conclusions559
When wind load causes the glass or other sheet infill material at the face560
of a structurally glazed curtain wall to deflect, moments are induced about the561
longitudinal axes of the framing members.562
Using the analytical methods proposed in this paper, facade engineers can563
incorporate mathematical expressions – for a sealant joint’s rotational stiffness564
and, hence, for axial moment – in their structural models of curtain wall mul-565
lions. There are at least two practical incentives to do so. Firstly, it will be566
possible to identify, during the design process, cases in which excessive axial567
rotation of a proposed mullion extrusion would impair its non-structural func-568
tions, such as the effectiveness of its air seals. Secondly, if analysis shows that569
the torsional restraint provided by a sealant-to-glass connection is sufficient to570
prevent lateral torsional buckling, then there will be an opportunity to create571
framing members containing less aluminium than would be needed if the es-572
tablished structural design conventions were to be observed. For this second573
application, however, further research into the stability of structurally glazed574
members will be needed to demonstrate that they can be reliably restrained by575
structural sealant in the all of the conditions that might be experienced by the576
facades of real buildings.577
Data sets have been obtained by physical testing and the results show that,578
for any one sample sealant joint, the relationship between rotation and applied579
moment is practically linear. The variation between one sample and another580
is, however, considerable: in a population of sealant joints, one standard de-581
viation is approximately one third of the mean value. So, when estimating582
the magnitude of the moment transferred to the frame of a structurally glazed583
pane, a pragmatic approach will be to consider a range of values for the sealant584
joint’s stiffness. When establishing that range, it should be kept in mind that585
the variability in rotational stiffness of structural sealant joints in a real build-586
ing’s curtain wall panels will, because of normal batch-to-batch inconsistencies587
in the sealant properties, dimensional tolerances, differences in loading history588
36
and other factors, be greater than that observed in these tests, which have been589
carried out in relatively tightly controlled conditions.590
The hardness of this study’s sealant samples, measured by the indentation591
method (Table 3, last row), was found to lie within the range published by592
the sealant manufacturer (Table 3, first row). However, the mean value of593
this study’s laboratory measurements of rotational stiffness, when used with594
the simple mathematical model proposed in Section 2, suggests that the elastic595
modulus of the sealant samples (Table 3, fourth row) is approximately 70 %596
greater than the value published by the sealant manufacturer (Table 3, second597
row). The more refined behavioural model, laid out in Section 3, which acknowl-598
edges a difference between the sealant’s properties in tension and compression,599
also leads to a value of Young’s modulus that is an apparent overestimate: the600
computed value (Table 3, fifth row) is about 34 % greater than that indicated601
by the sealant manufacturer (Table 3, second row). Nonetheless, even if pre-602
dictions of rotational stiffness based upon this paper’s algebraic models are not603
in precise agreement with the laboratory results, the models are still useful to604
facade designers. Providing the analysis of an adhesive joint’s rotational stiff-605
ness will take into consideration a suitably wide range of possible values for the606
structural sealant’s elastic modulus, some degree of inaccuracy in the predictive607
model will not be of consequence.608
Others [17] have recorded a manyfold increase in the Young’s modulus of609
single-part structural silicone sealant, occurring during the months after the610
initial fortnight of curing. The DC-983 two-part sealant specimens prepared611
for this investigation were tested at 14, 114 and 214 days, but no significant612
change in modulus was observed. This observation shows that, at 14 days, the613
cross-linking of polymer chains within the sealant – the curing process – was614
complete or substantially complete.615
Using the formulae that have been presented in this paper, designers of616
curtain wall systems will be able to estimate quickly, without a requirement for617
numerical modelling, load eccentricities that are ignored in standard structural618
analyses. The information will be of greatest interest when the metal framing619
37
members to which structural glazing is to be applied are susceptible to rotation620
about their longitudinal axes – for example, if unsupported spans are long, and621
if the profiles have low torsional rigidity.622
10. Acknowledgements623
The authors are grateful to Mr. James Chant, Chairman of Seapac Philip-624
pines Inc., who provided the material samples used in these tests. Mr. Lawrence625
Carbary of Dow Corning reviewed a draft of this paper and made helpful com-626
ments. Staff of PTCC Facade Design, led by Engineer Warren Tan and Mr. Rene627
Ramiscal helped to commission the test rig and collect data. PTCC’s Mr. Jhun628
Fabrero transformed the authors’ hand sketches into CAD drawings.629
References630
[1] Yeomans D. The pre-history of the curtain wall 1998;14:59–82. URL:631
http://www.arct.cam.ac.uk/Downloads/chs/final-chs-vol.14/632
chs-vol.14-pp.59-to-82.pdf.633
[2] Abalos I, Herreros J. Tower and Office: From Modernist Theory to Con-634
temporary Practice. MIT Press; 2003. ISBN 0-262-01191-3.635
[3] Yeomans D. The origins of the modern curtain wall. APT Bulletin636
2001;32:13–8. URL: http://www.jstor.org/stable/1504688. doi:10.637
2307/1504688.638
[4] Murray S. Contemporary Curtain Wall Architecture. Princeton Architec-639
tural Press; 2009. ISBN 978-1-56898-797-2.640
[5] ASTM C1401. Standard Guide for Structural Silicone Sealant Glazing;641
2014. doi:10.1520/C1401-14.642
[6] American Architectural Manufacturers Association. Curtain Wall Design643
Guide Manual; 2005.644
38
[7] Watts A. Modern Construction Envelopes. 2 ed.; AMBRA — V; 2014.645
ISBN 978-3-99043-559-5.646
[8] Yuanda China Holdings Limited. Global Offering; 2011. URL:647
www.hkexnews.hk/listedco/listconews/sehk/2011/0420/02789_648
1057382/EWF114.pdf; (Document available from Hong Kong Stock649
Exchange).650
[9] Ziemaian RD, editor. Guide to Stability Design Criteria for Metal Struc-651
tures. 6 ed.; John Wiley & Sons; 2010. ISBN 978-0-470-08525-7.652
[10] Center For Window and Cladding Technology. Technical Update No. 7:653
Buckling of Curtain Wall Mullions; 2002.654
[11] Aluminum Association. Aluminum Design Manual; 2005.655
[12] Goco LT. Rationalizing assumptions for evaluating the lateral tor-656
sional buckling strength of aluminium mullion extrusions by EN1999657
and AA ADM. Master’s thesis; Bath University, UK; 2017. URL:658
https://www.bath.ac.uk/library/dissertations/index.php?659
programme=MSc+Architectural+Engineering%3A+Faade+Engineering.660
[13] Skejic D, Lukic M, Buljan N, Vido H. Lateral torsional buckling of split661
aluminium mullion. Key Engineering Materials 2016;710:445–50. doi:10.662
4028/www.scientific.net/KEM.710.445.663
[14] Clift CD, Austin WJ. Lateral buckling in curtain wall systems. Jour-664
nal of Structural Engineering 1989;115(10):2481–95. doi:10.1061/(ASCE)665
0733-9445(1989)115:10(2481).666
[15] Hammond G, Jones C. Embodied Carbon: The Inventory of Carbon and667
Energy (ICE). Bath University and BSRIA; 2011. ISBN 978 0 86022 703668
8.669
[16] Lee AD, Shepherd P, Evernden MC, Metcalfe D. Optimizing the architec-670
tural layouts and technical specifications of curtain walls to minimize use671
39
of aluminium. Structures 2017;13:8–25. doi:10.1016/j.istruc.2017.10.672
004.673
[17] Ramesh K, Tock RW, Narayan RS, Vallabhan CVG. Property evaluation674
of silicone elastomers used in tension-adhesion joints. Materials and Science675
Letters 1995;14:964–7. doi:10.1007/bf02427478.676
[18] ASTM C1135. Standard Test Method for Determining Tensile Adhesion677
Properties of Structural Sealants; 2015. doi:10.1520/C1135-15.678
[19] Kimberlain J, Carbary L, Clift CD, Hutley P. Advanced structural silicone679
glazing. International Journal of High-Rise Buildings 2013;2(4):345–54.680
[20] Dow Corning Corporation. Product Information: Dow Corning 983681
Structural Glazing Sealant; 2012. URL: http://www.dowcorning.com/682
content/publishedlit/63-1110.pdf; Dow Corning Form Number: 63-683
1110C-01.684
[21] Vallabhan CVG, Asik MZ. Analysis of structural glazing systems. Comput-685
ers and Structures 1997;65:231–9. doi:10.1016/S0045-7949(96)00284-2.686
[22] Wolf AT, Cleland-Host HL. Material properties for use in FEA modeling:687
Sealant behaviour with ambient laboratory climate aging. Journal of ASTM688
International 2004;1(7):372–84. doi:10.1520/JAI11603.689
[23] ASTM C661. Standard Test Method for Indentation Hardness of690
Elastomeric-Type Sealants by Means of a Durometer; 2011. doi:10.1520/691
C0661-06R11.692
[24] ASTM D2240. Standard Test Method for Rubber Property – Durometer693
Hardness; 2005. doi:10.1520/D2240-05R10.694
[25] Casa L, Mendichi R. Shore A hardness and thickness. Polymer Testing695
1986;7:165–75. doi:10.1016/0142-9418(87)90030-4.696
40
[26] Gent AN. On the relation between indentation hardness and Young’s mod-697
ulus. Rubber Chemistry and Technology 1958;31(4):896–906. doi:10.5254/698
1.3542351.699
[27] Larson K. Can You Estimate Modulus From Durometer Hardness700
for Silicones?; 2016. URL: http://www.dowcorning.com/content/701
publishedlit/11-3716-01_durometer-hardness-for-silicones.pdf;702
Dow Corning Form Number: 11-3716-01.703
[28] Tock RW. Temperature and moisture effects on the engineering properties704
of silicone sealants. In: O’Connor TF, editor. Building Sealants: Materi-705
als, Properties and Performance. ASTM STP 1069. American Society for706
Testing and Materials; 1990, p. 167–73. doi:10.1520/STP26803S.707
[29] Mullins L. Effect of stretching on the properties of rubber. Journal of708
Rubber Research 1947;16(12):275–89.709
[30] Schmidt CM, Schoenherr WJ, Carbary LD, Takish MS. Performance prop-710
erties of silicone structural adhesives. In: Parise CJ, editor. Science and711
Technology of Glazing Systems. American Society for Testing and Materi-712
als; 1989, p. 22–45. doi:10.1520/STP22987S.713
[31] Descamps P, Hayez V, Chabih M. Next generation calculation method714
for structural silicone joint dimensioning. Glass Structures & Engineering715
2017;2:169–82. doi:10.1007/s40940-017-0044-7.716
[32] Dow Corning Corporation. Product Information: Dow Corning 993717
Structural Glazing Sealant; 2011. URL: http://www.dowcorning.com/718
content/publishedlit/62-0918.pdf; Dow Corning Form Number: 62-719
0918L-01.720
[33] Wang D, El-Sheikh AI. Large deflection mathematical analysis of rectan-721
gular plates. Journal of Engineering Mechanics 2005;131:809–21. doi:10.722
1061/(ASCE)0733-9399(2005)131:8(809).723
41
[34] Head RN, Sechler EE. Normal Pressure Tests on Unstiffened724
Flat Plates; 1944. URL: https://ntrs.nasa.gov/search.jsp?R=725
19930086088; NACA Technical Note 943.726
[35] AS 1288. Glass in Buildings – Selection and Installation; 2006. URL:727
http://www.standards.org.au.728
42