Embed Size (px)
Citation preview
CrystEngComm
PAPER
Cite this: CrystEngComm, 2021, 23,
4648
Received 23rd February 2021,Accepted 8th June 2021
DOI: 10.1039/d1ce00264c
rsc.li/crystengcomm
Measuring the end-face of silicon boules usingmid-infrared laser scanning
Mathias Novik Jensen and Olav Gaute Hellesø *
Laser scanning is investigated to measure the deflection of the crystal–melt interface during Czochralski-
growth of silicon. A mid-infrared laser is used to take advantage of the IR-transparency of silicon. The
method is tested at room temperature on the end-face of three crystal-samples prematurely separated
from the melt (‘body-pops’). For these samples, the end-face closely resembles the crystal–melt interface
during crystal growth. The laser beam is sent through the crystal boule and detected on the far side,
depending on whether it is reflected by the end-face or not. Two scanning methods are tested, one
assuming no reflection, i.e. direct transmission, and the second assuming reflection by the end-face, with
triangulation used to find the end-face deflection. The transmission scan distinguished the end-face from
other changes in transmission in >87% of measurement points along the samples, with the resolution
determined by the step-size used (1 mm). The end-face reflection method only worked for two of the
three samples, with a mean error of ≤0.3 mm and a standard deviation of ≤0.8 mm. This is sufficient to
distinguish normal from abnormal end-face deflections. Challenges for in situ implementation of the
methods are discussed.
1 Introduction
In the production of monocrystalline silicon via theCzochralski-process, a seed crystal is lowered into a cruciblecontaining the molten silicon. The liquid material of the meltthen adheres to the seed crystal due to capillary forces and,due to the relatively low temperature of the seed, crystallizesas part of the same crystalline structure as the seed. The seedis then slowly retracted from the melt, causing thecrystallization front (the crystal–melt interface) to remainstationary while a growing crystal is “pulled” from the melt,as shown in Fig. 1, eventually producing a silicon boule. Theshape and deflection of the crystal–melt interface has beenshown in the works of Noghabi et al.,1 Shiraishi et al.2 andPopescu et al.3 to be dependent on multiple factors, includingboule and crucible rotation, and with a strong dependence onthe temperature gradient near the interface. As investigatedby Jiptner et al.,4 the magnitude and nature of thetemperature gradient has a causal link to the development ofthermal stress-induced crystal dislocations resulting in lowercrystal quality. This implies a correlation between thedeflection h of the interface (Fig. 1) and the likelihood of thegrown crystal having reduced quality due to high dislocationdensity. A method for process-monitoring of the deflectionwould thus be a valuable tool for improving the quality and
reduce the cost of high quality Czochralski-grown silicon,which is the main method for making crystalline silicon forthe large, silicon-based, electronics and nanotechnologyindustries.
A few systems for measuring the interface geometryduring Czochralski-growth have been proposed previously.Kakimoto et al.5 used X-ray radiography to form lateralimages of the boule near the interface. A system developedby Zhu et al.,6,7 focused on the electro-chemical mechanismsof crystallization in Czochralski-growth of lithium niobate toindirectly measure the interface deflection. The methods ofKakimoto et al. and Zhu et al. have been experimentallytested in small-scale Czochralski-growth and showedencouraging results, but have not yet been implemented inlarge-scale production. A reason for this is that both methodsrequire significant alteration of the hardware of the commonCzochralski-furnace. Another method, suggested by Dinget al.,8 employs a thermal model of the crystal to find therelationship between the temperature distribution and theinterface deflection. Thus, by taking point measurements ofthe surface temperature of the boule, the deflection can befound. This method is relatively easy to implement, but themodel relies on certain assumptions being valid. This makesthe method vulnerable to changes in factors that are not wellaccounted for, such as variations in melt flow conditions andthermal properties due to contamination.
We propose a system, as shown in Fig. 1, using laserscanning9,10 and triangulation10 to detect the pseudo-
4648 | CrystEngComm, 2021, 23, 4648–4657 This journal is © The Royal Society of Chemistry 2021
Department of Physics and Technology, UiT The Arctic University of Norway, 9037
Tromsø, Norway. E-mail: [email protected]
Ope
n A
cces
s A
rtic
le. P
ublis
hed
on 0
9 Ju
ne 2
021.
Dow
nloa
ded
on 1
2/12
/202
1 5:
24:4
1 A
M.
Thi
s ar
ticle
is li
cens
ed u
nder
a C
reat
ive
Com
mon
s A
ttrib
utio
n-N
onC
omm
erci
al 3
.0 U
npor
ted
Lic
ence
.
View Article OnlineView Journal | View Issue
CrystEngComm, 2021, 23, 4648–4657 | 4649This journal is © The Royal Society of Chemistry 2021
parabolic interface1 and measure its deflection. Lasertriangulation has been employed for various applications11
and is a mature technique for precision measurement ofsurface features in industrial applications.12 In this system, amid-infrared laser is used to exploit the relatively low opticalabsorption of silicon13 for photon energies below its bandgap energy. Due to the high temperatures near the melt, andthe necessity of the funnel assembly, a pair of reflectors mustbe used to relay the beam, as shown in Fig. 1. In this article,a simplified version of the system is tested at roomtemperature, omitting these reflectors (see Fig. 2). Threecrystal-samples prematurely separated from the melt (‘body-pops’) are used. For these boules, the end-face closelyresembles the crystal–melt interface during crystal growthand the deflection of the end-face is the same as when theyseparated from the melt.
Two methods are investigated to measure the deflection ofthe end-face, both based on sending a laser beam through thecentre of the boule and detecting it on the far side. The firstmethod scans through the boule and finds the apex of theend-face, and thereby the deflection, as the position wherethe transmission decreases due to obstruction of the beam bythe end-face. Whereas the first method assumes no reflectionfrom the end-face, the second method relies on pointing the
beam onto the end-face where it is reflected, and using lasertriangulation to find the deflection based on the positionsand angles of the laser and the detector. We will refer to thetwo methods as transmission scan and end-face reflection,respectively. Based on experimental results obtained withsilicon boules at room temperature, it is discussed how thesystem and the two methods can be adapted to provide real-time process monitoring of the crystal–melt interface duringthe production of silicon boules.
2 Measurement principles andmethods2.1 Choice of wavelength
Laser scanning using a wavelength in the mid-infrared isproposed to take advantage of the relatively low opticalabsorption of light for photon energies below the intrinsicband gap energy of silicon. The indirect band gap energy ofsilicon can be approximated using a semi-empiricalexpression:14
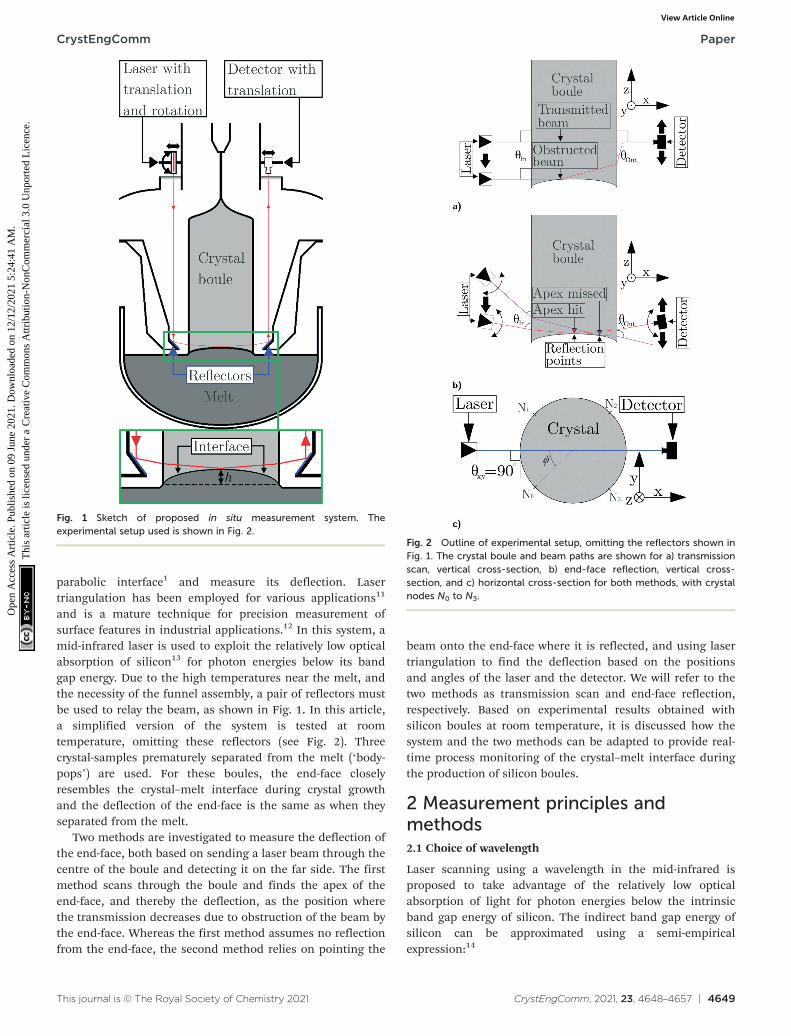
Fig. 1 Sketch of proposed in situ measurement system. Theexperimental setup used is shown in Fig. 2.
Fig. 2 Outline of experimental setup, omitting the reflectors shown inFig. 1. The crystal boule and beam paths are shown for a) transmissionscan, vertical cross-section, b) end-face reflection, vertical cross-section, and c) horizontal cross-section for both methods, with crystalnodes N0 to N3.
CrystEngComm Paper
Ope
n A
cces
s A
rtic
le. P
ublis
hed
on 0
9 Ju
ne 2
021.
Dow
nloa
ded
on 1
2/12
/202
1 5:
24:4
1 A
M.
Thi
s ar
ticle
is li
cens
ed u
nder
a C
reat
ive
Com
mon
s A
ttrib
utio
n-N
onC
omm
erci
al 3
.0 U
npor
ted
Lic
ence
.View Article Online
4650 | CrystEngComm, 2021, 23, 4648–4657 This journal is © The Royal Society of Chemistry 2021
EG Tð Þ ¼ EG 0ð Þ þ AT2
T þ B; (1)
with EG(0) = 1.1692 eV, A = −4.9 ± 0.2 × 10⁻⁴ eV K−1 and B =655 ± 40 K.15 Near the melting temperature of 1687 K, thisgives an approximate intrinsic band gap energy of EG = 0.58 ±0.04 eV, corresponding to a wavelength of λG = 2.2 ± 0.2 μm.Based on this, a wavelength of λ = 2.55 μm is used in thiswork, such that intrinsic band-to-band absorption isnegligible.13 Absorption can still occur for photon energieslower than the band gap, primarily through free carrier statesemerging from thermal excitation and the dopants inextrinsic silicon. The work of Schroder et al.16 has exploredthis, but only up to a temperature of 300 K. The significanceof this absorption is therefore not known for temperaturesapproaching the melting temperature of 1687 K, and must beinvestigated further before testing of the system duringcrystal growth.
2.2 Transmission scan
For the transmission scan method, the angle of incidencebetween the laser beam and boule sidewall is fixed andaligned to be orthogonal to the surface of the boule, asshown in Fig. 2. Note that the reflecting mirrors affixed tothe funnel above the melt, shown in Fig. 1, are not includedin the experimental setup. A beam transmitted through thecylindrical section of the boule (the “body”), above the end-face, will pass unobstructed through the bulk material, whilea beam intersecting the end-face will be reflected by the end-face, giving a sharp drop in transmission as the beam fallsoutside the detector's cone of acceptance. The deflection h ofthe end-face can be determined by varying the z-position ofthe laser, looking for the drop in transmission.
The direct transmission, i.e. for smooth entrance and exitsurfaces, no obstruction by the end-face and no internalscattering, can be calculated from the absorption and therefractive index of crystalline silicon. Given the findings ofSchroder et al.16 and a manufacturer specified dopant (boron)concentration, increasing from 1.45 × 10¹⁶ atoms per cm3 atthe top to 2.8 × 10¹⁶ atoms per cm3 at full length (>1500mm), the estimated absorption coefficient is α ̂ = 0.21 ± 0.07cm−1 for the entire length and λ = 2.55 μm. Factoring in thereflection upon entering and exiting the boule, assumingnormal angle of incidence on a planar surface and arefractive index of 3.44 at 300 K,17 the estimatedtransmission through a 210 mm diameter boule is −22 ± 6dB. The large uncertainty is due to the variation in doping. Aboule has four nodes given by the crystal structure, visible asridges along the growth direction. It is expected that thesenodes and growth striation in the boule will give a variationin the transmission as a function of the rotation angle (seeFig. 2c). This is not reflected by the calculated transmissionand was investigated experimentally.
The aim of the transmission scan is to find the positionwhere the transmission decreases due to intersection of the
beam and the end-face. To validate the method, the entirelength of the boule is scanned, giving a graph of thetransmission through the centre of the boule. This may showchanges in transmission due to defects, either on the surfaceor internally, which may disturb the detection of the end-face. The scan is performed by moving the laser to a position,scanning the detector around that position to find thetransmitted beam, before moving the laser to the nextposition. For each laser position, the detector is first swept athigh speed (8 mm s−1) over its entire travel range, whilecontinuously sampling at the maximum rate (24 kHz) of thedata-acquisition card. The peak response and itscorresponding detector position is found from the smootheddata (see Fig. 3), and subsequently verified and refined by anarrow sweep around the detected peak at a reduced speed.The transmission is determined from the peak response, theresponsivity (9.2 V mW−1) of the detector/DAQ-system and theopen-air transmission of −2.9 dB measured duringcalibration. Due to significant high-frequency noise in thedetector and its amplifier, the raw signal is filtered by a 120-point moving mean filter. A different filtering method is usedto remove the noise for the end-face reflection method, seenext paragraph.
2.3 End-face reflection
The end-face reflection method (Fig. 2b) uses a beam, withan oblique angle of incidence in the xz-plane, that isrefracted as it enters the boule, reflected internally from theend-face and again refracted as it exits the boule. By knowingthe angles and positions of the entering and exiting beams,as well as the refractive index of the crystal, the position ofthe reflection point on the end-face (in the xz-plane) can bedetermined by triangulation. This is illustrated in Fig. 2b fora beam hitting the apex at the centre of the end-face and an(exaggerated) beam hitting off the centre.
The transmission can be calculated as for thetransmission scan by taking into account the oblique angleof incidence and the reflection coefficient at the end-face.Due to the high refractive index and relatively low angles of
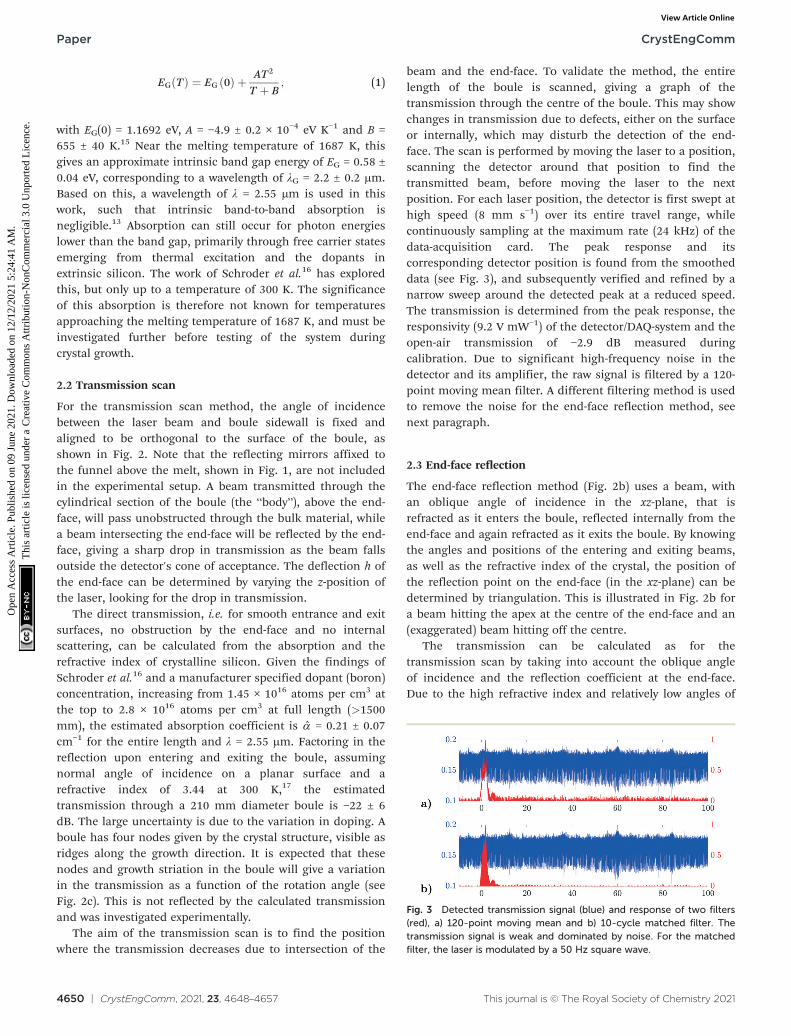
Fig. 3 Detected transmission signal (blue) and response of two filters(red), a) 120-point moving mean and b) 10-cycle matched filter. Thetransmission signal is weak and dominated by noise. For the matchedfilter, the laser is modulated by a 50 Hz square wave.
CrystEngCommPaper
Ope
n A
cces
s A
rtic
le. P
ublis
hed
on 0
9 Ju
ne 2
021.
Dow
nloa
ded
on 1
2/12
/202
1 5:
24:4
1 A
M.
Thi
s ar
ticle
is li
cens
ed u
nder
a C
reat
ive
Com
mon
s A
ttrib
utio
n-N
onC
omm
erci
al 3
.0 U
npor
ted
Lic
ence
.View Article Online
CrystEngComm, 2021, 23, 4648–4657 | 4651This journal is © The Royal Society of Chemistry 2021
incidence (≈15°), the beam makes a small angle (≈4.3°) withthe x-axis inside the boule. This results in a very smallincrease (≈0.6 mm) in path length inside the boulecompared to the normal incidence for the transmission scan.The small angle of the refracted beam results in a large angleof incidence (≈85.7°) with the end-face near its apex, wellabove the critical angle (16.9° for silicon/air). The beam isthus totally internally reflected by the end-face. Using theFresnel-equations (assuming TE-polarization) and the smallincrease in path-length and thus absorption, the expectedtransmission is just 3.5% lower than for the transmissionscan, also giving an estimated total transmission of −22 ± 6dB.
The optical properties of melted silicon resemble those ofa metal.18 Thus, with air replaced by melted silicon as theadjoining material, the reflection coefficient is expected to behigh, comparable to that for total internal reflection. Oursetup thus resembles the in situ situation regarding reflectionfrom the end-face.
The end-face reflection method relies on hitting the apexof the end-face with the laser and detect the reflected beam.A complete scan-procedure would thus have four variables,with positions and angles for both the laser and the detector.To simplify the problem, we chose to set the detector(manually) to a specified angle, while an algorithm attemptsto find a combination of laser angle, laser position, anddetector position to hit the apex and detect the reflectedbeam.
The loss for the beam reflected from the end-face wasfound to be significantly higher than for the transmissionscan, giving a poor signal-to-noise ratio. This can be due tosurface irregularities giving increased loss for the obliqueangle of incidence, small and concave area for reflection andpoor beam-capture by the detector. To enhance the signal-to-noise ratio, the moving-mean filter was replaced by a 50 Hzsquare wave modulation of the laser and a complementarymatched filtering of the detector signal. The matched filter isdefined by:
f ¼ 1ffiffiffiffiffiffiffiffiffiffiffiffiffiffiffiffiSHR − 1
n Sp R − 1
n S: (2)
Since the absolute amplitude of the signal is irrelevant andthe covariance matrix Rn of the noise is assumed time-invariant, the filter is implemented as a set number of cyclesof the time-reversed modulation signal S. This gave a signal-to-noise ratio of 11.5 dB for the example case, which is asignificant improvement compared to the moving mean (6.1dB), as shown in Fig. 3.
The search-algorithm assumes a parabolic end-face withan initial guess for the deflection at the apex. Given thedetector half-cone angle of 1.4° and a refractive index 3.44(ref. 17) for silicon, a “hit” must be on a portion of the end-face with a surface normal less than 0.4° from the z-axis to becaptured. As this angle is small, the triangulation algorithmconsiders the end-face apex to be flat and orthogonal to thesidewalls when calculating the reflection points.
The algorithm acquires a set of measurements through aseries of trials designed to make the beam intersect the end-face apex where each trial consists of a unique combinationof angles and positions for both laser and detector. The setof trials is arranged into a set of four nested subsets:
1. Detector angle• A set of manually set detector angles.
2. Laser angle• For each detector angle, a discrete set of laser anglesin a narrow range surrounding the detector angle.
3. Laser position• A set of laser positions surrounding the estimated laserposition required to hit the end-face apex given byentering each detector/laser angle combination andcurrent best estimate of the deflection into thetriangulation formula.
4. Detector position• A narrow, continuous sweep around the expectedbeam exit position given by the triangulation formulaand each of the preceding variables.
Each trial then returns either a negative (“miss”) or apositive (“hit”) giving the combination resulting in an actualbeam intersecting the end-face apex.
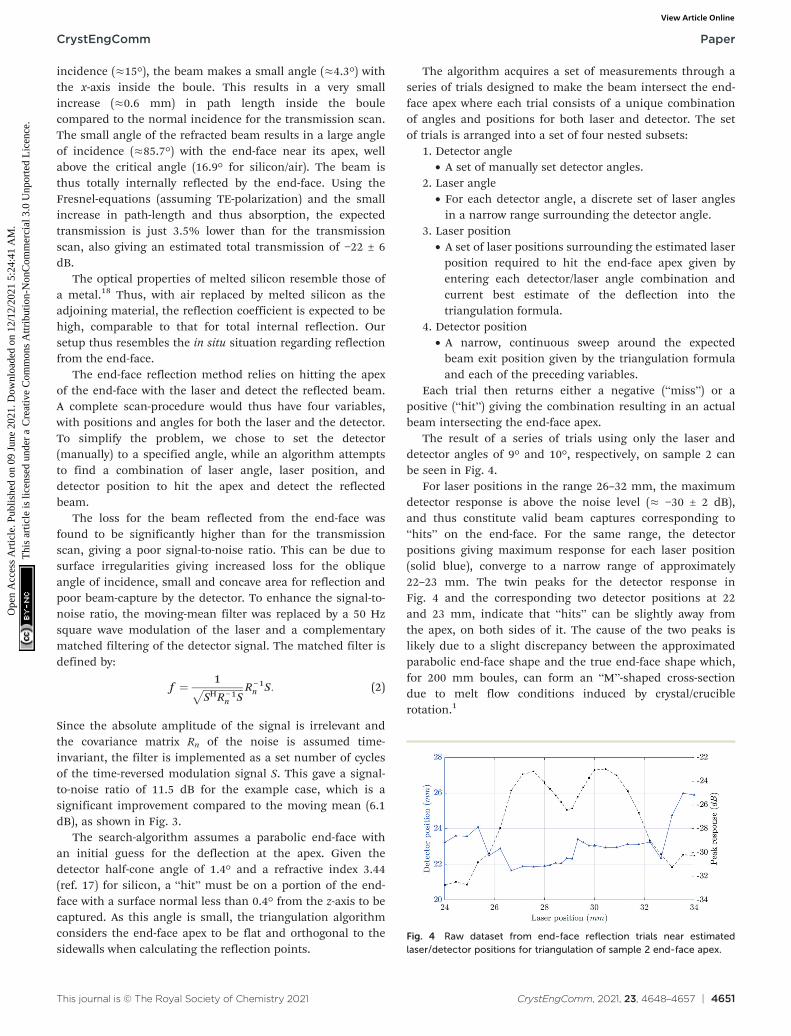
The result of a series of trials using only the laser anddetector angles of 9° and 10°, respectively, on sample 2 canbe seen in Fig. 4.
For laser positions in the range 26–32 mm, the maximumdetector response is above the noise level (≈ −30 ± 2 dB),and thus constitute valid beam captures corresponding to“hits” on the end-face. For the same range, the detectorpositions giving maximum response for each laser position(solid blue), converge to a narrow range of approximately22–23 mm. The twin peaks for the detector response inFig. 4 and the corresponding two detector positions at 22and 23 mm, indicate that “hits” can be slightly away fromthe apex, on both sides of it. The cause of the two peaks islikely due to a slight discrepancy between the approximatedparabolic end-face shape and the true end-face shape which,for 200 mm boules, can form an “M”-shaped cross-sectiondue to melt flow conditions induced by crystal/cruciblerotation.1
Fig. 4 Raw dataset from end-face reflection trials near estimatedlaser/detector positions for triangulation of sample 2 end-face apex.
CrystEngComm Paper
Ope
n A
cces
s A
rtic
le. P
ublis
hed
on 0
9 Ju
ne 2
021.
Dow
nloa
ded
on 1
2/12
/202
1 5:
24:4
1 A
M.
Thi
s ar
ticle
is li
cens
ed u
nder
a C
reat
ive
Com
mon
s A
ttrib
utio
n-N
onC
omm
erci
al 3
.0 U
npor
ted
Lic
ence
.View Article Online
4652 | CrystEngComm, 2021, 23, 4648–4657 This journal is © The Royal Society of Chemistry 2021
The corresponding reflection point (xz-plane) anddeflection for each “hit” is determined through triangulation(accounting for refraction). The value found for the deflectionis used to update the trial values for the angles and positionsfor subsequent scans. The aim of this iterative approachis that successful trials will improve the “hit”-rate ofsubsequent trials, thereby producing converging results.
2.4 Samples and experimental setup
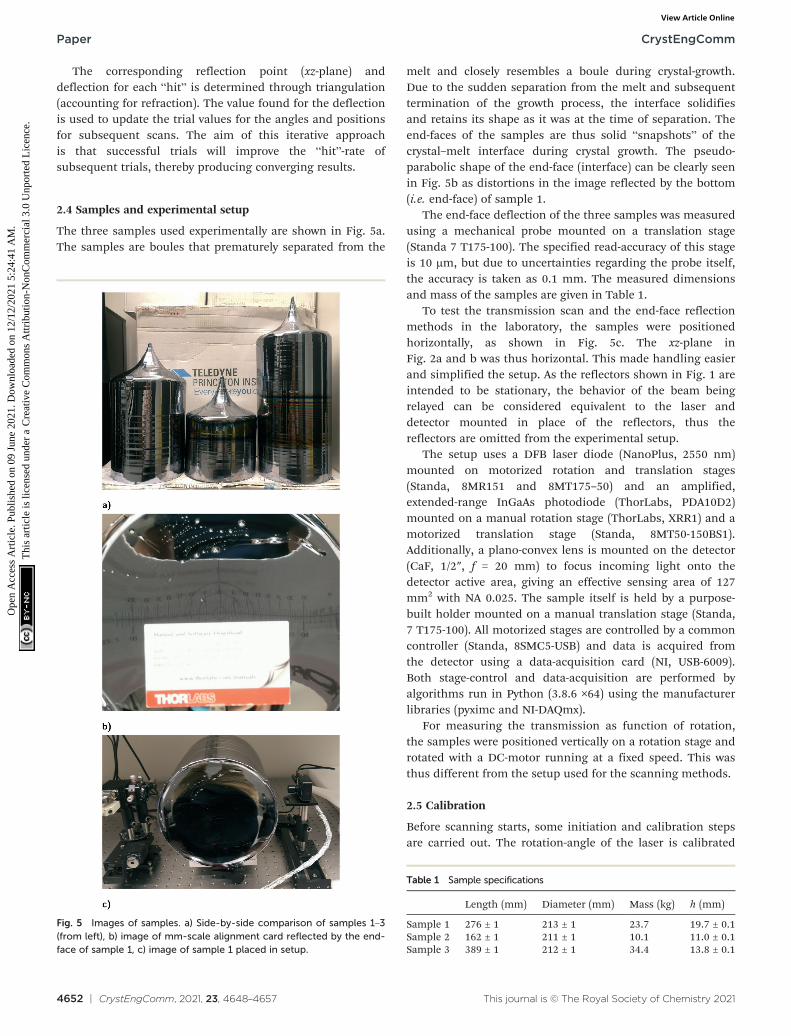
The three samples used experimentally are shown in Fig. 5a.The samples are boules that prematurely separated from the
melt and closely resembles a boule during crystal-growth.Due to the sudden separation from the melt and subsequenttermination of the growth process, the interface solidifiesand retains its shape as it was at the time of separation. Theend-faces of the samples are thus solid “snapshots” of thecrystal–melt interface during crystal growth. The pseudo-parabolic shape of the end-face (interface) can be clearly seenin Fig. 5b as distortions in the image reflected by the bottom(i.e. end-face) of sample 1.
The end-face deflection of the three samples was measuredusing a mechanical probe mounted on a translation stage(Standa 7 T175-100). The specified read-accuracy of this stageis 10 μm, but due to uncertainties regarding the probe itself,the accuracy is taken as 0.1 mm. The measured dimensionsand mass of the samples are given in Table 1.
To test the transmission scan and the end-face reflectionmethods in the laboratory, the samples were positionedhorizontally, as shown in Fig. 5c. The xz-plane inFig. 2a and b was thus horizontal. This made handling easierand simplified the setup. As the reflectors shown in Fig. 1 areintended to be stationary, the behavior of the beam beingrelayed can be considered equivalent to the laser anddetector mounted in place of the reflectors, thus thereflectors are omitted from the experimental setup.
The setup uses a DFB laser diode (NanoPlus, 2550 nm)mounted on motorized rotation and translation stages(Standa, 8MR151 and 8MT175–50) and an amplified,extended-range InGaAs photodiode (ThorLabs, PDA10D2)mounted on a manual rotation stage (ThorLabs, XRR1) and amotorized translation stage (Standa, 8MT50-150BS1).Additionally, a plano-convex lens is mounted on the detector(CaF, 1/2″, f = 20 mm) to focus incoming light onto thedetector active area, giving an effective sensing area of 127mm2 with NA 0.025. The sample itself is held by a purpose-built holder mounted on a manual translation stage (Standa,7 T175-100). All motorized stages are controlled by a commoncontroller (Standa, 8SMC5-USB) and data is acquired fromthe detector using a data-acquisition card (NI, USB-6009).Both stage-control and data-acquisition are performed byalgorithms run in Python (3.8.6 ×64) using the manufacturerlibraries (pyximc and NI-DAQmx).
For measuring the transmission as function of rotation,the samples were positioned vertically on a rotation stage androtated with a DC-motor running at a fixed speed. This wasthus different from the setup used for the scanning methods.
2.5 Calibration
Before scanning starts, some initiation and calibration stepsare carried out. The rotation-angle of the laser is calibrated
Table 1 Sample specifications
Length (mm) Diameter (mm) Mass (kg) h (mm)
Sample 1 276 ± 1 213 ± 1 23.7 19.7 ± 0.1Sample 2 162 ± 1 211 ± 1 10.1 11.0 ± 0.1Sample 3 389 ± 1 212 ± 1 34.4 13.8 ± 0.1
Fig. 5 Images of samples. a) Side-by-side comparison of samples 1–3(from left), b) image of mm-scale alignment card reflected by the end-face of sample 1, c) image of sample 1 placed in setup.
CrystEngCommPaper
Ope
n A
cces
s A
rtic
le. P
ublis
hed
on 0
9 Ju
ne 2
021.
Dow
nloa
ded
on 1
2/12
/202
1 5:
24:4
1 A
M.
Thi
s ar
ticle
is li
cens
ed u
nder
a C
reat
ive
Com
mon
s A
ttrib
utio
n-N
onC
omm
erci
al 3
.0 U
npor
ted
Lic
ence
.View Article Online
CrystEngComm, 2021, 23, 4648–4657 | 4653This journal is © The Royal Society of Chemistry 2021
such that at 0°, the laser beam is perpendicular to thetranslation axis of the sample holder. The position along thez-axis for the laser (Fig. 2a and b) is set to 0 mm with thetranslation-stage at the end-position. The detector referenceposition is subsequently aligned with the laser, such that adetector position of 0 mm optimally captures a beam fromthe laser at position 0 mm. The laser and detector zero-positions are automatically calibrated at the beginning ofeach scan. The maximum open-air transmission (i.e. beamnot intersecting the sample) was measured by optimallyaligning the detector and laser and found to be 51% (−2.9dB), this loss is likely due to misalignment resulting inoverfilling of the detector. This measurement was carried outfor a laser-power not saturating the detector, while maximumlaser power was used for transmission through the samples.
Upon placing the sample in the setup, the height (y-axis ofFig. 2a and b) of the laser is manually adjusted such that thebeam intersects the boule at its widest point, giving normalangle of incidence as shown in Fig. 2c. The height of thedetector is then adjusted to match that of the laser bymaximizing the measured open-air transmission. Lastly, thesample z-position is calibrated such that the lowermost edge(end-face side) obscures 50% of the beam for a laser positionof 0 mm and angle 0°.
3 Experimental results and discussion3.1 Transmission scan
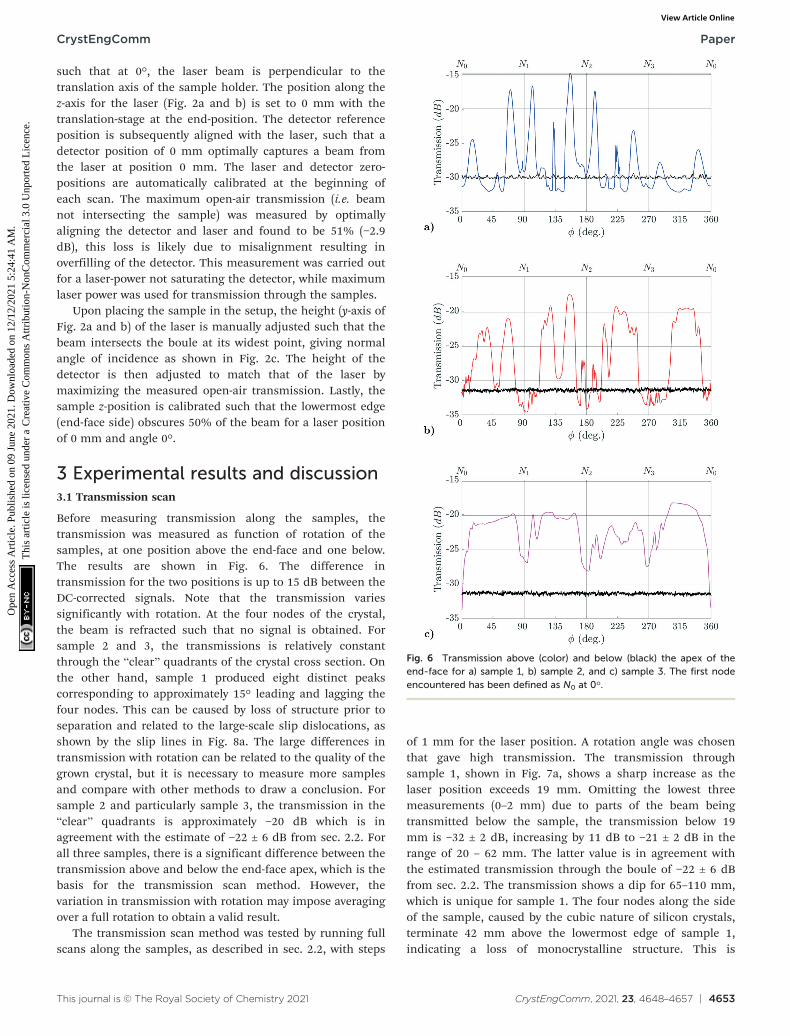
Before measuring transmission along the samples, thetransmission was measured as function of rotation of thesamples, at one position above the end-face and one below.The results are shown in Fig. 6. The difference intransmission for the two positions is up to 15 dB between theDC-corrected signals. Note that the transmission variessignificantly with rotation. At the four nodes of the crystal,the beam is refracted such that no signal is obtained. Forsample 2 and 3, the transmissions is relatively constantthrough the “clear” quadrants of the crystal cross section. Onthe other hand, sample 1 produced eight distinct peakscorresponding to approximately 15° leading and lagging thefour nodes. This can be caused by loss of structure prior toseparation and related to the large-scale slip dislocations, asshown by the slip lines in Fig. 8a. The large differences intransmission with rotation can be related to the quality of thegrown crystal, but it is necessary to measure more samplesand compare with other methods to draw a conclusion. Forsample 2 and particularly sample 3, the transmission in the“clear” quadrants is approximately −20 dB which is inagreement with the estimate of −22 ± 6 dB from sec. 2.2. Forall three samples, there is a significant difference between thetransmission above and below the end-face apex, which is thebasis for the transmission scan method. However, thevariation in transmission with rotation may impose averagingover a full rotation to obtain a valid result.
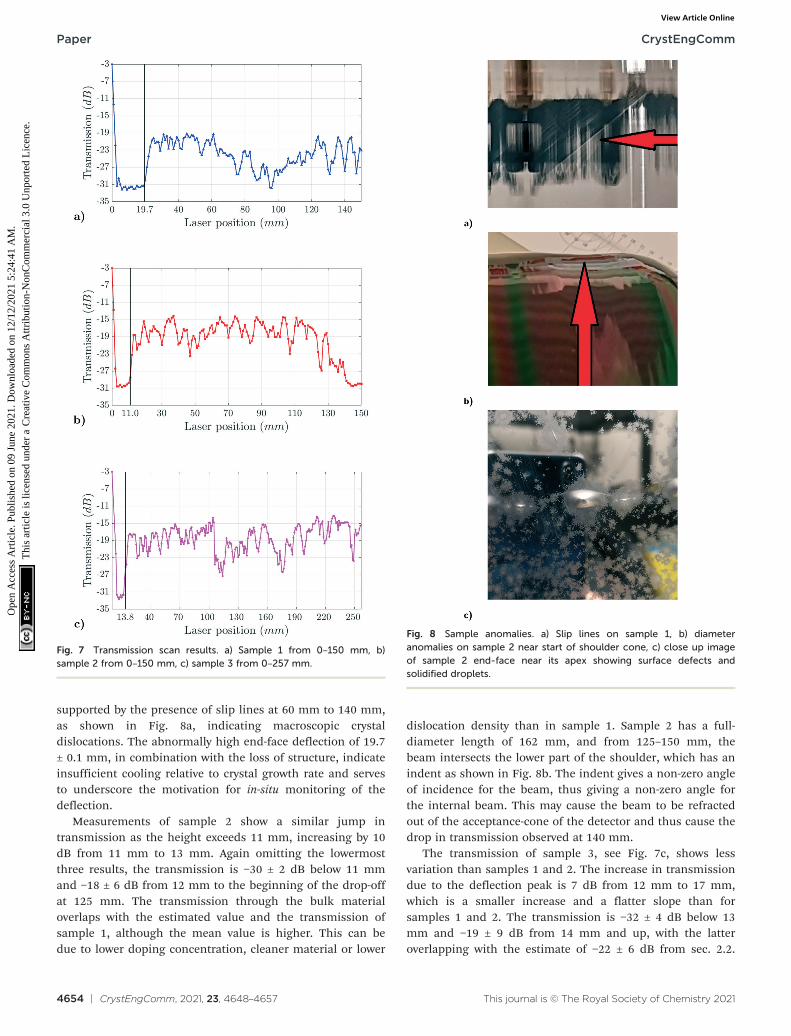
The transmission scan method was tested by running fullscans along the samples, as described in sec. 2.2, with steps
of 1 mm for the laser position. A rotation angle was chosenthat gave high transmission. The transmission throughsample 1, shown in Fig. 7a, shows a sharp increase as thelaser position exceeds 19 mm. Omitting the lowest threemeasurements (0–2 mm) due to parts of the beam beingtransmitted below the sample, the transmission below 19mm is −32 ± 2 dB, increasing by 11 dB to −21 ± 2 dB in therange of 20 – 62 mm. The latter value is in agreement withthe estimated transmission through the boule of −22 ± 6 dBfrom sec. 2.2. The transmission shows a dip for 65–110 mm,which is unique for sample 1. The four nodes along the sideof the sample, caused by the cubic nature of silicon crystals,terminate 42 mm above the lowermost edge of sample 1,indicating a loss of monocrystalline structure. This is
Fig. 6 Transmission above (color) and below (black) the apex of theend-face for a) sample 1, b) sample 2, and c) sample 3. The first nodeencountered has been defined as N0 at 0°.
CrystEngComm Paper
Ope
n A
cces
s A
rtic
le. P
ublis
hed
on 0
9 Ju
ne 2
021.
Dow
nloa
ded
on 1
2/12
/202
1 5:
24:4
1 A
M.
Thi
s ar
ticle
is li
cens
ed u
nder
a C
reat
ive
Com
mon
s A
ttrib
utio
n-N
onC
omm
erci
al 3
.0 U
npor
ted
Lic
ence
.View Article Online
4654 | CrystEngComm, 2021, 23, 4648–4657 This journal is © The Royal Society of Chemistry 2021
supported by the presence of slip lines at 60 mm to 140 mm,as shown in Fig. 8a, indicating macroscopic crystaldislocations. The abnormally high end-face deflection of 19.7± 0.1 mm, in combination with the loss of structure, indicateinsufficient cooling relative to crystal growth rate and servesto underscore the motivation for in-situ monitoring of thedeflection.
Measurements of sample 2 show a similar jump intransmission as the height exceeds 11 mm, increasing by 10dB from 11 mm to 13 mm. Again omitting the lowermostthree results, the transmission is −30 ± 2 dB below 11 mmand −18 ± 6 dB from 12 mm to the beginning of the drop-offat 125 mm. The transmission through the bulk materialoverlaps with the estimated value and the transmission ofsample 1, although the mean value is higher. This can bedue to lower doping concentration, cleaner material or lower
dislocation density than in sample 1. Sample 2 has a full-diameter length of 162 mm, and from 125–150 mm, thebeam intersects the lower part of the shoulder, which has anindent as shown in Fig. 8b. The indent gives a non-zero angleof incidence for the beam, thus giving a non-zero angle forthe internal beam. This may cause the beam to be refractedout of the acceptance-cone of the detector and thus cause thedrop in transmission observed at 140 mm.
The transmission of sample 3, see Fig. 7c, shows lessvariation than samples 1 and 2. The increase in transmissiondue to the deflection peak is 7 dB from 12 mm to 17 mm,which is a smaller increase and a flatter slope than forsamples 1 and 2. The transmission is −32 ± 4 dB below 13mm and −19 ± 9 dB from 14 mm and up, with the latteroverlapping with the estimate of −22 ± 6 dB from sec. 2.2.
Fig. 8 Sample anomalies. a) Slip lines on sample 1, b) diameteranomalies on sample 2 near start of shoulder cone, c) close up imageof sample 2 end-face near its apex showing surface defects andsolidified droplets.
Fig. 7 Transmission scan results. a) Sample 1 from 0–150 mm, b)sample 2 from 0–150 mm, c) sample 3 from 0–257 mm.
CrystEngCommPaper
Ope
n A
cces
s A
rtic
le. P
ublis
hed
on 0
9 Ju
ne 2
021.
Dow
nloa
ded
on 1
2/12
/202
1 5:
24:4
1 A
M.
Thi
s ar
ticle
is li
cens
ed u
nder
a C
reat
ive
Com
mon
s A
ttrib
utio
n-N
onC
omm
erci
al 3
.0 U
npor
ted
Lic
ence
.View Article Online
CrystEngComm, 2021, 23, 4648–4657 | 4655This journal is © The Royal Society of Chemistry 2021
The mean values for the transmission through the bulk arehigher for samples 2 and 3 than for sample 1, which mightbe linked to the loss of monocrystalline structure for sample1. Sample 3 is longer than the two other samples. This madeadditional alignment and adjustment necessary, which,together with the heavier load on the translation stage, mighthave given small errors in the recorded positions, althoughthis is not evident from the results.
The nature of each response is determined bythresholding on the transmission and classifying theresponses as above end-face apex if transmission is abovethe threshold, or as intersecting the end-face if under thetransmission threshold. The apex of the end-face, andthereby its deflection, is then found as between thelowermost response classified as above the apex and theuppermost response intersecting the end-face. Using theresults presented in Fig. 7, the optimum threshold is foundto be −27.7 dB and the results are shown in Table 2. Themeasured deflection deviates from the true deflection byless than the uncertainty of the measurement, and theaccuracy is high. Based on this, it is concluded that atransmission scan can determine the end-face deflectionwith an accuracy of ±0.5 mm using a transmissionthreshold of −27.7 dB. Note that the transmission scanspresented here are designed primarily to serve as ademonstration of the transmission change as the beampasses the apex of the end-face, therefore the method wasimplemented as a mapping algorithm with a chosenresolution of 1 mm. This means that the accuracy of ±0.5mm is the limit set by the resolution and not an inherentlimitation in the method itself. This method couldpotentially become both faster and more accurate by usinga search algorithm with decreasing scan intervals to findthe fast change in transmission identifying the end-face.
Regarding the classification accuracy (CA), see Table 2, forsamples 1 and 2 there are significant deviations caused byanomalous properties of the crystals, as shown in Fig. 8.However, the slip line defects on sample 1 and the diameteranomalies on sample 2 are both far removed from the end-face. In a practical implementation, only the areasurrounding the end-face and its apex would be of interest,such that these defects would only be included when theboules were in the beginning of the growth process. If onlythe lowermost 50 mm are considered here, then thethreshold becomes −27.4 dB, resulting in only themeasurement at 20 mm on sample 1 giving a false negative,giving a total accuracy of 99.3%.
3.2 End-face reflection
For each scan series, the detector was rotated to an angle inthe range 5–30° (1° intervals), followed by using the search-algorithm to find the reflection from the end-face. The searchwas repeated several times for each angle, includingcalibration, to obtain valid measurements. For sample 1,approximately 77% of trials gave valid results (see sec. 2.3),for sample 2 this was reduced to 34% and for sample 3 novalid measurements were obtained. As is seen in Fig. 8c, thesurface of sample 2 (and 3) exhibits defects that reduces theexternal reflectivity of the end-face whereas sample 1 (seeFig. 5b) does not. Given that the growth of samples 2 and 3was terminated due to loss of power, it is conceivable thatthe shutdown of the heating elements caused the meltbeneath the interface to become severely undercooled. Asshown in the work of Fujiwara et al.,19 strong undercoolingof the melt can induce the growth of facets on the interface,which would manifest as opaque features on the surface. It ispossible that these defects can also affect the internalsurface, resulting in attenuation and/or scattering of beamsreflected from it. Valid reflections might thus only bepossible in regions without defects, giving a lower ratio ofvalid measurements. Another likely reason for the lack ofvalid measurements from sample 3 is that the foam paddingbetween the sample and holder became significantlycompressed due to the higher weight of sample 3 (seeTable 1), causing misalignment of the sample. This indicatesthat the end-face reflection method is less reliable than thetransmission scan and more sensitive to alignment anddefects.
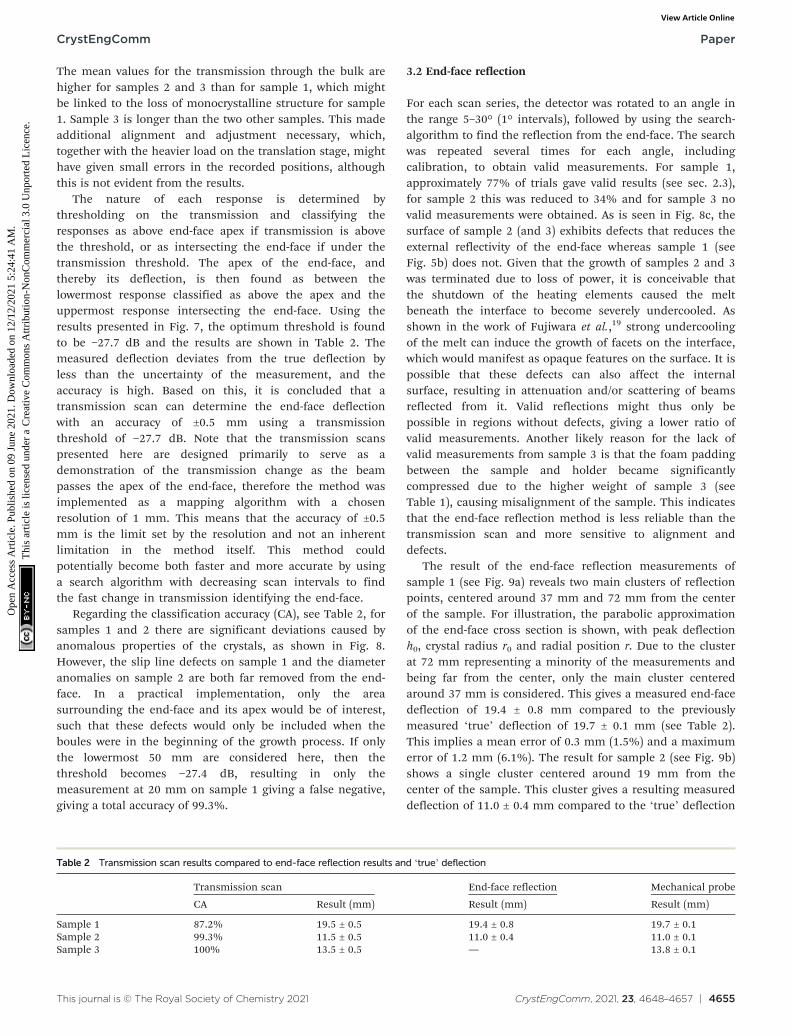
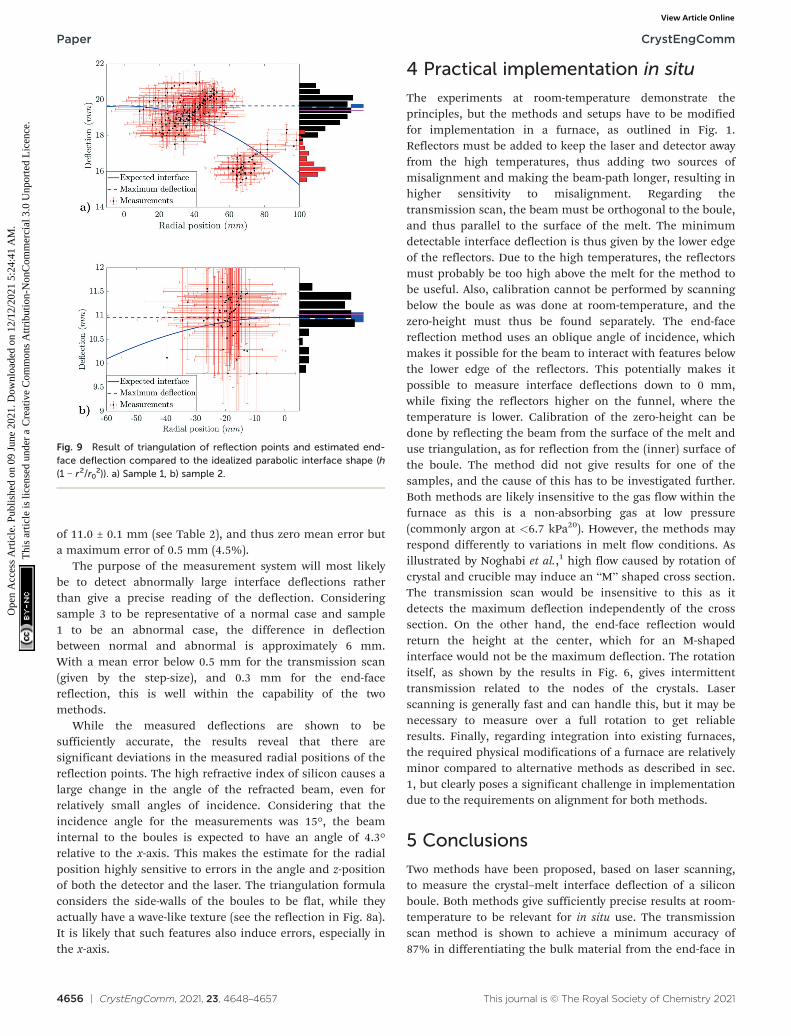
The result of the end-face reflection measurements ofsample 1 (see Fig. 9a) reveals two main clusters of reflectionpoints, centered around 37 mm and 72 mm from the centerof the sample. For illustration, the parabolic approximationof the end-face cross section is shown, with peak deflectionh0, crystal radius r0 and radial position r. Due to the clusterat 72 mm representing a minority of the measurements andbeing far from the center, only the main cluster centeredaround 37 mm is considered. This gives a measured end-facedeflection of 19.4 ± 0.8 mm compared to the previouslymeasured ‘true’ deflection of 19.7 ± 0.1 mm (see Table 2).This implies a mean error of 0.3 mm (1.5%) and a maximumerror of 1.2 mm (6.1%). The result for sample 2 (see Fig. 9b)shows a single cluster centered around 19 mm from thecenter of the sample. This cluster gives a resulting measureddeflection of 11.0 ± 0.4 mm compared to the ‘true’ deflection
Table 2 Transmission scan results compared to end-face reflection results and ‘true’ deflection
Transmission scan End-face reflection Mechanical probe
CA Result (mm) Result (mm) Result (mm)
Sample 1 87.2% 19.5 ± 0.5 19.4 ± 0.8 19.7 ± 0.1Sample 2 99.3% 11.5 ± 0.5 11.0 ± 0.4 11.0 ± 0.1Sample 3 100% 13.5 ± 0.5 — 13.8 ± 0.1
CrystEngComm Paper
Ope
n A
cces
s A
rtic
le. P
ublis
hed
on 0
9 Ju
ne 2
021.
Dow
nloa
ded
on 1
2/12
/202
1 5:
24:4
1 A
M.
Thi
s ar
ticle
is li
cens
ed u
nder
a C
reat
ive
Com
mon
s A
ttrib
utio
n-N
onC
omm
erci
al 3
.0 U
npor
ted
Lic
ence
.View Article Online
4656 | CrystEngComm, 2021, 23, 4648–4657 This journal is © The Royal Society of Chemistry 2021
of 11.0 ± 0.1 mm (see Table 2), and thus zero mean error buta maximum error of 0.5 mm (4.5%).
The purpose of the measurement system will most likelybe to detect abnormally large interface deflections ratherthan give a precise reading of the deflection. Consideringsample 3 to be representative of a normal case and sample1 to be an abnormal case, the difference in deflectionbetween normal and abnormal is approximately 6 mm.With a mean error below 0.5 mm for the transmission scan(given by the step-size), and 0.3 mm for the end-facereflection, this is well within the capability of the twomethods.
While the measured deflections are shown to besufficiently accurate, the results reveal that there aresignificant deviations in the measured radial positions of thereflection points. The high refractive index of silicon causes alarge change in the angle of the refracted beam, even forrelatively small angles of incidence. Considering that theincidence angle for the measurements was 15°, the beaminternal to the boules is expected to have an angle of 4.3°relative to the x-axis. This makes the estimate for the radialposition highly sensitive to errors in the angle and z-positionof both the detector and the laser. The triangulation formulaconsiders the side-walls of the boules to be flat, while theyactually have a wave-like texture (see the reflection in Fig. 8a).It is likely that such features also induce errors, especially inthe x-axis.
4 Practical implementation in situ
The experiments at room-temperature demonstrate theprinciples, but the methods and setups have to be modifiedfor implementation in a furnace, as outlined in Fig. 1.Reflectors must be added to keep the laser and detector awayfrom the high temperatures, thus adding two sources ofmisalignment and making the beam-path longer, resulting inhigher sensitivity to misalignment. Regarding thetransmission scan, the beam must be orthogonal to the boule,and thus parallel to the surface of the melt. The minimumdetectable interface deflection is thus given by the lower edgeof the reflectors. Due to the high temperatures, the reflectorsmust probably be too high above the melt for the method tobe useful. Also, calibration cannot be performed by scanningbelow the boule as was done at room-temperature, and thezero-height must thus be found separately. The end-facereflection method uses an oblique angle of incidence, whichmakes it possible for the beam to interact with features belowthe lower edge of the reflectors. This potentially makes itpossible to measure interface deflections down to 0 mm,while fixing the reflectors higher on the funnel, where thetemperature is lower. Calibration of the zero-height can bedone by reflecting the beam from the surface of the melt anduse triangulation, as for reflection from the (inner) surface ofthe boule. The method did not give results for one of thesamples, and the cause of this has to be investigated further.Both methods are likely insensitive to the gas flow within thefurnace as this is a non-absorbing gas at low pressure(commonly argon at <6.7 kPa20). However, the methods mayrespond differently to variations in melt flow conditions. Asillustrated by Noghabi et al.,1 high flow caused by rotation ofcrystal and crucible may induce an “M” shaped cross section.The transmission scan would be insensitive to this as itdetects the maximum deflection independently of the crosssection. On the other hand, the end-face reflection wouldreturn the height at the center, which for an M-shapedinterface would not be the maximum deflection. The rotationitself, as shown by the results in Fig. 6, gives intermittenttransmission related to the nodes of the crystals. Laserscanning is generally fast and can handle this, but it may benecessary to measure over a full rotation to get reliableresults. Finally, regarding integration into existing furnaces,the required physical modifications of a furnace are relativelyminor compared to alternative methods as described in sec.1, but clearly poses a significant challenge in implementationdue to the requirements on alignment for both methods.
5 Conclusions
Two methods have been proposed, based on laser scanning,to measure the crystal–melt interface deflection of a siliconboule. Both methods give sufficiently precise results at room-temperature to be relevant for in situ use. The transmissionscan method is shown to achieve a minimum accuracy of87% in differentiating the bulk material from the end-face in
Fig. 9 Result of triangulation of reflection points and estimated end-face deflection compared to the idealized parabolic interface shape (h(1 − r2/r0
2)). a) Sample 1, b) sample 2.
CrystEngCommPaper
Ope
n A
cces
s A
rtic
le. P
ublis
hed
on 0
9 Ju
ne 2
021.
Dow
nloa
ded
on 1
2/12
/202
1 5:
24:4
1 A
M.
Thi
s ar
ticle
is li
cens
ed u
nder
a C
reat
ive
Com
mon
s A
ttrib
utio
n-N
onC
omm
erci
al 3
.0 U
npor
ted
Lic
ence
.View Article Online
CrystEngComm, 2021, 23, 4648–4657 | 4657This journal is © The Royal Society of Chemistry 2021
all three samples when implemented as a mapping methodwith a fixed step-size of 1 mm, which dictates themeasurement error of 0.5 mm. The end-face reflectionmethod measured the deflection of two out of three sampleswith a mean measurement error of less than 0.3 mm (1.5%)with maximum errors of less than 1.2 mm (6%) when usingincidence angles between 5° and 30°.
The transmission scan method is superior in reliability asit successfully measured the deflection of all three samples,while the end-face reflection method failed to acquiremeasurements for sample 3. The transmission scan methodis also shown to remain viable with constant crystal rotation.An interesting topic for further study is to search for a linkbetween the variation in transmission during rotation andthe quality of the grown crystal.
The end-face reflection method is superior in flexibility asits use of oblique angles of incidence allows for fixing thereflectors higher on the funnel, while the transmission scanmethod requires the reflectors to be placed in close proximityof the melt.
A mid-infrared laser is used, to avoid absorption due toband-to-band transitions in silicon at high temperatures.This requires the use of detectors prone to high noise,resulting in low signal-to-noise ratio. This ratio can beimproved by changing from the uncooled detector used here,to a cooled one. By also changing the optical components toavoid the open-air loss of 2.9 dB, the signal-to-noise ratio canprobably be increased from 11.5 dB at present, to upwardsof 20 dB. The influence of absorption for photon energieslower than the band-gap must be investigated for hightemperatures, as an increase in absorption will reduce thesignal-to-noise ratio correspondingly, possibly compromisingthe success of the proposed methods.
Author contributions
The first author suggested the problem and the authorsconceived the measurement methods together. The firstauthor conducted the experimental work and the dataanalysis. The authors contributed equally on the written work.
Conflicts of interest
There are no conflicts to declare.
Acknowledgements
Norwegian Crystals AS for supplying the samples and relevantreference information. Also thanks to Dr. Eivind Johannes
Øverlid (SINTEF Industry) and Dr. Per Anders Eidem (SINTEFHelgeland) for advice.
Notes and references
1 O. Asadi Noghabi, M. M'Hamdi and M. Jomâa, J. Cryst.Growth, 2011, 318, 173–177.
2 Y. Shiraishi, S. Maeda and K. Nakamura, J. Cryst. Growth,2004, 266, 28–33.
3 A. Popescu and D. Vizman, Cryst. Growth Des., 2012, 12,320–325.
4 K. Jiptner, B. Gao, H. Harada, Y. Miyamura, M. Fukuzawa, K.Kakimoto and T. Sekiguchi, J. Cryst. Growth, 2014, 408,19–24.
5 K. Kakimoto, M. Eguchi, H. Watanabe and T. Hibiya,J. Cryst. Growth, 1988, 91, 509–514.
6 Y. Zhu, D. Ma, S. Long, F. Tang, S. Lin and B. Wang, J. Cryst.Growth, 2017, 475, 70–76.
7 Y. Zhu, S. Lin, Z. Liu, W. Wang, D. Ma and B. Wang,CrystEngComm, 2019, 21, 1107–1113.
8 J. Ding and L. Liu, CrystEngComm, 2018, 20, 6925–6931.9 Handbook of Optical and Laser Scanning, ed. G. F. Marshall
and G. E. Stutz, CRC Press, 2nd edn, 2011.10 In Laser in der Technik/Laser in Engineering, ed. W. Waidelich,
Springer, 1994.11 In Laser scanning: Theory and Application, ed. C.-C. Wang,
IntechOpen, 2011.12 K. Haug and G. Pritschow, IECON '98. Proceedings of
the 24th Annual Conference of the IEEE IndustrialElectronics Society (Cat. No.98CH36200), 1998, vol. 2, pp.1236–1241.
13 C. Schinke, P. Christian Peest, J. Schmidt, R. Brendel, K.Bothe, M. R. Vogt, I. Kröger, S. Winter, A. Schirmacher, S.Lim, H. T. Nguyen and D. MacDonald, AIP Adv., 2015, 5,067168.
14 Y. Varshni, Physica, 1967, 34, 149–154.15 V. Alex, S. Finkbeiner and J. Weber, J. Appl. Phys., 1996, 79,
6943–6946.16 D. K. Schroder, R. N. Thomas and J. C. Swartz, IEEE J. Solid-
State Circuits, 1978, 13, 180–187.17 D. Chandler-Horowitz and P. M. Amirtharaj, J. Appl. Phys.,
2005, 97, 123526.18 K. Li and P. Fauchet, Solid State Commun., 1987, 61,
207–209.19 K. Fujiwara, R. Gotoh, X. Yang, H. Koizumi, J. Nozawa and S.
Uda, Acta Mater., 2011, 59, 4700–4708.20 N. Machida, Y. Suzuki, K. Abe, N. Ono, M. Kida and Y.
Shimizu, J. Cryst. Growth, 1998, 186, 362–368.
CrystEngComm Paper
Ope
n A
cces
s A
rtic
le. P
ublis
hed
on 0
9 Ju
ne 2
021.
Dow
nloa
ded
on 1
2/12
/202
1 5:
24:4
1 A
M.
Thi
s ar
ticle
is li
cens
ed u
nder
a C
reat
ive
Com
mon
s A
ttrib
utio
n-N
onC
omm
erci
al 3
.0 U
npor
ted
Lic
ence
.View Article Online