Embed Size (px)
Citation preview
1 Measuring the Impact of Eminent Domain Partial Takings
INTERNATIONAL REAL ESTATE REVIEW
Measuring the Impact of Eminent Domain
Partial Takings: A Behavioral Approach
Michael J. Seiler Professor and Robert M. Stanton Chair of Real Estate and Economic Develop-ment, Old Dominion University, 2154 Constant Hall, Norfolk, VA 23529-0223; Phone: (757) 683.3505; Fax: (757) 683.3258; Email: [email protected].
This study uses a behavioral approach to measure the impact of a partial eminent domain land taking (which affects easement rights and causes proximity damage) on residential property values. Existing appraisal methods are not suited to handle this type of unique valuation impact determination, yet diminution must be determined by the courts to establish proper “just compensation”. To accomplish the quantification of damages, an experimental design is implemented that allows the market to voice its opinion of valuation impact through a mechanism other than direct comparable sales. Moreover, this behavioral methodology can and should be used in a number of additional real estate valuation applications.
Keywords:
Eminent Domain; Partial Takings; Experimental Design; Behavioral Real
Estate
Seiler 2
1. Introduction
Eminent domain is the taking of private land by a public authority for the
greater use of the community. Examples include the taking of land to build a
park or school, run power lines, widen a highway or bridge, create a light-rail
or bike trail corridor, and so forth. In return for condemning the private
property, the taking authority (a.k.a., condemnor) is required to pay “just
compensation” to the property owner. A theoretical discussion by Turnbull
(2012) describes how the taking authority often condemns more width along a
corridor than is necessary or cost-effective, an observation known as the
Averch-Johnson (1962) effect as termed in Baumol and Klevorick (1970).
In an eminent domain taking for a rail-trail corridor (RTC), the required width
of land is usually quite narrow. As such, the term “partial take” is used to
describe that the taking authority does not need to condemn the entire
property of the owner. Instead, only a strip of land is taken, leaving the
remainder of the property encumbered by both an easement right and a
resulting diminution in value – usually due to noise and/or view impaction.
When conducting a residential real estate appraisal, the most heavily relied
upon method is the comparable sales approach. This method considers recent
transactions (ideally within the last six months) of similar properties within
close proximity to the subject property in order to estimate the value of the
subject property. Recent actual sales are preferred since this is the best known
way to obtain the opinion of value of market participants. But what if there is
a lack of comparable sales observations? Moreover, in the event of a partial
taking, even if comparable sales did exist, no past sale would be truly
comparable to the partial taking involved with the eminent domain
condemnation because never before has a slice of land in the neighborhood
been taken and replaced with an easement right and further potential
diminution in value due to proximity damage (excess noise, potential loss of
privacy, and loss of view).In such situations where no comparable sales exist,
it is possible to estimate the opinion of value from the market by using an
alternate approach. The purpose of this study is to demonstrate the application
of one such approach, known within the behavioral literature as experimental
design, which is widely accepted in the natural sciences and should
appropriately be utilized in a real estate setting as well. To demonstrate the
experimental approach, this study considers a recent eminent domain partial
taking that received considerable media attention. A behavioral
methodological design is then implemented to show how just compensation
should be determined.
3 Measuring the Impact of Eminent Domain Partial Takings
2. Literature Review A number of studies have examined the impact of major infrastructural
support systems on nearby property values1. Studies that specifically relate to
railway systems typically find weak and/or inconsistent results, likely
stemming from the fact that while it might be ideal to be near a light rail
station, one does not want to be too close (Gatzlaff and Smith, 1993; Chen,
Rufolo, and Dueker, 1997; Haider and Miller, 2000; Knaap, Ding, and
Hopkins, 2001; Weinberger, 2001; Weinstein and Clower, 2003; McMillen
and McDonald, 2004; and Hess and Almeida, 2007)2. Being too close means
something different to every homeowner as does the negative externality
associated with excessive proximity. Two of the most common negative
externalities are view and noise. However, increased access to neighborhoods
by criminals is also a factor as studied in Bowes and Ihlanfeldt (2001).
Debrezion, Pels, and Rietveld (2007) demonstrate the importance of
differentiating between commuter railway stations and light versus heavy
railway stations. Moreover, the authors discuss the mitigating impact of
having nearby highways. One take away from all these studies is that the
impact on home prices of such railway systems is situation specific. It is
difficult to construct a study and then claim that the results will hold for all
future railway projects. For this reason, it is important to treat each new
project independently from those in the past. It should be noted that all of the
above referenced studies examine the impact of railway systems being located
near, but not on existing properties. Certainly none of them have examined the
impact of easement rights taken by a condemning authority. As such, the
results of such studies are only loosely related to the current investigation.
3. Background In 2004, plots of vacant land were sold as part of two new residential housing
communities: Mission Estates and Bay Oaks Estates, in Sarasota County, FL.
At that time, the Seminole Gulf/CSX railroad corridor was the weekly route
taken by a non-passenger cargo train that ran through otherwise open
woodlands that connected Sarasota, FL, to Venice, FL. Throughout the next
few years, landowners began to build houses on these vacant lots, thus
resulting in homes valued in the $300,000~$400,000 range.
1See Colwell and Foley (1979), Hamilton and Schwann (1995), Jaconetty (2001), and
Des Rosiers (2002), Wolverton and Bottemiller (2003) for a review of the impact of
power lines on residential property values. 2 International studies that examine the impact of railways on residential property
values include Lin and Hwang (2003), Celik and Yankaya (2006), and Pan and Zhang
(2008).
Seiler 4
In 2006, the National Trails System Act, which was enacted under the Federal
Surface Transportation Board (STB), took a 12.43 mile portion of this railroad
corridor under eminent domain and converted it into a multi-use public trail.
The 100-foot corridor (50 feet of which extended onto the homeowner’s
property while the other 50 feet extended in the opposite direction off the
owner’s property) represents a new easement to allow public access to a
multi-use trail, with the right to reactivate the RTC for future railroad usage. It
is widely acknowledged that for the foreseeable future, the RTC is to be
recreationally used, primary by cyclists, walkers, rollerbladers, and the like. If
the RTC would ever revert back to being used as a railroad, the most likely
candidate for its use would be a light-rail system which has become popular in
a number of areas across the country. However, since the old railroad track
had been removed and replaced with a 12-foot wide paved trail, creating a
light-rail system did not appear to be in the immediate or even intermediate
plans.
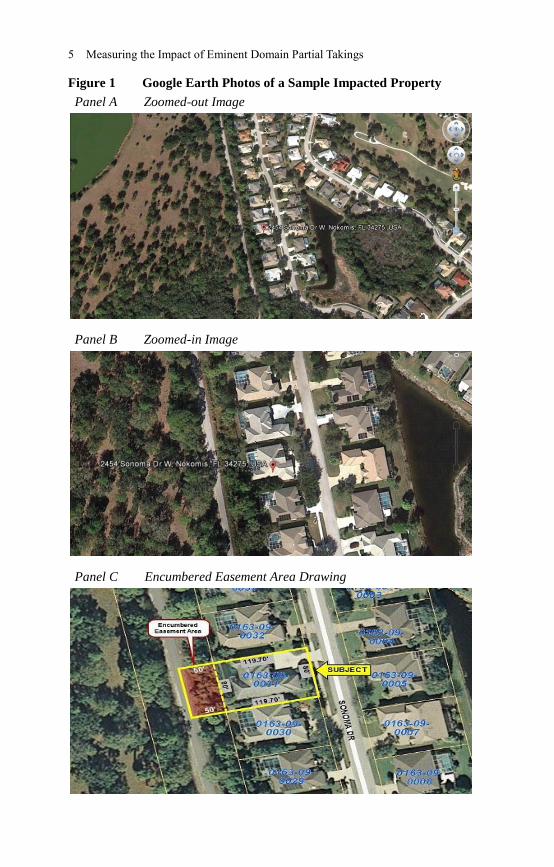
Figure 1 shows a view of one of the impacted communities. Panels A and B
show the subject property from both a zoomed-out and zoomed-in view,
respectively, while Panel C provides a drawing of the encumbered easement
area affected by the partial taking. This 12-foot wide paved trail is to be
maintained by the County Parks and Recreation Department which is
important because part of the county’s duties involve the removal of “invasive
plant species,” such as Brazilian pepper and Australian pine that grow wild
along the edge of the RTC. In many places, the removal of such species means
the removal of a natural sound and sight barrier between the RTC and a home,
thus resulting in a claim of proximity damage.
In addition to view and noise concerns, porta-potties and trash cans are
periodically placed along the RTC which means county vehicles must also
drive down the trail to service these facilities. The current estimate of 250,000
annual trail users is expected to increase over the years as more people
become accustom to using the trail and as additional trailheads come online.
For example, the trail will soon be connected to a network of existing trails
which also has approximately a quarter of a million current users.
Given that the two impacted communities involve new construction and no
sales of completed residences, traditional appraisal methods such as the
comparables sales method are inadequate for measuring the impact of a partial
taking under eminent domain. As such, the purpose of this study is to use a
behavioral approach, specifically experimental design, to arrive at an estimate
of value impaction.
5 Measuring the Impact of Eminent Domain Partial Takings
Figure 1 Google Earth Photos of a Sample Impacted Property
Panel A Zoomed-out Image
Panel B Zoomed-in Image
Panel C Encumbered Easement Area Drawing
Seiler 6
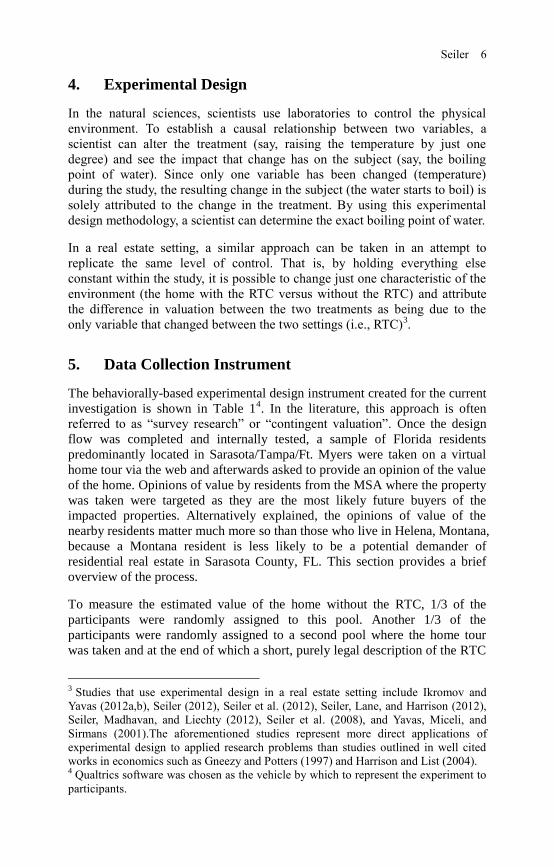
4. Experimental Design
In the natural sciences, scientists use laboratories to control the physical
environment. To establish a causal relationship between two variables, a
scientist can alter the treatment (say, raising the temperature by just one
degree) and see the impact that change has on the subject (say, the boiling
point of water). Since only one variable has been changed (temperature)
during the study, the resulting change in the subject (the water starts to boil) is
solely attributed to the change in the treatment. By using this experimental
design methodology, a scientist can determine the exact boiling point of water.
In a real estate setting, a similar approach can be taken in an attempt to
replicate the same level of control. That is, by holding everything else
constant within the study, it is possible to change just one characteristic of the
environment (the home with the RTC versus without the RTC) and attribute
the difference in valuation between the two treatments as being due to the
only variable that changed between the two settings (i.e., RTC)3.
5. Data Collection Instrument
The behaviorally-based experimental design instrument created for the current
investigation is shown in Table 14. In the literature, this approach is often
referred to as “survey research” or “contingent valuation”. Once the design
flow was completed and internally tested, a sample of Florida residents
predominantly located in Sarasota/Tampa/Ft. Myers were taken on a virtual
home tour via the web and afterwards asked to provide an opinion of the value
of the home. Opinions of value by residents from the MSA where the property
was taken were targeted as they are the most likely future buyers of the
impacted properties. Alternatively explained, the opinions of value of the
nearby residents matter much more so than those who live in Helena, Montana,
because a Montana resident is less likely to be a potential demander of
residential real estate in Sarasota County, FL. This section provides a brief
overview of the process.
To measure the estimated value of the home without the RTC, 1/3 of the
participants were randomly assigned to this pool. Another 1/3 of the
participants were randomly assigned to a second pool where the home tour
was taken and at the end of which a short, purely legal description of the RTC
3 Studies that use experimental design in a real estate setting include Ikromov and
Yavas (2012a,b), Seiler (2012), Seiler et al. (2012), Seiler, Lane, and Harrison (2012),
Seiler, Madhavan, and Liechty (2012), Seiler et al. (2008), and Yavas, Miceli, and
Sirmans (2001).The aforementioned studies represent more direct applications of
experimental design to applied research problems than studies outlined in well cited
works in economics such as Gneezy and Potters (1997) and Harrison and List (2004). 4 Qualtrics software was chosen as the vehicle by which to represent the experiment to
participants.
7 Measuring the Impact of Eminent Domain Partial Takings
was provided to the participant5. After the tour, these participants were also
asked to render an opinion of value. The final 1/3 of the sample was randomly
assigned to a third treatment – a home tour followed by a more lengthy
description of the RTC6. This third treatment provided not only a legal
description of the RTC, but also included both positive homeowner opinions
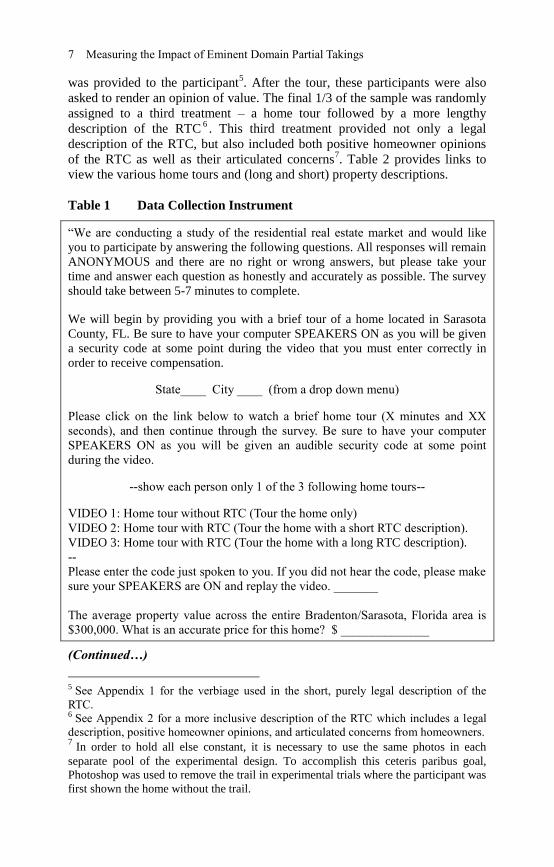
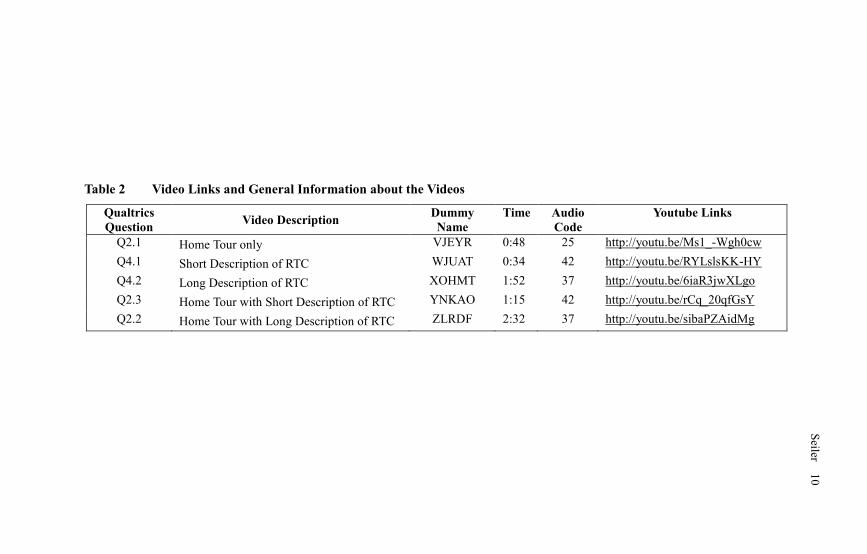
of the RTC as well as their articulated concerns7. Table 2 provides links to
view the various home tours and (long and short) property descriptions.
Table 1 Data Collection Instrument
“We are conducting a study of the residential real estate market and would like
you to participate by answering the following questions. All responses will remain
ANONYMOUS and there are no right or wrong answers, but please take your
time and answer each question as honestly and accurately as possible. The survey
should take between 5-7 minutes to complete.
We will begin by providing you with a brief tour of a home located in Sarasota
County, FL. Be sure to have your computer SPEAKERS ON as you will be given
a security code at some point during the video that you must enter correctly in
order to receive compensation.
State____ City ____ (from a drop down menu)
Please click on the link below to watch a brief home tour (X minutes and XX
seconds), and then continue through the survey. Be sure to have your computer
SPEAKERS ON as you will be given an audible security code at some point
during the video.
--show each person only 1 of the 3 following home tours--
VIDEO 1: Home tour without RTC (Tour the home only)
VIDEO 2: Home tour with RTC (Tour the home with a short RTC description).
VIDEO 3: Home tour with RTC (Tour the home with a long RTC description).
--
Please enter the code just spoken to you. If you did not hear the code, please make
sure your SPEAKERS are ON and replay the video. _______
The average property value across the entire Bradenton/Sarasota, Florida area is
$300,000. What is an accurate price for this home? $ ______________
(Continued…)
5 See Appendix 1 for the verbiage used in the short, purely legal description of the
RTC. 6 See Appendix 2 for a more inclusive description of the RTC which includes a legal
description, positive homeowner opinions, and articulated concerns from homeowners. 7 In order to hold all else constant, it is necessary to use the same photos in each
separate pool of the experimental design. To accomplish this ceteris paribus goal,
Photoshop was used to remove the trail in experimental trials where the participant was
first shown the home without the trail.
Seiler 8
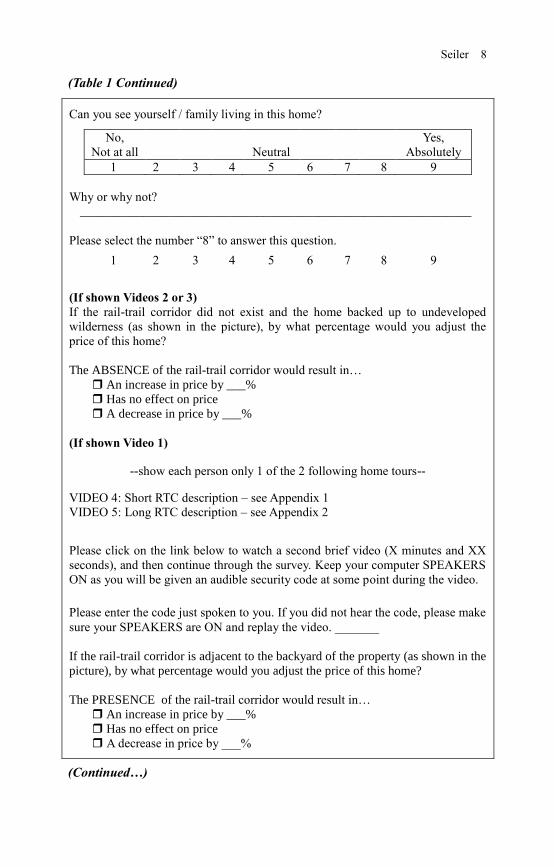
(Table 1 Continued)
Can you see yourself / family living in this home?
No,
Not at all
Neutral
Yes,
Absolutely
1 2 3 4 5 6 7 8 9
Why or why not?
______________________________________________________________
Please select the number “8” to answer this question.
1 2 3 4 5 6 7 8 9
(If shown Videos 2 or 3)
If the rail-trail corridor did not exist and the home backed up to undeveloped
wilderness (as shown in the picture), by what percentage would you adjust the
price of this home?
The ABSENCE of the rail-trail corridor would result in…
An increase in price by ___%
Has no effect on price
A decrease in price by ___%
(If shown Video 1)
--show each person only 1 of the 2 following home tours--
VIDEO 4: Short RTC description – see Appendix 1
VIDEO 5: Long RTC description – see Appendix 2
Please click on the link below to watch a second brief video (X minutes and XX
seconds), and then continue through the survey. Keep your computer SPEAKERS
ON as you will be given an audible security code at some point during the video.
Please enter the code just spoken to you. If you did not hear the code, please make
sure your SPEAKERS are ON and replay the video. _______
If the rail-trail corridor is adjacent to the backyard of the property (as shown in the
picture), by what percentage would you adjust the price of this home?
The PRESENCE of the rail-trail corridor would result in…
An increase in price by ___%
Has no effect on price
A decrease in price by ___%
(Continued…)
8 B
ubb
le, Bu
bb
le – Is th
ere Hou
se Price T
rou
ble

9 Measuring the Impact of Eminent Domain Partial Takings
(Table 1 Continued)
(For all treatments) – Everyone sees the rest of the questions
Please share with us your thoughts about how and why a rail-trail corridor might
impact the property value.
______________________________________________________________
Before taking this survey, were you already aware of the rail-trail project known
as the Sarasota Legacy Trail? Yes ____ No ____
Please select the number “3” to answer this question.
1 2 3 4 5 6 7 8 9
Do you live in either of the following 2 developments: (1) Mission Bay (Nokomis,
FL) or (2) Bay Oaks Estates (Osprey, FL)? Yes ___ No ___
Are you currently a homeowner? Yes ___ No ___
What is your Zip Code: _____
Gender: Male _____ Female _____
What is your Age? ______
Current Marital Status: Single ____ Married ____
Ethnicity:
_____ Caucasian _____ Asian
_____ African American _____ Native American
_____ Hispanic _____ Indian
_____ Other _________
What is your total Net Worth? Net Worth is defined as total assets (stocks, bonds,
price of your home, retirement accounts, etc.) minus total liabilities (outstanding
mortgage balance, credit card debt, student loans, auto loans, etc.)
_____ Less than -$400,000
_____ -$400,000 to -$200,001
_____ -$200,000 to $0
_____ $1 to $200,000
_____ $200,001 to $400,000
_____ $400,001 to $600,000
_____ $600,001 to $800,000
_____ $800,001 to $1,000,000
_____ Over $1,000,000”
9 B
ubb
le, Bu
bb
le – Is th
ere Hou
se Price T
rou
ble
Seiler 10
Table 2 Video Links and General Information about the Videos
Qualtrics
Question Video Description
Dummy
Name
Time Audio
Code
Youtube Links
Q2.1 Home Tour only VJEYR 0:48 25 http://youtu.be/Ms1_-Wgh0cw
Q4.1 Short Description of RTC WJUAT 0:34 42 http://youtu.be/RYLslsKK-HY
Q4.2 Long Description of RTC XOHMT 1:52 37 http://youtu.be/6iaR3jwXLgo
Q2.3 Home Tour with Short Description of RTC YNKAO 1:15 42 http://youtu.be/rCq_20qfGsY
Q2.2 Home Tour with Long Description of RTC ZLRDF 2:32 37 http://youtu.be/sibaPZAidMg
Seiler 1
0
11 Measuring the Impact of Eminent Domain Partial Takings
The random assignment of participants to just one of the three distinct pools is
done to prevent self-selection bias. It should be noted that up to this point in
the process, participants have no idea about the purpose of the study. They are
simply asked to take the home tour and answer a few questions afterwards.
This is intentionally done to prevent potential bias from entering the analysis.
After this first phase of the study was completed (as described above),
participants who were randomly assigned to see the home tour without an
RTC description next had the trail described to them. For consistency, half of
this sub-sample was subsequently shown the short, purely legal description of
the RTC, while the other half was shown the longer description of the RTC.
By asking the participants to indicate the percentage change in the value of the
home, this yielded a direct measure of the RTC impact.
6. Data Preparation
Data were collected through a third party vendor, Paradigm Sample, LLC.
This company has an existing network of people who stand ready to complete
a wide array of tasks/jobs for a fee. By construction, 504 participants were
paid for their time to participate in the data collection effort8. As it is so
important that participants offer their full attention, every attempt is made to
screen out those who are less than fully engaged. One basic screen is the
inclusion of hidden page timers that exist throughout the entire data collection
instrument. If, for example, the participant is asked to watch a 2 minute and
32 second video before advancing to the next question, but the hidden timer
reveals that their screen was advanced before this period, then it is the case
that they did not watch the entire video.
In addition to letting the video run its full length, the participant is required to
enter an auditory security code that is spoken during the video. Answering
correctly ensures that they not only had their speakers on, but were also
paying attention. Failure to correctly answer the question results in not being
paid and their responses being jettisoned from the analysis.
At two different points in the data collection instrument, participants are asked
to answer dummy questions. That is, they needed to simply enter the number
“3” for a given question and “8” for the other. While this simple hurdle is
meant to catch the most egregious of participants, a more advanced screening
criterion involves the matching of place of origin as indicated by the
participant from using a drop down menu of state and city (asked at the
beginning of the process) which is cross-referenced against the zip code
8 Paradigm uses a proprietary screening technique to ensure the sample profile
requested by the researcher matches those actually collected. It is not known to the
researcher how many potential participants were invited to participate in the
experiment. It is only known how many completed it. Paradigm was then paid $4 per
valid participant response.
Seiler 12
entered at the end of the study. Given the inability to backtrack through the
screens, the likelihood that the participant remembers a falsely selected city
early in the process and then takes the time to learn the valid zip code within
that city seems low.
In addition to all these metrics, it is possible to increase the likelihood of
achieving a clean sample simply by utilizing participants from these
established pools since examiners provide performance feedback to the data
provider after every study. It is in the mutual best interests of all parties
involved to take the study seriously as valid participants are needed by the
data provider to ensure examiners will pay to use the participant pool; it is in
the best interest of the participant to act responsibly because a poor feedback
report to the data provider will result in permanent banning of the participant
from future opportunities to participate; and of course, it is in the best interest
of the examiner as the quality of the results is predicated on the quality of the
inputs.
7. Results
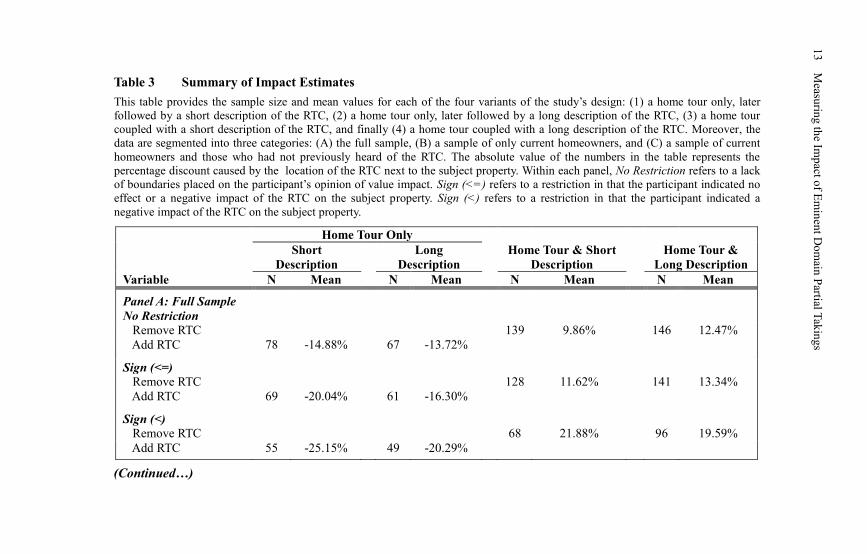
Table 3 provides the sample size and mean values for each of the four variants
of the methodological design: (1) a home tour only, later followed by a short
description of the RTC [N=78], (2) a home tour only, later followed by a long
description of the RTC [N=67], (3) a home tour coupled with a short
description of the RTC [N=139], and finally (4) a home tour coupled with a
long description of the RTC [N=146]. Moreover, the data are segmented into
three categories. Panel A shows the results from the full sample after
completing the screening process as described in the previous section. Panel B
reveals the results when the full sample is restricted to only current
homeowners. It can be argued that homeowner opinion of impacted value
might be more insightful than a person who is merely renting. As such, Panel
C further restricts the dataset by reporting the results for a sample of current
homeowners and those who had not previously heard of the RTC. The reason
to check the effect of excluding those who have heard about the RTC is
because the additional information they have received related to the RTC
cannot be directly controlled for in the study.
The absolute value of the numbers in the table represents the percentage
discount caused by the location of the RTC next to the subject property.
Alternatively stated, the negative numbers in the two Home Tour Only
columns reflect that participants believe the value of the subject property is
lowered with the presence of the RTC. The positive numbers in the rightmost
columns reflect that participants believe the value of the subject property
would be increased with the absence of the RTC. No matter the level of
restrictiveness placed on the data, the results are extremely consistent across
all three panels.
13 Measuring the Impact of Eminent Domain Partial Takings
Table 3 Summary of Impact Estimates
This table provides the sample size and mean values for each of the four variants of the study’s design: (1) a home tour only, later
followed by a short description of the RTC, (2) a home tour only, later followed by a long description of the RTC, (3) a home tour
coupled with a short description of the RTC, and finally (4) a home tour coupled with a long description of the RTC. Moreover, the
data are segmented into three categories: (A) the full sample, (B) a sample of only current homeowners, and (C) a sample of current
homeowners and those who had not previously heard of the RTC. The absolute value of the numbers in the table represents the
percentage discount caused by the location of the RTC next to the subject property. Within each panel, No Restriction refers to a lack
of boundaries placed on the participant’s opinion of value impact. Sign (<=) refers to a restriction in that the participant indicated no
effect or a negative impact of the RTC on the subject property. Sign (<) refers to a restriction in that the participant indicated a
negative impact of the RTC on the subject property.
Home Tour Only
Short
Description
Long
Description
Home Tour & Short
Description
Home Tour &
Long Description
Variable N Mean N Mean N Mean N Mean
Panel A: Full Sample
No Restriction
Remove RTC 139 9.86% 146 12.47%
Add RTC 78 -14.88% 67 -13.72%
Sign (<=)
Remove RTC 128 11.62% 141 13.34%
Add RTC 69 -20.04% 61 -16.30%
Sign (<)
Remove RTC 68 21.88% 96 19.59%
Add RTC 55 -25.15% 49 -20.29%
(Continued…)
13
Measu
ring
the Im
pact o
f Em
inen
t Do
main
Partial T
akin
gs
Seiler 14
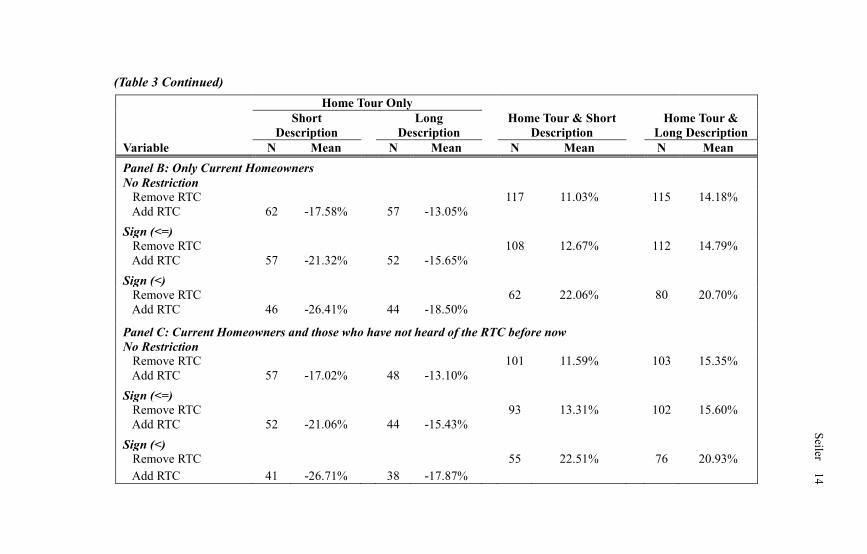
(Table 3 Continued)
Home Tour Only
Short
Description
Long
Description
Home Tour & Short
Description
Home Tour &
Long Description
Variable N Mean N Mean N Mean N Mean
Panel B: Only Current Homeowners
No Restriction
Remove RTC 117 11.03% 115 14.18%
Add RTC 62 -17.58% 57 -13.05%
Sign (<=)
Remove RTC 108 12.67% 112 14.79%
Add RTC 57 -21.32% 52 -15.65%
Sign (<)
Remove RTC 62 22.06% 80 20.70%
Add RTC 46 -26.41% 44 -18.50%
Panel C: Current Homeowners and those who have not heard of the RTC before now
No Restriction
Remove RTC 101 11.59% 103 15.35%
Add RTC 57 -17.02% 48 -13.10%
Sign (<=)
Remove RTC 93 13.31% 102 15.60%
Add RTC 52 -21.06% 44 -15.43%
Sign (<)
Remove RTC 55 22.51% 76 20.93%
Add RTC 41 -26.71% 38 -17.87%
S
eiler 14
15 Measuring the Impact of Eminent Domain Partial Takings
Within each panel, No Restriction refers to a lack of boundaries placed on the
participant’s opinion of value impact. That is, all participant opinions are
included whether they claim a positive, neutral, or negative relationship
between the impact of the RTC and value. Sign (<=) refers to a restriction that
the participant had indicated as having no effect at all or that they reported a
negative impact of the RTC on the subject property. Finally, Sign (<) refers to
a further restriction where only participants who included a negative impact of
the RTC on property value are included. Mathematically, these progressively
restrictive variable conditions result in a greater measured impact of the RTC
effect on property values.
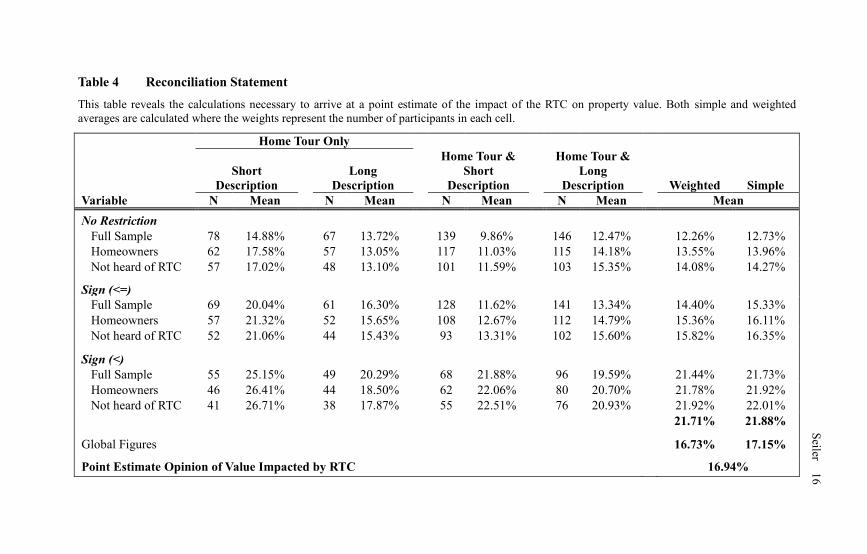
Reconciliation
With several estimates for value impact identified, the next step to estimate
the impact of the RTC is to reconcile the different measures to arrive at both a
reasonable range of values as well as a point estimate. This approach was
adopted as it is also a prescribed step for an appraiser to follow when
conducting an appraisal. Table 4 reports the reconciliation statement. Both
simple and weighted averages are provided where the weights represent the
number of observations in each category. Value estimates are extremely
similar under either system. The result is a reasonable range of value impact
between 13.3% and 21.9% with a point estimate of 16.9%.
8. Conclusions
Attorneys who represent both the property owner and condemnor hire expert
testifying witnesses who regularly disagree on the net valuation impact of an
eminent domain partial taking. Setting aside the clear economic incentive for
each party to arrive at substantially different values, one explanation for the
disparate estimation of valuation is that by using traditional appraisal
methods, there is really no way to have a high degree of confidence in the
estimate. To obtain a better estimate of true market value impact, the
utilization of a behaviorally-based approach used in the natural sciences is
proposed. Alternatively stated, through the implementation of a controlled
experiment, one is able to truly isolate the impact of reduced easement rights
and proximity damage on residential real estate values.
While every condemnation is unique and should be valued as such, this
behavioral methodology is now established as a standard for estimating value
as a supplement or input to traditional appraisal methods. A partial taking of
personal property through the invoking of eminent domain offers one such
opportunity to expand the tool belt of appraisers.
Seiler 16
Table 4 Reconciliation Statement
This table reveals the calculations necessary to arrive at a point estimate of the impact of the RTC on property value. Both simple and weighted
averages are calculated where the weights represent the number of participants in each cell.
Home Tour Only
Short
Description
Long
Description
Home Tour &
Short
Description
Home Tour &
Long
Description
Weighted Simple
Variable N Mean N Mean N Mean N Mean Mean
No Restriction
Full Sample 78 14.88% 67 13.72% 139 9.86% 146 12.47% 12.26% 12.73%
Homeowners 62 17.58% 57 13.05% 117 11.03% 115 14.18% 13.55% 13.96%
Not heard of RTC 57 17.02% 48 13.10% 101 11.59% 103 15.35% 14.08% 14.27%
Sign (<=)
Full Sample 69 20.04% 61 16.30% 128 11.62% 141 13.34% 14.40% 15.33%
Homeowners 57 21.32% 52 15.65% 108 12.67% 112 14.79% 15.36% 16.11%
Not heard of RTC 52 21.06% 44 15.43% 93 13.31% 102 15.60% 15.82% 16.35%
Sign (<)
Full Sample 55 25.15% 49 20.29% 68 21.88% 96 19.59% 21.44% 21.73%
Homeowners 46 26.41% 44 18.50% 62 22.06% 80 20.70% 21.78% 21.92%
Not heard of RTC 41 26.71% 38 17.87% 55 22.51% 76 20.93% 21.92% 22.01%
21.71% 21.88%
Global Figures 16.73% 17.15%
Point Estimate Opinion of Value Impacted by RTC 16.94%
Seiler 1
6
17 Measuring the Impact of Eminent Domain Partial Takings
References
Averch, H. and Johnson L.L. (1962). Behavior of the Firm under Regulatory
Constraint, American Economic Review, 52, 5, 1052-1069.
Baumol, W.J. and Klevorick A.K. (1970). Input Choices and the Rate of
Return Regulation: An Overview of the Discussion, Bell Journal of
Economics, 1, 2, 169-190.
Bowes, D. and Ihlanfeldt K. (2001). Identifying the Impacts of Rail Transit
Stations on Residential Property Values, Journal of Urban Economics, 50, 1-
25.
Celik, H. and Yankaya U. (2006). The Impact of Rail Transit Investment on
the Residential Property Values in Developing Countries: The Case of Izmir
Subway, Turkey, Property Management, 24, 4, 369-382.
Chen, H., Rufolo A., and Dueker K.. (1997). Measuring the Impact of Light
Rail Systems on Single Family Home Values: A Hedonic Approach with GIS
Application, Discussion Paper 97-3, Centre for Urban Studies.
Colwell, P. F. and Foley K.W. (1979). Electric Transmission Lines and the
Selling Price of Residential Property, Appraisal Journal, 47, 4, 490-499.
Debrezion, G., Pels E. and Rietveld P.. (2007). The Impact of Railway
Stations on Residential and Commercial Property Value: A Meta-Analysis,
Journal of Real Estate Finance and Economic, 35, 161-180.
Des Rosiers, F. (2002). Power Lines, Visual Encumbrances, and House
Values, Journal of Real Estate Research, 23, 3, 275-301.
Gatzlaff, D. and Smith M. (1993). The Impact of the Miami Metrorail on the
Value of Residences near Station Locations, Land Economics, 69, 1, 54-66.
Gneezy, U. and Potters J. (1997). An Experiment on Risk Taking and
Evaluation Periods, Quarterly Journal of Economics, 112, 2, 631-645.
Haider, M. and Miller E.. (2000). Effects of Transportation Infrastructure and
Locations on Residential Real Estate Values: Application of Spatial
Autoregressive Techniques, Transportation Research Record, 1722, Paper
no.00-0641.
Hamilton, S.W. and Schwann G.M.. (1995). Do High Voltage Electric
Transmission Lines Affect Property Values?, Land Economics, 71, 4, 436-444.
Seiler 18
Harrison, G. and List J. (2004). Field Experiments, Journal of Economic
Literature, 42, 4, 1009-1055.
Hess, D. and Almeida T. (2007). Impact of Proximity to Light Rail Rapid
Transit on Station-area Property Values in Buffalo, New-York, Urban Studies,
44, 5, 1041-1068.
Ikromov, N. and Yavas A. (2012). Cash Flow Volatility, Prices a Price
Volatility: An Experimental Study, Journal of Real Finance and Economics,
44, 203-229.
Ikromov, N. and Yavas A. (2012). Asset Characteristics and Boom and Bust
Periods: An Experimental Study, Real Estate Economics, 40, 3, 603-636.
Jaconetty, T.A. (2001). Do You Want Your Children Playing Under Those
Things?: The Continuing Controversy About High Voltage Electromagnetic
Fields, Human Health, and Real Property Values, Assessment Journal, 68, 3,
23-30.
Knaap, G., Ding C. and Hopkins L. (2001). Do Plans Matter?: The Effects of
Light Rail Plans on Land Values in Station Areas, Journal of Planning
Education and Research, 21, 1, 32-39.
Lin, J. and Hwang C. (2003). Analysis of Property Prices Before and After the
Opening of the Taipei Subway System, Annals of Regional Science, 38, 687-
704.
McMillen, D. and McDonald J. (2004). Reaction of House Prices to a New
Rapid Transit Line: Chicago’s Midway Line, 1983-1999, Real Estate
Economics, 32, 3, 463-486.
Pan, H. and Zhang H. (2008). Rail Transit Impacts on Land Use: Evidence
from Shanghai, China, Transportation Research Board: Journal of the
Transportation Research Board, 2048: 16-25.
Seiler, M. (2012).The Effect of Perceived Lender Characteristics and Market
Conditions on Strategic Mortgage Defaults, Journal of Real Estate Finance
and Economics, forthcoming.
Seiler, M., Lane M. and Harrison D. (2012). Mimetic Herding Behavior and
the Decision to Strategically Default, Journal of Real Estate Finance and
Economics, 40, S1, 199-233.
Seiler, M., Madhavan P. and Liechty M. (2012). Toward an Understanding of
Real Estate Homebuyer Internet Search Behavior: An Application of Ocular
Tracking Technology, Journal of Real Estate Research, 34, 2, 211-241.
19 Measuring the Impact of Eminent Domain Partial Takings
Seiler, M., Seiler V., Lane M. and Harrison D. (2012). Fear, Shame, and Guilt:
Economic and Behavioral Motivations for Strategic Default, Real Estate
Economics, 40, 4, forthcoming.
Seiler, M., Seiler V., Traub S. and Harrison D. (2008). Regret Aversion and
False Reference Points in Residential Real Estate, Journal of Real Estate
Research, 30, 4, 461-474.
Turnbull, G. (2012). Delegating Eminent Domain Powers to Private Firms:
Land Use and Efficiency Implications, Journal of Real Estate Finance and
Economics, 45, 2, 305-325.
Weinberger, R. (2001). Light Rail Proximity: Benefit of Detriment in the Case
of Santa Clara County, California?,Transportation Research Record: Journal
of the Transportation Research Board, 1747, 104-113.
Weinstein, B. and Clower T. (2003). DART Light Rail’s Effect on Taxable
Property Valuations and Transit-Oriented Development,Centre for Economic
Development and Research, University of North Texas.
Wolverton, M.L. and Bottemiller S.C. (2003). Further Analysis of
Transmission Line Impact on Residential Property Values, Appraisal Journal,
71, 3, 244-252.
Yavas, A., Miceli T. and Sirmans C. (2001). An Experimental Analysis of the
Impact of Intermediaries on the Outcome of Bargaining Games, Real Estate
Economics, 29, 2, 251-276.
Seiler 20
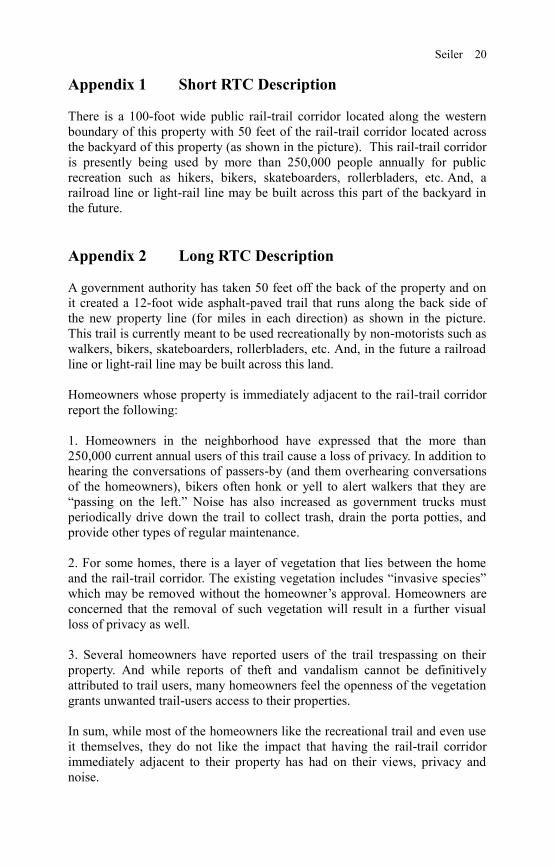
Appendix 1 Short RTC Description
There is a 100-foot wide public rail-trail corridor located along the western
boundary of this property with 50 feet of the rail-trail corridor located across
the backyard of this property (as shown in the picture). This rail-trail corridor
is presently being used by more than 250,000 people annually for public
recreation such as hikers, bikers, skateboarders, rollerbladers, etc. And, a
railroad line or light-rail line may be built across this part of the backyard in
the future.
Appendix 2 Long RTC Description
A government authority has taken 50 feet off the back of the property and on
it created a 12-foot wide asphalt-paved trail that runs along the back side of
the new property line (for miles in each direction) as shown in the picture.
This trail is currently meant to be used recreationally by non-motorists such as
walkers, bikers, skateboarders, rollerbladers, etc. And, in the future a railroad
line or light-rail line may be built across this land.
Homeowners whose property is immediately adjacent to the rail-trail corridor
report the following:
1. Homeowners in the neighborhood have expressed that the more than
250,000 current annual users of this trail cause a loss of privacy. In addition to
hearing the conversations of passers-by (and them overhearing conversations
of the homeowners), bikers often honk or yell to alert walkers that they are
“passing on the left.” Noise has also increased as government trucks must
periodically drive down the trail to collect trash, drain the porta potties, and
provide other types of regular maintenance.
2. For some homes, there is a layer of vegetation that lies between the home
and the rail-trail corridor. The existing vegetation includes “invasive species”
which may be removed without the homeowner’s approval. Homeowners are
concerned that the removal of such vegetation will result in a further visual
loss of privacy as well.
3. Several homeowners have reported users of the trail trespassing on their
property. And while reports of theft and vandalism cannot be definitively
attributed to trail users, many homeowners feel the openness of the vegetation
grants unwanted trail-users access to their properties.
In sum, while most of the homeowners like the recreational trail and even use
it themselves, they do not like the impact that having the rail-trail corridor
immediately adjacent to their property has had on their views, privacy and
noise.