Embed Size (px)
Citation preview
Measuring Time Preference and the
Elasticity of Intertemporal Substitution
Miles S. Kimball, Claudia R. Sahm and Matthew D. Shapiro
September 6, 2006
Internet Project Meeting
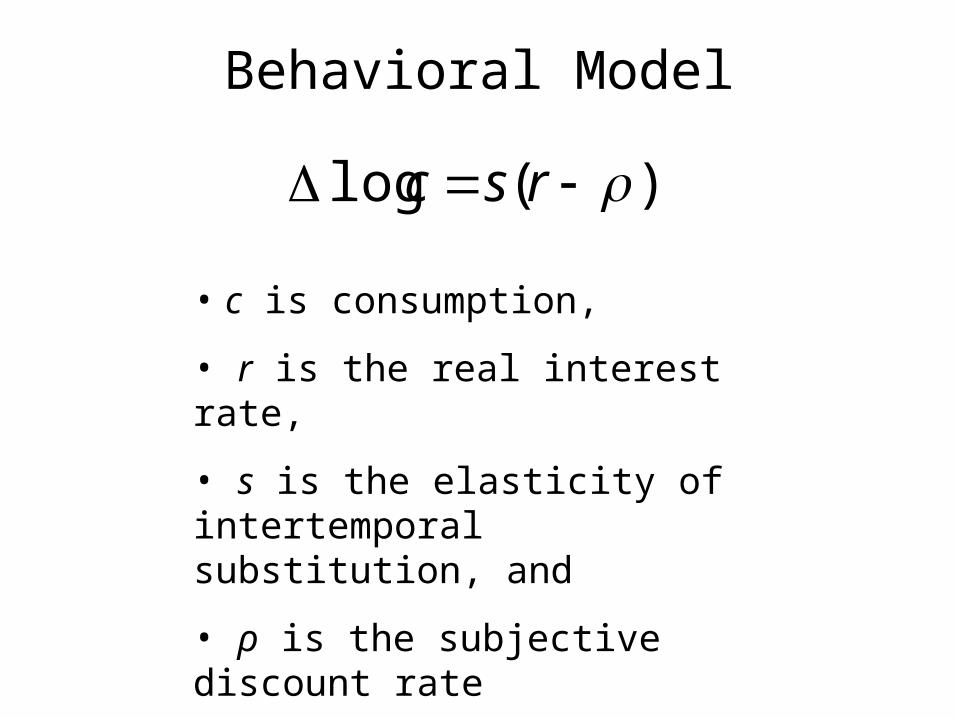
Behavioral Model
)(log rsc
• c is consumption,
• r is the real interest rate,
• s is the elasticity of intertemporal substitution, and
• ρ is the subjective discount rate
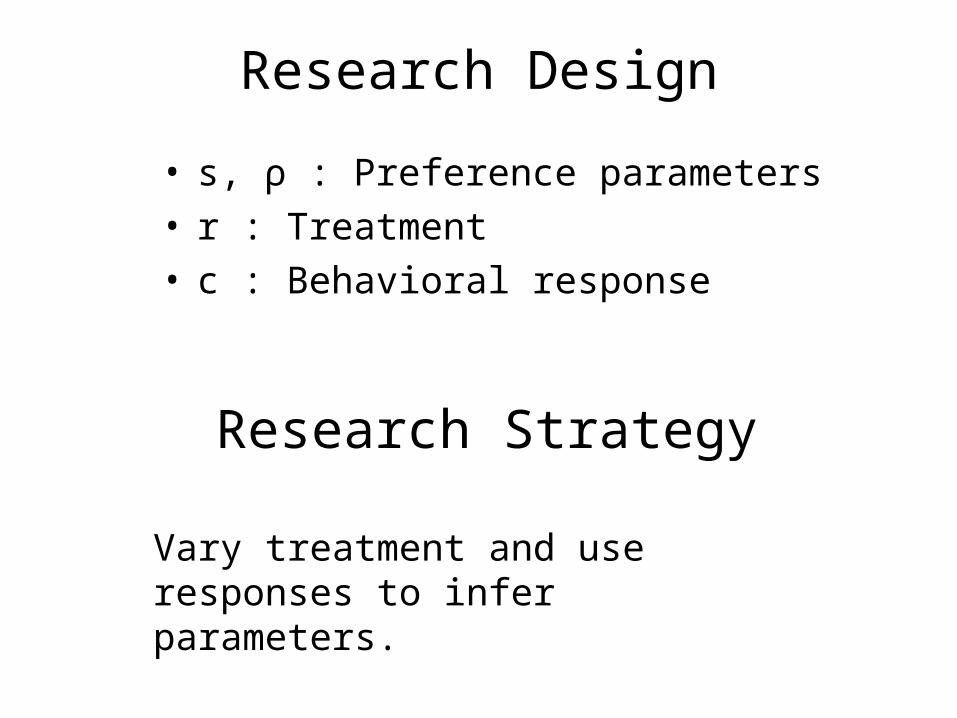
Research Design
• s, ρ : Preference parameters• r : Treatment• c : Behavioral response
Vary treatment and use responses to infer parameters.
Research Strategy
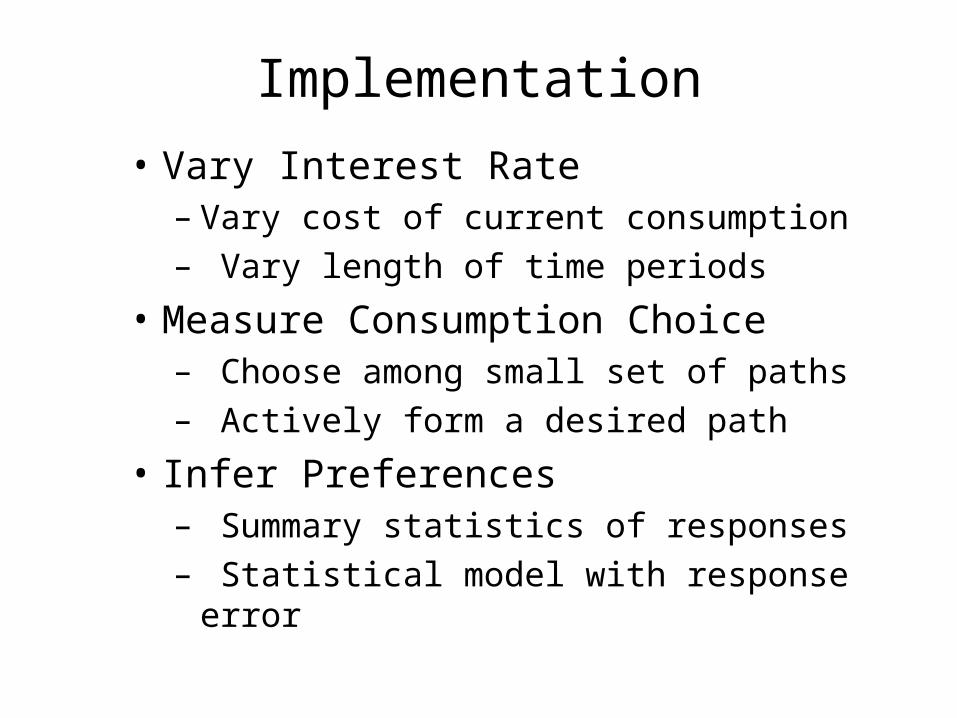
Implementation
• Vary Interest Rate– Vary cost of current consumption– Vary length of time periods
• Measure Consumption Choice– Choose among small set of paths– Actively form a desired path
• Infer Preferences– Summary statistics of responses– Statistical model with response error
Previous Survey Measures
• HRS 1992 Module K, N = 198– Analyzed by Barsky, Kimball, Juster, and
Shapiro (QJE 1997)
• HRS 1999 Mailout, N = 1,210– Similar content to part of Internet Survey
Questions explicitly vary the cost of current consumption and offer a discrete choice over a small set of consumption paths
MS Internet SurveyWave 2 (Fall 2004)
• Version 1, N = 350– Vary cost of consumption– Choose from set of pairs
• Version 2, N = 155– Vary cost of consumption– Move bars to create pair
• Version 3, N = 183– Vary length of period– Move bars to create pair
Use graphics on internet to test other measures:
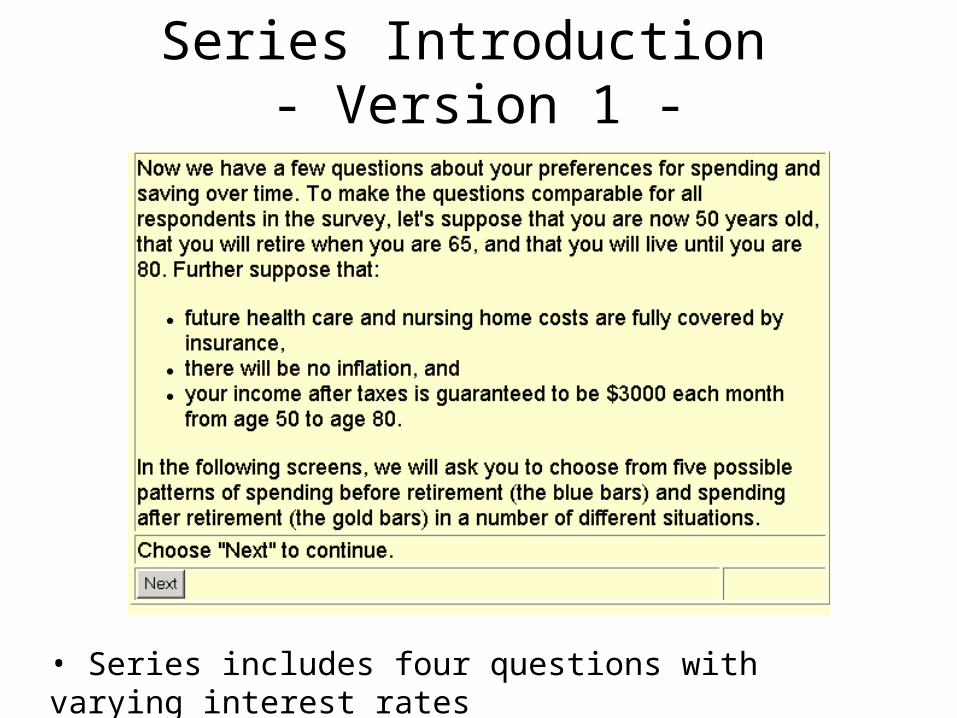
Series Introduction - Version 1 -
• Series includes four questions with varying interest rates
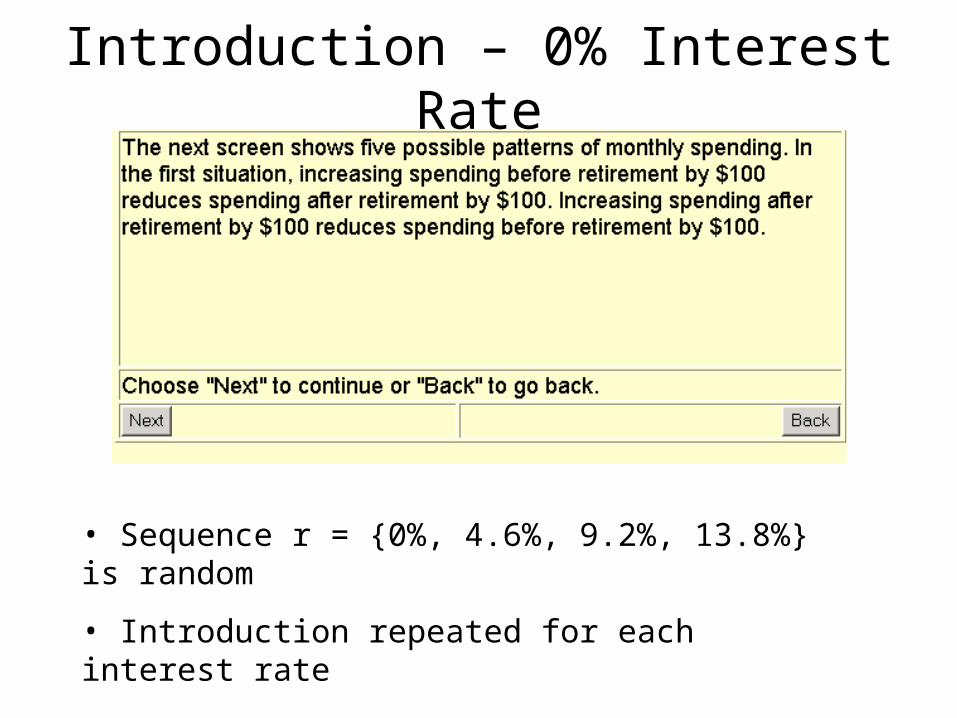
Introduction – 0% Interest Rate
• Sequence r = {0%, 4.6%, 9.2%, 13.8%} is random
• Introduction repeated for each interest rate
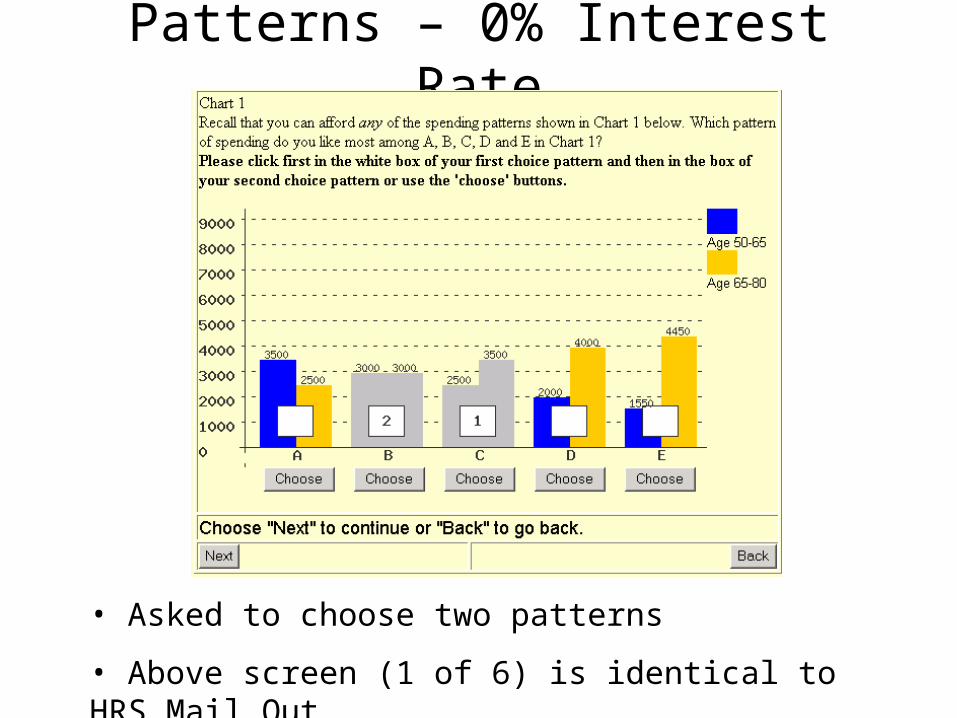
Patterns – 0% Interest Rate
• Asked to choose two patterns
• Above screen (1 of 6) is identical to HRS Mail Out
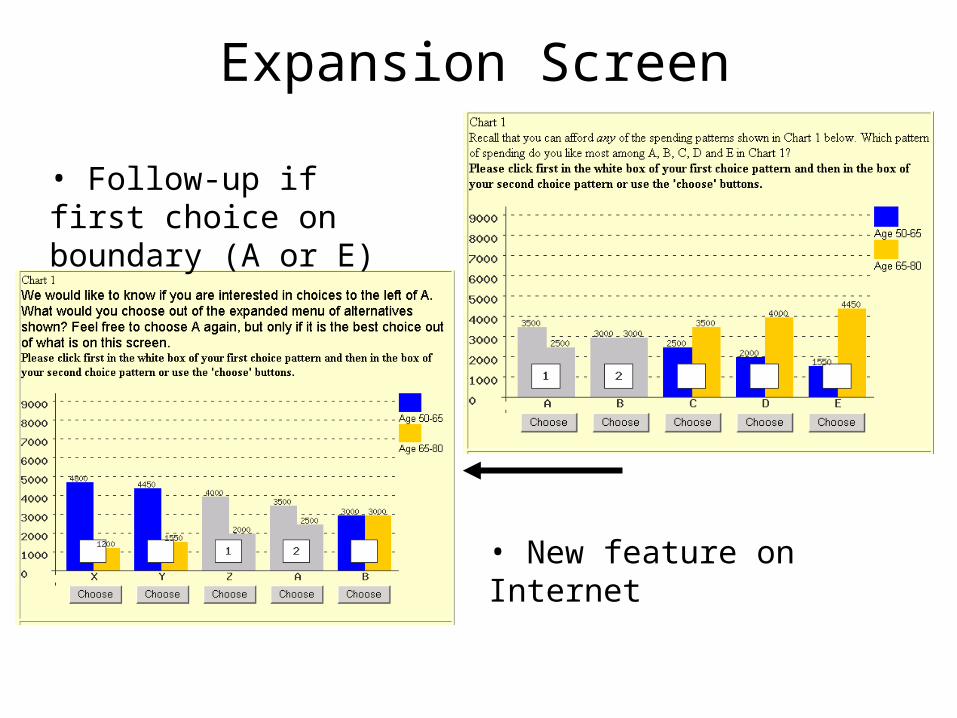
Expansion Screen
• Follow-up if first choice on boundary (A or E)
• New feature on Internet
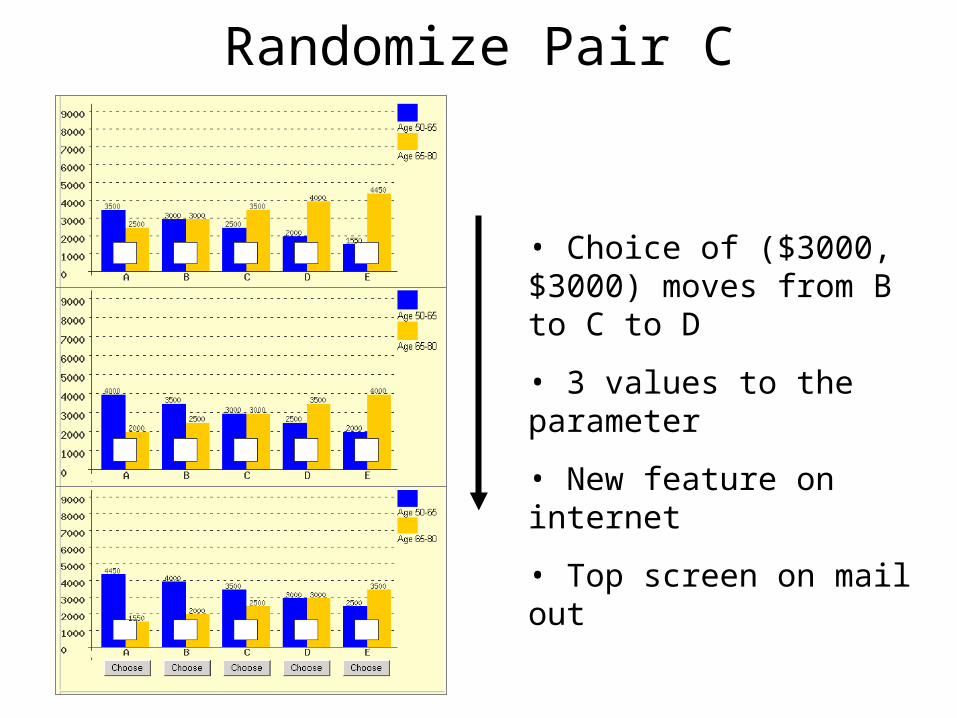
Randomize Pair C
• Choice of ($3000, $3000) moves from B to C to D
• 3 values to the parameter
• New feature on internet
• Top screen on mail out
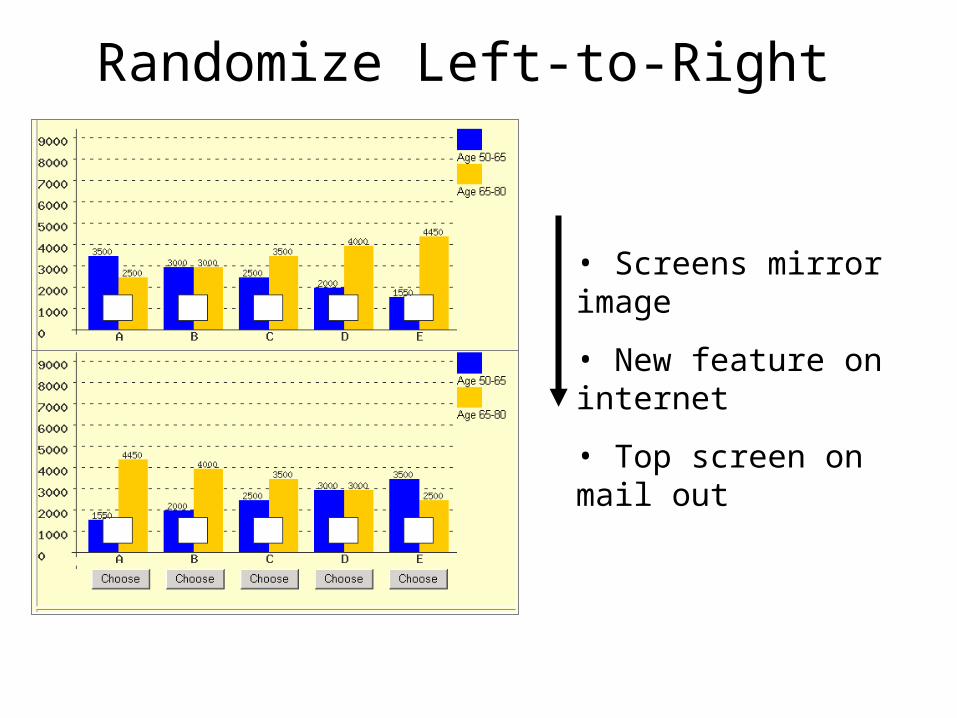
Randomize Left-to-Right
• Screens mirror image
• New feature on internet
• Top screen on mail out
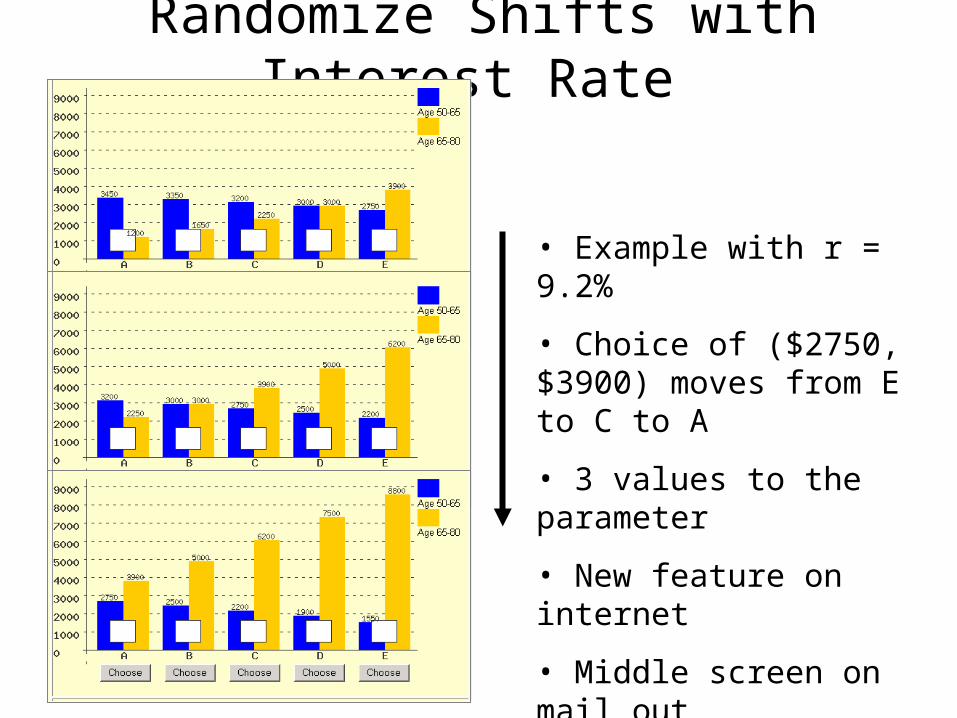
Randomize Shifts with Interest Rate
• Example with r = 9.2%
• Choice of ($2750, $3900) moves from E to C to A
• 3 values to the parameter
• New feature on internet
• Middle screen on mail out
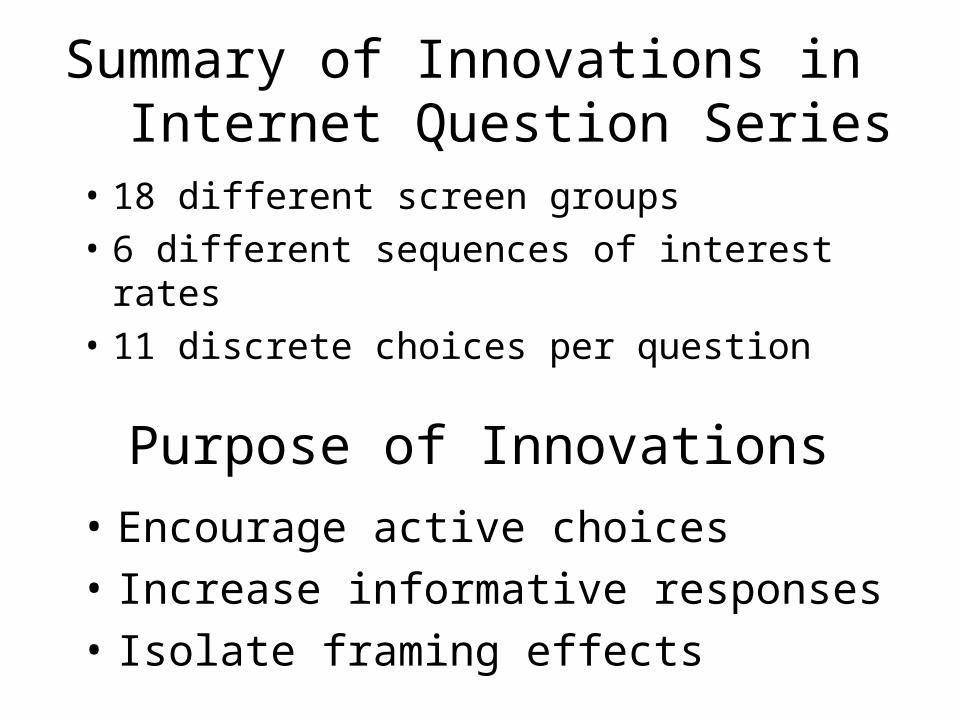
Summary of Innovations in Internet Question Series
• 18 different screen groups
• 6 different sequences of interest rates
• 11 discrete choices per question
• Encourage active choices
• Increase informative responses
• Isolate framing effects
Purpose of Innovations
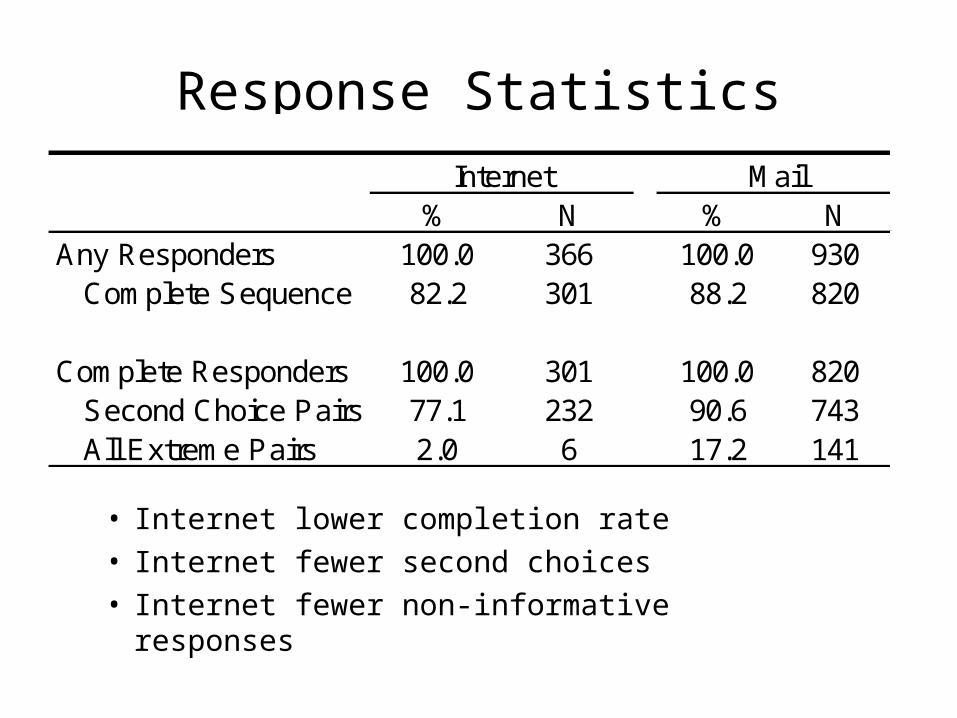
Response Statistics
% N % NAny Responders 100.0 366 100.0 930 Complete Sequence 82.2 301 88.2 820
Complete Responders 100.0 301 100.0 820 Second Choice Pairs 77.1 232 90.6 743 All Extreme Pairs 2.0 6 17.2 141
Internet Mail
• Internet lower completion rate• Internet fewer second choices• Internet fewer non-informative responses
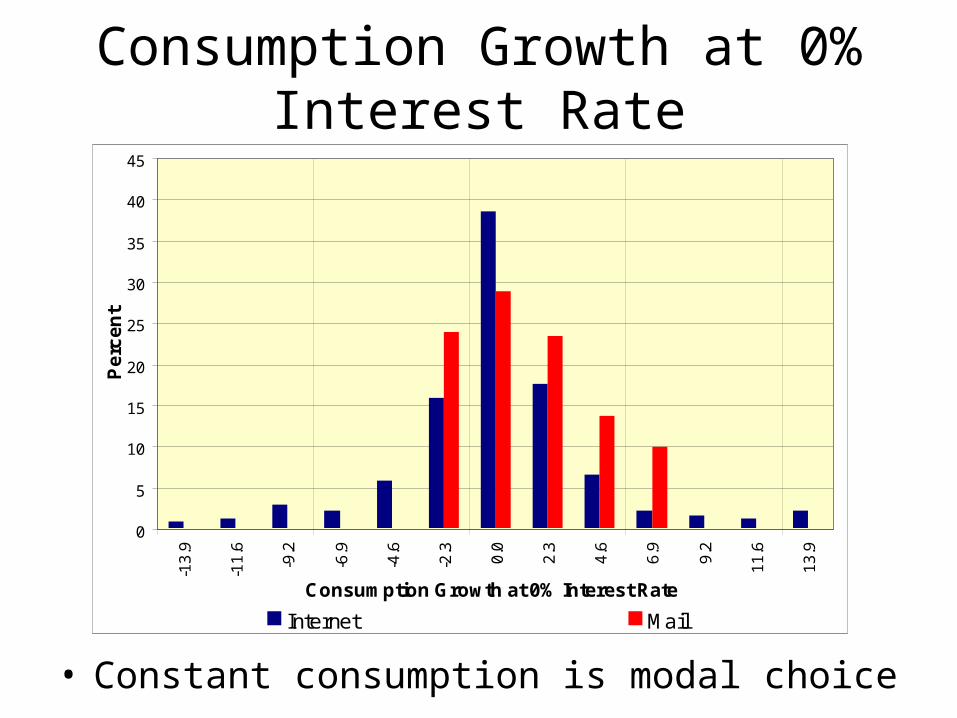
Consumption Growth at 0% Interest Rate
0
5
10
15
20
25
30
35
40
45
-13
.9
-11
.6
-9.2
-6.9
-4.6
-2.3
0.0
2.3
4.6
6.9
9.2
11
.6
13
.9
Consumption Growth at 0% Interest Rate
Pe
rce
nt
Internet Mail
• Constant consumption is modal choice
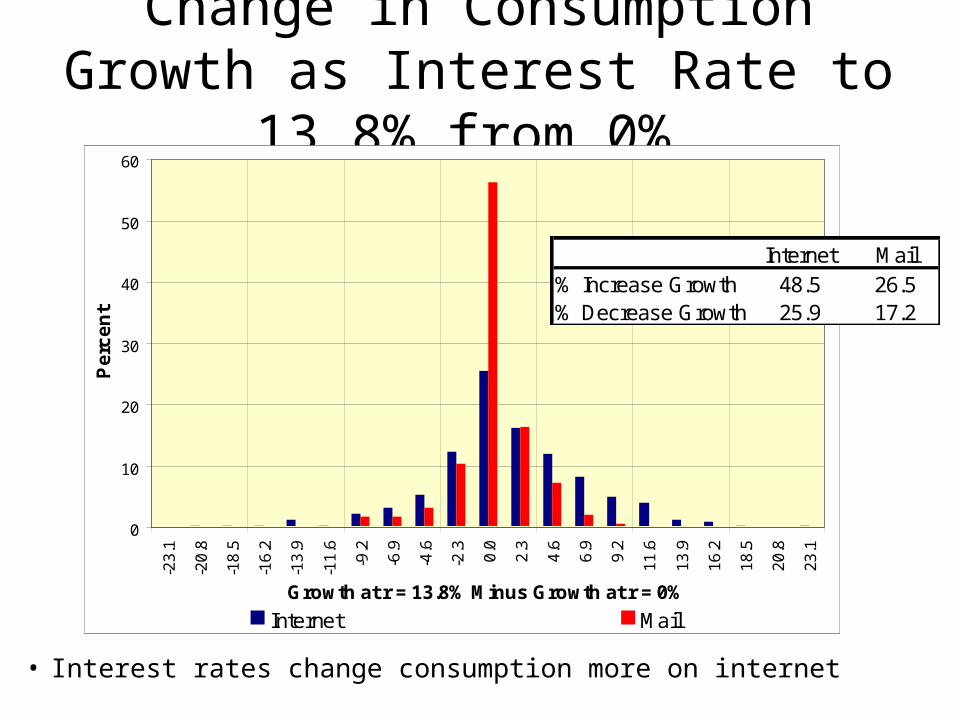
Change in Consumption Growth as Interest Rate to 13.8% from 0%
0
10
20
30
40
50
60-2
3.1
-20
.8
-18
.5
-16
.2
-13
.9
-11
.6
-9.2
-6.9
-4.6
-2.3
0.0
2.3
4.6
6.9
9.2
11
.6
13
.9
16
.2
18
.5
20
.8
23
.1
Growth at r = 13.8% Minus Growth at r = 0%
Pe
rce
nt
Internet Mail
• Interest rates change consumption more on internet
Internet Mail% Increase Growth 48.5 26.5% Decrease Growth 25.9 17.2
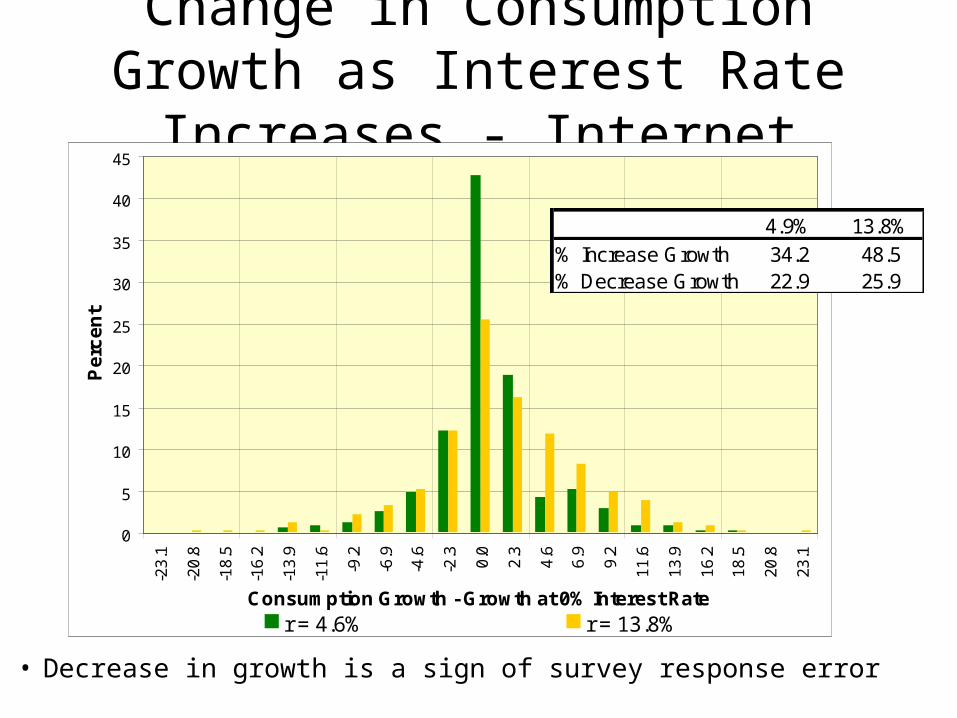
Change in Consumption Growth as Interest Rate Increases - Internet
• Decrease in growth is a sign of survey response error
0
5
10
15
20
25
30
35
40
45-2
3.1
-20
.8
-18
.5
-16
.2
-13
.9
-11
.6
-9.2
-6.9
-4.6
-2.3
0.0
2.3
4.6
6.9
9.2
11
.6
13
.9
16
.2
18
.5
20
.8
23
.1
Consumption Growth - Growth at 0% Interest Rate
Pe
rce
nt
r = 4.6% r = 13.8%
4.9% 13.8%% Increase Growth 34.2 48.5% Decrease Growth 22.9 25.9
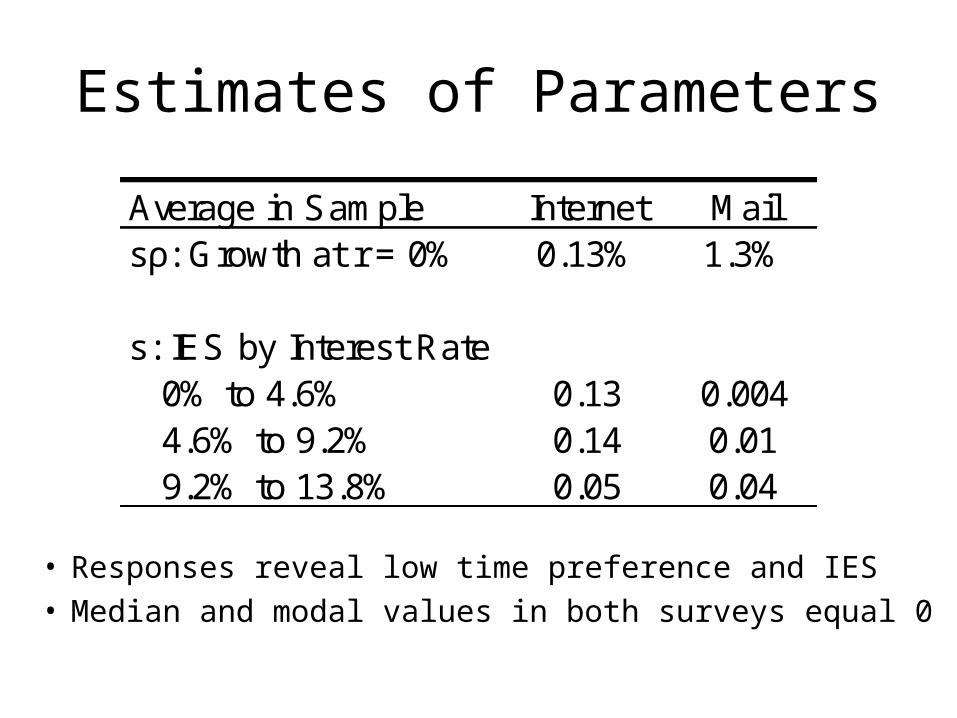
Estimates of Parameters
Average in Sample Internet Mailsρ: Growth at r = 0% 0.13% 1.3%
s: IES by Interest Rate 0% to 4.6% 0.13 0.004 4.6% to 9.2% 0.14 0.01 9.2% to 13.8% 0.05 0.04
• Responses reveal low time preference and IES• Median and modal values in both surveys equal 0
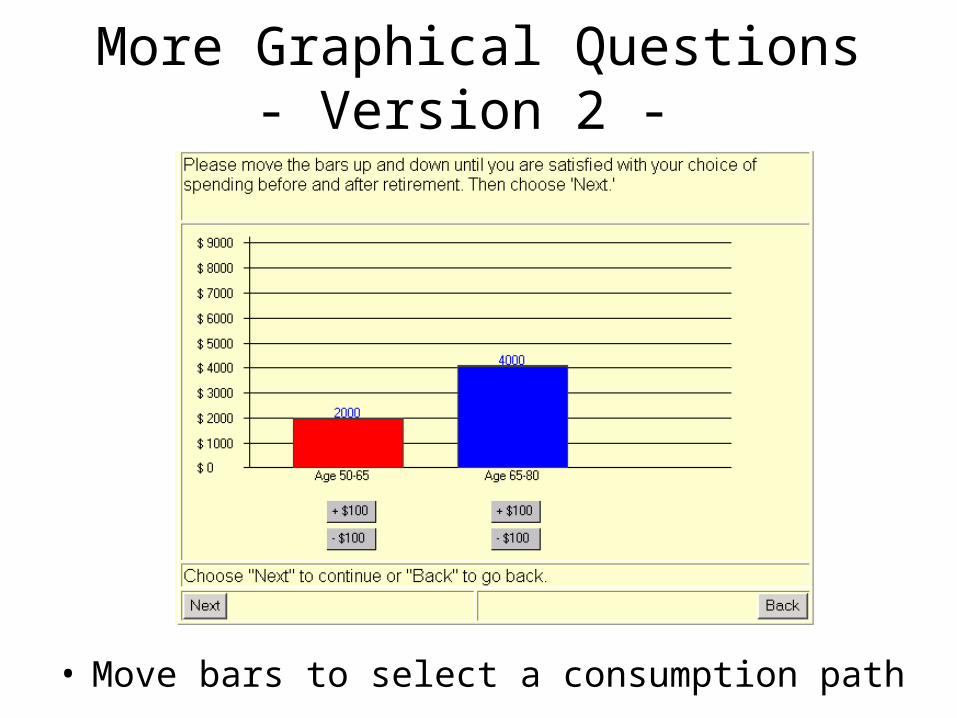
More Graphical Questions- Version 2 -
• Move bars to select a consumption path
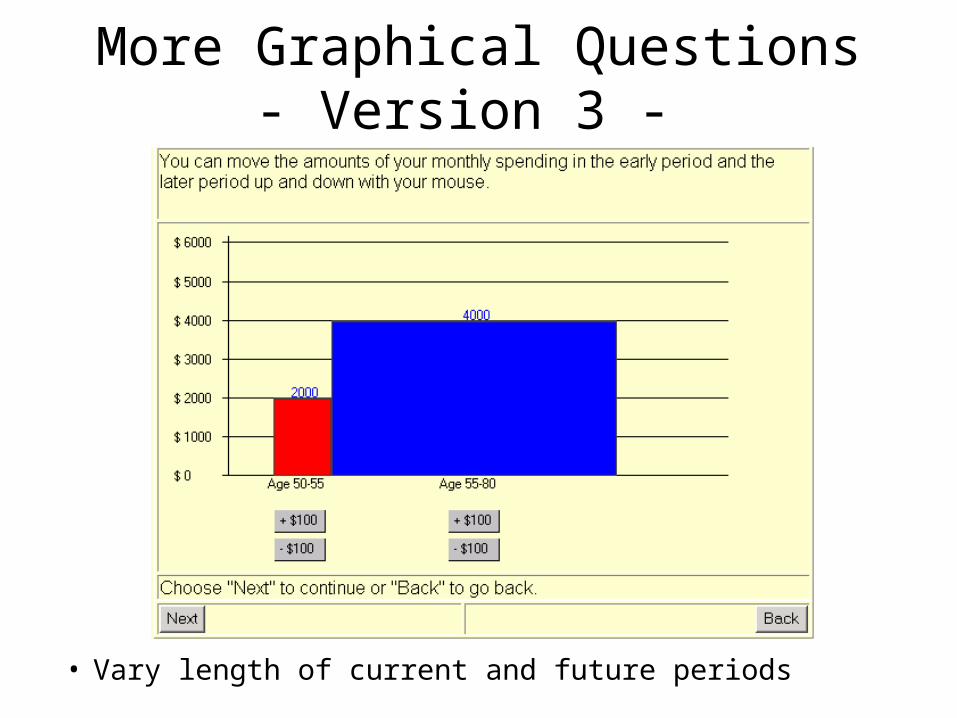
More Graphical Questions- Version 3 -
• Vary length of current and future periods
Implementation Issues
• Graphics require more programming– More programming → more bugs– Coordinate programmer and analyst
• Internet captures more data: number of clicks and interim responses
Internet expands preference measures, but
Extensions / Renewal
• Refine and analyze data on IES, time preference, and risk tolerance – Improve instrument and output delivery– Estimate statistical model
• Measure complementary parameters– Diminishing marginal utility– Labor supply elasticities– Retirement elasticity